Embed Size (px)
Citation preview

2021 Defined Contribution Survey
Research

1
Table of Contents
Introduction 2
Respondent Characteristics 3
Key Findings: DC Trends in Governance, Plan Design and Investments 5
DC Plan Governance Trends 6
DC Plan Design Trends 16
DC Plan Investment Trends 24
Key Findings: Legislation 31
SECURE and CARES Legislation 32
SECURE Act 33
CARES Act 41
Key Findings: Financial Wellness 47
Financial Wellness 48
Key Findings: Health Savings Accounts 57
Health Savings Accounts 58
About the Survey Contributors 64

2
Introduction
The world is changing dramatically, and our annual
Defined Contribution Survey is evolving to fit the shifting
landscape. The 14th Annual DC Survey now covers the
SECURE and CARES Acts, the impacts of the COVID-
19 pandemic, along with the key tenets of DC plan
management, financial wellness, and HSAs. The
insights and experience distilled in our DC Survey
inform this discussion and we are grateful to all of those
who contributed.

3
Constructio
n / Mining
3.3%
Callan conducted our 14th annual DC Survey online in September and October of 2020 (2021 DC Survey). The survey incorporates responses from 93 large DC plan sponsors, including both Callan clients and other organizations.
Respondents span a range of industries; the top industries represented are financial services/insurance, energy/utilities, government, automotive/construction & mining/manufacturing, and health care. Note, the survey requests what is the primary industry that an employer looks to hire from, which means that there is some disconnect between the responses on this page and the organization type described on the following page.
More than 90% of plans in the survey had over $100 million in assets; moreover, 60.9% were “mega plans” with more than $1 billion in assets. The majority of respondents (57.8%) had more than 10,000 participants.
Primary industry employees hired from
Constructio
n / Mining
3.3%
Number of participants in DC plan
Note: Throughout the survey, charts may not sum to 100% due to rounding.
Respondent Characteristics
Assets in DC plan
Other categories: education (2%),entertainment / media (2%), nonprofit (2%), andtransportation (1%).
> 100,000 13%
50,001 to 100,000 7%
10,001 to 50,000 38%
5,001 to 10,000 13%
1,001 to 5,000 17%
≤ 1,000 12%
> $5 billion 29%
≤ $100 million 8%
$100.1 to $200 million 10%
$500.1 mm to $1 bn 12%
$1 to $5 billion 32%
$200.1 to $500 million 10%
Financial Services / Insurance 20%
Energy / Utilities 16%
Government 13%
Health Care 10%
Technology 7%
Aerospace / Defense 5%Retail 4%
Automotive / Construction & Mining / Manufacturing 13%
Professional Services 4%
Other 8%
4
Corporate67%
Tax-exempt12%
Government21%
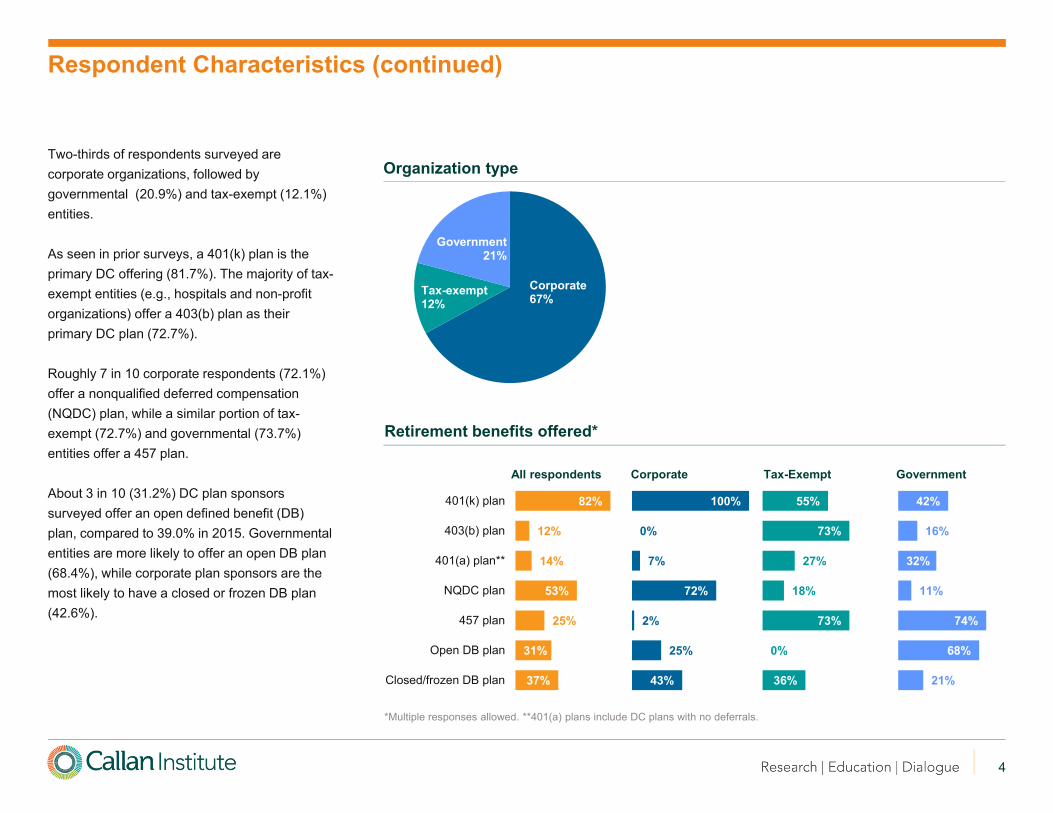
Two-thirds of respondents surveyed are corporate organizations, followed by governmental (20.9%) and tax-exempt (12.1%) entities.
As seen in prior surveys, a 401(k) plan is the primary DC offering (81.7%). The majority of tax-exempt entities (e.g., hospitals and non-profit organizations) offer a 403(b) plan as their primary DC plan (72.7%).
Roughly 7 in 10 corporate respondents (72.1%) offer a nonqualified deferred compensation (NQDC) plan, while a similar portion of tax-exempt (72.7%) and governmental (73.7%) entities offer a 457 plan.
About 3 in 10 (31.2%) DC plan sponsors surveyed offer an open defined benefit (DB) plan, compared to 39.0% in 2015. Governmental entities are more likely to offer an open DB plan (68.4%), while corporate plan sponsors are the most likely to have a closed or frozen DB plan (42.6%).
Organization type
Retirement benefits offered*
Respondent Characteristics (continued)
82%
12%
14%
53%
25%
31%
37%
0% 50% 100%
401(k) plan
403(b) plan
401(a) plan**
NQDC plan
457 plan
Open DB plan
Closed/frozen DB plan
All respondents Corporate Tax-Exempt Government
100%
0%
7%
72%
2%
25%
43%
0% 50% 100%
55%
73%
27%
18%
73%
0%
36%
0% 50% 100%
42%
16%
32%
11%
74%
68%
21%
0% 50% 100%
*Multiple responses allowed. **401(a) plans include DC plans with no deferrals.

3 Implement, update, or review IPS
Key Findings: DC Trends in Governance, Plan Design, and Investments
Top Areas of Focus
1 Governance and process
2 Investment structure evaluation
3 Fund / manager due diligence
83%seek to retain assets of retirees
63% offer a retirement income solution
2x as many plans suspended or reduced the matching contribution in 2020
86% indicated they would reinstate
See pages 21 & 22 for detailsSee page 17 for details
49%offer a managed account
87%with > 50k participants
91%have taken steps to prevent plan leakage
3.5 actions taken, on average, to reduce leakage
See page 20 for details
completed a plan design evaluation in past 3 years
8 in 10 offer Roth
6 in 10offer Roth
in-plan conversions
7 in 10 have
automatic enrollment
See pages 16 & 18 for details
See page 7 for detailsSee page 6 for details
Planned for 2021
1 Review plan fees
2 Complete formal fiduciary training
71% of plan sponsors are either somewhat or very likely to conduct a fee study in 2021
VirtualUp
86%
20% increase in total committee meetings
See page 13 for details
7in 10
See page 12 for details
See page 19 for details
In-person
down62%
6
2020 2019 2018
Plan governance and process
3.9 Total plan fees 3.5 Total plan fees 3.6
Investment structure evaluation
2.7 Participant education and communications
3.5 Participant education and communications
3.5
Fund / manager due diligence
2.7 Fund / manager due diligence
3.3 Financial wellness 3.4
Plan investment management fees
2.3 Financial wellness 3.3 Fund / manager due diligence
3.2
Asset allocation and diversification
1.2 Retirement readiness of participants
3.2 Investment structure evaluation
3.1
Participant education and communications
1.2 Investment structure evaluation
3.1 Retirement readiness of participants
3.1
Committee education and fiduciary training
1.1 Cybersecurity 2.9 Committee education and fiduciary training
2.5
Qualified default fund selection
1.1 Evaluation of providers 2.8 Plan design 2.5
Plan administration fees 1.1 Plan design 2.7 Evaluation of providers 2.5
Committee education and fiduciary training
2.5 Cybersecurity 2.4
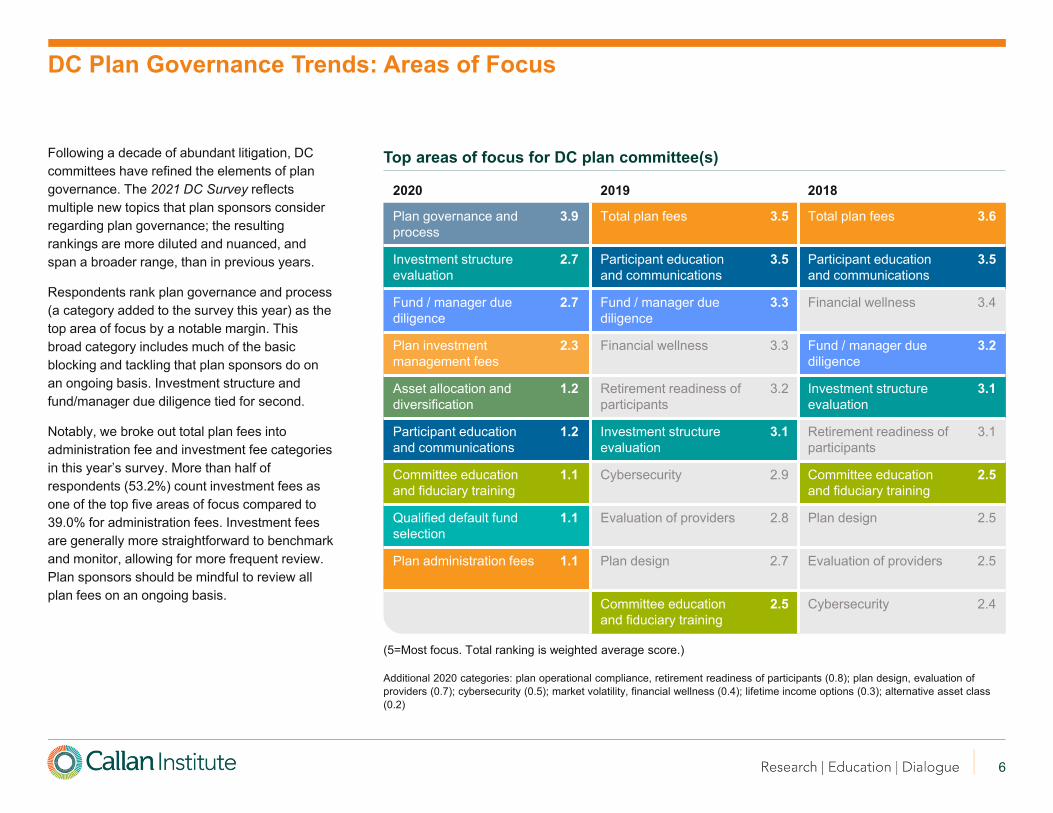
Following a decade of abundant litigation, DC committees have refined the elements of plan governance. The 2021 DC Survey reflects multiple new topics that plan sponsors consider regarding plan governance; the resulting rankings are more diluted and nuanced, and span a broader range, than in previous years.
Respondents rank plan governance and process (a category added to the survey this year) as the top area of focus by a notable margin. This broad category includes much of the basic blocking and tackling that plan sponsors do on an ongoing basis. Investment structure and fund/manager due diligence tied for second.
Notably, we broke out total plan fees into administration fee and investment fee categories in this year’s survey. More than half of respondents (53.2%) count investment fees as one of the top five areas of focus compared to 39.0% for administration fees. Investment fees are generally more straightforward to benchmark and monitor, allowing for more frequent review. Plan sponsors should be mindful to review all plan fees on an ongoing basis.
Top areas of focus for DC plan committee(s)
DC Plan Governance Trends: Areas of Focus
Additional 2020 categories: plan operational compliance, retirement readiness of participants (0.8); plan design, evaluation of providers (0.7); cybersecurity (0.5); market volatility, financial wellness (0.4); lifetime income options (0.3); alternative asset class (0.2)
(5=Most focus. Total ranking is weighted average score.)

7
68%
58%
58%
51%
32%
28%
24%
23%
18%
16%
15%
15%
14%
0% 10% 20% 30% 40% 50% 60% 70%
Reviewed plan fees
Implemented, updated, or reviewed IPS
Reviewed investment structure to confirminclusion of broad asset categories
Completed formal fiduciary training
Implemented, updated, or reviewedcommittee charters or delegations
Audited plan operational compliance
Added or deleted a specific fund(s)
Reviewed security protocols audit
Evaluated or reviewed managed accountservices
Conducted a formal plan design review
Reviewed / changed QDIA
Added or deleted asset categories
Reviewed business continuity
In 2019 and 2020, DC plan sponsors were largely focused on actions that support governance responsibilities such as fiduciary training, investment structure, and documentation (i.e., investment policy statement (IPS)).
Around one-quarter of respondents added or deleted a fund in 2019 or 2020, but fewer plan to do so in 2021 (12.7%). This drop-off reflects the general nature of fund changes: they are not necessarily premeditated many months in advance, and plan sponsors may act relatively quickly once any decision has been made.
Few respondents took action on services and capabilities utilized at the plan level (e.g., reviewed business continuity) or for participant use (e.g., managed accounts).
Fiduciary actions DC plans has taken or will take*
*Multiple responses allowed.
DC Plan Governance Trends: Fiduciary Initiatives
Top Actions Planned for 2021
1. Review plan fees
2. Complete formal fiduciary training
3. Implement, update, or review IPS or structure
68%
56%
53%
42%
43%
30%
28%
28%
22%
14%
20%
13%
18%
0% 10% 20% 30% 40% 50% 60% 70%
54%
42%
34%
44%
25%
23%
13%
19%
16%
5%
10%
10%
13%
0% 10% 20% 30% 40% 50% 60% 70%
Governance Fund structure Fund selection Plan management
2019 Will take2020
8
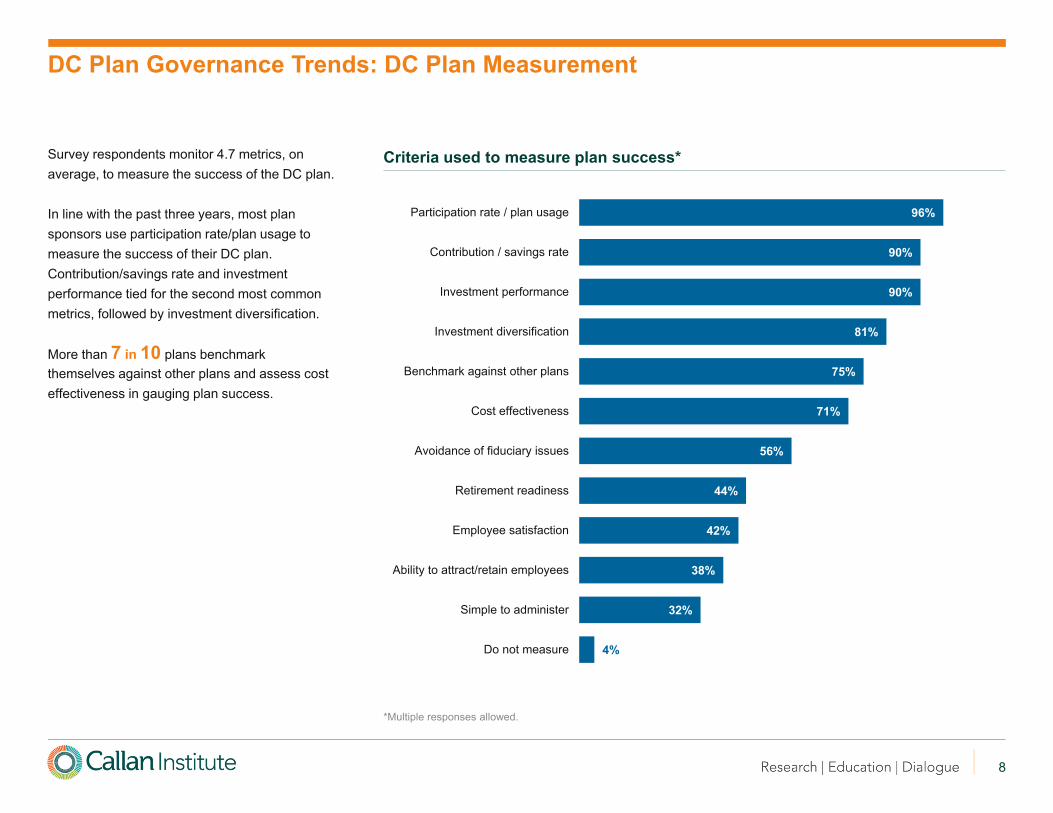
Survey respondents monitor 4.7 metrics, on average, to measure the success of the DC plan.
In line with the past three years, most plan sponsors use participation rate/plan usage to measure the success of their DC plan. Contribution/savings rate and investment performance tied for the second most common metrics, followed by investment diversification.
More than 7 in 10 plans benchmark themselves against other plans and assess cost effectiveness in gauging plan success.
Criteria used to measure plan success*
DC Plan Governance Trends: DC Plan Measurement
96%
90%
90%
81%
75%
71%
56%
44%
42%
38%
32%
4%
0% 100%
Participation rate / plan usage
Contribution / savings rate
Investment performance
Investment diversification
Benchmark against other plans
Cost effectiveness
Avoidance of fiduciary issues
Retirement readiness
Employee satisfaction
Ability to attract/retain employees
Simple to administer
Do not measure
*Multiple responses allowed.

9
80%
4%16%
80%
8% 12%
0%
10%
20%
30%
40%
50%
60%
70%
80%
90%
No change in the number of funds
Increase number of funds
Decrease number of funds
Changed in 2020 Will change in 2021
The events of 2020, including the COVID-19 pandemic and economic turmoil, seem to have slowed the pace of change made to investment structures.
Only 16.2% of plan sponsors report making changes to the investment structure in 2020, down from 25.3% in 2019. Furthermore, more sponsors indicate they are planning a change next year—19.1% of all respondents, or 25.5% when governmental plans are removed from the dataset, compared to 15.7% of respondents in last year’s survey, which did not include governmental plans.
The most common action in 2020 or planned for 2021 was to decrease the number of funds (25.5%). Only 9.8% of respondents indicated they would increase the number of funds in either year.
Just 2 in 10 plan sponsors are planning changes to the investment structure in 2021.
Investment structure change in fund quantity
Investment structure change in fund style
DC Plan Governance Trends: Investment Structure
92%
3% 6%
90%
3% 8%
0%
10%
20%
30%
40%
50%
60%
70%
80%
90%
No change to active passive mix
Increase proportion of active funds
Increase proportion of passive funds
Changed in 2020 Will change in 2021
10
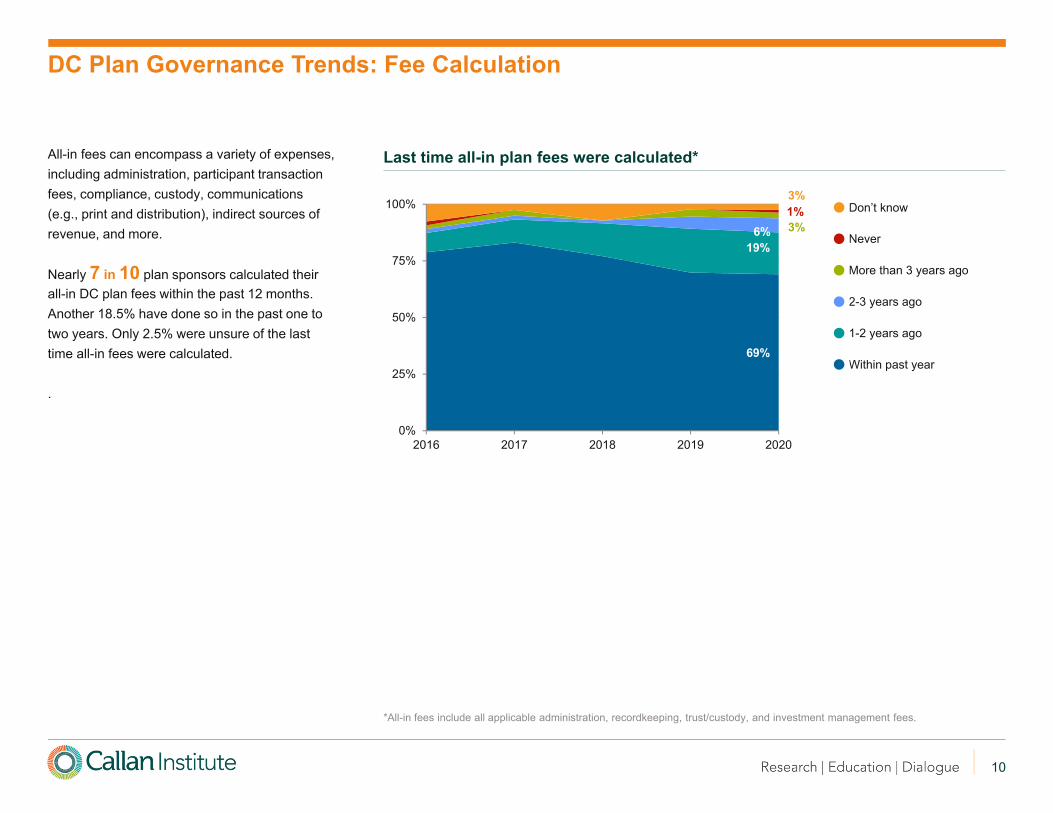
All-in fees can encompass a variety of expenses, including administration, participant transaction fees, compliance, custody, communications (e.g., print and distribution), indirect sources of revenue, and more.
Nearly 7 in 10 plan sponsors calculated their all-in DC plan fees within the past 12 months. Another 18.5% have done so in the past one to two years. Only 2.5% were unsure of the last time all-in fees were calculated.
.
Last time all-in plan fees were calculated*
*All-in fees include all applicable administration, recordkeeping, trust/custody, and investment management fees.
DC Plan Governance Trends: Fee Calculation
69%
19%6% 3%
1%3%
0%
25%
50%
75%
100%
2016 2017 2018 2019 2020
Don’t know
Never
More than 3 years ago
2-3 years ago
1-2 years ago
Within past year

11
79%
7%12%1%
Don't know
100% paid by plan sponsor
Partially paid by plan sponsorand plan participants
100% paid by plan participants
Investment management fees are most often paid entirely by participants (79.0%), and almost always at least partially paid by participants (86.4%). By contrast, nearly half (49.4%) of all administrative fees are paid entirely by participants, up slightly from last year. Most plan sponsors (80.2%) note that at least some administrative fees are paid for by participants.
More than three-quarters of plan sponsors report using a per-participant fee for plan administration. Flat, per-participant fees continue to be more popular than asset-based fees that fluctuate based on account balances (75.4% vs. 23.0%, respectively).
92.6% of respondents are somewhat or very unlikely to change the way fees are paid (e.g., move from asset-based to flat, per-participant fee) in 2021.
How investment management fees are paid
How participants pay for plan administration*
12%
75%
23%3%
0.0%
10.0%
20.0%
30.0%
40.0%
50.0%
60.0%
70.0%
80.0%
Revenue sharing Explicit per-participant dollar fee
Explicit asset-based fee
Don't know
49%
31%
17%
3%
How administrative fees are paid
*Multiple responses allowed.
DC Plan Governance Trends: Fee Payment
86% at least partially paid by participant
80% at least partially paid by participant

12
43%
19%
29%
23%
14%
15%
14%
22%
13%
5%
10%
7%
3%
29%
40%
25%
28%
33%
22%
17%
8%
9%
12%
4%
3%
9%
4%
5%
16%
19%
29%
25%
30%
28%
30%
22%
31%
34%
21%
19%
23%
27%
25%
12%
22%
18%
23%
23%
35%
39%
47%
47%
49%
66%
71%
68%
66%
70%
Conduct a fee study
Move to lower-cost investment vehicles
Evaluate indirect compensation shared withrecordkeeper
Evaluate managed account fees
Renegotiate investment manager fees
Renegotiate recordkeeper fees
Renegotiate service agreement with therecordkeeper
Rebate participant fees/revenue sharing toparticipant accounts
Reduce or eliminate the use of revenue sharing
Move some or all funds from actively managed toindex funds
Conduct a recordkeeper search
Conduct a trustee/custodian search
Change part or all of the expense structure fromplan sponsor to participant paid
Change the way fees are paid (e.g., move fromasset-based to hard dollar per-participant fee)
Change part or all of the expense structure fromparticipant to plan sponsor paid
Very likely Somewhat likely Somewhat unlikely Very unlikely
More than two-thirds of plan sponsors are either somewhat or very likely to conduct a fee study in 2021 (71.2%), an increase from the prior year’s DC survey (55.7%). Most respondents also indicate that they are very or somewhat likely to review other fee types (e.g., managed account services fees) and indirect revenue (e.g., revenue shared from the managed account or rollover provider).
Fewer plan sponsors report exploring a recordkeeper search in the coming year. Just 13.7% of respondents are somewhat or very likely to conduct a recordkeeper search in 2021, compared to nearly one-quarter in last year’s survey.
A clear majority (58.8%) of respondents are likely to move to lower-cost investment vehicles (e.g., move from an R6 share class to a collective investment trust) in 2021, albeit a decrease from the prior year.
Other somewhat or very likely actions include renegotiating investment manager and recordkeeper fees (47.0% and 37.5%, respectively).
Fee initiatives planned for 2021
DC Plan Governance Trends: Fee Initiatives

13
Plan sponsors report a typical committee meeting schedule in 2019, with around five in-person meetings per year, on average. On the other hand, the findings for 2020 were atypical. The total number of meetings increased to six due to a pronounced rise in virtual meetings. In-person meetings dropped from around five to two, on average, as people were asked to limit activities outside of their households and travel was severely restricted.
Additional committee meetings could be attributed to the extreme market volatility that occurred during the year or passage of CARES legislation addressing the impact of the pandemic.
Health care plan sponsors reported fewer investment committee meetings on average (4.5 in 2020 versus 6.0 in 2019) as they balanced multiple business concerns during the pandemic.
DC Plan Governance Trends: Meeting Delivery and Frequency
In-person and virtual DC plan committee meetings held annually
6.0
6.0
5.7
6.8
6.3
3.3
5.7
8.9
6.7
6.2
5.9
4.5
4.9
5.3
4.3
5.7
5.0
4.9
4.4
10.6
5.1
4.3
4.2
6.0
All respondents
< 5,000 participants
5,001 to 50,000participants
> 50,000 participants
Corporate
Tax-Exempt
Government
Automotive, Construction& Mining, Manufacturing
Energy/Utilities
Aerospace/Defense
Financial Services,Insurance
Health Care
2020 2019
Total meetings
1.8
1.7
1.8
1.8
1.7
1.3
1.8
2.1
1.3
1.3
1.5
1.3
4.7
5.5
4.0
5.2
4.8
4.6
4.3
8.6
5.0
4.3
4.2
6.7
5.2
5.2
4.8
6.3
5.4
2.9
5.0
6.8
6.0
5.3
5.0
4.0
2.8
2.2
3.0
3.5
3.2
1.0
2.0
0.0
1.0
4.0
0.0
4.0
In-person meetings Virtual meetings

14
83%
56%
47%
25%
24%
11%
7%
5%
3%
1%
79%
11%
36%
21%
n/a
9%
6%
n/a
4%
4%
Investment consultant
Internal legal counsel
Relationship manager from DC planrecordkeeper
Outside legal counsel
Fund managers
Benefits consultant
Employee group representatives(e.g., nurses or engineers)
Actuaries
Public input
Union representatives
2020 2017
Investment consultants are the most likely non-committee member to attend committee meetings in both the 2021 DC Survey and Callan’s 2017 Governance Survey.
We observe a sharp increase in internal legal counsel attending meetings (from 11.3% to 56.0%) and a slight increase in external legal counsel (20.8% to 25.3%) over three years. More survey respondents indicate that the relationship manager from the DC plan recordkeeper attended meetings in 2020 than 2017.
Few plans include employee representatives, actuaries, public input, or union representatives at committee meetings.
Non-committee advisers that attend the committee meetings*
*Multiple responses allowed.
DC Plan Governance Trends: Non-Committee Member Attendees
Most common non-committee attendees
1. Investment consultant
2. Legal counsel
3. DC plan recordkeeper relationship manager

15
Yes89%
No10%
Don't know 1%
Nearly 9 in 10 (89.0%) plan sponsors engaged an investment consultant in 2020, in line with 2019 (89.2%) and up from 2018 (84.1%). Of those that utilize an investment consultant, 54.8% solely use a 3(21) non-discretionary adviser. Government plan sponsors are more likely to use an investment consultant (93.8%) but are less certain of the adviser’s role (discretionary vs. non-discretionary). A notable portion of corporate and tax-exempt plan sponsors (21.4%) were unsure which type of consultant they use.
A handful of corporate and tax-exempt entities report using a 3(38) discretionary adviser, either exclusively or partially, while no government plans confirmed using this type of consultant. This low uptake may reflect that these plan sponsors are less likely to participate in these types of surveys, as they have delegated several facets of fiduciary responsibility.
Use of investment consultant (project or retainer)
Type of consultant used
55%
3%
6%
26%
3(21) non-discretionaryadviser
3(38) discretionary adviser(OCIO)
3(21) non-discretionary and3(38) discretionary advisers
Unsure whether 3(21) or3(38) adviser
DC Plan Governance Trends: Use of Investment Consultants
55%
4%
7%
21%
56%
0%
0%
38%
Yes88%
No11%
Don't know2%
Yes94%
No6%
3(38) discretionary consultant: The investment consultant selects and monitors funds and acts as a co-fiduciary (also known as an outsourced chief investment officer or OCIO model).
3(21) non-discretionary consultant: The investment consultant monitors and recommends changes as a co-fiduciary, while the plan sponsor maintains the fiduciary responsibility in selecting investments.
All respondentsCorporate or tax-exempt Government
Corporate or tax-exempt GovernmentAll respondents
16
79%
70%
68%
64%
62%
32%
24%
8%
3%
4%
6%
7%
13%
30%
29%
32%
32%
68%
69%
0% 100%
Roth deferrals
Automatic enrollment
After-taxcontributions
Automatic increase
Roth in-planconversions
Traditional ADP/ACPsafe harbor
Automatic enrollmentADP/ACP safe
harbor
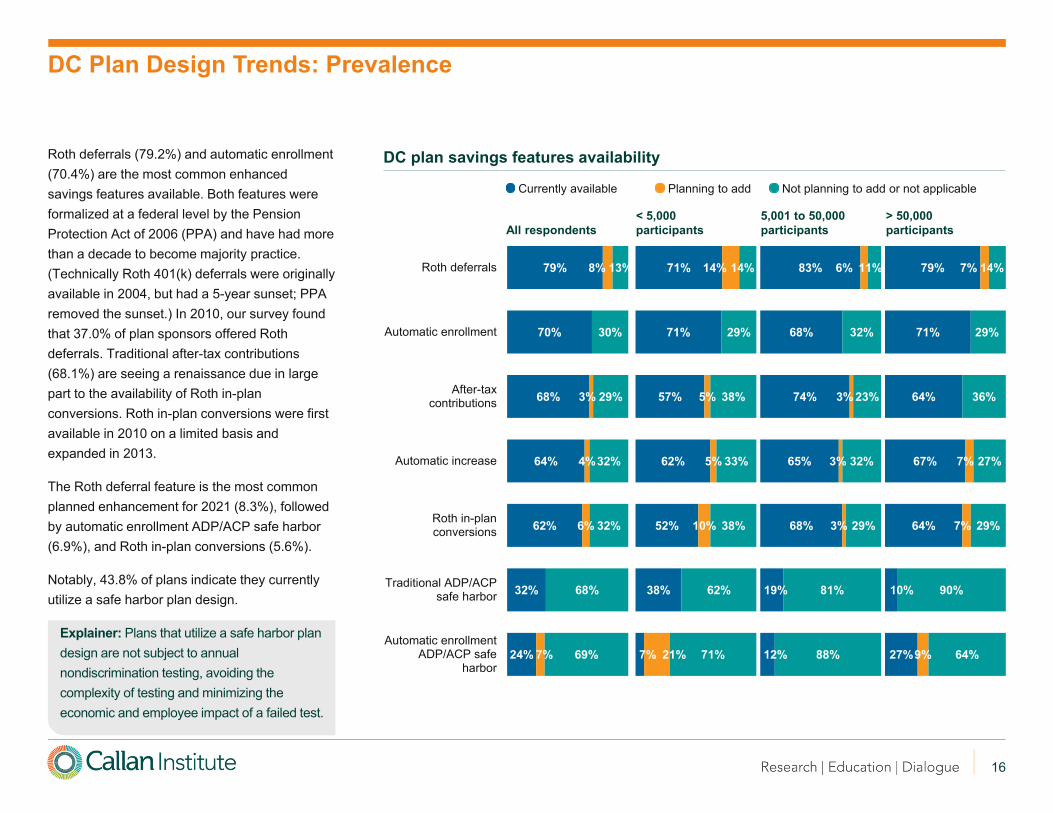
Roth deferrals (79.2%) and automatic enrollment (70.4%) are the most common enhanced savings features available. Both features were formalized at a federal level by the Pension Protection Act of 2006 (PPA) and have had more than a decade to become majority practice. (Technically Roth 401(k) deferrals were originally available in 2004, but had a 5-year sunset; PPA removed the sunset.) In 2010, our survey found that 37.0% of plan sponsors offered Roth deferrals. Traditional after-tax contributions (68.1%) are seeing a renaissance due in large part to the availability of Roth in-plan conversions. Roth in-plan conversions were first available in 2010 on a limited basis and expanded in 2013.
The Roth deferral feature is the most common planned enhancement for 2021 (8.3%), followed by automatic enrollment ADP/ACP safe harbor (6.9%), and Roth in-plan conversions (5.6%).
Notably, 43.8% of plans indicate they currently utilize a safe harbor plan design.
Explainer: Plans that utilize a safe harbor plan design are not subject to annual nondiscrimination testing, avoiding the complexity of testing and minimizing the economic and employee impact of a failed test.
DC Plan Design Trends: Prevalence
DC plan savings features availability
71%
71%
57%
62%
52%
38%
7%
14%
5%
5%
10%
21%
14%
29%
38%
33%
38%
62%
71%
0% 100%All respondents< 5,000 participants
5,001 to 50,000 participants
> 50,000 participants
83%
68%
74%
65%
68%
19%
12%
6%
3%
3%
3%
11%
32%
23%
32%
29%
81%
88%
0% 100%
79%
71%
64%
67%
64%
10%
27%
7%
7%
7%
9%
14%
29%
36%
27%
29%
90%
64%
0% 100%
Currently available Planning to add Not planning to add or not applicable

17
72%
67%
49%
1%
1%
27%
33%
50%
0% 100%
Partial distributions
Installment payments
Managed accountservices
Partial distributions (71.8%) and installment payments (67.1%) are the most common decumulation features. Both have been available for decades and, while the rules have varied over time, their prevalence has increased steadily as plan sponsors explore retirement income options.
Large plans are the most likely to offer managed accounts.
Only 3% of respondents removed managed accounts from their plan in 2019 or 2020. (This group is not included in the chart to the right.)
DC Plan Design Trends: Prevalence
DC plan decumulation features availability
55%
50%
42%
45%
50%
58%
0% 100%All respondents< 5,000 participants
5,001 to 50,000 participants
> 50,000 participants
77%
76%
40%
3%
3%
20%
24%
57%
0% 100%
86%
71%
87%
14%
29%
13%
0% 100%
Currently available Planning to add Not planning to add or not applicable

18
17%
44%
11%
14%
3%
11%
0% 45%
40%
40%
7%
7%
0%
7%
0% 45%
29%
39%
12%
11%
1%
8%
0% 45%
Within past year
1 to 3 years ago
3 to 5 years ago
More than5 years ago
Never
Don't knowor don't recall
Most respondents indicate they completed a formal plan design evaluation to understand DC plan gaps and needs during the past three years.
In contrast to other fiduciary elements, evaluating and setting the plan design are generally considered settlor actions. This type of evaluation may be driven by:
1. Plan sponsor review of benefits broadly
2. Competitive analysis by industry, geography, or both
3. Administrative or compliance issues (e.g., failing nondiscrimination testing or to allow accelerated savings options)
Nearly 7 in 10 respondents completed a plan design evaluation in the past three years.
DC Plan Design Trends: Evaluation
Frequency of formal plan design evaluations
43%
26%
17%
9%
0%
4%
0% 45%All respondents< 5,000 participants
5,001 to 50,000 participants
> 50,000 participants

19
Most survey respondents (84.4%) indicate they did not make a change to their matching contribution in 2020.
15.6% of plan sponsors report making a change to their company match in some fashion, an increase from last year (13.6%). Of those that made a change, the most common action was to eliminate, suspend, or reduce the match (70.0%). Last year’s survey found that the most common action was to restructure the match (41.7%).
The percentage of plan sponsors that eliminated, suspended, or reduced the matching contribution doubled in 2020 compared to previous years. Of those that reported any type of change to the match, 6 in 10 indicated they would reinstate it in 2020 or 2021. None of the plans surveyed expect to eliminate or reduce the match in 2021.
1 in 10 plans reduced or suspended the match in 2020.
More than 8 in 10 of that group will reinstate the match.
Company match actions*
*Percentages out of those taking steps with respect to the company match. Multiple responses allowed.
DC Plan Design Trends: Company Match
Took step in 2020 Will take step in 2021
Eliminate, suspend, or reduce match 70% Reinstate the match if suspended 50%
Reinstate the match if suspended 10% Improve matching formulas 20%
Improve matching formulas 10% Change to stretch match 20%
Add a match true-up feature 10% Change timing of contributions 10%
Change to stretch match 0% Move to safe harbor design 10%
Change timing of contributions 0% Eliminate, suspend, or reduce match 0%
Move to safe harbor design 0% Add a match true-up feature 0%

20
DC Plan Design Trends: Plan Leakage
Steps taken to prevent plan leakage*
*Multiple responses allowed.
^e.g., reduce number of loans allowed, change loan frequency.
Most plan sponsors (91.4%) have taken steps to prevent plan leakage. Actions include offering partial distributions (69.2% in 2020 vs. 56.7% in 2018) and installment payments (63.5% in 2020 vs. 44.8% in 2018). These types of distribution options can help prevent plan leakage since the participant is not forced to take a total distribution.
Slightly less than half of survey respondents (47.5%) allow terminated participants to continue repaying their DC plan loans.
Only 14.3% of respondents anticipate taking additional steps to prevent plan leakage in 2021—most notably, to make the fund lineup more attractive to retirees. This is a sharp decrease from prior years, which may be due to a strong drive to mitigate plan leakage in prior years, or a reflection of other business needs taking priority in 2021.
9 in 10 plan sponsors have taken steps to prevent plan leakage.
These plan sponsors report taking an average of 3.5 actions to reduce leakage.
69%
64%
58%
48%
33%
22%
18%
2%
0%
2%
2%
8%
5%
0%
0.00% 10.00% 20.00% 30.00% 40.00% 50.00% 60.00% 70.00%
Offer partial distributions
Offer installment payments
Encourage rollovers from other qualified plans
Allow terminated/retired participants to continuepaying off loans
Make fund lineup more attractive toterminated/retirees
Restructure plan loan provisions^
Place restrictions on distributions
Took this step in the past Will take this step in 2021

21
83%
69% 67%
12% 12% 10%
Seeks to retain assets of retirees
Seeks to retain assets of terminated participants
Seeks to retain both retirees and terminated participants
Does not seek to retain assets of retirees
Does not seek to retain assets of terminated participants
Does not seek to retain either retirees or terminated participants
The majority of plan sponsors seek to retain the assets of both retiree and terminated participants (66.7%), a notable increase from five years ago (43.5%). More than 8 in 10 respondents with a defined strategy around this issue seek to retain retiree assets.
Various rationales can drive the decision to retain assets. For example, retirees often have higher account balances, which can lead to cost efficiencies for the plan. On the other hand, account balances of employees who terminate before retirement can vary widely, as can the length of time before retirement, making these accounts potentially less efficient to retain.
Plan sponsors should weigh cost efficiency benefits against the fiduciary responsibility of retaining assets for participants who are not actively employed with the plan sponsor (e.g., maintain contact information to provide notices, monitor investments).
Around one-third of plan sponsors do not have an asset retention policy. Interestingly, the proportion of active versus terminated participants had no impact on the sponsors’ likelihood of having a policy in place to address those assets.
Strategies to retain retiree / terminated assets*
*Percentages out of those with a stated intent in place. Multiple responses allowed.
DC Plan Design Trends: Post-Employment Assets

22
Nearly two-thirds of plans (63.1%) offered some sort of retirement income solution to employees in 2020. Providing access to a drawdown solution or managed account service were the two most common.
Explainer: a drawdown solution is a simplified process on the participant website (e.g., a one-step button) to implement the output from a retirement calculator. It is a more streamlined process for participants to establish a stream of income, who would otherwise have to manually transfer the calculator output into the transactional section of the website.
Few plan sponsors offer qualified longevity annuity contracts (QLACs) or longevity insurance in their plans despite a 2014 Treasury Department ruling making it easier to do so. Nearly 5% of plan sponsors indicate they are planning to add an in-plan guaranteed minimum withdrawal benefit product or a form of longevity insurance.
63.1% of plan sponsors offer aretirement income solution.
63%
45%
39%
33%
12%
11%
6%
5%
33%
25%
n/a
17%
5%
8%
0%
9%
11%
18%
n/a
18%
11%
10%
1%
4%
0.00% 10.00% 20.00% 30.00% 40.00% 50.00% 60.00%
Drawdown solution or calculator
Managed accounts for retirees
Access to defined benefit plan (all respondents)**
Access to defined benefit plan(government plans removed from dataset)
Annuity as a form of distribution(e.g., money purchase distribution)
Annuity platform services that allow for directcomparison of quotes from multiple annuity providers
(e.g., Hueler Income Solutions)
Longevity insurance / QLAC
In-plan guaranteed minimum withdrawalbenefit product
2020 2019 2018
Retirement income solutions offered*
DC Plan Design Trends: Retirement Income Solutions
*Multiple responses allowed.**Government plans were not included in the DC Survey for 2018 and 2019 plan years. Including governmental plans artificially inflates the 2020 experience, in comparison.

23
Ranking
Increasing savings rates 5.2
Plan participation 4.9
Retirement readiness (e.g., income replacement levels) 4.7
Investing (e.g., market activity, use of funds, diversification, market timing) 3.9
Financial wellness 3.0
Fees 2.1
Managing income in retirement 1.5
When ranking priorities for participant communications, plan sponsors focus on topics that will help improve participants’ position within the DC plan: savings rates, plan participation, and retirement readiness are tightly grouped in the top three. Financial wellness, which was ranked number one in last year’s survey, dropped to number five. This may reflect an increased focus on getting back to basics, as a result of the current environment.
New categories that we introduced in this year’s survey—communicating plan design changes and investing strategy considerations driven by the 2020 pandemic—ranked in the bottom half of communication priorities.
Areas of communication focus
*Multiple responses allowed.
DC Plan Trends: Participant Communication
(7=Most focus. Total ranking is weighted average score.)Additional categories: Plan design changes driven by 2020 pandemic (1.4); loans (1.1); withdrawals/distributions (1.1); managed account services (0.8); investing strategies driven by 2020 pandemic (0.7); company stock (0.4).

24
85%
78%
72%
46%
32%
32%
7%
4%
5%
84%
67%
56%
33%
24%
24%
4%
4%
0%
Mutual Funds
Collective trusts
Collective trusts for non-stablevalue funds
Collective trusts for stable valuefunds
Separately managed accounts fornon-stable value funds
Unitized or private label funds
Annuities (fixed or variable)
Pooled insurance companyseparate accounts
Standalone ETFs
2020 2019
Mutual funds (85.1%) and collective trusts (78.4%) continue to be the most prevalent investment vehicles. Plans are less likely to use collective trusts for stable value funds (45.9%) than non-stable value options (71.6%).
Over the past decade, the use of mutual funds has decreased by nearly 10% while the use of collective trusts has increased by about 25%. In 2020, separate account usage for non-stable value funds increased slightly from 2019 (23.5%).
The proportion of plans using unitized funds increased from 23.5% in 2019 to 32.4% in 2020. The majority of plans that use unitized funds (95.8%) have over $1 billion in assets.
Investment types within the fund lineup*
*Multiple responses allowed. Some respondents offer multiple asset classes in each vehicle type (e.g., both stable value and another asset class are offered as a collective trust and/or separate account).
DC Plan Investment Trends: Types of Investment Vehicles
25
All respondents< 5,000 participants
5,001 to 50,000 participants
> 50,000 participants
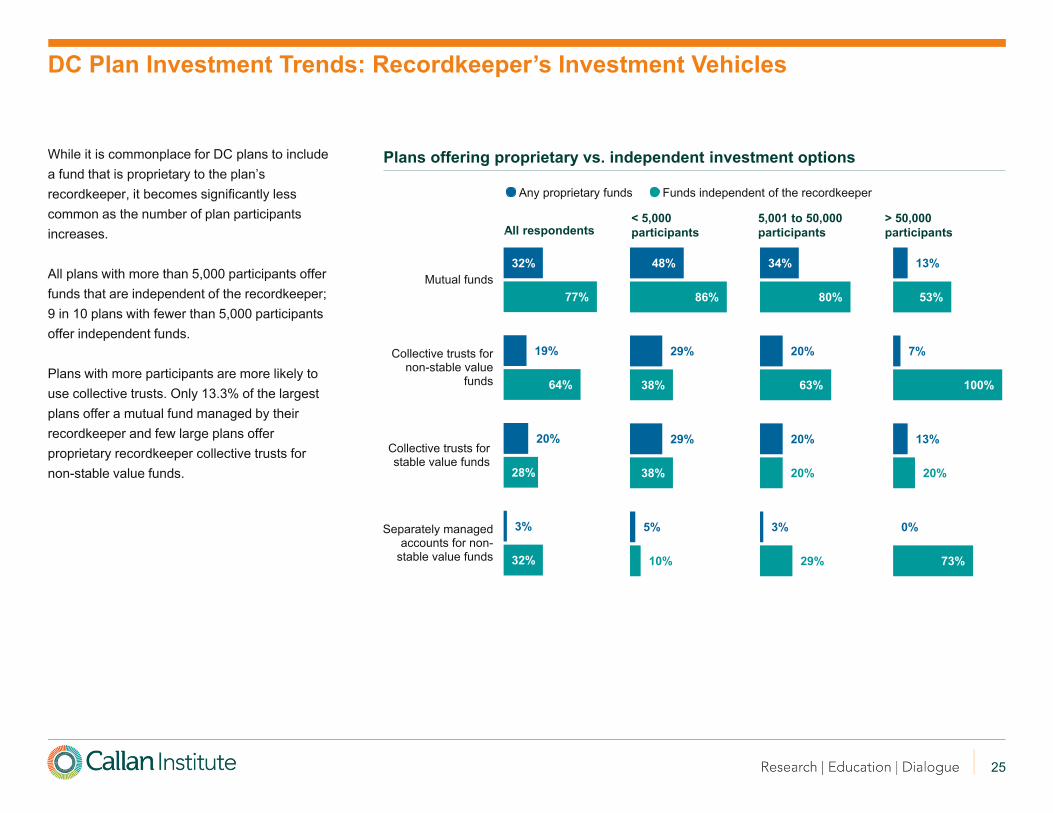
While it is commonplace for DC plans to include a fund that is proprietary to the plan’s recordkeeper, it becomes significantly less common as the number of plan participants increases.
All plans with more than 5,000 participants offer funds that are independent of the recordkeeper; 9 in 10 plans with fewer than 5,000 participants offer independent funds.
Plans with more participants are more likely to use collective trusts. Only 13.3% of the largest plans offer a mutual fund managed by their recordkeeper and few large plans offer proprietary recordkeeper collective trusts for non-stable value funds.
DC Plan Investment Trends: Recordkeeper’s Investment Vehicles
Plans offering proprietary vs. independent investment options
32%
19%
20%
3%
77%
64%
28%
32%
0.00% 100.00%
Mutual funds
Collective trusts fornon-stable value
funds
Collective trusts forstable value funds
Separately managedaccounts for non-
stable value funds
48%
29%
29%
5%
86%
38%
38%
10%
0.0% 100.0%
34%
20%
20%
3%
80%
63%
20%
29%
0.0% 100.0%
13%
7%
13%
0%
53%
100%
20%
73%
0.0% 100.0%
Any proprietary funds Funds independent of the recordkeeper

26
57%
12% 10%
11%
11% 11%
11%
30%26%
11%
30%34%
9%15% 16%
2% 2%
2010 Offered in 2020 Will offer in 2021
The usage of recordkeeper target date vehicles in DC plans continues to drop over time.
Only 22.7% of respondents used their recordkeeper’s target date option in 2020, a sharp decrease from 67.4% from a decade ago. That number is projected to decrease slightly in 2021 to 21.3%.
The prevalence of mutual funds for the target date fund is on the decline, as well. In 2010, 67.4% of plans used a mutual fund for their target date fund compared to 42.4% in 2020.
Target date fund approach: in place and will be in place
DC Plan Investment Trends: Target Date Fund Approaches
67% offer RK funds
23% offer RK funds
Don’t know
Custom target date strategy
Collective trust not recordkeeper’s
Mutual fund not recordkeeper’s
Collective trust of recordkeeper
Mutual fund of recordkeeper

27
26%
26%
11%
5%
3%
3%
35%
28%
32%
5%
2%
2%
3%
32%
0.00% 5.00% 10.00% 15.00% 20.00% 25.00% 30.00% 35.00% 40.00%
Evaluate suitability of underlying funds
Evaluate suitability of glidepath
Replace target date fund / manager
Shift to a mix of active and passive target date fund
Change share class of target date fund
Add target date fund
None of the above
Changed in 2020 Will change in 2021
Most plans took at least one action around the target date fund in 2020 (64.6%). The most common actions were to evaluate the suitability of the underlying funds and the glidepath (26.2% each). A slightly higher percentage of plans aim to accomplish these tasks in 2021.
4 in 10 respondents that reviewed the underlying funds in 2020 also report they would do so in 2021; only two in 10 that reviewed the glidepath will do so both years.
Notably, 15.4% of respondents indicated they were changing the target date fund/manager in either 2020 or 2021.
Actions taken or planning to take regarding target date fund suite*
*Multiple responses allowed.
DC Plan Investment Trends: Actions Around Target Date Funds
Additional categories with <2% (2020): Shift to all passive, move to dynamic QDIA, move to target date collective trust, move tocustom target date funds, eliminate target date fund.

28
Most DC plan sponsors (62.0%) offer either managed account services or advice to support plan participants.
While the definition of a fiduciary who provides advice has been in flux over the years, advice itself is generally limited to a recommendation on how to manage investments without actually implementing that advice.
One-quarter of respondents indicate they offer advice only.
Managed account services are geared toward “do-it-for-me” investors who desire greater personalization. Managed account providers are investment managers under the Employee Retirement Income Security Act (ERISA) section 3(38). They offer independent, third-party advice and implement the portfolio recommendations, with a glidepath, and ongoing rebalancing. In addition, the services include a variety of tools, communication, education, and in-person or phone counseling for participants. Nearly half of plans report offering managed accounts.
Offer managed accounts services or advice*
DC Plan Investment Trends: Managed Accounts and Advice
*Managed account products include an advice component.
62%4%
1%
32%
56%
9%
3%
31%
64%
36%
All respondents
Yes Planning to add Previously offered, but removed No
Corporate or tax-exempt Government

29
8%
12%
16%
22%
22%
20%
30%
34%
36%
0.00% 5.00% 10.00% 15.00% 20.00% 25.00% 30.00% 35.00%
Direct relationship with advice provider
Sub-advised by internal group at recordkeeper
Recordkeeper product sub-advised by third party
There are two basic types of fiduciary arrangements for managed account services and advice providers:
Sub-Advised RelationshipThe recordkeeper (or an affiliate) is the adviser and fiduciary; the advice provider serves as a sub-adviser. The communications and call center are supported by the recordkeeper. The recordkeeper sets the fees and pays the advice provider a sub-advisory fee, if applicable.
This relationship is the most common for plan sponsors who include both managed account and advice services (26.5%).
Managed accounts services are most commonly offered through a recordkeeper product, with similar rates for a managed account product powered by an internally (16.2%) or by a separate party (14.7%).
Direct Relationship with Advice ProviderThe advice provider serves as the adviser and fiduciary. The advice provider generates communications and provides call center support. It also determines fees and pays the recordkeeper an ongoing data connectivity fee for data, transactional, web, and operational support.
Fiduciary relationship of managed accounts services or advice*
*Managed account products include an advice component. Multiple responses allowed.
DC Plan Investment Trends: Managed Accounts and Advice – Fiduciary Relationship
All respondents Advice Managed accounts

30
83%
10%
7%
3%
3%
3%
3%
No changes anticipated
Increase communication to improvediversification out of company stock
Regularly review company stock ininvestment committee meetings
Offer more tools to improvediversification out of company stock
Cap contributions to company stock
Outsource oversight of companystock
Waiting to make decision pendingthe outcome of recent stock drop
lawsuits
More than 4 in 5 respondents (83.3%) with company stock do not anticipate making changes to their company stock fund in the coming year, which represents a slight increase over prior years (81.8% in 2018, 66.7% in 2016, 72.7% in 2014).
The respondents that are planning changes in 2021 indicate they will take 1 to 2 actions, on average.
Next year, 10.0% of plan sponsors with company stock in the lineup will increase communication around participant diversification away from company stock. Similar to last year’s findings, no respondents intend to eliminate company stock in 2021, in contrast to 2.8% in 2016.
Slightly less than one-third of plan sponsors include company stock in the DC plan.
Changes regarding company stock next year*
*Multiple responses allowed.
DC Plan Investment Trends: Anticipated Changes to Company Stock
Additional categories with 0%: Eliminate insiders from investment committee; hardwire company stock into the plan document; freeze company stock; eliminate company stock as a plan option.

Key Findings: Legislation
SECURE Act (Setting Every
Community Up for Retirement
Enhancement): Uncertainty exists
around adoption due in part to
competing priorities and limited
guidance. These headwinds and
relative newness are reflected in the
reported implementation.
Multiple Employer Plan (MEP) / Pooled Employer Plan (PEP) Adoption
76%of DC plans signaled they are very unlikely to join an MEP or PEP once they are available
See pages 39 & 40 for details
Top Concerns
76% Less control over plan administration
69% Complexity around administration
67% Competitiveness relative to existing plan
CARES Act (Coronavirus Aid, Relief, and Economic Security)
73% adopted coronavirus-related distributions (CRDs)
Employers that reported taking a workforce action (e.g., salary reductions, layoffs) were more likely to adopt CARES provisions
63%of governmental plans offered CRDs
increased loan maximums13%
Largest plans’ top concerns for MEP / PEP
Limited cost efficiencies
Competitiveness relative to existing plans
32% of plan sponsors with a QACA will increase their automatic escalation rate as a result of SECURE Act
See page 34 for details See page 40 for details
See page 46 for detailsSee page 42 & 43 for detailsSee page 43 for detailsSee page 42 for details
1 /3are unsure if they will add annuities and are waiting for further guidance
See pages 36 & 37 for details
~ 4 0 %increased loan maximums

32
CARES and SECURE Legislation
CARES and SECURE Acts Regulatory Guidance
SECURE Act December 2019
CARES Act March 2020
Further SECURE Act Regulatory Guidance
2021
What’s next: TBDSECURE 2.0
Portman-Cardin Legislation
Two recent bodies of law impacting retirement—the Setting Every Community Up for Retirement Enhancement (SECURE) Act and Coronavirus Aid, Relief, and Economic Security (CARES) Act—followed widely different paths to enactment with wildly divergent purposes.
The SECURE Act, passed in December 2019, was the first major retirement-related legislation enacted since the Pension Protection Act (PPA) in 2006. SECURE represents the culmination of years spent negotiating and revising the bill. Its primary goal was to increase coverage—increasing the deferral cap in certain safe harbor plans, adding the new requirement to let “long-term part-time” employees defer into a 401(k) plan, and devising the new Pooled Employer Plan (PEP) and revised Multiple Employer Plan (MEP) structures, among others. The effective date of those provisions ranges between 2020 and 2024.
In contrast, the CARES Act was introduced to Congress as the second round of federal stimulus on March 25, 2020, and passed on March 27, with some retirement provisions effective immediately. While SECURE’s aim is to expand retirement savings opportunities, CARES’ focus is to make retirement assets available to participants with as few barriers as possible.
Both bodies of law included optional and mandatory provisions.
Due to the urgent needs generated by the pandemic for participants, plan sponsors, recordkeepers, and regulators, the implementation of SECURE has been more limited than had been anticipated at the outset of 2020. Instead of pushing through a swath of regulation needed to implement the provisions of SECURE, the Internal Revenue Service (IRS) and Department of Labor (DOL) were sidetracked with the volume of guidance needed to support the immediacy of CARES.
As a part of the 2021 DC Survey, Callan looked to understand the degree of implementation and where uncertainty remains for both pieces of legislation.

33
A fair amount of uncertainty exists around adoption, in part due to competing priorities and limited guidance.
SECURE Act
– Trends in DC plan design are largely driven by regulatory and legislative catalysts (e.g., target date funds, auto features)
– The SECURE Act will likely have significant impacts on DC plans; its rollout was hindered by the pandemic’s impact on plan sponsors’ organizational priorities and regulatory agencies’ priorities
What you need to know
– Increases the deferral cap from 10% to 15% in automatic enrollment safe harbor plans
– Expands availability of open MEPs and created PEPs
– Long-term part-time employees must be permitted to make deferrals
Broadening Coverage
– Increases the age to commence required minimum distributions
– Requires annual lifetime income projection disclosures
– Safe harbor for annuity provider selection plus portability
Increases Decumulation Flexibility
Implementation
– The volume of changes has led recordkeepers and plan sponsors to scramble to update programming, plan documents, tax withholding and reporting, required notices, communications, forms, and SPDs
– A number of provisions are still awaiting further clarification/guidance
The pool of plan sponsors willing to implement an annuity product is limited, particularly when guidance has not yet been issued on the new safe harbor.
Certain provisions that are not effective in 2020 or 2021 will still require programming and tracking in the near term (e.g., long-term part-time employee hours counting).
A modest but notable percentage of automatic enrollment safe harbor plans will increase the cap on deferrals.

34
Statistics based on subset of respondents that answered yes or no.
12%
20%
68%
30%36%
Yes, up to a rate between 10%-15%
Yes, up to 15% No Don't know Not applicable
The SECURE Act, passed in December 2019, allows plan sponsors with an automatic enrollment safe harbor (Qualified Automatic Contribution Arrangement or QACA) plan design to increase the automatic escalation cap to 15%. The cap was previously set at 10% as per the (PPA).
Only 24.1% of the total survey respondent pool currently utilize this plan design feature. Remarkably, 20% of the plan sponsors that have a QACA indicate they will increase the automatic escalation cap to 15% and another 12% indicated that they would increase the cap between 10% and 15%.
While 68% of plan sponsors with a QACA said that they would not increase the rate, that number could fall once the pandemic has passed and plan sponsors have an opportunity to revisit retirement savings.
Have or will increase automatic escalation cap in QACAs
SECURE Act: Encouraging Retirement Savings
32% of plan sponsors with a QACA will increase their automatic escalation rate as a result of SECURE Act.

35
2% 8%4%
33%
53%
Very likely Somewhat likely Somewhat unlikely
Very unlikely Unknown
SECURE Act: Encouraging Retirement Savings
A safe harbor plan design can eliminate the burden and consequences of nondiscrimination testing. Testing failures are generally corrected by refunding excess amounts from the plan or making additional contributions to lower-paid employees.
Historically the safe harbor contribution had to be communicated to participants at least 30 days prior to the plan year, leaving plan sponsors with limited options to address testing issues in the current year. The SECURE Act changes that timing and allows plan sponsors to add a safe harbor non-elective contribution prior to year-end (3% employer contribution) or prior to the end of the next tax year (4% employer contribution).
Very few respondents indicate that they are very or somewhat likely to add a safe harbor non-elective contribution at some point in the future. Most respondents are uncertain if they would utilize it in the future. The uptake of this option will likely evolve over time.
More than half of respondents are uncertain if they would take advantage of the more flexible safe harbor plan.
Willing to adopt a safe harbor non-elective contribution after the beginning of the plan year

36
Uncomfortable/unclear about fiduciary implications
3.6
Unnecessary or not a priority 3.4
No participant need or demand 3.2
Concerned about insurer risk 3.0
Too costly to plan sponsors/participants
2.3
Difficult to communicate to participants
2.1
Uncomfortable with available products
2.1
Too administratively complex 2.0
Availability of DB plan 2.0
Products are not portable 1.8
Lack of product knowledge 1.5
Recordkeeper will not support this product
1.1
Plan sponsors cited several reasons why they are unlikely to offer an annuity-type product in Callan’s 2020 DC Survey, such as being uncomfortable or unclear about the fiduciary implications, and viewing an annuity-type product as unnecessary or not a priority. Respondents also indicated that a lack of participant need or demand, concern over insurer risk, and concern over cost drove the decision to not offer these products.
The SECURE Act looked to address plan sponsors’ concerns and provide a safe harbor around annuity selection.
In the past three years of survey data, between 5% and 10% of respondents indicated that they currently offered an annuity product. This year 7% of respondents indicated they offer an annuity option (3% of government respondents, 3% of the tax-exempt employers, and 4% corporate).
17% of respondents indicated they are very or somewhat likely to add an annuity option following the SECURE Act. Mid-sized plans (5,000-50,000 participants) expressed the most willingness to add an annuity.
Reasons for not offering an annuity-type product (2020 DC Survey)
10%
5%
15%
17%
5%
12%
23%
23%
15%
20%
23%
23%
45%
31%
38%
27%
35%
32%
Willingness to add an annuity option following SECURE
SECURE Act: In-Plan Annuity Safe Harbor
(5=Most important. Total ranking is weighted average score.)
Full dataset
> 50,000 participants
5,001 to 50,000 participants
< 5,000 participants
Very likely Somewhat likely
Somewhat unlikely Very unlikely
Unsure, awaiting further guidance
Ranking

37
12% 12%15%
21%
40%
Very likely Somewhat likely Somewhat unlikely Very unlikely Unknown
Until the SECURE Act, DC plans that allowed investment in a lifetime income investment faced a dilemma if they wished to remove the product from the plan or move to a new recordkeeping platform that did not support the product.
The SECURE Act creates portability for lifetime income options that can no longer be held as an investment option in a DC plan by permitting a direct rollover to an IRA or other retirement plan, or in the case of an annuity contract, through direct distribution to the individual. Distributions must occur within a limited time frame (no earlier than 90 days prior to the lifetime income investment being removed).
This change gives plan sponsors the flexibility to remove these options while permitting participants to preserve their lifetime income investments and avoid surrender charges or penalties. It allows plan sponsors to consider in-plan annuities or a guaranteed product without having their hands tied should they elect to remove the option or change to a different recordkeeper in the future.
Given the forward-looking nature of this feature, usage is difficult to gauge at this point.
Willing to rollout lifetime income balances based on SECURE, if needed
SECURE Act: Annuity Portability

38
1%
3%
10%
21%
19%
12%
34%
Yes, we have added birth / adoption withdrawalsand permit repayments
Yes, we have added birth / adoption withdrawals
Very likely
Somewhat likely
Somewhat unlikely
Very unlikely
Unknown
Birth/Adoption Withdrawals
SECURE allows parents to take early withdrawals of up to $5,000 per child from their retirement accounts within a year of a child’s birth or adoption, effective Jan. 1, 2020. These withdrawals are not subject to the 10% excise tax for distributions prior to age 59 ½ or the 20% mandatory withholding. Participants can repay this type of withdrawal to the distributing plan (if it accepts rollover contributions). Only 4%currently offer birth / adoption withdrawals.
Qualified Disaster Withdrawals
SECURE provides a framework for disaster withdrawals. For nationally declared disasters from Jan. 1, 2018, through Feb. 18, 2020, impacted participants can take a loan or distribution up to $100,000 (with no 10% early withdrawal tax) which can be recontributed within three years. The funds must be taken within 180 days of the enactment of the SECURE Act. Key features of this relief include: (1) extending the loan for an additional year, (2) repayment of hardship withdrawals for home purchases in the disaster area, and (3) the ability to spread taxation over a three-year period.
28% of plan sponsors added either the qualified disaster withdrawals and/or loans.
Birth or adoption withdrawals
Withdrawal or loan option for expenses associated with a “qualified disaster”
SECURE Act: New Withdrawal Types
14%
1%
13%
10%
13%
17%
4%
29%
Yes, we have added withdrawals
Yes, we have added loans up to $100k
Yes, we have added withdrawals andloans up to $100k
Very likely
Somewhat likely
Somewhat unlikely
Very unlikely
Unknown
39
4%
6%
7%
4%
8%
5%
9%
6%
76%
77%
72%
80%
11%
14%
8%
13%
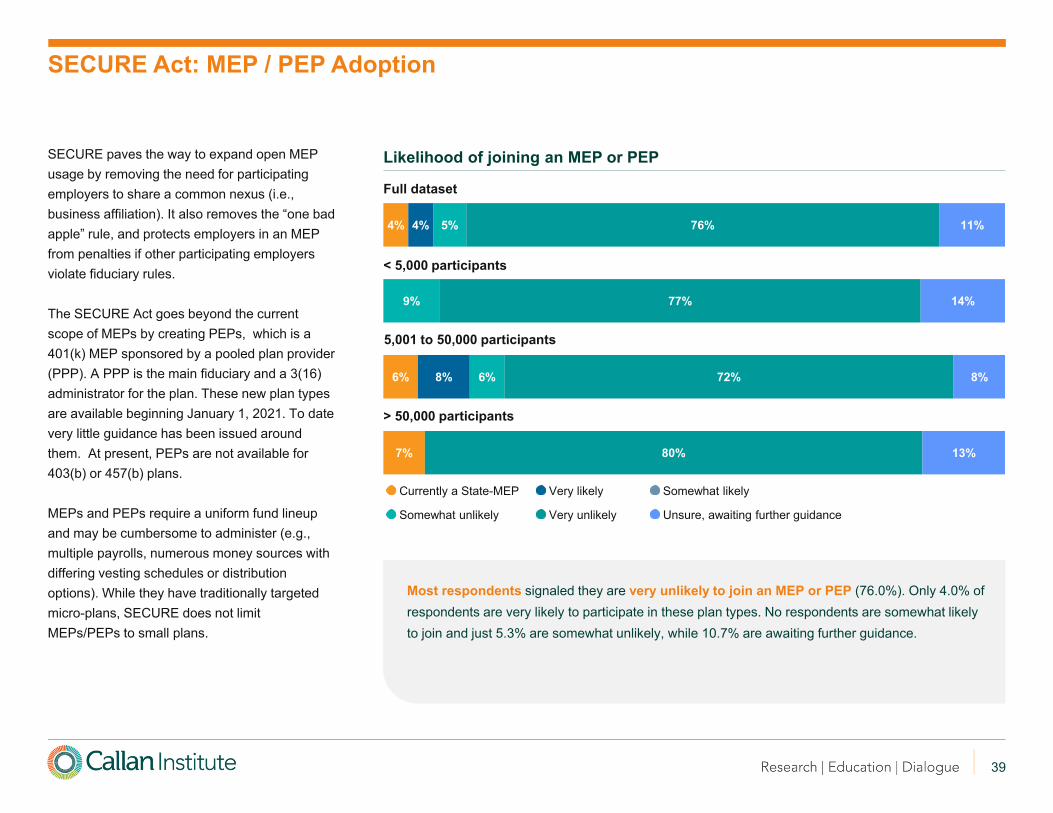
SECURE paves the way to expand open MEP usage by removing the need for participating employers to share a common nexus (i.e., business affiliation). It also removes the “one bad apple” rule, and protects employers in an MEP from penalties if other participating employers violate fiduciary rules.
The SECURE Act goes beyond the current scope of MEPs by creating PEPs, which is a 401(k) MEP sponsored by a pooled plan provider (PPP). A PPP is the main fiduciary and a 3(16) administrator for the plan. These new plan types are available beginning January 1, 2021. To date very little guidance has been issued around them. At present, PEPs are not available for 403(b) or 457(b) plans.
MEPs and PEPs require a uniform fund lineup and may be cumbersome to administer (e.g., multiple payrolls, numerous money sources with differing vesting schedules or distribution options). While they have traditionally targeted micro-plans, SECURE does not limit MEPs/PEPs to small plans.
Likelihood of joining an MEP or PEP
SECURE Act: MEP / PEP Adoption
Full dataset
> 50,000 participants
5,001 to 50,000 participants
< 5,000 participants
Currently a State-MEP Very likely Somewhat likely
Somewhat unlikely Very unlikely Unsure, awaiting further guidance
Most respondents signaled they are very unlikely to join an MEP or PEP (76.0%). Only 4.0% of respondents are very likely to participate in these plan types. No respondents are somewhat likely to join and just 5.3% are somewhat unlikely, while 10.7% are awaiting further guidance.

40
Guidance is still required for countless administrative and compliance hurdles, including safe harbor plan status for certain members, nondiscrimination testing, distribution tracking (e.g., managing distributions and rollovers for a participant who leaves one employer in the MEP and moves to another), complexity around administration (e.g., employees moving between employers with different rights or features based on money source, nondiscrimination testing, limits monitoring), and a prohibited transaction exemption for PPPs.
Survey respondents were generally concerned about administrative issues:75.6% of respondents identified less control over plan administration as a concern (3.8 weighted rating out of 5). Administration complexity was cited by 68.9% of respondents (3.2). Competitiveness relative to the existing plan was a concern for 66.7% of respondents (3.2).
Plan size affects top concerns. The largest plans flagged limited cost efficiencies first (due to efficiencies in the current plan), followed by competitiveness relative to the existing plan. The largest plans are the least likely to participate in an MEP or PEP.
Top concerns around moving to an MEP or PEP, as defined in the SECURE Act
SECURE Act: MEP / PEP Concerns
3.8
3.2
3.1
2.0
1.8
1.2
0.9
0.9
0.7
0.5
Less administrationcontrol
Administrationcomplexity
Existing plancompetitiveness
Limited costefficiencies
Employeesatisfaction
Payroll programmingobstacles
Data security
Regulatorylandscape
Limited investmentchoices
Vendor pool andcapabilities
All respondents< 5,000 participants
5,001 to 50,000 participants
> 50,000 participants
3.9
3.5
2.8
1.8
1.9
1.0
0.8
0.4
1.0
0.8
4.1
3.6
2.5
1.1
1.8
1.3
0.9
0.6
1.0
1.0
2.5
2.0
3.7
4.0
0.8
0.7
0.5
0.5
0.0
0.3
(5=Most concerned. Total ranking is weighted average score.)

41
*https://www.callan.com/blog-archive/dc-plans-cares-survey/
The Coronavirus Aid, Relief, and Economic Security (CARES) Act
Respondents implemented an average of 2.3 CARES provisions
Governmental plans reported the lowest uptake of CARES options
The CARES Act is Federal economic stimulus passed to address the economic tremors stemming from the coronavirus pandemic. The legislation provided multiple forms of financial relief for individuals, including access to retirement savings.
What you need to know
– Access to liberalized loan and distribution availability is limited to certain DC plan participants (“qualified individuals”)
– Certain provisions are optional while others appear to be mandatory
Lmited Access
– Provides access to deferrals while employed by the plan sponsor
– Permits special distributions of up to $100k for qualified individuals
– Waives required minimum distributions due in 2020
Increases Access to DC Plan Monies
Liberalized Loan Options
– Loan maximums were expanded
– Loan repayments and defaults were delayed
Coronavirus-related distributions (CRDs) were the most common provision adopted (73.2%), a 40% increase in adoption relative to Callan’s April 2020 CARES Flash Survey* (52.4%)
Only 42.3% of plans adopted the higher loan maximums; this is a 1.0% increase from the April CARES survey
Only 33.8% of DC plans allowed Required Minimum Distributions (RMDs) to be repaid to the plan, the lowest of any of the CARES Act provisions addressed in this survey

42
DC
Sur
vey
(Thi
rd Q
uart
er 2
020)
All
Res
pond
ents
Cor
pora
teTa
x-Ex
empt
Gov
ernm
ent
Apr
il 20
20C
AR
ES
Flas
h Su
rvey
Although the CARES Act liberalized distribution and loan provisions, it also recognizes that DC plan monies are intended to support retirement needs and thus limits access to these loans and distributions to certain employees impacted by the pandemic.
CARES established coronavirus-related distributions for qualified individuals. Normally employees are not permitted to take withdrawals of their deferrals prior to attaining age 59½ or while employed with the plan sponsor. This limitation was waived for CRDs taken in 2020. The total amount of CRDs an individual takes cannot exceed $100,000 in a taxable year, across plans and employers.
CRDs were also spared the 10% additional tax for early distributions and mandatory withholding. Unless the taxpayer elects otherwise, any amount included in gross income due to a CRD will be spread ratably over a three-year period. Additionally, a qualified individual can repay a CRD as a rollover contribution within three years of taking the distribution.
CRDs were the most common CARES Act provision to be added to DC plans (73.2%) when this survey was conducted in October 2020. This is consistent with the findings from our April CARES survey, when 52.4% of respondents had adopted CRDs.
Coronavirus-Related Distributions
CARES Act: Coronavirus-Related Distributions
73%
79%
57%
63%
52%

43
DC
Sur
vey
(Thi
rd Q
uart
er 2
020)
All
Res
pond
ents
Cor
pora
teTa
x-Ex
empt
Gov
ernm
ent
Apr
il 20
20C
AR
ES
Flas
h Su
rvey
The CARES Act looked to support qualified individuals’ immediate financial needs by increasing the maximum available loan from a DC plan. Pre-CARES, the maximum amount available for a DC plan loan is the lesser of $50,000 or 50% of the vested account balance.
CARES increased the maximum amount available to the lesser of $100,000 or 100% of the vested balance. These loans were available only for qualified individuals between March 27 and September 22, 2020.
Slightly more than half of corporate or tax-exempt respondents indicated that they had increased the maximum available loan amount. This is an approximate 10% increase from our April CARES survey, which did not include governmental DC plans. Nearly 21% of respondents in the 2021 DC Survey sponsor a governmental DC plan, which depressed the overall adoption of rate. Government plans are generally guided by statute and making a complicated change to the loans for a relatively short time period may have had limited appeal. While 63% of governmental plans offered CRDs, only 13% offered increased loan maximums.
Due to the abbreviated period between drafting the bill and the effective date, this provision was difficult for some recordkeepers to administer, as their systems are hard-coded to reject loans above the pre-CARES designated maximums. Some recordkeepers would have required manual intervention for some or all of the time period these loans were available. As always, any administrative tasks that require manual intervention should be audited closely.
Increased Maximum Loan Adoption
CARES Act: Increased Maximum Loan Amount
42%
51%
57%
13%
41%

44
DC
Sur
vey
(Thi
rd Q
uart
er 2
020)
All
Res
pond
ents
Cor
pora
teTa
x-Ex
empt
Gov
ernm
ent
Apr
il 20
20C
AR
ES
Flas
h Su
rvey
The CARES Act looked to limit the impact of the pandemic and fallout by allowing qualified individuals to suspend DC plan loan repayments and prevent loan defaults.
The maximum term for a general purpose loan is five years. If the DC plan permits, the loan term for the purchase of a primary residence could be longer. If a participant misses a loan repayment and does not make up the payment within the cure period,* the remaining loan is deemed distributed from the DC plan. When this happens, the outstanding loan balance is treated as a distribution and is subject to income tax and the 10% early distribution penalty, if applicable, and reported on Form 1099-R.
Under the CARES Act, DC plans could allow qualified plan individuals to suspend DC plan loan repayments any time between March 27 and December 31, 2020. The plan may also extend the loan term by up to one year. Repayments must resume in January 2021 and must be adjusted to reflect the new loan term, plus applicable interest.
Missed loan repayments by participants who are not considered qualified individuals will continue to trigger a default.
The changes to the default process for qualified individuals could be problematic to administer, as plan sponsors and recordkeepers would need to identify and track qualified individuals who took advantage of the suspension. Additionally, the responsible parties will also need to re-amortize those loans, document the variation for audit purposes, update loan procedures, and communicate with employees.
*DC plans may (but are not required to) offer a “cure period”
Loan Repayment Suspension Adoption
CARES Act: Loan Repayment Suspensions
55%
64%
43%
31%
51%

45
DC
Sur
vey
(Thi
rd Q
uart
er 2
020)
All
Res
pond
ents
Cor
pora
teTa
x-Ex
empt
Gov
ernm
ent
The RMD provisions of CARES Act and SECURE Act intersected in 2020.
Before 2020, participants were required to take minimum distributions from their retirement accounts once they had reached age of 70.5. Plans could (but were not required to) delay those distributions until the participant had both terminated service and reached age 70.5.
The SECURE Act, passed in December 2019, increased the age to begin RMD from 70.5 to 72. Because of this, DC plan recordkeepers will need to track and maintain two different rules and calculations based on birth date (i.e., participants born before and after 6/30/1949). The initial RMD has to be taken by April 1 following the year in which the participant becomes eligible.
The CARES Act allowed plan participants to waive the RMD paid in 2020. In a down market, delaying these distributions permits participants to continue to invest and recover from the downturn. Because of the timing behind the passage of the CARES Act and the resulting financial turmoil, some participants were forced to take a distribution on or before April 1 at the low point of the market decline.
In June 2020, the IRS issued guidance allowing participants to repay the RMD paid in 2020 by August 31. This may be the simplest aspect of CARES to implement, as a similar waiver was granted in 2009.
Repay Required Minimum Distributions (RMD) Adoption
CARES Act: Repay Required Minimum Distributions
34%
38%
43%
19%
46
34%
42%
55%
73%
Allow RMDs to berepaid
Expanded loanmaximums
Suspend loanrepayments
Coronavirus-relateddistributions
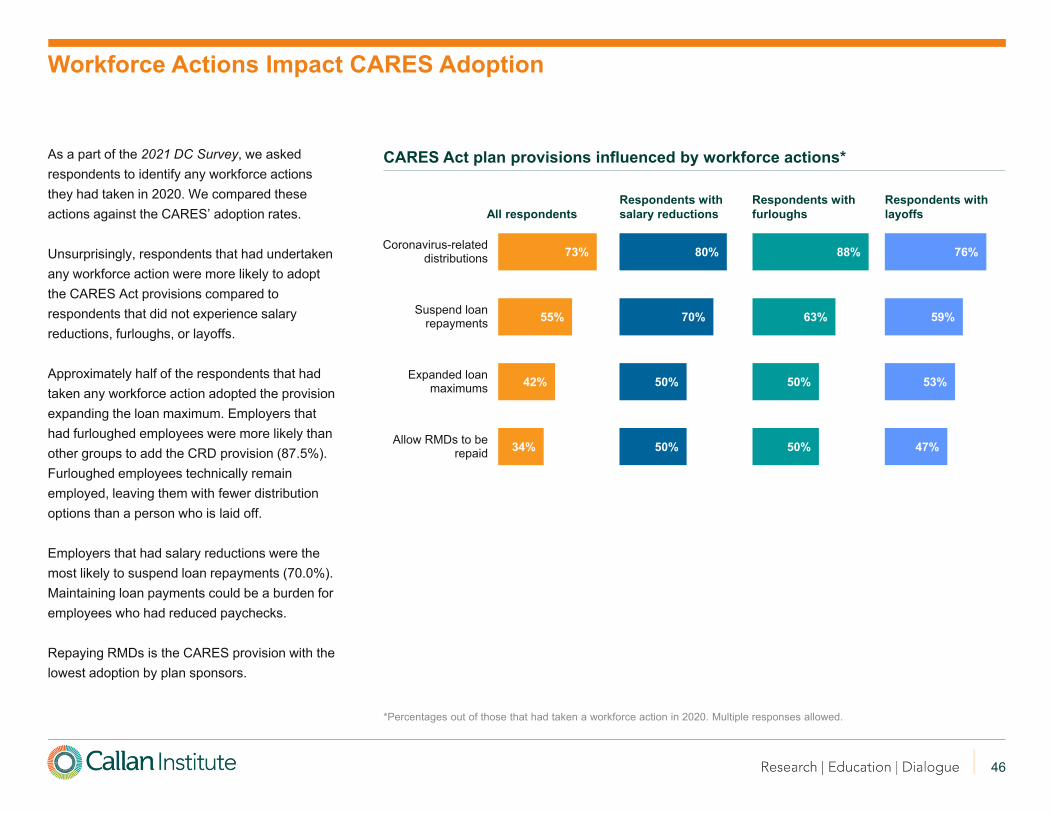
As a part of the 2021 DC Survey, we asked respondents to identify any workforce actions they had taken in 2020. We compared these actions against the CARES’ adoption rates.
Unsurprisingly, respondents that had undertaken any workforce action were more likely to adopt the CARES Act provisions compared to respondents that did not experience salary reductions, furloughs, or layoffs.
Approximately half of the respondents that had taken any workforce action adopted the provision expanding the loan maximum. Employers that had furloughed employees were more likely than other groups to add the CRD provision (87.5%). Furloughed employees technically remain employed, leaving them with fewer distribution options than a person who is laid off.
Employers that had salary reductions were the most likely to suspend loan repayments (70.0%). Maintaining loan payments could be a burden for employees who had reduced paychecks.
Repaying RMDs is the CARES provision with the lowest adoption by plan sponsors.
CARES Act plan provisions influenced by workforce actions*
*Percentages out of those that had taken a workforce action in 2020. Multiple responses allowed.
Workforce Actions Impact CARES Adoption
50%
50%
70%
80%
50%
50%
63%
88%
47%
53%
59%
76%
All respondentsRespondents with salary reductions
Respondents with furloughs
Respondents with layoffs

Key Findings: Financial Wellness
Top reason to offer a financial wellness program
Organizational philosophy to support employees 89%
Retirement savings
Emergency savings
Debt management
14%offer a standalone financial wellness program
36% have plans to develop one
Most common financial wellness benefits:
Life insuranceTuition assistanceCritical illness
Financial wellness is an
umbrella term covering a myriad of
financial concepts that help
employees become financially fit and
able to act intelligently with respect
to their own financial matters in all
stages of life.
50%conducted an internal
employee survey
Top financial needs
9in10respondents indicate they get information on financial wellness benefits from their current service providers
In response to the pandemic, employers prioritized immediate employee financial needs
(scale of 1-10)
Average program effectiveness
6.4 Newer programs reported
the lowest satisfaction
Programs with the highest
ratings were in place 3 to 6 years
See page 53 for details See page 56 for detailsSee page 49 for details
See page 51 for details See page 48 for details
See page 54 for detailsSee page 50 for details

48
96%
89%
87%
83%
82%
72%
70%
64%
63%
62%
60%
48%
46%
39%
35%
30%
29%
28%
28%
4%
3%
11%
4%
5%
13%
6%
9%
10%
4%
11%
4%
7%
11%
14%
4%
14%
8%
21%
10%
5%
25%
11%
26%
25%
38%
22%
6%
11%
9%
7%
7%
14%
26%
11%
25%
17%
25%
48%
17%
44%
30%
35%
29%
39%
67%
Life insurance
Tuition assistance
Critical illness
Retirement savings behavior
Investing support
Budgeting
Discount services
Financial coaching
Health care spending
Debt management
Child care
Auto / home insurance
Identity theft
Elder care
Credit monitoring
Student loan consolidation
Emergency savings
Student loan repayment
Home purchase
Currently offer Planned Considering Not likely to offer
This year’s survey introduces new questions around financial wellness themes and programs.
Financial wellness is an umbrella term covering a myriad of financial concepts that help employees become financially fit and able to act intelligently with respect to their own financial matters in all stages of life. The most common types of benefits tend to be traditional benefit programs where regulatory guidance is available. Life insurance, critical illness (leave or long-term care), and tuition assistance are the most prevalent.
Regarding future planned enhancements, the services with the most traction include identity theft, financial coaching, student loan repayment programs, and student loan consolidation support. These programs were becoming more prevalent prior to the 2020 pandemic and financial shocks. Many respondents are considering whether to offer additional financial wellness services such as emergency savings and credit monitoring support in the future.
Financial wellness program services included
Elements of Financial Wellness

49
14%
60%
26%Standalone financialwellness package
Financial wellness toolsavailable not as aseparate program
Not currently 6%
17%
50%
75%
62%
44%
25%
21%
Government
Tax-Exempt
Corporate
Financial wellness has been a topic of interest for several years, yet most employers do not have a formal standalone financial wellness program. Instead, most respondents provide financial wellness tools in conjunction with other benefits (e.g., retirement or health and welfare benefits). Only 26% do not offer any financial wellness tools.
Corporate plan sponsors are the most likely to offer a standalone financial wellness program (17.0%) and tax-exempt entities are most likely to offer financial wellness tools (75.0%) in conjunction with other benefits. Governmental entities are the least likely to offer a financial wellness program (43.8%).
More than one-third of respondents (36.8%) without a financial wellness program are likely to offer a program in the future.
7 in 10 employers offer financial wellness support.
Financial wellness program availability
If none, plans to create a financial wellness program for employees
21%
16%
16%
47%
Likely, but not on near-term roadmap
Yes, in the next 18 months
No
Don't know
Financial Wellness Prevalence
By organization

50
89%
59%
57%
48%
30%
11%
11%
11%
Organizational philosophy to supportemployees
Increase efficiency of current benefits
Employee morale
Competitive position to recruit talent inyour industry or geography
Lower health care costs related to stress
Address absenteeism and engagementconcerns
Delayed retirement concerns
Employee request
The top reason plan sponsors offer financial wellness support is due to the organizational philosophy to support employees (89.1%).
A greater percentage of corporate plans (90.6%) cited organizational philosophy than governmental employers (75.0%). Government benefit offerings are often tied to statute. These plans are more likely to cite employee morale (62.5%) than corporate plans (56.3%) as a reason to offer financial wellness support.
Reasons for offering financial wellness support to employees*
91%
63%
56%
53%
38%
9%
13%
13%
75%
50%
63%
25%
25%
25%
n/a
13%
*Multiple responses allowed
Rationale for Offering Financial Wellness
All respondents Corporate Government

51
Following these steps can help employers implement financial wellness strategies that meet the needs of their population:
1. Define financial wellness and identify the targeted employee groups (e.g., conduct a survey, solicit feedback).
2. Take inventory of the tools and educational resources already offered by the current service providers (e.g., retirement, health and welfare).
3. Identify providers (e.g., RFP) to support the program, implement services, design a communication campaign introducing the program, and simplify access (e.g., employer’s intranet). After the providers have been identified, the employer should implement new services and consider communicating the existing options to support program needs and identify gaps.
4. Measure success metrics and usage statistics.
5. As a newer benefit, employers should review the plan success metrics to understand what works and what may need to be revisited.
3 in 10 report offering financial or non-financial incentives to participate.
Employee feedback solicitation to gauge financial wellness needs*
*Multiple responses allowed.
Top financial needs identified
Financial Wellness Needs and Objectives
Define
Inventory
Implement
Measure and monitor
Refine
4.1
2.5
2.1
1.8
1.7
1.5
1.0
0.6
0.1
Retirement savings
Emergency savings
Debt management
Budgeting
Investing behaviors
Health care spending
Student loans
Child care
Credit monitoring
50%46%
21% 21%28%
Internal survey Individual feedback Focus group No Don't know
(5=Most important. Total ranking is weighted average score.)
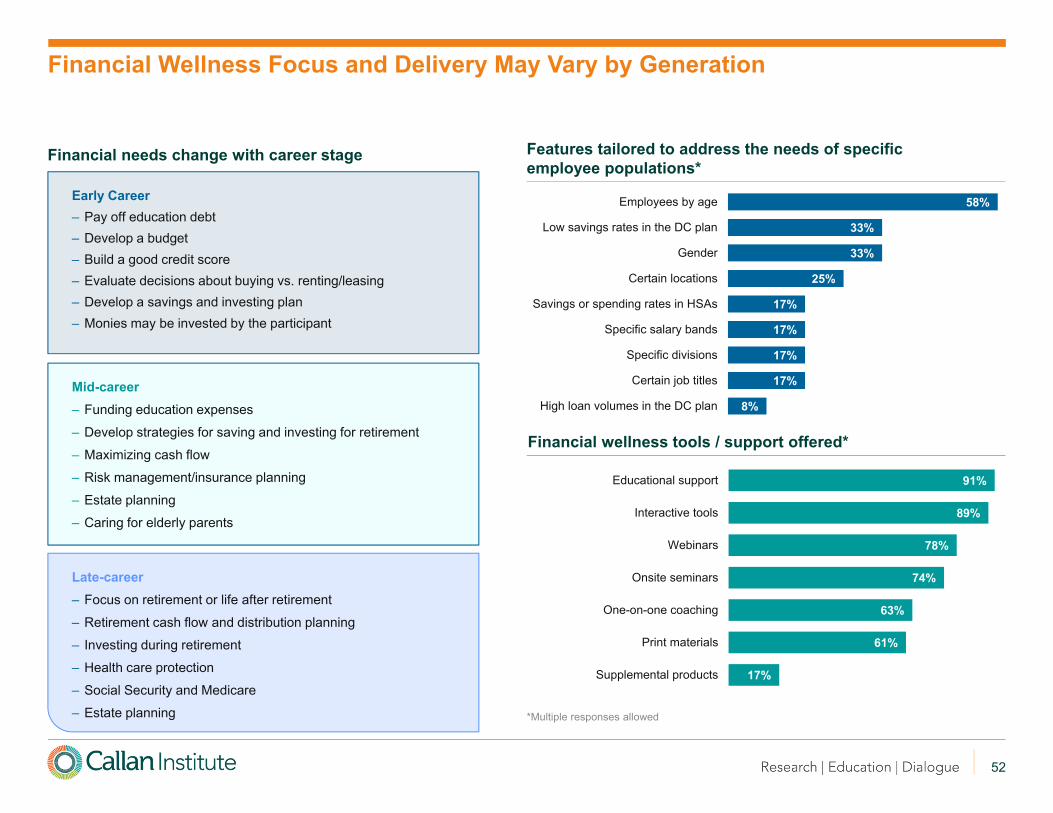
52
8%
17%
17%
17%
17%
25%
33%
33%
58%
High loan volumes in the DC plan
Certain job titles
Specific divisions
Specific salary bands
Savings or spending rates in HSAs
Certain locations
Gender
Low savings rates in the DC plan
Employees by age
Features tailored to address the needs of specific employee populations*
Financial wellness tools / support offered*
91%
89%
78%
74%
63%
61%
17%
Educational support
Interactive tools
Webinars
Onsite seminars
One-on-one coaching
Print materials
Supplemental products
*Multiple responses allowed
Financial Wellness Focus and Delivery May Vary by Generation
Early Career– Pay off education debt – Develop a budget – Build a good credit score– Evaluate decisions about buying vs. renting/leasing– Develop a savings and investing plan– Monies may be invested by the participant
Mid-career – Funding education expenses– Develop strategies for saving and investing for retirement– Maximizing cash flow– Risk management/insurance planning– Estate planning– Caring for elderly parents
Late-career – Focus on retirement or life after retirement– Retirement cash flow and distribution planning– Investing during retirement– Health care protection– Social Security and Medicare– Estate planning
Financial needs change with career stage

53
63%
35%
31%
8%
4%
2%
Benefits group
Human resources staff
Total rewards/benefits staff
Governance committee
Board
Compensation group
The responsibility for designing and monitoring the financial wellness program most often falls within the staff’s purview. Unlike most DC plans (and certain health and welfare plans), financial wellness generally does not fall under ERISA and is not tied to specific fiduciary responsibilities. This can pose difficulties in monitoring and supporting these benefits.
While the two programs (DC and financial wellness) may interact, they are monitored by separate bodies, which can lead to efficiency gaps. DC plan fiduciaries may require regular reporting on the financial wellness program in conjunction with their ongoing monitoring to ensure both programs are operating optimally.
9 in 10 respondents indicate they get information on financial wellness benefits from their current service providers (e.g., retirement or health and welfare). This may create a blind spot, as the providers are most familiar with their own offering and the efficacy of their programs. Many survey respondents supplement the information provided by their current service providers with information from industry publications, consultants, advisers, and other sources.
Responsibility for designing and monitoring the financial wellness program*
Financial wellness benefits information providers*
93%
48%
41%
39%
39%
30%
25%
14%
14%
Current service providers
Industry publications
Consultant / adviser
Employer roundtables
Employee request / feedback
Surveys
Potential service providers
Legal counsel
Review of competitors
*Multiple responses allowed.
Financial Wellness: Employer Education

54
4.4
2.6
2.0
1.6
1.3
1.3
1.1
0.5
0.4
0.2
Usage
Participant feedback or surveys
Increased engagement
Impact on DC plan savings behaviors
Ease of administration
Cost
Return on investment
Ease of implementation
Impact on HSA plans
Reduction in absenteeism
6.45.7
8.06.4
Any TimePeriod
< 3 years 3 – 6 years > 6 years
Survey respondents report maintaining a formal financial wellness program for 6 years, on average (median 5 years). They ranked program effectiveness (formal or informal program) at 6.4, on average, on a scale of 1 to 10 (10 = highest). or a median score of 7. Newer programs reported the lowest average effectiveness rate (5.7) while the most mature programs deemed their programs slightly more effective (6.4). The programs that had the highest ratings were those that had been in place between 3 and 6 years, suggesting that programs that have been designed more recently with sufficient time to implement and socialize the programs are the most effective.
Respondents prioritize usage, participant feedback or surveys, and increased engagement to measure financial wellness program success. With the exception of participant feedback, the elements being measured vary based on the self-assessed effectiveness rating. Those that rated their program as highly effective (i.e., 7 or greater “Effectiveness Score”) relied on metrics specific to the financial wellness program. Highly rated programs focus on usage (+0.2) and return on investment (+0.4) to measure success, compared to those who rated their program less effective (i.e., less than 7) where there was an outsized focus on cost (+0.8) and impact on DC savings behaviors (+0.6).
Average reported program effectiveness
Top criteria to gauge success of financial wellness program
4%
25%
4%68%
Monthly
Quarterly
Semi-annually
Annually
Success measurement frequency
Financial Wellness Effectiveness
4.2
2.6
2.3
2.1
1.4
1.7
0.9
0.8
0.5
0.4
4.4
2.6
1.9
1.5
1.2
0.9
1.3
0.3
0.3
0.1
Years the program has been in place
< 7 Effectiveness Score
≥ 7 Effectiveness Score
Average All Responses
(5=Most important. Total ranking is weighted average score.)

55
58%
45%
26%
23%
13%
10%
Limited program engagement
Strained internal resources
Data privacy
Lack of clear direction
Lack of employee need
Lack of appropriate expertise
Limited program engagement and strained internal resources are the chief concerns cited by survey respondents around offering financial wellness support for employees. Any additional employee benefits demand attention and resources from both employees and employers.
Most programs do not generate additional fees, either for the employer or employee; many of these programs are supported in part or in full by existing vendors. Employees who utilize programs that are supported by a retirement plan vendor may be engaging these benefits for individuals that are not plan participants.
For financial wellness programs with separate fees, 7 in 10 employers pay those fees.
Concerns around offering financial wellness support*
Additional costs for financial wellness program*
14% 3% 14%
76%
Yes, program-level fee, does not vary based on number of active users
Yes, fees based on number of active users
Yes, fees based on eligible population
No, separate feesdo not apply
*Multiple responses allowed
Financial Wellness Concerns

56
69%
51%
35%
33%
33%
31%
14%
Supporting immediate employee financial needs
Increased employee communications
Modifying how financial education / counseling /planning takes place
Review of participant investment behaviors
Reviewing cyber and information security protocols inlight of increased work-from-home arrangements
Concern around retirement readiness
Cost cutting / management design changes
In response to the massive disruptions to multiple facets of daily life wrought by COVID-19, employers prioritized supporting immediate employee financial needs and increased employee communications. These priorities were consistent from both DC plan and financial wellness program perspectives.
DC plans also indicated a greater focus on participant investment behaviors and concern around retirement readiness, as employees have been forced to react in uncertain circumstances.
DC plan priority changes due to the coronavirus pandemic*
Financial wellness priority changes in response to the coronavirus pandemic*
64%
64%
39%
25%
11%
Supporting immediate employee financial needs
Increased employee communications
Increased program awareness from employees
Increased program awareness frommanagement / governance
Increased focus on emergency savings
*Multiple responses allowed.
Immediate Impact of COVID-19 Pandemic

Key Findings: Health Savings Accounts
Savings rates were monitored in
35% of HSAsand 90% of DC plans
A Health Savings Account is a special-purpose account owned
by an individual employee.
Contributions are made on a pre-tax
basis. Any withdrawals for medical
expenses are tax-free and non-
medical withdrawals after age 65 are
taxed as regular income.
The benefits committee has oversight over the HSA program
6 in1022%
Bundle HSA and DC services
HSAs are tax-advantaged
at the time of deferral and distribution
Participationand Cost tied for top concerns
53%Prevalence of HSAs for those with a DC
plan only
58%19%
with an open DB plan44%
with a closed DB plan
See page 59 for details
65%offer an HSA
See page 59 for details See page 63 for details See page 63 for details
See page 58 for details
See page 61 for details See page 60 for detailsSee page 61 for details
Only 17% of sponsors select the HSA provider and take on the additional responsibility of selecting and monitoring underlying investments
10% offer a DC plan investment menu mirror in the HSA6% are planning to offer an investment menu mirror

58
This year’s survey introduces a review of Health Savings Accounts (HSAs). An HSA is a special-purpose account owned by an individual employee (unlike a DC plan, where the account is part of a trust or custodial account).
Types of Health Spending Accounts
Health Savings Accounts
Health Savings Account (HSA)– Supports both spending and saving– Only available in conjunction with a High Deductible Health Plan (HDHP) – Owned by the employee and portable following termination of employment– Amounts roll over to following year– May include employee and employer contributions– Monies may be invested by the participant
Health Reimbursement Account (HRA)– Supports spending and may offer an opportunity to save– Owned by employer; if the employee leaves service with the employer, the remaining balance
may be forfeited or the employee may be allowed to spend down the balance– Amounts may be permitted to roll over to following year– Usually no opportunity to earn interest– Not limited to HDHPs– HRA is funded solely by the employer
Flexible Spending Account (FSA)– Owned by the employer, not portable following termination of employment – Not limited to HDHP/CDHP – Monies that are not used by the deadline are forfeited– Depending on plan rules, users may carry over up to $500 OR use a 2.5-month grace period into
the next calendar year
HSAs are considered the most tax-favored savings option because:
1. Contributions to the HSA are tax-deductible.
2. Employee contributions to an HSA via a Section 125 salary reduction arrangement are not subject to FICA.
3. Investment growth and interest are tax-exempt.
4. Withdrawals avoid taxes if they are spent on qualified medical expenditures. If the monies are used for other purposes, the account holder will incur income taxes and, if under age 65, an additional 20% penalty.

59
65%
26%
52%
22%
0%
10%
20%
30%
40%
50%
60%
70%
All respondents < 5,000 participants
5,001 to 50,000 participants
> 50,000 participants
Most DC plan sponsors offer an HSA arrangement.
Reflecting the shared responsibility benefit trend, we note that employers with a DC plan only are the most likely to offer an HSA (58%). That number decreases for employers with a closed DB plan (44%). In contrast, the prevalence of HSAs drops to 19% for respondents with an open DB plan.
HSA availability
HSA Trends
“Shared Responsibility” Model
Employees share in benefit costs and take responsibility for understanding and planning for their current and future needs, including retirement (e.g., DC plans instead of DB plans) and health care.

60
Understanding HSAs in the context of ERISA is vital. HSAs are generally not subject to ERISA, contingent on the employer’s limited involvement with the HSA product. Should the HSA become subject to ERISA, the employer would have to maintain a plan document and summary plan description, and file a Form 5500 with the Department of Labor annually, as well as being subject to the range of ERISA fiduciary responsibilities.
DOL guidance indicates that employers can select an HSA provider, without becoming subject to ERISA, so long as employees have a "reasonable choice" of investment options based on the relevant circumstances.
Outsourcing investment selection for HSA programs is an underutilized option for employers seeking to limit exposure to ERISA, while also providing meaningful access to a curated menu of investments that meet the needs of an HSA holder. It is noteworthy that the parallel savings and spending objectives in an HSA may require other investment options that may not be appropriate for the long-term investment horizon in a DC plan.
Utilizing a OCIO model would allow plan sponsors to delegate investment decisions to an independent third-party, with the intent of offering best-in-class funds for HSA programs, while limiting the ERISA exposure.
HSA and ERISA and OCIO
Statistics based on subset of respondents that identified a governance structure.
HSA monitoring in governance structure
In order to limit ERISA exposure, the employer cannot:
– Make or influence HSA investment decisions.
– Make participation involuntary (i.e., no employee funded automatic enrollment).
– Limit employees' ability to move funds to another HSA or take a distribution.
– Represent the program as a “welfare benefit program.”
– Receive compensation from the HSA arrangement (e.g., revenue sharing).
Only 17% of sponsors select the HSA provider and take on the additional responsibility to select and monitor underlying investments.
59%
35%
21%3%
22%
0%
10%
20%
30%
40%
50%
60%
70%
Benefits committee
Health and welfare committee or subcommittee
Total rewards committee
Compensation committee
Unsure

61
10%6%
80%
4%0%
10%
20%
30%
40%
50%
60%
70%
80%
90%
Yes, a DC mirror is in place
No, but planned future enhancement
No, not considering Unsure
Often, the DC plan and HSA fall under different governance models, which may account for the limited bundling of DC providers. Further, a significant minority report they mirror the DC plan investments in the HSA program and fewer are planning on moving to an investment mirror.
8 in 10 plans are not considering a DC plan mirror for the HSA. This may be in part due to limited overlap in governance models between the two benefit types, as well as a reluctance to trigger ERISA by making active investment menu decisions.
Only 22% of respondents use a solution that bundles DC and HSA services.
Investment structure mirrors DC plan investment lineup
HSA Investment Options
Explainer: The majority of recordkeepers do not administer HSA programs directly. The HSA products are structured as distinct accounts per user, compared to the omnibus trust solution utilized by DC plans.
Some DC plan recordkeepers partner with an external HSA provider or offer these services internally. It is not uncommon in these arrangements to see a majority of investment options available for HSA holders limited to those offered by the recordkeeper.

62
41%
14% 14%
32%
0%
10%
20%
30%
40%
50%
60%
< 50% 50% – 75% >75% Don't know
HSA reporting can be more difficult to obtain than DC plan reporting, due in part to differences in governance structures and vendor limitations. HSAs are individual accounts, thus deferrals and spending patterns are not tracked in an omnibus account. Accordingly, nearly one-third of survey respondents are not sure of the HSA plan statistics.
For employers that do track HSA statistics, we note lower utilization (participation and contributing to the maximum), which are driven in part by the lack of automated solutions available for HSA programs. Further, many plan participants do not know much about these relatively new products. While FSAs have been in place since 1978, HSAs have only been widely available since 2004 and are not offered by all employers.
Notably, HSA participants can invest the balances in their accounts. Initial deferrals are generally invested in a low-interest bank account until a discretionary account limit has been met. After meeting the account minimum, participants can make investment allocation elections. HSA account balances can be spent in the current year or saved; thus, HSA investment time horizons vary more than those in DC plans.
Percentage of eligible workforce participating in an HSA
Percentage of eligible workforce who take action to invest the funds in their HSA
92%
4% 4%0%
10%
20%
30%
40%
50%
60%
70%
80%
90%
100%
< 50% 50% – 75% >75%
95%
5%0%
10%
20%
30%
40%
50%
60%
70%
80%
90%
100%
< 50% 50% – 75%
Percentage of eligible workforce contributing maximum to an HSA
HSA Utilization
Percent of workforce
Percent of workforce
Percent of workforce

63
53%
53%
43%
35%
35%
28%
18%
Participation
Cost
Ease of administration
Savings rates
Usage
Fiduciary and governance
Satisfying ERISA requirements
Survey respondents with HSA programs indicate they monitor an average of 2.6 elements related to the program. Top concerns for HSA programs include participation and cost (52.5% for both).
By comparison, survey respondents report monitoring 4.7 elements, on average, within their DC plans. Participation (95.8%) was the element most used to measure the success of the DC plan. Savings rates were monitored in 90.3% of DC plans, compared to 35.0% in HSAs.
Top concerns with the HSA program*
*Multiple responses allowed.
Monitoring HSA Programs

About the Survey Contributors

65
Defined Contribution Consulting
Jamie McAllister Jana Steele(Primary author of 2021 DC Survey)
Ben Taylor Greg Ungerman, CFA James Veneruso, CFA, FRM, CAIA
Patrick Wisdom
Callan’s DC Consulting Team complements our investment consultants, providing specialty research and expertise around plan trends, aspects of compliance and administration, behavioral aspects of structure design specific to DC plans, and vendor and fee management. We have a strongly tenured team that works with a wide variety of plan sponsors and recordkeepers, which provides valuable context and expertise to our clients.
1997 DC team formalized at Callan to serve as a dedicated, specialized resource
15+ Years of average industry experience
65 DC projects in 2020 (i.e., investment structure or target date suitability studies, vendor search and fee studies)
42 Email “Insights” and blog posts in 2020 focused on litigation, legislation, and regulation
5 Organizations we serve in leadership or committees (DCIIA, EBRI, NAGDCA, PRRL, SPARK DSOB)

66
Disclosure
© 2021 Callan LLC
Certain information herein has been compiled by Callan and is based on information provided by a variety of sources believed to be reliable for which Callan has not necessarily verified the accuracy or completeness of this publication. This report is for informational purposes only and should not be construed as legal or tax advice on any matter. Any investment decision you make on the basis of this report is your sole responsibility. You should consult with legal and tax advisers before applying any of this information to your particular situation. Reference in this report to any product, service or entity should not be construed as a recommendation, approval, affiliation or endorsement of such product, service or entity by Callan. Past performance is no guarantee of future results. This report may consist of statements of opinion, which are made as of the date they are expressed and are not statements of fact. Reference to or inclusion in this report of any product, service or entity should not be construed as a recommendation, approval, affiliation or endorsement of such product, service or entity by Callan.
Callan is, and will be, the sole owner and copyright holder of all material prepared or developed by Callan. No party has the right to reproduce, revise, resell, disseminate externally, disseminate to subsidiaries or parents, or post on internal websites any part of any material prepared or developed by Callan without permission. Callan’s clients only have the right to utilize such material internally in their business.

About Callan
Callan was founded as an employee-owned investment consulting firm in 1973. Ever since, we have empowered institu-
tional clients with creative, customized investment solutions that are backed by proprietary research, exclusive data, and
ongoing education. Today, Callan advises on more than $2 trillion in total fund sponsor assets, which makes it among
the largest independently owned investment consulting firms in the U.S. Callan uses a client-focused consulting model
to serve pension and defined contribution plan sponsors, endowments, foundations, independent investment advisors, in-
vestment managers, and other asset owners. Callan has six offices throughout the U.S. For more information, please visit
www.callan.com.
About the Callan Institute
The Callan Institute, established in 1980, is a source of continuing education for those in the institutional investment
community. The Institute conducts conferences and workshops and provides published research, surveys and news-
letters. The Institute strives to present the most timely and relevant research and education available so our clients
and our associates stay abreast of important trends in the investments industry.
For more information about this report, please contact:
Your Callan consultant or Jana Steele at [email protected]

Corporate Headquarters
600 Montgomery StreetSuite 800San Francisco, CA 94111800.227.3288415.974.5060
www.callan.com
Regional Offices
Atlanta800.522.9782
Chicago800.999.3536
Denver855.864.3377
New Jersey800.274.5878
@CallanLLC Callan
Portland800.227.3288


![GOVERNMENTAL DEFINED CONTRIBUTION … DEFINED CONTRIBUTION VOLUME SUBMITTER PLAN AND TRUST BASIC PLAN DOCUMENT [DC-BPD #05] © Copyright 2014 Governmental Defined Contribution Basic](https://img.dokumen.tips/doc/110x75/5b0419f67f8b9a4e538d36ff/governmental-defined-contribution-defined-contribution-volume-submitter-plan.jpg)