Embed Size (px)
Citation preview

1 | P a g e
2021-2024 STRONG WORKFORCE PROGRAM Orange County Regional Plan

2 | P a g e
Table of Contents Executive Summary ............................................................................................... 4
Los Angeles|Orange County Regional Consortium ............................................... 6
LA|OC Landscape ................................................................................................ 6
Governance Structure ......................................................................................... 6
Orange County Demographic Overview................................................................ 8
OC Regional Planning Process for 2021-2024 ...................................................... 10
Regional Priorities for 2020 in Response to COVID-19 ...................................... 13
WDB Alignment ................................................................................................... 14
Regional Assets and Investments........................................................................ 16
Noncredit Programs .......................................................................................... 20
Summary of Regional SWP Projects .................................................................... 23
SWP Sustained Projects .................................................................................... 23
2019-20 SWP Funding Allocations .................................................................... 25
K12 Strong Workforce Program Investments and Collaboration ........................ 29
K12 SWP Funding Summary .............................................................................. 29
OC Pathways ..................................................................................................... 30
Regional Economic Overview and COVID-19 Impacts ........................................ 31
OC Economic Recovery Strategy Mission Statement ............................................ 31
COVID-19 Pandemic Impacts on Orange County ............................................... 31
OC Economic Recovery Strategy Purpose ............................................................ 31
Economy and Employment ............................................................................... 31
Orange County’s Resilient Jobs ......................................................................... 33
Business Survey Analysis Summary ................................................................... 34
OC Strong Analysis Summary ............................................................................ 36
Data Analysis Informing the 2021-2024 Orange County Regional Plan .............. 37
CCCCO Priority Sectors Analysis ........................................................................ 37

3 | P a g e
Orange County Sector Analysis Project Findings ............................................... 38
SWP Regional Outcomes ..................................................................................... 47
Program Requests ............................................................................................. 47
SWP Launchboard Metrics ................................................................................ 48
Strategic Recommendations through 2024 ......................................................... 49
Overview and Initial Findings ............................................................................ 49
Orange County Sector Analysis Recommendations ........................................... 51
Conclusion/SWP Lessons Learned ....................................................................... 55
Accomplishments, Challenges & Lessons Learned ............................................ 55
Ongoing Priorities ............................................................................................. 56
Appendix A: K12 SWP Project Investments ........................................................ 57
Appendix B: Colleges with Programs Related to the 12 CCCCO Sectors ............. 58
Appendix C: Annual Openings and Wages for Top Priority Sector Middle-skill Occupations......................................................................................................... 60
Appendix D: LaunchBoard Metrics for Orange County’s Priority Sectors ........... 64

4 | P a g e
Executive Summary The 2021-2024 Orange County Strong Workforce Program (SWP) Plan was developed through a collaborative process involving Orange County’s nine community colleges and stand-alone continuing education (noncredit) center, workforce development boards, industry stakeholders, and representatives from organizations invested in improving and aligning career education (CE) in the region. The following report describes the work underway to calibrate community college efforts for the next four years to meet workforce demand fueling the regional economy, while strengthening pathways between postsecondary institutions and K-12 education. The SWP planning process and outcomes summarized in this report have been based on the premise that deploying targeted, localized strategies to prepare the area’s workforce can be advanced through a strong network of training, education, workforce, and community partners. Ultimately, this work contributes to helping students enter high-demand jobs that pay solid wages and that strengthen a competitive and growing regional economy. In addition to the state’s legislative mandate, there were many considerations in developing the plan. This included growing concern about permanent job loss and business closures stemming from the COVID-19 pandemic and what will be needed to support and propel the region’s economic recovery. The California Community Colleges Chancellor’s Office also has urged community colleges to offer more noncredit and not-for-credit credentials that can be completed in 4-12 weeks by displaced workers in need of marketable skills. Indeed, in 2020 the California State Legislature embedded such encouragement in Section 88821(g) of the California Education Code. In addition, regional planning takes into account the state’s goal to produce one million more industry-valued credentials over the next decade. All of these factors contribute to a large and growing need to reskill and upskill displaced workers and to lead existing and future community college students into career pathways that are either stable or growing over the next four years. Taken together, the strategies stemming from these considerations can help the region recover, rebuild, and renew as we work toward a post-pandemic economy. In accordance with California Education Code Section 88823, the primary purpose of this four-year plan is to inform the development of strategies related to CE and workforce development courses, programs, and pathways in Orange County. The plan was developed in collaboration with education and workforce stakeholders described in Sections 88821, 88823, 88825, and 88831. This plan is intended to inform strategies for the four-year period of 2021-2024, with annual updates provided each January. Beginning in 2019, regional stakeholders engaged in a planning process described herein. The following plan is organized by major topic, beginning with a demographic overview and ending with a labor market analysis informing the 2021-2024 plan. The plan ends with a discussion of the strategic recommendations for 2021-2024.
5 | P a g e
Extensive data analysis has informed the Orange County planning process, including the Orange County Economic Recovery Strategy (OCERS) and the Orange County Sector Analysis Project. Additional economic and labor market analysis contributing to the priority strategies and recommendations incorporated in this document included the Orange County Center of Excellence’s Resilient Jobs report and the OC Strong project conducted by Kleinhenz Economics. The OC COE Resilient Jobs report recommends focusing on the seven identified recession- and pandemic-resilient middle-skill occupations which can be addressed by the region’s credit and noncredit CE programs. Initial findings from the OC Strong project indicate Orange County is well positioned to exit the current economic downturn with solid (2-3%) job growth, and the county is likely to experience faster growth than adjacent regions. Findings from the Orange County Sector Analysis Project, and initial findings from the OCERS report and OC Strong economic forecast, validate the 2017 selection of the eight priority sectors. The findings not only confirm the decision made in choosing the eight priority sectors, but, through regional investments, also highlight many positive outcomes that have been achieved. The Orange County planning process concluded in November 2020 with the reaffirmation of the priority sectors selected in 2017 and the adoption of the same regional priorities for 2021-2024. These were approved by the voting members comprising the Orange County Sub-Regional Council. Orange County Priority Sectors, 2021-2024:
• Advanced Manufacturing • Advanced Transportation & Logistics • Business & Entrepreneurship • Energy, Construction & Utilities • Health • Information & Communication Technologies (ICT)/Digital Media • Life Sciences/Biotech • Retail, Hospitality & Tourism

6 | P a g e
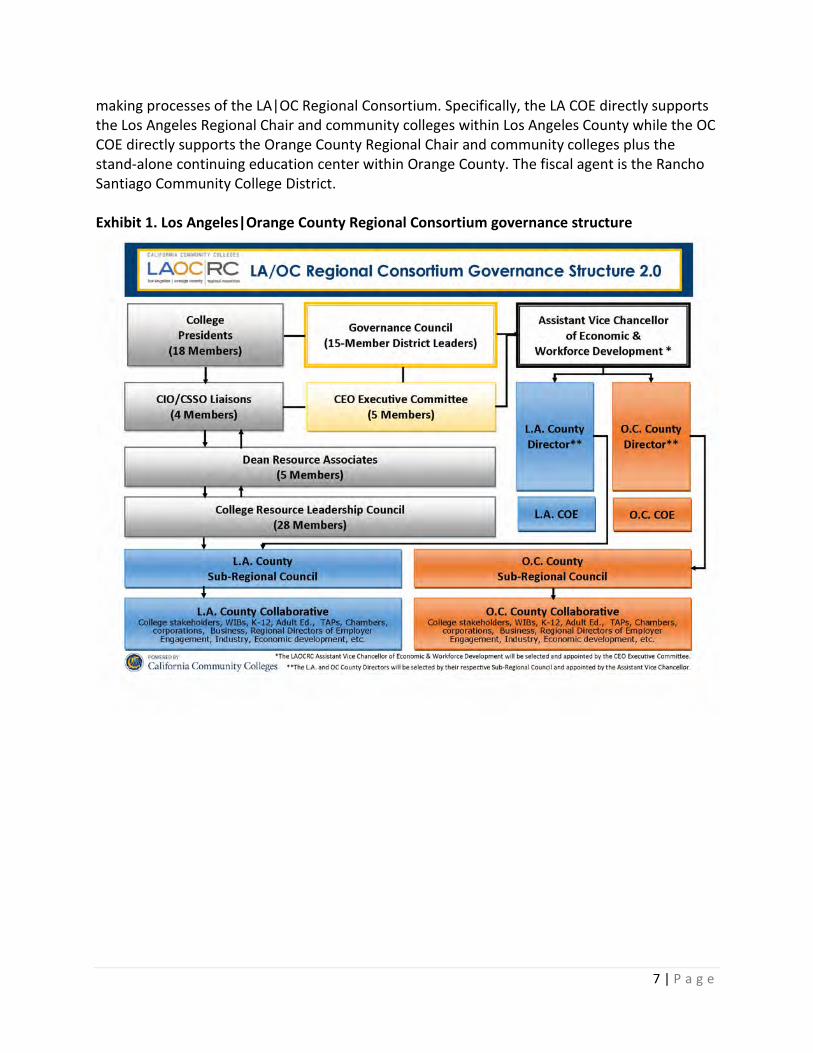
Los Angeles|Orange County Regional Consortium LA|OC Landscape The LA|OC Regional Consortium serves the largest and most diverse SWP macroregion population in the state, spanning Los Angeles and Orange counties, and encompassing 28 community colleges, one stand-alone continuing education (noncredit) center, 10 workforce development boards, and a population of roughly 13.6 million residents. Altogether, the LAOCRC member colleges serve 848,490 students, which is more than one-third of the students in the California Community College system. More importantly, the colleges serve one-third of economically disadvantaged students across all programs in California and one-third of the under-resourced students in career education (CE), meaning that Strong Workforce Program investments are supporting some of the most financially needy students in the state. Governance Structure The Los Angeles|Orange County Regional Consortium (LAOCRC) is overseen by a 15-member Governance Council of district leaders and is guided by a five-member CEO Executive Committee (Exhibit 1). The Governance Council is convened in quarterly business meetings to help guide the region's CE goals and codify decisions on SWP investments. The work of the Governance Council is supported by several subgroups: an 18-member College President Committee, a four-member Chief Instructional Officer/Chief Student Services Officer (CIO/CSSO) Liaisons Committee, a 28-member College Resource Leadership Council comprised of voting members from community colleges in Orange County and Los Angeles County, and a five-member Dean Resource Associates Committee elected from the College Resource Leadership Council. LAOCRC convenes the region in monthly meetings, with the exception of July and August, to facilitate business meetings for College Resource Leadership Council members to take action on new CE programs and discuss other business items. LAOCRC is headed by the Consortium’s Executive Director/Assistant Vice Chancellor of Economic and Workforce Development, who supervises the Los Angeles County Regional Director and Orange County Regional Director, also called Regional Chairs. Each Regional Chair facilitates a subregional council that is informed by a county collaborative comprising college stakeholders and representatives from workforce development boards, K-12 districts and ROPs, adult education, technical assistance providers (TAPs), chambers of commerce, industry and businesses, and Regional Directors for Employer Engagement (formerly known as Deputy Sector Navigators). The Los Angeles/Orange County Center of Excellence for Labor Market Research (LA COE) and the Orange County Center of Excellence for Labor Market Research (OC COE) provide labor market information and analysis to inform the decision-
7 | P a g e
making processes of the LA|OC Regional Consortium. Specifically, the LA COE directly supports the Los Angeles Regional Chair and community colleges within Los Angeles County while the OC COE directly supports the Orange County Regional Chair and community colleges plus the stand-alone continuing education center within Orange County. The fiscal agent is the Rancho Santiago Community College District. Exhibit 1. Los Angeles|Orange County Regional Consortium governance structure
8 | P a g e
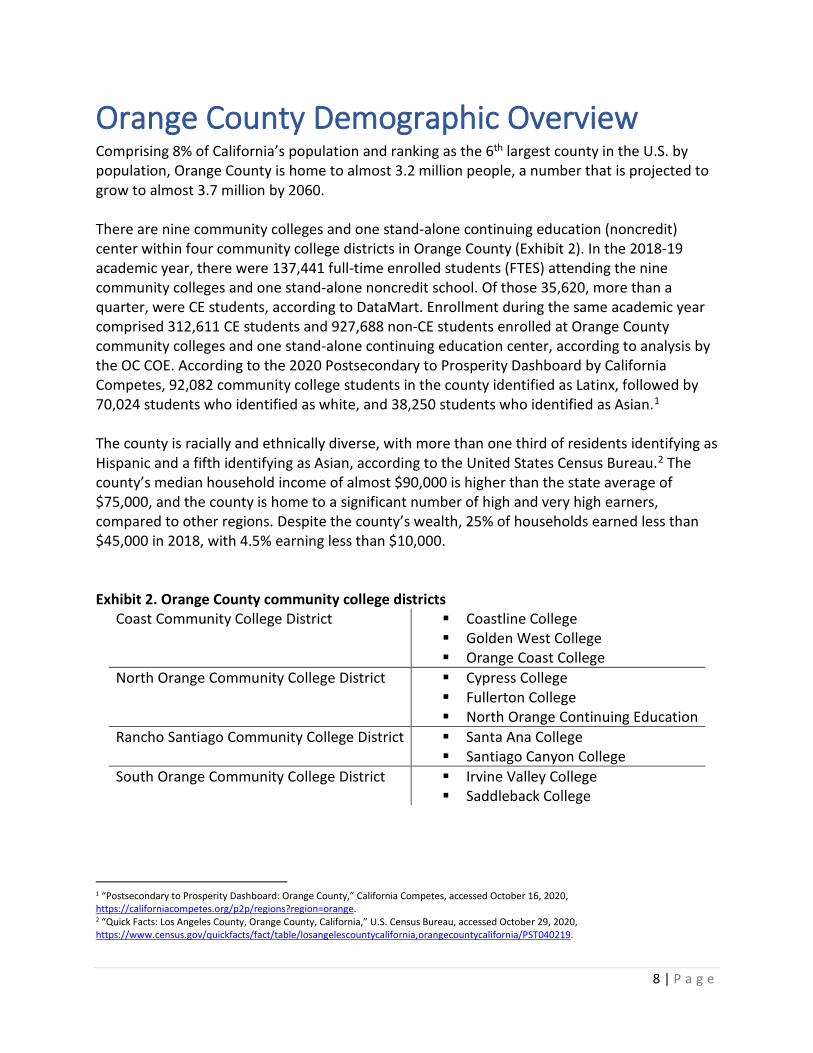
Orange County Demographic Overview Comprising 8% of California’s population and ranking as the 6th largest county in the U.S. by population, Orange County is home to almost 3.2 million people, a number that is projected to grow to almost 3.7 million by 2060. There are nine community colleges and one stand-alone continuing education (noncredit) center within four community college districts in Orange County (Exhibit 2). In the 2018-19 academic year, there were 137,441 full-time enrolled students (FTES) attending the nine community colleges and one stand-alone noncredit school. Of those 35,620, more than a quarter, were CE students, according to DataMart. Enrollment during the same academic year comprised 312,611 CE students and 927,688 non-CE students enrolled at Orange County community colleges and one stand-alone continuing education center, according to analysis by the OC COE. According to the 2020 Postsecondary to Prosperity Dashboard by California Competes, 92,082 community college students in the county identified as Latinx, followed by 70,024 students who identified as white, and 38,250 students who identified as Asian.1 The county is racially and ethnically diverse, with more than one third of residents identifying as Hispanic and a fifth identifying as Asian, according to the United States Census Bureau.2 The county’s median household income of almost $90,000 is higher than the state average of $75,000, and the county is home to a significant number of high and very high earners, compared to other regions. Despite the county’s wealth, 25% of households earned less than $45,000 in 2018, with 4.5% earning less than $10,000. Exhibit 2. Orange County community college districts
Coast Community College District Coastline College Golden West College Orange Coast College
North Orange Community College District Cypress College Fullerton College North Orange Continuing Education
Rancho Santiago Community College District Santa Ana College Santiago Canyon College
South Orange Community College District Irvine Valley College Saddleback College
1 “Postsecondary to Prosperity Dashboard: Orange County,” California Competes, accessed October 16, 2020, https://californiacompetes.org/p2p/regions?region=orange. 2 “Quick Facts: Los Angeles County, Orange County, California,” U.S. Census Bureau, accessed October 29, 2020, https://www.census.gov/quickfacts/fact/table/losangelescountycalifornia,orangecountycalifornia/PST040219.

9 | P a g e
According to the Postsecondary to Prosperity Dashboard, high school graduation rates and college attendance rates in the county surpass the state average, and the county is relatively well educated, with 41% of adults over age 25 holding a bachelor’s degree, compared to roughly 24% statewide. However, educational attainment varies across racial and ethnic groups, with Latinx residents faring less favourably. A majority (59%) of Latinx residents have no college experience, compared with 16% of Asian residents and 17% of white residents. As of October 2020, California’s unemployment rate was 10.8% while Orange County’s was 9%, according to the California Employment Development Department. In Orange County, 70% of residents earn a living wage, surpassing the state average of 64%. Disparities exist in who earns a living wage, though, with 49% of Latinx residents earning a living wage compared to 62% of Asian residents and 70% of white residents. These disparities highlight a need to provide robust CE experiences and access to advanced programs for residents from all racial/ethnic groups and across the income spectrum. The living wage in Orange County is $17.36/hour for a single adult.3 The California Family Needs Calculator shows that an individual would need to earn $3,055 a month in order to cover cost-of-living expenses in the county, with about half of monthly earnings spent on housing, $1,493/month.4 As of July 2020, there were roughly 1.5 million jobs in the county, with employment greatest in Professional and Business Services; Trade, Transportation, and Utilities; Education and Health Services; and Leisure and Hospitality, according to the Labor Market Information Division of the California Employment Development Department.5 The county is also recognized nationally for several high-tech industry clusters, including medical device manufacturing, aerospace, apparel manufacturing, and biopharmaceuticals.
3 The term “living wage” in Center of Excellence reports is the self-sufficiency wage for a single adult from the Insight Center’s California Family Needs Calculator per county: https://insightcced.org/tools-metrics/self-sufficiency-standard-tool-for-california/. 4 “Family Needs Calculator: Orange County,” Insight Center for Community Economic Development, 2020, accessed October 13, 2020, https://insightcced.org/2018-family-needs-calculator/. 5 “Anaheim-Santa Ana-Irvine Metropolitan Division (Orange County), Nonfarm Jobs up 30,100 over the Month,” Employment Development Department, press release, October 16, 2020, accessed October 29, 2020, https://www.labormarketinfo.edd.ca.gov/file/lfmonth/oran$pds.pdf.
10 | P a g e
OC Regional Planning Process for 2021-2024 SWP legislation mandates that the community college regional consortia in the state conduct stakeholder engagement to align strategies and identify priority projects that are informed by labor market analysis. Orange County’s planning process has been driven by continuous engagement over the last four years with constant attention being directed toward the region’s performance in attaining goals related to its priority sectors. In addition to community college faculty and deans, representatives from workforce development boards (WDBs), K-12 schools and districts, non-profits, and business and industry, are regular attendees at monthly meetings convened by the OC Regional Consortium.6 Over the course of more than a year, the consortium gathered input and insights from a diverse array of educational, industry, workforce, and community-based stakeholders, and held strategizing sessions with the goal of strengthening and expanding new and existing regional sector career pathways. Beginning in Summer 2019, through multiple workshops, focus groups, and team meetings, strategic regional planning partners were engaged to identify key challenges and opportunities in the region, develop solutions, and improve outcomes in meeting workforce needs. Participation in the planning process involved representatives from business and industry; workforce development; economic development; non-profit, for-profit, and public entities; K-12 educators, four-year colleges and universities; and others. In Orange County, key participants included the Regional Directors for Employer Engagement (RDEEs), the Orange County Business Council, Orange County WDB, Santa Ana WDB, Anaheim WDB, the Employment Development Department (EDD), K-12 educational partners including Orange County Department of Education (OCDE) and ROPs, and adult education and continuing education providers. Many of the entities that participated have strong ties to industry leaders and to initiatives targeting high-growth and priority industries in the region. In 2019, the OC COE conducted the first phase of the Orange County Sector Analysis Project (OCSAP)—a quantitative and qualitative regional labor market research study. The OC COE completed a quantitative labor market assessment of each priority sector to determine labor market gaps and opportunity areas for program development and pathways leading to middle-skill occupations paying at or above a living wage. The qualitative portion of the study, conducted between July and August of 2019, consisted of 12 focus groups comprised of faculty—both instructional and counseling, deans, and administrators—from all nine regional community colleges as well as the stand-alone continuing education center. In addition, all of the region’s RDEEs as well as some of the Statewide Directors for Employer Engagement participated to provide input pertaining to the region’s priority sectors. The objectives of the
6 For ease of reference in this report, and because each subregion of the LAOCRC receives individual funding allocations and thus conducts separate planning processes, the term “OC Consortium” is used to distinguish the portion of the LAOCRC carrying out SWP activities in Orange County from 2017 to 2020 and for the future 2021-2024 period.

11 | P a g e
focus groups were to examine the quantitative data showing the region’s labor market supply gaps in middle-skill jobs; understand where programs exist or do not exist to fill the supply gaps; discuss how Orange County’s community colleges could close the supply gaps; and assess the colleges’ challenges that impede their ability to mitigate the supply gaps. The labor market data and consensus from the focus groups reaffirmed the region’s commitment to the original priority sectors selected in 2017 and a collective desire to remain consistent in strengthening and enhancing career pathways leading into those sectors. The OC COE used this information to develop a set of sector-specific and regional recommendations that were included in the final report and subsequent collateral materials. Beginning in Fall 2019, the OC COE widely presented the findings from the OCSAP to the community colleges and stakeholders throughout the region, including the Orange County Department of Education, the Irvine Chamber of Commerce, and three of the four Orange County community college districts as part of the regional advisories in support of their Perkins Act funding applications. Data and findings from the OCSAP were used by all Orange County community college districts in their written applications. Starting in Spring 2020, in response to the economic disruption resulting from COVID-19, the OC Consortium pivoted along with the WDBs to address workforce development needs. The Orange County Economic Recovery Strategy (OCERS) formed teams to address three areas:
1) Research and Data Analysis 2) Economic Recovery 3) Workforce Recovery
Advisory teams for each area were convened throughout the spring and fall. Led by the OC COE’s director and the director of the Woods Center for Economic Analysis and Forecasting from California
Research Team
OC COE CSUF College of Business and Economics/Woods
Center for Economic Analysis and Forecasting Kleinhenz Economics Golden West College Coast ROP Santiago Canyon College Orange Coast College EDD Rancho Santiago Community College District
Economic Recovery Team CEO Leadership Alliance-Orange County OC WDB Cypress College Santa Ana College Coast Community College District Golden West College Rancho Santiago Community College District OC COE North Orange County Chamber Orange County Department of Education Santa Ana Chamber of Commerce Employment Development Department (EDD) UC Irvine Bren School of Information and
Computer Sciences Inkable Arts | Intellitwin | Seasonally Fresh CSUF College of Business and Economics/Woods
Center for Economic Analysis and Forecasting Kleinhenz Economics Kolena Corporation Fullerton College Extension and International
Programs Orange County Automotive Dealers Association
Workforce Recovery Team CEO Leadership Alliance-Orange County Rancho Santiago Community College District OC COE OC WDB Anaheim WDB North Orange Continuing Education Saddleback College Capistrano USD Santa Ana WDB OC United Way North Orange County ROP CSUF College of Business and Economics/Woods
Center for Economic Analysis and Forecasting Kleinhenz Economics
12 | P a g e
State University, Fullerton, the Research Team included representatives from the EDD, Kleinhenz Economics, OC COE, K12 Pathway Coordinators, and representatives from the colleges and ROPs. The Research Team compiled and analyzed a variety of economic and labor market data to accurately describe the Orange County economy before and during the COVID-19 pandemic to provide accurate information to the Economic and Workforce Recovery Teams. A separate analysis was conducted by Kleinhenz Economics to examine the importance and implications of “external” factors such as developments in automation and artificial intelligence, economy-wide trends taking place across the region and nation, and emerging trends specific to key industries. The Research Team completed the following activities:
• Analyzed employment, payroll, and establishment trends in the county’s industries, with special emphasis on identified priority industries
• Profiled the county’s resident workforce in terms of occupations, demographics, and educational attainment
• Assessed the county’s current mix of occupations
The Research Team forecasted Orange County’s economic recovery, emerging areas and areas impacted by accelerated trends caused by the impacts of the COVID-19 pandemic and identified opportunities for the county’s current and future workforce. Additionally, the OC COE administered a business survey in partnership with the County of Orange, to gauge issues affecting businesses during the pandemic, their future prospects given the current economic climate, and how they would like their business to be supported by local agencies. Nearly 500 survey responses were received. The Workforce Recovery Team—which included workforce development boards, EDD, RDEEs, non-profits, ROPs, and educational partners—addressed how to improve efficiencies and close gaps in services to more rapidly upskill and reskill displaced workers. In addition, the Workforce Recovery Team was tasked with identifying opportunities for community colleges with respect to workforce training to respond to the increasingly dynamic workforce environment with new “business models” for worker training. One area of focus for the team was the Rapid Response process in the county and how to develop a better referral system for individuals affected by company closures and downsizing, and the tracking of those individuals to measure outcomes. The Economic Recovery Team, comprised primarily of business and industry participants, was convened early in the process to provide guidance for the activities undertaken by the Data Analysis Team and Workforce Recovery Team. The resulting Orange County Economic Recovery Strategy final report, which was being completed at the time of this writing, will include strategies and recommendations to guide SWP investments and activities in the immediate and near future. The “Strategic Recommendations through 2024” section of the report contains recommendations from the 2019 Orange County Sector Analysis Project and preliminary findings identified by the OCERS teams that address employment opportunities, opportunities for student preparation, and areas where the community colleges should invest resources.

13 | P a g e
Regional Priorities for 2020 in Response to COVID-19 With the arrival of COVID-19, community college campuses made a sudden and drastic move to offering almost all instruction and student services remotely. As a result, exploring effective strategies for serving students in a COVID-19 environment became a priority for regional stakeholders. To guide the selection of SWP regional projects undertaken by the nine community colleges and K12 SWP investments in Orange County, regional priorities and COVID-19-responsive activities were adopted. The regional priorities for projects included:
• Using data to inform work plan activities • Increasing responsiveness to unemployment and underemployment (e.g., providing
assistance and/or retraining for displaced workers) • Offering short-term training, noncredit courses, and pathways to credit courses • Addressing completion, transfer, median earnings, employment in the field of study,
and/or attainment of a living wage • Sector work-based learning, apprenticeships, and internships • Focusing on in-demand and emerging industry sectors • Aligning sector curriculum • Developing community awareness of community college opportunities and
contributions in CE • Leveraging resources with other partners and programs, including K12 SWP, WIOA, and
adult education • Leveraging technological resources/talent, collaboration, administrative capacity, and
staffing to provide services for the region COVID-responsive activities included:
• Supporting hard-to-convert courses in collaboration with faculty • Addressing protocols for in-person instruction • Offering strategies for distance learning/remote instruction • Focusing on student success through remote support services (counseling, career re-
entry) • Leveraging regional investments for the development and implementation of
equipment and software technologies
14 | P a g e
WDB Alignment The workforce development system is a critical component of the regional economy, and the community colleges have been tasked with working to align their efforts with the county’s workforce development boards. The Orange County Workforce Development Board (OCWDB), the Anaheim Workforce Development Board, and the Santa Ana Workforce Development Board work in collaboration on workforce development activities in Orange County. As noted in the Orange Regional Plan (ORP), the three WDBs and their partners recognize that the county’s long-term economic prosperity will be driven by the development of a strong pool of educated workers whose knowledge, skills, and abilities align with current and future industry needs.7 Strategies described in the plan aim to:
• Provide employers and businesses with the skilled workforce necessary for the county to compete in the U.S. and global economy
• Develop and support career pathway programs to ensure that all residents, including those with barriers to employment, are able to access the level of education necessary to obtain a good job that provides long-term economic security
• Increase middle-skill, industry-valued postsecondary credentials. This goal supports the state’s efforts to produce a million “middle-skill” postsecondary credentials between 2017 and 2027
• Target efforts to areas of the county with high numbers of unemployed and low-income residents
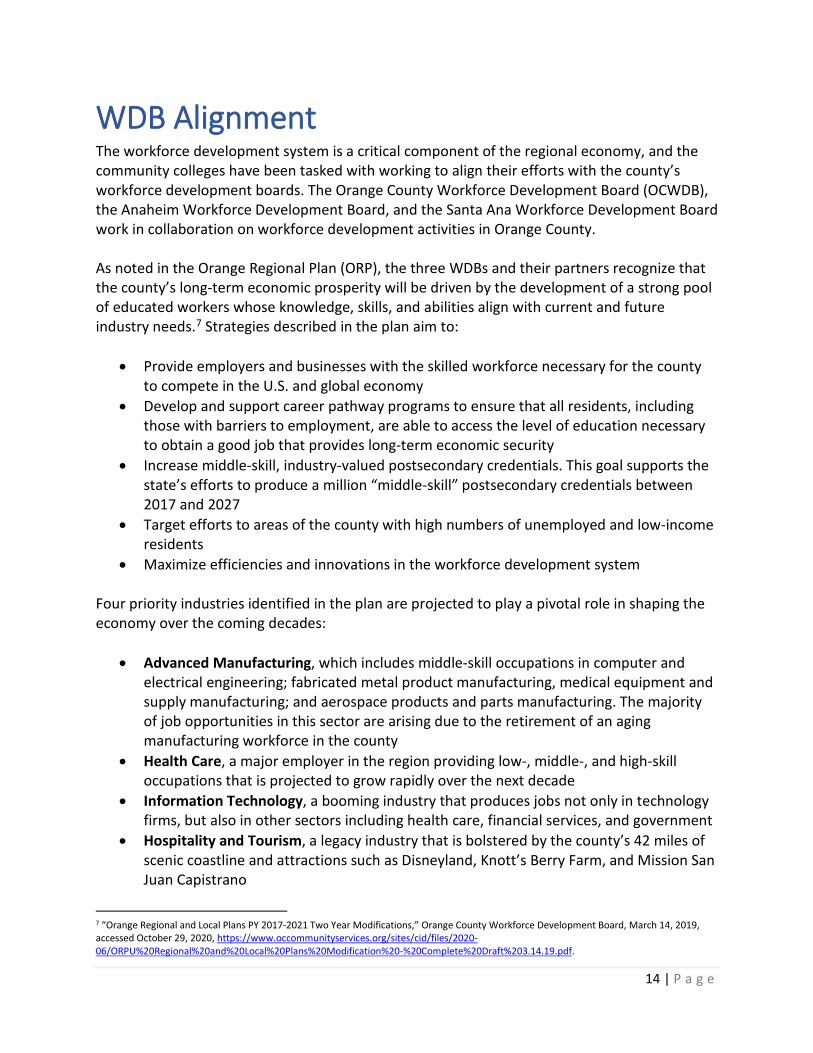
• Maximize efficiencies and innovations in the workforce development system Four priority industries identified in the plan are projected to play a pivotal role in shaping the economy over the coming decades:
• Advanced Manufacturing, which includes middle-skill occupations in computer and electrical engineering; fabricated metal product manufacturing, medical equipment and supply manufacturing; and aerospace products and parts manufacturing. The majority of job opportunities in this sector are arising due to the retirement of an aging manufacturing workforce in the county
• Health Care, a major employer in the region providing low-, middle-, and high-skill occupations that is projected to grow rapidly over the next decade
• Information Technology, a booming industry that produces jobs not only in technology firms, but also in other sectors including health care, financial services, and government
• Hospitality and Tourism, a legacy industry that is bolstered by the county’s 42 miles of scenic coastline and attractions such as Disneyland, Knott’s Berry Farm, and Mission San Juan Capistrano
7 “Orange Regional and Local Plans PY 2017-2021 Two Year Modifications,” Orange County Workforce Development Board, March 14, 2019, accessed October 29, 2020, https://www.occommunityservices.org/sites/cid/files/2020-06/ORPU%20Regional%20and%20Local%20Plans%20Modification%20-%20Complete%20Draft%203.14.19.pdf.

15 | P a g e
In addition to technical skills required in the advanced manufacturing, health care, and information technology sectors, the plan highlights soft skills—such as project management, teamwork, and team management—and critical thinking skills—such as process improvement and problem solving—as critical to these industries. In 2017, during the LAOC Regional Consortium planning process, Orange County and Los Angeles County identified separate priority CCCCO sectors for each subregion. Orange County’s priority CCCCO sectors largely align with those identified in the Orange County Regional Plan (Exhibit 3). The priority sectors identified by the Anaheim Workforce Development Board in its local plan are Professional and Business Services; Trade, Transportation, and Utilities; Leisure and Hospitality; and Education and Health Services. (Because the titles of WDB priority sectors do not perfectly align with CCCCO sector titles, more than five categories are marked in the table below for the Anaheim WDB.) Within Orange County, Regional Directors for Employment Engagement (RDEEs) are assigned to the following priority sectors as defined by the CCCCO: Advanced Transportation & Logistics; Business & Entrepreneurship; Energy, Construction & Utilities; Health; ICT/Digital Media; and Retail, Hospitality & Tourism. Using grant funding, in 2019, a separate RDEE was assigned to facilitate employer engagement for the Life Sciences/Biotech and Advanced Manufacturing sectors in recognition of the importance these then emerging sectors were playing in the regional economy. These two sectors are now considered priority sectors due to their regional importance. Exhibit 3. Priority sectors for OC community colleges, OCWDB/Santa Ana WDB, and Anaheim WDB
CCCCO Sector OC Community College Priority Sectors
OCWDB/ Santa Ana WDB1
Anaheim WDB2
Advanced Manufacturing x x Advanced Transportation & Logistics x x
Life Sciences/Biotech x Business & Entrepreneurship x x Education & Human Services x Energy, Construction & Utilities x x Global Trade x Health Care x x x ICT/Digital Media x x Retail, Hospitality, & Tourism x x x
1 Orange County WDB and Santa Ana WDB collaborated on developing the 2017-2020 Orange County Regional Plan. 2 Anaheim Workforce Development Board 2017-2020 Local Plan, p. 5, https://cwdb.ca.gov/wp-content/uploads/sites/43/2017/04/Anaheim-Exec-Summary-and-Local-Plans.pdf.
16 | P a g e
Regional Assets and Investments Orange County’s workforce development system is varied and complex. Many entities in the county have formed collaborative partnerships to align goals and efforts to support employer needs and create pathways for students into promising careers. As a result, a complete list of all assets and investments could not be included. However, this section includes a summary of key assets and investments that are propelling the region forward and advancing the goals of the Strong Workforce Program. These projects involve regional coordination with K-12 school districts and WDBs, resulting in the creation of more efficient systems for the delivery of education and training. They are helping to meet regional labor market demand while improving and expanding critical CE pathways. In recent years, several funding streams through the state have contributed toward implementing strategies and building a foundation in the region for preparing CE students to enter stable, in-demand jobs that pay solid wages. Senate Bill 1070, which created the Career Technical Education Pathways Program, has assisted with improving CE pathways and led to the work now being conducted through the Strong Workforce Program (a $248 million allocation for the community colleges) and through the K12 Strong Workforce Program to create, support, or expand high-quality CE at the K-12 level (a $150 million allocation for local education agencies). These efforts have been leveraged and built upon through five rounds of Career Technical Education Incentive Grant funding. In addition, funding through the Carl D. Perkins Vocational and Technical Education Act (Perkins Act) has been critical in supporting existing and developing new CE programs in the region and complements the goals of the Strong Workforce Program. In the
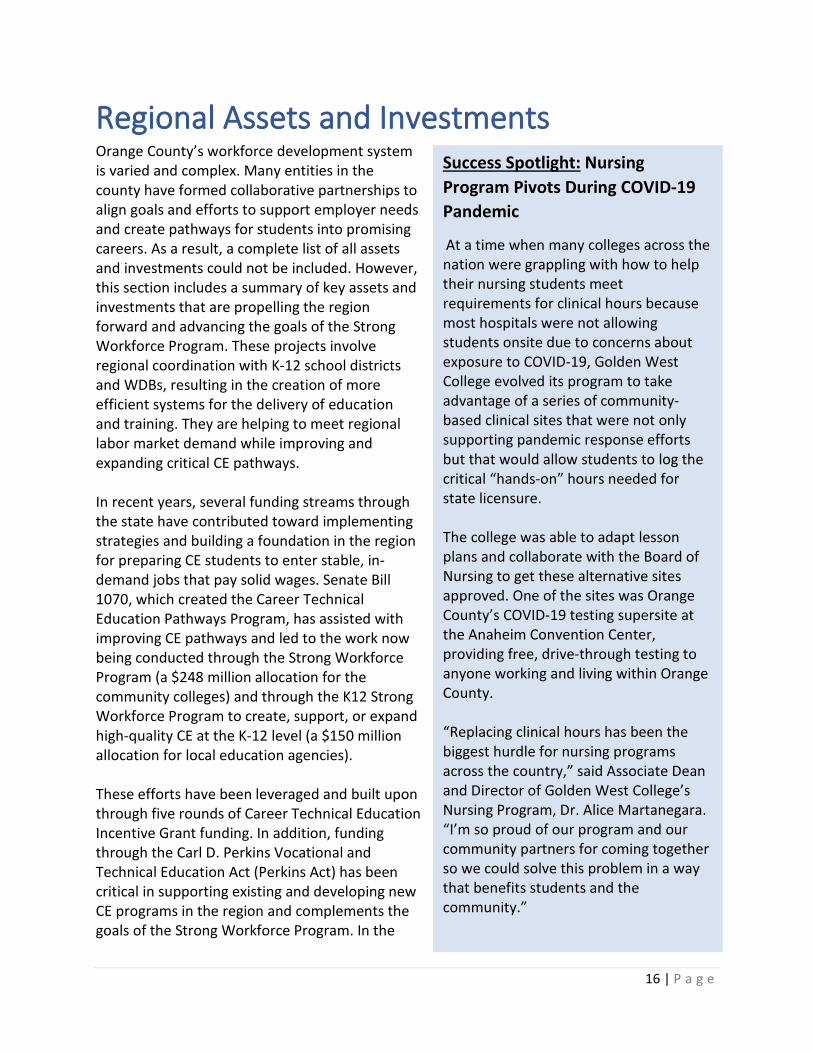
Success Spotlight: Nursing Program Pivots During COVID-19 Pandemic
At a time when many colleges across the nation were grappling with how to help their nursing students meet requirements for clinical hours because most hospitals were not allowing students onsite due to concerns about exposure to COVID-19, Golden West College evolved its program to take advantage of a series of community-based clinical sites that were not only supporting pandemic response efforts but that would allow students to log the critical “hands-on” hours needed for state licensure. The college was able to adapt lesson plans and collaborate with the Board of Nursing to get these alternative sites approved. One of the sites was Orange County’s COVID-19 testing supersite at the Anaheim Convention Center, providing free, drive-through testing to anyone working and living within Orange County. “Replacing clinical hours has been the biggest hurdle for nursing programs across the country,” said Associate Dean and Director of Golden West College’s Nursing Program, Dr. Alice Martanegara. “I’m so proud of our program and our community partners for coming together so we could solve this problem in a way that benefits students and the community.”
17 | P a g e
spring, the Orange County community colleges completed Perkins V Comprehensive Local Needs Assessments to guide local program delivery. The colleges evaluated their performance in six areas, including meeting federal accountability measures, alignment with local labor market needs, and progress toward implementing CE programs. Early on, the focus of much of the work in the region was on strengthening community college CE pathways, but as many goals and accomplishments have been attained, attention has been directed toward aligning K-14 pathways, fostering demand-driven skills attainment for students and incumbent workers, and incorporating more accountable, outcomes-based measures. California Adult Education Program (CAEP), formerly known as the Adult Education Block Grant (AEBG), funding has further helped the region to align, coordinate, and integrate services through the ongoing work of several adult education consortia, including the Coast Adult Education Consortium, North Orange County Regional Consortium for Adult Education (NOCRC), Rancho Santiago Adult Education Consortium, and South Orange County Regional Consortium (SOCRC). Other assets in the region include the SWP Regional Directors for Employer Engagement (RDEEs), the Orange County Center of Excellence (OC COE), and the K-14 Technical Assistance Providers and K-12 Pathway Coordinators assigned to the LA/OC region. The goals and wide-ranging activities of the WDBs in the region are another essential component of the deliberate and mindful work being conducted to align and expand pathways. Several county-wide partnerships are in place to prepare residents to enter the workforce and to implement strategies spurring economic vitality in the region. Key partnerships include the Orange County Business Council and collaboration with chambers of commerce throughout the county. The WIOA Leadership Council comprises stakeholder groups; workforce, industry, and education partners; and the county’s workforce development boards to implement the Workplace Innovation Opportunities Act (WIOA) in the region. In addition, OCWDB and its partners support the development of career pathways that lead to industry-valued credentials and skills, and through the OC Pathways project (created through a partnership between the OC Regional Consortium and Orange County Department of Education), OCWDB connects industry and community stakeholders with educators striving to align their programs with workplace needs. America’s Job Centers of California (AJCC) are important providers of workforce training and support services for displaced workers in the county. These include the Orange County One-Stop Center, the Veterans Service Office in Santa Ana, Los Alamitos Joint Forces Training Base, Anaheim Workforce Connection, and Santa Ana WORK Center. In addition, there are a number of collaborative projects underway in the county that are advancing career pathways to meet workforce needs (Exhibit 4).

18 | P a g e
Exhibit 4. Collaborative projects in Orange County addressing workforce development needs Project Name Description
Latino Educational Attainment Initiative (LEA) Program
OCBC’s Latino Educational Attainment Initiative (LEA) program educates Orange County’s immigrant families on the skills needed to navigate California’s school system and college enrollment process.
OC Pathways: Partnerships for College and Career Success
Led by the Orange County Department of Education, the OC Pathways consortium is a county-wide regional infrastructure that builds, supports, and expands high-demand and high-growth career pathways. This structure enables educators to collaborate with key stakeholders to develop viable and sustainable career pathways in priority industries, including health care, manufacturing, and information technology. OC Pathways ensures that OC students are ready for college, career, and life success through participation in both classroom and work-based learning experiences that integrate rigorous academics and career preparation.
SlingShot Coalition The SlingShot Initiative catalyzes collaborative efforts by businesses, industry, government, workforce development, economic development, and education stakeholders within a region to address employment challenges with regionally selected solutions to regionally defined problems. The OC Region’s SlingShot Coalition is designed to respond to industry-led and identified needs to address a widening skills gap and waning regional talent pipeline.
Veterans’ Employment-Related Assistance Program (VEAP)
OCWDB facilitates the Veterans’ Employment-Related Assistance Program (VEAP), which provides veterans with education, training, and industry-recognized certifications required for high-wage, high-growth industries.
Workforce Innovation and Opportunity Act (WIOA) Young Adult Program
OCWDB's Workforce Innovation and Opportunity Act (WIOA) Young Adult Program provides a variety of services to young adults, including career exploration and guidance, educational support, skills training, and career pathways to help navigate job searches and/or enrollment in postsecondary education.

19 | P a g e
Other community college projects and partnerships in the region:
• The Multi-Craft Core Curriculum (MC3) is an apprenticeship training program within the construction industry. The county’s three workforce development boards collaborate with local community colleges to support MC3. As courses become available, local job centers conduct outreach to educate job seekers and assist with identifying students. The county is exploring ways to increase apprenticeships in the area by expanding MC3 curriculum to health care, IT, manufacturing, and hospitality and tourism.
• The Automotive Collaborative Project brought together Cypress, Fullerton, Golden West, Saddleback, and Santa Ana colleges to broaden and enhance CE and planning, strengthen work-based learning opportunities, and improve student progress and outcomes. Each college received professional development in advanced automotive technologies that could be integrated into new and existing courses. Faculty received training in electric/hybrid technologies, alternative fuels, tires and brakes, and advanced transportation, and many received third-party certification from the Tire Industry Association. Classroom equipment was upgraded, and a Switch Lab was purchased. Employers were recruited to offer cooperative work experience through the colleges’ academic programs.
• The Regional Biotechnology Education Partnership—which includes Fullerton, Irvine Valley, Santa Ana, and Santiago Canyon colleges—undertook efforts to develop curriculum and raise awareness among students about career opportunities in biotechnology and related disciplines. Regional biotech stakeholders were engaged to assess their needs, match students with internship opportunities, and determine skills and work-based learning experiences needed by students to help them succeed in internships and jobs.
• The Vertical Sector Alignment Lead Nursing and Allied Health project brought together Golden West, Saddleback, Orange Coast, and Cypress colleges along with the Health Workforce Initiative/Regional Director of Health to address high-wage and high-skill jobs in health care that require increased education. Utilizing a collaborative approach, the project addressed program alignment to refine and expand current programs for long-term employability and career growth. This enhanced existing programs and led to new innovative programs in collaboration with community partners and employers to address labor market and health care training needs.
20 | P a g e
Noncredit Programs COVID-19 has presented challenges to educational providers offering noncredit programs. The transition to distance learning in Spring 2020 meant that some noncredit program offerings in Orange County were reduced. As noncredit providers adjusted to the new reality of COVID-19, they were able to overcome numerous obstacles and some were able to resume previous levels of noncredit course offerings. In some instances, noncredit classes were able to resume in person in August 2020 in the county. For example, Santiago Canyon College was able to bring back its Certified Nursing Assistant (CNA) program for in-person instruction. A remaining concern, however, is the challenge of regaining the interest of students who may have felt pushed away by the switch to distance learning—either because distance education does not suit their learning style; lack of access to Internet, iPads, and necessary software; or due to the initial reduction in program offerings. While noncredit providers are hopeful that in-person instruction can resume in Summer 2021, they are aware that the longer it takes to resume in-person instruction, the more difficult it may be to attract students and return to the level of performance attained pre-COVID-19. A priority discussed by noncredit providers is the need for outreach and a concerted marketing effort to engage potential noncredit students and encourage students who have stepped away from their noncredit coursework to return. Noncredit providers also are optimistic that SB 554, which allows community colleges to deliver credit-bearing courses at adult education and noncredit program sites, will spur more students to enroll in noncredit courses and pursue pathways to fulfilling careers.
• Coast Community College District—Noncredit programs are offered through the district’s three community colleges. Coastline College offers 11 programs with certificates of completion or competency, and five noncredit courses in accounting, counseling, English, ESL, and special education. Golden West offers 13 certificates of completion or competency in five areas—automotive technology, college preparation, computer business applications, ESL, and English, as well as 43 courses, ranging from digital arts to management. Orange Coast College offers four adult education career training programs in computer basics, customer service/retail sales, early childhood education (credit), and personal care aide, as well as an English language learning program.
• North Orange Community College District—North Orange Continuing Education (NOCE) has worked consistently to align noncredit CE programs with workforce and credit pathways. NOCE’s faculty have implemented several regional and statewide pathway efforts, such as creating the Business Information Worker I & II pathways that lead to employment and/or higher learning at sister colleges. NOCE has also worked with the OC COE regarding TOP Codes and labor market data to ensure that its programs align with other pathways and programs within the region.

21 | P a g e
Additionally, NOCE has led and/or participated in many regional efforts in the areas of work-based learning, job placement, and helping promote the benefits of noncredit-to-credit pathways. COVID-19 has impacted NOCE’s CE programs over the past seven months. During the state shutdown, NOCE was in the early stages of developing and implementing distance education. Faculty had been working hard to ramp up a program that would be piloted in the fall, and COVID-19 presented a new opportunity for growth in best practices to serve students and increase access to classes and programs. Initially, there was a decrease in students with the switch to online. In Fall, although headcount has declined somewhat, NOCE CE registrations have increased. Based on student need, NOCE has created a laptop loan program, offered access to Wi-Fi in its parking lots, and moved all services online. To increase short-term noncredit CE courses and programs, funding was applied for and approved from NOCE’s California Adult Education Program allocation. This funding is being used to pay faculty and hire content experts to work with other faculty within the region and state to increase noncredit CE programs as well as determine ways to create pathways to sister colleges for those students who want to earn associate degrees and higher-level credit certificates. NOCE has also recently started working with San Diego Continuing Education and other noncredit providers throughout the state to apply for a federal grant that will increase the ability to offer more fully online programming for our students. NOCE participates in and undertakes a variety of other efforts, including the regional and statewide Medical Assistant workgroups; the Orange County Dean’s workgroup; the SWP TalentED project to bring industry and pathway information to our students; the SWP Biotechnology Advisory/Workgroup; SWP marketing efforts; and the SWP Sector Analysis focus groups. Activities include leading the SWP Regional Work-Based Learning and Job Placement project and creating partnerships with and implementing regional access to LinkedIn Learning, Portfolium, Career Launch Academy, and Emsi Alumni Analyst reporting.
• Rancho Santiago Community College District—Within the Rancho Santiago Adult Education Consortium (RSAEC), creating CE pathways for noncredit students is one of the top five goals in the California Adult Education Program (CAEP) three-year regional plan. Santa Ana College (SAC) School of Continuing Education and Santiago Canyon College (SCC) Division of Continuing Education are working with the credit side to align specific programs so that students can articulate and continue their studies to obtain recognized certifications and job opportunities (Exhibit 5). Some of the areas where noncredit and credit are working closely include medical occupations such as CNA, CNA Acute Care, Home Health Aide Pharmacy Technician, and Behavior Technician as well as business occupations such as General Office Clerk, Home-Based Business, and Digital Marketing Specialist. Pathways to credit departments include Biology, Registered Nurse, Occupational Therapy, Child Development, and Business. Regarding impacts from COVID-19, a laptop loaner program has been established for noncredit students along with free software available to students in Adobe, MS Office, and Medical Billing/Coding. Noncredit students are also able to apply for CARES Act grants of $300 to support their studies.

22 | P a g e
All SCC CE courses have been approved with distance education addenda to be taught in an online format. CNA students at SAC and SCC have been granted waivers to continue clinicals on the school campus while sites are closed. A Behavior Technician program was created from an industry roundtable and has partnerships with industry groups such as the Qualified Applied Behavior Analysis Credentialing Board (QABA) and the Autism Business Association, along with nonprofit groups such as Taller San Jose Hope Builders. CNA Acute Care is also in talks with four area hospitals to offer the clinical program at the hospitals as soon as COVID-19 restrictions are lifted.
Exhibit 5. Summary of Santa Ana College and Santiago Canyon College metrics Career Education & Workforce Preparation (100+ courses)
Attendance Hours >0 (drops included)
Headcount Enrollment Number of
Sections
Sum of Attendance
Hours
FTES (Quick Facts)
Santa Ana College School of Continuing Education
3,878 9,052 374 267,441 524
Santiago Canyon College Division of Continuing Education
2,599 6,009 221 139,294 426
• South Orange Community College District—In an effort to align with CE pathways in
Orange County, Saddleback Adult Education works collaboratively with the Orange County Workforce Development Board, WIOA, and One-Stop stakeholders to develop an integrated educational and workforce system to provide students with individualized and customized education and training. During the 2019-20 academic year, the program served more than 2,800 students in the areas of adult ESL, high school equivalency, and adults with disabilities. Saddleback added Career Development and College Preparation certificates in Adult English as a Second Language for the Workplace, Basic Culinary Arts, and High School Equivalency in English and Spanish. A Career Development and College Preparation certificate in basic technology is currently going through the approval process. Due to COVID-19, all course offerings and support services shifted to online. Students are provided access to technology and no-cost textbooks. The program also offers virtual workshops in resumé building, interview tips, job market and pandemic impacts, job search, skill assessment, and career decision making. There are three counselors who provide ongoing support for students looking to enter or re-enter the workforce. The Irvine Valley College Community Education department also offers short-term, not–for-credit classes, workshops, and career training programs. Noncredit programs include adult ESL classes.
23 | P a g e
Summary of Regional SWP Projects In past years, strategies to achieve SWP goals that have been adopted by the OC Regional Consortium have involved enhanced industry engagement, regional alignment of curriculum between K-12 schools and community colleges, modifying curriculum to incorporate industry standards, faculty professional development, and upgrading equipment, supplies, and technological resources. SWP Sustained Projects Over the past three years, SWP funding has been invested in several long-term projects, which are realizing significant results:
• OC COE—The Centers of Excellence for Labor Market Research (COEs) are the primary providers of labor market information (LMI) and data for California’s community colleges. There are currently seven CCCCO Workforce & Economic Development Division grant-funded COEs in the state. The OC COE was the first center funded via regional SWP funds, which began in the second year’s allocation. The OC COE has taken on numerous projects to help the colleges increase the quality of their CE programs, including the comprehensive, almost year-long Orange County Sector Analysis Project; Resilient Jobs; the annual Orange County Drone Report; leading the Orange County Economic Recovery Strategy; and reworking the Program Recommendation LMI briefs to include more employer requested skills information and completing more than 300 Program Recommendation LMI briefs in support of proposed regional CE programs. The OC COE has taken a leadership role in creating and participating in numerous collaborations in support of Orange County’s community colleges. Partnerships exist with the Orange County Department of Education and other K-12 institutions, the county’s ROPs, the four California Adult Education Program (CAEP) consortia within Orange County, the three County Workforce Development Boards, various chambers, and others. These have resulted in shared projects, numerous presentations and trainings specifically related to Orange County’s community college CE programs and how they are addressing the region’s labor market needs, and strategies for increasing K-12 to community college pathways and CE partnerships. The OC COE considers building and maintaining these relationships on behalf of the region’s colleges to be one of its highest priorities.
• Regional Marketing—In 2017-18, the LAOC Regional Consortium hired Interact Communications, a full-service marketing company that works only with community colleges and their foundations, to help spread the word about the efficacy of CE and reverse statewide and regional trends in declining community college enrollment. Interact Communications developed a comprehensive marketing campaign and conducted in-depth research on Orange County’s community colleges (and regional perceptions of them) to inform planning, collateral development, and subsequent print products, digital and social media
24 | P a g e
campaigns, and TV advertising. This assessment resulted in the “Future BUILT” brand and marketing campaign, which has driven more than 427,430 website visits, 15,530 “apply” clicks, and 1.4 million video views. Overall estimates across indoor, outdoor, and digital advertising suggest more than 130 million impressions. Since the marketing campaign’s inception, for-credit CE enrollment numbers increased by 4.3% and noncredit CE enrollment increased 13%, while non-CE for-credit and noncredit enrollment in the county declined 4.2% and 2.7% respectively.
• Future BUILT Website—Using the first round of SWP funding, the OC region
created the Future BUILT website as a source of information for students on CE programs, colleges, and careers in the region. In response to COVID-19, News.FutureBUILT.org added up-to-date resources for faculty and students. A dedicated faculty web page was created to curate the latest online teaching resources to support regional instructors as they transitioned their students to distance learning. The page featured links to current and upcoming Vision Resource Center and CVC-OEI training seminars, and sector-specific links to teaching resources, many of which were provided by Orange County’s RDEEs. A student-focused, one-stop-shop for all things COVID-19 was built to make it easy for students to get up-to-the-minute updates and information in a single, convenient location. The regional consortium also leveraged its 2,000+ subscriber e-newsletter to send regular, weekly updates to keep faculty and stakeholders informed of the latest system updates, upcoming events, and newly added resources. The News.FutureBUILT.org website has since returned to its regular features highlighting regional career education programs, students, and projects but continues to update its COVID-19 resource pages as new resources and information become available.
• Program Finder—Funded by the Strong Workforce Program and developed in partnership with the Orange County Board of Education, Program Finder is an online career development tool that links occupational areas of interest with Orange County community college CE programs. The web-based app was designed to benefit a wide audience—prospective students exploring career and college opportunities, parents looking for practical and professional education options, counselors trying to connect students to community college programs, and CE teachers guiding students on their career journey. Programs are displayed on an interactive map so users can determine which locations best fit their geographic needs. In addition, the online tool gives colleges visibility into which CE pathways each K-12 institution offers and the number of students in each pathway.
• Career Awareness and Work Readiness—Managed by the North Orange County
Community College District and North Orange Continuing Education, the Orange

25 | P a g e
County Regional Work-Based Learning and Job Placement Project is a focused effort to develop and implement a sustainable, regional approach to career services, work-based learning, internships, job placement, and employment engagement for students, employers, colleges/schools, and community partners. The project makes available to Orange County community college students over 16,000 on-demand video tutorials on topics ranging from professional development to Microsoft Office skills and learning the Python programming language through LinkedIn Learning. In October 2020, Future BUILT started offering a weekly online series, Future BUILT Fridays, featuring professional career coaches, guest speakers, and industry experts. Topics include careers, networking, and interviewing techniques that assist community college students in their quest for jobs and internships.
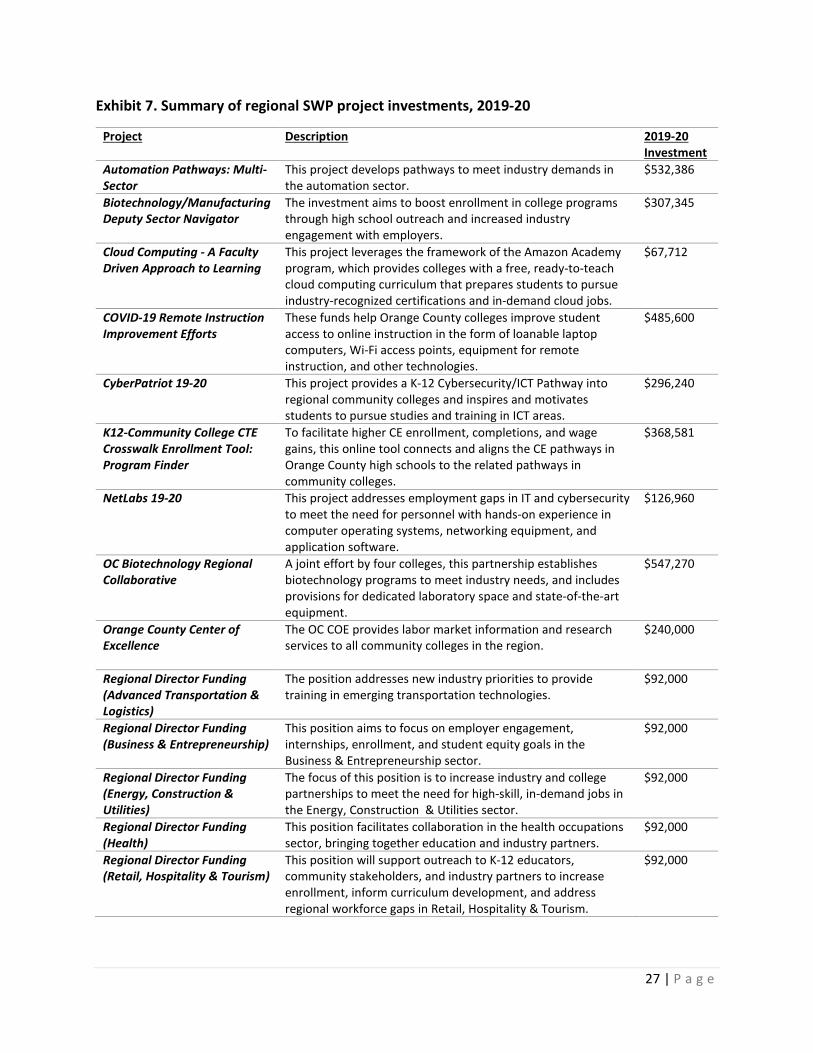
2019-20 SWP Funding Allocations In 2019-20, $8.4 million in SWP funding was allocated across 22 regional projects (Exhibits 6 and 7). Of those, a majority (just over $5 million) was dedicated to specific industry sectors, with the remainder (roughly $3.4 million) supporting comprehensive marketing activities and student/educator support services that are used across colleges and programs. As of the writing of this report, proposals for 2020-21 were being reviewed and were expected to be approved in November. SWP funds invested in 2019-20 totaled $8,442,347. Exhibit 6. Percentage allocation of SWP funds, 2019-20 academic year
19%
29%
18%
9%
7%
4%
4%3%
3% 2%2%
All Sectors
Multi-sector
Biotech/Advanced Manufacturing
Student Supports
Education
ICT/Digital Media
Regional Directors of EmployerEngagementK12 Alignment
Health Care
Business & Entrepreneurship
Advanced Transportation
$8,442,347
Total Funds

26 | P a g e
• Sector-specific support—A majority of the funding was allocated to projects that support specific industry sectors, including Orange County’s eight CCCCO priority sectors. Support for industry-desired programs in ICT/Digital Media continues to be a priority, with investments made in the ongoing CyberPatriot and NetLabs programs, as well as in the implementation of the Amazon Academy program, which provides colleges with a free, ready-to-teach, cloud computing curriculum. Current projects also are geared toward the biotech industry. The investment in a position akin to a regional director was created to connect educational leaders with regional businesses and help create K-12-to-college pathways. Another focus is addressing critical gaps in the rapidly changing automotive industry. As part of Orange County’s Automotive Collaborative Project, investments were made in faculty training, community outreach, and classroom upgrades.
• Aligning career pathways—Alignment with K-12 and regional industry and employer needs remains a focal point for SWP projects in the region. The K12-Community College CTE Crosswalk Enrollment Tool, which became Program Finder (www.programfinderoc.com), aims to facilitate higher enrollments, completions, and wage gains by aligning CE pathways between OC high schools and the community colleges using K-12 Industry Sector and Pathway codes with 4-digit TOP codes.
• Student support services—TalentED, created through a regional collaboration between OC community colleges and partner businesses, is a new website that provides information about jobs and careers to community college students. This geo-enabled career navigation hub provides workforce data, mapping, and visualization capabilities that empower students to find programs, enter pathways, and secure high-demand middle-skill jobs that pay a living wage.
• Support for remote instruction—State-mandated “Safer at Home” orders during the COVID-19 pandemic resulted in the allocation of additional funds to all Orange County community colleges to improve student access to online education. Technology investments include loanable laptop computers, Wi-Fi access points, equipment for remote instruction, and other technologies to assist student access or enhance online instruction.
• Regional Marketing—The investment in a comprehensive, unified, and data-driven branding and marketing campaign has continued to be sustained. Campaign objectives of the “Future BUILT” brand include creating CE awareness, generating interest among potential students, providing information, and driving increases in enrollment.
27 | P a g e
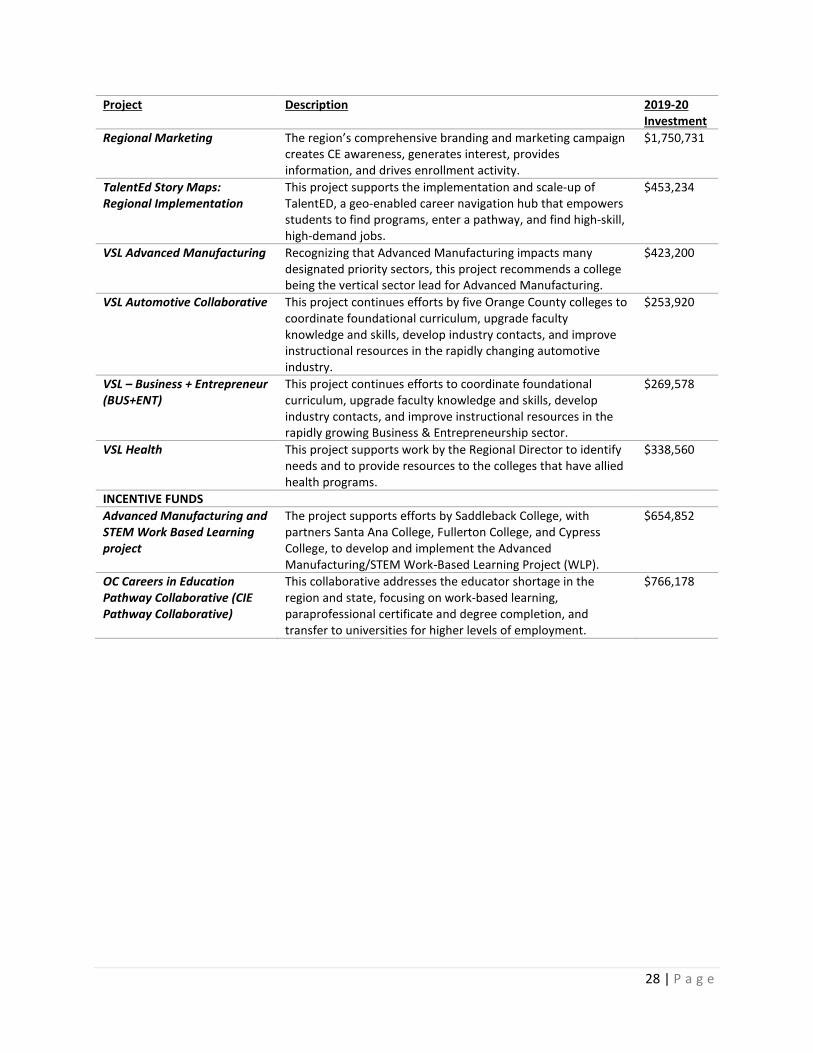
Exhibit 7. Summary of regional SWP project investments, 2019-20
Project Description 2019-20 Investment
Automation Pathways: Multi-Sector
This project develops pathways to meet industry demands in the automation sector.
$532,386
Biotechnology/Manufacturing Deputy Sector Navigator
The investment aims to boost enrollment in college programs through high school outreach and increased industry engagement with employers.
$307,345
Cloud Computing - A Faculty Driven Approach to Learning
This project leverages the framework of the Amazon Academy program, which provides colleges with a free, ready-to-teach cloud computing curriculum that prepares students to pursue industry-recognized certifications and in-demand cloud jobs.
$67,712
COVID-19 Remote Instruction Improvement Efforts
These funds help Orange County colleges improve student access to online instruction in the form of loanable laptop computers, Wi-Fi access points, equipment for remote instruction, and other technologies.
$485,600
CyberPatriot 19-20
This project provides a K-12 Cybersecurity/ICT Pathway into regional community colleges and inspires and motivates students to pursue studies and training in ICT areas.
$296,240
K12-Community College CTE Crosswalk Enrollment Tool: Program Finder
To facilitate higher CE enrollment, completions, and wage gains, this online tool connects and aligns the CE pathways in Orange County high schools to the related pathways in community colleges.
$368,581
NetLabs 19-20
This project addresses employment gaps in IT and cybersecurity to meet the need for personnel with hands-on experience in computer operating systems, networking equipment, and application software.
$126,960
OC Biotechnology Regional Collaborative
A joint effort by four colleges, this partnership establishes biotechnology programs to meet industry needs, and includes provisions for dedicated laboratory space and state-of-the-art equipment.
$547,270
Orange County Center of Excellence
The OC COE provides labor market information and research services to all community colleges in the region.
$240,000
Regional Director Funding (Advanced Transportation & Logistics)
The position addresses new industry priorities to provide training in emerging transportation technologies.
$92,000
Regional Director Funding (Business & Entrepreneurship)
This position aims to focus on employer engagement, internships, enrollment, and student equity goals in the Business & Entrepreneurship sector.
$92,000
Regional Director Funding (Energy, Construction & Utilities)
The focus of this position is to increase industry and college partnerships to meet the need for high-skill, in-demand jobs in the Energy, Construction & Utilities sector.
$92,000
Regional Director Funding (Health)
This position facilitates collaboration in the health occupations sector, bringing together education and industry partners.
$92,000
Regional Director Funding (Retail, Hospitality & Tourism)
This position will support outreach to K-12 educators, community stakeholders, and industry partners to increase enrollment, inform curriculum development, and address regional workforce gaps in Retail, Hospitality & Tourism.
$92,000
28 | P a g e
Project Description 2019-20 Investment
Regional Marketing
The region’s comprehensive branding and marketing campaign creates CE awareness, generates interest, provides information, and drives enrollment activity.
$1,750,731
TalentEd Story Maps: Regional Implementation
This project supports the implementation and scale-up of TalentED, a geo-enabled career navigation hub that empowers students to find programs, enter a pathway, and find high-skill, high-demand jobs.
$453,234
VSL Advanced Manufacturing
Recognizing that Advanced Manufacturing impacts many designated priority sectors, this project recommends a college being the vertical sector lead for Advanced Manufacturing.
$423,200
VSL Automotive Collaborative
This project continues efforts by five Orange County colleges to coordinate foundational curriculum, upgrade faculty knowledge and skills, develop industry contacts, and improve instructional resources in the rapidly changing automotive industry.
$253,920
VSL – Business + Entrepreneur (BUS+ENT)
This project continues efforts to coordinate foundational curriculum, upgrade faculty knowledge and skills, develop industry contacts, and improve instructional resources in the rapidly growing Business & Entrepreneurship sector.
$269,578
VSL Health
This project supports work by the Regional Director to identify needs and to provide resources to the colleges that have allied health programs.
$338,560
INCENTIVE FUNDS Advanced Manufacturing and STEM Work Based Learning project
The project supports efforts by Saddleback College, with partners Santa Ana College, Fullerton College, and Cypress College, to develop and implement the Advanced Manufacturing/STEM Work-Based Learning Project (WLP).
$654,852
OC Careers in Education Pathway Collaborative (CIE Pathway Collaborative)
This collaborative addresses the educator shortage in the region and state, focusing on work-based learning, paraprofessional certificate and degree completion, and transfer to universities for higher levels of employment.
$766,178

29 | P a g e
K12 Strong Workforce Program Investments and Collaboration K12 SWP Funding Summary In 2017 the California State Legislature approved the K12 Strong Workforce Program which was chaptered in California Education Code Section 88827.8 The legislature committed $150 million annually for projects led by local educational agencies (LEAs) that included:
• Partnership with at least one community college in the region • Activities to strengthen CE pathways between K-12 and the community college
In response to the legislation, the OC region convened LEAs to engage and assist them in the application process. The region established a K12 Selection Committee to review applications and select awardees.
The first round of K12 SWP funding was effective fiscal year 2018-2019; however, the funding period began statewide on July 1, 2019. Similarly, Round 2 of K12 SWP funding was effective fiscal year 2019-2020 but became available July 1, 2020. K12 SWP performance and funding periods are 30 months.
Round 3 (FY 2020-2021) of K12 SWP funding will begin January 1, 2021. Future rounds of K12 SWP funding are expected to begin with the corresponding fiscal year.
For Round 1, Orange County received 12 applications for funding and awarded funding to nine projects (Exhibit 8). Round 2 saw 13 applications and 11 awardees. At the time of the writing of this report, 22 applications had been received for Round 3 and were undergoing the selection process. A full list of K12 SWP projects for Round 2 can be found in Appendix A.
Exhibit 8. Applications, awards, and funding for Los Angeles K12 SWP
Round Fiscal Year
Performance Period
OC K12 SWP Allocation
Number of Applications
Number of Awards
1 2018-2019
July 1, 2019-Dec. 31, 2021
$12,828,373 12 9
2 2019-2020
July 1, 2020-Dec. 31, 2022
$11,888,757 13 11
3 2020-2021
Jan. 1, 2021-June 30, 2023
$11,789,491 22 TBD
8 California Education Code, Title 3, Division 7, Part 54.5, Section 88827, https://leginfo.legislature.ca.gov/faces/codes_displaySection.xhtml?lawCode=EDC§ionNum=88827.

30 | P a g e
OC Pathways Since its inception in 2014, the OC Pathways Consortium, a partnership between the Orange County Regional Consortium and Orange County Department of Education (OCDE), has grown to include 27 school districts, nine community colleges, one stand-alone continuing education center, and numerous regional agencies and industry partners. Initially funded as part of California’s $500 million California Career Pathways Trust (CCPT) grant, the program aimed to expand career pathways for students to earn skills and credentials leading to high-wage careers. Today, the project is funded by OCDE through the Career Technical Education Incentive Grant (CTEIG) and the K12 Strong Workforce Program. Across the region, middle school CE enrollment increased more than 27% in 2019-20 compared with the previous academic year, while high school enrollment was up more than 8%. Other notable accomplishments include the addition of 24 new CE dual-enrollment courses across the region and 81 new industry certifications. As part of the OC Pathways K12 SWP grant, there are eight regional initiatives focused on the development and strengthening of K-14 CE course sequences, programs, and pathways (Exhibit 9). Exhibit 9. Eight regional OC Pathways initiatives Advancing Career Counseling
Provide a Career Counseling Coordinator (CCC) to 14 secondary school districts in Orange County to develop the critical infrastructure necessary to strengthen and align primary and secondary school K-12 pathways with community college CE programs across the region.
Building CE Dual Enrollment
Build and grow CE early college credit course offerings/pathway sequences between high schools and community colleges in OC.
Creating Industry Certification Opportunities
Develop opportunities for all students to have access to industry certifications county-wide and align these opportunities from high school to community college.
Designing Career-Based Student Leadership
Inspire students to learn and acquire career development skills by building student leadership in Orange County beyond Career Technical Student Organizations (CTSO).
Enhancing Career Education Pedagogies
Provide learning opportunities for K-12 teachers in career pathway and career awareness programs so they can grow in their proficiency as CE educators.
Forming OC Integrated Pathway Teams
Build incentives for schools and districts to develop and refine career pathway sequences with multidisciplinary pathway teams.
Heightening Work-Based Learning
Build upon work-based learning in Orange County from the established practices set by the regional ROP’s, which are currently implementing work-based learning in 15 secondary districts across the county.
Gold Standard CE Model for Special Populations
Define the need for all educators to be involved in the integration of CE planning allowing all students to participate in CTE courses, pathways, and work-based learning experiences.

31 | P a g e
Regional Economic Overview and COVID-19 Impacts COVID-19 Pandemic Impacts on Orange County The Orange County Economic Recovery Strategy (OCERS) Research Team conducted an in-depth analysis of Orange County’s economy pre-COVID-19 and during the pandemic, as well as forecasted what the potential economic recovery could look like. The Research Team is composed of a variety of the county’s stakeholders from education and workforce but is driven by a core set of researchers led by the OC COE; the Woods Center for Economic Analysis and Forecasting from California State University, Fullerton; the Employment Development Department’s Labor Market Information Division (EDD LMID); and Kleinhenz Economics. This group of five individuals collected and analyzed economic and labor market data and created forecasts of the county’s expected recovery. A brief summary of their findings is included in this section.
Economy and Employment The regional economy and employment have been adversely affected by the COVID-19 pandemic. Though Orange County had strong employment prior to the pandemic, the impacts of COVID-19 continue to be felt as shown by a high unemployment rate, a significant number of job losses, and record number of unemployment insurance (UI) claims filed by unemployed workers.
Nonfarm jobs are an important economic indicator that identifies trends related to economic growth. California lost around 2.6 million nonfarm jobs (or 14.9% of all jobs) between February and April 2020. Nonfarm jobs bounced back slightly in May, and the state recovered 993,600 (38%) of these by September, but it is unclear if this trend will continue. The Leisure & Hospitality industry sector (a key sector in the Orange County economy) was hardest hit, losing 47.8% of jobs during the shutdown and only recovering 39% of those by September.
OC Economic Recovery Strategy Purpose
Engage diverse public and private sector partners in an integrated economic development planning process to develop a Post-COVID-19 Economic Recovery Strategy that will serve as an economic roadmap to diversify and strengthen the Orange County regional economy through the development of regional economic goals, a regional plan of action, and identification of investment priorities and funding.
OC Economic Recovery Strategy Mission
Statement Create strategies that guide economic prosperity and resiliency, encourage partnerships and collaboration, and fully utilize Orange County’s unique advantages to maximize economic opportunity and overall quality of life for businesses and residents in the region.

32 | P a g e
Ten industries—Leisure & Hospitality; Health Care & Social Assistance; Retail Trade; Administrative & Support & Waste Services; Manufacturing; Other Services, Government; Wholesale Trade; Professional, Scientific & Technical Services; and Finance & Insurance—accounted for 92% of nonfarm jobs lost between February 2020 and May 2020.
The Leisure & Hospitality, Health Care & Social Assistance, and Retail Trade industries accounted for 60% of job losses from February to April 2020 but accounted for 35% of all jobs in 2019. Nearly 40% of the jobs lost were in Leisure & Hospitality alone. From April 2020 to May 2020, some of these 10 industries gained jobs while others continued to decline.
Shutdowns drove unemployment rates to record highs in April and May 2020. The unemployment rate in Orange County in February 2020 was 2.8%. After a slight increase in March (3.7%), the unemployment rate skyrocketed in April (13.8%) and May (14.5%). Orange County’s unemployment rate was 9% as of September 2020, the most current data available at the time of this writing.
According to a forecast produced by the Woods Center at California State University, Fullerton, the unemployment rate in Orange County is projected to steadily decline through the end of 2021 and will reach 4.5% in the fourth quarter of 2021, which is above the February 2020 unemployment rate (2.8%). Comparatively, the U.S. unemployment rate is forecasted to follow a similar yet slightly smoother trajectory reaching 6.2% in the fourth quarter of 2021, which is above the February 2020 rate of 3.5%.
The number of weekly initial unemployment insurance (UI) claims was relatively flat between January and mid-March 2020, then increased exponentially during the week that ended March 28 (86,125 claims). Initial UI claims stayed at the same level the following week (86,112 claims), then started declining before another uptick in the week ending May 2 (59,324 claims).
The week ending May 2 was the first week to include Pandemic Unemployment Assistance (PUA) claims. PUA is a provision of the CARES Act that helps unemployed Californians who are not usually eligible for regular UI benefits, such as business owners, self-employed workers, and independent contractors.9 The highest number of PUA claims were filed during that week (30,632 PUA claims) and PUA claims have declined and remained relatively flat since then.
9 “Pandemic Unemployment Assistance,” California Employment Development Department, October 15, 2020, accessed October 28, 2020, https://edd.ca.gov/about_edd/coronavirus-2019/pandemic-unemployment-assistance.htm.

33 | P a g e
Orange County’s Resilient Jobs The OC COE conducted an analysis of industries and occupations that appear to be resilient during economic downturns and that were also important to the economy in the years following the Great Recession (2010-2019). For the purpose of this study, industries and occupations that experienced employment growth or sustained employment levels prior to, during the 2007-2009 Great Recession, and after are considered recession-resilient industries and jobs. To determine which occupations are also pandemic-resilient, the recession-resilient jobs were compared with regional online job postings between March and August 2020. While the economic impacts of the Great Recession and those caused by the impact of the COVID-19 pandemic are not identical, there are similarities that are worth considering and which are addressed in this report. Resilient Jobs Key Findings
• Recession-resilient industries—Only 92 industries, of the nearly 1,000 industries in the North American Industry Classification System (NAICS), have been identified as recession-resilient industries within Orange County.
• Recession-resilient jobs—Only 35 occupations, of the more than 800 occupations in the Standard Occupational Classification (SOC) system, have been identified as recession-resilient jobs in Orange County. Of those 35 recession-resilient jobs, 15 are considered middle-skill jobs, or jobs that could be trained by community college programs.10,11
• Pandemic-resilient jobs—There are 126 occupations that met the criteria to be
considered pandemic-resilient. Of those, only 17 met the criteria to also be considered recession-resilient. More than 225,000 online job postings listed between March and June 2020 were reviewed to identify the top 100 jobs in each month, by number of job postings, within Orange County. During this period, the aforementioned 126 occupations made the monthly top 100 jobs list at least once.
• Recession- and pandemic-resilient, middle-skill jobs—There are seven middle-skill jobs, or jobs that could be trained by community college programs, of the 17 recession- and pandemic-resilient jobs.
Exhibit 10 lists the seven recession- and pandemic-resilient middle-skills jobs for Orange County along with their entry-level and median hourly earnings.
10 The Standard Occupational Classification (SOC) system is used by federal statistical agencies to classify workers into occupational categories for the purpose of collecting, calculating, or disseminating data. For more information, see bls.gov/soc. 11 Emsi 2020.3; QCEW, Non-QCEW, Self-Employed.

34 | P a g e
Exhibit 10. Recession- and pandemic-resilient middle-skill occupations in Orange County Occupation Entry-Level Hourly
Earnings (25th Percentile)
Median Hourly Earnings
Computer Network Architects $37.56 $53.10 Life, Physical, and Social Science Technicians, All Other
$17.98 $24.44
Pharmacy Technicians $17.45 $21.18 Project Management Specialists and Business Operations Specialists, All Other
$24.84 $34.34
Registered Nurses $40.49 $49.22 Sales Representatives of Services, Except Advertising, Insurance, Financial Services, and Travel
$17.53 $26.26
Web Developers and Digital Interface Designers
$20.32 $31.41
Business Survey Analysis Summary As part of the Orange County Economic Recovery Strategy (OCERS), a regional collaborative effort to create an economic recovery plan in response to the COVID-19 pandemic, the County of Orange conducted a business survey to better understand regional businesses’ concerns about the effects of COVID-19 on their operations. The OC COE administered this survey using Qualtrics, an online survey platform. The survey was sent through various channels to numerous businesses throughout Orange County between September 4 and October 3, 2020; 433 businesses responded to the survey. It is important for Orange County’s community colleges to be aware of the impact the COVID-19 pandemic has had on regional businesses so that they are informed as to the economic climate that students will encounter as they complete their programs and look for jobs. Some of the key findings of the OCERS Business Survey are discussed below.12
Business Survey Key Findings Orange County businesses have been adversely affected by the COVID-19 pandemic. Declines in sales, revenue, and employees will likely affect the ability of businesses to stay afloat during the partial shutdown of the economy.
• Business operations have changed negatively for 76% of businesses. Survey results show 74% of businesses are expecting revenue shortages greater than 25% compared to their original budget projections. Only 3% will have no shortage or will have increased revenues. Regarding the impact of COVID-19 on sales, 56% of businesses have
12 Note: Several questions included in the survey allowed respondents to select more than one response. For that reason, the sum of the percentages for certain findings may exceed 100%. Findings for which this situation applies are denoted with an asterisk (*).

35 | P a g e
experienced more than a 50% reduction in sales; only 5% of businesses have experienced no reduction or an increase.
• A decline in business/sales was identified as a major or moderate problem for 92% of
respondents.* These concerns were echoed in the response to an open-ended question in which the loss of business and jobs was identified as the biggest concern for 30% of respondents, followed by government mandated closures/restrictions (21%), and the health and safety of employees and customers (15%).*
• 65% of respondents (280 businesses) estimate that they can sustain their business for
less than a year in the partial shutdown of the economy; 17% (75 businesses) do not know how long they can sustain their business, and another 17% (75) can sustain their business for one or more years. Of the 370 businesses (85%) with fewer than 50 employees, 70% estimate that they can sustain their business for less than a year, 18% do not know, and only 12% estimate they can sustain their business for more than a year.
• 63% of businesses anticipate they will have laid off employees by the end of the year
while 37% anticipate either no layoffs or increasing their staffing levels.
• Despite these challenges, Orange County businesses are trying new methods to minimize the impacts of COVID-19 but anticipate it will take time to return to pre-COVID-19 levels. For example, 42% of respondents have moved to more online business, 42% are assisting employees with transitional resources, and 38% are having regular discussions with other local businesses to brainstorm ideas and share their experiences.
• Within the Accommodation and Food Services industry, 84% of businesses are offering carryout/delivery services, and another 6% are considering doing the same.
• Regarding the economic recovery, 39% (145) of businesses think it will take one year or more for their business to return to pre-COVID-19 levels, and 6% (21) say they will not be able to return to pre-COVID-19-levels.
• Businesses in the Arts, Entertainment, and Recreation industry appear to be most concerned about returning to pre-COVID-19 levels, with 59% saying it will take one year or more, and another 10% saying they will not be able to return to pre-COVID-19 levels. Businesses in the Arts, Entertainment, and Recreation industry were the hardest hit by shutdowns, as 47% of respondents in this industry said they have completely shut down due to the pandemic.

36 | P a g e
OC Strong Analysis Summary In addition to the OCERS report, a separate analysis entitled “Orange County Strong” was conducted by Kleinhenz Economics to examine the importance and implications of “external” factors such as developments in automation and artificial intelligence, as well as emerging trends that are affecting industries in Orange County. Findings indicate Orange County has a vibrant, dynamic economy, including a strong presence in manufacturing, health care, and retail trade. OC Strong Key Findings
• Private sector businesses—In 2019 there were 124,261 private sector establishments in Orange County, generating $96 billion in payroll. The largest numbers were in Health Care; Professional, Scientific, and Technical Services; Retail Trade; and Accommodation and Food Services.
• CCCCO priority sectors—Collectively, Orange County’s eight priority sectors comprised 72% of all jobs in the county in 2019. Between 2015 and 2019, the number of business establishments grew across all priority CCCCO sectors, with the largest growth rate in ICT/Digital Media. During that same timeframe, average wages in the priority sectors were generally higher and grew faster than average wages overall.
• Self-employed workers—In 2018, there were 323,593 self-employed people in Orange County, generating $19 million in receipts. This is an important segment for community colleges to consider in light of the growing gig economy and freelance workforce.
• Job growth—In terms of growth over the past five years, jobs in health care support showed the highest growth (25%), although a related occupation, health care practitioners and technical, experienced very little growth. Strong growth occurred in community and social services, and transportation and materials movers.
• Advanced Manufacturing—Despite the automation-related decline in manufacturing jobs throughout Southern California, this sector still accounts for 20-25% of the economy.
• Retail, Hospitality & Tourism—With a large proportion of Orange County’s 1.67 million jobs in the Leisure & Hospitality industry (including hotels, restaurants, and bars), the county has been more impacted by pandemic-related shutdowns than neighboring counties. The Leisure & Hospitality industry employs the highest number (almost 14%) of Orange County workers, followed by Health Care & Social Assistance (12%). Solid growth in the Retail, Hospitality & Tourism CCCCO sector in Orange County over the past five years supports the decision to continue prioritizing this sector despite impacts from the pandemic.

37 | P a g e
Data Analysis Informing the 2021-2024 Orange County Regional Plan CCCCO Priority Sectors Analysis Twelve sectors have been selected as areas of focus for SWP statewide. Eight priority sectors were selected in 2017 during the SWP planning process that contribute to the economic vitality of the Orange County microregion. The data analysis completed for the OCERS study validates the decision to keep the same priority sectors for the next four years. Exhibit 11 displays the number of middle-skill occupations associated with each CCCCO sector, the number of community college programs offered in the county for each sector, and the number of colleges with programs related to each sector. (Appendix A contains a list of colleges with programs related to each CCCCO sector.) In 2019, the OC COE conducted extensive stakeholder engagement to gather input and insights into the eight priority sectors. The OC COE also conducted a labor market analysis of each sector, examined postsecondary supply, and identified middle-skill jobs offering above a living wage in each sector. The process reaffirmed the region’s commitment to its priority sectors. The following sections summarize the OC COE’s labor market analysis. (Annual openings and wages for each occupation included in this section are shown in Appendix B.) Exhibit 11. Number of occupations and program inventory by CCCCO sector, Orange County
CCCCO Sector Number of Middle-skill Occupations
Number of Programs
Number of Colleges Offering
Programs Advanced Manufacturing 31 103 9 Advanced Transportation & Logistics 35 96 8 Agriculture, Water & Environmental Technologies
12 27 6
Business & Entrepreneurship 40 184 10 Education & Human Development 4 64 10 Energy, Construction & Utilities 36 118 9 Global Trade 4 8 4 Health 43 103 9 ICT/Digital Media 24 251 10 Life Sciences/Biotech 9 15 4 Public Safety 16 41 7 Retail, Hospitality & Tourism 25 125 9 Unassigned 16 83 10

38 | P a g e
Orange County Sector Analysis Project Findings In Fall 2019, the OC COE completed the Orange County Sector Analysis Project, an in-depth labor market analysis of the eight priority sectors. At the close of the year, the OC COE released eight sector analyses plus an executive summary brief and set of profiles that included postsecondary supply for top middle-skill occupations with substantial labor market demand, stable employment growth, and wages above the county’s living wage of $17.39, as determined by the California Family Needs Calculator. The study identified top occupations within the region that have entry-level wages above the living wage as well as occupations with entry-level wages below the living wage, but that offer median wages above the living wage. For the sake of brevity, only top occupations with entry-level wages above the county’s living wage are included in this section. (Appendix C contains a detailed breakdown of labor market demand information including entry-level and median wages and annual openings for each occupation described in this section.) Overall, the eight priority sectors account for 1,287,693 jobs in Orange County and 10.2% of all jobs in these sectors in California. There are approximately 74,516 individual businesses in the county, which make up 10.1% of all the businesses for all sectors in California. These sectors are projected to increase by 5% (70,174 jobs) in the next five years in Orange County. The average earnings per job are $73,371. Exhibit 12 shows a breakdown of the nearly 29,000 middle-skill jobs in the eight priority sectors.
12,970
4,898
3,764
3,174
1,879944894
179
Exhibit 12. Labor market demand for top middle-skill jobs in the eight priority sectors in Orange County
Business and Entrepreneurship
Energy, Construction, andUtilities
Health
ICT and Digital Media
Advanced Manufacturing
Retail, Hospitality, and Tourism
Advanced Transportation andLogistics
Life Sciences and Biotechnology
Total Middle-skill
Jobs28,702

39 | P a g e
Advanced Manufacturing The Advanced Manufacturing sector accounts for 130,342 jobs in Orange County and 13.5% of all Advanced Manufacturing jobs in California. There are approximately 39,811 individual businesses in the county, which make up 11.5% of all the businesses for the sector in California. This sector is projected to decline by 6% (a loss of 8,144 jobs) in the next five years in the county. The average earnings per job are $91,177. Top occupations include first-line supervisors of production and operating workers, and industrial machinery mechanics (Exhibit 13). Please note that for the following charts an asterisk (*) indicates that an occupation has an oversupply of labor, i.e., that more awards are being conferred on average each year than there are annual job openings.
56
61
84
87
88
125
169
184
198
207
620
109
0
58
20
0
3
233
N/A
171
23
10
0
0
0
0
0
0
4
0
2
0
0
Mechanical Drafters*
Computer Numerically Controlled Machine ToolProgrammers, Metal and Plastic
Aircraft Mechanics and Service Technicians
Engineering Technicians, Except Drafters, All Other
Electrical and Electronics Repairers, Commercialand Industrial Equipment
Civil Engineering Technicians
Industrial Production Managers
Structural Iron and Steel Workers
Electrical and Electronics Engineering Technicians
Industrial Machinery Mechanics
First-Line Supervisors of Production and OperatingWorkers
Exhibit 13. Advanced Manufacturing top middle-skill jobs in Orange County: Labor market demand vs. program supply
Demand
Supply from CCs
Supply from non-CCs
(Please note: N/A indicates that no community college program reported awards for this occupation, or no community college program is available for this occupation.)

40 | P a g e
Advanced Transportation & Logistics The Advanced Transportation & Logistics sector accounts for 58,520 jobs in Orange County and 6.4% of all Advanced Transportation & Logistics jobs in California. There are approximately 3,756 individual businesses in the county, which make up 7.6% of all the businesses for the sector in California. This sector is projected to grow by 4% (or 2,327 jobs) in the next five years in Orange County. The average earnings per Advanced Transportation & Logistics job are $65,963. Top occupations include first-line supervisors of mechanics, installers, and repairers; logisticians; and transportation, storage, and distribution managers (Exhibit 14).
Business & Entrepreneurship The Business & Entrepreneurship sector accounts for 336,106 jobs in Orange County and 13.5% of all Business & Entrepreneurship jobs in California—the largest sector in the county. There are approximately 22,925 individual businesses in the county, which make up 11.7% of all the businesses for the sector in California. This sector is projected to grow by 6% (or 21,607 jobs) in the next five years in Orange County. The average earnings per Business & Entrepreneurship job are $91,266. Top occupations include bookkeeping, accounting, and auditing clerks; sales representatives, services, all other; and first-line supervisors of office and administrative support workers (Exhibit 15).
102
107
119
209
357
49
189
37
0
86
0
33
0
0
243
Mobile Heavy Equipment Mechanics,Except Engines
Cargo and Freight Agents*
Transportation, Storage, and DistributionManagers
Logisticians
First-Line Supervisors of Mechanics,Installers, and Repairers
Exhibit 14. Advanced Transportation & Logistics top middle-skill jobs in Orange County: Labor market demand vs. program supply
DemandSupply from CCsSupply from non-CCs

41 | P a g e
65
66
79
83
211
212
243
274
289
311
346
455
471
648
779
844
1,216
1,986
2,009
2,383
0
0
0
N/A
0
0
21
0
0
0
7
0
2812
42
0
4
0
233
0
602
0
0
0
0
0
0
0
0
0
0
0
0
64
7
0
0
0
5
0
16
Brokerage Clerks
Credit Counselors
Appraisers and Assessors of Real Estate
Compensation, Benefits, and Job AnalysisSpecialists
Advertising Sales Agents
Real Estate Brokers
Tax Preparers
Payroll and Timekeeping Clerks
Claims Adjusters, Examiners, and Investigators
Sales and Related Workers, All Other
Training and Development Specialists
Property, Real Estate, and CommunityAssociation Managers
Administrative Services Managers*
Real Estate Sales Agents
Executive Secretaries and ExecutiveAdministrative Assistants
Loan Officers
Insurance Sales Agents
First-Line Supervisors of Office andAdministrative Support Workers
Sales Representatives, Services, All Other
Bookkeeping, Accounting, and Auditing Clerks
Exhibit 15. Business & Entrepreneurship top middle-skill jobs in Orange County: Labor market demand vs. program supply
Demand
Supply from CCs
Supply from non-CCs
(Please note: N/A indicates that no community college program reported awards for this occupation, or no community college program is available for this occupation.)
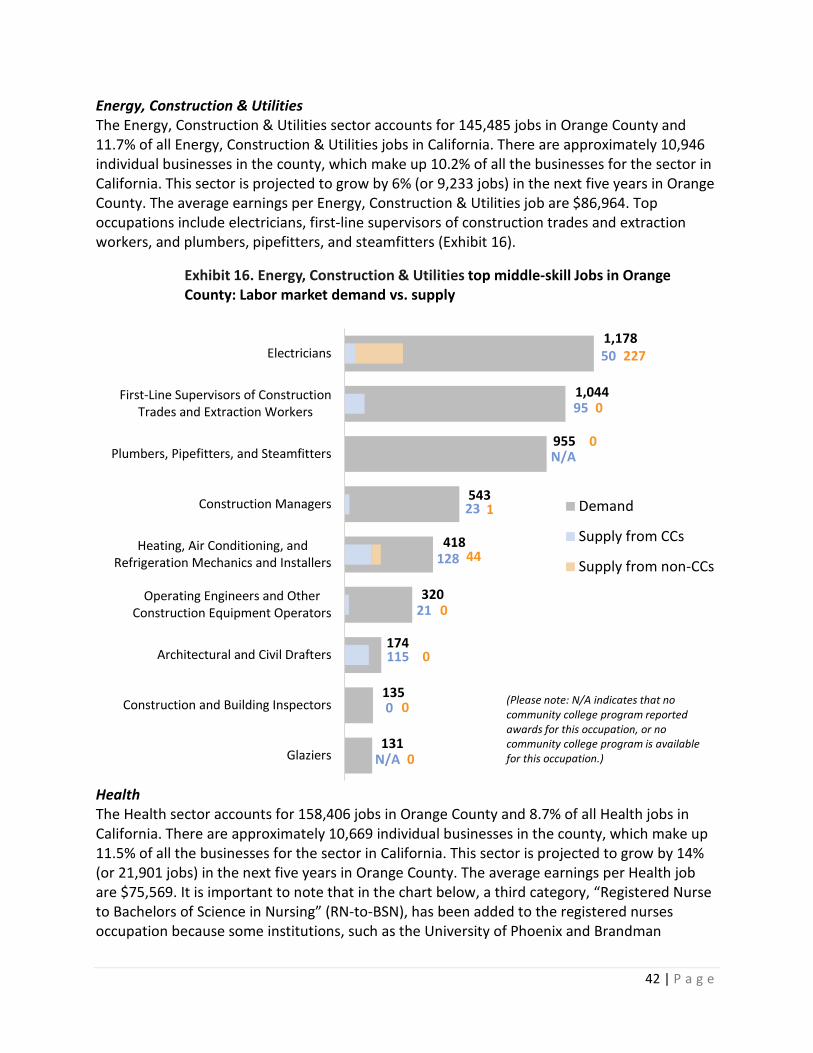
42 | P a g e
Energy, Construction & Utilities The Energy, Construction & Utilities sector accounts for 145,485 jobs in Orange County and 11.7% of all Energy, Construction & Utilities jobs in California. There are approximately 10,946 individual businesses in the county, which make up 10.2% of all the businesses for the sector in California. This sector is projected to grow by 6% (or 9,233 jobs) in the next five years in Orange County. The average earnings per Energy, Construction & Utilities job are $86,964. Top occupations include electricians, first-line supervisors of construction trades and extraction workers, and plumbers, pipefitters, and steamfitters (Exhibit 16).
Health The Health sector accounts for 158,406 jobs in Orange County and 8.7% of all Health jobs in California. There are approximately 10,669 individual businesses in the county, which make up 11.5% of all the businesses for the sector in California. This sector is projected to grow by 14% (or 21,901 jobs) in the next five years in Orange County. The average earnings per Health job are $75,569. It is important to note that in the chart below, a third category, “Registered Nurse to Bachelors of Science in Nursing” (RN-to-BSN), has been added to the registered nurses occupation because some institutions, such as the University of Phoenix and Brandman
131
135
174
320
418
543
955
1,044
1,178
N/A
0
115
21
128
23
N/A
95
50
0
0
0
0
44
1
0
227
Glaziers
Construction and Building Inspectors
Architectural and Civil Drafters
Operating Engineers and OtherConstruction Equipment Operators
Heating, Air Conditioning, andRefrigeration Mechanics and Installers
Construction Managers
Plumbers, Pipefitters, and Steamfitters
First-Line Supervisors of ConstructionTrades and Extraction Workers
Electricians
Exhibit 16. Energy, Construction & Utilities top middle-skill Jobs in Orange County: Labor market demand vs. supply
Demand
Supply from CCs
Supply from non-CCs
0
(Please note: N/A indicates that no community college program reported awards for this occupation, or no community college program is available for this occupation.)

43 | P a g e
University, provide programs for those who already are a registered nurse and have an associate degree in nursing to earn their Bachelors of Science in Nursing; therefore, these programs are not training new nurses and are not creating additional supply.13 Top occupations include registered nurses, licensed practical and vocational nurses, and dental hygienists (Exhibit 17).
13 Focus group participants pointed out that the supply number for registered nurses is misleading because it overstates the number of new nurses that are being trained. Due to the way IPEDS collects awards data, the OC COE cannot determine how many awards were conferred for pre-licensure programs versus RN-to-BSN programs at institutions that offer both programs (non-community college supply information is generated from CIP data which comes from the Integrated Postsecondary Education Data System [nces.ed.gov/ipeds/use-the-data], also known as IPEDS). Therefore, the data presented in the above exhibit overstates the supply for registered nurses by an undeterminable amount of at least 455 awards because it is double-counting current registered nurses.
54
79
83
87
102
144
155
156
234
235
652
1,783
0
52
0
0
79
16
21
48
21
18
3
469
0
103
90
0
55
141
0
0
0
0
529
857 455
Community Health Workers
Occupational Therapy Assistants*
Surgical Technologists*
First-Line Supervisors of ProtectiveService Workers, All Other
Radiologic Technologists*
Respiratory Therapists*
Physical Therapist Assistants
Healthcare Support Workers, All Other
Clinical Laboratory Technologists andTechnicians
Dental Hygienists
Licensed Practical and LicensedVocational Nurses
Registered Nurses
Exhibit 17. Health top middle-skill jobs in Orange County: Labor market demand vs. program supply
Demand
Supply from CCs
Supply from non-CCsRN-to-BSN

44 | P a g e
ICT/Digital Media The ICT/Digital Media sector accounts for 46,524 jobs in Orange County, and 6.1% of all ICT/Digital Media jobs in California. There are approximately 3,553 individual businesses in the county, which make up 8.3% of all the businesses for the sector in California. This sector is projected to grow by 9% (or 4,038 jobs) in the next five years in Orange County. The average earnings per ICT/Digital Media job are $130,418. Top occupations include computer user support specialists, computer occupations (all other), and graphic designers (Exhibit 18).
51
56
127
128
166
178
236
307
352
400
408
765
20
12
0
80
N/A
3
115
117
N/A
160
5
140
0
0
0
0
0
0
29
0
0
16
7
42
Surveying and Mapping Technicians
Commercial and Industrial Designers
Computer Network Architects
Producers and Directors
Telecommunications Line Installers andRepairers
Computer Network Support Specialists
Web Developers
Network and Computer SystemsAdministrators
Telecommunications EquipmentInstallers and Repairers, Except Line
Installers
Graphic Designers
Computer Occupations, All Other
Computer User Support Specialists
Exhibit 18. ICT/Digital Media top middle-skill jobs in Orange County: Labor market demand vs. program supply
Demand
Supply from CCs
Supply from non-CCs
(Please note: N/A indicates that no community college program reported awards for this occupation, or no community college program is available for this occupation.)
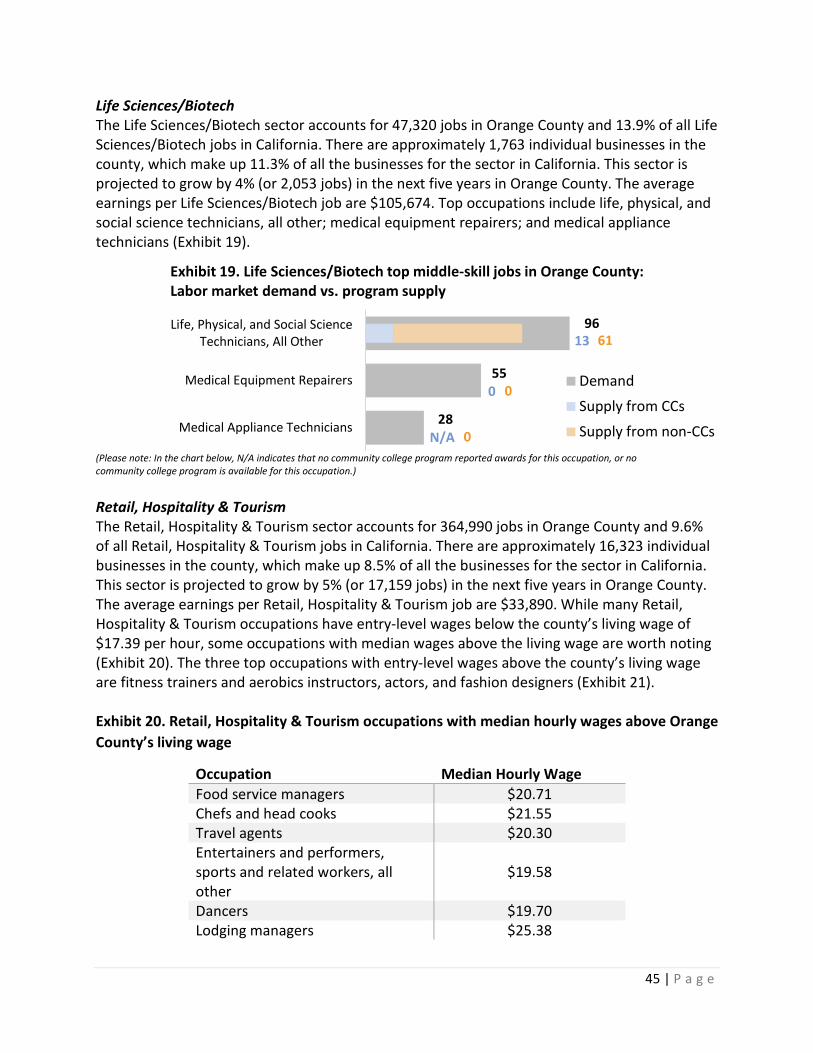
45 | P a g e
Life Sciences/Biotech The Life Sciences/Biotech sector accounts for 47,320 jobs in Orange County and 13.9% of all Life Sciences/Biotech jobs in California. There are approximately 1,763 individual businesses in the county, which make up 11.3% of all the businesses for the sector in California. This sector is projected to grow by 4% (or 2,053 jobs) in the next five years in Orange County. The average earnings per Life Sciences/Biotech job are $105,674. Top occupations include life, physical, and social science technicians, all other; medical equipment repairers; and medical appliance technicians (Exhibit 19).
(Please note: In the chart below, N/A indicates that no community college program reported awards for this occupation, or no community college program is available for this occupation.)
Retail, Hospitality & Tourism The Retail, Hospitality & Tourism sector accounts for 364,990 jobs in Orange County and 9.6% of all Retail, Hospitality & Tourism jobs in California. There are approximately 16,323 individual businesses in the county, which make up 8.5% of all the businesses for the sector in California. This sector is projected to grow by 5% (or 17,159 jobs) in the next five years in Orange County. The average earnings per Retail, Hospitality & Tourism job are $33,890. While many Retail, Hospitality & Tourism occupations have entry-level wages below the county’s living wage of $17.39 per hour, some occupations with median wages above the living wage are worth noting (Exhibit 20). The three top occupations with entry-level wages above the county’s living wage are fitness trainers and aerobics instructors, actors, and fashion designers (Exhibit 21). Exhibit 20. Retail, Hospitality & Tourism occupations with median hourly wages above Orange County’s living wage
Occupation Median Hourly Wage Food service managers $20.71 Chefs and head cooks $21.55 Travel agents $20.30 Entertainers and performers, sports and related workers, all other
$19.58
Dancers $19.70 Lodging managers $25.38
28
55
96
N/A
0
13
0
0
61
Medical Appliance Technicians
Medical Equipment Repairers
Life, Physical, and Social ScienceTechnicians, All Other
Exhibit 19. Life Sciences/Biotech top middle-skill jobs in Orange County: Labor market demand vs. program supply
Demand
Supply from CCs
Supply from non-CCs
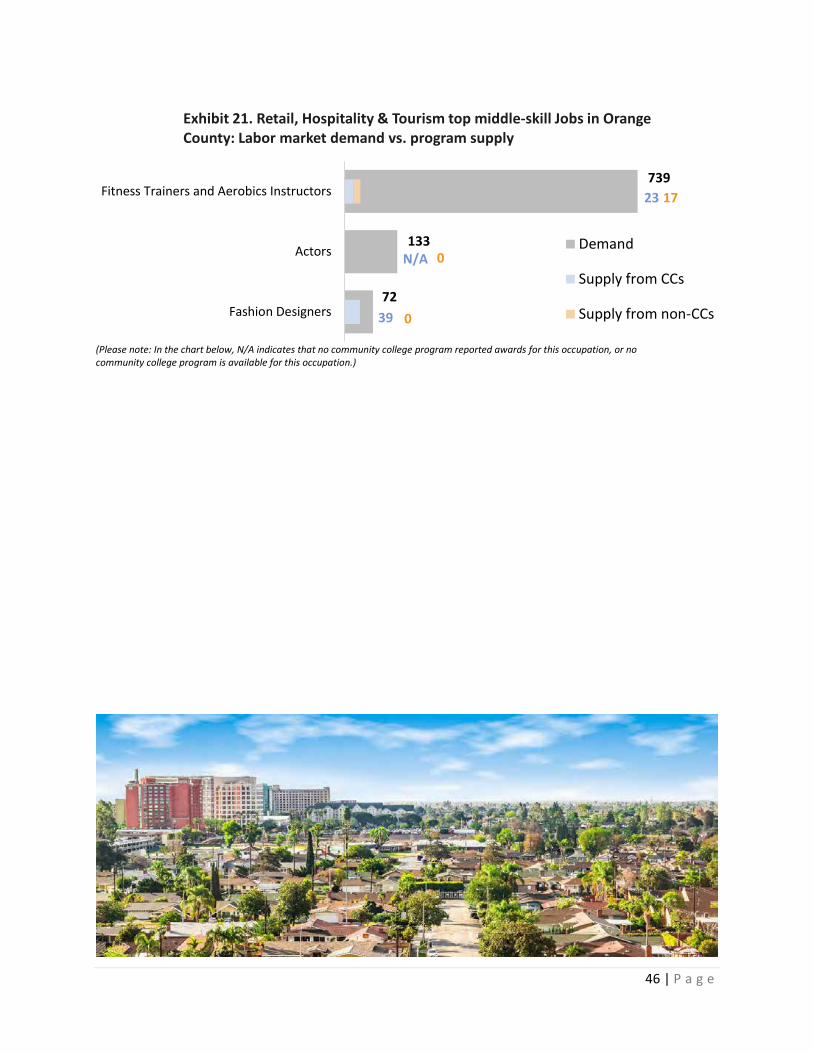
46 | P a g e
(Please note: In the chart below, N/A indicates that no community college program reported awards for this occupation, or no community college program is available for this occupation.)
72
133
739
39
N/A
23
0
0
17
Fashion Designers
Actors
Fitness Trainers and Aerobics Instructors
Exhibit 21. Retail, Hospitality & Tourism top middle-skill Jobs in Orange County: Labor market demand vs. program supply
Demand
Supply from CCs
Supply from non-CCs

47 | P a g e
SWP Regional Outcomes Program Requests Exhibit 22 shows program recommendation requests by sector received by the OC COE during the last two academic years. In the 2018-19 academic year, program requests were greatest in the areas of ICT/Digital Media, 30 requests, Business & Entrepreneurship, 28 requests, and Health, 21 requests. In the following academic year, program requests were greatest for Advanced Transportation & Logistics, Business & Entrepreneurship, and ICT/Digital Media. In 2019-20, sectors with the fewest requests were Life Sciences/Biotech; Agriculture, Water & Environmental Technologies; and Public Safety. Overall, program requests increased by 12% in the 2019-20 academic year, from 145 total requests in the previous year to 163 requests. “Unassigned” in the table below means the requestor did not indicate a TOP code on the request form. Exhibit 22. Program requests by sector from Orange County community colleges
CCCCO Sector 2018-19 2019-20 Subtotal % Change
Advanced Manufacturing 17 10 27 (41%) Advanced Transportation & Logistics
9 53 62 489%
Agriculture, Water & Environmental Technologies
2 6 8 200%
Business & Entrepreneurship 28 25 53 (11%) Education & Human Development 2 14 16 600% Energy, Construction & Utilities 6 6 12 0% Health 21 9 30 (57%) ICT/ Digital Media 30 20 50 (33%) Life Sciences/Biotech 0 5 5 N/A Public Safety 8 2 10 (75%) Retail, Hospitality & Tourism 14 4 18 (71%) Unassigned 8 9 17 13% TOTAL 145 163 308 12%

48 | P a g e
SWP Launchboard Metrics In previous years, various outcomes and metrics have been considered and employed in the development, selection, and execution of regional projects funded through the SWP. For the purpose of this plan, all nine SWP metrics from the California Community College Chancellor’s Cal-PASS Plus LaunchBoard have been provided to demonstrate progress and success in areas such as student completion and job attainment. Exhibit 23 shows SWP metrics for Orange County’s combined eight priority sectors. There are several notable trends. Since 2015-16, although student headcount has slightly declined, the number of SWP students who earned a degree or certificate or attained apprenticeship journey status has steadily increased, from 5,964 in 2015-16 to 7,734 in 2018-19. Similarly, students who attained a noncredit workforce milestone in a single year grew from 38% to 54%. Median annual earnings for SWP existing students rose from $33,127 in 2015-16 to $34,5127. Slight increases were also realized for SWP students who earned 9 or more CE units in a single year, median change in earnings for SWP exiting students, and SWP students attaining a job closely related to their field of study. Appendix C shows the LaunchBoard metrics for each of Orange County’s CCCCO priority sectors. Exhibit 23. SWP metrics for all eight CCCCO priority sectors, Orange County SWP Metric 2015-16 2016-17 2017-18 2018-19 Strong Workforce Program Students 106,441 100,332 101,082 99,041 SWP Students Who Earned 9 or More Career Education Units in the OC Subregion in a Single Year
20% 20% 20% 21%
SWP Students Who Earned a Degree or Certificate or Attained Apprenticeship Journey Status
5,964 6,199 6,472 7,734
Students Who Attained a Noncredit Workforce Milestone in a Single Year 38% 51% 54% 55%
SWP Students Who Transferred to a Four-Year Postsecondary Institution 6,867 6,592 6,281
Median Annual Earnings for SWP Exiting Students $33,127 $33,857 $35,127
Median Change in Earnings for SWP Exiting Students 33% 34% 36%
SWP Exiting Students Who Attained the Living Wage 43% 44% 46%
SWP Students with a Job Closely Related to Their Field of Study 70% 71%

49 | P a g e
Strategic Recommendations through 2024 Overview and Initial Findings As of the writing of this report, two reports were in the process of being finalized that are expected to greatly assist in post-COVID-19 pandemic strategic recommendations. One of these projects, the Orange County Economic Recovery Strategy (OCERS), is in collaboration with numerous community college stakeholders and partners. As these reports are completed, the region will use them to amend short-term strategies as appropriate. In the interim, the OC COE Resilient Jobs report recommends focusing on the seven identified recession- and pandemic-resilient middle-skill jobs which can be addressed by the region’s credit and noncredit CE programs. Given that all of the economic forecasts are projecting that Orange County will return to a pre-COVID-19 economy within 18-24 months of the current restrictions being lifted, the Orange County subregion is focusing on the recommendations of the OC Sector Analysis Project for mid- and long-term strategic goals. Findings from the Orange County Sector Analysis Project in 2019 and initial findings from the OCERS report and OC Strong economic forecast validate the 2017 selection of the eight priority sectors. The findings not only confirm the decision made in choosing the eight priority sectors, but, through regional investments, highlight many positive outcomes that have been achieved. As a result, the priority sectors for 2021 through 2024 will remain the same:
• Advanced Manufacturing • Advanced Transportation & Logistics • Business & Entrepreneurship • Energy, Construction & Utilities • Health • ICT/Digital Media • Life Sciences/Biotech • Retail, Hospitality & Tourism.
The data analysis conducted for the Orange County Sector Analysis Project, OCERS, and the OC Strong economic forecast also reinforces the decision to sustain the positions held by the Orange County RDEEs. The business survey administered by the OC COE reveals that there is a need to make sure businesses impacted by COVID-19 receive additional assistance, such as small business advising regarding how to tap into available resources and funding to help them stay in business. Access to resources is critical for small businesses to survive the current economic conditions, as is education that applies to financial literacy (especially in the area of applying for funding through the Small Business Administration and other forms of support through local and state sources), entrepreneurship, and business operations.
50 | P a g e
Initial findings from the OC Strong project indicate Orange County is well positioned to exit the current economic downturn with solid (2-3%) job growth, and the county is likely to experience faster growth than adjacent regions.
Recovery itself will take time and will affect industries unevenly. Such signature industries as Orange County’s hospitality sector will recover more slowly than other sectors that rely less on personal interaction and have been able to adapt through remote work practices. Present circumstances have disrupted the overall outlook for jobs and community-college-level training and education programs. While some occupations will surge in demand over the near future, many occupations and staffing requirements will revert to their long-term trajectories, driven by fundamental forces such as population and job growth, income growth, and changing demographics. As an example, the increasing share of older residents in the county has ramifications, not just for health care, but for personal services, transportation services, and other industries and associated occupations. In terms of the priority sectors, the Health sector will likely outpace growth in other areas of the region’s economy due to increased demand for health care services from an aging population. The Health sector is a significant contributor to target occupations that require training at the community college level.
Moreover, the presence of manufacturing in the region and the county is often overlooked. This industry is not necessarily growing a lot of jobs, but it is still a significant source of long-term economic growth for the region. While some of the other priority sectors will likely contribute to the region’s recovery, notably Retail, Hospitality & Tourism, there are other areas that could be significant job creation engines for the region, such as professional, scientific and technical services, as well as architecture, engineering, and design.
Despite the frequent misperception that a four-year degree is a must in tomorrow’s economy, there will continue to be long run demand for several middle-wage occupations that are effectively filled by community colleges through their academic and certificate programs. As community colleges shape their curriculum and offerings over the next few years, they must seek a balance between meeting the needs of industries serving local populations (for example, food and beverage establishments) that often require large numbers of workers, and so-called “traded” industries (such as manufacturing, goods movement) that may not hire as many workers but whose activities grow the county economy, expanding the “economic pie” for all.

51 | P a g e
Orange County Sector Analysis Recommendations Throughout July and August of 2019, as the qualitative portion of the Orange County Sector Analysis Project, the OC COE convened 12 focus groups to discuss regional workforce demand and postsecondary supply for the eight priority sectors and to gather insights and input from stakeholders. Based on the feedback received during that engagement process combined with the quantitative labor market information collected for the study, the OC COE released in-depth recommendations that were included in nine profiles—eight sector profiles and one executive summary profile, at the end of 2019. The recommendations stem from regional priorities and are summarized below. All Sectors – Executive Summary
1. To increase CE student completion, colleges should consider re-working overdesigned programs or move those programs to enhanced noncredit. College faculty, deans, and RDEEs should review program and course data to determine barriers that prevent students from successfully completing a program (e.g., challenging introductory courses and differing pre-requisites across colleges for higher level courses) and invest SWP funds accordingly.
2. To better understand student employment outcomes, colleges could invest more resources to promote the use of the CTE Outcomes Survey (CTEOS). By informing faculty and students about the CTEOS and its purpose, it is possible for the region to increase its response return rate. This information would help colleges better understand outcomes for all students and provide valuable data on students who leave a program before completing a degree or certificate.
3. Community colleges should leverage existing regional SWP projects and other initiatives to focus finite resources on effective strategies benefiting students. For instance, colleges could collaborate with the six RDEEs to connect with employers and determine which equipment is most important to the training of future employees. Additionally, colleges could collaborate with the OC Careers in Education Pathway Collaborative project, which is part of the Teacher Preparation Pipeline initiative, to provide professional development for newly hired faculty.
4. To determine if the region’s community colleges are training for the right knowledge, skills, and abilities (KSAs), RDEEs should convene employers in a “regional advisory group” where employers can review program KSAs, provide feedback, and validate the KSAs’ relevance in the labor market for each priority sector.

52 | P a g e
Priority Sectors Advanced Manufacturing
1. To increase student completion rates, colleges could re-work overdesigned programs or consider moving these programs to enhanced noncredit as a way to satisfy student needs for short-term programs. Noncredit certificates are included in SWP and Student Success metrics, and Vision for Success.
2. Employers tend to hire students before they complete their programs, as long as students have foundational skills needed for a job. Industry-recognized certifications are another way to demonstrate skill attainment. Colleges could explore offering courses that will allow students to obtain certifications such as Siemens Programmable Logic Controller (PLC), Level One Mechatronics, and SOLIDWORKS, all of which can be applied in both the Advanced Manufacturing, and Energy, Construction & Utilities sectors.
3. To address the fragmentation of Advanced Manufacturing programs, administrators, faculty, and counselors could be convened to discuss articulation for courses and programs that have similar goals or learning outcomes to create a more seamless pathway and increase program completion.
Advanced Transportation & Logistics
1. Orange County community colleges could offer similar training or re-training programs to reduce job loss from automation.
2. Common career paths and job titles within occupations should be defined and shared with community college counselors so they can advise students on how to advance their careers and earn higher wages.
3. Identify the most effective training technology/platforms and concentrate finite resources in areas that will be the most effective in supporting student success.
Business & Entrepreneurship
1. Focus regional and local efforts on helping undecided students narrow their interests so that they have a clear path to progression and program completion.
2. To increase completion numbers, review program curriculum and identify programs that may be overdesigned, i.e., programs that offer more courses than what may be needed in the labor market and that could be shortened, yet still prepare students for small companies’ needs.
3. To increase enrollments and help students focus on specific careers, offer dual-enrollment courses at high schools.
4. To better understand industry-desired entrepreneurship skills and quantify existing entrepreneurship programs, the OC COE could generate a list of associated regional TOP codes related to entrepreneurship that could be used for regional alignment.
Energy, Construction & Utilities 1. In conjunction with the Advanced Manufacturing RDEE and faculty, develop cross-sector
training programs that provide a diverse skill set that can be applied toward occupations in both sectors.

53 | P a g e
2. To increase completion numbers, review curriculum and identify programs that may be overdesigned and consider using the CTEOS to better understand student completion, employment status, and change in earnings.
3. To better understand noncredit reporting, faculty and administrators could work with their Institutional Effectiveness/Research offices to see how noncredit information is collected locally and reported to the CCCCO. More accurate reporting could increase both the sector metrics and the amount of funding colleges receive while also helping the OC COE more accurately measure supply for each occupation.
4. Explore K-12 partnerships, dual enrollment agreements, and targeted marketing to attract younger students and develop pathways between K-12 and the community colleges.
Health
1. To increase student clinical placement, hire a regional clinical placement coordinator to work with all Orange County community colleges and employers to help place students, or use funding to support this work at individual colleges.
2. To help students move into occupations with higher wages, consider creating noncredit programs for high-demand, low-wage occupations and create a noncredit-to-credit pipeline so students have a pathway to additional education and experience that will help them earn better wages and advance their careers. Common career paths and job titles within occupations should be defined and shared with community college counselors so they can advise students on how their earnings potential changes with additional education and experience.
3. To better understand and quantify the supply of qualified students from programs at all educational institutions in Orange County, the OC COE could identify existing health programs and generate a complete list of training providers for related occupations.
ICT/Digital Media
1. The ICT/Digital Media RDEE and faculty could work with employers to determine high-value certifications, and colleges could consider providing students with vouchers to take certification exams after they complete a degree or certificate.
2. Convene employers, faculty, and the RDEE to identify emerging areas in need of qualified workers; identify the skills, certifications, and education employers require; and re-tool or develop new programs.
3. Explore establishing college-specific specializations that build upon already existing infrastructure, personnel, and resources. Faculty at each college could work with each other to establish articulation agreements and clear pathways for students. For example, students could earn a foundational IT skills certificate at one college, then continue taking courses at another college that specializes in cybersecurity.

54 | P a g e
Life Sciences/Biotech 1. To break down the bachelor’s degree requirement that is common among employers,
the Life Sciences/Biotech RDEE and internship coordinators at each college could work with employers to show how the community colleges are preparing students to meet demand for qualified workers.
2. To raise awareness, attract younger students to community college programs, and increase enrollments in this sector, colleges could promote programs to targeted audiences such as K-12 students, career counselors, and K-12 partners.
Retail, Hospitality & Tourism 1. To increase completion rates, colleges could focus on counseling efforts early in a
student’s course progression to help them understand the value of a degree or certificate. Colleges could also add a work experience component toward the end of their programs, such as an internship or work-based learning opportunity, to incentivize degree or certificate completion.
2. Colleges could create noncredit programs for high-demand, low-wage occupations, and a noncredit-to-credit pipeline so students can progress to careers with higher wages.
3. Define common career paths and job titles within occupations and share these with community college counselors so they can advise students on how their earnings potential changes with additional education and experience.

55 | P a g e
Conclusion/SWP Lessons Learned Through a coordinated effort, the nine community colleges and stand-alone continuing education (noncredit) center in Orange County have worked collaboratively through SWP funded projects to respond to workforce needs in the subregion and the larger Los Angeles/Orange County region to develop, strengthen, and enrich CE programs that lead to in-demand jobs paying at or above a living wage. Since 2017, this work has expanded to involve collaboration with K-12 districts to align and strengthen K-14 CE pathways that connect students to career opportunities that support upward social and economic mobility in industries that help fuel a vibrant and evolving regional economy. As a result, eight CCCCO sectors that power Orange County’s economy and require a strong pool of skilled workers were selected as priorities for the subregion: Advanced Manufacturing, Advanced Transportation & Logistics, Business & Entrepreneurship, Energy, Construction & Utilities, Health, ICT/Digital Media, Life Sciences/Biotech, and Retail, Hospitality & Tourism. Accomplishments, Challenges & Lessons Learned A major accomplishment in the subregion has been the level of regional alignment achieved through extensive stakeholder engagement, collaboration among K-12 education providers, business organizations, and industry and workforce development partners, as well as the effective leveraging of regional investments to maximize results. One example of success on this front has been the regional “Future BUILT” branding and marketing campaign, which was achieved by aligning a regional investment with local dollars that the community colleges received through the SWP. Community college partners recognized the need to amplify messaging about the benefits of CE to reach a wider audience and to centralize information about CE opportunities in Orange County, and this became a regional priority. As a result of this alignment, enrollment has increased in for-credit and noncredit CE classes, while general enrollment has declined in Orange County.
The timing of the release of SWP funds poses a challenge for the subregion and has required careful planning. In past years, the timing of the funding allocation announcement has curtailed planning activities and has reduced the timeframe for colleges to carry out projects to less than 24 months. This shorter timeframe is exacerbated by hiring constraints, which can also impact the start dates of projects. A set yearly date for release of SWP funds, both base and incentive, from the Chancellor’s Office could ameliorate the situation.
Another challenge is the perception of SWP funding among district fiscal offices, which tend to view SWP funding as if it were grant funding rather than a fairly consistent yearly allocation. This can impact a district’s willingness to allocate funding toward hiring positions necessary for SWP project activities.
The ability to use SWP funds for student internships would advance efforts to strengthen workforce readiness and job placement efforts by the community colleges and adult education

56 | P a g e
providers. Unfortunately, this is perceived as a gift of public funds, and thus SWP funding cannot be used to pay students.
An important lesson learned over the past four years has been the need to reinforce the idea that the success of SWP investments hinges upon alignment at local and regional levels. Without a commitment to the cooperation required to achieve alignment, participants can become siloed, which can lead to funds not being invested effectively or efficiently. Over the past four years, collaboration among Orange County education and training providers has not only facilitated alignment but has created momentum that has resulted in many successful endeavors and that continues to propel the subregion forward.
Ongoing Priorities With so many meaningful achievements accomplished through mindful, comprehensive strategies and widespread engagement related to Orange County’s eight priority sectors, a new focus will be on programs and investments that can be leveraged beyond the region. One example is Program Finder, an online career development tool that links occupational areas of interest with community college CE programs. Program Finder was conceptualized and developed by the OC consortium and has received interest from other regions in the state that would like to create their own Program Finders. We believe we are being good stewards of SWP funds if we are able to capitalize on SWP investments and use them as best practices that other regions can replicate.
Employer engagement is another priority in the sense that educational and training providers, particularly the community colleges, could do a better job of communicating with employers to make it easier for them to post jobs and hire students. A smoother, more centralized job posting system linking employers and Orange County’s community colleges would improve access to the hiring pool of trained, talented, and workforce ready students. Through a centralized system, employers would be able to more readily access local talent, and students would have a clear avenue to access and apply for new job opportunities.
Another priority is focusing on student enrollment, an area that will likely remain critical for community colleges due to the rapid pace of technological advances affecting educational delivery. Educational delivery was changing even before the pandemic as a result of increased competition from non-profit and for-profit postsecondary institutions, both in state and out of state. The community colleges will need to continue to be proactive and committed to evolving and innovating to remain relevant for students, employers, and the community.

57 | P a g e
Appendix A: K12 SWP Project Investments
Exhibit A1. Round 2 K12 SWP investments
Project Name Lead Agency Lead Agency Type
Award Amount
Biotechnology and Cybersecurity in CTEp
Central Orange County CTE Partnership (CTEp)
ROC/P* $1,362,519
Business and Entrepreneurship in Orange County OCDE County Office
of Education $1,492,344
Regional K12 CTE Marketing & Branding OCDE County Office of Education $497,374
Maximizing Access to College and Career Santa Ana USD Unified School
District $1,517,332
Strengthening K-12 Career Pathways Through Vertical Alignment Brea-Olinda USD Unified School
District $547,374
Career Readiness Initiative: Equipping Students Today for the Jobs of Tomorrow
North Orange County ROP ROC/P $1,628,379
Automation, New Technologies and Opportunities in OC OCDE County Office
of Education $1,742,374
Finding, Personalizing and Planning Early PATHways to College and Career through Personal, Educational and Professional Discovery
Fullerton Elementary
Elementary School District $297,374
Equity, Access, Engagement, and Achievement
Garden Grove USD
Unified School District $1,397,374
Health and Medical Technology, Student Transitions and Employment Success
College and Career Advantage ROC/P $487,374
Building a Skilled Workforce Through Work Based Learning Coastline ROP ROC/P $918,939
TOTAL
$11,888,757 *ROC/P denotes Regional Occupation Center/Program

58 | P a g e
Appendix B: Colleges with Programs Related to the 12 CCCCO Sectors Exhibit B1. Orange County community colleges with programs related to each CCCCO sector
CCCCO Sector Community College Advanced Manufacturing COASTLINE
FULLERTON GOLDEN WEST IRVINE VALLEY NORTH ORANGE ADULT ORANGE COAST SADDLEBACK SANTA ANA SANTIAGO CANYON
Advanced Transportation & Logistics
COASTLINE CYPRESS FULLERTON GOLDEN WEST ORANGE COAST SADDLEBACK SANTA ANA SANTIAGO CANYON
Agriculture, Water & Environmental Technologies
FULLERTON GOLDEN WEST IRVINE VALLEY ORANGE COAST SADDLEBACK SANTIAGO CANYON
Business & Entrepreneurship COASTLINE CYPRESS FULLERTON GOLDEN WEST IRVINE VALLEY NORTH ORANGE ADULT ORANGE COAST SADDLEBACK SANTA ANA SANTIAGO CANYON
Education & Human Services COASTLINE CYPRESS FULLERTON GOLDEN WEST IRVINE VALLEY NORTH ORANGE ADULT ORANGE COAST SADDLEBACK SANTA ANA SANTIAGO CANYON

59 | P a g e
CCCCO Sector Community College Energy, Construction & Utilities COASTLINE
CYPRESS FULLERTON GOLDEN WEST NORTH ORANGE ADULT ORANGE COAST SADDLEBACK SANTA ANA SANTIAGO CANYON
Global Trade FULLERTON GOLDEN WEST SADDLEBACK SANTA ANA
Health CYPRESS FULLERTON GOLDEN WEST IRVINE VALLEY NORTH ORANGE ADULT ORANGE COAST SADDLEBACK SANTA ANA SANTIAGO CANYON
ICT/Digital Media COASTLINE CYPRESS FULLERTON GOLDEN WEST IRVINE VALLEY NORTH ORANGE ADULT ORANGE COAST SADDLEBACK SANTA ANA SANTIAGO CANYON
Life Sciences/Biotech FULLERTON IRVINE VALLEY SANTA ANA SANTIAGO CANYON
Public Safety
COASTLINE CYPRESS FULLERTON GOLDEN WEST IRVINE VALLEY SADDLEBACK SANTA ANA
Retail, Hospitality & Tourism COASTLINE CYPRESS FULLERTON GOLDEN WEST IRVINE VALLEY ORANGE COAST SADDLEBACK SANTA ANA SANTIAGO CANYON

60 | P a g e
Appendix C: Annual Openings and Wages for Top Priority Sector Middle-skill Occupations
Exhibit C1. Entry-level and median wages for top Advanced Manufacturing middle-skill jobs
SOC Code SOC (Occupational) Title Demand
(Annual Openings) Entry-level Wage (25th Percentile) Median Wage
49-9071 First-Line Supervisors of Production and Operating Workers 620 $19.57 $26.77
51-4041 Industrial Machinery Mechanics 207 $19.18 $24.48
51-4121 Electrical and Electronics Engineering Technicians 198 $18.92 $26.08
51-5112 Structural Iron and Steel Workers 184 $25.22 $35.91 51-4011 Industrial Production Managers 169 $34.19 $46.47 47-2211 Civil Engineering Technicians 125 $24.28 $31.56
51-9195 Electrical and Electronics Repairers, Commercial and Industrial Equipment 88 $21.22 $25.36
17-3029 Engineering Technicians, Except Drafters, All Other 87 $21.64 $28.24
49-3011 Aircraft Mechanics and Service Technicians 84 $24.22 $29.94
51-4012 Computer Numerically Controlled Machine Tool Programmers, Metal and Plastic
61 $20.34 $26.75
17-3013 Mechanical Drafters 56 $22.58 $27.61
Exhibit C2. Entry-level and median wages for top Advanced Transportation & Logistics middle-skill jobs
SOC Code SOC (Occupational) Title Demand
(Annual Openings) Entry-level Wage (25th Percentile) Median Wage
49-1011 First-Line Supervisors of Mechanics, Installers, and Repairers
357 $28.33 $36.67
13-1081 Logisticians 209 $30.89 $40.09
11-3071 Transportation, Storage, and Distribution Managers
119 $30.96 $47.98
43-5011 Cargo and Freight Agents 107 $17.88 $22.48
49-3042 Mobile Heavy Equipment Mechanics, Except Engines
102 $21.78 $28.11

61 | P a g e
Exhibit C3. Entry-level and median wages for top Business & Entrepreneurship middle-skill jobs
SOC Code SOC (Occupational) Title Demand
(Annual Openings) Entry-level Wage (25th Percentile) Median Wage
43-3031 Bookkeeping, Accounting, and Auditing Clerks 2,383 $17.61 $22.05
41-3099 Sales Representatives, Services, All Other 2,009 $18.32 $26.33
43-1011 First-Line Supervisors of Office and Administrative Support Workers 1,986 $22.80 $28.72
41-3021 Insurance Sales Agents 1,216 $17.50 $23.63 13-2072 Loan Officers 844 $18.53 $30.89
43-6011 Executive Secretaries and Executive Administrative Assistants 779 $25.93 $31.80
41-9022 Real Estate Sales Agents 648 $19.12 $20.16 11-3011 Administrative Services Managers 471 $41.40 $55.21
11-9141 Property, Real Estate, and Community Association Managers 455 $20.64 $26.36
13-1151 Training and Development Specialists 346 $24.29 $32.97 41-9099 Sales and Related Workers, All Other 311 $19.99 $24.56
13-1031 Claims Adjusters, Examiners, and Investigators 289 $23.82 $32.31
43-3051 Payroll and Timekeeping Clerks 274 $20.36 $25.40 13-2082 Tax Preparers 243 $17.99 $25.14 41-9021 Real Estate Brokers 212 $22.04 $24.89 41-3011 Advertising Sales Agents 211 $23.27 $27.89
13-1141 Compensation, Benefits, and Job Analysis Specialists 83 $25.32 $33.35
13-2021 Appraisers and Assessors of Real Estate 79 $22.50 $27.47 13-2071 Credit Counselors 66 $20.85 $24.10 43-4011 Brokerage Clerks 65 $22.19 $26.39
Exhibit C4. Entry-level and median wages for top Energy, Construction & Utilities middle-skill jobs
SOC Code SOC (Occupational) Title Demand
(Annual Openings) Entry-level Wage (25th Percentile) Median Wage
47-2111 Electricians 1,178 $17.93 $26.22
47-1011 First-Line Supervisors of Construction Trades and Extraction Workers
1,044 $26.88 $36.62
47-2152 Plumbers, Pipefitters, and Steamfitters 955 $17.52 $24.89 11-9021 Construction Managers 543 $20.89 $41.93
49-9021 Heating, Air Conditioning, and Refrigeration Mechanics and Installers
418 $17.57 $23.85
47-2073 Operating Engineers and Other Construction Equipment Operators
320 $26.93 $36.64
17-3011 Architectural and Civil Drafters 174 $22.65 $27.92 47-4011 Construction and Building Inspectors 135 $32.54 $39.80 47-2121 Glaziers 131 $20.70 $27.48

62 | P a g e
Exhibit C5. Entry-level and median wages for top Health middle-skill jobs
SOC Code SOC (Occupational) Title Demand
(Annual Openings) Entry-level Wage (25th Percentile) Median Wage
29-1141 Registered Nurses 1,783 $32.88 $42.47
29-2061 Licensed Practical and Licensed Vocational Nurses
652 $20.63 $25.57
29-2021 Dental Hygienists 235 $29.86 $45.68
29-2018 Clinical Laboratory Technologists and Technicians
234 $19.29 $27.21
31-9099 Healthcare Support Workers, All Other 156 $18.09 $21.23 31-2021 Physical Therapist Assistants 155 $21.86 $29.34 29-1126 Respiratory Therapists 144 $29.49 $35.32 29-2034 Radiologic Technologists 102 $31.19 $38.54
33-1099 First-Line Supervisors of Protective Service Workers, All Other
87 $23.33 $27.51
29-2055 Surgical Technologists 83 $22.48 $27.53 31-2011 Occupational Therapy Assistants 79 $18.42 $27.70 21-1094 Community Health Workers 54 $19.79 $23.58
Exhibit C6. Entry-level and median wages for top ICT/Digital Media middle-skill jobs
SOC Code SOC (Occupational) Title Demand
(Annual Openings) Entry-level Wage (25th Percentile) Median Wage
15-1151 Computer User Support Specialists 765 $21.70 $26.86 15-1199 Computer Occupations, All Other 408 $27.90 $40.40 27-1024 Graphic Designers 400 $18.37 $21.57
49-2022 Telecommunications Equipment Installers and Repairers, Except Line Installers
352 $20.62 $26.45
15-1142 Network and Computer Systems Administrators 307 $32.76 $42.51
15-1134 Web Developers 236 $21.85 $27.91 15-1152 Computer Network Support Specialists 178 $25.42 $34.04
49-9052 Telecommunications Line Installers and Repairers 166 $20.54 $28.18
27-2012 Producers and Directors 128 $23.40 $29.08 15-1143 Computer Network Architects 127 $38.56 $51.61 27-1021 Commercial and Industrial Designers 56 $24.45 $29.93 17-3031 Surveying and Mapping Technicians 51 $26.47 $33.04

63 | P a g e
Exhibit C7. Entry-level and median wages for top Life Sciences/Biotech middle-skill jobs
SOC Code SOC (Occupational) Title Demand
(Annual Openings) Entry-level Wage (25th Percentile) Median Wage
19-4099 Life, Physical, and Social Science Technicians, All Other
96 $17.45 $23.32
49-9062 Medical Equipment Repairers 55 $18.31 $22.61 51-9082 Medical Appliance Technicians 28 $18.56 $24.52
Exhibit C8. Entry-level and median wages for top Retail, Hospitality & Tourism middle-skill jobs
SOC Code SOC (Occupational) Title Demand
(Annual Openings) Entry-level Wage (25th Percentile) Median Wage
39-9031 Fitness Trainers and Aerobics Instructors 739 $17.45 $20.97 27-2011 Actors 133 $20.91 $22.94 27-1022 Fashion Designers 72 $22.61 $29.41

64 | P a g e
Appendix D: LaunchBoard Metrics for Orange County’s Priority Sectors D1. Advanced Manufacturing metrics
ADVANCED MANUFACTURING 2015-16 2016-17 2017-18 2018-19
Strong Workforce Program Students 3,675 3,739 3,923 3,737 SWP Students Who Earned 9 or More Career Education Units in the District in a Single Year 28% 28% 27% 25% SWP Students Who Earned a Degree or Certificate or Attained Apprenticeship Journey Status 310 301 355 382 Students Who Attained a Noncredit Workforce Milestone in a Single Year 38% 38% 42% 50% SWP Students Who Transferred to a Four-Year Postsecondary Institution 112 133 149 Median Annual Earnings for SWP Exiting Students $40,239 $40,232 $41,820 Median Change in Earnings for SWP Exiting Students 27% 28% 37% SWP Exiting Students Who Attained the Living Wage 54% 55% 57% SWP Students with a Job Closely Related to Their Field of Study 75% 76%
D2. Advanced Transportation & Logistics metrics ADVANCED TRANSPORTATION 2015-16 2016-17 2017-18 2018-19
Strong Workforce Program Students 3,244 3,174 3,174 2,965 SWP Students Who Earned 9 or More Career Education Units in the District in a Single Year 31% 29% 31% 36% SWP Students Who Earned a Degree or Certificate or Attained Apprenticeship Journey Status 277 258 301 399 Students Who Attained a Noncredit Workforce Milestone in a Single Year SWP Students Who Transferred to a Four-Year Postsecondary Institution 51 39 38 Median Annual Earnings for SWP Exiting Students $31,556 $29,858 $36,424 Median Change in Earnings for SWP Exiting Students 53% 58% 73% SWP Exiting Students Who Attained the Living Wage 41% 37% 50% SWP Students with a Job Closely Related to Their Field of Study 64% 68%

65 | P a g e
D3. Business & Entrepreneurship metrics BUSINESS & ENTREPRENEURSHIP 2015-16 2016-17 2017-18 2018-19
Strong Workforce Program Students 32,804 31,438 30,945 30,046 SWP Students Who Earned 9 or More Career Education Units in the District in a Single Year 22% 22% 22% 23% SWP Students Who Earned a Degree or Certificate or Attained Apprenticeship Journey Status 2,773 2,924 2,908 3,310
Students Who Attained a Noncredit Workforce Milestone in a Single Year 15% 15% 21% 28% SWP Students Who Transferred to a Four-Year Postsecondary Institution 2,827 2,825 2,685
Median Annual Earnings for SWP Exiting Students $33,518 $34,341 $33,506 Median Change in Earnings for SWP Exiting Students 31% 32% 30% SWP Exiting Students Who Attained the Living Wage 45% 47% 45% SWP Students with a Job Closely Related to Their Field of Study 68% 71%
D4. Energy, Construction & Utilities metrics ENERGY, CONSTRUCTION & UTILITIES 2015-16 2016-17 2017-18 2018-19
Strong Workforce Program Students 7,829 7,909 8,620 7,918 SWP Students Who Earned 9 or More Career Education Units in the District in a Single Year 18% 16% 19% 16% SWP Students Who Earned a Degree or Certificate or Attained Apprenticeship Journey Status 515 512 534 647 Students Who Attained a Noncredit Workforce Milestone in a Single Year 29% 30% 40% 42% SWP Students Who Transferred to a Four-Year Postsecondary Institution 199 208 198 Median Annual Earnings for SWP Exiting Students $53,364 $51,701 $55,998 Median Change in Earnings for SWP Exiting Students 42% 47% 55% SWP Exiting Students Who Attained the Living Wage 68% 67% 72% SWP Students with a Job Closely Related to Their Field of Study 84% 81%

66 | P a g e
D5. Health metrics HEALTH 2015-16 2016-17 2017-18 2018-19
Strong Workforce Program Students 17,883 18,089 18,684 19,393 SWP Students Who Earned 9 or More Career Education Units in the District in a Single Year 22% 21% 21% 20% SWP Students Who Earned a Degree or Certificate or Attained Apprenticeship Journey Status 1,248 1,303 1,368 1,744
Students Who Attained a Noncredit Workforce Milestone in a Single Year 47% 70% 67% 67% SWP Students Who Transferred to a Four-Year Postsecondary Institution 1,032 1,015 1,015
Median Annual Earnings for SWP Exiting Students $27,163 $28,697 $27,624 Median Change in Earnings for SWP Exiting Students 39% 38% 38% SWP Exiting Students Who Attained the Living Wage 33% 35% 33% SWP Students with a Job Closely Related to Their Field of Study 78% 77%
D6. ICT/Digital Media metrics ICT/DIGITAL MEDIA 2015-16 2016-17 2017-18 2018-19
Strong Workforce Program Students 34,959 29,957 29,459 28,592 SWP Students Who Earned 9 or More Career Education Units in the District in a Single Year 16% 15% 16% 17% SWP Students Who Earned a Degree or Certificate or Attained Apprenticeship Journey Status 612 680 767 908 Students Who Attained a Noncredit Workforce Milestone in a Single Year 41% 56% 59% 58% SWP Students Who Transferred to a Four-Year Postsecondary Institution 2,428 2,146 1,972
Median Annual Earnings for SWP Exiting Students $28,781 $30,228 $30,276 Median Change in Earnings for SWP Exiting Students 26% 25% 21% SWP Exiting Students Who Attained the Living Wage 38% 40% 40% SWP Students with a Job Closely Related to Their Field of Study 59% 61%

67 | P a g e
D7. Life sciences/Biotech metrics LIFE SCIENCES/BIOTECH 2015-16 2016-17 2017-18 2018-19
Strong Workforce Program Students 154 255 279 360 SWP Students Who Earned 9 or More Career Education Units in the District in a Single Year 9% 17% 14% SWP Students Who Earned a Degree or Certificate or Attained Apprenticeship Journey Status 11 29 Students Who Attained a Noncredit Workforce Milestone in a Single Year SWP Students Who Transferred to a Four-Year Postsecondary Institution 16 23 Median Annual Earnings for SWP Exiting Students $18,830 $36,381 $31,488 Median Change in Earnings for SWP Exiting Students 26% 47% SWP Exiting Students Who Attained the Living Wage 49% 40% SWP Students with a Job Closely Related to Their Field of Study
D8. Retail, Hospitality & Tourism metrics RETAIL, HOSPITALITY & TOUISM 2015-16 2016-17 2017-18 2018-19
Strong Workforce Program Students 5,893 5,771 5,998 6,030 SWP Students Who Earned 9 or More Career Education Units in the District in a Single Year 28% 26% 25% 27% SWP Students Who Earned a Degree or Certificate or Attained Apprenticeship Journey Status 229 210 239 315 Students Who Attained a Noncredit Workforce Milestone in a Single Year 43% 59% 67% 66% SWP Students Who Transferred to a Four-Year Postsecondary Institution 218 210 201 Median Annual Earnings for SWP Exiting Students $25,564 $25,727 $27,012 Median Change in Earnings for SWP Exiting Students 38% 38% 38% SWP Exiting Students Who Attained the Living Wage 30% 29% 30% SWP Students with a Job Closely Related to Their Field of Study 70% 63%