Embed Size (px)
Citation preview

2020 Vegetable Trial Report
January 2021
MP-164
Department of Horticulture and Landscape Architecture Division of Agricultural Sciences and Natural Resources Oklahoma State University

ii
The Department of Horticulture and Landscape Architecture, cooperating departments and experimental farms conducted a series of experiments on field vegetable production. Data were recorded on a majority of aspects of each study, and can include crop culture, crop responses and yield data. This report presents those data, thus providing up-to-date information on field research completed in Oklahoma during 2018.
Small differences should not be overemphasized. Least significant differences (LSD) values are shown at the bottom of columns or are given as Duncan’s letter groupings in most tables. Unless two values in a column differ by at least the LSD shown, or by the Duncan’s grouping, little confidence can be placed in the superiority of one treatment over another. When trade names are used, no endorsement of that product or criticism of similar products not named is intended.
Contributors
Lynn Brandenberger, [email protected], Lynda Carrier, [email protected], Mathew Beartrack, Department of Horticulture and Landscape Architecture, Oklahoma State University, Stillwater. Bizhen Hu, [email protected], Department of Horticulture and Landscape Architecture, Oklahoma State University, Stillwater.
Josh Massey, [email protected], Department of Field and Research Service Unit, Cimarron Valley Research Station, Perkins Jim Shrefler, [email protected], Oklahoma Cooperative Extension Service, Department of Horticulture and Landscape Architecture. Editor Lynn Brandenberger Department of Horticulture and Landscape Architecture, Oklahoma State University, Stillwater Cover Design Gayle Hiner Agriculture Communications Services, Oklahoma State University, Stillwater

iii
Seed Sources
Dewitt Seeds P.O. Box 5556 Norman, OK 73070 www.dewittseed.com
Seedway/Bejo 99 Industrial Rd. Elizabethtown, PA 17022 www.seedway.com
Johnny’s Selected Seeds 955 Benton Avenue https://www.johnnyseeds.com/
Syngenta Seeds, Inc. (Rogers) P.O. Box 4188 Boise, ID 83711-4188 www.syngenta.com
University of Florida Tomato breeding PO Box 110690
Gainesville, FL 32611
https://hos.ifas.ufl.edu/public/kleeweb/index.html
Territorial Seed Co. P.O. Box 158 Cottage Grove, OR 97424 www.territorialseed.com
Baker Creek heirloom Seeds 2278 Baker Creek Rd. Mansfield, MO 65704 www.rareseeds.com
Paramount Seeds 7998 SW Jack James Dr, Stuart, FL 34997. (772) 221-0653, www.paramountseeds.com
Rupp Seeds, Inc. 17919 County Road B Wauseon, OH 43567 800-700-1199 https://www.ruppseeds.com/vegetables/home
DeRuiter Seeds https://www.deruiterseeds.com/en-ca/tomato/beef.html

4
Table of Contents Table of Contents ............................................................................... 4
Crop Culture ....................................................................................... 5
Fresh Market Tomato Field Trial....................................................... 6
Fresh Market Brussel Sprouts Trial ................................................ 12
Bio-Intensive Cover Cropping for Soil Improvement ....................... 16
Bio-Intensive Cover Cropping for Vegetable Crop Production ........ 21
Sweet Potato Observational Trials ................................................. 24
Choctaw Squash Planting Density Trial .......................................... 28
Pest Management ............................................................................ 31
Row Cover Materials for Insect Pest Exclusion in Yellow Squash .. 32
Effects of Row Cover Removal Timing in Yellow Squash ............... 35
SI (METRIC) CONVERSION FACTORS ........................................ 37
Location of Oklahoma Agricultural Experiment Stations ................. 38

5
Crop Culture

6
Fresh Market Tomato Field Trial
Lynda Carrier, Matt Beartrack, Lynn Brandenberger, Bizhen Hu, Niels Maness, & Donna Chrz
Oklahoma State University Stillwater, OK
Introduction and Objectives: Tomato (Lycopersicon esculentum) originated in Peru and Ecuador. It is a warm season crop and a member of the Solanaceae family—also known as the nightshade family. Although introduced to the U.S. in the early 18th century tomatoes did not become popular in the United States until the later part of the 19th century. The objectives for this trial were to examine varieties used primarily for greenhouse production and compare yield, lycopene, and taste differences in those varieties grown in three different growing environments: Greenhouse; High tunnel; Field grown. Field production of tomatoes still dominates the market, however use of season-extension production systems like greenhouses and high tunnels are increasing to meet market demands of readily available tasteful tomatoes. Both greenhouse and high tunnel production are thought to improve yields and nutritional quality with fewer inputs compared to field production by allowing growers to avoid Oklahoma’s unpredictable weather. The field research project evaluated cultivars of two different types of tomato (slicing and cherry) using the same cultivars trialed in each system. Testing procedures will determine quality characteristics not only yield to allow better marketing of these crops. The results of the field study are one part of the three part study, this part is focusing on field production only. The outcomes include a taste panel, lycopene results and field harvest data. Methods: Tomatoes were direct seeded in the greenhouse into soilless media [Sungro Professional Growing Mix] in the finish containers [Landmark plastic; 4 x 9 (36 cell) six-packs] on 3/9/20. Rows in the field trial had the winter cover crop mown and then were strip-tilled with a tractor powered rototiller following the application of approximately 1 ton per acre of spent mushroom compost. Free-standing raised beds were formed and buried drip tape was installed using a Rain-Flo (Model 2550) single-row bed shaper on the strip-tilled rows on 4/20/20. Tomatoes were transplanted into all plots on 4/21/20 with in-row spacing at two feet apart with a total of six plants per treatment plot. Beds were spaced 10’ apart from the center of each bed, plots were 12’ long. Immediately following transplanting, a preemergence herbicide (Prowl H2O at 2 pints/acre rate) was applied to the soil surface for weed control. This was followed by the application of clean-straw mulch on 5/27/20 for weed control and soil temperature management. Tomatoes were supported using the stake and weave support system with baling twine and metal pipes beginning on 4/23/20. An equivalent of 147-45-30 lbs. per acre of N, P2O5, and K2O was applied during the entire trial period to meet crop fertility needs according to soil testing results. Insect pests included tobacco horn worm which were treated with Permethrin twice during the growing season. The experimental design included a randomized block design with three replications. Harvest began on 6/15/20 and continued until 8/24/20, a total of 12 harvests were recorded. Fruit were determined as marketable or culls, and those in both categories were counted, then weighed for each plot. Tomatoes were divided into 2 groups; Cherry and slicer for statistical purposes (Table 1). There were 3 cherry tomato varieties and 6 slicer varieties. A taste panel was organized and carried out on 8/6/20 with available fruit from each of the three growing locations (field, high tunnel, and greenhouse). Tomatoes were cut into small bite sized pieces and placed on a plate divided into nine sections. Each plate was given a specific number as tomato piece placement was randomized on each individual plate. The varieties were not separated by type. Participants were asked to rate them on a 0-10 scale. Most desirable taste=10 and a 0 would be undesirable flavor.

7
Results: Taste panelists included 22 participants on 8/6/20. Several varieties from the greenhouse study were not included due to a lack of fruit available from that site. Both the field and high tunnel sites included six varieties with the field site including an additional three varieties that had been added to that trial (Table 2). Favorita an indeterminate cherry was rated highest among varieties included from both the field and high tunnel sites. Taste ratings were 6.3, 7.0, and 4.1 respectively, for Favorita from the field, high tunnel, and greenhouse sites. Ratings from the field site ranged from 4.8 (BHN 964) to 6.3 (Favorita), ratings from the high tunnel site ranged from 4.1 (BHN 964) to 7.0 (Favorita), ratings from the greenhouse were 4.1 for both Favorita and BHN 268. Lycopene per gram (µg/gm) of tomato fruit did not vary between cultivars of cherry tomatoes (Table 3). Although there were no differences on a per gram basis there were differences in the amount of lycopene per fruit due to a variance in fruit sizes. BHN 268 had the highest amount of lycopene per fruit with 724 µg/fruit of lycopene while Sakura and Favorita had 469 and 282 µg/fruit, respectfully. Lycopene varied significantly for slicer tomatoes both on µg/gm and µg/fruit, (Table 4). Garden Gem, Garden Treasure, and W Hybrid had 51, 59, and 52 µg/gm of lycopene, respectfully, and BHN 964 recorded 45 µg/gm. Lycopene per fruit was highest for Garden Treasure which recorded 10,786 µg/fruit and W Hybrid and BHN 964 which had per fruit levels of lycopene of 8,086 and 7,346 µg/fruit, respectfully. Differences occurred for all aspects of marketable yield for Cherry tomatoes (Table 5.). Number of marketable fruit varied from a low of 1,872 (BHN 268) to a high of 4,326 (Favorita) with 2,924 marketable fruit recorded for Sakura. All Cherry varieties produced fruit during the early market period which was the first 4 weeks of harvest. Both BHN 268 and Sakura produced 20 lbs. of fruit during the first four weeks of harvest while Favorita produced 13 lbs. during that same period. Overall marketable yield reflected this same trend with both BHN 268 and Sakura recording higher yields, 81 and 78 lbs. per plot, respectfully and Favorita recording 65 lbs. Yield of cull fruit was lowest for Favorita and Sakura at three pounds each and highest for BHN 268 at seven pounds. BHN 268 had cull fruit from both insect damage and fruit splitting, as did Favorita and Sakura which recorded fewer. Total yields (marketable + culls) were 88, 68, and 81 lbs., respectfully, for BHN 268, Favorita, and Sakura. Average fruit size was highest for BHN 268 with 0.06 lbs. per fruit and lower for both Favorita and Sakura at 0.02 and 0.03 lbs., respectfully. The slicer tomatoes had differences in each category of yield and fruit characteristics (Table 6). Garden Gem had the highest number of marketable fruit recording 588 fruit compared to other varieties which ranged from 116 (BHN 964) to 237 (Geronimo). Early market yields were highest for Garden Gem which recorded 24 lbs. of marketable fruit during the first four weeks of harvest while W Hybrid the second highest early yielder had 14 lbs. of fruit harvested during this period. Highest marketable yields were recorded for Geronimo (82 lbs. per plot) and Garden Gem (66 lbs. per plot). Cull yields were lowest for Garden Gem and Geronimo with cull yields of 6 and 11 lbs. per plot, respectfully. Causes of culling varied considerably and ranged from split fruit to insect and animal damage, to some fruit rots. Total yield which included both marketable and cull fruit was highest for Geronimo and Trust which had 93 and 85 lbs. of total fruit per plot, respectfully, although Trust recorded the highest amount of cull fruit (34 lbs.). Average fruit size ranged from a low of 0.11 lbs. per fruit (Garden Gem) to a high of 0.43 and 0.40 lbs. per fruit (BHN 964 and Garden Treasure, respectfully). Other varieties had average fruit sizes that ranged between 0.29 to 0.35 lbs. per fruit. For market producers tomato is a major crop that a majority of them will grow and market to their customers. Often producers will grow both cherry and slicer types, but may choose to produce

8
more of one than the other depending on their customer’s wants and the grower’s interests. In summary, there were both high and low performing entries included in both types (cherry and slicer) varieties of tomato. Although the highest rated tomato for flavor was a cherry type (Favorita) there were also several slicer varieties that ranked high in the taste panel evaluations. There has been progress in breeding programs for increasing levels of lycopene and the trial supports that there has been a gain for this important nutrient. Taste and lycopene levels are important factors in marketing tomatoes, but so is the ability of a variety to produce consistently for without reasonable yields there won’t be much potential for generating income. Hopefully, the information included in this report will assist tomato producers in selecting tomato varieties that they may want to use in their own on-farm trials in the future. Acknowledgements: The authors would like to thank Niels Maness and Donna Chrz for sampling lycopene content.
Table 1. 2020 Tomato Variety trial, Botanic gardens, Stillwater, OK.
Variety Seed Source Type
Cherry
BHN 268 Rupp Determinate Cherry
Favorita Paramount Indeterminate Cherry
Sakura Johnny’s Indeterminate large Cherry
Slicer
BHN 964 Rupp Determinate 10 oz. fruit
Geronimo Johnny’s Indeterminate large fruit
Trust DeRuiter Indeterminate Beefsteak
Garden Gem U of Florida Semi-determinate 2 oz. fruit
Garden Treasure U of Florida Indeterminate 8 oz. fruit
W Hybrid U of Florida Determinate 6 oz. fruit

9
Table 2. 2020 Tomato Taste Panel Evaluations, August 6, 2020.
Rating (0-10)10 being best flavor
Variety Field High Tunnel Greenhouse
BHN 268 6.1 az 5.2 ab 4.1 b
Favorita 6.3 a 7.0 a 4.1 b
Sakura 6.2 a 5.1 a N/A
BHN 964 4.8 a 4.1 a N/A
Geronimo 5.6 a 6.0 a N/A
Trust 5.4 a 6.9 a N/A
Garden Gem 5.8 y
Garden Treasure 6.0
W Hybrid 5.7
zNumbers in a row followed by the same letter exhibited no significant differences based on Duncan’s Multiple Range Test where P=0.05. yNo other sites included the varieties Garden Gem, Garden Treasure, or W Hybrid, therefore there were no statistical comparisons made between sites for these varieties.
Table 3. 2020 Tomato lycopene results, cherry varieties, Botanic garden, Stillwater, OK
Variety (cherry)
Lycopene ugz
ug/g ug/fruit Average Fruit wt. (g)
BHN 268 39 ay 724 a 18.6 a Favorita 39 a 282 c 7.3 c Sakura 36 a 469 b 13.1 b zLycopene ug=micrograms/gram, micrograms/fruit, ug/fruit=micrograms/g x avg. fruit weight. yNumbers in a column followed by the same letter exhibited no significant differences based on Duncan’s Multiple Range Test where P=0.05.
Table 4. 2020 Tomato lycopene results, slicer varieties, Botanic garden, Stillwater, OK
Variety (Slicer)
Lycopene ugz
ug/g ug/fruit Average Fruit wt. (g)
BHN 964 45 bcy 7,346 b 166 ab Geronimo 31 d 5,358 c 170 ab Trust 41 c 5,492 c 126 b Garden Gem 51 ab 2,431 d 47 c Garden Treasure 59 a 10,786 a 178 a W Hybrid 52 ab 8,086 b 157 ab zLycopene ug=micrograms/gram, micrograms/fruit, ug/fruit=micrograms/g x avg. fruit weight. yNumbers in a column followed by the same letter exhibited no significant differences based on Duncan’s Multiple Range Test where P=0.05.

10
Table 5. 2020 Cherry tomato harvest data for field grown trail, The Botanic Garden, Stillwater, OK.
Variety (Cherry)
Number marketable fruit
Yield (lbs. per plot)Z Average fruit size
(lbs.) Early Markety (1st 4 weeks)
Marketable yield
Culls yield
Total yield
BHN 268 1872 cx 20 a 81 a 7 a 88 a 0.06 a
Favorita 4326 a 13 b 65 b 3 b 68 b 0.02 b
Sakura 2924 b 20 a 78 a 3 b 81 a 0.03 b
zPlots=12’ long on raised beds, 6 plants/plot, spaced 2’ apart. To figure yield in lbs./acre multiply by 363 yEarly Market=Pounds of yield for the early harvest period which began on 6/15/20 to 7/10/20 (4 weeks). Harvest data continued to 8/24/20 (total of 11 weeks) xNumbers in a column followed by the same letter exhibited no significant differences based on Duncan’s Multiple Range Test where P=0.05.
Table 6. 2020 Slicer tomato harvest data for field grown trial, The Botanic Garden, Stillwater, OK.
Variety (Slicer)
Number marketable fruit
Yield (lbs./plot)Z Average fruit size
(lbs.) Early Markety (1st 4 weeks)
Marketable yield
Culls yield
Total yield
BHN 964 116 bx 7 cx 55 b 18 bc 73 ab 0.43 a
Geronimo 237 b 10 bc 82 a 11 cd 93 a 0.35 b
Trust 201 b 11 bc 51 b 34 a 85 a 0.29 c
Garden Gem 588 a 24 a 66 ab 6 d 72 ab 0.11 d
Garden Treasure 129 b 11 bc 55 b 18 b 46 c 0.40 ab
W Hybrid 134 b 14 b 49 b 21 b 54 bc 0.34 b
zPlots=12’ long on raised beds, 6 plants/plot, spaced 2’ apart.. To figure yield in lbs./acre multiply by 363 yEarly Market=Pounds of yield for the early harvest period which began on 6/15/20 to 7/10/20 (4 weeks). Harvest data continued to 8/24/20 (total of 11 weeks) xNumbers in a column followed by the same letter exhibited no significant differences based on Duncan’s Multiple Range Test where P=0.05.

11
Figure 1. Photos of 2020 tomato varieties in The Botanic Garden tomato trial.
Preparing taste samples Samples for testing Satisfied tester
Table of Contents

12
Fresh Market Brussel Sprouts Trial
Lynda Carrier, Bizhen Hu, Matt Beartrack, & Lynn Brandenberger Oklahoma State University
Stillwater, OK
Introduction and Objectives: Brussel sprouts (Brassica oleracea, group Gemmifera) originated in Belgium in the sixteen century and are currently grown around the world. It is a cool season crop that has reasonably high levels of calcium and vitamin C (Pierce, 1987). The objectives for this trial included examining cultivars for use in Oklahoma and determining if spring Brussel sprouts are a viable crop for fresh market production in the state. Methods: Brussel sprouts were direct seeded in the greenhouse into soilless media [Sungro Professional Growing Mix] into 128 cell ‘Speedling’ flats on 2/3/20. Once the seedlings emerged they received one application of a complete water soluble fertilizer (18-21-21) at a rate of two tablespoons per gallon of irrigation water on one occasion. Rows in the field trial had the winter cover crop mown and then were strip-tilled with a tractor powered rototiller. Free-standing raised beds were formed and buried drip tape was installed using a Rain-Flo (Model 2550) single-row bed shaper on the strip-tilled rows on 3/12/20. Brussel sprouts were transplanted on 3/12/20 with in-row spacing at 16 inches with staggered double rows on top of each bed and a total of 10 plants per treatment plot. Beds were spaced 10’ apart from the center of each bed, plots were eight feet long. The trial received nitrogen fertilizer on 3/13/20 as a broadcast application at a rate of 50 lbs. of nitrogen per acre from 46-0-0 which was immediately watered in from rainfall. Following this other fertilizer applications were through the drip irrigation system, an equivalent of 172-45-30 lbs. per acre of N, P2O5, and K2O was applied during the entire trial period to meet crop fertility needs according to soil testing results. Weed control was managed through hand hoeing and the application of clean-straw mulch on 5/01/20 for both weed control and soil temperature management. Insect pests included harlequin bug and tobacco horn worm which were treated with Permethrin twice during the growing season. The experimental design included 11 Brussel sprout cultivars (Table 1) in a randomized block design with three replications. Plants in each plot were topped on 7/02/20 to encourage development of sprouts and further plant pruning was done throughout the season to remove old and senesced leaves. A second observational trial was transplanted at Langston University and end of the season notes were taken for that trial. Harvest began on 7/13/20 and continued until 7/24/20, a total of 3 harvests were recorded. Five out of 10 plants were harvested from each plot. At harvest the entire plant was cut at ground level and weighed prior to sprouts being removed from the main stem. Sprouts were determined as marketable or culls, and those in both categories were counted, then weighed for each plot. Brussel sprouts were considered to be marketable if they were larger than 3/4 inch and not over 2 inches in diameter. Sprouts that were smaller than ¾ inch or larger than 2 inches in diameter were considered to be culls. Results: Regarding the overall trial, there were five cultivars of Brussel sprouts that grew and developed to a harvestable stage. The other six cultivars in the trial did not develop fully and were not harvested. In addition, there were four cultivars that arrived too late for the initial planting in the greenhouse and were not included in the Stillwater trial, but which were grown and transplanted into a second trial at the Langston University site. Among these four cultivars, Gustus, Redarling, and Confidant performed as well as Dagan, Marte, and Divino, based on visual ratings. Whole plant weights did not vary between the five cultivars in the trial and ranged from 20 to 25 ounces per plant (Table 2). Differences were observed between cultivars for the number of

13
marketable sprouts per plant with Dagan having the highest number of marketable sprouts (31). Other cultivars ranged from 14 for Hestia to 28 for Marte and 22, 20 for Churchill, and Divino, respectfully. Weight of marketable sprouts per plant ranged from 4.4 to 8.5 ounces per plant. Dagan produced the highest weight of marketable sprouts while Hestia had the lowest yields both in terms of number and weight of marketable sprouts. The distance between individual sprouts on a stalk varied from 1.1 inches for Divino to 0.6 inches for Churchill. The other three cultivars had between sprout spacing of 0.7, 0.8, and 0.8 for Marte, Dagan, and Hestia, respectfully. Sprouts were culled for both being too small and too large. Hestia had the highest number of small cull sprouts which were less than ¾ inch in diameter (Table 2). Numbers of small culls were 16.4, 8.0, 6.4, 5.6 and 4.6, respectively, for Hestia, Marte, Divino, Churchill, and Dagan. Weights of small culls varied in a similar manner with Hestia having the highest weight of small culls. Culls due to being too large (over 2 inches) were highest in number and weight for Divino which had 4.6 large culls per plant and weighed 6.0 ounces per plant. Other cultivars that had high numbers and weights of large culls included Churchill (4.0 large culls at 2.2 ounces per plant) and Hestia (3.4 large culls at 3.9 ounces per plant). In summary, significant experience was gained about growing and selecting cultivars of Brussel sprouts for production in Oklahoma. Six of the 11 cultivars that were trialed did not develop enough for harvest in July. If more growing time had been available earlier in the season it may have been possible that more cultivars would have made the July harvest window. There were four other cultivars whose seed was not available until later in the planting season, we hope to include these in trials during the coming year. Starting next year’s trial earlier (early-mid February) may provide a better opportunity for more cultivars of Brussel sprouts to perform at a higher level under Oklahoma conditions. Based on this year’s trial results, Dagan, Marte, and Divino appear to have the most potential for spring-summer production in Oklahoma.

14
Table 1. Cultivars included in 2020 Brussels Sprouts Cultivar Trial, The Botanic Garden, Stillwater, OK
Cultivar Source Type RDHz Comments 7/31/2020 unless harvested
Churchill Johnny’s Green F1 123 Harvested 7/13/20 green, puffy loose leaves, stalk is woody, close spacing of sprouts
Dagan Johnny’s Bejo Green F1 134 Harvested 7/24/20 Uniform size, firm but some loose wrapper leaves
Diablo Johnny’s Green F1 110 Not-harvested: Sprouts did not size up, no sprouts on lower end and few on the upper end, green color
Divino Bejo Green F1 123 Harvested 7/13/20 Blue/green color, dense sprouts, cut nice (not woody) more oblong in shape
Groninger Rareseeds Green F1 NA Not-harvested: Inconsistent size Hestia Johnny’s Green F1 127 Harvested 7/17/20 Blue/green color, spacing
good, some loose, many small size Long Island Improved
Rareseeds Green OP 100 Not-harvested: No sprouts, very large stalks
Marte Bejo Green F1 123 Harvested 7/13/20 uniform size (top to bottom) nice color, fairly dense.
Nautic Territorial Green F1 120 Not-harvested: No sprouts on lower stalk, a few small ones higher up
Red Rubine Territorial Red OP 85 Not-harvested: Very small if any sprouts, Roodnerf Territorial Green OP 100 Not-harvested: Variable, some sized up, others
have no sprouts and some very small. Capitola Syngenta Green F1 135 Not in Stillwater trial, Langston only Confidant Syngenta Green F1 130 Not in Stillwater trial, Langston only Gustus Syngenta Green F1 110 Not in Stillwater trial, Langston only Redarling Syngenta Purple F1 140 Not in Stillwater trial, Langston only zRDH Reported Days to Harvest
Table 2. Harvest data for 2020 Brussels Sprouts Cultivar Trial, The Botanic Garden, Stillwater, OK
Cultivar Weight (oz.) whole plantz
Marketable Yield (per plant)
Non Marketable Yield (per plant)
Space between sprouts
(in.)y
number sprouts Weight
ounces
Small <3/4” Large >2”
Number sprouts
Weight ounce
s Number sprouts
Weight ounce
s
Churchill 24 ax 22 bc 5.5 bc 5.6 b 0.5 c 4.0 ab 2.2 c 0.6 b Dagan 20 a 31 a 8.5 a 4.6 b 0.4 c 1.2 c 1.4 c 0.8 ab Divino 25 a 20 bc 6.0 abc 6.4 b 0.5 c 4.6 a 6.0 a 1.1 a Hestia 20 a 14 d 4.4 c 16.4 a 1.5 a 3.4 ab 3.9 b 0.8 ab Marte 23 a 28 ab 7.6 ab 8.0 b 0.9 b 1.8 bc 1.6 c 0.7 b zPlants were cut at ground level, tops above sprouts were removed before weighing. ySpace between sprouts = Distance in inches between sprouts on stalk. xNumbers in a column followed by the same letter exhibited no significant differences based on Duncan’s Multiple Range Test where P=0.05.
15
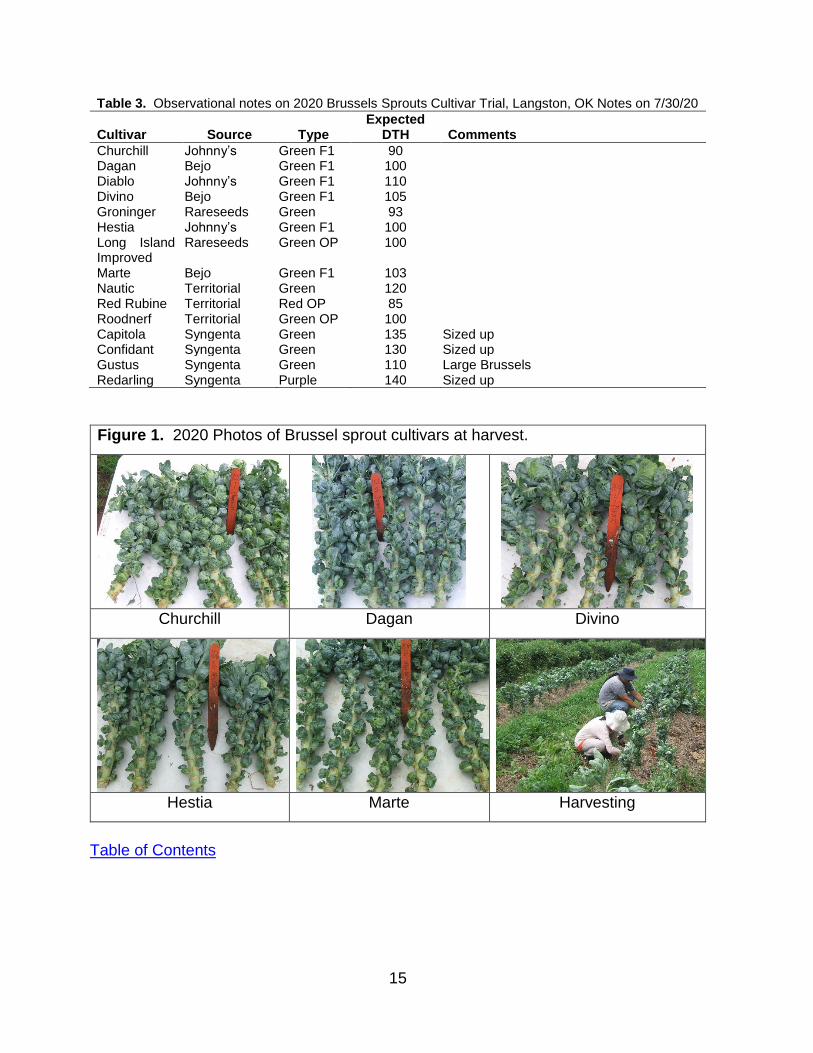
Table 3. Observational notes on 2020 Brussels Sprouts Cultivar Trial, Langston, OK Notes on 7/30/20
Cultivar Source Type Expected
DTH Comments
Churchill Johnny’s Green F1 90 Dagan Bejo Green F1 100 Diablo Johnny’s Green F1 110 Divino Bejo Green F1 105 Groninger Rareseeds Green 93 Hestia Johnny’s Green F1 100 Long Island Improved
Rareseeds Green OP 100
Marte Bejo Green F1 103 Nautic Territorial Green 120 Red Rubine Territorial Red OP 85 Roodnerf Territorial Green OP 100 Capitola Syngenta Green 135 Sized up Confidant Syngenta Green 130 Sized up Gustus Syngenta Green 110 Large Brussels Redarling Syngenta Purple 140 Sized up
Figure 1. 2020 Photos of Brussel sprout cultivars at harvest.
Churchill Dagan Divino
Hestia Marte Harvesting
Table of Contents

16
Bio-Intensive Cover Cropping for Soil Improvement
Cimarron Valley Research Station
Josh Massey1, Lynn Brandenberger1, Lynda Carrier1, Hailin Zhang1, João Antonangelo1, and George Kuepper2
1Oklahoma State University, 2Kerr Foundation/retired
Introduction and Objectives: Soil health is critical for sustainable soil productivity in the vegetable industry. One soil health parameter is the level of organic matter contained in field soils. In Oklahoma, soil organic matter is often well below 1% (generally at 0.5 to 0.7%). Organic matter in soils is critical because of its effects on nutrient stabilization, water availability, tilth, crop establishment, and soil physical structure in crop rooting and growth. Southern plains states have a longer warm season than in the northern plains, by several months. The longer growing season and warmer weather allows soil microbes to break down more organic matter than in the northern plains. In addition, clean-tillage systems used predominantly in vegetable production speed up microbial activity. This rapid microbial action and extended period in which it can occur adds to the reduction of soil organic matter. Organic matter can be added to soil in a number of ways including compost, manure, organic fertilizers, etc. Some of the issues associated with these sources of organic matter include availability and cost, but also can include the potential for food-borne disease. As an alternative, cover crops can be seen as a “Grow in Place” source of organic matter with lower potential for contamination of fresh produce. Some added advantages of cover crops are the protection of the soil from erosion and reduction of weed pressure by shading out weed populations. The objective of this long-term study (5 year) is to compare three different cover crop regimens to a clean fallow system to determine each treatment’s effect on soil organic matter levels and crop responses to them. Materials and Methods: The study area was divided into four different areas (each area is 90’ x 330’) within the fenced vegetable area at the Cimarron Valley Research Station, Perkins, OK (Figure 1). Three of the areas follow a specific cover crop regime and the fourth area is maintained as a fallow area when not planted to crops. The three cover crop and fallow areas are:
Treatment area # 1 cover crop combinations: a. Cool season: Cereal rye + Crimson clover b. Warm season: Sorghum-sudan + Cowpea
Treatment area # 2 cover crop combinations:
a. Cool season: Wheat + Crimson clover b. Warm season: Forage cowpea
Treatment area # 3 cover crop combinations:
a. Cool season: Cereal rye + Austrian winter pea + Tillage radish b. Warm season: Pearl millet + Forage cowpea
Treatment area #4 fallow treatment:
a. Both cool and warm seasons will consist of clean fallow using either tillage, mowing, with some postemergence herbicides to maintain the area when not planted to crops.

17
Each area is utilized for vegetable crop research plots and rotated between a summer and winter cover crop each year. This would mean that if a vegetable crop is not being grown in a given area there will be a cover crop growing on any open land within the three cover crop areas. In 2020, each treatment area was divided into five plots and soil samples taken from each. Sampling will continue each year for the duration of the study. Soil sample results include pH, N-P-K, and percent soil organic matter. Results: For 2020, soil pH among cover crop treatments was significantly different in treatment #1, at 7.6. Soil pH of other treatments ranged from 6.4 to 6.6 (Table 1). Nitrogen ranged from approximately 13.8 to 43.6 lbs. per acre, treatment #1 having the highest and treatment #4 having the lowest N availability (Table 1, Fig. 2). Phosphorus ranged from 14.8 to 38.0 lbs. per acre (Table 1). Treatment #1 was found to be significantly higher than other treatments. Potassium ranged from 347.2 to 518.8 lbs. per acre (Table 1). Significant differences were shown between treatments #1 and #4. Potassium in all treatment areas would be considered adequate for a majority of vegetable crops. Soil organic matter ranged from 1.6 to 2.1% across all treatments and significant differences detected between treatments #1, 3 and 4. The fallow treatment (#4) has been trending lower each year, and this year was significantly lower than all other treatments. Areas that received cover crop treatments had organic matter of 1.8, 2.0 and 2.1% (Table 1, Fig. 3). Treatments #1 and #2 were not significantly different from one another and treatments #2 and #3 were not significantly different from each other. Acknowledgements: The authors would like to thank the staff at the Cimarron Valley Experiment station for assistance with this study.

18
Figure 1. Cover crop and fallow areas at Cimarron Valley Research Station, Perkins, OK.

19
Table 1. 2020 Soil sample results, Cimarron Valley Research Station, Perkins, OK
lbs./acre %
Section pH Nitrogen Phosphorus Potassium Organic matter
1 7.6 az 43.6 a 38.0 a 519 a 2.1 a 2 6.6 b 30.6 b 17.8 b 450 ab 2.0 ab 3 6.4 b 29.4 b 16.0 b 418 ab 1.8 b 4 6.6 b 13.8 c 14.8 b 347 b 1.6 c
zNumbers in a column followed by the same letter exhibited no significant differences based on Duncan’s Multiple range Test, P=0.05.
Table 2. 2019 Soil sample results, Cimarron Valley Research Station, Perkins, OK
lbs./acre %
Section pH Nitrogen Phosphorus Potassium Organic matter
1 7.0 az 8.4 c 30.6 a 488 a 2.0 a 2 6.5 b 16.2 a 25.8 a 490 a 2.1 a
3 6.5 b 12.0 b 20.6 a 422 a 2.1 a 4 6.5 b 10.4 bc 30.8 a 448 a 1.7 a
zNumbers in a column followed by the same letter exhibited no significant differences based on Duncan’s Multiple Range Test where P=0.05. Table 3. 2018 Soil sample results, Cimarron Valley Research Station, Perkins, OK
lbs./acre %
Section pH Nitrogen Phosphorus Potassium Organic matter
1 6.6 az 9.0 c 27.7 a 473 ab 2.0 ab 2 6.4 b 24.0 a 21.3 b 494 ab 1.9 bc
3 6.2 c 12.0 b 20.3 b 429 b 1.7 c 4 6.1 c 21.7 a 31.7 a 534 a 2.2 a
zNumbers in a column followed by the same letter exhibited no significant differences based on Duncan’s Multiple Range Test where P=0.05. Table 4. 2017 Soil sample results, Cimarron Valley Research Station, Perkins, OK
lbs./acre %
Section pH Nitrogen Phosphorus Potassium Organic matter
1 6.8 az 22.0 b 21.3 b 374 c 1.8 b 2 6.5 b 23.3 b 30.7 a 433 b 2.2 a 3 6.4 b 20.7 b 21.7 b 394 bc 1.8 b 4 6.2 c 31.3 a 34.3 a 488 a 2.4 a
zNumbers in a column followed by the same letter exhibited no significant differences based on Duncan’s Multiple Range Test where P=0.05.

20
Figures 2 and 3. Soil test results for Nitrogen and Organic Matter, respectively, as effected by cover crop treatment, 2017-2019.
Table of Contents
0
10
20
30
40
50
1 2 3 4
lbs
N p
er a
cre
Cover crop treatment
Nitrogen 2017-2020
2017 N
2018 N
2019 N
2020 N
0
0.5
1
1.5
2
2.5
3
1 2 3 4
Soil
Org
anic
Mat
ter,
%
Cover crop Treatment
Organic Matter 2017-2020
2017 OM
2018 OM
2019 OM
2020 OM

21
Bio-Intensive Cover Cropping for Vegetable Crop Production
Cimarron Valley Research Station
Josh Massey1, Lynn Brandenberger1, Lynda Carrier1, Hailin Zhang1, João Antonangelo1, and George Kuepper2
1Oklahoma State University, 2Kerr Foundation/retired
Introduction and Objectives: Many production areas in Oklahoma have very low soil organic matter, in the range of 0.5 to 0.7%. Cover cropping practices can add organic matter to the soil and potentially improve crop yield and quality. In addition, increases in soil organic matter could greatly improve soil health for the benefit of vegetable production. Organic matter in soils is critical because of its effects on soil chemical properties in nutrient stabilization and fertility; and soil physical properties such as water availability and tilth. These physical properties influence crop establishment, rooting and growth. Cover crops can be seen as a “Grow in Place” source of organic matter with lower potential for contamination of fresh produce. An objective of this long-term study (5 year) is to compare three different cover crop regimens to a clean fallow system to determine each treatment’s effect on crop yield, marketability, and nutritive value. Materials and Methods: The study area was divided into four different areas (each area is 90’ x 330’) within the fenced vegetable area at the Cimarron Valley Research Station, Perkins, OK (Fig. 1). Three of the areas follow a specific cover crop regime and the fourth area is maintained as a fallow area when not planted to crops (Table 1). The three cover crop and fallow areas are:
Treatment area # 1 cover crop combinations: c. Cool season: Cereal rye + Crimson clover d. Warm season: Sorghum-sudan + Cowpea
Treatment area # 2 cover crop combinations:
c. Cool season: Wheat + Crimson clover d. Warm season: Forage cowpea
Treatment area # 3 cover crop combinations:
c. Cool season: Cereal rye + Austrian winter pea + Tillage radish d. Warm season: Pearl millet + Forage cowpea
Treatment area #4 fallow treatment:
b. Both cool and warm seasons will consist of clean fallow using either tillage, mowing, with some postemergence herbicides to maintain the area when not planted to crops.

22
Table 1: Cover Crop Treatments.
Treatment # 1 2 3 4
Warm Season
sorghum Sudan and cowpeas
cowpea pearl millet and cowpea fallow
Cool Season cereal rye and crimson clover
winter wheat and crimson clover
cereal rye, Austrian winter pea, tillage radish
fallow
Each area is utilized for vegetable crop research plots and rotated between a summer and winter cover crop each year. If a vegetable crop is not being grown in a given area, there will be a cover crop growing on any open land within the three cover crop areas. In 2020, each treatment area was divided into five plots, 4’ x 50’ (total plot area of 200 ft2). Two vegetable crops were used to determine the effect of each cover crop on their yield and quality. Cowpea (Vigna unguiculata, var. Empire), and sweet potato (Ipomoea batatas, var. Covington) were planted and harvested. Cowpeas were planted June 18th and harvested September 21st and October 2nd. Sweet potatoes were planted June 15th and harvested October 9th. Results: Yields for cowpea were shown to be significantly different from one another between treatments. Treatments #1 and #2 differed from treatments #3 and #4, shown in Table 2.
Table 2. Summer 2020 Cowpea, Perkins, OK.
Cover Crop Combined Shelled peas
(lbs./acre) z Moisture
%
1 180.41 b 18.784 ab
2 95.50 b 27.492 a
3 680.56 a 14.150 b
4 636.25 a 9.370 b
zlbs./acre= Plot size 50’ long 2 row plots 3’ spacing=300 (43560/300=145.2) yNumbers in a column followed by the same letter exhibited no significant differences based on Duncan’s Multiple Range Test where P=0.05.
Significant differences in marketable number and weight of sweet potatoes among cover crop treatments were not detected (Table 3). However, differences were shown in cull weight and total weight. Cull weights of treatment #4 were significantly higher than treatments #1 and #2. Total weights of treatments #3 and #4 were significantly higher than treatment #2 (Table 3). As cover crop treatments in this project has been planted over the last 4 years (2017-2020), trends in soil organic matter were detected and in 2020 significant differences in soil organic matter have been shown. Differences in yields and quality of crops grown due to soil quality enhancement have not been as evident.

23
Table 3. Summer 2020 Sweet Potato, Perkins, OK.
lbs./1,000 sqftz
Cover Crop Number
marketabley Marketable wt. y Cull wt.x Total yield
1 567.9 aw 382.2 a 44.3 b 433.5 ab
2 549.1 a 300.3 a 55.2 b 362.4 b
3 610.4 a 452.0 a 86.3 ab 539.5 a
4 643.0 a 444.6 a 96.9 a 551.9 a
zlbs./1000 sqft = Plot size 45’ long raised bed, plants spaced 18 inches apart, average number plants is 33/plot y Marketable wt. & number=-US #1 + Canners + Jumbos. xCulls – Roots must be 1: or larger in diameter and so misshapen or unattractive that they could not fit as marketable roots. Most culls were insect damage wNumbers in a column followed by the same letter exhibited no significant differences based on Duncan’s Multiple Range Test where P=0.05.
Acknowledgements: The authors would like to thank the staff at the Cimarron Valley Experiment station for assistance with this study. Table of Contents
24
Sweet Potato Observational Trials
Jeffrey Roebuck, Demonstration Farm Manager, Choctaw Nation Jim Shrefler, OCES SE District Horticulturist Cecil Mackey and Jeffrey Mackey, Wes Watkins Agricultural Research & Extension Center Casey Russell, Extension Educator and Director, Coal County Extension Harold Stephens, Extension Educator and Director, Atoka County Extension Marty Montague, Extension Educator and Director, Choctaw County Extension
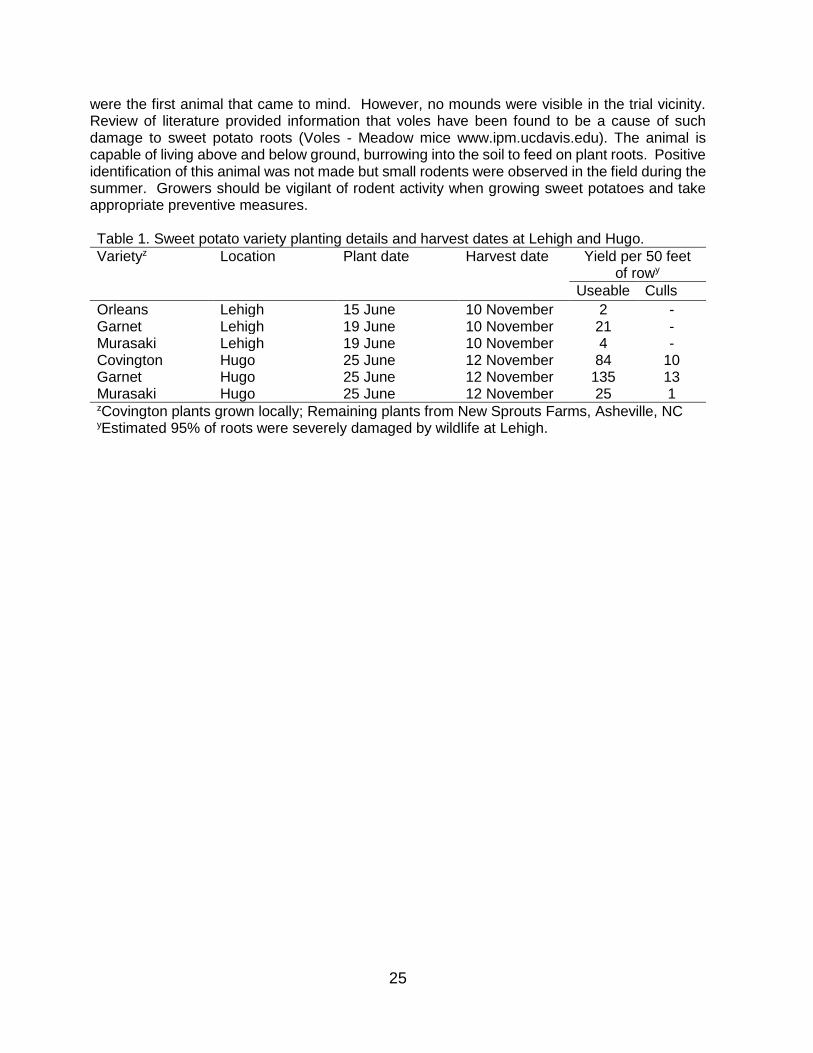
Efforts are currently underway to develop vegetable crop production information for use by growers within the Choctaw Nation of Oklahoma that would facilitate entry into local marketing outlets. Historically, sweet potatoes have been an important crop for farmers at various locations in Oklahoma. In recent years the crop has increased in popularity with market garden growers. One aspect of interest is knowledge about varieties of varied skin and flesh color that can be grown in the area. To address this grower interest an observational trial was conducted at two locations. Varieties chosen for use in the trial were based on input from local growers. Trial locations were Choctaw Nation Demonstration Farms at Lehigh and Hugo. Depending on the variety, sweet potato slips were obtained from New Sprouts Farms https://www.newsproutfarms.com or from a local grower. The varieties trialed are shown in Table 1. Fields at both locations was prepared by disking and rototilling soil. Raised beds four feet in width and six inches high were constructed. A complete granular fertilizer (17-17-17) was broadcast over the 4-foot wide bed at a rate of 25 lbs. per 100 feet of row and lightly incorporated into the bed with a tractor mounted rototiller. Planting was accomplished by making a furrow about 6 inches deep in the center of the row. Soil in the furrow was wetted with a hose and plants were placed on one side of the furrow and then covered by hand with hoes. Following planting at Lehigh the herbicide Devrinol was applied at a rate of 4 lbs. per acre over the bed area to control annual grass and broadleaf weeds. At both locations, plant establishment was normal and vine growth was good throughout the summer. Vine development over time is shown in Figure 1. The plantings were watered with drip irrigation as needed. Plants were checked periodically for insect pest and disease incidence, but no major problems were observed. Beginning in September plantings were checked periodically for root development. Root development was evident in late September, but roots were still small. Harvest was delayed as long as possible to allow time for root to continue growing. Once freezing temperatures were forecast for the area roots were harvested at Lehigh and Hugo on November 10 and 12, respectively. There were substantially fewer roots to harvest at Lehigh than expected. Upon examination of the plants that were dug, it was discovered that roots were being fed on by animals of an unknown species and the loss was estimated to be 90% or greater (Figure 2). Because of this severe damage at Lehigh yields of intact roots are very low and not representative of what plants actually produced. Roots were dug two days later at Hugo and found to be in much better condition, although a few roots were found with damage similar to those at Lehigh. Garnet produced the greatest root weights at Hugo. The outward appearance of roots of the varieties are shown in Figure 2. One reason for the low yields of Murasaki is that there were many roots but few that increased in diameter beyond an inch or so, and therefore not useable. We investigated the possible causes of sweet potato animal root feeding to determine what may have caused the damage to roots at Lehigh. Pocket gophers are common in the region and
25
were the first animal that came to mind. However, no mounds were visible in the trial vicinity. Review of literature provided information that voles have been found to be a cause of such damage to sweet potato roots (Voles - Meadow mice www.ipm.ucdavis.edu). The animal is capable of living above and below ground, burrowing into the soil to feed on plant roots. Positive identification of this animal was not made but small rodents were observed in the field during the summer. Growers should be vigilant of rodent activity when growing sweet potatoes and take appropriate preventive measures. Table 1. Sweet potato variety planting details and harvest dates at Lehigh and Hugo.
Varietyz Location Plant date Harvest date Yield per 50 feet of rowy
Useable Culls
Orleans Lehigh 15 June 10 November 2 - Garnet Lehigh 19 June 10 November 21 - Murasaki Lehigh 19 June 10 November 4 - Covington Hugo 25 June 12 November 84 10 Garnet Hugo 25 June 12 November 135 13 Murasaki Hugo 25 June 12 November 25 1 zCovington plants grown locally; Remaining plants from New Sprouts Farms, Asheville, NC yEstimated 95% of roots were severely damaged by wildlife at Lehigh.

26
Figure 1. Images showing general appearance of the sweet potato trial at Lehigh.
24 days after planting field view (left) weed control versus adjacent area (right).
Vines at 53 days (left) and 92 days (right)

27
Figure 2. Images showing appearance of sweet potato roots and apparent rodent damage.
Garnet from Hugo (left). Orleans from Lehigh (right)
Covington from Hugo (left) Murasaki from Hugo (right)
Murasaki with poor root formation (left) Roots from Lehigh with apparent rodent damage
This work was supported in part by each of the Choctaw Nation of Oklahoma, The Oklahoma Cooperative Extension Service, The Oklahoma Agricultural Experiment Station, a grant from the Indian Land Tenure Foundation and the USDA National Institute of Food and Agriculture’s Federally Recognized Tribal Extension Grant Program. Table of Contents

28
Choctaw Squash Planting Density Trial
Mingo Valley Research Station – Bixby Jim Shrefler, OCES SE District Horticulturist; John Haase, Rogers Co. Extension Horticulturist; Dr. Charles Webber, Tulsa Co. Master Gardener; Jeffrey Roebuck, Choctaw Nation Robert Havener and Ted Newell, Research Station Cooperators Choctaw squash is an heirloom crop held by members of the Choctaw Nation and thought to be classified botanically as Cucurbita moschata. Also referred to as sweet potato squash, it is a winter squash with variable fruit shape and matures to a light to dark tan color that is lightly mottled. At maturity it has a hard outer surface. Out of interest of encouraging increased use of the crop, a need was perceived to develop crop culture information that would aid farmers who desire to grow the crop. A second objective was to gain information on susceptibility of Choctaw squash to common cucurbit insect pests and diseases. A trial was conducted in 2020 to evaluate the influence of plant spacing on Choctaw squash productivity and assess its susceptibility to insect pests of cucurbit crops. The study site was the Mingo Valley Research Station at Bixby. Plants were established by direct seeding on 25 June using seed collected from fruits grown at Lehigh, OK in 2019. Rows were spaced 10 feet apart and plots were a single row 12 feet long with a four-foot unplanted section of row between plots. Treatments consisted of plant densities of 2, 4, 6 and 8 plants per 10 feet of row which corresponds to within-row plant spacings of 6, 3, 2 and 1.5 feet. Four replications were planted using a randomized complete block design. On both sides of the trial a row of yellow summer squash (Lioness) was planted to serve as a border row and to serve as a reference crop that could be used to assess cucurbit insect pest incidence. To aid in assessing the incidence of squash vine borer, pheromone baited traps were placed at each end of the field on 22 July, in line with one of the summer-squash rows. Strategy herbicide was applied at 3 pints / acre immediately after planting squash seed. A selective post-emergence herbicide was later applied to control grass weeds. Shallow mechanical herbicide incorporation was done 1 July. Plants were watered with drip irrigation as needed. Squash were harvested on September 15 by collecting mature fruits and weighing each individually. Data are shown in Table 1. No statistical differences were detected among the plant spacing treatments for fruit yield in terms of quantity or weight of fruits. Although not significant, the lower mean numbers and weights of squash fruits for plants spaced six feet apart are to be expected due to the wide plant spacing. Observations were made with Choctaw squash and Lioness squash on growth habit and fruit set and development. This should serve to begin to establish baseline information of expected crop development for Choctaw squash, with summer squash as a reference. Seedlings of both crops emerged at about the same time. On 8 July Choctaw squash had 4-5 leaves per plant and Lioness had 5-6. The general appearance of the two squash types is shown in Figure 1. Flower buds were first observed on Lioness at 17 July and 10 days later for Choctaw squash, at which time Lioness fruit were ready for harvest. Fruit set and early development on Choctaw squash were observed during mid-August. Choctaw squash fruits were harvested after reaching full size and rind color changed from green to tan as previous testing showed that seed from fruit harvested green had poor germination. General observations regarding Choctaw squash plant growth habit were that several branches (runners) typically initiate near the plant base and there is little additional branch formation. Runner development was well underway by 27 July and abundant tendrils were present on vines. By harvest time, runners tended to be long with one measuring 29 feet. There was generally no more than one fruit to a runner. The quantity of fruits

29
per plant was affected by planting density (Table 1). With plant spacings of 1.5 or 2 feet there was less than an average of one fruit per plant. There were significantly greater numbers of fruit per plant for wider plant spacings with nearly 2 per plant when spaced at 6 feet. During early crop development vines were checked periodically for the incidence of squash bugs and squash vine borers. Squash vine borer traps were monitored weekly for incidence of moths of this insect pest. Moths (numbers in parenthesis) were recorded on July 23 (2), 27 (10), 31 (10) and August 3 (2), 6 (4) and 14 (6). On 15 September plants were examined for squash vine borer incidence. Essentially all Lioness squash vines were severely infested with borers. Choctaw squash vines were examined from the plant base to 2 feet outward. Low levels of borer attack and presence were observed but was limited to entry points at nodes and little boring into vines was observed. Choctaw squash vines were smaller in diameter than summer squash and seemed to have a rather hard outer surface as compared to Lioness squash. No vines appeared to have been severely damaged by vine borers. Moderate numbers of squash bugs were observed in early August on Lioness squash, but incidence of this insect pest was low on Choctaw squash. In summary, these results suggest that when plant spacings are too close some plants may remain fruitless but that excessively wide spacings may result in an overall decrease in yield. Although, insect pest attack of Choctaw squash was less than for summer squash, growers should always use recommended Integrated Pest Management practices to protect crops from these potentially destructive major insect pests of cucurbit vegetables. Table 1. Choctaw squash yield and fruit weight as affected by plant spacing.
Number of feet between
plants
Fruit yield Mean individual fruit weight (lbs.)
Number of fruits per
plantz Number / 1000
sq. ft. Weight (lbs.)/1000 sq.
ft.
1.5 44 463 10.6 0.65 a 2 41 490 11.8 0.83 a 3 50 516 10.4 1.5 b 6 31 333 10.7 1.9 b n.s. n.s. n.s.
Zmeans followed by a common letter are not different based on Duncan’s Multiple Range test.

30
Figure 1. Images showing general appearance of Choctaw squash and Lioness summer squash.
Left – Choctaw squash at 25 days after seeding. Right – Lioness yellow squash at 25 days after seeding
Example fruits of Choctaw squash at harvest
This work was supported in part by each of the Oklahoma Cooperative Extension Service, The Oklahoma Agricultural Experiment Station, a grant from the Indian Land Tenure Foundation and the USDA National Institute of Food and Agriculture’s Federally Recognized Tribal Extension Grant Program. Table of Contents

31
Pest Management

32
Row Cover Materials for Insect Pest Exclusion in Yellow Squash
The Botanic Garden, Stillwater, OK
Bizhen Hu, Lynda Carrier, Matt Beartrack, Eric Rebek, Jim Shrefler, and Lynn Brandenberger
Introduction: Summer squash is a popular vegetable crop both for commercial fresh market farms and home gardens. The primary insect pest of all squash is squash bug (Anasa tristis) which overwinters in the previous year’s crop debris and can destroy the crop quickly and spread to remaining plants. Control methods include crop rotation, cleaning up and destroying crop debris at the end of the growing season to remove overwintering sites for adult squash bugs, consistent monitoring, and the use of approved insecticides. All squash producers are challenged to manage this insect pest, but organic producers particularly struggle due to the limited number of effective insecticides. Therefore, the current challenge is to determine how to establish and produce squash with limited or no use of pesticides.
The objective was to determine the effect of covering squash with insect excluding row covers to reduce the number of insects, primarily squash bugs. The study investigated 3 different types of row covers with daily removal for pollinator access. This report focuses on the effects of these row cover materials on the yield of yellow squash at the Botanic Garden Student Farm in 2020.
Methods and Materials: The study was carried out as a completely randomized design with four treatments and three replications. Treatment plots consisted of free-standing raised beds with drip irrigation tape buried in the middle of the bed. These beds were installed on May 11, 2020. Plots were 15 feet long with 5’ alleys between rows. Yellow squash variety ‘Lioness’ was direct seeded on May 19 by hand-planting 2-3 seeds per spot and 6 spots per plot with in-row spacings 2 feet apart in the row. Following direct seeding, plots were sprayed with herbicides ‘Strategy’ and glyphosate on May 20. Three lbs. per application of 10-30-20 blossom booster fertilizer was added through a fertilizer injector on May 28, June 8 and 13. 46-0-0 fertilizer was also added through an injector at a rate of three lbs. per application on June 23, 29, July 6, 10, 23, and August 10. Rebar and hoops were installed and row cover treatments were put over hoops on June 4. Seedlings were thinned to 6 plants per plot with a spacing of 2 feet apart in the row. Starting from June 30, covers were opened at 7:00 am each morning and closed by noon each day to allow pollinators to access flowers during peak activity. Fruit was harvested approximately every 3 days from June 30 to August 14. Yield data were recorded including marketable fruit weight, marketable fruit number, and cull fruit number.
Results: The weight and number of Marketable fruit per plot varied significantly among treatments, (Table 1). Highest yields were in the treatment with woven mesh cover, followed by the treatment with no cover, then that with DeWitt row cover 0.5 oz. material, and the lowest yield in the treatment with DeWitt row cover deluxe plus 1 oz. material. The number of non-marketable fruit per plot was less in the treatment with no cover and woven mesh cover than that with DeWitt row covers 0.5 oz. and 1 oz. material, with cull fruit primarily being moldy
(Choanephora cucurbitarum). There were no significant differences in the total number of fruit
per plot, even though the number was numerically smaller in the treatment with no cover. There were no differences in the average fruit weight.

33
Conclusions: The purpose of using row covers is to exclude insect pests and improve plant growth and yield. However, the 0.5 oz. and 1 oz. DeWitt row cover materials reduced marketable yield compared to the no cover control, due to the higher number of non-marketable moldy fruit. The woven mesh cover increased marketable yield and did not lead to increased moldy fruit compared to the other cover materials. The reason is probably a lower humidity under the woven mesh cover than that experienced under the other cover materials. Besides the effects on yield, the 0.5 oz. DeWitt row cover material would tear easily and needed to be repaired or replaced regularly. The 1 oz. DeWitt row cover material resulted in high relative humidity under the cover causing the largest number of moldy fruit and blossoms and some plant death. The woven material was sturdy and breathable and did not retain excessive moisture. The treatment with no cover had squash bugs the earliest and most plants in the no cover treatment died by the end of the season. To summarize, the woven mesh cover appeared to be a compromise of excluding pests, being sturdy, not retaining humidity, and improving yield.
Table 1. Total Season Yield of Yellow Squash Under Different Row Cover Materials for Insect Pest Exclusion at the Botanic Garden in Stillwater, OK, 2020.
Treatment
Marketable weight/plotzy
(lbs.)
Marketable number of fruit/plot
Non-marketable number of fruit/plot
Total number of fruit/plot
Average weight per fruit (lbs.)
DeWitt Row cover 0.5 oz. material
12 bcx 20 bc 82 a 102 a 0.62 a
Woven mesh 40 a 62 a 28 ab 90 a 0.64 a
DeWitt Row cover deluxe plus 1 oz. material
3 c 6 c 95 a 101 a 0.61 a
No Cover 22 b 32 b 11 b 43 a 0.68 a z plot size=6 plants per plot, spaced 2’ apart on raised beds. y Harvested every 3 days from 6/30/20 to 8/14/20. x Numbers in a column followed by the same letter exhibited no significant differences based on Duncan’s Multiple Range Test where P=0.05.

34
Figure 1.
DeWitt Row cover 0.5 oz. material Woven mesh
DeWitt Row cover deluxe plus 1 oz. material
No cover
Table of Contents

35
Effects of Row Cover Removal Timing in Yellow Squash
On Yield of Yellow Squash
Stillwater, Oklahoma
Bizhen Hu, Lynda Carrier, Matt Beartrack, Eric Rebek, Jim Shrefler, & Lynn Brandenberger
Introduction: Summer squash is a popular vegetable crop both for commercial fresh market farms and home gardens. The primary insect pest of all squash is squash bug (Anasa tristis) which overwinters in the previous year’s crop debris and can destroy the crop quickly and spread to remaining plants. Control methods include crop rotation, cleaning up and destroying crop debris at the end of the growing season to remove overwintering sites for adult squash bugs, consistent monitoring, and the use of approved insecticides. All squash producers are challenged to manage this insect pest, but organic producers particularly struggle due to the limited number of effective insecticides. Therefore, the current challenge is to determine how to establish and produce squash with limited or no use of pesticides.
The objective was to determine the effects of covering squash with insect excluding row covers to reduce the number of insects, primarily squash bugs. The study we will discuss investigated the removal of one type of cover at different times. This report focuses on the yield effects of cover removal times on yellow squash at the Baker Bokorney farm in Stillwater, OK. Methods and Materials: The study was carried out as a randomized design with three replications and five treatments (DeWitt Row Cover 0.5 oz. with material removed at 1, 2, 3, and 4 weeks after 50% bloom of female flowers and a no-cover control). Treatment plots consisted of free-standing raised beds with drip irrigation tape buried in the middle of the bed. Yellow squash variety ‘Lioness’ was direct seeded on May 19 by hand-planting 2-3 seeds per spot and 6 spots per plot with spacing 2 feet apart in the row. Following direct seeding, plots were sprayed with herbicides ‘Strategy’ and glyphosate on May 20. Rebar and hoops were installed and row cover treatments were put over hoops on June 5. Seedlings were thinned to 6 plants per plot with a spacing of 2 feet apart in the row. Fruit was harvested 1-2 times a week from July 17 to August 14. Yield data were recorded including marketable fruit weight, marketable fruit number, and cull fruit number.
Results and Discussion: Marketable fruit weight, numbers of marketable fruit, number of non-marketable fruit, total number of fruit, and the average fruit weight were not significantly different among the five treatments (Table 1). However, the treatments with earlier cover removal at 1, 2, and 3 weeks after 50% bloom of female flowers had a numerically higher yield than the no-cover control. The treatment with later cover removal at 4 weeks after 50% bloom of female flowers had a numerically lower yield than the no-cover control. Further study is needed to determine whether the timing at 1, 2, 3, and 4 weeks after 50% bloom of female flowers for removing the DeWitt Row Cover 0.5 oz. material affects the yield of yellow squash.
Acknowledgements: The authors want to thank Baker Bokorney for plot space on his property for the study.

36
Table 1. Total season yield of yellow squash using the DeWitt Row Cover 0.5 oz. material for insect pest exclusion, with covers removed at 1, 2, 3, or 4 weeks after 50% bloom of female flowers compared to a no-cover control, at Baker vegetable field in Stillwater, OK, 2020.
Treatment
Marketable weight/plotz, y
(lbs.)
Marketable number of fruit/plot
Non-marketable number of fruit/plot
Total number of fruit/plot
Average weight per fruit (lbs.)
1 Week Removal 19 a 23 a 5 a 28 a 0.88 a
2 Week Removal 20 a 23 a 1 a 24 a 0.84 a
3 Week Removal 15 a 18 a 6 a 23 a 0.83 a
4 Week Removal 6 a 11 a 6 a 17 a 0.57 a
No-cover 11 a 14 a 0 a 15 a 0.79 a
z plot size=6 plants per plot, spaced 2’ apart. y Harvested 1-2 times a week from 7/17/20 to 8/14/20. x Numbers in a column followed by the same letter exhibited no significant differences based on Duncan’s Multiple Range Test where P=0.05.
Table of Contents

37
SI (METRIC) CONVERSION FACTORS
Approximate Conversions to SI Units Approximate Conversions from SI Units
Symbol When you
know Multiply
by To Find Symbol Symbol When you
know Multiply by To Find Symbol
LENGTH
LENGTH in
inches
25.40
millimeters
mm
mm
millimeters
0.0394
inches
in
ft
feet 0.3048
meters
m
m
meters
3.281
feet
ft
yd
yards 0.9144
meters
m
m
meters
1.094
yards
yds
mi
miles
1.609
kilometers
km
km
kilometers
0.6214
miles
mi
AREA
AREA
in2
square inches
645.2
square
millimeters mm2
mm2
square
millimeters
0.00155 square inches
in2
ft2
square feet
0.0929
square meters
m2
m2
square meters
10.764
square feet
ft2
yd2
square yards
0.8361
square meters
m2
m2
square meters
1.196
square yards
yd2
ac
acres 0.4047
hectacres
ha
ha
hectacres
2.471
acres
ac
mi2
square miles
2.590
square
kilometers km2
km2
square
kilometers
0.3861 square miles
mi2
VOLUME
VOLUME fl oz
fluid ounces
29.57
milliliters
mL
mL
milliliters
0.0338
fluid ounces
fl oz
gal
gallon
3.785
liters
L
L
liters
0.2642
gallon
gal ft3
cubic feet
0.0283
cubic meters
m3
m3
cubic meters
35.315
cubic feet
ft3
yd3 cubic yards
0.7645
cubic meters
m3
m3
cubic meters
1.308
cubic yards
yd3
MASS
MASS oz
ounces
28.35
grams
g
g
grams
0.0353
ounces
oz
lb
pounds 0.4536
kilograms
kg
kg
kilograms
2.205
pounds
lb
T
short tons (2000 lb)
0.907
megagrams
Mg
Mg
megagrams
1.1023
short tons (2000 lb)
T
TEMPERATURE (exact)
TEMPERATURE (exact)
°F
degrees
(°F-32)
/1.8
degrees
°C
°C
degrees 9/5(°C)+32
degrees
°F
Fahrenheit Celsius Fahrenheit Celsius
FORCE and PRESSURE or STRESS
FORCE and PRESSURE or STRESS
lbf
poundforce 4.448
Newtons
N
N
Newtons
0.2248
poundforce
lbf
lbf/in2
poundforce 6.895
kilopascals
kPa
kPa
kilopascals
0.1450
poundforce
lbf/in2
per square
inch per square
inch

38
Location of Oklahoma Agricultural Experiment Stations
THE OKLAHOMA AGRICULTURAL EXPERIMENT STATION
SYSTEM COVERS THE STATE
✪ MAIN STATION—Stillwater and adjoining areas
1. Oklahoma Panhandle Research and Extension Center—Goodwell 2. Southern Plains Range Research Station—Woodward 3. Marvin Klemme Range Research Station—Bessie 4. North Central Research Station—Lahoma 5. Oklahoma Vegetable Research Station—Bixby 6. Eastern Research Station—Haskell 7. Kiamichi Forestry Research Station—Idabel 8. Wes Watkins Agricultural Research and Extension Center—Lane 9. Cimarron Valley Research Station—Perkins 10. A. South Central Research Station—Chickasha
B. Caddo Research Station—Ft. Cobb 11. A. Southwest Research and Extension Center—Altus
B. Sandyland Research Station—Mangum C. Southwest Agronomy Research Station—Tipton
12. Grazingland Research Laboratory—El Reno