Embed Size (px)
Citation preview

2020 State Academic Accountability Overview
Texas Education AgencyOffice of Governance and AccountabilityPerformance Reporting

History of Accountability Ratings in Texas
1994–2002
Exemplary (district and campus)
Recognized (district and campus)
Academically Acceptable (district) Acceptable (campus)
Academically Unacceptable (district) Low-Performing (campus)
Additional rating labels for alternative education campuses or special circumstances
2004–2011
Exemplary (district and campus)
Recognized (district and campus)
Academically Acceptable (district and campus)
Academically Unacceptable (district and campus)
Additional rating labels for alternative education campuses or special circumstances
2013–2017
Met Standard/Met Alternative Standard (district and campus)
Improvement Required (district and campus)
Not Rated
2Texas Education Agency | Performance Reporting

A-F Accountability: How It Was Designed
84th Legislature
HB 2804
85th Legislature
HB 22
“The commissioner shall evaluate school district and campus performance and assign each district and campus an overall performance rating of”
A = Exemplary Performance
B = Recognized Performance
C = Acceptable Performance
D = In Need of Improvement
F = Unacceptable Performance
3Texas Education Agency | Performance Reporting

Accountability Rating Labels
2018
Texas Education Agency | Performance Reporting
Districts
A, B, C, D, or F
Campuses
Met Standard/Met Alternative Standard
orImprovement Required
A, B, C, D, or F
Districts
Campuses
A, B, C, D, or F
2019
4
Overview of the Accountability System
Student Achievement evaluates performance across all subjects for all students, on both general and alternate assessments; College, Career, and Military Readiness (CCMR) indicators; and graduation rates.
School Progress measures district and campus outcomes in two areas: the students that grew at least one year academically (or are on track) as measured by STAAR results and the achievement of all students relative to districts or campuses with similar economically disadvantaged percentages.
Closing the Gaps uses disaggregated data to demonstrate differentials among racial/ethnic groups, socioeconomic backgrounds and other factors. The indicators included in this domain, as well as the domain’s construction, align the state accountability system with the Every Student Succeeds Act (ESSA).
5Texas Education Agency | Performance Reporting
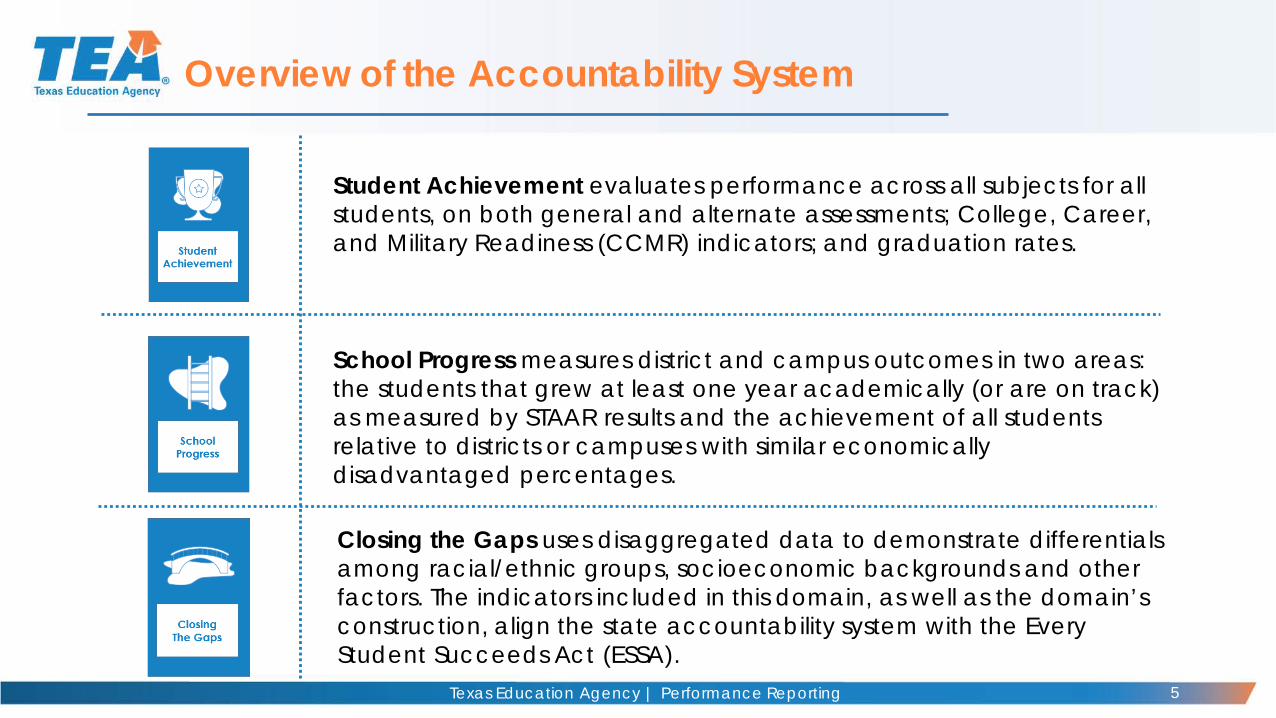
Three Domains: Calculating an Overall Accountability Rating
Districts and campuses receive an overall rating, as
well as a rating for each domain.
A = scaled score 90–100
B = scaled score 80–89
C = scaled score 70–79
D = scaled score 60–69
F = scaled score ≤59
6Texas Education Agency | Performance Reporting

Student Achievement Domain
Student Achievement
SchoolProgress
Closing The Gaps
7Texas Education Agency | Performance Reporting

Student Achievement Domain: Calculating a Score
Elementary Schools• 100% STAAR
Middle Schools
• 100% STAAR
High Schools, K–12, and Districts
• 40% STAAR • 40% College, Career, Military Ready (CCMR)• 20% Graduation Rates
Texas Education Agency | Performance Reporting 8

Student Achievement Domain: STAAR Performance Labels
MASTERS GRADE LEVEL: Performance in this category indicates that students are expected to succeed in the next grade or course with little or no academic intervention. Students in this category demonstrate the ability to think critically and apply the assessed knowledge and skills in varied contexts, both familiar and unfamiliar
MEETS GRADE LEVEL: Performance in this category indicates that students have a high likelihood of success in the next grade or course but may still need some short-term, targeted academic intervention. Students in this category generally demonstrate the ability to think critically and apply the assessed knowledge and skills in familiar contexts.
APPROACHES GRADE LEVEL: Performance in this category indicates that students are likely to succeed in the next grade or course with targeted academic intervention. Students in this category generally demonstrate the ability to apply the assessed knowledge and skills in familiar contexts.
DID NOT MEET GRADE LEVEL: Performance in this category indicates that students are unlikely to succeed in the next grade or course without significant, ongoing academic intervention. Students in this category do not demonstrate a sufficient understanding of the assessed knowledge and skills.
9Texas Education Agency | Performance Reporting

Student Achievement Domain: STAAR Methodology
10Texas Education Agency | Performance Reporting
STAAROne point is given for each percentage of assessment results that are at or above the following:
• Approaches Grade Level or above• Meets Grade Level or above• Masters Grade Level
Percentage of Assessments at Approaches Grade Level or above + Percentage of Assessments at Meets Grade Level or above +
Percentage of Assessments at Masters Grade LevelThree

CCMR Indicators for HS, K–12, and Districts
College Ready
• Meet criteria of 3 on AP or 4 on IB examinations
• Meet TSI criteria (SAT/ACT/TSIA/College Prep course) in reading and mathematics
• Complete a course for dual credit(9 hours or more in any subject or 3 hours or more in ELAR/mathematics)
• Earn an associate’s degree• Complete an OnRamps course in any
subject and earn college credit
Military Ready
Enlist in the United States Armed Forces
Career Ready
• Earn an industry-based certification• CTE coherent sequence coursework
completion and credit aligned with approved industry-based certifications (one-half point credit)
• Graduate with completed IEP and workforce readiness (graduation type codes 04, 05, 54, or 55)
• Earn a Level I or Level II certificate• Graduate under an advanced
degree plan and be identified as a current special education student
Texas Education Agency | Performance Reporting 11

CCMR Indicators for HS, K–12, and Districts: Methodology
Texas Education Agency | Performance Reporting
CCMR One point is given for each annual graduate who accomplishes
any one of the CCMR indicators, except for CTE coherent sequence graduates.
One-half point is given for each CTE coherent sequence graduate who completes coursework aligned to the approved list of industry-based certifications.*
Number of Graduates Who Accomplish Any One of the CCMR IndicatorsNumber of 2019 Annual Graduates
*This is for graduates who meet no other CCMR indicator.
12

Student Achievement Domain: Graduation Rate
Texas Education Agency | Performance Reporting
Graduation Rate
High school graduation rates include the four-year, five-year, or six-year longitudinal graduation rate (with state exclusions) or annual dropout rate, if the graduation rate is not available.
Example Calculation: Graduation Rate
Graduation Rate All Students
Class of 2019 , 4-year 85.2%
Class of 2018 , 5-year 87.3%
Class of 2017 , 6-year 85.0%
Graduation Rate Score 87.3
13

School Progress Domain
Student Achievement
SchoolProgress
Closing The Gaps
14Texas Education Agency | Performance Reporting
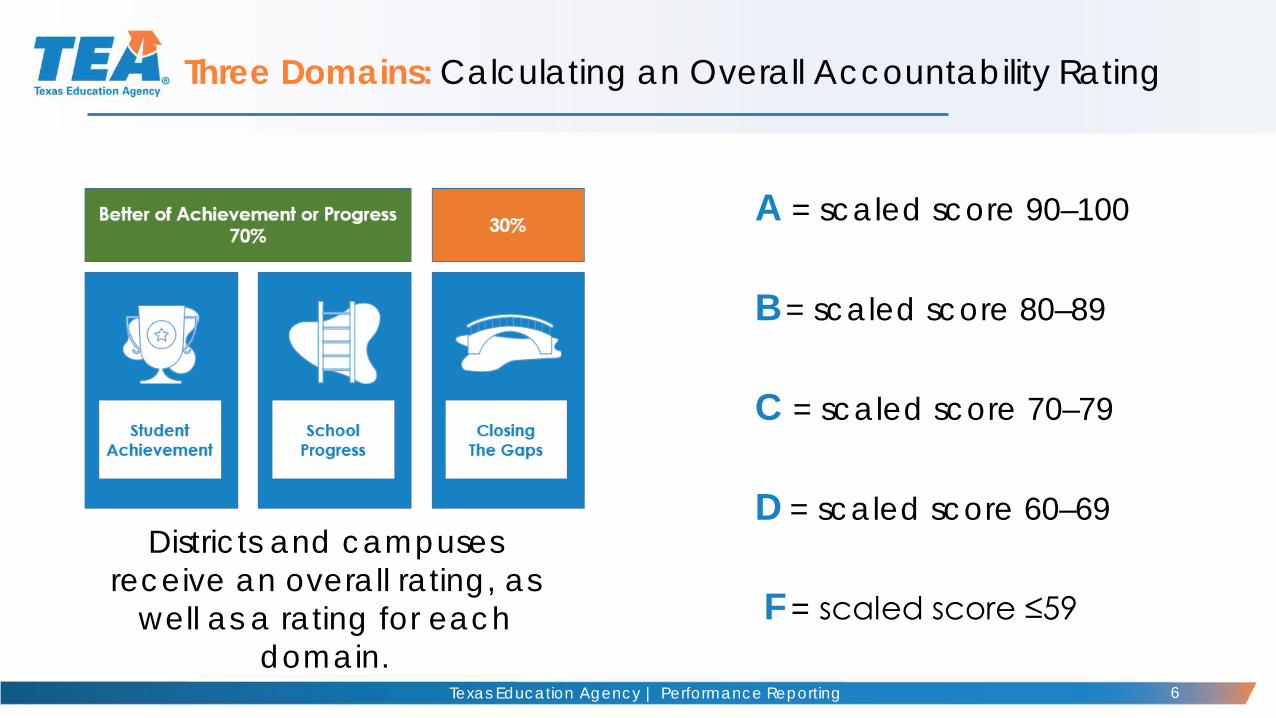
School Progress: Two Aspects of Progress
The School Progress domain measures district and campus outcomes in two areas:
• the number of students that grew at least one year academically (or maintained performance) as measured by STAAR results
• the achievement of students relative to districts or campuses with similar economically disadvantaged percentages
Better of Part A: Academic Growth
or Part B: Relative Performance
Texas Education Agency | Performance Reporting 15

School Progress Domain, Part A: Academic Growth
School Progress, Part A: Academic Growth includes all assessments with a STAAR progress measure. Districts and campuses (including high schools) earn credit for results that maintain performance or meet growth expectations on STAAR.
Part A: Academic Growth
16Texas Education Agency | Performance Reporting
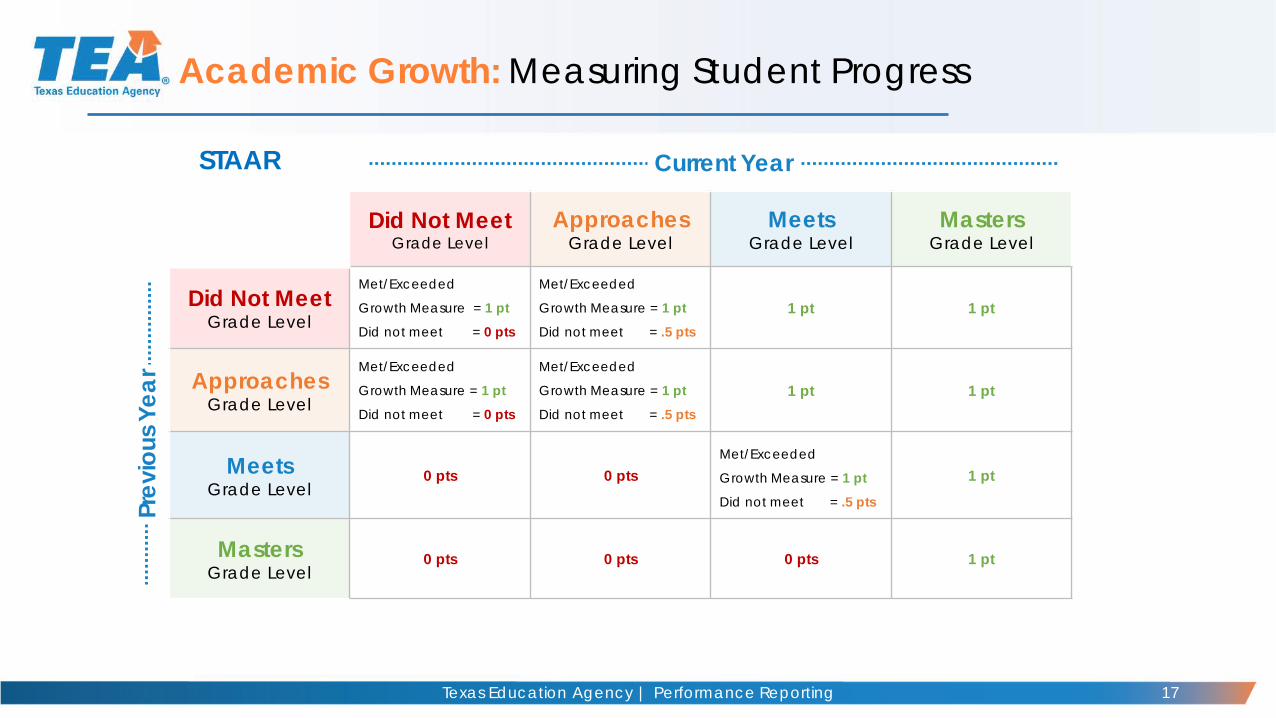
Academic Growth: Measuring Student Progress
STAAR Current YearPr
evio
us Y
ear
Did Not Meet Grade Level
Approaches Grade Level
MeetsGrade Level
Masters Grade Level
Did Not Meet Grade Level
Met/Exceeded
Growth Measure = 1 ptDid not meet = 0 pts
Met/Exceeded
Growth Measure = 1 ptDid not meet = .5 pts
1 pt 1 pt
Approaches Grade Level
Met/Exceeded
Growth Measure = 1 ptDid not meet = 0 pts
Met/Exceeded
Growth Measure = 1 ptDid not meet = .5 pts
1 pt 1 pt
MeetsGrade Level
0 pts 0 ptsMet/Exceeded
Growth Measure = 1 ptDid not meet = .5 pts
1 pt
Masters Grade Level
0 pts 0 pts 0 pts 1 pt
17Texas Education Agency | Performance Reporting

Academic Growth: Measuring Student Progress
STAAR Alternate 2
Current YearPr
evio
us Y
ear
Level I: Developing
Level II: Satisfactory
Level III: Accomplished
Level I: Developing
Met/Exceeded Growth Measure = 1 ptDid not meet = 0 pts
1 pt 1 pt
Level II: Satisfactory
0 ptsMet/Exceeded Growth Measure = 1 ptDid not meet = .5 pts
1 pt
Level III: Accomplished
0 pts 0 pts 1 pt
18Texas Education Agency | Performance Reporting

School Progress Domain: Two Aspects to Progress
Texas Education Agency | Performance Reporting
Part A: Academic Growth Part B: Relative Performance
19

Part B: Relative Performance
School Progress, Part B: Relative Performance evaluates the achievement of all students relative to districts or campuses with similar socioeconomic statuses.
Relative Performance: Measuring School Progress
20Texas Education Agency | Performance Reporting

Relative Performance: Measuring School Progress
Texas Education Agency | Performance Reporting
At this high school, 70.0% of students were identified as economically disadvantaged on the TSDS PEIMS October snapshot. The campus earned a 52 averaged Student Achievement STAAR (47 component score) and CCMR (57 component score) components.
In this case, the high school would earn a B in School Progress, Part B: Relative Performance.
Example High School
* This image is for illustrative purposes only and is only meant to provide a general idea of the methodology used for School Progress, Part B.
21
SchoolProgress
Closing the Gaps Domain
Student Achievement
Texas Education Agency | Performance Reporting 22

Closing the Gaps Domain: Ensuring Educational Equity
Student Groups• All Students• African American • Hispanic• White• American Indian• Asian• Pacific Islander• Two or More Races• Economically Disadvantaged• Current Special Education• Former Special Education• Current and Monitored English Learners• Continuously Enrolled• Non-Continuously Enrolled
Components• Academic Achievement in Reading and
Mathematics (At Meets Grade Level or Above)
• Growth in Reading and Mathematics (Elementary and Middle Schools)
• 4-year Federal Graduation Rate (High Schools, K–12, and Districts)
• College, Career, and Military Readiness(High Schools, K–12, and Districts)
• Student Achievement Domain Score:STAAR Component Only (Elementary and Middle Schools)
• English Language Proficiency Status
23Texas Education Agency | Performance Reporting

Closing the Gaps Domain: Calculating a Rating
Texas Education Agency | Performance Reporting
Student Group Achievement Target
% of Student Groups that Meet Target
OverallDomain Grade
24

Closing the Gaps Indicator Targets
Texas Education Agency | Performance Reporting 25

Closing The Gaps
SchoolProgress
Student Achievement
Better of Achievement or Progress70% 30%
Calculating an Overall Rating
26Texas Education Agency | Performance Reporting

Calculating an Overall Rating: Example
27Texas Education Agency | Performance Reporting
Scaled scores were created to align letter grades and scores used in the A–F academic accountability system to the common conception of letter grades.
Domain
Student Achievement
Scaled Score
89
Better of School Progress Part A
or Part B
Better of Student Achievement or WeightSchool Progress
89 70%
Weighted Points
62.3
School Progress, Part A 84 84
School Progress, Part B 72
Closing the Gaps 81 30% 24.3
Overall Score 872020 Overall Rating B

Questions
Resources• http://tea.texas.gov/A-F• https://tea.texas.gov/perfreport/resources/index.html
Sign up for the Performance Reporting weekly bulletin:
28Texas Education Agency | Performance Reporting

Performance Reporting Resources and Contacts
Performance Reporting Home Pagehttp://tea.texas.gov/accountability/
TEA ESSA Pagehttps://tea.texas.gov/ESSA/
Performance Reporting Email [email protected]
Performance Reporting Telephone (512) 463-9704
29Texas Education Agency | Performance Reporting

Thank you!


![2015 Adequate Yearly Progress Report - California … accountability system (or the Academic Performance Index [API]) for two years to focus on the development of a new state accountability](https://img.dokumen.tips/doc/110x75/5b4059637f8b9aff118d32fd/2015-adequate-yearly-progress-report-california-accountability-system-or-the.jpg)