Embed Size (px)
Citation preview

Port Freight Statistics notes and definitions 2020 - Page 1
Port Freight Statistics2020: notes and definitions
IntroductionDepartment for Transport statistics
on UK port traffic are published in
two stages: (1) provisional quarterly
releases, published 10 weeks
after the end of the quarter. (2)
more detailed final annual release,
published in summer of the following
year.
All port freight statistics are published
through the maritime and shipping
series on the DfT statistics web page:
https://www.gov.uk/government/
collections/maritime-and-shipping-
statistics.
In this publicationDefinitions ............................... p1
Data collection and processing p4
Port freight statistics
Ship arrivals statistics
Domestic waterborne freight
Published tables..................... p8
Changes to tables
Revisions
Related data sources -
comparison with port freight
statistics .................................p11
Annex A: UK ports covered ... p16
Annex B: Cargo classification p23
Annex C: Previous processing
methods .................................p25
Purpose and usageThese statistics relate to freight traffic to and from ports in the United Kingdom. They provide an overview of patterns and trends in cargo handled by ports which inform the work of the Department for Transport (DfT) Maritime Directorate, as well as others with an interest such as industry stakeholder organisations, academics and researchers. The statistics were used to fulfil Eurostat reporting requirements under the Maritime Statistics Directive, which will continue to maintain a consistent time series and allow comparisons with other countries.
This document outlines the coverage of these statistics, including information on data sources and processing methodology as well as changes which have occurred to both methods and published outputs.
For more detailed information about the quality of the statistics, users and uses and responses to user feedback, please see the accompanying Port Freight statistics: Background Quality Report.
1. Definitions
Ports covered These statistics relate to freight traffic to and from ports in the United Kingdom, unless otherwise stated, and do not cover ports in the Isle of Man or the Channel Islands.
Major and minor ports. From 2000, major ports are those with cargo volumes of at least 1 million tonnes annually. There are in some years a small number of ports with less tonnage who have either just fallen below the threshold, are showing a trend that they will exceed 1 million tonnes within a year, or have previously handled more than 1 million tonnes of cargo in a year. Prior to 2000 the threshold for ‘major’ ports was 2 million tonnes of cargo annually.
Details of the major and minor ports included are given in Annex A.

Port Freight Statistics notes and definitions 2020 - Page 2
More detailed data are collected for major ports than for the remaining ‘minor’ ports. All tables starting PORT01 have been supplemented by estimated breakdowns of the minor port traffic.
Cargo classificationCargo types. Major port traffic is classified by cargo type, which is the means by which goods are loaded onto or off the vessel. Although for some cargo types there is further subdivision into broad commodities, the method of loading takes priority. Detail of these classifications are set out in Annex B on page 23.
Weights. All weights stated are tonnes gross, including crates and other packaging. The tare weights of containers, road goods vehicles, trailers and other items of transport equipment (i.e. the unloaded weight of the vehicle or equipment itself) are excluded.
Unitised goods. Goods which are lifted on or off the vessel in large (20 foot or longer) shipping containers, or rolled on or off in one of a variety of self propelled or towed units are said to be unitised cargoes. For these cargo types, the number of units as well as the weight of goods is recorded.
Main freight units. A subset of unitised goods are main freight units – this group consists of all containers and those Ro-Ro units which are designed to carry freight (categories 51, 61 and 63 in the cargo type table on page 7). The purpose of the main freight unit classification is that it excludes those Ro-Ro units which are not freight carrying – i.e. passenger vehicles, trade vehicles, and other specialised vehicles and trailers.
Container traffic. For the purpose of maritime statistics, the classification of containers is based purely upon their length as shown in the table. TEU (twenty-foot equivalent units) is a standardised measure to allow for the different sizes of container boxes.
Containers carried on board Ro-Ro vessels by shipborne port-to-port trailers are not included from 2000 onwards, although some operators incorrectly continued to include them until 2004 (see annex C on page 25 for details).
Vessel informationSeveral of the data tables provide a breakdown by vessel characteristics.
In table PORT0604 nationality refers to the nationality of the parent owner of the carrying vessel. In table PORT0605 the flag denotes the country authorising the registry of the vessel. See Shipping Fleet Statistics tables for more information on shipping fleets at https://www.gov.uk/government/statistics/shipping-fleet-statistics-2018.
Arrivals statistics - shown in tables PORT0601 and PORT0602 - include a vessel type breakdown (outlined on page 6).
Size TEU20ft 140ft 2>20ft & <40ft 1.5
>40ft 2.25

Port Freight Statistics notes and definitions 2020 - Page 3
Geographical breakdown UK port traffic is classified geographically according to where the goods were last loaded or next unloaded at the other end of the sea journey. All traffic is either domestic or international. Domestic traffic is either coastwise or one-port. International traffic is either short sea or deep sea, and short sea traffic may be further divided according to whether or not it is with another EU member state. A more detailed description of these terms is given in the following table.
Geographical classification of UK port trafficDomestic Coastwise Traffic between ports in the United Kingdom (and with the Isle of Man and
the Channel Islands). The totals of inwards and outwards coastwise traffic, however, do not match exactly. This is mainly because traffic between major and minor ports, or between major ports and ports in the Isle of Man and the Channel Islands, are not recorded at both ends (as is the case with coastwise traffic between major ports), but only at the major port end.
One-port Dredged sand, gravel etc, landed at a port for commercial purposes; and traffic to and from UK offshore oil and gas installations (traffic with non-UK offshore oil and gas installations is recorded as foreign traffic). Formerly also included material shipped for dumping at sea, until this practice ceased.
International Short sea EU (as at 1 July 2013)
Traffic with Belgium, Bulgaria, Cyprus, Denmark (including Faroe Islands), Croatia, Estonia, Finland, France, Germany, Greece, Italy, Latvia, Lithuania, Malta, Netherlands, Poland, Portugal (including Madeira and Azores), Republic of Ireland, Romania, Spain (including the Canary Islands), Slovenia, Sweden.
Other Europe & Mediterranean
Traffic with Albania, Algeria, Azerbaijan, Croatia, Egypt, Georgia, Gibraltar, Iceland, Israel, Lebanon, Libya, Monaco, Morocco, Norway, Russia, Syria, Tunisia, Turkey, Ukraine.
Deep sea Rest of world Traffic with all countries of Africa (excluding Mediterranean countries), America (both North and South America), Asia (excluding Mediterranean and Black Sea countries) and Australasia.

Port Freight Statistics notes and definitions 2020 - Page 4
2. Data collection and processing
The figures included in the port freight statistics come from several sources. The current collection arrangements for port freight traffic statistics - outlined in part A below - were introduced in 2000 to meet the requirements of the EC Maritime Statistics Directive (Council Directive 95/64/EC on statistical returns in respect of the carriage of goods and passengers by sea, recast as Directive 2009/42/EC). Whilst the way in which providers submit information has changed several times, the scope of the collection has remained basically unchanged since 2000 when it was introduced.
Additionally, tables PORT0601 and PORT0602 provide information on vessels arriving at UK ports. These are compiled from a range of data sources (outlined in part B, below).
The port freight data tables also include information on domestic waterborne freight (DWF) in tables PORT0701 - PORT0705; this is based on re-analysis of information from the port freight system and additional information on inland waterway movements. Key differences are summarised in section C below, with further details in the separate notes and definitions document for DWF.
A: Port freight statisticsData collection. Data are collected from major ports and shipping lines and agents, on a quarterly basis, and from minor ports annually - in accordance with the Directive. Data providers can submit returns online using the Department’s ‘submit maritime statistics’ website or in flat file format. Full details - including collection forms, instructions and code lists - are available in the guidance for data providers: https://www.gov.uk/government/publications/maritime-statistics-directive-reporting-guidance.
From 2019, DfT collate the data, carry out initial validation checks, and also operate a helpdesk to identify and follow up non-respondents (prior to 2019, this process was managed by a separate collection agency). At the end of each quarter and year, additional checks are carried out, including the cross-comparison of port and agent records, and comparisons with previous time periods. Major anomalies are followed up with data providers. Further details of the collection and the quality assurance carried out, and strengths and limitations of the data, can be found in the separate background quality report (BQR).
Compilation methodology. Published figures are based on annual totals by cargo type and direction provided by ports.
From 2000 all freight estimates shown in the tables which have a geographic element (e.g. imports, exports, foreign, domestic traffic) have been estimated by grossing procedures based on information supplied by shipping lines and agents. Port figures are used as control totals, and figures from agents are grossed to port totals on annual basis to provide a breakdown by route and vessel information which is not collected from ports. Further details of this grossing are given in the BQR.
Before 2000, this information has been estimated by ports but only approximately in many cases. The post-2000 collection arrangements provide more reliable geographic information, i.e. estimates of imports, exports, foreign, coastwise, one-port traffic, traffic on individual routes, etc.

Port Freight Statistics notes and definitions 2020 - Page 5
B: Ship arrivals statisticsThe PORT0601 and PORT0602 data tables present statistics on the number of arrivals of commercial cargo and passenger ships at UK ports. These statistics are based largely on different sources of data to the statistics on cargo handled obtained through the port freight collection system described above.
The data are considered a reasonably accurate estimate of the number of commercial shipping movements at UK ports, but are not necessarily exact, and the coverage of certain vessel or traffic types may be variable at the margins. Consequently, these data are not classified as National Statistics.
The methods for compiling the statistics were substantially revised for 2010 data (and 2009 was also re-cast on the new basis, so that 2009 estimates are available on both bases for comparison). and again for 2018 data (with 2017 being shown for both old and new methods). Previous approaches are outlined in Annex C, and the current method summarised below.
Arrivals statistics current methodology. The statistics are compiled on data from three sources:
1. Data from the Maritime and Coastguard Agency Consolidated European Reporting System (CERS), which is based on a mandatory reporting procedure for vessels arriving at UK ports. This includes information on around 100,000 vessel arrivals per year, although some regular services (mostly ferries) are exempt and it appears that some non-cargo vessels are not covered.
2. Data collected by DfT for monthly and annual sea passenger statistics. This source provides information on vessel arrivals for vessels which carry passengers, which includes the vast majority of those not captured by CERS
3. Data collected as part of the port freight collection system as outlined above. Both ports and shipping agent returns capture information about cargo vessel voyages and this information is used where information is not available from one of the above two sources.
The overall estimates of arrivals are compiled by taking the best estimate from the above three sources for each vessel and port combination, and aggregating them.
Comparison with previous approaches. The main change in the calculation method for 2018 was to replace data previously purchased from Lloyds List Intelligence (LLI) with data freely available from CERS. These sources differ in coverage, particularly for non-cargo vessels and minor ports - some of which are not well covered in CERS. A detailed comparison for the years for which both estimates are available suggests that these are not systematic; in some cases CERS counts more vessels and in some cases less, but overall for most ports there was a good agreement between the different approaches.
Users should note that the arrival statistics are best estimates based on the data available, and subject to limitations. In comparing LLI and CERS data, it was noted that some movements within ports (for example, between different terminals within Milford Haven port) were being counted. Such movements have been excluded from the figures calculated under the new approach, wherever possible, which is one reason why the figures on the new basis are generally lower.
Port Freight Statistics notes and definitions 2020 - Page 6
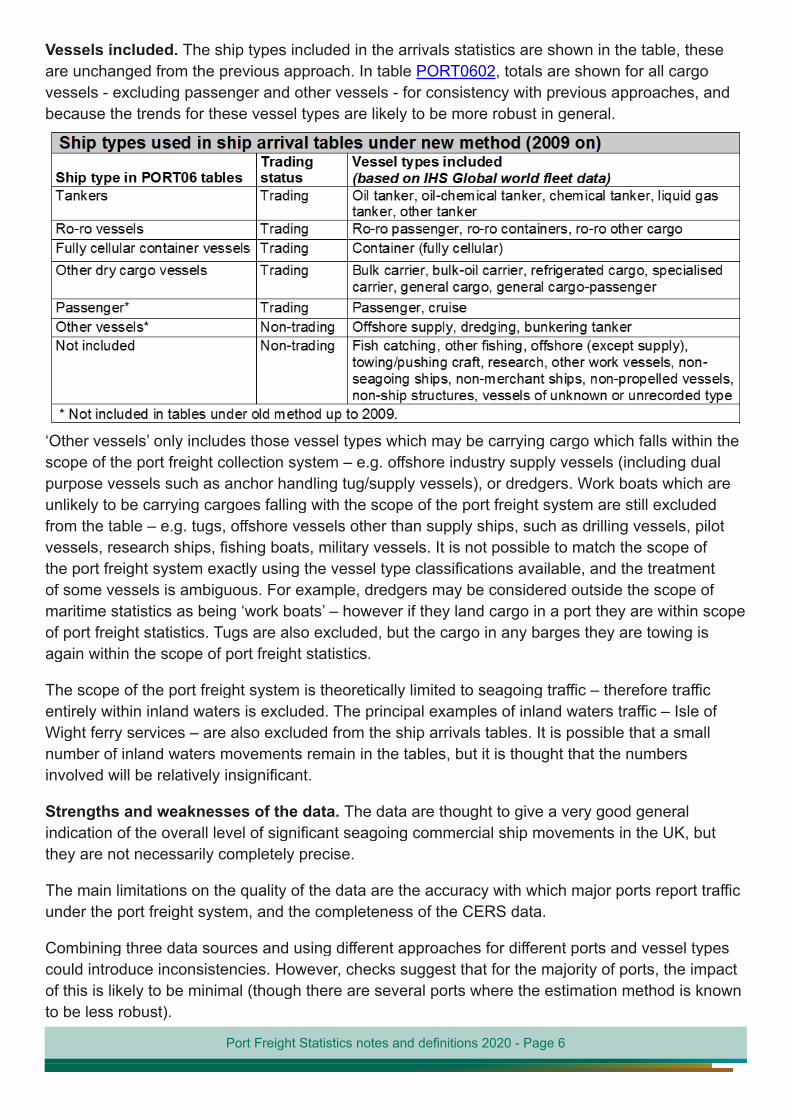
Vessels included. The ship types included in the arrivals statistics are shown in the table, these are unchanged from the previous approach. In table PORT0602, totals are shown for all cargo vessels - excluding passenger and other vessels - for consistency with previous approaches, and because the trends for these vessel types are likely to be more robust in general.
‘Other vessels’ only includes those vessel types which may be carrying cargo which falls within the scope of the port freight collection system – e.g. offshore industry supply vessels (including dual purpose vessels such as anchor handling tug/supply vessels), or dredgers. Work boats which are unlikely to be carrying cargoes falling with the scope of the port freight system are still excluded from the table – e.g. tugs, offshore vessels other than supply ships, such as drilling vessels, pilot vessels, research ships, fishing boats, military vessels. It is not possible to match the scope of the port freight system exactly using the vessel type classifications available, and the treatment of some vessels is ambiguous. For example, dredgers may be considered outside the scope of maritime statistics as being ‘work boats’ – however if they land cargo in a port they are within scope of port freight statistics. Tugs are also excluded, but the cargo in any barges they are towing is again within the scope of port freight statistics.
The scope of the port freight system is theoretically limited to seagoing traffic – therefore traffic entirely within inland waters is excluded. The principal examples of inland waters traffic – Isle of Wight ferry services – are also excluded from the ship arrivals tables. It is possible that a small number of inland waters movements remain in the tables, but it is thought that the numbers involved will be relatively insignificant.
Strengths and weaknesses of the data. The data are thought to give a very good general indication of the overall level of significant seagoing commercial ship movements in the UK, but they are not necessarily completely precise.
The main limitations on the quality of the data are the accuracy with which major ports report traffic under the port freight system, and the completeness of the CERS data.
Combining three data sources and using different approaches for different ports and vessel types could introduce inconsistencies. However, checks suggest that for the majority of ports, the impact of this is likely to be minimal (though there are several ports where the estimation method is known to be less robust).

Port Freight Statistics notes and definitions 2020 - Page 7
C: Domestic Waterborne Freight (DWF) statisticsAs of the 2019 statistics (published in August 2020), figures for domestic waterborne freight (DWF) are presented alongside the port freight statistics and included in the same statistical release. The publication of the 2020 DWF statistics were postponed to September 2021 following the identification of a data issue which affects the internal flow figures, which affects data from 2015 onwards. Data tables PORT0701 to PORT0705 contain DWF data.
DWF statistics are based largely on data collected through the port freight collection system, but processed differently and with some additional sources, which include:
• Inclusion of data for inland waterway movements, which comes from a survey of barge operators, further information for inland movements (such as between Liverpool and Manchester) collected as part of the port freight system but not included in the port freight figures, and estimates for minor ports. It should be noted that when looking at internal waterways traffic, in 2019, more companies responded the Barge Survey and hence, internal waterways traffic may have seen an increase in their annual figures because of this.
• Counting coastwise movements in only one direction; in the port freight statistics, coastwise domestic movements are reported twice - by the inwards and outwards ports. For DWF, one direction is counted (which is the one with the highest tonnage reported overall)
• Calculation of figures for good moved, as well as good lifted (i.e. tonnage)
There are separate notes and definitions for the DWF statistics which cover the methodology used in more detail.

Port Freight Statistics notes and definitions 2020 - Page 8
3. Published tables and revisions
Publication arrangements: provisional and final statisticsPort freight statistics are published in two stages in order to put usable information in the public domain as early as possible:
(1) Provisional quarterly results are published approximately 10 weeks after the end of the quarter to which they relate. These statistics are based on high level quarterly returns provided by major ports. Data are available for total weight of goods and number of units, inwards and outwards for each responding port. These figures may be subject to revision if subsequent checks at the year end highlight anomalies. Typically a very small number of ports do not provide data in time for publication, in which case figures are estimated. Typically this applies to a small number of ports and has a minimal impact on the overall national trends shown.
(2) Final detailed annual results are published about 7 months after the year end. These statistics are based on annual returns provided at the end of the year by each major port and minor port. A split into broad cargo type is available for each major port. At this stage a full reconciliation of port and shipping agent data will have been carried out, and grossing of the final data completed and checked. The detailed results are based on this grossed data. At this stage the full range of analyses, including those by route and vessel type are available.
Prior to the 2018 publication, statistics on DWF were published separately from the port freight statistics, however from 2018 onwards they have been included in one annual publication. Due to the identification of a data issue which affects the internal flow figures, affecting data years 2015 onwards, the publication of the 2020 DWF statistics were postponed to September 2021.
PORT data tablesData tables published as part of the port freight series, including those containing data on ship arrivals and domestic waterborne freight, have the prefix PORT. Details of changes to published tables and how we work with users are given in the background quality report, but recent changes include:
• For the 2017 statistics (published 2018), the format of the data tables was revised, introducing ‘filterable’ data tables to provide a greater range of information to users. A mapping between the old and new table numbers is available on the data tables page.
• For the 2018 statistics (published in 2019), more minor changes were made, in particular the presentation of the arrivals tabes (PORT0601 and PORT0602) was changed to be more in line with the other port freight tables.
• For the 2019 statistics (published in 2020), more minor changes were made, in particular adding gross tonnage values to the arrivals table PORT0601.
Downloadable data file (PORT0499). This special file is designed to allow advanced users to filter for or download data for their own analyses. The data are disaggregated as far as is consistent with maintaining commercial confidentiality. Most of our published tables also have the raw data available within a ‘Data’ worksheet for use by interested users. PORT0499 contains data

Port Freight Statistics notes and definitions 2020 - Page 9
by number of tonnes as well as units. Note that not all unitised cargo types are capable of carrying cargo therefore tonnage and units results should only be compared for those types of unit which can do so.
The tables contain data by year (from 2000), UK port, region of loading/unloading, country of loading/unloading, cargo category (at two different levels of detail) and direction of movement. Very small flows have been aggregated to world region totals to help maintain confidentiality.
Small flows. Small flows are defined by direction of travel and consist of unitised traffic weighing less than 500 tonnes and containing less than 200 units, or non-unitised traffic weighing less than 500 tonnes. In some of the data tables, these small flows are aggregated to preserve the commercial sensitivity of our data providers, as otherwise this data could identify specific shipping lines or agents.
RevisionsWhere there are notable changes impacting on coverage of the published figures, these are noted in relevant changes. For example, Stranraer port closed in November 2011 and its operations were transferred to neighbouring Loch Ryan port.
Aside from the scheduled updating of the provisional figures noted above, revisions are occasionally made to correct inaccuracies. This includes minor corrections as follows:
• Statistics during 2013 for freight handled by UK ports were revised to correct a small error found in the final statistics published on 27 August 2014. The original statistics included some under-reporting due to a data supply issue identified through ongoing quality assurance processes.
• Statistics during 2016 were revised to correct for a small error found in the tables and release published in September 2017.
• During the production of the new published data tables in 2018, a series of minor errors were found on historical tables, mostly related to operations transferring between co-located minor ports and a reallocation of some cargo volumes (totals are not affected as a result). These have been indicated with an ‘r’ on the relevant table for that data point.
• For the 2018 statistics, a minor revision was made to the vessel arrival statistics (tables PORT0601 and PORT0602) for Cairnryan port for years 2014-16, to correct some double counting identified.
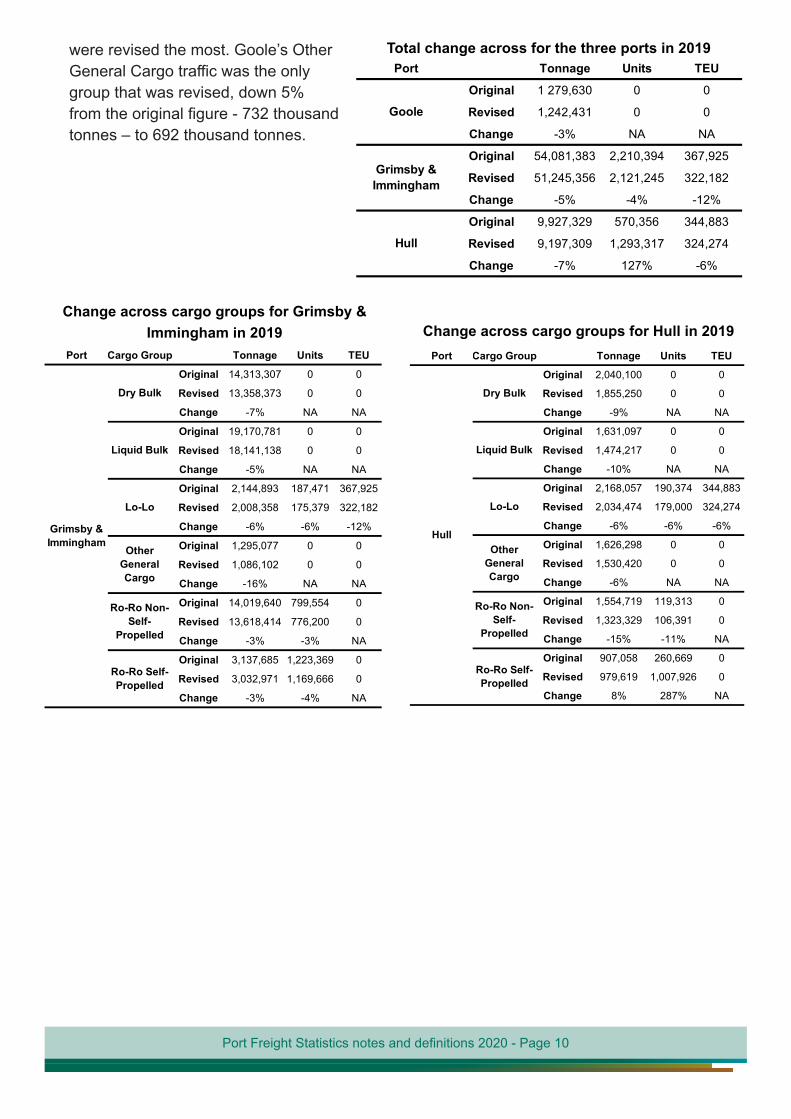
• 2019 statistics were revised in the 2020 publication, published on 14 July 2021, due to volumes submitted for three ports - Goole, Grimsby & Immingham and Hull - being incorrectly inputted by the data provider. These revisions have resulted in there being an overall decrease in the volume of tonnage, and increase in the volume of units, between 2018 and 2019, which contradicted the original figures. TEU’s rose over the same period, but to a lesser extent after the revision. A summary of the revisions can be found in the below tables, as well as a cargo group breakdown of the changes for Grimsby & Immingham, and Hull, which
Total change across all UK major ports in 2019
Tonnage Units TEU
Original 475,342,590 23,269,929 10,534,455
Revised 471,739,344 23,903,741 10,468,103
Change -1% 3% -1%
t o
Port Freight Statistics notes and definitions 2020 - Page 10
were revised the most. Goole’s Other General Cargo traffic was the only group that was revised, down 5% from the original figure - 732 thousand tonnes – to 692 thousand tonnes.
Total change across for the three ports in 2019Port Tonnage Units TEU
Original 1 279,630 0 0
Revised 1,242,431 0 0
Change -3% NA NA
Original 54,081,383 2,210,394 367,925
Revised 51,245,356 2,121,245 322,182
Change -5% -4% -12%
Original 9,927,329 570,356 344,883
Revised 9,197,309 1,293,317 324,274
Change -7% 127% -6%
Goole
Grimsby & Immingham
Hull
Change across cargo groups for Grimsby & Immingham in 2019
Port Cargo Group Tonnage Units TEU
Original 14,313,307 0 0
Revised 13,358,373 0 0
Change -7% NA NA
Original 19,170,781 0 0
Revised 18,141,138 0 0
Change -5% NA NA
Original 2,144,893 187,471 367,925
Revised 2,008,358 175,379 322,182
Change -6% -6% -12%
Original 1,295,077 0 0
Revised 1,086,102 0 0
Change -16% NA NA
Original 14,019,640 799,554 0
Revised 13,618,414 776,200 0
Change -3% -3% NA
Original 3,137,685 1,223,369 0
Revised 3,032,971 1,169,666 0
Change -3% -4% NA
90 058 60 66 0
Grimsby & Immingham
Dry Bulk
Liquid Bulk
Lo-Lo
Other General Cargo
Ro-Ro Non-Self-
Propelled
Ro-Ro Self-Propelled
Change across cargo groups for Hull in 2019
O ig na 19 1 0 781 0
Revised 138
h nge
riginal 9 3
vise 58 2
a g N
Origi al 19 6 0 7 4 0
evi d 8,41 77 0 0
ang %
Port Cargo Group Tonnage Units TEU
Original 2,040,100 0 0
Revised 1,855,250 0 0
Change -9% NA NA
Original 1,631,097 0 0
Revised 1,474,217 0 0
Change -10% NA NA
Original 2,168,057 190,374 344,883
Revised 2,034,474 179,000 324,274
Change -6% -6% -6%
Original 1,626,298 0 0
Revised 1,530,420 0 0
Change -6% NA NA
Original 1,554,719 119,313 0
Revised 1,323,329 106,391 0
Change -15% -11% NA
Original 907,058 260,669 0
Revised 979,619 1,007,926 0
Change 8% 287% NA
Hull
Dry Bulk
Liquid Bulk
Lo-Lo
Other General Cargo
Ro-Ro Non-Self-
Propelled
Ro-Ro Self-Propelled
i
L L
G Carg
R Se f-

Port Freight Statistics notes and definitions 2020 - Page 11
4. Strengths and weaknesses of these statistics
Port freight statistics undergo an extensive data validation exercise comparing data obtained from UK ports with data from shipping agents and operators (outlined in the background quality report). It is also possible to assess the quality of port freight statistics by comparing with other National Statistics, such as those produced by Her Majesty’s Revenue & Customs (HMRC).
Port freight statistics: comparison with related data sourcesHMRC’s Overseas Trade statistics record the movement of goods for trade purposes between the UK and non-EU countries. Detailed documentation of this system is available on the UK trade info website.
The two datasets can be compared to investigate whether there are similarities in reporting coverage and whether international port freight trends for imports and exports are consistent over time. Overall, the two data sources follow a similar trend in recent years, however, HMRC import and export statistics tend to be consistently smaller than those from DfT port freight statistics. It should be noted that HMRC reports the location of where the goods are cleared through customs, and this may be different from the port where the goods entered or exited the country.
UK major port non-EU international imports and exports from HMRC and DfT, 2010-2020
Even though HMRC data reports the cargo where it has cleared customs, as stated above, the location of where it was cleared may be different from the port of unload. To tackle specific geographical differences, it is interesting to observe the differences that might exist between countries in the United Kingdom, in order to improve the detail of the checks in the reporting of particular major ports.
In the next page, you will find a comparison for total freight imported and exported in the four UK countries.

Port Freight Statistics notes and definitions 2020 - Page 12
UK major port non-EU international freight from HMRC and DfT by UK country, 2010-2020
Trends seem to be very similar for both data sources across the different countries, with constant differences for England and Northern Ireland as a consequence of over-reporting of dry bulk in port freight statistics, differences for Scotland driven by crude oil and oil products and caused by other liquid bulk cargo in the case of Wales. Nevertheless, as shown in the table below, correlation between series for each country are close to 1, with the exception of Scotland.
England Northern Ireland Scotland Wales Correlation 0.89 0.82 0.45 0.85
Additionally, it is possible to look at this data source at the cargo category level, by comparing the tonnage of non-EU freight. This comparison is made by using a look up table that joins HMRC commodity codes, known as the Harmonised System of tariffs, to DfT cargo codes, as established by the European Commission Maritime Statistics Directive (95/64/EU).

Port Freight Statistics notes and definitions 2020 - Page 13
Data from both sources for 2010 to 2020 for each subgroup were analysed with the findings discussed in detail below. Note that all comparisons are for non-EU UK major port traffic only.
Comparison of DfT port statistics and HMRC trade data, UK energy commodity traffic, 2020
Data Source Imports Exports Imports Exports Imports Exports Imports ExportsHMRC 14.4 0.4 36.4 11.4 12.6 4.0 15.2 6.6Port Freight Statistics 13.6 0.5 33.1 9.1 12.0 4.8 31.2 5.4Difference
Tonnage -0.9 0.1 -3.3 -2.4 -0.6 0.8 16.0 -1.2Percentage -6% 19% -9% -21% -5% 20% 106% -18%
Liquefied Gas Crude Oil Oil Products Dry Bulk
Liquefied gasFor the liquefied gas cargo category we can see that the two data sources have very similar trends and the reported tonnages are extremely similar. There is a slight difference in the coverage of the two sources for imports, especially between 2017 and 2019, but the trends followed are almost identical, with 2020’s volumes being similar. For exports, although the values are very low, the differences are still minor.
UK major port non-EU imports and exports of liquefied gas, HMRC and DfT, 2010-2020
Crude oilIn the trends for crude oil imports, the differences have greatly reduced in the last years, probably driven by better reporting of port freight statistics. For exports, correlation is near 0.93, which shows that both series have followed very similar trends across time. Again, in this case, the differences for exports could be driven by slightly poorer coverage of traffic from the port freight statistics.

Port Freight Statistics notes and definitions 2020 - Page 14
UK major port non-EU imports and exports of crude oil, HMRC and DfT, 2010-2020
Oil productsIn the trends for oil products imports, the differences have reduced in the last years, probably driven by better reporting of port freight statistics and better categorisation of cargo. Trends for both directions are very similar, although it should be highlighted that for imports, there have been several years where there has been noticeable differences between the two sources, such as 2017 and years prior to 2015. Nevertheless, absolute differences are very small for exports and almost negligible for imports in 2020.
UK major port Non-EU imports and exports of Oil Products, HMRC and DfT, 2010-2020

Port Freight Statistics notes and definitions 2020 - Page 15
Dry bulkStatistics for dry bulk follow similar trends for both directions, with correlations of 0.94 and 0.60 for imports and exports respectively. Differences for imports are mainly driven by poor categorisation of bulk agricultural goods in port freight statistics, which seems to be constant across time. When only considering the cargo categories ores and coal, the percentage difference of imports decreases from 106% to 25% in 2020.
UK major port Non-EU imports and exports of Dry Bulk, HMRC and DfT, 2010-2020
In conclusion, these comparisons show that these two National Statistics on freight goods products are broadly quite similar. Further investigation of possible over-reporting or wrong categorisation of dry bulk could lead to better reporting of port freight statistics.
Biomass estimatesAdditionally, the biomass estimates provided on this publication are based on a commodity look up that filters HMRC Overseas Trade Statitsics data for those goods that are used as biomass fuel (wood pellets, agricultural residues, seeds...). With these cargo codes and an estimation of the importance of maritime freight in the biomass market, tonnage and value estimates have been generated for both EU and non-EU imports/exports.

Port Freight Statistics notes and definitions 2020 - Page 16
Annex A: United Kingdom ports
Listed below are all the ports which were considered as active major or minor ports for the purposes of compiling the 2020 port freight statistics.
Major portsAberdeenBelfastBostonBristolCairnryanCardiffClydeCromarty FirthDoverDundeeFelixstoweFishguardForthFoweyGlensandaGooleGreat Yarmouth
Grimsby and ImminghamHarwichHeyshamHolyheadHullIpswichKilroot Power Station JettyLarneLiverpoolLoch RyanLondonLondonderryManchesterMedwayMilford HavenNewhavenNewport
OrkneyPeterheadPlymouthPoolePort TalbotPortsmouthRamsgateRivers Hull and HumberRiver TrentShorehamSouthamptonSullom VoeSunderlandSwanseaTees & HartlepoolTyneWarrenpoint
Minor portsAppledoreArdrishaigAyrBarrowBarryBerwickBidefordBlythBridgwaterBrightlingseaBuckieBurry PortChichesterColeraineCorpachCowes, Isle of WightFalmouthFraserburghGarstonGill’s Bay ScotlandHughtown (St Mary’s)
InverkeithingInvernessKilrootKing’s LynnKyle of LochalshLancasterLerwickLittlehamptonLlandulasLowestoftMaldonMistleyMontroseMostynNeathNewport, Isle of WightPadstowPenzancePerthPort PenrhynPorthoustock
River OuseRyeScallowayScrabsterSeahamSharpnessSillothStornowaySutton BridgeTeignmouthTroonTruroWallaseaWeymouth & PortlandWhitstableWickWisbechWorkingtonYelland

Port Freight Statistics notes and definitions 2020 - Page 17
Full list of current and previous ports included in port freight statisticsIncludes some where freight operations have ceased.
United Kingdom Port Description Country of the United Kingdom
Major port for freight
Aberdeen Wharves within Aberdeen Harbour Scotland YesAppledore Wharf at Appledore Harbour England No
Ardrishaig Wharf at Ardrishaig Harbour on the Crinan Canal Scotland No
Ayr Wharves within Ayr Harbour Scotland No
Barnstaple Wharves at Barnstaple and Yelland Harbours England No
Barrow Wharves within Barrow Harbour (including the Furness peninsula) England No
Barry Wharves within Barry Harbour Wales NoBelfast Wharves within Belfast Harbour Northern Ireland YesBerwick Wharves within Berwick Harbour England NoBideford Wharves at Bideford Harbour England NoBlyth Wharves within Blyth Harbour England NoBoston Wharves within Boston Harbour England YesBridgwater Wharves on River Parrett England NoBrightlingsea Wharves at Brightlingsea Dock England No
Bristol About 40 wharves at Avonmouth and along River Avon England Yes
Buckie Wharves within Buckie Harbour Scotland NoBurghead Wharves at Burghead Scotland NoBurry Port Wharves within Burry Port Harbour Wales No
Cairnryan Wharf within Cairnryan Harbour, on Loch Ryan Northern Ireland Yes
Cardiff Wharves within Cardiff Harbour Wales YesCharlestown Wharf within Charlestown Harbour England No
Chichester Wharves at Chichester and Langstone Harbours England No
Clyde
Wharves on River Clyde and Forth of Clyde, including Clydeport, Hunterston and Ardrossan, and those on Loch Fyne and Loch Long
Scotland Yes
Colchester Wharves on River Colne England NoColeraine Wharves within Coleraine Harbour Northern Ireland No
Corpach Wharf at Corpach at south end of the Caledonian Canal Scotland No
Cowes Wharves on River Medina at Cowes Harbour, Isle of Wight England No
Cromarty Firth Wharves along Cromarty Firth, including Nigg and Invergordon Scotland Yes
Dartmouth Wharves at Dartmouth, Kingswear and Totnes on River Dart England No
Dean Point Wharf at Dean Point near Helston England No

Port Freight Statistics notes and definitions 2020 - Page 18
United Kingdom Port Description Country of the United Kingdom
Major port for freight
Dover Wharves within Dover Harbour England Yes
Dundee Wharves within Dundee Harbour on River Tay England Yes
Exmouth Wharf at Exmouth on River Exe England No
Falmouth Wharves at Falmouth Docks and within Falmouth Harbour (excluding Truro and Penryn on River Fal)
England No
Fareham Wharf at Fareham Harbour England NoFelixstowe Wharves within Felixstowe Harbour England YesFishguard Wharf within Fishguard Harbour Wales YesFleetwood Wharves within Fleetwood Harbour England YesFolkestone Wharves within Folkestone Harbour England No
Forth Wharves along the Firth of Forth including Houndpoint, Grangemouth, Leith, Rosyth and Braefoot
Scotland Yes
Fosdyke Wharf at Fosdyke Bridge, River Welland England No
Fowey Wharves within Fowey Harbour England YesFraserburgh Wharves within Fraserburgh Harbour Scotland No
Garston Wharves at Garston (port separate from Liverpool and Manchester) England No
Gills Bay, Scotland Wharf at Gills Bay Harbour (Caithness) Scotland No
Girvan Wharf within Girvan Harbour Scotland NoGlensanda Wharf at Glensanda on Loch Linnhe Scotland Yes
Goole Wharves at Goole Docks on River Ouse England Yes
Great Yarmouth Wharves within Great Yarmouth Harbour England Yes
Grimsby & ImminghamWharves at Grimsby and Immingham Harbours, including Killingholme, on south side of the River Humber
England Yes
Gweek Wharf on River Helford England No
HarwichWharves at Parkeston Quay and Navyard Wharf within Harwich Harbour
England Yes
Heysham Wharves within Heysham Harbour England Yes
Holyhead Wharves at Holyhead and on Isle of Anglesey Wales Yes
Hull Wharves at Hull Harbour on the north side of the River Humber England Yes
Inverkeithing Wharves at Inverkeithing Harbour Scotland NoInverness Wharves within Inverness Harbour Scotland No
Ipswich Wharves at Ipswich harbour on River Orwell England Yes
KilrootSalt Wharf at Kilroot (separate from the major port of Kilroot Power Station Jetty)
Northern Ireland No

Port Freight Statistics notes and definitions 2020 - Page 19
United Kingdom Port Description Country of the United Kingdom
Major port for freight
Kilroot Power Station Jetty Wharves for power station at Kilroot Jetty Northern Ireland Yes
King’s Lynn Wharves within King's Lynn Harbour England NoKyle of Lochalsh Wharf at Lochalsh Harbour Scotland NoLancaster Wharves at Glasson Dock, Lancaster England NoLarne Wharves within Larne Harbour Northern Ireland Yes
LerwickWharves within Lerwick Harbour and other harbours on Shetland Islands excluding Sullom Voe and Scalloway
Scotland No
Littlehampton Wharf within Littlehampton Harbour England No
Liverpool
Wharves along the River Mersey eastwards to and excluding Garston and the Manchester Ship Canal (includes Seaforth Dock, Bromborough and Tranmere Oil Terminal)
England Yes
Llandulas Wharves at Llandulas Wales NoLochaline Wharf at Lochaline Scotland No
Loch RyanStranraer port closed in November 2011. Its operations were transferred to neighbouring Loch Ryan Port.
Scotland Yes
London
The Port of London Authority area of the River Thames between Teddington and the North Sea (excluding the River Medway). Includes Tilbury, London gateway, Purfleet, Dartford and Dagenham.
England Yes
Londonderry Wharves within Londonderry Harbour Northern Ireland YesLowestoft Wharves within Lowestoft Harbour England NoMacduff Wharves within Macduff Harbour Scotland NoMagheramorne Wharf at Magheramorne Harbour Scotland NoMaldon Wharves on River Blackwater England No
Manchester Wharves along Manchester Ship Canal England Yes
Medway
Rivers Medway and Swale and their tributaries: about 29 wharves, including those at Sheerness, Thamesport, Rochester, Chatham, Ridham Dock and Queenborough
England Yes
Milford Haven Wharves at Milford Haven, including Pembroke Dock and Pembroke Port Wales Yes
Mistley Wharf on River Stour (Mistley Quay) England NoMontrose Wharves within Montrose Harbour Scotland NoMostyn Wharves within Mostyn Harbour Wales NoNeath Wharves on River Neath Wales NoNewhaven Wharves within Newhaven Harbour England YesNewlyn Wharves within Newlyn Harbour England No

Port Freight Statistics notes and definitions 2020 - Page 20
United Kingdom Port Description Country of the United Kingdom
Major port for freight
Newport Alexandra Dock and Newport Harbour: wharves on Alexandra Dock and River Usk
Wales Yes
Newport IOW Wharf at Newport, on River Medina (Isle of Wight) England No
OrkneyAll wharves on the Orkney Islands including Kirkwall, Flotta (oil terminal), Scapa Flow and Stromness
Scotland Yes
Padstow Wharf at Padstow Harbour England NoPar Wharf at Par Harbour England No
Penryn Wharf at Penryn on the River Fal above Falmouth England No
Penzance Wharves within Penzance Harbour England NoPerth Wharves within Perth Harbour Scotland No
PeterheadWharves within the whole of Peterhead Harbour including the off-shore wharves
Scotland Yes
Plymouth Wharves at Millbay Docks and within Cattewater Harbour England Yes
Poole Wharves within Poole Harbour England YesPort Askaig Wharves on Islay island Scotland NoPort Penrhyn Wharf within Port Penrhyn Wales NoPort Talbot Wharves at Port Talbot Harbour Wales YesPorthoustock Wharf at Porthoustock Quarry England NoPortrush Wharf at Portrush Harbour Northern Ireland NoPortsmouth Wharves within Portsmouth Harbour England YesRamsgate Wharves within Ramsgate Harbour England Yes
River Ouse Wharves on River Ouse, including Selby but excluding Goole England No
River TrentWharves on River Trent, including Kingsferry, Flixborough, Neap House and Gunness
England Yes
Rivers Hull & Humber
Wharves on River Hull and River Humber, including those at New Holland and Tetney (oil terminal) but excluding Hull and Grimsby & Immingham
England Yes
Rye Wharf within Rye Harbour England No
Sandwich Wharf at Richborough on the River Stour England No
Scalloway Wharves at Scalloway Harbour Scotland NoScrabster Wharf within Scrabster Harbour Scotland NoSeaham Wharves at Seaham Harbour England No
Sharpness (including Gloucester)
Wharves at Sharpness and Gloucester (River Severn upstream to Gloucester)
England No
Shoreham Wharves within Shoreham Harbour England YesShotton Wharf on River Dee England NoSilloth Wharves within Silloth Harbour England No

Port Freight Statistics notes and definitions 2020 - Page 21
United Kingdom Port Description Country of the United Kingdom
Major port for freight
Southampton
Wharves on Southampton Water and Rivers Itchen and Test, including Fawley and Hamble (oil refinery and terminal) and Southampton Container Terminals
England Yes
Stornoway Wharves within Stornoway Harbour Scotland No
Stranraer
Wharf is now above Cairnryan (still on Loch Ryan). Stranraer port closed in November 2011. Its operations were transferred to neighbouring Loch Ryan Port.
Scotland Yes
Sullom Voe Sullom Voe oil terminal Scotland YesSunderland Wharves within Sunderland Harbour England Yes
Sutton Bridge Wharves at Sutton Bridge on River Nene England No
Swansea Wharves within Swansea Harbour Wales Yes
Tees & HartlepoolWharves along River Tees, including Middlesbrough, Billingham and Redcar, and at Hartlepool Harbour
England Yes
Teignmouth Wharves within Teignmouth Harbour England NoTorquay Wharf at Torquay Harbour England NoTroon Wharves within Troon Harbour Scotland No
Truro Wharves at Truro on the River Fal above Falmouth England No
Tyne Wharves along River Tyne, including Newcastle England Yes
Wallasea Wharves on River Crouch and River Roach England No
Warrenpoint Wharves within Warrenpoint Harbour Northern Ireland YesWatchet Wharf within Watchet Harbour England NoWells Wharves within Wells Harbour England No
Weymouth & Portland Wharves within Weymouth Harbour and at Portland Port England No
Whitby & Scarborough Wharves at Scarborough and Whitby England NoWhitehaven Wharf within Whitehaven Harbour England NoWhitstable Wharves within Whitstable Harbour England NoWick Wharves within Wick Harbour Scotland No
Wisbech Wharves on River Nene excluding Sutton Bridge England No
Workington Wharves within Workington Harbour England No

Port Freight Statistics notes and definitions 2020 - Page 22
Ports, port groups and freight waterways

Port Freight Statistics notes and definitions 2020 - Page 23
Annex B: Cargo classification
Classification of port freight traffic for the EC Directive on statistical returns in respect of the carriage of goods and passengers by sea (2009/42/EC)
Unitised trafficCategory Description Code Statistics required for major ports
Number of units Weight of goods Loaded Empty Total
Containers 20 ft freight units 31 40 ft freight units 32 Freight units > 20 ft & < 40 ft 33 Freight units > 40 ft 34 Roll-on/Roll-off (self- propelled)
Road goods vehicles with or without accompanying trailers
51
Passenger cars, motorcycles and accompanying trailers/caravans
52
Passenger buses 53 Import/Export motor vehicles 54 Live animals on the hoof 56 Other mobile self-propelled units 59 Roll-on/Roll-off (non self-
Unaccompanied road goods trailers & semi-trailers
61
propelled) Unaccompanied caravans and other road, agricultural and industrial vehicles
62
Rail wagons, shipborne port to port trailers, and shipborne barges engaged in goods transport
63
Other mobile non self-propelled units 69
Non-unitised traffic
Category Description Code Statistics required for major ports
Weight of goods
Liquid Bulk Liquefied gas 11 Crude oil 12 Oil products 13 Other liquid bulk products 19 Dry Bulk Ores 21 Coal 22 Agricultural products 23 Other dry bulk 29 Other general Forestry products 91 cargo Iron and steel products 92 Other general cargo & containers <
20 ft 99

Port Freight Statistics notes and definitions 2020 - Page 24
The following flowchart is provided to data suppliers to aid in the correct classification of cargo:
Port Freight Statistics (last update December 2019)
Categorisation Flowchart
What does the cargo look like?How is the cargo carried on the ship?
Load on-Load offContainer
What is the size of the container?The cargo inside is not of interest here, but its weigtht.
Do not include the weight of the container.
99 - less than 20 foot containers31 - 20 foot containers32 - 40 foot containers33 - Freight containers between 20 and 40 foot in length34 - Freight containers over 40 foot in length
Liquid Bulk What is it?
11 - Liquified gas, e.g. butane, propane and LNG12 - Crude oil. If weight is unavailable, 1 barrel of oil = 0.14 tonnes13 - Oil products (i.e. derivatives of petroleum), including diesel, gasoil, aviation fuel, reformate, gas condensate and benzene heat cut. 19 - Other liquid bulk, not related to petrochemicals e.g. molasses, juices, ethanol, liquid fertilizer
Dry Bulk(can be scooped)
What is it?
21 - Ores and scrap, e.g. iron ores, metal scraps, rutile sand.22 - Coal, coke, coke breeze and coke foundry but not coal by-products (e.g. gypsum, fly ash and slag).23 - Bu k agricultural products, e.g. grain, soya or tapioca. Only grains but not fertilizer or processed, grains (rape or soya meal/pellets) or animal feeds.29 - Other dry bulk, e.g. coal by-products, ash, fertiliser products, cement, aggregates, wood pellets or wood chip but not wood pulp.
Roll-On Roll-Off(vehicle or other container
rolled onto ship)
Only include the tonnage of the cargo, not the weight of the vehicle/carrying unit
Is it self-propelled?Was it transported on the vessel by itself?
51 - Road goods vehicles with or without accompanying trailers, not import/export motor vehicles 52 - Passenger cars, motorcycles with or without any accompanying trailers/caravans, not import/export motor vehicles 53 - Passenger buses, which are not for trade. 54 - Import/export motor vehicles 59 - Other mobile self-propelled units, e.g. a mobile crane that is being moved but not traded.
Is it not self-propelled?
61 - Unaccompanied road goods trailers and semi-trailers. 62 - Unaccompanied caravans and other road, agricultural or industrial vehicles 63 - Rail wagons, shipborne port-to-port trailers and shipborne barges. e.g. containers/cargo loaded onto MAFI’s or lash barges. One MAFI loaded with cargo is recorded as one unit and the weight is entered.69 - Other mobile non self-propelled units, e.g. large industrial vehicles carrying goods which are pulled on to the vessel.
Other(none of the above)
56 - Live animals on the hoof 91 - Forestry products, including timber, paper and pulp (when shipped as break bulk).92 - Iron and steel products, e.g. steel coils, uncoated metal pipes and strip but not manufactured products 99 - Other general cargo (none of the previous categories or less than 20 foot containers). This includes any goods that are transported in bags, barrels, on pallettes, etc.
For more details, please check the complete notes and definitions.
Common miscoding errors!• Check the content of the liquid bulk, not
everything is “other liquid bu k”.• Bulk agricultural products (23) only include
grains and not processed or fertilised.• Wood pulp is a forestry product (91), not a
bu k agricultural products or other dry bulk.• Similarly, wood pellets and chip are con-
sidered other dry bulk (29).• Check if the iron and steel is a product (92)
or metal ore and/or scrap (21).• Any vehicle being shipped for trade is 54.

Port Freight Statistics notes and definitions 2020 - Page 25
Annex C: Historical changes affecting these statisticsPort freight statistics have been collected in various forms for many years, with the current statistics including data back to the 1960’s (e.g. table PORT0101). The current collection methodology for the core port freight statistics was established in 2000, following the introduction of the EU Maritime Statistics Directive. Although the published data series from before 2000 are considered to be largely comparable with the current system, the change in collection methodology resulted in some discontinuities in the data between 2000 and previous years.
Port freight statistics: previous data collection systemsAnnual statistics on freight handled at GB ports have been collected by the Department for Transport since 1980. Statistics for Northern Ireland ports were collected by the Department for Economic Development, Northern Ireland from 1988 to 1999, and have been collected by DfT within the UK system since 2000. Prior to this, similar statistics were collected by the National Ports Council from 1965. There were various relatively modest changes to the collection system during this period; these notes relate mainly to the data collection system from 1995 to 1999.
Prior to 2000 all freight information was collected from ports annually. There was no quarterly collection and no collection from shipping agents. A PS4 form was sent to major ports asking for detailed information on weight of traffic in and out, by cargo category and whether these were foreign, coastwise or one port cargoes. A detailed commodity analysis was also required for bulk traffic, and a broad commodity analysis for coastwise traffic. Separate information was required on unitised traffic i.e. the number of units in and out by unitised cargo categories and by broad route. The current system includes more detail than previously on vessels and routes (in terms of the port of loading/unloading) used, and on unitised traffic by weight; but less commodity detail for non-unitised traffic.
The major ports covered by the PS4 were taken to be ports with at least 2 million tonnes of cargo a year. A few selected ports with smaller volumes were also included, which were required to provide only total weight of cargo, in and out, in a simplified form.
Main differences between the freight collection systems in 1995–1999 and from 2000
Difference Freight collection system from 2000 Freight collection system in 1995–1999 Traffic breakdown
More detail on unitised traffic by weight (e.g. by size of container) but less commodity detail on non-unitised traffic. Change to definition of containers on Roll-on/Roll-off services (see table below for full comparison)
Less detail on unitised traffic by weight but more commodity detail on non-unitised traffic (see table below for full comparison)
Route and vessel information
Information on individual trips from shipping lines and agents, including port of load and unload, so geographic information should be more accurate. Also vessel details available e.g. LRN and flag. Summary data only from ports, on traffic in and out of ports, quarterly.
No information from shipping lines and agents and no vessel data. Detailed information annually from ports, but aggregated – no individual trips identified, so geographic information is likely to be less accurate.
Definition of major port
Major ports (52 in 2000) are defined as ports with annual cargo volumes of at least 1 million tonnes, plus a few selected ports with less tonnage. Otherwise ports are classified as minor ports.
Major ports (39 in 1999) defined as ports with annual cargo volumes of at least 2 million tonnes, plus a few selected ports with less tonnage. Otherwise ports classified as minor ports.

Port Freight Statistics notes and definitions 2020 - Page 26
Comparison of cargo categories used in port statistics up to 1999 and from 2000
1) Weight of unitised cargoCargo categories in use until 1999
Cargo categories in use from 2000
Containers on Lift-on/Lift-off or conventional services
Containers 20 ft freight units 40 ft freight units Freight units > 20 ft & < 40 ft Freight units > 40 ft
Containers on Roll-on/Roll-off services
Containers Only if lifted on or off vessel by crane. Container sub-categories as above.
Roll-on/ Roll-off (non self-propelled)
If loaded aboard using any type of roll-on/roll-off trailer. Rail wagons, shipborne port to port trailers, and shipborne barges engaged in goods transport
Powered road goods vehicles and unaccompanied road goods trailers
Roll-on/ Roll-off (self-prop)
Road goods vehicles with or without accompanying trailers
Roll-on/ Roll-off (non self-prop)
Unaccompanied road goods trailers & semi-trailers
Rail wagons and barges carried on ships
Roll-on/ Roll-off (non self-prop)
Rail wagons, shipborne port to port trailers, and shipborne barges engaged in goods transport
Vehicles for import and export on Roll-on/Roll-off services
Roll-on/ Roll-off (self- prop)
Import/Export motor vehicles
Other wheeled and Roll-on/Roll-off freight
Roll-on/ Roll-off (self- prop)
Other mobile self-propelled units
Roll-on/ Roll-off (non self-prop)
Unaccompanied caravans and other road, agricultural and industrial vehicles Other mobile non self-propelled units
2) Weight of non-unitised cargo
Cargo categories in use until 1999 Cargo categories in use from 2000 Liquid bulks Crude petroleum Liquid bulks Crude oil Petroleum products and gas Oil products Liquefied gas Animal and vegetable oils and fats, beverages,
chemicals, chemical fertilisers, crude minerals, material shipped for dumping at sea, sugar and sugar preparations, and other liquid bulks
Other liquid bulks
Dry bulks Ores and scrap Dry bulks Ores Coal, coke and briquettes Coal Foodstuffs and tobacco (including animal feeding stuff,
dairy products and eggs, fruit and vegetables, meat and meat preparations, milled cereals and cereal preparations, sugar and sugar preparations and unmilled cereals), animal and vegetable oils and fats, and oil seeds and nuts
Agricultural products
Cement lime etc, chemicals, crude and manufactured fertilisers, crude minerals, iron and steel, material shipped for dumping at sea, non-ferrous metals, other non-metallic mineral manufactures, petroleum products and gas, sea dredged aggregates, wood lumber and cork, and other dry bulks
Other dry bulks
Semi-bulks Unitised forest products Other general cargo
Forestry products
Other semi-bulk traffic (for example, iron and steel, and palletised cargo)
Iron and steel products
Conventional traffic General cargo and containers < 20 ft
Non-oil traffic with UK offshore installations

Port Freight Statistics notes and definitions 2020 - Page 27
3) Number of unitsCargo categories in use until 1999 Cargo categories in use from 2000 Containers on Lift-on/Lift-off or conventional services
20 ft Containers 20 ft freight units
30/40 ft Containers 40 ft freight units Freight units > 20 ft & < 40 ft Freight units > 40 ft
Containers on Roll-on/Roll-off services
20 - 40 ft Roll-on/ Roll-off (non self-propelled)
Rail wagons, shipborne port to port trailers, and shipborne barges engaged in goods transport (including containers loaded using special port trailers/shipborne port to port trailers). Note – number of roll-on/roll-off units is counted, as opposed to the number of containers carried (change from 2000)
Powered road goods vehicles Roll-on/ Roll-off (self-prop)
Road goods vehicles with or without accompanying trailers
Unaccompanied road goods trailers Roll-on/ Roll-off (non self-propelled)
Unaccompanied road goods trailers & semi-trailers
Rail wagons and barges carried on ships
Roll-on/ Roll-off (non self-propelled)
Rail wagons, shipborne port to port trailers, and shipborne barges engaged in goods transport
Vehicles for import and export on Roll-on/Roll-off services
Roll-on/ Roll-off (self-prop)
Import/Export motor vehicles
Accompanied passenger cars Roll-on/ Roll-off (self-prop)
Passenger cars, motorcycles and accompanying trailers/caravans
Accompanied passenger buses and coaches
Roll-on/ Roll-off (self-prop)
Passenger buses
Port freight statistics: unitised traffic category changes from 2000The following effects of an important change to the categorisation of ‘containers’ and ‘shipborne port-to-port trailers’ between 1999 and 2000 should be noted.
Containers can be lifted onto ships using conventional services at container ports (Lift-on/Lift-off or Lo-Lo) or they can be loaded onto Roll-on/Roll-off (Ro-Ro) vessels – used principally for road goods vehicles, road goods trailers or passenger cars etc. The latter method often employs ‘port-to-port trailers’ used only within the port and which may return to the quay after loading or stay with the ship (either returning empty from the destination port or with another load).
Until 1999, Lo-Lo containers were included in ‘containers on Lo-Lo and conventional services’ whilst Ro-Ro containers were classified to ‘containers on Ro-Ro services’. From 2000 the category ‘containers on Ro-Ro services’ was discontinued and a new category introduced called ‘rail wagons, shipborne port-to-port trailers and barges’. Most containers previously recorded by respondents as Ro-Ro containers were subsequently recorded as ‘rail wagons, shipborne port-to-port trailers and barges’ but it is believed others were recorded as containers on Lo-Lo services. The effect of this definitional change can be seen in PORT0103.
It was evident by 2005 that some respondents operating at Ro-Ro ports were indeed incorrectly reporting containers transported on port-to-port trailers as Lo-Lo containers and had been doing so since the start of the new data system in 2000. This was corrected for 2005 when data providers were given further guidance.
Revised estimates for 2000 to 2004 for containers and shipborne trailers etc are provided in the

Port Freight Statistics notes and definitions 2020 - Page 28
table below.
The adjustment shown was calculated using updated information obtained from ports together with information from shipping lines and published sources. Comparative data is shown for 2005-07. Note that the original figures for 2000-2004 have not been adjusted in the published tables.
It should be noted that in both the previous and current data collection systems containers carried by road goods vehicle or road goods trailer are correctly classified as ‘road goods vehicles’ or ‘unaccompanied trailers’ and not as containers.
Containers and shipborne trailers, etc: 2000–2007 (thousand units)
2000 2001 2002 2003 2004 2005 2006 2007
Containers (original) 4,325 4,464 4,506 4,533 4,919 4,754 4,883 5,381
Shipborne trailers, etc. (original) 361 344 348 374 383 665 668 744
Ro-Ro containers1
Adjustment to containers -116 -157 -230 -265 -299
of which London 32 -74 -173 -158 -166
Adjustment to shipborne trailers, etc. 116 157 230 265 299
of which London -32 74 173 158 166
Containers (adjusted) 4,209 4,307 4,276 4,268 4,620 4,754 4,883 5,381
Shipborne trailers, etc. (adjusted) 477 501 578 639 682 665 668 744
1 Not separately identified after 1999
Ship arrivals statistics: previous methodsThe approach used to produce the ship arrivals statistics has changed several times since they were first published. The current approach was established for the 2018 statistics. Details of previous approaches are given here.
Method until 2009: The scope of these estimates was cargo carrying trading vessels. The primary source used was commercially obtained vessel movement data from Lloyds List Intelligence (LLI). LLI maintain a global vessel movement database, based on a variety of sources, principally daily reports from an established network of Lloyd’s Agents and sub-agents, and increasingly also vessel tracking data from transponders which most vessels are now required to carry under maritime safety rules. LLI aim to cover “the deployment of all self-propelled sea going merchant vessels over 99gt engaged in international seaborne trade”. The data obtained by DfT certainly includes domestic movements between UK ports, but it may be reasonable to suppose that data coverage could be less comprehensive in this category, particularly for small vessels, and/or those on very local or inshore routes.
The LLI data do not cover individual movements on frequent services (those with more than one call per day at the same port – mainly ferry services), so information on the number of these movements was compiled for DfT by a separate contractor and added to the total.

Port Freight Statistics notes and definitions 2020 - Page 29
Method from 2009 to 2017: In 2012, new tables were released for 2009 and 2010, using a similar but revised method. These changes replaced a source of information on ‘frequent services’ no longer available, made better use of information already held, and expanded the scope of the table to cover non-cargo vessels. In table PORT0602, historical data are retained to allow comparisons to be made between the previous and revised approaches. The new method added about 5,000 vessel movements not identified by the old method (a 4% increase in the total) from the ‘fully cellular container’ to the ‘other general cargo’ category. This also applied to over 13,000 movements by vessel types not previously included, and over 1,000 arrivals of general cargo ships with container capacity, many of which were probably running container services.
LLI data continued to be an important basis of the method. However, it was merged with other information on ship movements obtained by DfT through the port freight collection system (all cargo or passenger carrying movements at major ports) and its sea passenger survey (movements on regular seagoing ferry services). The three data sources are merged at the level of individual vessels calling at each port. The maximum number of calls from any of the three sources is taken as the final estimate. In the small proportion of cases where it is not possible to match vessels to other sources, these movements are also included in the total for the relevant port.
A further difference in the method used from 2009 is that in nearly all cases vessel type is based on IHS Global world fleet data. Under the old method (figures to 2009) vessel type information came largely from LLI, except for those vessels on frequent services which did not appear in the LLI data set. This change was made because data were being merged from more data sets. In general LLI and IHS Global sources agree on vessel type, but there are some cases where they differ – since some vessels can be employed in a variety of roles. Generally this does not make a significant difference to the overall results, but one relatively major change is for smaller container ships. The old method classified LLI’s ‘General cargo with container capacity’ category as container vessels. In general the vessels in question were employed on container services. However, they were not ‘fully cellular’ – that their container cell guides were not fixed, allowing the vessels to be configured for other cargoes. Therefore these vessels appear under the ‘other general cargo’ category in the new tables. Consideration was given to whether vessels identified by IHS Global as having container capacity should be included under the ‘container’ category, but this would have lead to much larger discontinuities in the opposite direction, with the probability that many vessels operating as general cargo ships would be misclassified as container ships.
Between 2009 and 2010, LLI increased the coverage of their data. The impact of this on the DfT tables results is probably significantly reduced, because many of the additional movements recorded by LLI would already have been captured in one of the other sources used in the DfT statistics.