Embed Size (px)
Citation preview

2020 CSR EPRA
REPORT
05/07/2021

--
❖ FOREWORD 3
❖ ENVIRONMENTAL SUSTAINABILITY PERFORMANCE MEASURES 4❖ Reporting scope and methodology 5 to 6❖ Energy & Greenhouse gas emissions 7 to 12❖ Water 13 to 15❖ Waste 16 to 17
❖ COMMUNITY ENGAGEMENT 18❖ Certification 19 to 22❖ Stakeholders engagement 23 to 24❖ Gecina support actions 25
❖ SOCIAL PERFORMANCE MEASURES 26
❖ Employee gender diversity 27❖ Gender pay ratio 28❖ Training & development 29❖ Employee performance appraisal & employee turnover and retention 30❖ Employee health and safety 31❖ Asset health and safety assessments 32 to 33❖ Health and well-being assessment 34
❖ GOVERNANCE PERFORMANCE MEASURES 35
❖ Composition of the highest governance body 36 to 37
❖ Nominating and selecting the highest governance body 38 to 39
❖ Process for managing conflicts of interest 40 to 41
❖ ASSURANCE & GRI TABLE 42 to 43
CONTENTS
2 05/07/2021 2020 CSR EPRA Report

--
Gecina has implemented the EPRA sustainability BPR since 2012.
In addition to the detailed information published in the 2020 Universal
Registration Document, Gecina has decided to edit this document in order to
give easy access to performance measures indicators recommended by EPRA
and following the EPRA Best Practices Recommendations on Sustainability
Reporting Guidance of September 2017.
FOREWORD
2020 CSR EPRA Report3 05/07/2021

ENVIRONMENTALSUSTAINABILITY
PERFORMANCEMEASURES
05/07/2021

--
➢ SCOPE
The scope covers all businesses operationally controlled by Gecina in Francefrom January 1 to December 31 of the reporting year.
➢ SCOPE OF AREA
Commercial and office surface area refers to gross leasable area (GLA), inother words that means private surface area and the rented surface ofcommunal areas;
Residential surface area refers to the net floor area (NFA) rented.
The adopted office and residential surface areas are:
Reporting scope and methodology (1/2)
GROUP OFFICE RESIDENTIAL
2019 2020 2019 2020 2019 2020
SCOPE Surface area Sq.m 1,693,784 1,701,279 1,275,233 1,279,182 418,551 422,097
2020 CSR EPRA Report5 05/07/2021

➢ KPI Scope
Reporting scope and methodology (2/2)
Number of assets with data available for KPI
calculation.
Surface area corresponding to the assets with data
available.
% of the surface area corresponding to assets with
data available compared with the reference surface
area.
Number of assets with data available for KPI calculation:
● An asset is considered in operation for Y if it is included with the properties from January 1 of year Y until
December 31 of year Y and if its occupancy rate is higher than 50%. Assets sold in year Y are thus directly excluded
from the scope.
● Acquisitions and deliveries that took place in year Y are only effectively taken into account as part of properties
from year Y for the certification indicators.
05/07/2021 2020 CSR EPRA Report6 -

➢ Further information on indicators’ SCOPE
As Gecina has no control over the completeness of fluid meters, the data collection and reporting period has been shifted in
order to ensure the most comprehensive monitoring possible of the relevant indicators (i.e energy consumption, GHG
emissions, water consumption and waste volume). Therefore, for year Y the reporting period is from 10/01/Y-1 to 09/30/Y for
these indicators.
➢ Methodology
Energy and GHG emissions data reported in this report are not adjusted by degree days methodology. They are based on
real consumption (i.e. bills). When this is not possible, for some residential for example, EPD method is used for estimations.
Gecina reports in accordance with the GHG protocol, which breaks down the operational scope of the greenhouse gas
emissions of an organization into three scopes :
• Scope 1: direct emissions linked to the combustion of fossil fuels of resources owned by the company
• Scope 2: indirect emissions linked to the purchase or production of electricity and heating and cooling
• Scope 3: indirect emissions related to energy consumed but no controlled by Gecina
Since 2015, GHG emissions factors comes from Bilan Carbone® method developed by ADEME, the French Environment
and Energy Management Agency.
Energy and GHG emissions – (1/6)*
*Elec-Abs/LfL , DH&C-Abs/LfL, Fuels-Abs/LfL, GHG-Dir-Abs/LfL, GHG-Indir-Abs/LfL, Energy-Int, GHG-Int
05/07/2021 2020 CSR EPRA Report7 -
Energy and GHG emissions – Group (2/6)*
➢ Results (1/4)
NB: - Energy and GHG emissions of Gecina’s headquarter are included in the total of Owner consumption and emissions. See slide 9 to have headquarter details.
- GHG emissions include tenants uses and are not corrected for climate hazards.
*Elec-Abs/LfL , DH&C-Abs/LfL, Fuels-Abs/LfL, GHG-Dir-Abs/LfL, GHG-Indir-Abs/LfL, Energy-Int, GHG-Int
Unit 2019 2020 % change 2019 2020 % change 2019 2020 % change 2019 2020 % change 2019 2020 % change 2019 2020 % change
Number of assets 179 168 -6,1% 161 161 0,0% 118 109 -7,6% 105 105 0,0% 61 59 -3,3% 56 56 0,0%
Surf. Area sq.m 1 644 573 1 647 619 0,2% 1 505 536 1 505 536 0,0% 1 049 993 1 063 500 1,3% 992 715 992 715 0,0% 606 408 584 119 -3,7% 512 821 512 821 0,0%
% covered (vs Ref. surf. Area) 100% 100% 0,0% 100% 100% 0,0% - - - - - - - -
Total energy consumption from electricity kWhFE 215 219 137 211 000 417 -2,0% 196 826 392 180 486 195 -8,3% 119 461 945 102 955 322 -13,8% 118 606 052 96 691 478 -18,5% 95 757 192 108 045 095 12,8% 78 220 340 83 794 717 7,1%
Total energy consumption from districk
heating and coolingkWhFE 92 329 475 87 627 720 -5,1% 89 664 045 86 264 476 -3,8% 58 159 420 56 411 866 -3,0% 64 204 990 55 276 972 -13,9% 34 170 055 31 215 854 -8,6% 25 459 055 30 987 504 21,7%
Total energy consumption from fuels kWhFE 50 850 327 50 074 337 -1,5% 46 379 698 47 244 335 1,9% 33 822 487 32 527 086 -3,8% 31 069 369 29 697 084 -4,4% 17 027 840 17 547 251 3,1% 15 310 329 17 547 251 14,6%
Building energy intensitykWhFE/sq.m/
year218 212 -2,9% 221 209 -5,7% 201 180 -10,4% 215 183 -15,1% 242 268 10,8% 232 258 11,2%
% of electricity consumption purchased and
self-generated renewable sources% 26 35 35,9% 26 35 34,6% 60 60 0,4% 60 60 0,0% 27 35 30,8% 27 35 29,6%
% of energy consumption from district
heating and cooling generated on and/or off
site from renewable sources
% 70 70 0,0% 70 70 0,0% 70 70 0,0% 70 70 0,0% 70 70 0,0% 70 70 0,0%
Total direct GHG emissions (Scope 1) tCO 2e 7 392 6 994 -5,4% 8 431 7 662 -9,1% 5 663 5 414 -4,4% 6 993 6 083 -13,0% 1 729 1 580 -8,6% 1 438 1 579 9,8%
Total indirect GHG emissions (Scope 2) tCO 2e 11 747 7 180 -38,9% 8 245 7 089 -14,0% 8 628 5 837 -32,3% 6 753 5 749 -14,9% 3 119 1 343 -56,9% 1 492 1 340 -10,2%
GHG emissions from non controlled buildings
(Scope 3)tCO 2e 14 897 13 094 -12,1% 15 938 11 469 -28,0% 6 928 5 650 -18,4% 5 788 5 038 -13,0% 7 969 7 444 -6,6% 10 150 6 431 -36,6%
GHG intensity from building energy (all
scopes)
kgCO 2e/sq.m/
year21 17 -20,0% 22 17 -19,6% 20 16 -21,4% 20 17 -13,6% 21 18 -16,0% 26 18 -28,5%
Indicator
SCOPE
ENERGY
GHG
EMISSIONS
TENANT
Absolute Like-for-Like Absolute Like-for-Like Absolute Like-for-LikeGROUP
TOTAL OWNER
8

Energy and GHG emissions – Headquarter (3/6)*
➢ Results (2/4)
*Elec-Abs,DH&C-Abs, Fuels-Abs, GHG-Dir-Abs, GHG-Indir-Abs, Energy-Int, GHG-Int
Indicator Unit 2019 2020 % change
Number of assets 1 1 -
Surf. Area sq.m 9 772 9 772 -
% covered (vs Ref. surf. Area) 100% 100% -
Total energy consumption from electricity kWhFE (1) 1 384 445 1 246 808 -9,9%
% of electricity consumption from purchased
and self-generated renewable sources% 100 100 0,0%
Total energy consumption from districk
heating and coolingkWhFE (1) 667 000 615 000 -7,8%
% of energy consumption from district
heating and coolong generated on and/or off
site from renewable sources
% 100 100 0,0%
Total energy consumption from fuels kWhFE (1) 0 0 0,0%
Building energy intensitykWhFE/sqm/y
ear (2) 210 191 -9,2%
Total direct GHG emissions (Scope 1) tCO2e (1) 0 0 0,0%
Total indirect GHG emissions (Scope 2) tCO2e (1) 62 29 -53,2%
GHG emissions from non controlled buildings
(Scope 3)tCO2e (1) 56 8 -85,7%
GHG intensity from building energy (all
scopes)
kgCO2e/sqm/y
ear (2) 12 4 -68,6%
SCOPE
ENERGY
GHG
EMISSIONS
HEADQUARTERTOTAL
Absolute
9

Energy and GHG emissions – Office (4/6)*
NB: Factoring in uses and the green energy contracts of buildings under its control, the proportion of renewable energy in Gecina's energy mix is 40% (versus
38% in 2019). 40% of renewable energies in the energy mix through renewable origin guarantees and biomethane compared to 17,2% used in the traditional
energy mix.
*Elec-Abs/LfL , DH&C-Abs/LfL, Fuels-Abs/LfL, GHG-Dir-Abs/LfL, GHG-Indir-Abs/LfL, Energy-Int, GHG-Int
➢ Results (3/4)
Unit 2019 2020 % change 2019 2020 % change 2019 2020 % change 2019 2020 % change 2019 2020 % change 2019 2020 % change
Number of assets 123 114 -7,3% 111 107 - 84 77 -8,3% 73 73 - 39 37 -5,1% 34 34 -
Surf. Area sq.m 1 226 668 1 220 552 -0,5% 1 031 820 1 078 469 - 740 431 756 604 2,2% 685 819 685 819 - 486 238 463 948 -4,6% 392 650 392 650 -
% covered (vs Ref. surf. Area) 100% 100% - 100% 100% - - - - - - - - - - - - -
Total energy consumption from
electricitykWhFE 210 120 004 205 910 644 -2% 178 805 941 175 396 422 -1,9% 119 332 712 102 955 322 -13,7% 118 606 052 96 691 478 -18,5% 90 787 292 102 955 322 13,4% 73 250 440 78 704 944 7,4%
Total energy consumption from
districk heating and coolingkWhFE 55 224 000 52 561 634 -4,8% 44 974 129 51 198 390 13,8% 26 925 218 27 203 603 1,0% 34 291 892 26 068 709 -24,0% 28 298 781 25 358 031 -10,4% 19 587 781 25 129 681 22,1%
Total energy consumption from
fuelskWhFE 19 350 517 19 142 468 -1,1% 19 350 517 16 312 466 -15,7% 10 756 500 10 017 296 -6,9% 8 003 383 7 187 294 -10,2% 8 594 017 9 125 172 6,2% 6 876 506 9 125 172 32,7%
Building energy intensitykWhFE/sq.m/
year232 227 -2,0% 236 225 -4,4% 212 185 -12,6% 235 189 -19,2% 263 296 12,8% 254 288 13,3%
% of electricity consumption
purchased and self-generated
renewable sources
% 32 40 25,0% 33 40 21,2% 100 100 0,0% 100 100 0,0% 34 40 17,6% 34 40 17,6%
% of energy consumption from
district heating and cooling
generated on and/or off site from
renewable sources
% 70 70 0,0% 70 70 0,0% 70 70 0,0% 70 70 0,0% 70 70 0,0% 70 70 0,0%
Total direct GHG emissions
(Scope 1)tCO 2 e 4 347 3 420 -21,3% 3 011 4 088 35,8% 2 618 1 840 -29,7% 2 612 2 509 -3,9% 1 729 1 580 -8,6% 1 438 1 579 9,8%
Total indirect GHG emissions
(Scope 2)tCO 2 e 3 744 3 037 -18,9% 5 928 2 946 -50,3% 2 252 1 694 -24,8% 2 251 1 606 -28,7% 1 492 1 343 -10,0% 1 492 1 340 -10,2%
GHG emissions (Scope 3) tCO 2 e 11 254 9 185 -18,4% 9 815 7 560 -23,0% 6 437 5 183 -19,5% 5 299 4 571 -13,7% 4 817 4 002 -16,9% 3 467 2 989 -13,8%
Greenhouse gaz intensity from
building energy (all scopes)
kgCO 2 e/sq.m
/year16 13 -18,7% 18 14 -25,5% 16 12 -28,0% 15 13 -14,5% 20 15 -24,9% 20 15 -22,8%
Indicator
SCOPE
ENERGY
GHG
EMISSIONS
OFFICETOTAL OWNER TENANT
Absolute Like-for-Like Absolute Like for Like Absolute Like for Like
10
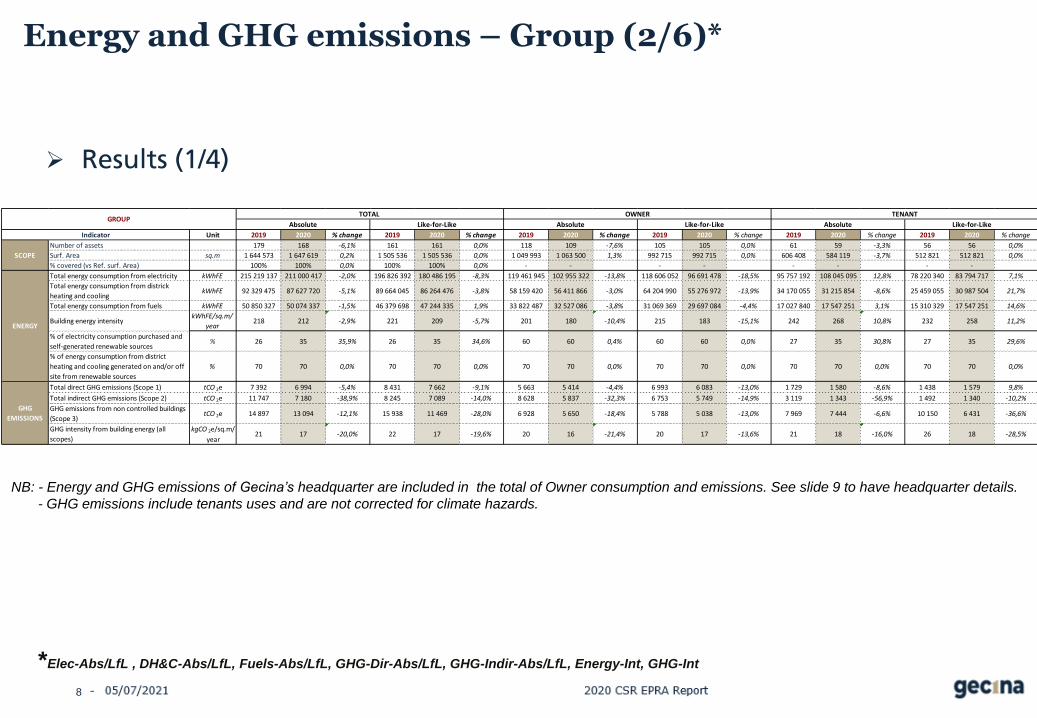
Energy and GHG emissions – Residential (5/6)*
*Elec-Abs/LfL , DH&C-Abs/LfL, Fuels-Abs/LfL, GHG-Dir-Abs/LfL, GHG-Indir-Abs/LfL, Energy-Int, GHG-Int
➢ Results (4/4)
Unit 2019 2020 % change 2019 2020 % change 2019 2020 % change 2019 2020 % change 2019 2020 % change 2019 2020 % change
Number of assets 56 54 -3,6% 55 54 - 34 32 -5,9% 32 32 - 22 22 0,0% 22 22 -
Surf. Area sq.m 417 905 427 067 2,2% 422 808 427 067 - 309 563 306 896 -0,9% 306 896 306 896 - 120 171 120 171 0,0% 120 171 120 171 -
% covered (vs Ref. surf. Area) 100% 100% 0,0% 100% 100% - - - - - - - - - -
Total energy consumption from
electricitykWhFE 5 099 133 5 089 773 0% 5 099 133 5 089 773 0% 129 232 0 100,0% 0 0 100% 4 969 900 5 089 773 2,4% 4 969 900 5 089 773 2,4%
Total energy consumption from
districk heating and coolingkWhFE 37 105 475 35 066 086 -5% 35 827 067 35 066 086 -2% 31 234 202 29 208 263 -6,5% 29 913 098 29 208 263 -2,4% 5 871 274 5 857 823 -0,2% 5 871 274 5 857 823 -0,2%
Total energy consumption from
fuelskWhFE 31 499 810 30 931 869 -2% 31 499 810 30 931 869 -2% 23 065 987 22 509 790 -2,4% 23 065 986 22 509 790 -2% 8 433 823 8 422 079 -0,1% 8 433 823 8 422 079 -0,1%
Building energy intensitykWhFE/sq.m/
year176 166 -6% 171 166 -3% 176 169 -4,2% 173 169 -2% 160 161 0,5% 160 161 0,5%
% of electricity consumption
purchased and self-generated
renewable sources
% 20 20 3% 20 20 3% 20 20 3% 20 20 0% 20 20 3% 20 20 3%
% of energy consumption from
district heating and cooling
generated on and/or off site
from renewable sources
% 70 70 0% 70 70 0% 70 70 0% 70 70 0% 70 70 0% 70 70 0%
Total direct GHG emissions
(scope 1)tCO 2 e 4 381 3 574 -18% 4 381 3 574 -18% 4 381 3 574 -18,4% 4 381 3 574 -18% 0 0 - 0 0 -
Total indirect GHG emissions
(scope 2)tCO 2 e 4 507 4 143 -8% 4 507 4 143 -8% 4 507 4 143 -8,1% 4 502 4 143 -8% 0 0 - 0 0 -
Total GHG emissions from non
controlled buildings (scope 3)tCO 2 e 3 643 3 909 7% 3 632 3 909 8% 491 467 -4,9% 489 467 -4% 3 152 3 442 9,2% 6 683 3 442 -48,5%
GHG intensity from building
energy (all scopes)
kgCO 2 e/sq.m
/year30 27 -9% 30 27 -8% 30 27 -12,0% 31 27 -13% 26 29 9,2% 26 29 9,2%
Indicator
SCOPE
ENERGY
GHG
EMISSIONS
RESIDENTIALTOTAL OWNER TENANT
Absolute Like-for-Like Absolute Like-for-Like Absolute Like-for-Like
11

Energy consumption for office assets decreased in 2020. Gecina also involves its clients and suppliers in the fight against greenhouse gas emissions. The
role of maintenance operators is crucial to properly configure equipment and control their energy consumption. Finally, corporate clients seek high-performance
company headquarters in order to embody their own low carbon ambitions. It should be noted that the consequences of the Covid-19 crisis are making
performance analysis more complex compared to last year, given the disparity of the return-towork policies followed by our clients.
As a reminder, since 2017, to challenge our data management process, we decided to include tenants uses. The average consumption of the office properties is
227 kWhfe/sq.m/year, representing a 2% decrease compared to 2019. The residential properties performance decreases to 166 kWhfe/sq.m/year in 2020.
Main actions to limit energy consumption :▪ Managing our performance better: 91 commercial buildings equipped with an energy monitoring system.▪ 380 corrective actions have been implemented which has resulted in a reduction of 5.5% in energy consumption and 4.8% in carbon emissions for the
buildings concerned.▪ Mobilizing our employees: 74 best low-carbon practices to be deployed across our buildings.▪ Engaging our stakeholders in a continuous improvement process: 100% buildings have ISO 50001 certification.▪ 70% of residential surface areas covered by an incentive contract linked to the energy performance of the building. In 2019, 52% of covered surface areas
benefited from a bonus.▪ Setting up and using a Responsible Carbon (CARE) fund to stimulate low carbon innovation.▪ For several years now, the replacement of energy equipment has been subject to a technical/economic analysis of the overall cost with a preference for the
most energy-efficient.
Meter readings and analyses, the search for optimization between the needs of occupants, the operating time of facilities, and the continued renovation of assetsare all factors that contribute to improved energy efficiency. The environmental certification of surface area in properties remains an important lever for improvingenergy efficiency. In 2020, Gecina continued its efforts to increase the share of renewables in its energy mix.
GHG emissions for office and residential assets decrease in 2020. The average GHG intensity of the office properties is 13 kgCO2e/sq.m/year,
representing a 19% decrease compared to 2019. The residential properties performance also records a decrease of 9% with 27 kgCO2e/sq.m/year in 2020.
Main actions leading to a reduction of GHG emissions :
▪ 45% of buildings connected to an urban heating network.
▪ 28% of buildings connected to a cooling network.
▪ 100% of electricity paid for by Gecina was of guaranteed renewable origin. Integration of 20% of biomethane to supply the boilers of the residential and
commercial property portfolio
▪ The review of energy requirements for building heating and cooling needs is also an influential vector, not only on performance of a property but also on its
primary energy and carbon footprint.
Action plans use the results of the CSR scoring of properties on this theme are used in long-term planning of processes to be implemented in each building.
In 2021, Gecina will accelerate the deployment of its CSR policy. Its objective is to aim for carbon neutrality in 2030 instead of 2050.
>> see more details on pages 123 to 127 of the Universal Registration Document 2020
Energy and GHG emissions – Analysis (6/6)
12

Water (1/3)*
➢ Further information on indicator’s scope
Reported data are based on bills from municipal water consumption only.
Some properties have a rainwater collection, but no measure collect system has been implemented so far.
*Water-Abs/LfL/Int
➢ Results (1/2)
Unit 2019 2020 % change 2019 2020 % change 2019 2020 % change
Number of assets 140 140 0,0% 91 135 48,4% 1 1 -
Surf. Area sq.m 1 430 271 1 422 151 -0,6% 786 978 1 400 604 78,0% 9 772 9 772 -
% covered (vs Ref. surf.
Area)93% 86% -7,6% 55% 93% 69,1% 100% 100% -
Total water consumption m 3 953 952 1 005 664 5,4% 724 492 991 478 36,9% 4 434 3 898 -12,1%
Building water intensity m 3/sq.m/year 0,67 0,71 6,0% 0,92 0,71 -23,1% 0,45 0,40 -12,1%
Indicator
SCOPE
Water
GROUPTOTAL HEADQUARTER
Absolute Like-for-Like Absolute/Like-for-like
13
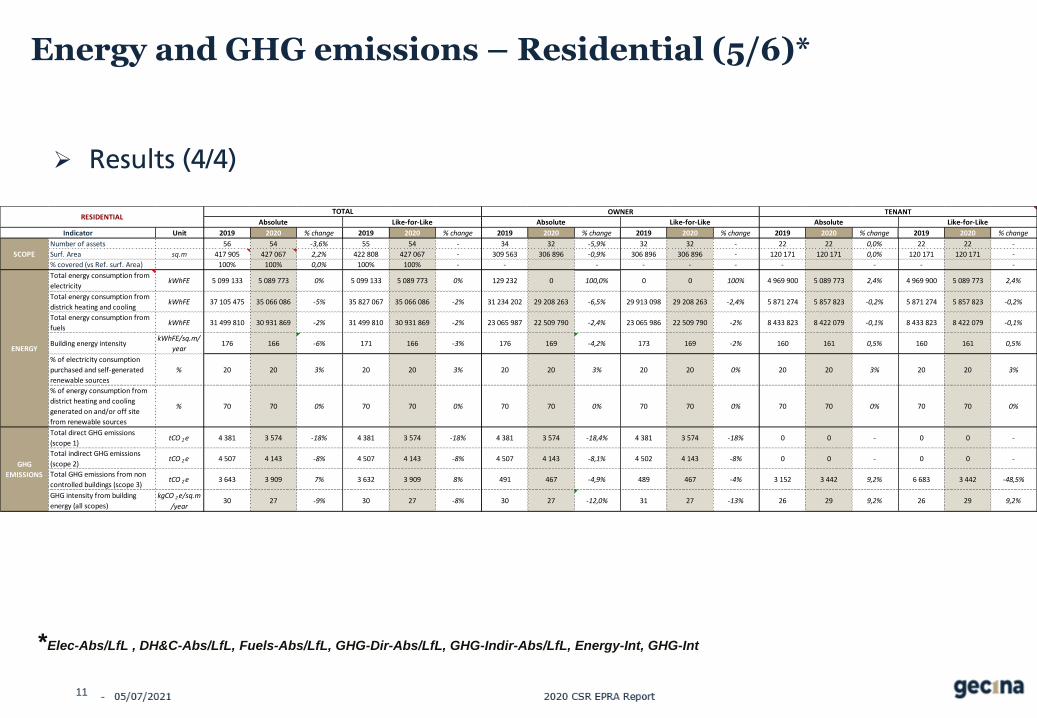
Water (2/3)*
➢ Results (2/2)
*Water-Abs/LfL/Int
NB: Water consumption of Gecina’s headquarter are included in the total of office consumption
Unit 2019 2020 % change 2019 2020 % change
Number of assets 90 88 -2,2% 84 84 -
Surf. Area 1 042 329 990 419 -5,0% 975 977 975 977 -
% covered (vs Ref. surf.
Area)93% 81% -12,6% 80% 80% -
Water Total water consumption m 3 381 427 378 719 -0,7% 359 847 373 574 3,8%
Building water intensity m 3/sq.m/year 0,37 0,38 4,5% 0,37 0,38 3,8%
Indicator
SCOPE
OFFICE Absolute Like-for-Like
Unit 2019 2020 % change 2019 2020 % change
Number of assets 50 52 4,0% 51 51 -
Surf. Area 387 943 431 732 11,3% 424 627 424 627 -
% covered (vs Ref. surf.
Area)93% 100% 8,0% 99% 99% -
Total water consumption m 3 572 525 626 945 9,5% 576 028 617 904 7,3%
Building water intensity m3/sq.m/year 1,48 1,45 -1,6% 1,36 1,46 7,3%
SCOPE
Water
RESIDENTIAL Absolute Like-for-Like
Indicator
14

Water (3/3)
In 2020, the average consumption of the property portfolio slightly decreased compared to 2019 and reached
0.71 m3 / sq.m / year.
Gecina’s residential assets represent 62% of the total water consumption of the property portfolio, which
justifies a slightly higher level of priority and better monitoring in the residential property than in the office
properties. The consequences of the sanitary crisis and the confinements in France explain in part this increase
in water consumption, in particular for residential properties
Actions performed on office assets in operation :
● deployment of a water consumption monitoring system of buildings for remote metering on commercial
buildings
● installation of meters and connection of meters and sub-meters to building management systems (BMS) for
close tracking of consumption and identification of any leaks;
● signing of a water savings contract with the installation of aeration units to limit throughput;
● removal of air-cooled towers.
➢ Analysis (1/1)
15

Waste (1/2)*
In 2015, Gecina has appointed the specialized consultancy, Indigo, to analyze its property portfolio, increase the
number of buildings with selective waste sorting facilities and to recover an increased proportion of waste. The
purpose of this forward-looking inventory was to obtain an overview of the problems encountered relating to waste
management with respect to technical, legal and financial criteria. In 2020 Gecina has signed a new operating waste
management contract with challenging CSR criteria to ensure that the service providers selected are the best
performers in their recycling operations. From 2020, all contracts covered by Gecina guarantee 100% energy or
material recycling.
Office property buildings that have a selective waste collection contract subscribed by Gecina with an occupancy rate
above 50% correspond to a surface area of 736,219 sq.m (i.e. more than 60% of the office properties), representing
54 buildings. 96% of office surface areas have selective waste collection contracts subscribed independently or by
Gecina and 95% of residential surface areas are equipped with a specially adapted room for this collection.
➢ Further information on indicator’s scope
In 2015, Gecina changed its reporting method to better reflect all the measures in place for commercial buildings
concerning selective waste collection. Since 2008, Gecina had recognized only office buildings for which it had
taken out a selective waste collection contract. By also including buildings in the property portfolio where tenants
manage their own waste, the reporting scope now reflects the complete range of the property portfolio’s selective
waste collection capacity.
Residential buildings have garbage collection made by the municipal company. Hence, there is currently no system
that provides data on quantities and types of waste collected.
➢ Results (1/2)
16

Waste (2/2)*
➢ Results (2/2)
*Waste-Abs/LfL
Unit 2019 2020 % change 2019 2020 % change 2019 2020 % change
Number of assets 41 54 31,7% 41 41 0,0% 1 1 -
Surf. Area sq.m 606 723 736 219 21,3% 634 967 634 967 0,0% 9 772 9 772 -
% covered (vs Ref.
surf. Area)33% 60% 82,8% 52% 52% 0,5% 100% 100% -
Total waste recovered t 1 949 1 080 -45% 1 845 964 8% 131 18 -86%
Total not recovered
waste t 44 11 -76% 44 11 61% 0 0 0%
% waste recovered t 98% 100% 2% 98% 99% -1% 100% 100% 0%
% not recovered waste t 2% 1% -51% 2% 1% -100% 0% 0% 0%
Indicator
SCOPE
Waste
OFFICE
TOTAL HEADQUARTER
TOTAL (absolute measures)
Absolute Like for like scope Absolute/Like-for-like
17

CommunityEngagement
05/07/2021

Certification - Office HQE® Operation (1/4)*
*Cert-Tot
➢ Results (1/1)
➢ Further information on indicator’s scope
Only the surface area that can be eligible to certification are considered in
the total surface area for this item.
2008 2009 2010 2011 2012 2013 2014 2015 2016 2017 2018 2019 2020
Surface areas certified HQE®
Operations0 0 42 806 151 955 274 351 359 813 518 684 652 986 673 858 699 911 689 425 975 542 1 036 116
Office surface area 903 037 891 815 824 466 799 673 815 758 819 582 830 091 921 005 869 629 879 846 1 171 826 1 275 233 1 301 162
% of surface areas certified HQE®
Operations0% 0% 5% 19% 34% 44% 62% 71% 77% 79,5% 58,8% 76,5% 80%
2008 2009 2010 2011 2012 2013 2014 2015 2016 2017 2018 2019 2020
Office surface area certified 0 0 0 0 9 772 9 772 9 772 9 772 9 772 9 772 9 772 9 772 9 772
The headquarter have been certified HQE ® Operation in 2012 at the different level : Sustainable building focus = Good(Bon) / Sustainable operation focus = Excellent (Excellent)
Office HQE® Operation Certification/BREEAM in Use
Headquarter certification HQE® Operation
19
Certification - Office HQE® Operation (2/4)*
➢ Analysis (1/1)
Gecina chose the HQE® Operation certification to underscore its commitment and capitalize on the best operating practices
developed for its property portfolio.
The most widespread initiative in France for office property, the HQE® Operation certification represents the most appropriate
reference framework for the type of Gecina's assets as well as its property management activity. The HQE® Operation certificate
guarantees the quality level of the building for tenants and investors by establishing mandatory responsible management methods
and improvement of environmental performance (analyzed using objective metrics) through a progress action plan.
In addition, it ensures continuity in operating methods since 2010, when Gecina introduced an HQE® Operation Management System,
audited and recognized for the properties assessed by Certivéa. By regularly intervening either through in-situ audit, or through
documentary analysis, Certivéa assesses the system in place and checks the achievement of the established efficiency goals on a
range of buildings submitted for certification. The certification of each asset is re-assessed every five years.
As of the end of 2020, the Gecina HQE™ Operations-certified office portfolio represents 1,036,116 sq.m, or 80% of surface areas.
in 2020, 19 assets obtained HQE Operation or BREEAM in Use certification, which enables it to achieve and exceed our objective of
75% of surface office areas certified
Gecina’s headquarter represented a surface area of 9 772 sq.m, or 100% of its total surface area is HQE™ Operations certification.
HQE® Operation certification is voluntary, Gecina is not bound by any mandatory certification so far for its buildings.
*Cert-Tot
20

Certification - Office and Residential Development (3/4)*
NB: As a building in operation, please note that the headquarter of Gecina is not concerned by this indicator
*Cert-Tot
➢ Results (1/1)
* Residential : NF HQE® Habitat
2008 2009 2010 2011 2012 2013 2014 2015 2016 2017 2018 2019 2020
Surface areas delivered with a high level of certification* 0 0 18 622 53 827 67 525 32 269 7 219 11 393 41 537 40 523 150 027 71 468 10 639
Surface areas delivered certified 31 023 0 23 675 53 827 75 350 77 956 7 219 11 393 41 537 40 523 150 027 71 468 10 639
Surface areas delivered 35 671 4 754 47 030 65 873 80 057 77 956 7 219 11 393 41 537 40 523 172 059 75 620 10 639
% of surface areas delivered with a high level of certification 0% 0% 40% 82% 84% 100% 100% 100% 100% 100% 87% 95% 100%
% of surface areas delivered certified 87% 0% 50% 82% 94% 100% 100% 100% 100% 100% 87% 95% 100%
% of surface areas delivered with a high level of certification 0% 0% 40% 82% 84% 100% 100% 100% 100% 100% 87% 95% 100%
* Office : HQE Green Building/ LEED® Excellent or Exceptional
Offices and Residential Development Certification
21
Certification - Office and Residential Development (4/4)*
*Cert-Tot
➢ Analysis (1/1)
Since 2005, Gecina has used the NF HQE® Commercial Buildings certification for its office buildings under
development. Gecina's initial choice had proven to be relevant with its highly ambitious aspirations, seeking
one of the two highest levels of certification known as the HQE® Excellent or Exceptional passport.
For its residential properties, Gecina chose NF HQE® Habitat.
Gecina seeks to complement its HQE® certification with other certifications (LEED, BREEAM®, etc.) and
labels (Effinergie +, BiodiverCity, Well Building Standard, etc.), with a view to adapting its operations as
closely as possible to expectations of stakeholders, current and future tenants, investors and local authorities.
In 2020, 100% of surface areas were delivered with a high level of certification for office and residential
properties.
All those certifications are voluntary, Gecina is not bound by any mandatory certification so far for its buildings.
22

Stakeholders engagement (1/2)

Stakeholders engagement (2/2)
24

Gecina support actions
➢ Gecina Foundation
➢ Supporting art and culture
➢ Supporting emergency accomodation aid
The Gecina Foundation structures philanthropic projects around four areas of focus:• improving living conditions for the disabled (accessibility etc.);• protecting nature through actions to preserve or restore natural sites and promote biodiversity;• safeguarding at-risk real estate assets;• access to housing for the largest number possible.In 2020, the Gecina Foundation continued to support human-scale interaction structures. The Group’s employees remain at theheart of the collective projects supported by the Foundation by championing projects that they have suggested or agreed tosupport out of an interest in the proposed project.The Foundation has mobilized its employees, who have participated in large numbers in each of the Foundation’s actions. TheGroup’s employees are in fact at the heart of the collective actions supported by the Foundation, acting on a voluntary and non-profit basis.More details in 2020 Universal Registration Document pages 151-153
In 2019, Gecina established the new direction of its artistic policy by publishing clear guidelines.In 2020, Gecina maintained the new direction of its artistic policy through its participation in the “1 Immeuble, 1 OEuvre”. (1Building, 1 Work of Art) Club. To support French healthcare workers in the fight against Covid-19, Gecina took part in a charityauction and put up for sale two works of art. The amount collected was used in full for the benefit of nursing staff.
More details in 2020 Universal Registration Document pages 153
During the health crisis, Gecina has responded actively to the national solidarity effort by offering accommodation to on-duty oron-call healthcare staff of hospitals in the Île-de-France region in residences with apartments that have been vacated bystudents. Gecina has signed agreements with Assistance Public – Hôpitaux de Paris (AP-HP) and the Diaconesses-Croix-Saint-Simon hospital group to accommodate healthcare staff in YouFirst Campus network of residences. Following the success of thisfirst collaboration, Gecina and AP-HP are now coming together to rent housing units to house nurses who have recentlycompleted their professional training, facilitating their access to housing.To offer urgent protection to women in need and their children, Gecina has partnered with the Fondation des Femmes (FrenchWomen’s Foundation) and the FNSF (French National Women’s Solidarity Federation) to provide furnished bedrooms in itsstudent residences.More details in 2020 Universal Registration Document pages 153
25
SOCIAL PERFORMANCE
MEASURES
05/07/2021
--
In 2020, the group had :
• 50% women on the board of directors;
•45% women on the executive committee;
• 35% of women senior managers (executive committee and board of directors);
• 59,4% of women employees.
Employee gender diversity
2020 CSR EPRA Report27 05/07/2021
The professional equality index score increased to 94/100 for the year 2020 and Gecina obtained first place in the Ethics & Board ranking for the feminization of management bodies for the fourth consecutive year.

--
The wage analysis made in the context of work for professional equality between men and women is shared every year with the social partners. Since 2010, corrective measures have been taken for each unjustified difference in compensation of over 3%, at equivalent position, skills, level of qualification and work experience.
GENDER PAY RATIO
2020 CSR EPRA Report28 05/07/2021
% raise M W % raise M W
Managers individual raise 3,21% 3,90% 2,43% 3,49% 3,36% 3,63%
Company-wide raise 0,95% 0,92% 0,95% 1,14% 1,13% 1,14%
Individual raise 2,25% 3,68% 1,82% 1,41% 1,66% 1,33%
Total raises non managers 3,19% 4,60% 2,78% 2,55% 2,78% 2,47%
3,21% 3,98% 2,55% 3,25% 3,29% 3,21%
Non-managers
Total overall increases
% increase CWR + IR 2019 % increase CWR + IR 2020
Median wage M W
Manager 5 183 4 935
Non manager 3 010 3 182
Caretakers 2 549 2 286
--
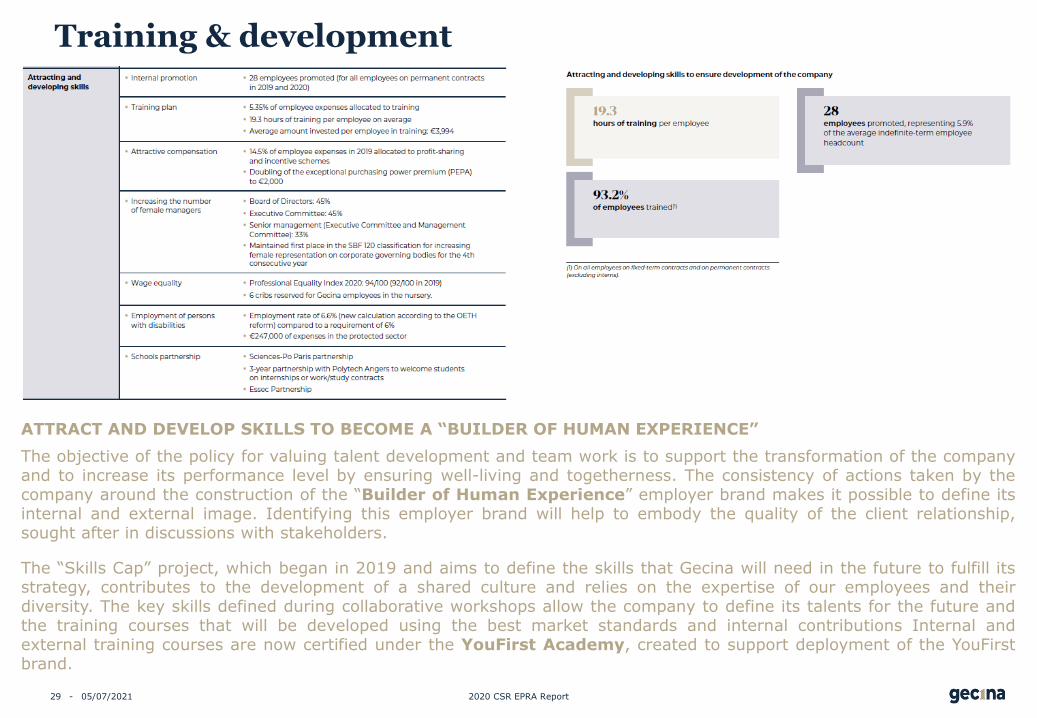
ATTRACT AND DEVELOP SKILLS TO BECOME A “BUILDER OF HUMAN EXPERIENCE”
The objective of the policy for valuing talent development and team work is to support the transformation of the companyand to increase its performance level by ensuring well-living and togetherness. The consistency of actions taken by thecompany around the construction of the “Builder of Human Experience” employer brand makes it possible to define itsinternal and external image. Identifying this employer brand will help to embody the quality of the client relationship,sought after in discussions with stakeholders.
The “Skills Cap” project, which began in 2019 and aims to define the skills that Gecina will need in the future to fulfill itsstrategy, contributes to the development of a shared culture and relies on the expertise of our employees and theirdiversity. The key skills defined during collaborative workshops allow the company to define its talents for the future andthe training courses that will be developed using the best market standards and internal contributions Internal andexternal training courses are now certified under the YouFirst Academy, created to support deployment of the YouFirstbrand.
Training & development
2020 CSR EPRA Report29 05/07/2021
--
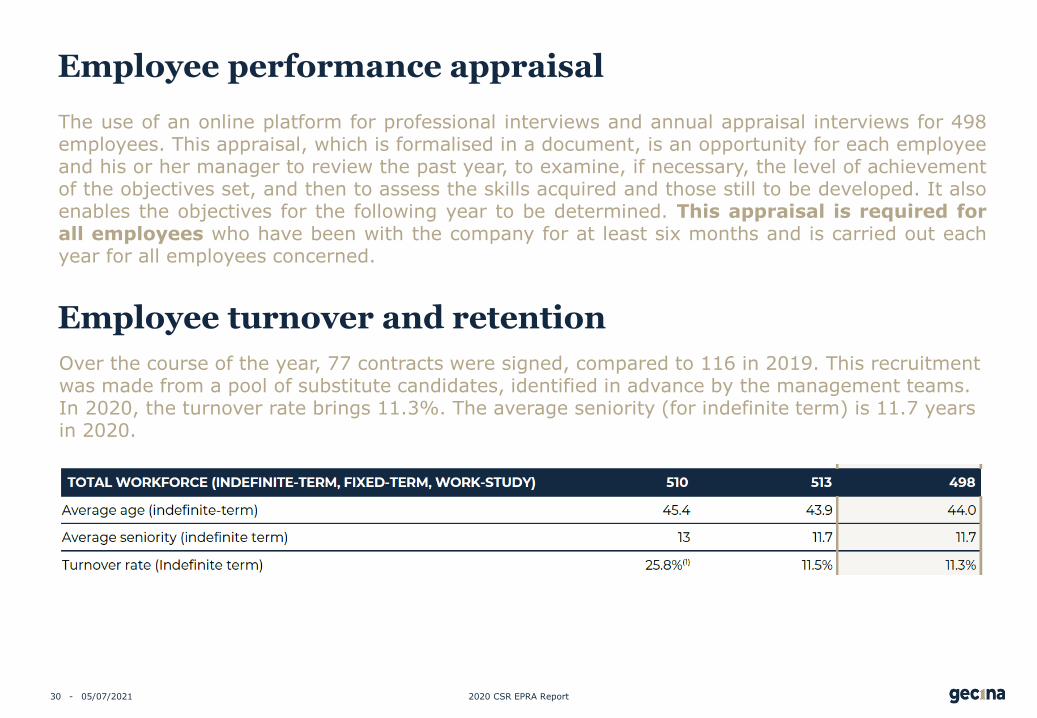
The use of an online platform for professional interviews and annual appraisal interviews for 498employees. This appraisal, which is formalised in a document, is an opportunity for each employeeand his or her manager to review the past year, to examine, if necessary, the level of achievementof the objectives set, and then to assess the skills acquired and those still to be developed. It alsoenables the objectives for the following year to be determined. This appraisal is required forall employees who have been with the company for at least six months and is carried out eachyear for all employees concerned.
Employee performance appraisal
Employee turnover and retention
Over the course of the year, 77 contracts were signed, compared to 116 in 2019. This recruitment was made from a pool of substitute candidates, identified in advance by the management teams. In 2020, the turnover rate brings 11.3%. The average seniority (for indefinite term) is 11.7 years in 2020.
2020 CSR EPRA Report30 05/07/2021

--
Employee health and safety
2020 CSR EPRA Report31 05/07/2021

--
Asset health and safety assessments (1/2)
Since 2006, the Gecina group has been supported by Provexi. Provexi provides Gecina with a secure web platform,where data linked to the risks for its assets in the 15 mapped areas is centralized, structured and harmonized. Allthe audits required by regulation (asbestos, lead paints, etc.) And those stemming from Grecina's strategic policy(flood, fire, operational safety, mobile telephony antennas, etc.) are integrated and controlled on this platform.
Dynamic dashboards make it possible to constantly monitor buildings’ compliance with Gecina's regulations andstrategy. The action plans to be undertaken stem from the support tool, and promote a better awareness of therisks and, once addressed, boost the efficiency of the assets.
The improvements made to the mechanism over 2017 include, in particular, an adjustment of the lead and waterindicators, the establishment of periodic elevator visits (in addition to the five-year visit reports alreadyconducted), the inclusion of summaries on asbestos per site following a new visual that allows easier access toinformation, the integration of the new control obligations in relation to gas and electricity facilities within the DDT(technical audit file) locations, the creation of specific access channels for those conducting audits that make itpossible to establish a control and exchange work flow on audit reports before their integration into the files(extended to all areas of real estate audits), the introduction of mobile applications to facilitate the preparation ofoccupational risk prevention and risk assessments plans in the field, and the development of the platform in orderto integrate the new Gecina organizational framework.
It covers all of the group’s activities, 268 assets.
2020 CSR EPRA Report32 05/07/2021

--
Asset health and safety assessments (2/2)
2020 CSR EPRA Report33 05/07/2021
➢ 3,165 checks carried out identified 240 compliance actions to be carried out. 51% were completed in 2020. The remaining 49% have been implemented in 2021 and will be closed upon receipt of the corresponding certificates.
➢ In 2020, the building risk monitoring system was strengthened in three areas:➢ Management, with the strengthening of central
management and an increase in the frequency of risk monitoring
➢ The implementation of new tools (dashboard, summary, details) to facilitate and improve monitoring
➢ In-depth work to complete building risks by collecting, centralising and making reliable technical data.

--
Comfort and well-being of occupants
2020 CSR EPRA Report34 05/07/2021

GOVERNANCE PERFORMANCEMEASURES
05/07/2021

--
Composition of the highest governance body (1/2)
2020 CSR EPRA Report36 05/07/2021

--
Composition of the highest governance body (2/2)
2020 CSR EPRA Report37 05/07/2021

--
Nominating and selecting the highest governance body (1/2)
Gecina complies with the AFEP-MEDEF Corporate Governance Code for listed companies (“AFEP-MEDEF Code”),pursuant to the decision by the Board Meeting of February 19, 2020. As at the date of preparation of this report,Gecina complies with all recommendations of this Code, which is available on the AFEP (www.afep.com) and theMEDEF (www.medef.com) websites.
During the 2020 financial year, the following changes were made to the structure of the Board of Directors and itsCommittees:
More details in 2020 Universal Registration Document page 167
2020 CSR EPRA Report38 05/07/2021
At its meeting on February 19, 2020, the Board of Directors resolved, on the recommendation of the Governance, Appointment, and Compensation Committee, to set up two new Committees, in addition to the Audit and Risk Committee, the Governance, Appointment, and Compensation Committee and the Strategic and Investment Committee, in order to strengthen the adaptation of the company’s governance to legislative and regulatory changes and to the new challenges arising therefrom:• a Corporate Social Responsibility (CSR) Committee;• a Compliance and Ethics Committee.

--
Nominating and selecting the highest governance body (2/2)
The Board of Directors ensures that each movement in its structure is compliantwith this goal in order to be able to carry out its tasks under the best conditions.Accordingly, at December 31, 2020, the members of the Board of Directors :
■ include two different nationalities (French and Canadian);
■ respect gender parity with a 50% representation of women on the Board;
■ are 60% independent Directors in accordance with the independence criteria of
the AFEP-MEDEF Code;
■ have a range of diverse and complementary expertise, notably in the areas of
real estate, finance, accounting, management, law, CSR, risk management andnew technologies.
More details in 2020 Universal Registration Document page 166 to 181
2020 CSR EPRA Report39 05/07/2021

--
Process for managing conflicts of interest (1/2)
The internal regulations of the Board of Directors and the Directors’ charter, in accordance with the AFEP-MEDEFrecommendations, set out the rules to be followed by Directors in the area of prevention and management of conflictsof interests.
Each year, the Governance, Appointment and Compensation Committee devotes a point of its agenda to reviewingpotential situations of conflict of interest.
For transactions for which there could be a conflict of interests (acquisition, disposal of assets, etc.), the Board ofDirectors ensures that the aforesaid rules are strictly followed. Furthermore, the information or documents linked tosuch transactions are not disclosed to the Directors in such situations of conflicts of interests, even potentialones.
To Gecina’s knowledge:• no member of the Board of Directors has been convicted of fraud in the last five years;• none of its members have held senior positions in companies subject to bankruptcy, receivership or liquidationproceedings in the last five years and no one has been under arraignment and/or been the object of official publicsanctions levied by a statutory or regulatory authority;• none of these members have been prohibited by a Court from serving as a member of an administrative, executive,or supervisory body of an issuer or from being involved in the management of an issuer during the last five years.
To Gecina’s knowledge, (i) there exist no arrangements or agreements entered into with the major shareholders,clients, suppliers or other parties, by virtue of which any of the Directors were selected, (ii) there exist no restrictionsother than those, where applicable, accepted by the corporate officers concerning the sale, within a certain period oftime, of stake(s) in the share capital, (iii) there exist no service contracts linking members of the administration bodiesto Gecina or to any of its subsidiaries providing for the granting of benefits at the end of such a contract.
To the company’s knowledge, there is no family link among (i) members of the Board of Directors, (ii) corporateofficers of the company or (iii) between the persons referred to under (i) and (ii).
2020 CSR EPRA Report40 05/07/2021
--
Process for managing conflicts of interest (2/2)
Ethics charter
The ethics charter was drafted in accordance with Gecina’s fundamental values and ratified by the Board ofDirectors. It is distributed to all employees, is available via the intranet and is made public via its website. Eachnew employee is given the ethics charter and the practical guide on joining the company. A presentation on thecharter is also added to the orientation process for new Group employees and the executive induction seminar. Thispresentation is part of the more comprehensive anticorruption training scheme. The ethics charter, which isappended to the internal regulations, is based around nine main challenges:
■ compliance with regulations;■ Group commitments to stakeholders;■ Group corporate social responsibility;■ community involvement and political neutrality;■ work conduct;■ ethical business management;■ confidentiality;■ stock exchange compliance;■ whistleblowing mechanism.
All employees are asked to comply with and enforce this charter and, under all circumstances, to behaveconsistently toward their colleagues and to any other people for whom they may act as a representative of Gecinaor one of its subsidiaries.
More details in 2020 Universal Registration Document page 107
2020 CSR EPRA Report41 05/07/2021

Assurance
In compliance with french law – article 225 grenelle II law, all the following indicators have beenassessed and audited by an Independant Third Party (Ernst & Young) with different level ofassurance as follows (directly related to our materiality analysis) :
>> More details in the document called Cross-reference table on the GRI Standards « Core » optionon FY 2020
Third party audit’s (Ernst & Young) attestation is publicly available on page 159-161 of the 2020Universal Registration Document
In addition, Gecina’s HQE® operation management system is audited by Certivéa that also assessesproperties directly according to HQE® Operation certification process.
Indicator Level of certification in 2020
Energy Consumption Reasonable assurance : 50%
GHG Emission Reasonable assurance : 50%
% of renewable energy in energy mix Reasonable assurance : 50%
Waste Detailed testing (moderate) : 25%
Certification Detailed testing (moderate) : 25%
Headcount by gender Detailed testing (moderate) : 25%
42

Cross-reference table with the information required in the non financialperformance statement
43