Embed Size (px)
Citation preview

2020
A partnership between Teletrac Navman and Civil Contractors New Zealand
CONSTRUCTION INDUSTRY
SURVEY

2
This is the fourth Construction Industry Survey, a research partnership between Civil Contractors New Zealand (CCNZ) and Teletrac Navman.
Our research helps to build a picture of New Zealand’s civil construction industry and the experiences of those within the industry. The results shed light on the state of the civil construction industry and its outlook for the future, as well as stimulating discussion on industry views amongst private and public organisations, local and central government.
In previous years, the survey has resulted in a successful procurement reset, an industry careers promotion, and improved avenues for highlighting issues and improvements.
Specifically, the 2020 survey aimed to explore
Peter Silcock CEO, Civil Contractors New Zealand
James French Construction Industry Specialist, Teletrac Navman
The future of sustainable procurement and supporting technologies.
The impact of the Covid-19 pandemic on businesses and the workforce.
The industry response to sector issues and its outlook for the future.
FOREWORD

3
CONTENTS
Sustainability & Technology
Key Industry Issues
Industry Outlook /
Confidence
Key Findings WorkforceBusiness Sustainability
& Covid-19 Impacts

4
Civil contractors play a vital role in the development of New Zealand.
The people within this sector build
and maintain our nation’s civil
infrastructure which includes roading
and transport, energy, water,
communications and public
infrastructure. They also provide
services to residential and
commercial construction sectors.
A modern economy must have quality
infrastructure to compete in world
markets and to deliver high living
standards for its people.
* Ministry of Business, Innovation and Employment. (August 2019). National Construction Pipeline Report 2019. https://www.mbie.govt.nz/assets/national-construction-pipeline-report-2019.pdf
$7.6 billion* the value of national infrastructure activity in 2018
Transport, water and subdivision projects dominated new infrastructure activity in 2019, contributing 83% of the projects
and 93% of the total value.*
Estimated 60,000people employed in civil construction industry
Local Government
47%Central Government
28%(Predominantly transport projects)
Private Sector
25%(Predominantly subdivision
projects)
Project initiators from 2019 – 2024*
INDUSTRY SNAPSHOT

5
DEMOGRAPHICS AND METHODOLOGY
Base: 2020 Total (n=188)
A G E
1%
15%
28%
26%
23%
7%
18-24 years
25-34 years
35-44 years
45-54 years
55-64 years
65+ years
P O S I T I O N / R O L E
29% 14% 13% 11% 1% 21% 12%
Owner/Partner
Director GeneralManager/
CEO
ProjectManager
FleetManager
Manager (Other)
Other
56%Owner / Director / GM (CEO)
32%PM / FM / Manager
N U M B E R O F P E O P L E I N B U S I N E S S
11% 22% 18% 14% 23% 4% 7%
1-5 6-24 25-50 51-100 101-500 501-1,000 1,000+
52%Small-Medium Business
(1-50)
48%Large Business
(51+)
188 adultsfrom the civil construction industry took the online survey from 8 – 28 June 2020
The survey was produced by research firm Colmar Brunton. Margin of error for the total sample is + or - 7.1 percent at a 95 percent confidence level.

6
KEY FINDINGS
Top three projects types currently delivering most work are…
48% Roading
25% Three Waters (fresh, storm & waste)
20% Residential
Industry Outlook / Confidence
WorkforceBusiness Sustainability & Covid-19 Impacts*
22% were forced to lay off staff*
19% had contracts cancelled or deferred*
47% expect turnover to shrink over the next 12 months (June 2020 –April 2021)*
37% were affected by travel/transport restrictions*
84% took a wage subsidy*
59% are confident in their business’ ability
to withstand change and overcome challenges
29% are confident in
the outlook for the construction
industry
25% choose skills shortage as the main industry challenge
69% would hire today if the right skills were available
54% would pay for some reallocation costs for more skilled workers
19%are confident in
the New Zealand
economy
Requirement for staff over next year
32% increase
46% stay the same
21% decrease
Sustainability & Technology
77% use technology to measure adherence to workplace health and safety
77% are taking action to be more environmentally sustainable
Clients indicated to
37% of contractors that sustainability practices
will impact their procurement decision making
* Survey taken 8 – 28 June 2020

Key Industry Issues
8
In 2020, there is greater emphasis on the importance for local and central Government to provide the industry with a clearer pipeline for upcoming work. With 75 percent of work initiated by public bodies, their clarity and certainty around future work heavily impacts on the industry.
Q1. What impact do you think these actual or potential issues/events could have on your business in the next three years?
Expected events / issues with most positive impact in the next 3 years
Development of a clearer pipeline of
Government and local Government work
Investment in water infrastructure to meet new fresh water and
waste water regulatory standards (proposed)
Government's increased procurement emphasis on training and development of people and other social
outcomes
Introduction of the ‘Construction &
Infrastructure Skill Shortage List’ by immigration NZ in
December 2018
Central and local Government focus on environmental
sustainability
Base: 2019 Total (n=186), 2020 Total (n=188)
63% 54%77% 70% 58%
T O P 5 E V E N T S / I S S U E S
Development of a clearer pipeline of
Government and local Government work
Large projects proposed under the
NZ Upgrade Programme
Regional projects proposed under the
Shovel Ready Projects programme
Government's increased procurement emphasis on training and development of people and other social
outcomes
The introduction of the Construction
Industry Accord in April 2019
2020
83% 58%69% 68% 47%
2019

9
SATISFACTION OF PRODUCTIVITY KEY OPPORTUNITES E X P E C T E D I M PA C T I N T H E N E X T 3 Y E A R S
Q1. What impact do you think these actual or potential issues/events could have on your business in the next three years?
21%
11%
14%
7%
4%
6%
4%
3%
3%
2%
6%
62%
58%
54%
51%
43%
40%
41%
32%
22%
16%
5%
14%
29%
28%
32%
48%
41%
42%
36%
32%
31%
27%
3%
2%
4%
9%
4%
11%
9%
24%
37%
37%
28%
1%
1%
1%
2%
4%
5%
5%
14%
38%
Heavy reliance on the announcement of national and regional infrastructure projects has been propelled by the recent Covid-19 outbreak, in particular the Shovel Ready Projects programme, which contractors hope will fill urgent short-term gaps in the pipeline of work.
Base: 2019 Total (n=186), 2020 Total (n=188)
Development of a clearer pipeline of central and local government work
Large projects proposed under the NZ Upgrade Programme
Regional projects proposed under the Shovel Ready Projects programme
Government's increased procurement emphasis on training and development of people and other social outcomes
The introduction of the Construction Industry Accord in April 2019
The reform of Vocational Education
The establishment of the New Zealand Infrastructure Commission
Central and local Government focus on environmental sustainability
Waste minimisation and increasing landfill levies
The Zero Carbon Bill
Legalisation of cannabis (proposed)
A high negative impact A negative impact No significant impact A positive impact A high positive impact
83%
69%
68%
58%
47%
46%
45%
35%
26%
19%
6%
NETT POSITIVE

Industry Outlook / Confidence

1 1
23%
47%
E X P E C T E D T U R N O V E R C H A N G E I N T H E N E X T 1 2 M O N T H S
The impact of Covid-19 is significantly affecting growth. Only 23 percent predict growth in 2020, compared with 52 percent in 2019. Whilst half of Auckland’s businesses expect turnover to stay about the same, 60 percent of South Island businesses are anticipating that their turnover will shrink.
Q2. Do you expect that your turnover will grow, stay about the same, or shrink in the next 12 months?
25%
26%
32%
11%
6%
Grow by more than 10%
Grow by less than 10%
Stay about the same
Shrink by less than 10%
Shrink by more than 10%
Expect turnover growth in the
next 12 months
Base: 2019 Total (n=186), 2020 Total (n=188)
Expect turnover loss in the next 12 months
2019 2020
Significantly higher / lower than Total
12%
12%
30%
18%
29%
Upper NI (exc. AKL) 49%South Island 19%
South Island 60%
Significantly higher / lower than 2019

1 2Q3. What area / type of project within civil construction does your business currently get most of your work from?
SATISFACTION OF PRODUCTIVITY KEY OPPORTUNITES K E Y P R O J E C T S T Y P E S C U R R E N T LY G E T T I N G M O S T W O R K F R O M
Base: 2019 Total (n=186), 2020 Total (n=188)
9%Public infrastructure
(ports, airports, landfills)Commercial building
foundations and demolition
22%27%
Three waters (freshwater, stormwater and wastewater)
21%
Residential
32%
Roading
14%
2020
11%Public infrastructure
(ports, airports, landfills)
20%
Residential
25%
Three waters (freshwater, stormwater and wastewater)
Commercial building foundations and demolition
48%
Roading
Significantly higher / lower than 2019
2019
Roading is coming through strongly as the area with the most work on in 2020, as commercial building projects drop off. The Government’s New Zealand Upgrade Programme has allocated $5.3 billion towards roading. Residential and three waters continue to be strong areas for work.

1 3Q4. What area / type of project within civil construction do you plan to increase your capability in over the next 12 months?
K E Y P R O J E C T T Y P E S F O R I N C R E A S E D C A P A B I L I T Y I N N E X T 1 2 M O N T H S
Base: 2019 Total (n=186), 2020 Total (n=188)
Public transport (rail, cycleways, busways etc.)
15%
Commercial building foundations and demolition
14%
Residential
18%
Roading
18%
Three waters (freshwater, stormwater and wastewater)
27%
13%
Public infrastructure (ports, airports, landfills)
13%
Residential
14%
Public transport (rail, cycleways, busways etc.)
29%
Three waters (freshwater, stormwater and wastewater)
Significantly higher / lower than 2019
2020
31%
Roading
2019
Businesses are responding to changes by planning to significantly increase their capabilities in roading projects, whereas commercial building projects have become less of a focus within the industry and have been replaced by public infrastructure.
1 4
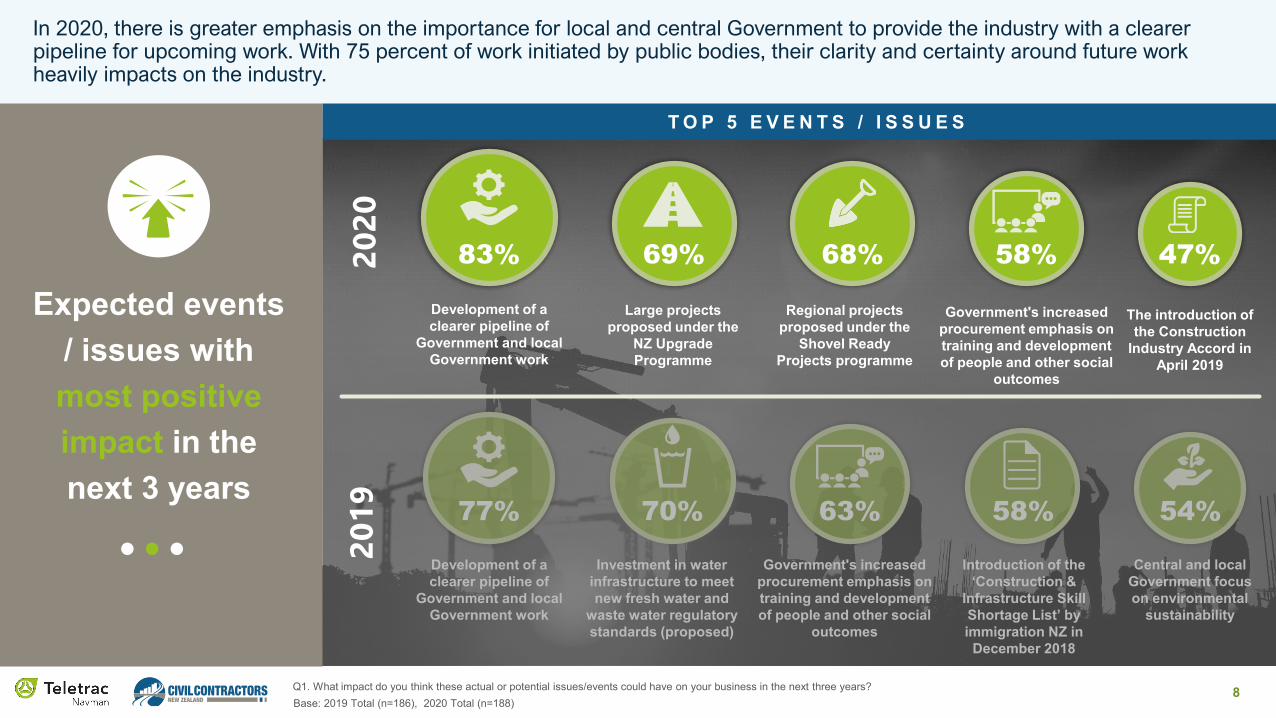
59 percent of businesses are feeling confident in their ability to withstand change and overcome challenges. However, overallconfidence is lower: contractors are less certain in the industry outlook and the economy as a whole.
Q5. Thinking about the future, how confident are you in...Base: 2020 Total (n=188)
B U S I N E S S C O N F I D E N C E & O U T L O O K
3%
6%
13%
14%
10%
24%
19%
7%
13%
18%
24%
31%
23%
30%
32%
35%
40%
35%
34%
33%
32%
41%
36%
23%
19%
20%
13%
14%
17%
11%
6%
7%
5%
7%
4%
1 - Not at all confident 2 3 4 5 - Very confident
The ability of your business to withstand change and overcome challenges
The ability of new technology to improve business efficiency and overcome challenges
The current outlook for the civil construction industry
The future pipeline of civil construction work
The ability of New Zealand’s infrastructure to cope with climate change (e.g. Erosion, severe
weather events)
The Government’s commitment to infrastructure
The New Zealand economy

1 5Q5. Thinking about the future, how confident are you in... Q6. Why did you give the rating of confident for the current outlookof the civil construction industry?Base: 2020 Total (n=188)
What’s driving industry confidence?
“I am relatively confident that in tight times and high unemployment that the government will spend money on infrastructure to soak up unemployment.” – South Island
“Investment in core infrastructure is key to the recovery of the country.” – Auckland
“Civil construction will receive funding boosts (election year policies on both sides) and will have more labour available as other industries shed staff.” – Lower North Island
29%
Government investment for recovery Pipeline of work increasing A strong industry
“In Southland we are very busy and positive, however our Central Lakes region has changed due to lack of tourism.”– South Island
“The medium term outlook is for a strong pipeline of work published by Government. Longer term however I am concerned how sustainable this will be and whether we will go into a boom/bust cycle (again).” – Auckland
“There is plenty of work around and not enough skilled people to carry it out.” – Lower North Island
“Civil construction industry is robust. The last to dry up in a recession and the first to get going. Dirt = $$$.” - Upper North Island (exc. Auckland)
“Work will pick up and be more competitive with the experience coming back from overseas. And the government funded projects will help get the industry moving in the right direction.”– Upper North Island exc. Auckland)
“The work on the books over the next few years is good.” – Lower North Island
Confident in civil construction industry
outlook
There are three key themes driving confidence in the current outlook for the industry – Government investment, increase in the pipeline of work and the sector’s resilience in economic downturns.
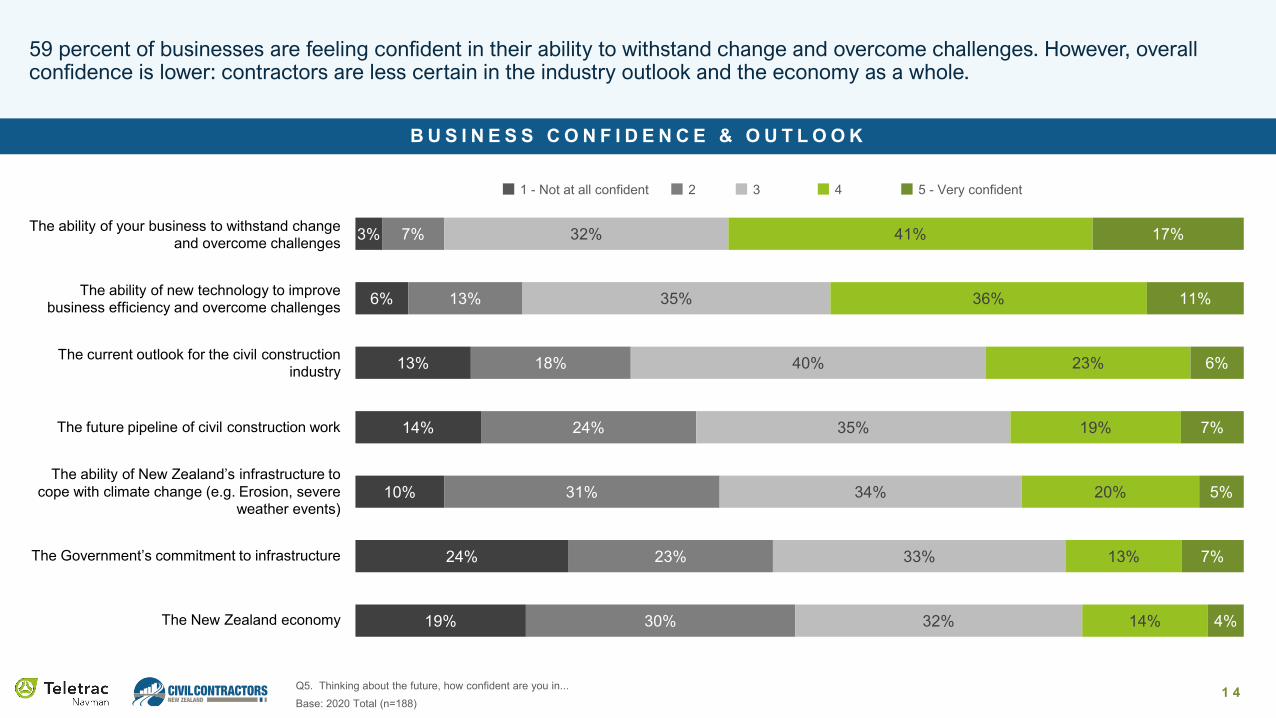
1 6Q5. Thinking about the future, how confident are you in... Q6. Why did you give the rating of less confident for the currentoutlook of the civil construction industry?Base: 2020 Total (n=188)
“Government and Council inefficiencies and red tape.”– South Island
“Very few projects to keep pipeline flowing. Coming out of Covid-19, Ministers involved in the construction industry have been very quiet to date on what they see as a road map to keep the nation moving forward.”– Auckland
Lack of faith in the Government
Work slow to materialise Uncertain times causing pessimism
“No visibility of pipeline greater than 3 months. Government investment not visible, will be a huge gap for 3-12 months as we sit and wait. Local Councils sitting on hands waiting for government funding too - all too slow!!” -South Island
“Delays caused by approvals consents and two many contractors bidding for work.” -South Island
“Lack of definitive project pipeline from the government. To much talk not much action.” – Lower North Island
“Its very complex environment which increases the level of uncertainty. A lot of factors can influence the outlook. Very hard to predict at the moment.” -South Island
“The pipeline is gone.” -Auckland
“Many facing uncertain future. We have a road maintenance contract but would really struggle without it.” – Upper North Island (exc. Auckland)
“Work is stopping.” – Lower North Island
31%
Not confident in civil construction industry
outlook
What’s causing a lack of confidence?
Many are facing a slowdown of work or running out of work, with no projects on the immediate horizon heavy competition, and slow processes causing delays in work coming to market.
1 7
Skill shortage and availability of workers
Impact of potential recession
Lack of work for contractors
Sudden changes in Government pipeline
Visibility of project pipeline
Compliance and regulatory costs
Collaboration between clients
Changes to Government procurement guidelines
COVID-19
Work consent conditions and client requirements
Fluctuating costs
Health and safety competency
Lack of technology advances/innovations
Environmental sustainability challenges
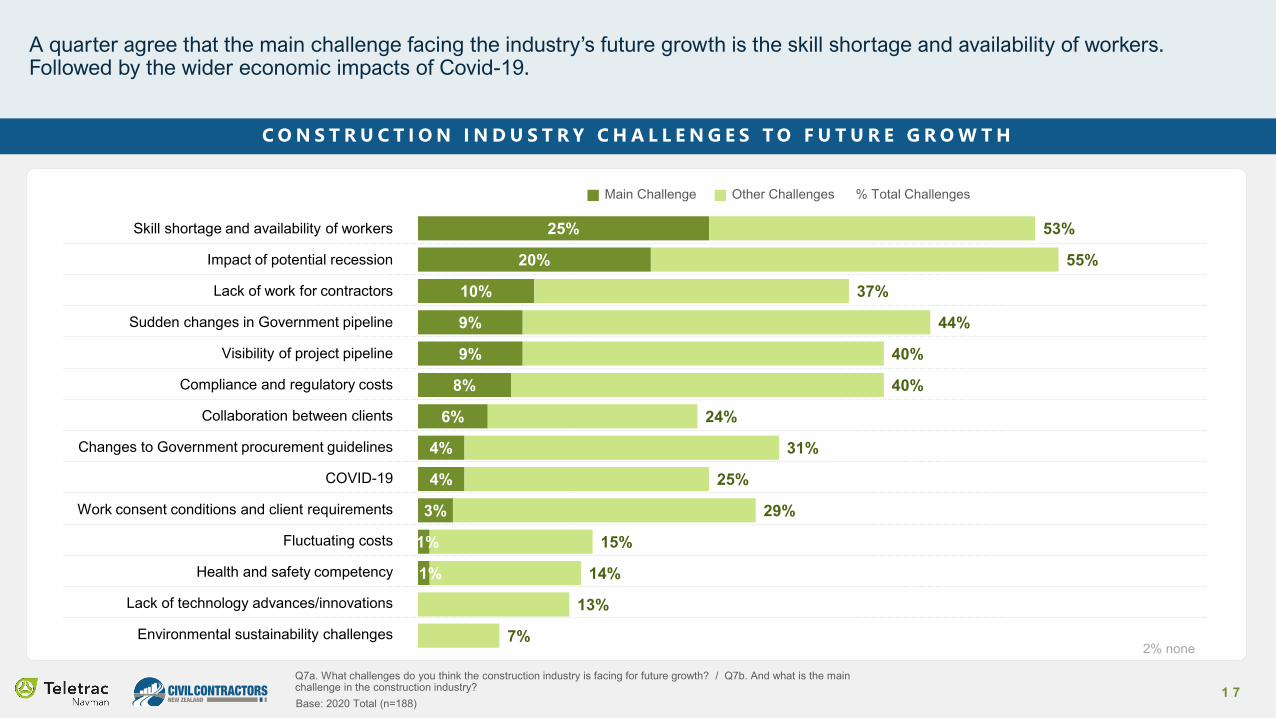
A quarter agree that the main challenge facing the industry’s future growth is the skill shortage and availability of workers. Followed by the wider economic impacts of Covid-19.
Q7a. What challenges do you think the construction industry is facing for future growth? / Q7b. And what is the main challenge in the construction industry?
C O N S T R U C T I O N I N D U S T R Y C H A L L E N G E S T O F U T U R E G R O W T H
25%
20%
10%
9%
9%
8%
6%
4%
4%
3%
1%
1%
53%
55%
37%
44%
40%
40%
24%
31%
25%
29%
15%
14%
13%
7%
Base: 2020 Total (n=188)
2% none
Main Challenge Other Challenges % Total Challenges
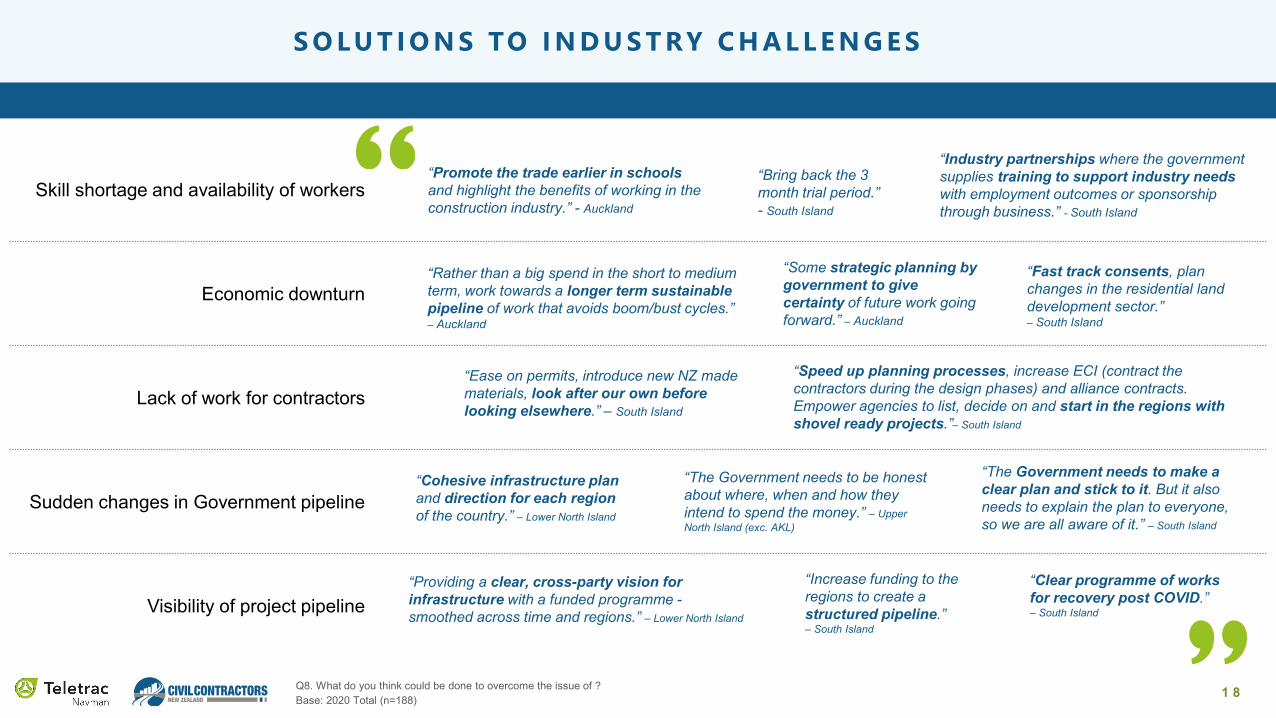
1 8Q8. What do you think could be done to overcome the issue of ?Base: 2020 Total (n=188)
Skill shortage and availability of workers
Economic downturn
Lack of work for contractors
Sudden changes in Government pipeline
Visibility of project pipeline
S O LU T I O N S TO I N D U S T RY C H A L L E N G E S
“Promote the trade earlier in schools and highlight the benefits of working in the construction industry.” - Auckland
“Bring back the 3 month trial period.”- South Island
“Industry partnerships where the government supplies training to support industry needswith employment outcomes or sponsorship through business.” - South Island
“Some strategic planning by government to give certainty of future work going forward.” – Auckland
“Rather than a big spend in the short to medium term, work towards a longer term sustainable pipeline of work that avoids boom/bust cycles.” – Auckland
“Fast track consents, plan changes in the residential land development sector.” – South Island
“Speed up planning processes, increase ECI (contract the contractors during the design phases) and alliance contracts. Empower agencies to list, decide on and start in the regions with shovel ready projects.”– South Island
“Ease on permits, introduce new NZ made materials, look after our own before looking elsewhere.” – South Island
“The Government needs to make a clear plan and stick to it. But it also needs to explain the plan to everyone, so we are all aware of it.” – South Island
“Cohesive infrastructure plan and direction for each region of the country.” – Lower North Island
“The Government needs to be honest about where, when and how they intend to spend the money.” – Upper North Island (exc. AKL)
“Clear programme of works for recovery post COVID.”– South Island
“Increase funding to the regions to create a structured pipeline.”– South Island
“Providing a clear, cross-party vision for infrastructure with a funded programme -smoothed across time and regions.” – Lower North Island

Business Sustainability & Covid-19 Impacts

2 0
The pipeline uncertainty, with both council and private sector pulling back on spending, is that no one can see six to 12 months ahead. Projects starting construction today had planners, designers and architects at work last year. Contractors began allocating resources, scaling up or down based on predictions of work. Therefore it will take a long time for Government spending to reach the ‘shovel ready’ stage.
C O V I D - 1 9 I M PA C T O N B U S I N E S S E S
Q29. What impact has COVID-19 had on your business? / Q30. What has been the biggest impact of COVID-19 on your business?
Base: 2020 Total (n=188)
94% of businesses have been negatively impacted by Covid-19…
5%
21%
40%
32%
1%
No / Positive Impact
Minor Negative Impact
Moderate Negative Impact
Large Negative Impact
Forced to close business
Biggest impacts of Covid-19
Cashflow
23%
Loss of profit
21%
Uncertainty of work pipeline
26%
Contracts cancelled or deferred
19%
Business productivity impacts
6%
Added costs of compliance
2%
2 1
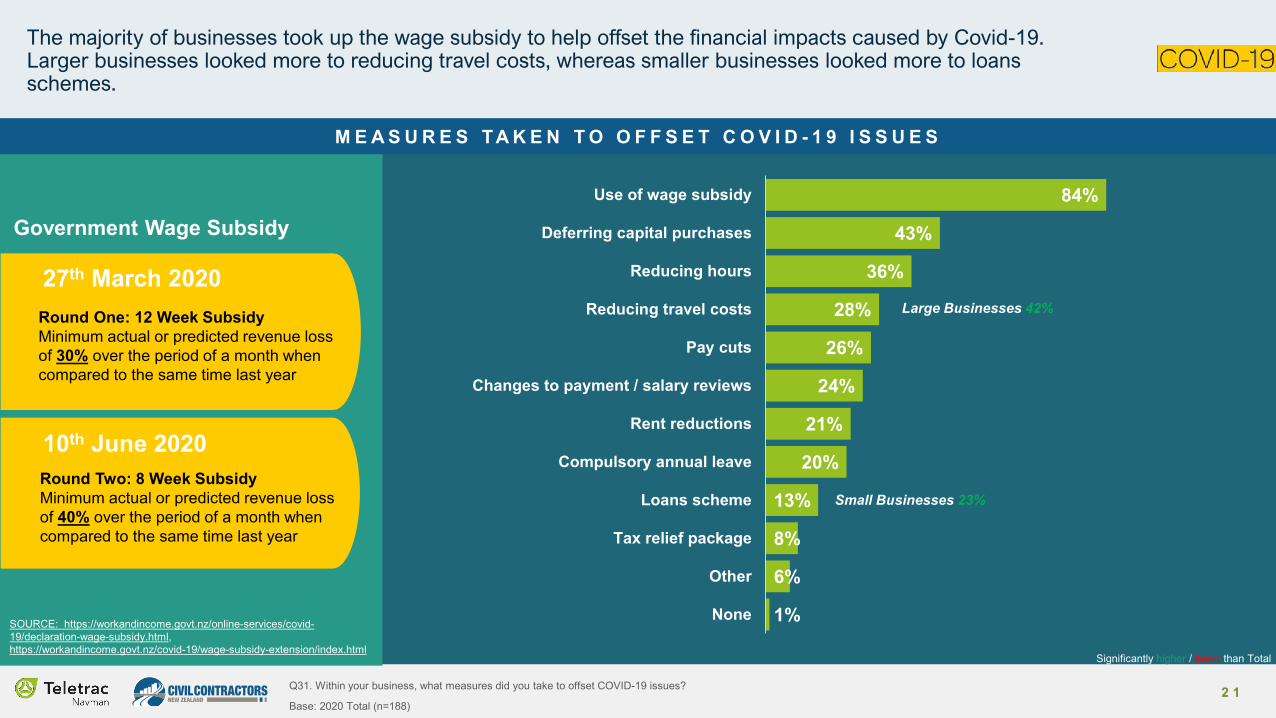
Government Wage Subsidy
The majority of businesses took up the wage subsidy to help offset the financial impacts caused by Covid-19. Larger businesses looked more to reducing travel costs, whereas smaller businesses looked more to loans schemes.
M E A S U R E S TA K E N T O O F F S E T C O V I D - 1 9 I S S U E S
Q31. Within your business, what measures did you take to offset COVID-19 issues?
Base: 2020 Total (n=188)
84%
43%
36%
28%
26%
24%
21%
20%
13%
8%
6%
1%
Use of wage subsidy
Deferring capital purchases
Reducing hours
Reducing travel costs
Pay cuts
Changes to payment / salary reviews
Rent reductions
Compulsory annual leave
Loans scheme
Tax relief package
Other
None
Large Businesses 42%
Small Businesses 23%
Round One: 12 Week SubsidyMinimum actual or predicted revenue loss of 30% over the period of a month when compared to the same time last year
SOURCE: https://workandincome.govt.nz/online-services/covid-19/declaration-wage-subsidy.html, https://workandincome.govt.nz/covid-19/wage-subsidy-extension/index.html
27th March 2020
10th June 2020Round Two: 8 Week SubsidyMinimum actual or predicted revenue loss of 40% over the period of a month when compared to the same time last year
Significantly higher / lower than Total

2 2Q36a. Were you forced to lay off staff because of COVID-19? / Q36b. How many staff did you need to lay off due to COVID-19?
Base: Owner, Director, General Manager, Project Manager, Fleet Manager, 2020 (n=127), 2020 Total (n=188)
45% 21% 10% 5% 5% 7%
22% were forced to lay off staff. Here’s how many staff they laid off…
T H E I M PA C T O F C O V I D - 1 9 O N S TA F F N U M B E R S
1 to 5 6 to 10 11 to 20 21 to30
41 to50
51+
Note: 0% for 31 to 40
2 3
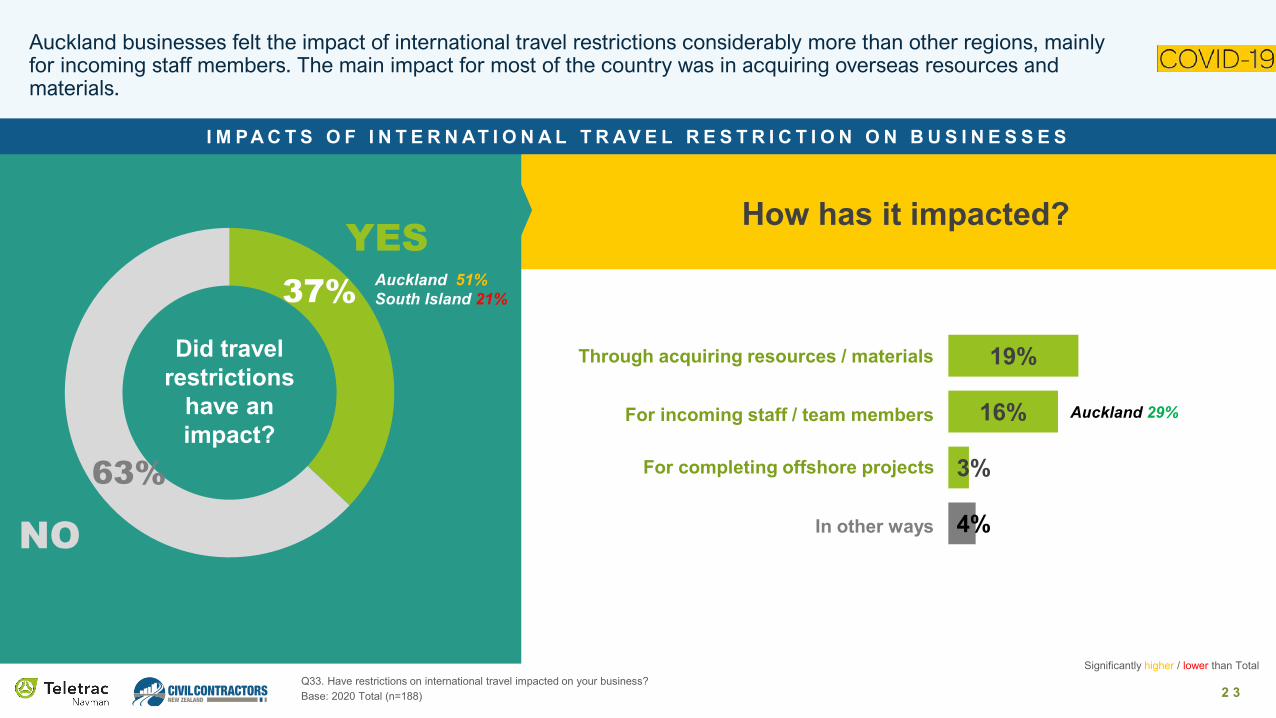
37%
63%
Auckland businesses felt the impact of international travel restrictions considerably more than other regions, mainly for incoming staff members. The main impact for most of the country was in acquiring overseas resources and materials.
I M PA C T S O F I N T E R N AT I O N A L T R AV E L R E S T R I C T I O N O N B U S I N E S S E S
Base: 2020 Total (n=188) Q33. Have restrictions on international travel impacted on your business?
NO
How has it impacted?
Auckland 51%South Island 21%
Did travel restrictions
have an impact?
YES
19%
16%
3%
4%
Through acquiring resources / materials
For incoming staff / team members
For completing offshore projects
In other ways
Significantly higher / lower than Total
Auckland 29%
Workforce

2 5Q19. Over the next year, do you think your requirement for staff will…Base: Owner, Director, General Manager, Project Manager, Fleet Manager
R E Q U I R E M E N T F O R S TA F F I N T H E N E X T Y E A R
21%12% 8% 2%
46%
39%28% 34%
32%50%
63% 64%
Increase
Stay the same
Decrease
2018 20172019
n=113 n=95 n=95
There is a significant decline in the number of businesses saying they will require more staff in the next year. It is feared that during this contraction, skills will not be developed or will be lost overseas, leading to a larger skills shortage once Government projects come to market.
n=127
2020
Significantly higher / lower than 2019
2 6
2019
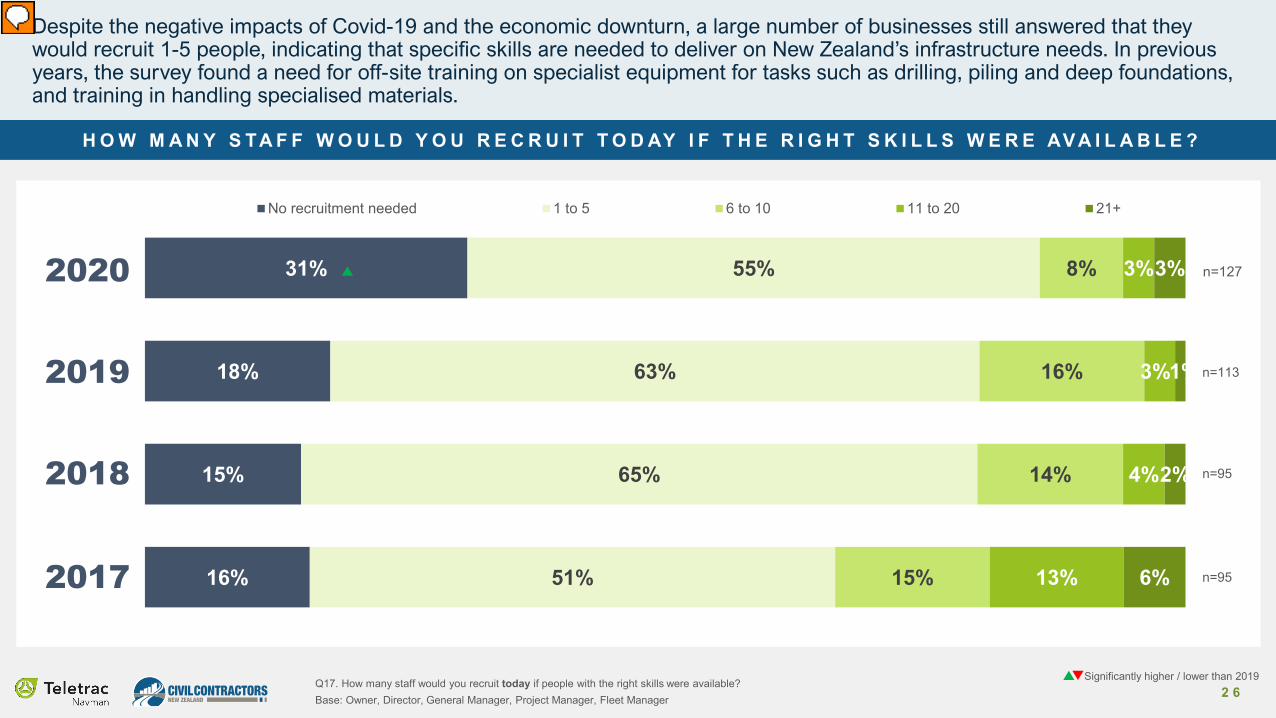
H O W M A N Y S TA F F W O U L D Y O U R E C R U I T T O D AY I F T H E R I G H T S K I L L S W E R E AV A I L A B L E ?
Q17. How many staff would you recruit today if people with the right skills were available? Base: Owner, Director, General Manager, Project Manager, Fleet Manager
2018
2017
Despite the negative impacts of Covid-19 and the economic downturn, a large number of businesses still answered that they would recruit 1-5 people, indicating that specific skills are needed to deliver on New Zealand’s infrastructure needs. In previous years, the survey found a need for off-site training on specialist equipment for tasks such as drilling, piling and deep foundations, and training in handling specialised materials.
2020 31%
18%
15%
16%
55%
63%
65%
51%
8%
16%
14%
15%
3%
3%
4%
13%
3%
1%
2%
6%
No recruitment needed 1 to 5 6 to 10 11 to 20 21+
Significantly higher / lower than 2019
n=113
n=95
n=95
n=127
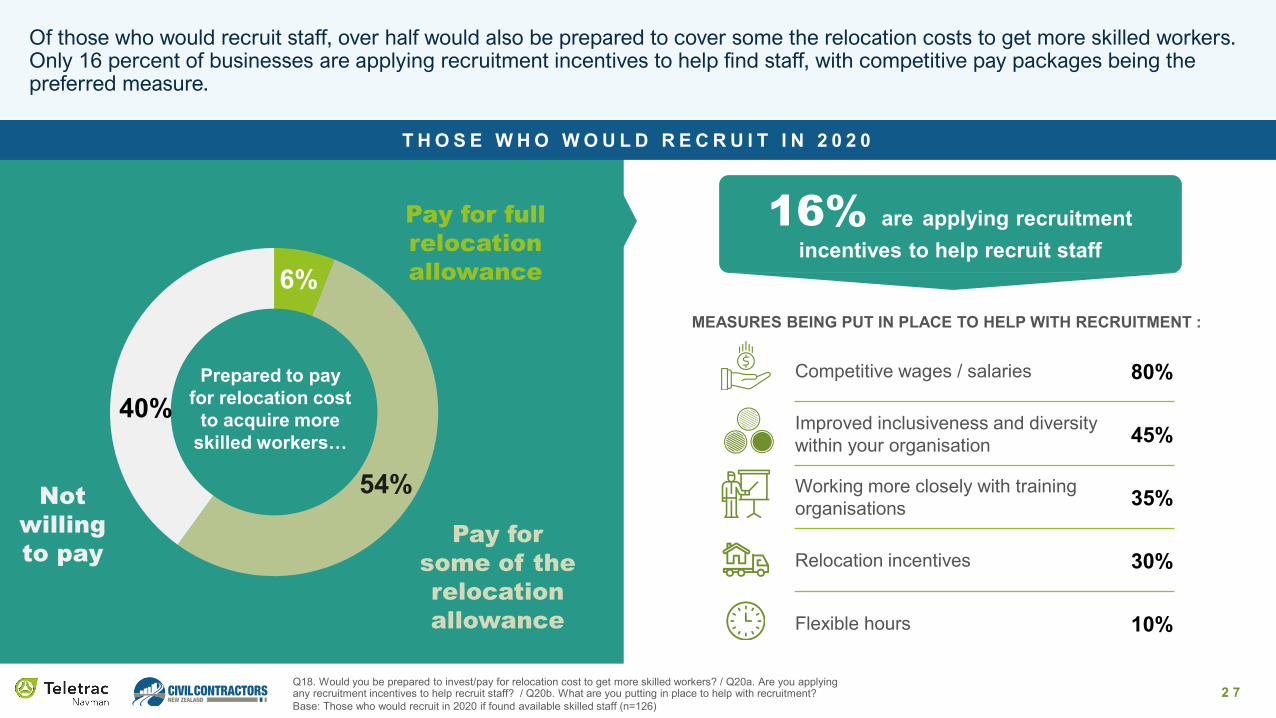
2 7Base: Those who would recruit in 2020 if found available skilled staff (n=126)
Of those who would recruit staff, over half would also be prepared to cover some the relocation costs to get more skilled workers. Only 16 percent of businesses are applying recruitment incentives to help find staff, with competitive pay packages being thepreferred measure.
6%
54%
40%
16% are applying recruitmentincentives to help recruit staff
Competitive wages / salaries 80%
Improved inclusiveness and diversity within your organisation 45%
Working more closely with training organisations 35%
Relocation incentives 30%
Flexible hours 10%
Prepared to pay for relocation cost
to acquire more skilled workers…
Pay for full relocation allowance
Pay for some of the relocation allowance
Not willing to pay
MEASURES BEING PUT IN PLACE TO HELP WITH RECRUITMENT :
Q18. Would you be prepared to invest/pay for relocation cost to get more skilled workers? / Q20a. Are you applying any recruitment incentives to help recruit staff? / Q20b. What are you putting in place to help with recruitment?
T H O S E W H O W O U L D R E C R U I T I N 2 0 2 0
Sustainability and Technology

2 9
37%
14%
49%NO
Yes, will impact
Local and central Government make up around 75 percent of the clients for civil construction work. Client focus on more sustainable business practices - social, environmental, financial - is starting to impact on procurement decisions. In coming years, sustainability initiatives could offer contractors an opportunity for competitive advantage.
P R O C U R E M E N T
Q11. Have your clients indicated that your business’s sustainability (economic, social, environmental) practices will impact their procurement decision making? / Q12. Which of the following procurement initiatives are affecting your business?Base: Total Sample 2020 (n=188)
Procurement initiatives affecting businesses:Have clients indicated that your business’s sustainability efforts will impact their procurement decisions?
Deviation from standard contract terms 30%
Increasing use of panels amongst local Government and CCOs 24%
The inclusion of more environmental outcomes in procurement (e.g. the Zero Carbon Bill requirements) 20%
Bundling of contracts 18%
A shift in procurement outcomes from lowest cost towards social outcomes 16%
None 35%Don’t Know

3 0
Health and safety in the workplace is a strong driver behind the adoption of measurement technology. Technology is also used by some contractors to measure environmental impacts such as waste management, water usage on site and carbon emissions.
Q15. Are you using technology to measure the following?
Base: Total Sample 2020 (n=188)
T E C H N O L O G Y I S B E I N G U S E D T O M E A S U R E …
Adherence to workplace health
and safety
Safe driver behaviour
Contact tracing Efficiency of asset utilisation
77% 69% 62% 59%
3 4
53%Safe Machine
Operator Behaviour
5
44%Fuel Burn
30%Electricity Usage
on site
30%Waste Management
29%Recycling
27%Water Usage
on site
25%Carbon emissions
from vehicles
23%Carbon emissions from machinery
T E C H N O L O G Y I S B E I N G U S E D T O M E A S U R E …
21

3 1
T E C H N O L O G Y T Y P E B E I N G U S E D T O M E A S U R E T H E S E A R E A S …
Base: Those using each technology Q16. And what technology are you using to measure…?
GPS fleet tracking, electronic checklists, and machine control and guidance are the most widely used technologies for measuring safety in the civil construction industry.
n=144 n=129 n=117 n=110 n=99
Sensors and alerts
Solar Power
Machine control and guidance
RFID tags
Electronic checklistsor reporting
Project management software
Cameras on person(body cams)
Cameras in vehicle (front facing)
Fuel management systems
GPS fleet tracking
38%
84%
34%
71% 64%
11%
18%
9%
30%
19%
13%
17%
6%
5%
16%
4%
3%
2%
1%6%
26%
7%
16%
22%10%
54%
27%
54%
30%
32%
4%2%
3%
5%
3%18%
11%
5%
23%30%
1%
1%
15% 17%
9%
12% 20%
Adherence to workplace health
and safety
Safe machine operator behaviour
Efficiency of asset utilisation
Contact tracing
Safe driver behaviour
3 2
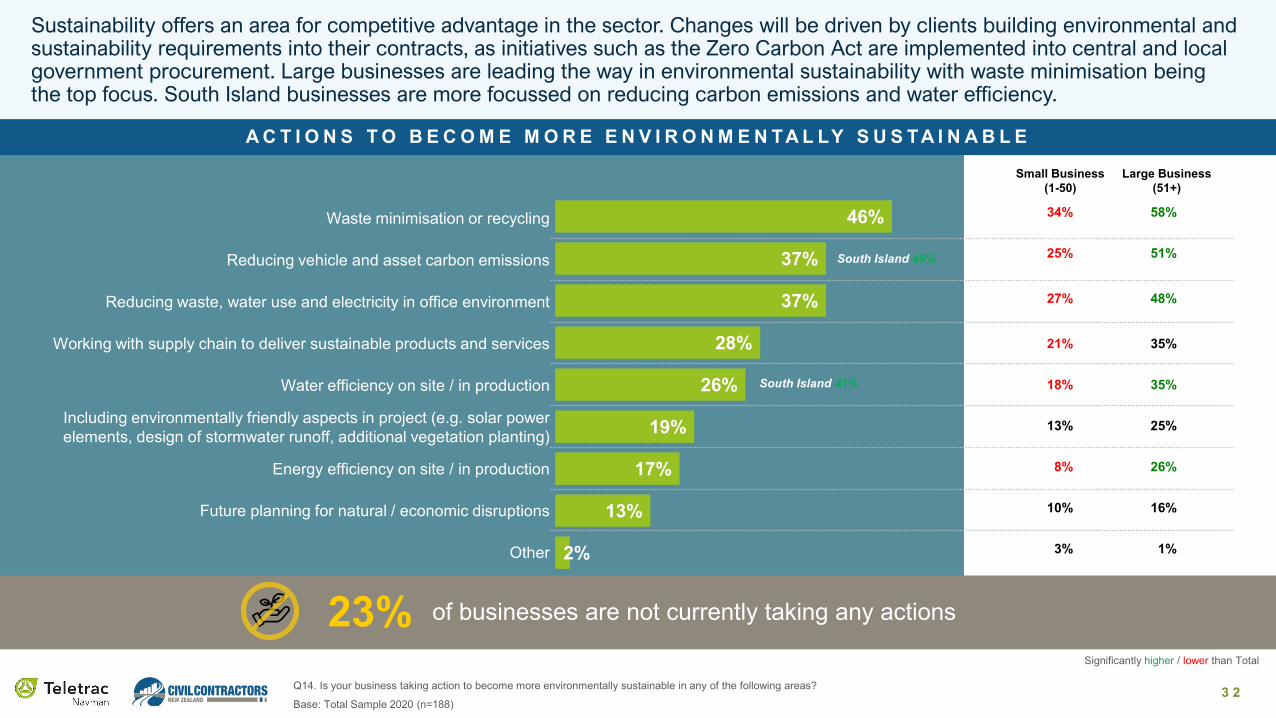
Waste minimisation or recycling
Reducing vehicle and asset carbon emissions
Reducing waste, water use and electricity in office environment
Working with supply chain to deliver sustainable products and services
Water efficiency on site / in production
Including environmentally friendly aspects in project (e.g. solar power elements, design of stormwater runoff, additional vegetation planting)
Energy efficiency on site / in production
Future planning for natural / economic disruptions
Other
Base: Total Sample 2020 (n=188)
Q14. Is your business taking action to become more environmentally sustainable in any of the following areas?
A C T I O N S T O B E C O M E M O R E E N V I R O N M E N TA L LY S U S TA I N A B L E
Sustainability offers an area for competitive advantage in the sector. Changes will be driven by clients building environmental and sustainability requirements into their contracts, as initiatives such as the Zero Carbon Act are implemented into central and local government procurement. Large businesses are leading the way in environmental sustainability with waste minimisation being the top focus. South Island businesses are more focussed on reducing carbon emissions and water efficiency.
46%
37%
37%
28%
26%
19%
17%
13%
2%
South Island 41%
South Island 49%
34% 58%
25% 51%
27% 48%
21% 35%
18% 35%
13% 25%
8% 26%
10% 16%
3% 1%
Small Business(1-50)
Large Business(51+)
of businesses are not currently taking any actions23%Significantly higher / lower than Total
Civil Contractors New Zealand
Teletrac Navman
Teletrac Navman is a leading software-as-a-service (SaaS)provider leveraging location-based technology and servicesfor managing mobile assets. With specialised solutions thatdeliver greater visibility into real-time insights and analytics,Teletrac Navman helps companies make better businessdecisions that enhance productivity and profitability. It tracksand manages more than 550,000 vehicles and assets formore than 40,000 companies around the world. Thecompany is headquartered in Garden Grove CA, withadditional offices in New Zealand, United States, UnitedKingdom, Australia and Mexico.
Civil Contractors New Zealand represents the interests andaspirations of more than 600 member organisations –including large, medium-sized and small businesses in civilengineering, construction and general contracting. It also hasassociate members who provide valuable products, supportand services to contractor members.
7-11 Kawana StreetNorthcote, Auckland0800 447 735www.teletracnavman.co.nz
21 Fitzherbert TerraceThorndon, Wellington0800 692 376www.civilcontractors.co.nz