Embed Size (px)
Citation preview

2020 Bremen Commercial PropertiesReassessment Report
Reassessment notices mailed: September 16, 20202020 South Triad Reassessment

Due to the significant economic impact of the COVID-19 outbreak and the natural disaster proclamation by the Governor of Illinois, the CCAO has incorporated COVID-19 Adjustments to property values.
Each property’s adjustment depended on its location and use type.
This report contains information about Initial Valuation Data as well as COVID-19 Adjustments (cap rate adjustments) used to produce the CCAO’s 2020 Market Values of commercial property values in Bremen.
The Assessor’s changes to South Suburb commercial reassessments in response to economic effects of COVID-19
Initial valuation data from earlier this year
Your property’s COVID-19 Adjustment
Your property’s CCAO2020 Market Value& =
Our analysts compiled data about sales, rents, vacancy rates, and
expense rates of properties similar to yours, in and around your
neighborhood.
We produced ranges of cap rates from this information.
COVID-19 has had different economic impacts on different property types and locations.
We implemented COVID-19 Adjustments by adjusting cap rates.
Larger COVID-19 effects led to larger COVID-19 Adjustments.
Based on: Initial Valuation Data and COVID-19 Adjustment.
Mailed values on reassessment notices have been adjusted for
effects of COVID19.
2

The CCAO is confident that the 2020 reassessment reflects an in-depth and professionally researched view of commercial/industrial properties.
Fair market values of commercial properties have risen in Bremen since 2017.
Market rents used in the 2020 reassessment were generally higher than rents used in the 2017 reassessment. This generates additional increases in market value (resulting in comparable increases in assessed value).The most powerful driver of increased values is an overall lower capitalization rate, driven by a low interest rate environment and increasing rental rates from 2017 through the beginning of 2020. For example, the range of cap rates used for apartments in 2017 was 11.80% to 13.35% and in 2020, the range was 5.5% to 9.5%. 2020 cap rates have been adjusted to encompass the economic events that have transpired since the onset of the COVID-19 pandemic.
The remainder of this report provides significant detail for each property class.
The CCAO is committed to transparency in all that we do and the detail provided here is a result of that commitment.
Bremen 2020 Reassessment: CommercialExecutive Summary
3

The CCAO’s duty is to produce a Fair Market Value for each property: what the property could sell for, between a willing buyer and a willing seller.
The assessment process does not attempt to perform appraisals on individual properties. Instead, mass appraisal performs valuations across groups of properties. The assessment process strives for uniformity of valuation across properties of similar size, location, and Investment Class (examples are on next page).
The assessment process looks to the market for current rent levels, rental rates, vacancy, and expense levels, rather than historical levels that an individual property might experience. The market levels are then adjusted for variations in size, location and other characteristics based upon property type.
Using the market rents and the average vacancy and expense levels, a net operating income is generated for each commercial property.
Assessment Methodology: Mass Appraisal for Fair Market Values
4

Assessment Methodology:Investment Class Categorization
Investment Class Category
Investment ClassDescription
Institutional • Highest Quality• Typically the focus of national and international investors• Typically lower cap rates
Regional • Typically distinguished from Institutional class by age, size, and condition• Larger and more complex than Neighborhood class• Frequently a transitional property• Typically the focus of regional and national investors
Neighborhood • Typically smaller properties• Typical commercial tenant is an owner user or local business• Typically the focus of only local investors• Typically higher cap rates
5

The Cook County Assessor’s Office (CCAO) used multiple professional sources of data used to determine market values and, by extension, assessed values, for commercial properties.
For years, the CCAO has used CoStar, a leading source of commercial property rents and sales information. In 2019 the CCAO added Trepp to its tools for research. Trepp reports on every loan that is financed through a commercial mortgage backed securities (CMBS). CMBS are a significant source of financing for commercial properties nationwide. For each loan in a CMBS transaction, Trepp reports on the appraisal the lender used to make the loan, reports the operating income the lender used to make the loan, and provides the operating results of the property since the loan has been made. This data helps to determine rents, expenses, and capitalization rates.
Capitalization rates were also utilized from recent sales as well as national surveys from PWC, RERC, and Realty Rates.
In addition to CoStar and Trepp, the CCAO uses expense information from expense ratio studies as well as reports from IREM and vacancy rates from leading firms including CBRE, Cushman & Wakefield, JLL, and others.
Finally, the CCAO requested other market participants, including local brokers and appraisers, to share insights on current market rents, occupancy levels, and capitalization rates (a.k.a. cap rates). CCAO analysts also researched the websites for many of the properties to determine rents and property characteristics.
Assessment Methodology:Data Sources
6
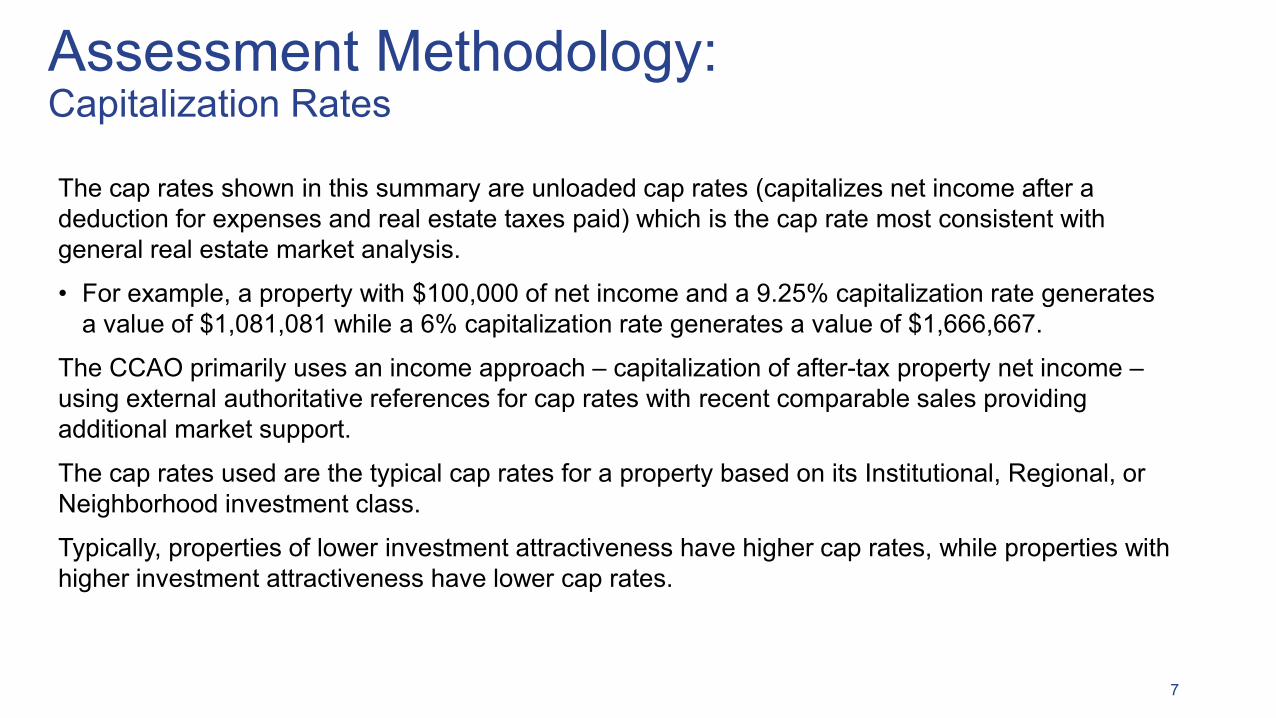
The cap rates shown in this summary are unloaded cap rates (capitalizes net income after a deduction for expenses and real estate taxes paid) which is the cap rate most consistent with general real estate market analysis.
• For example, a property with $100,000 of net income and a 9.25% capitalization rate generates a value of $1,081,081 while a 6% capitalization rate generates a value of $1,666,667.
The CCAO primarily uses an income approach – capitalization of after-tax property net income –using external authoritative references for cap rates with recent comparable sales providing additional market support.
The cap rates used are the typical cap rates for a property based on its Institutional, Regional, or Neighborhood investment class.
Typically, properties of lower investment attractiveness have higher cap rates, while properties with higher investment attractiveness have lower cap rates.
Assessment Methodology:Capitalization Rates
7

The COVID-19 pandemic is associated with changes to sales, incomes, expenses, and vacancies of properties throughout the county. The CCAO’steam of commercial valuations experts has done substantial research on the economic effects of COVID-19. Based on evidence about the economic effects of COVID-19 from sources including CBRE, JLL, the Appraisal Institute, local market participants, and others, some property types are affected more than others. To encompass the economic effects of COVID-19 in property valuations, the CCAO has developed COVID Adjustments for each property type. These adjustments were implemented as modifications to cap rates.For a more in-depth report of our methodology for COVID-19 Adjustments, please visit https://www.cookcountyassessor.com/covid19.
COVID-19 Adjustments
8

To produce our estimate of fair market value, the calculated net operating income (NOI) for each property is divided by the appropriate capitalization rate for a given property type.
• Property revenues are calculated based on market rent per square foot for commercial, retail, office, and industrial properties, and per unit for apartment properties.
• Our analysis also includes secondary income, such as parking income, reimbursements, escalations, etc.
• Property operating expenses are calculated based on typical expense ratios based on property type, class, and location.
• Vacancy rates are generalized for property type based upon location.
Assessment Methodology:Estimating Fair Market Value
9

Notes on broader trends seen in the 2020 Bremen Reassessment:
Overall, commercial and retail properties have seen stable growth over the last three years due to a low interest rate environment, increasing rental rates, and capitalization rate compression.
Property Type 2020 Properties
Apartments 320Offices 289
Commercial/Retail 912Industrial 265
2020 Bremen Commercial Reassessment
10

Each apartment was categorized in its Investment Class based on a combination of factors.
The following table describes the ranges of vacancy rates, expense rates, and cap rates that were used to calculate fair market values, based on our data sources and interviews with local market participants. COVID-19 Adjustments of 50 or 150 basis points were made to cap rates. These adjusted cap rates were used to produce our final estimates of property values (final column).
Apartments in Bremen
Investment Class # properties
Rent $/unit (range)
Vacancy rate
Expense ratio
(range)
Initial cap rate (range)
Adjusted cap rates (range)
CCAO FMV$/unit (range)
Institutional 9 $804 to $1,700 5% 40% to 45% 5.5% to 8% 5.5% to 9% $103,228 to $ 176,182
Regional 108 $450 to $1,800 5% 40% to 45% 5.5% to 8% 5.5% to 9% $44,323 to $160,242
Neighborhood 203 $608 to $1,614 5% 40% to 45% 5.5% to 8% 5.5% to 9% $42,323 to $112,445
Initial 2020 Valuations Data COVIDAdjustment
CCAO estimate of Fair Market Value
11

Offices include general and medical office types, under both modified and net lease. Each office was categorized in an Investment Class based on a combination of factors.
The following table describes the ranges of vacancy rates, expense rates, and cap rates that were used to calculate fair market values, based on our data sources and interviews with local market participants. COVID-19 Adjustments of 0 to 100 basis points were made to cap rates. These adjusted cap rates were used to produce our final estimates of property values (final column).
Offices in Bremen
Investment Class # properties
Rent $/SF (range)
Vacancy rate
Expense ratio
(range)
Initial cap rate (range)
Adjusted cap rates (range)
CCAO FMV$/bldg (range)
Institutional 0 N/A N/A N/A N/A N/A N/A
Regional 7 $21 11% 45% 8.5% 8.5% $852,721- $1,693,328
Neighborhood 282 $19 to $21 11% to 15% 45% 8.5% to 9% 8.5% to 10% $61,723 - $6,155,357
Initial 2020 Valuations Data COVIDAdjustment
CCAO estimate of Fair Market Value
12

Commercial/Retail includes car washes, restaurants, big box stores, regional malls, strip malls, shopping centers, supermarkets, and other similar retail use types. Each commercial/retail building was categorized in its Investment Class based on a combination of factors. The following table describes the ranges of vacancy rates, expense rates, and cap rates that were used to calculate fair market values, based on our data sources and interviews with local market participants.
COVID-19 Adjustments of 0 to 150 basis points were made to cap rates. These adjusted cap rates were used to produce our final estimates of property values (final column).
Commercial/Retail in Bremen
Investment Class # properties
Rent $/SF (range)
Vacancy rate
Expense ratio
(range)
Initial cap rate (range)
Adjusted cap rate (range)
CCAO FMV$/bldg (range)
Institutional 0 N/A N/A N/A N/A N/A N/A
Regional 123 $9 to $25 5% to 40% 15% to 70% 7% to 9% 7% to 11% $304,486- $27,403,737
Neighborhood 789 $6 to $23 5% to 42% 15% to 65% 7% to 10.5% 7% to 12% $45,608-$12,804,202
Initial 2020 Valuations Data COVIDAdjustment
CCAO estimate of Fair Market Value
13

Each industrial building was categorized in its Investment Class based on a combination of factors. The following table describes the ranges of vacancy rates, expense rates, and cap rates that were used to calculate fair market values, based on our data sources and interviews with local market participants (see Slide 5). There was a small number of Institutional-class industrial buildings. To avoid posting identifiable information about these properties, the Institutional and Regional classes are grouped here.
COVID-19 Adjustments of 50 to 100 basis points were made to cap rates. These adjusted cap rates were used to produce our final estimates of property values in $/sf (final column).
Industrial buildings in Bremen
Investment Class # properties
Rent $/sf (range)
Vacancy rate
Expense ratio
(range)
Initial cap rate (range)
Adjusted cap rate (range)
CCAO FMV$/sf (range)
Regional & Institutional 38 $2.40 - $14.64 5% 15% 7 to 8% 7 to 9% $18.88 - $224.54
Neighborhood 227 $1.31 - $13.31 5% 15% 9% 10% $12.80 - $244.79
Initial 2020 Valuations Data COVIDAdjustment
CCAO estimate of Fair Market Value
14

The CCAO is committed to transparency in all that we do and the detail provided here is a result of that commitment. To access more CCAO data and reports, please visit cookcountyassessor.com/community-data.
The CCAO is involved in a years-long effort to improve the quality of its assessments.
To this end, we are working to improve the accuracy, timeliness, and granularity of our data. To that end, in January 2020, we released a data submission portal for commercial property owners to voluntarily submit local, high-quality data about properties to analysts. Read more about the Real Property Income & Expense (RPIE) tool on the next page.
Conclusions & Community Data
15

RPIE (Real Property Income and Expense)Fair and accurate assessments depend on high-quality data.
But outside data sources may not capture all of the market rental rates, expenses, and vacancy rates specific to different property types and neighborhoods of our county. These data sources do not always convey how much rentable space is included in your buildings.
In 2020, property owners can now submit data about their properties directly to the CCAO using the Real Property Income & Expense tool (RPIE). This provides local data to our analysts to use during valuations. Data submission during assessments is voluntary, and any data submitted will contribute to the CCAO’s efforts for fair and accurate assessments for individual properties and other nearby properties like it.
16

RPIE (Real Property Income and Expense)http://RPIE.cookcountyassessor.comThe Real Property Income & Expense tool (RPIE) is an online portal developed by the CCAO specifically for owners of commercial properties.
All commercial property owners in the South Suburb townships were mailed one RPIEinvitation code per PIN. The invitation looks like this:
17

CCAO in 2020Fairness. Ethics. Transparency.CCAO resources and tools for owners of income-producing properties:cookcountyassessor.com/business-ownersCCAO’s RPIE:RPIE.cookcountyassessor.comCCAO data and reports: cookcountyassessor.com/community-dataRequest a meeting with CCAO Leadership:cookcountyassessor.com/contact-assessor-leadership
www.CookCountyAssessor.comFacebook: /CookCountyAssessorsOfficeTwitter: @AssessorCook
18

Residential includes all class 2. Commercial/non-residential includes classes 1, 3, 4, 5, 6, 7, and 9.
2019 are Assessor-certified final values. 2020 values are Assessor mailed values.
Appendix A: Total Assessed Value in Bremen
Sum of AV % share of total AV
Commercial /Non-residential $203,408,467 28.1%
Residential $521,561,349 71.9%
TOTAL $724,969,816
2019
Sum of AV % share of total AV
$277,402,847 34.3%
$532,340,429 65.7%
$809,743,276
2020
Bremen’s total assessed value is predominantly residential. There has been total growth in both residential and non-residential real estate sectors.
19
Change in AV
Change in % share
+$74.0m 6.2%
+$10.2m -6.2%
+$84.8m(+11.7%)
2019 2020
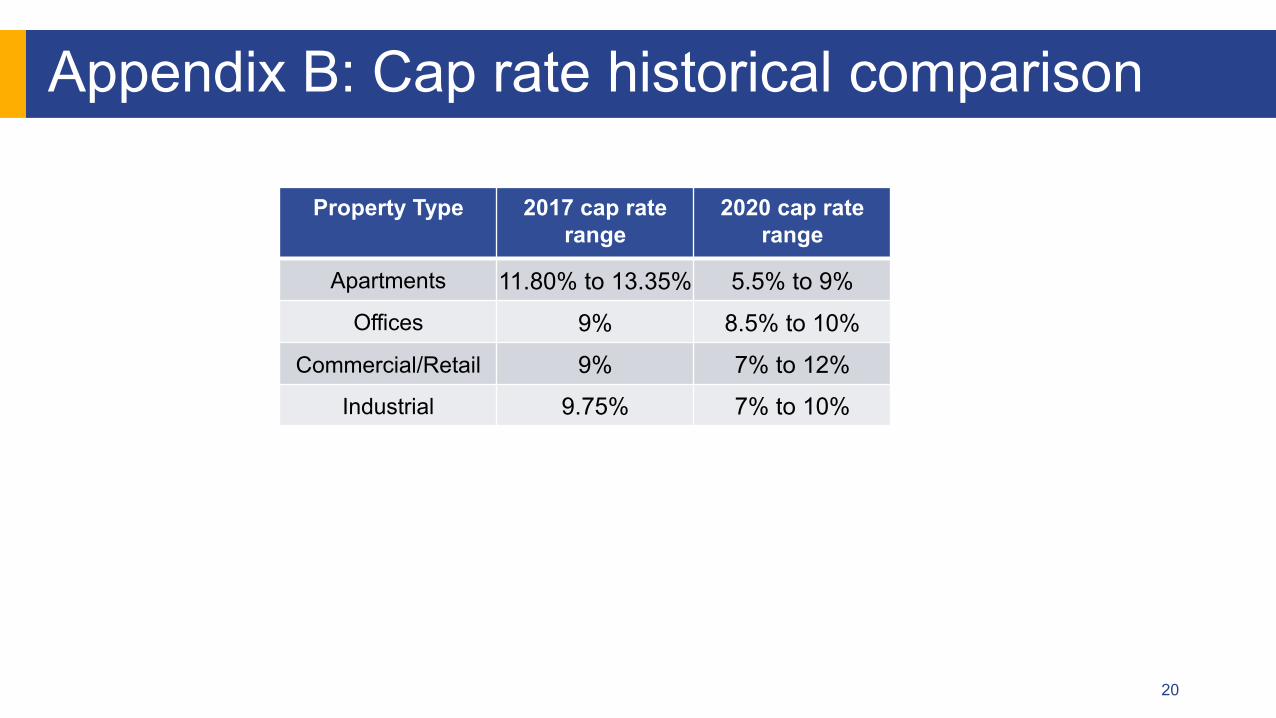
Property Type 2017 cap rate range
2020 cap rate range
Apartments 11.80% to 13.35% 5.5% to 9%Offices 9% 8.5% to 10%
Commercial/Retail 9% 7% to 12%
Industrial 9.75% 7% to 10%
Appendix B: Cap rate historical comparison
20
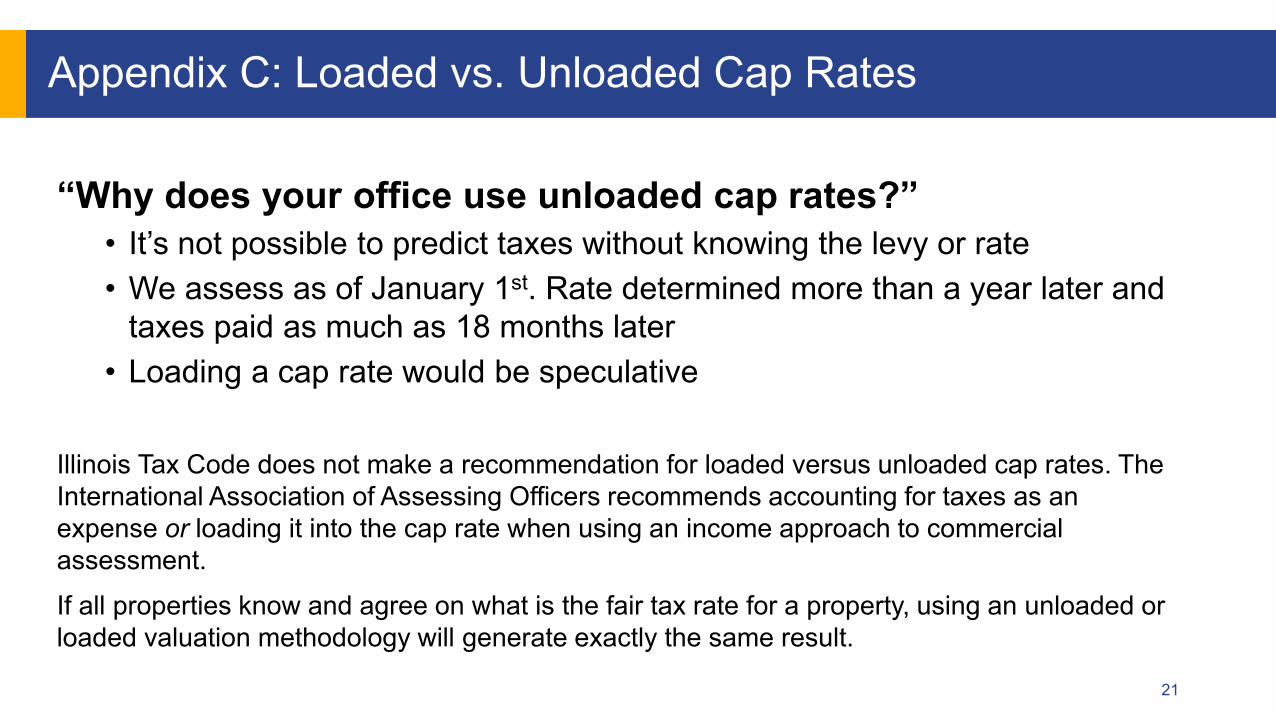
“Why does your office use unloaded cap rates?”• It’s not possible to predict taxes without knowing the levy or rate• We assess as of January 1st. Rate determined more than a year later and
taxes paid as much as 18 months later• Loading a cap rate would be speculative
Illinois Tax Code does not make a recommendation for loaded versus unloaded cap rates. The International Association of Assessing Officers recommends accounting for taxes as an expense or loading it into the cap rate when using an income approach to commercial assessment.If all properties know and agree on what is the fair tax rate for a property, using an unloaded or loaded valuation methodology will generate exactly the same result.
Appendix C: Loaded vs. Unloaded Cap Rates
21

The estimated Fair Market Value of a property is not what is taxed. The taxable value of a property depends on its Assessed Value (AV), which is a percentage of its Fair Market Value.
Cook County ordinance defines different assessment levels for different property types:• Residential and apartment properties are assessed at 10% of FMV
• Most non-incentive commercial properties are assessed at 25% of FMV.
Examples: for an apartment building with a FMV of $1,000,000, its AV = 10% of $1,000,000 = $100,000. For a non-incentive industrial building with a FMV of $1,000,000, its AV = 25% of $1,000,000 = $250,000.
Note: commercial property tax bills depend on the property’s local tax rate, its assessed value, and State Equalizer. These numbers are all printed on second-installment tax bills mailed by the Cook County Treasurer.
Appendix D: What is an Assessed Value?
22