Embed Size (px)
Citation preview

2020 Ratio Report

Larry Hogan, Governor · Boyd K. Rutherford, Lt. Governor · Michael L. Higgs, Jr., Director
The State Department of Assessments and Taxation (SDAT) is required to submit a report on assessment ratios in each county in accordance with Tax Property Article § 2-202(12) of the Annotated Code of Maryland.
In accordance with this requirement, SDAT is pleased to submit the 2020 Assessment Ratio Report. This report measures the quality of real property assessments in each of Maryland’s 24 jurisdictions.
The Department has adopted the national standards for measuring property assessment quality as outlined by the International Association of Assessing Officers. Those national standards, as well as the Department’s compliance with those standards, are outlined in this report. Statewide, the Department has met the IAAO standard for coefficient of dispersion, indicating an overall uniformity of assessments.
Our entire team is committed to provide the customers we serve with the highest level of courteous, prompt and efficient service. I hope the information contained in this Report is of value to you and your constituents. As always, I welcome and appreciate the opportunity to share more information on our policies and procedures with you to enhance the level of service provided to our customers.
Very truly yours,
Michael Higgs, Director

2020 ASSESSMENT RATIO REPORT
SECTION I – OVERVIEW
The State Department of Assessments and Taxation appraises real property in Maryland once every three years. Assessments are certified by the Department to local governments where they are converted into property tax bills. Properties are valued using the three approaches generally recognized by the appraisal profession: cost, sales comparison, and (when applicable) income.
Residential property characteristics include size, type and condition of a structure, type and quality of construction, and any new improvements or renovations. Commercial property aspects consist of size, type and condition of a structure, type and quality of construction, new improvements or renovations, current use of the property, types of tenants, and vacancy.
This year, the Department valued 769,668 properties, which required the use of mass appraisal techniques. While a fee appraiser is concerned with assessing one property at a time, an assessor is valuing whole neighborhoods through the use of special mass appraisal procedures. The assessor will review the data and calculate replacement costs for improvements/renovations, much like a fee appraiser. The assessor will then review the sales from the area. In Maryland, the county’s local assessment office receives a copy of all deeds and property sales prices when the deed transferring the property is recorded with the clerk of the court. In Baltimore City, the Department of Transportation/Property Location Section provides that data to the Department. In the assessor’s review and analysis of the sales, the assessor will develop land rates, depreciation tables, and sales analysis reports. After completing the analysis, the assessor applies the factors uniformly throughout the neighborhood to value all comparable properties consistently. Rental rates, vacancy and collection loss, expense ratios, and capitalization rates are analyzed and uniformly applied for comparable income-producing properties.
The Department’s work is reviewed by legislative auditors and often scrutinized by individual property owners. SDAT is continually striving for higher quality in assessment uniformity and consistency. Quality control begins with the individual assessor and the assessor’s immediate supervisor. As work is completed, each assessor’s supervisor reviews the analysis, makes recommendations, and approves the work. When the assessor completes the revaluation, the supervisor makes a random check using procedural and data editing to ensure valuation quality.
Measurement of quality is the assessed value/sale price ratio, which measures how closely the Department’s values compare to the actual sales prices. Although the average assessed value/sale price ratio indicates an average level of value, the marketplace is not perfect and there will always be properties that sell for more or less than can be anticipated. This may be due to factors such as buyers willing to pay extra for a unique property or declining values in a buyer’s market.

In mass appraisal and assessment ratio studies, SDAT is not only concerned with average assessed value/sale price levels (ratios) but also with the degree of spread (variation) from the typical ratio. The measurement of variation is the Coefficient of Dispersion (COD). The lower the COD, the more consistent the assessment level.
In the balance of this report, Section II will give a more detailed explanation of the statistical terms as applied to assessment administration and quality control. Section III explains the International Association of Assessing Officers’ Standard of Performance for ratio studies. Section IV gives an overview of statewide appraisal quality for the most recent valuation of triennial Group 2, performed for January 1, 2020.
SECTION II – RATIO STATISTICS
The purpose of this ratio study is to test the quality of the assessment product, which is examined from both an assessment level and assessment uniformity standpoint. The assessment level examines the degree to which the assessments are performed based upon the statutory requirement of full market value. Assessment uniformity measures the degree to which different properties are assessed at equal percentages of their market values. From our most recent valuation, the Department performs many ratio studies examining neighborhoods, types of structures, age of structures, etc.
Several measures of central tendency are used as performance gauges and are affected differently by outliers. A ratio of assessed value to sale price is calculated for each property, with the average ratio being the total of all ratios divided by the number of sales. The average (mean) ratio has a natural upward bias, indicating a higher level of assessment than has occurred. The median is the midpoint of any data listed from lowest to highest, and the median ratio is the point where half the ratios fall above and half the ratios fall below. The median ratio counts each ratio equally. It is less biased by extreme ratios (outliers) or by individual property values. The weighted ratio is the total of all assessed values divided by the sum of all sale prices. Since the weighted ratio counts each dollar equally, it is swayed by higher-priced properties.
In addition to the general level of assessments, the Department is also concerned with the relative spread or variation that individual ratios fall from the typical. This variability is measured in two ways: coefficient of dispersion and coefficient of variation. These statistics measure horizontal inequities, or the dispersion of ratios regardless of the value of the individual properties. The coefficient of dispersion is calculated by dividing the average absolute deviation by the median ratio. The average absolute deviation is calculated by subtracting the median ratio from each ratio, adding all the results while ignoring positive and negative signs, and dividing that result by the number of ratios. Acceptable coefficients of dispersion depend on property type but should typically be 20% or less. Coefficient of variation is calculated by dividing the standard deviation by the mean or average ratio and multiplying by 100. The variance is calculated by subtracting the mean from each ratio, squaring the differences, summing the squared differences, dividing by

the total number of ratios less one. The standard deviation is calculated by taking the square root of the variance. The coefficient of dispersion is the preferable measure of variance unless a sample is normally distributed. In a normal distribution situation, coefficient of variation is the preferred measure of variance.
Another statistical measure used to gauge assessment uniformity is the Price Related Differential (PRD). The PRD tests to see if higher or lower-valued properties are assessed at the same level, and is calculated by dividing the average ratio by the weighted ratio. This statistic measures vertical inequities. When low-value properties are valued at a higher percentage of their market value, the property taxes levied against these assessments would be considered regressive. Conversely, if high-value properties are valued at a higher rate of their market value, property taxes levied against these assessments would be regarded as progressive. Typically, PRDs have an upward bias because higher-priced properties are unique. PRDs should range between 0.98 and 1.03, except for very small samples. For example, a PRD of 1.03 indicates undervaluation of high priced properties, while a PRD of .98 shows an under valuation of low priced properties.
Other descriptive statistical methods that may be used to analyze the assessment product are histograms, frequency distributions, and scatter diagrams. For further information on statistics relating to assessments, please refer to the International Association of Assessing Officers’ publication “Improving Real Property Assessment”.
Table I is the Fiscal Year 2020 Real Property Base/Ratio by Subdivision with assessment ratios expressed relative to full value. Table II is a history of weighted assessment ratios converted to full value (100% levels) that allows for comparison between years by adjusting for statutory changes in the assessment level. Table III displays examples of the statistical calculations used in this report.
Tables IV and V show the residential and commercial 2020 Ratio Study data by jurisdiction at assessed full market value level for the area most recently assessed. Following the ratio study is Table VI of the report detailing issues of assessment and appraisal quality that are summarized in Section IV.
SECTION III – RATIO STUDY STANDARDS VALUES TO SALE PRICES
The International Association of Assessing Officers (IAAO) is a professional organization that provides educational programs, assessment administration standards, and research on appraisal and tax policy issues. IAAO has developed numerous standards and texts on appraisal and assessment administration. Additionally, the organization is a founding member of the national Appraisal Foundation, which developed the Uniform Standards of Professional Appraisal Practice (USPAP).
IAAO’s Standard on Ratio Studies was first published in September 1980 and was revised in April 2013. The Standard is an advisory and guides those performing ratio studies in the mass

appraisal field regarding the design, statistics, performance measures, and other issues related to such studies. The Maryland State Department of Assessments and Taxation uses the fundamental ratio statistical measures of the Standard and has adopted IAAO’s Assessment Ratio Performance Standard as the criteria to judge the performance of Maryland revaluations.
The IAAO Ratio Performance Standards are:
Ratio Study Uniformity Standards Indicating Acceptable General Quality*
General Property Class Jurisdiction Size /Profile /Market Activity Max COD
Residential improved (single family dwellings, condominiums, manuf.
Very large jurisdictions / densely populated / newer properties / active markets 5.0 to 10.0
Large to mid-sized jurisdictions / older & newer properties / less active markets 5.0 to 15.0
housing, 2-4 family units) Rural or small jurisdictions / older properties / depressed market areas 5.0 to 20.0 Income-producing properties (commercial, industrial, apartments,)
Very large jurisdictions / densely populated / newer properties / active markets 5.0 to 15.0
Large to mid-sized jurisdictions / older & newer properties / less active markets 5.0 to 20.0 Rural or small jurisdictions / older properties / depressed market areas 5.0 to 25.0
Residential vacant land Very large jurisdictions / rapid development / active markets 5.0 to 15.0 Large to mid-sized jurisdictions / slower development / less active markets 5.0 to 20.0 Rural or small jurisdictions/ little development / depressed markets 5.0 to 25.0
Other (non-agricultural) vacant land
Very large jurisdictions / rapid development / active markets 5.0 to 20.0 Large to mid-sized jurisdictions / slower development / less active markets 5.0 to 25.0 Rural or small jurisdictions/ little development / depressed markets 5.0 to 30.0
These types of property are provided for general guidance only and may not represent jurisdictional requirements. *The COD performance recommendations are based upon representative and adequate sample sizes, with outliers trimmed and a 95% level of confidence. *Appraisal level recommendation for each type of property shown should be between 0.90 and 1.10. *PRD's for each type of property should be between 0.98 and 1.03 to demonstrate vertical equity. PRD standards are not absolute and may be less meaningful when samples are small or when wide variation in prices exists. In such cases, statistical tests of vertical equity hypotheses should be substituted. *CODs lower than 5.0 may indicate sales chasing or non-representative samples.
Source: Standard on Ratio Studies; International Association of Assessing Officers; Kansas City, MO; April 2013; p. 34.
Ratio studies may be performed for various reasons, including appraisal accuracy and assessment equity studies, to judge the need for management of a reappraisal, to identify problems with appraisal procedures, to assist in market analysis, and to adjust appraised values. Many ratio study design issues must be considered depending on the purpose of the ratio study.
This study considers unadjusted sales price data six months before and six months after the date of finality (date of valuation, January 1st) for which assessments have become active so that an unbiased estimate of assessment performance can be obtained. Sales that are arms-length
transactions between willing and informed buyers and sellers are used in this study. Maryland’s ratio performance conforms to the IAAO Standard.
While several measures of central tendency are calculated (average, median, and weighted ratios), the median is less affected by extreme ratios. The IAAO observes in its Standard that the median is generally the preferred measure of central tendency for monitoring appraisal performance. For this reason, median ratios are used in this study to measure compliance with IAAO standards.
As a proxy for time adjustments, this report uses sales from six months before the date of finality to six months after the date of finality. Under normal circumstances, with steadily changing property values, these sales will balance. In unusual cases, when property values are rapidly changing, this will affect the ratio statistics.
On average, the residential values in this group increased by 7.3%, and commercial values increased 13.5%, with an overall average increase of 8.9% statewide.
Property value changes varied by region in the state since the last triennial revaluation in January 2017.
Statewide, the Department met the IAAO standard for coefficient of dispersion indicating an overall uniformity of assessments.
Commercial properties are generally less similar than residential properties. Many commercial properties are income-producing and are valued using the income approach. Most commercial uses are cyclical. Various segments of the commercial real estate market may be ascending in value as a class, while others may be declining in market popularity. Commercial and industrial properties are very unique which is why measures of central tendency tend to vary more widely than with residential properties.
The number of commercial properties is small compared to the number of residential properties. In several jurisdictions, the number of commercial properties sold is small enough that the statistical measures are prone to bias. Allegany, Calvert, Caroline, Cecil, Charles, Dorchester, Garrett, Kent, Queen Anne’s, St. Mary’s, Somerset, and Talbot Counties all had fewer than ten arms-length commercial transfers for Group 2. In those jurisdictions, individual statistical measures would be unreliable due to sample size.
The number of commercial sales increased from 433 statewide in the 2019 Ratio Report to 552 statewide in the 2020 Ratio Report.
SECTION IV – STATEWIDE COMPARISON OF DEPARTMENT’S VALUES TO SALE PRICE
Quality is the degree of excellence of a product or service as determined by the extent to which they measure up to specific standards. In this case, a measure of quality is the ratio study measuring whether the assessor appraised properties uniformly at market value. The ratio study conducted in this report is based upon sales data occurring after the time period of sales used by the assessor in the group of properties being reassessed.
This ratio study is a cross-check by Department management to ensure the quality of the mass appraisal work product. The ratio statistics for each county in Table IV was conducted on 26,752 improved residential property sales from July 1, 2019, to June 30, 2020, and compares the Department’s valuations to sale prices.
The frequency distribution in Table IV and statistics present a statewide ratio analysis of improved residential property sales from July 1, 2019, to June 30, 2020, comparing the Department’s values to sales prices. The measures of central tendency indicate that properties are valued at approximately 93% of the sale price and, on average, all other properties have similar ratios as indicated by the 8.17 Coefficient of Dispersion. Additionally, higher valued properties are assessed at a similar level to lower-valued properties, as indicated by a Price Related Differential statistic of 1.00. A price-related differential of 1.00 indicates vertical uniformity across all strata of property values.
The analysis from Table IV and the following descriptive statistics indicates that values determined by assessors for the most recent triennial Group 2 valuation attained a uniform and appropriate level of value. At the time of valuation, the assessments were close to the sale price.
In summary, the data shows that properties throughout the State are assessed uniformly as required by law.

Table I Fiscal Year 2020 Real Property Tax Base/Ratio by Jurisdiction
This table shows the taxable assessable base and ratios of real property used for different purposes. Ratios shown are median ratios of arms-length sales of properties in Group 2 that were sold between July 1, 2019 and June 30, 2020, compared with the Department's January 1, 2020 assessed value. In jurisdictions with fewer than 10 commercial sales, the statewide ratio is used (see Table V). A ratio of 100% is used for property not assessed on market value.
Number of Properties
Residential Commercial Agricultural Use Value Total Base Weighted Ratio Base Ratio Base Ratio Base Ratio Base Ratio
Allegany 38,362 2,546,107,983 95.2% 1,008,194,410 95.5% 134,353,904 95.2% 3,136,433 100.0% 3,691,792,730 95.2% Anne Arundel 214,635 71,684,009,988 94.0% 22,743,065,617 90.7% 572,257,533 94.0% 20,424,000 100.0% 95,019,757,138 93.2% Baltimore City 220,921 26,193,203,899 94.4% 20,445,559,262 95.7% 0 94.4% 0 100.0% 46,638,763,161 95.0% Baltimore 284,753 63,457,583,366 92.4% 25,851,436,722 95.3% 1,119,836,445 92.4% 67,135,366 100.0% 90,495,991,899 93.2% Calvert 42,024 10,798,203,790 94.9% 1,396,513,633 95.5% 286,251,496 94.9% 1,600 100.0% 12,480,970,519 95.0% Caroline 15,972 1,906,756,683 96.2% 411,515,830 95.5% 394,121,786 96.2% 505,100 100.0% 2,712,899,399 96.1% Carroll 66,307 17,038,768,173 94.1% 2,871,730,517 96.6% 920,588,272 94.1% 4,209,367 100.0% 20,835,296,329 94.4% Cecil 46,253 7,595,372,623 95.8% 2,510,769,760 95.5% 570,640,944 95.8% 1,943,000 100.0% 10,678,726,327 95.8% Charles 66,137 15,075,457,118 94.6% 3,473,082,254 95.5% 462,283,130 94.6% 18,787,400 100.0% 19,029,609,902 94.8% Dorchester 22,098 2,128,324,999 87.5% 533,721,630 95.5% 276,078,862 87.5% 3,220,500 100.0% 2,941,345,991 88.9% Frederick 100,664 25,381,435,234 93.2% 6,585,514,671 93.3% 1,389,280,728 93.2% 17,737,134 100.0% 33,373,967,767 93.2% Garrett 28,791 3,742,662,171 94.8% 483,330,498 95.5% 242,700,716 94.8% 0 100.0% 4,468,693,385 94.9% Harford 97,720 22,453,042,211 94.1% 6,092,942,039 89.6% 787,941,042 94.1% 18,485,334 100.0% 29,352,410,626 93.1% Howard 106,111 41,645,669,450 94.5% 13,161,298,929 84.3% 419,090,968 94.5% 35,557,835 100.0% 55,261,617,182 91.9% Kent 12,965 2,169,539,161 94.6% 418,948,366 95.5% 399,646,637 94.6% 2,792,700 100.0% 2,990,926,864 94.8% Montgomery 333,407 151,433,868,401 95.1% 47,735,260,335 97.9% 655,075,995 95.1% 107,907,401 100.0% 199,932,112,132 95.8% Prince George's 286,244 72,662,081,831 94.0% 29,910,071,703 96.3% 322,345,353 94.0% 18,795,633 100.0% 102,913,294,520 94.6% Queen Anne's 25,635 6,765,847,804 94.0% 1,051,794,435 95.5% 809,851,291 94.0% 8,148,400 100.0% 8,635,641,930 94.2% St. Mary's 48,550 10,355,328,958 94.7% 1,841,756,919 95.5% 671,166,006 94.7% 6,580,800 100.0% 12,874,832,683 94.8% Somerset 15,868 957,746,483 94.8% 282,916,070 95.5% 150,333,942 94.8% 857,500 100.0% 1,391,853,995 94.9% Talbot 20,841 6,623,395,723 95.1% 1,113,817,927 95.5% 901,676,641 95.1% 7,309,867 100.0% 8,646,200,158 95.2% Washington 56,728 8,516,841,036 91.6% 4,018,059,440 94.1% 602,750,139 91.6% 8,388,367 100.0% 13,146,038,982 92.4% Wicomico 45,034 4,477,739,313 89.8% 1,762,743,351 96.4% 306,952,731 89.8% 3,199,067 100.0% 6,550,634,462 91.5% Worcester 64,336 13,149,074,969 93.3% 2,843,873,350 96.7% 295,801,038 93.3% 17,339,900 100.0% 16,306,089,257 93.9% Statewide 2,260,356 588,758,061,367 94.1% 198,547,917,668 95.5% 12,691,025,599 94.1% 372,462,704 100.0% 800,369,467,338 94.4%

TABLE II
Assessment Levels 2006 2007 2008 2009 2010 2011 2012 2013 2014 2015 2016 2017 2018 2019 2020
Allegany 95.2 95.0 93.0 89.6 90.1 90.0 91.8 94.5% 94.2% 95.2% 94.0% 95.6% 96.4% 95.4% 95.2% Anne Arundel 85.6 96.0 95.2 95.1 90.3 89.7 90.2 91.2% 90.7% 93.8% 95.2% 94.3% 96.3% 96.9% 93.2% Baltimore City 85.2 92.0 94.7 91.6 91.4 91.3 95.8 94.8% 93.1% 91.0% 92.2% 91.7% 94.7% 95.7% 95.0% Baltimore 83.5 94.0 94.6 94.8 91.5 93.6 93.0 87.6% 92.3% 96.8% 94.8% 94.6% 92.3% 92.3% 93.2% Calvert 85.6 95.0 95.4 96.0 94.0 91.7 90.6 90.5% 91.1% 91.3% 91.5% 93.3% 94.2% 96.0% 95.0% Caroline 88.9 95.0 95.3 92.8 95.7 97.2 98.1 94.4% 95.6% 95.4% 94.8% 95.2% 92.4% 94.5% 96.1% Carroll 89.7 96.0 97.1 94.0 89.5 93.2 90.5 91.5% 92.9% 91.3% 92.6% 93.7% 94.9% 94.8% 94.4% Cecil 91.0 94.0 94.9 94.9 91.6 87.2 91.2 94.8% 92.4% 93.2% 92.6% 94.2% 96.0% 95.9% 95.8% Charles 88.0 94.0 96.4 93.4 92.1 92.2 92.2 91.9% 92.3% 94.5% 93.1% 94.1% 94.3% 93.5% 94.8% Dorchester 79.3 91.0 96.9 90.2 95.3 91.2 90.8 98.1% 91.8% 93.1% 93.7% 95.5% 96.1% 94.7% 88.9% Frederick 90.9 96.0 98.2 95.6 89.2 93.0 89.2 90.4% 92.1% 90.9% 92.3% 93.2% 94.1% 95.2% 93.2% Garrett 91.8 95.0 92.7 91.0 89.9 98.1 90.6 90.2% 94.9% 94.7% 93.3% 96.1% 94.9% 95.3% 94.9% Harford 85.0 93.0 96.1 92.8 91.6 91.2 94.2 92.8% 92.0% 91.7% 91.2% 94.9% 93.1% 93.6% 93.1% Howard 92.5 97.0 96.5 93.1 88.2 89.6 91.3 89.8% 92.6% 91.3% 94.2% 94.4% 94.0% 95.3% 91.9% Kent 83.9 94.0 95.2 91.0 90.8 94.8 98.5 96.9% 96.4% 91.4% 91.7% 97.1% 96.1% 95.7% 94.8% Montgomery 95.5 98.0 96.4 95.4 88.4 92.9 92.9 91.6% 92.4% 96.6% 93.6% 93.1% 93.9% 96.2% 95.8% Prince George's 85.1 91.0 98.2 96.4 95.3 92.8 92.9 90.7% 91.8% 93.7% 94.3% 92.5% 93.2% 94.4% 94.6% Queen Anne's 87.9 96.0 96.4 91.1 90.6 93.6 92.2 95.2% 93.8% 96.4% 98.4% 95.8% 96.7% 96.7% 94.2% St. Mary's 88.2 95.0 97.9 96.6 93.3 94.5 94.5 95.3% 94.1% 92.7% 93.2% 94.1% 93.4% 92.9% 94.8% Somerset 86.2 86.0 92.5 89.3 85.0 91.5 87.9 96.1% 93.7% 93.3% 94.2% 94.9% 96.7% 92.6% 94.9% Talbot 88.7 96.0 98.0 93.9 93.8 97.7 96.8 93.8% 94.5% 92.8% 96.6% 96.6% 98.0% 94.7% 95.2% Washington 90.0 97.0 97.2 91.8 92.9 95.4 90.7 90.8% 93.7% 93.1% 93.3% 92.3% 92.7% 92.7% 92.4% Wicomico 82.9 89.0 90.3 88.9 89.1 90.6 89.4 91.0% 90.4% 87.8% 91.5% 93.3% 92.5% 92.7% 91.5% Worcester 89.2 97.0 93.9 93.9 92.2 89.5 91.4 89.7% 91.5% 90.5% 92.5% 94.6% 92.4% 94.8% 93.9% Statewide 89.7 96.0 95.7 94.0 91.0 92.0 91.7 91.3% 92.3% 93.9% 93.2% 93.9% 94.3% 94.9% 94.4%

TABLE III Illustrated Ratio Study Statistics
(1.) (2.) (3.) (4.) (5.) Property Sale Assessed Ratio Absolute Number Price Value A/S % Deviation
from Median
1 28,000 22,400 80% 20% 2 22,000 19,250 88% 12% 3 63,500 55,575 88% 12% 4 55,900 51,700 92% 7% 5 20,000 19,000 95% 5% 6 21,000 20,475 98% 2% 7 80,000 80,000 100% 0% 8 40,000 40,000 100% 0% 9 33,000 33,300 101% 1% 10 45,000 46,125 103% 3% 11 24,000 25,200 105% 5% 12 39,000 41,925 108% 8% 13 37,000 41,625 113% 13% 14 40,300 45,800 114% 14% 15 51,000 59,925 118% 18%
TOTAL 599,700 602,300 1500% 120%
Average Ratio = Total of Ratios (4.) ÷ Number of Sales (1.) 1500% ÷ 15 = 100%
Weighted Ratio = Total of Assessed Values (3.) ÷ Total of Sale Prices (2.) 602,300 ÷ 599,700 = 100%
Average Deviation = Total Deviations (5.) ÷ Number of Sales (1.) 120% ÷ 15 = 8%
Median Ratio = Middle Value of Data Array = 100% 100%
(i.e. property #8)
Coefficient of = Average Deviation (5.) ÷ Median Ratio (4.) Dispersion 8% ÷ 100% = 7.98
Price Related = Average Ratio (4.) ÷ Weighted Ratio Differential 100% ÷ 100% = 1.00

Table IV 2020 Residential Ratio Study
This table shows arms-length sales of improved residential and condominium properties in Group 2 from July 1, 2019 through June 30, 2020. Ratios compare the Department's January 1, 2020 value to the actual sale price.
Number of Sales
Average Ratio
Median Ratio
Weighted Ratio
Average Deviation
Coefficient of Dispersion
Price Related Differential
Standard Deviation
Coefficient of Variation
Median Sale Price
Allegany 167 94.7% 95.2% 94.5% 5.3% 5.55 1.00 0.07 7.66 $132,500 Anne Arundel 4,488 94.4% 94.0% 94.1% 7.0% 7.40 1.00 0.10 10.82 $355,000 Baltimore City 2,224 93.1% 94.4% 90.9% 15.6% 16.56 1.02 0.22 23.65 $156,768 Baltimore 2,821 90.9% 92.4% 90.7% 8.2% 8.83 1.00 0.12 12.69 $330,602 Calvert 392 95.2% 94.9% 95.5% 4.6% 4.87 1.00 0.06 6.40 $400,000 Caroline 148 95.4% 96.2% 94.8% 7.3% 7.61 1.01 0.11 11.93 $239,500 Carroll 616 91.7% 94.1% 91.9% 7.2% 7.68 1.00 0.09 10.13 $335,000 Cecil 371 94.7% 95.8% 93.3% 7.9% 8.28 1.01 0.13 13.67 $240,000 Charles 675 93.5% 94.6% 93.8% 5.6% 5.94 1.00 0.08 8.41 $360,000 Dorchester 171 88.6% 87.5% 88.0% 13.9% 15.88 1.01 0.18 20.47 $180,000 Frederick 1,955 92.4% 93.2% 92.2% 5.8% 6.18 1.00 0.08 8.29 $300,000 Garrett 238 94.4% 94.8% 92.0% 6.9% 7.25 1.03 0.10 10.33 $297,500 Harford 1,423 92.7% 94.1% 92.7% 5.4% 5.77 1.00 0.08 8.22 $348,000 Howard 1,279 94.6% 94.5% 94.7% 6.0% 6.40 1.00 0.08 8.89 $533,400 Kent 107 91.3% 94.6% 91.9% 7.9% 8.35 0.99 0.11 11.97 $272,500 Montgomery 3,267 94.0% 95.1% 93.5% 7.5% 7.86 1.01 0.11 11.34 $500,000 Prince George's 4,144 93.7% 94.0% 93.4% 6.6% 6.98 1.00 0.10 10.33 $380,000 Queen Anne's 142 92.5% 94.0% 92.3% 6.7% 7.11 1.00 0.09 9.81 $280,500 St. Mary's 666 93.9% 94.7% 93.8% 5.3% 5.62 1.00 0.07 7.72 $365,000 Somerset 36 93.2% 94.8% 90.4% 10.6% 11.15 1.03 0.17 17.99 $120,000 Talbot 154 94.3% 95.1% 93.5% 9.1% 9.58 1.01 0.14 14.33 $420,000 Washington 738 90.4% 91.6% 90.1% 8.5% 9.25 1.00 0.11 12.48 $179,950 Wicomico 334 88.7% 89.8% 89.0% 9.6% 10.69 1.00 0.13 14.39 $199,400 Worcester 196 90.9% 93.3% 89.5% 6.4% 6.85 1.02 0.09 10.02 $232,000 Statewide 26,752 93.2% 94.1% 93.1% 7.7% 8.17 1.00 0.12 12.38 $345,000

TABLE IV-B Statewide Residential Ratio Study Frequency Statistics
Average Ratio
Total of Ratios = 24,934.39 = 93.2% Number of Sales 26,752
Total Assessed Values Total Sales Prices
=
Weighted Ratio
9,866,893,800 10,602,582,431
= 93.1%
Total Deviations Number of Sales
=
Average Deviation
2,055 26,752
= 7.7%
Coefficient of Dispersion
Average Absolute Deviation = 7.7% = 8.17 Median Ratio 94.1%
Price Related Differential
Average Ratio = 93.2% = 1.00 Weighted Ratio 93.1%
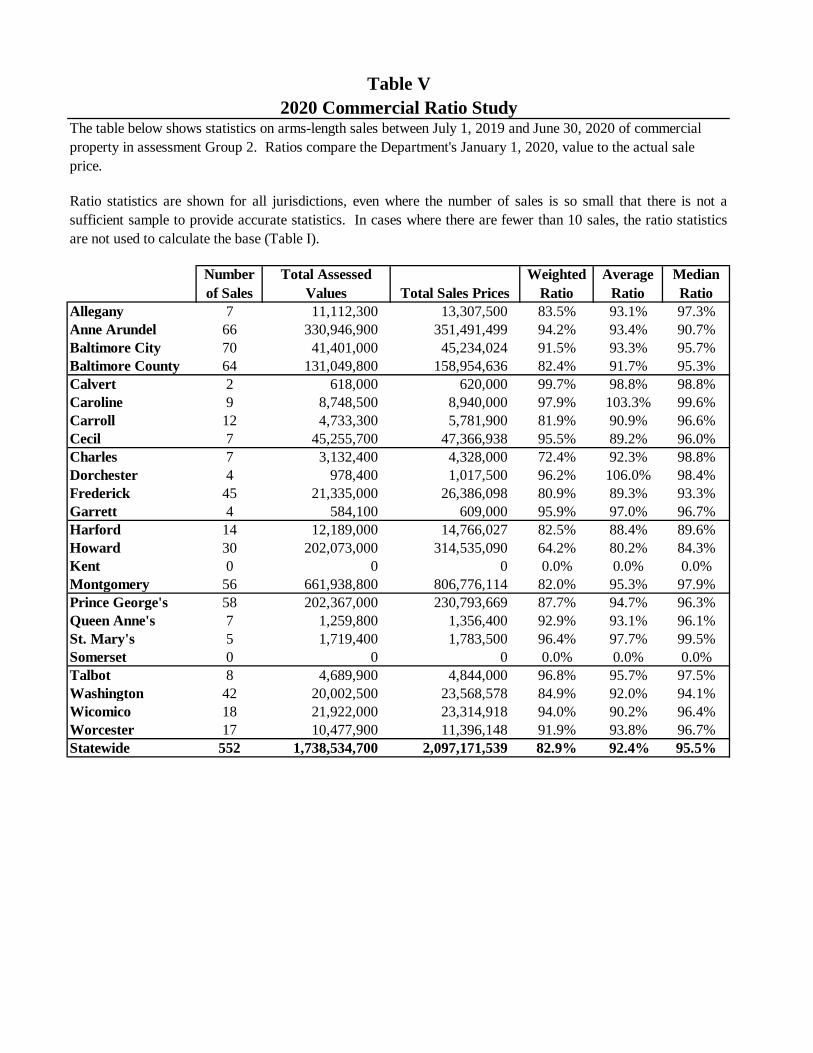
Table V 2020 Commercial Ratio Study
The table below shows statistics on arms-length sales between July 1, 2019 and June 30, 2020 of commercial property in assessment Group 2. Ratios compare the Department's January 1, 2020, value to the actual sale price.
Ratio statistics are shown for all jurisdictions, even where the number of sales is so small that there is not a sufficient sample to provide accurate statistics. In cases where there are fewer than 10 sales, the ratio statistics are not used to calculate the base (Table I).
Number of Sales
Total Assessed Values Total Sales Prices
Weighted Ratio
Average Ratio
Median Ratio
Allegany Anne Arundel Baltimore City Baltimore County
7 66 70 64
11,112,300 330,946,900
41,401,000 131,049,800
13,307,500 351,491,499
45,234,024 158,954,636
83.5% 94.2% 91.5% 82.4%
93.1% 93.4% 93.3% 91.7%
97.3% 90.7% 95.7% 95.3%
Calvert Caroline Carroll Cecil
2 9
12 7
618,000 8,748,500 4,733,300
45,255,700
620,000 8,940,000 5,781,900
47,366,938
99.7% 97.9% 81.9% 95.5%
98.8% 103.3% 90.9% 89.2%
98.8% 99.6% 96.6% 96.0%
Charles Dorchester Frederick Garrett
7 4
45 4
3,132,400 978,400
21,335,000 584,100
4,328,000 1,017,500
26,386,098 609,000
72.4% 96.2% 80.9% 95.9%
92.3% 106.0% 89.3% 97.0%
98.8% 98.4% 93.3% 96.7%
Harford Howard Kent Montgomery
14 30 0
56
12,189,000 202,073,000
0 661,938,800
14,766,027 314,535,090
0 806,776,114
82.5% 64.2% 0.0%
82.0%
88.4% 80.2% 0.0% 95.3%
89.6% 84.3% 0.0%
97.9% Prince George's Queen Anne's St. Mary's Somerset
58 7 5 0
202,367,000 1,259,800 1,719,400
0
230,793,669 1,356,400 1,783,500
0
87.7% 92.9% 96.4% 0.0%
94.7% 93.1% 97.7% 0.0%
96.3% 96.1% 99.5% 0.0%
Talbot Washington Wicomico Worcester
8 42 18 17
4,689,900 20,002,500 21,922,000 10,477,900
4,844,000 23,568,578 23,314,918 11,396,148
96.8% 84.9% 94.0% 91.9%
95.7% 92.0% 90.2% 93.8%
97.5% 94.1% 96.4% 96.7%
Statewide 552 1,738,534,700 2,097,171,539 82.9% 92.4% 95.5%
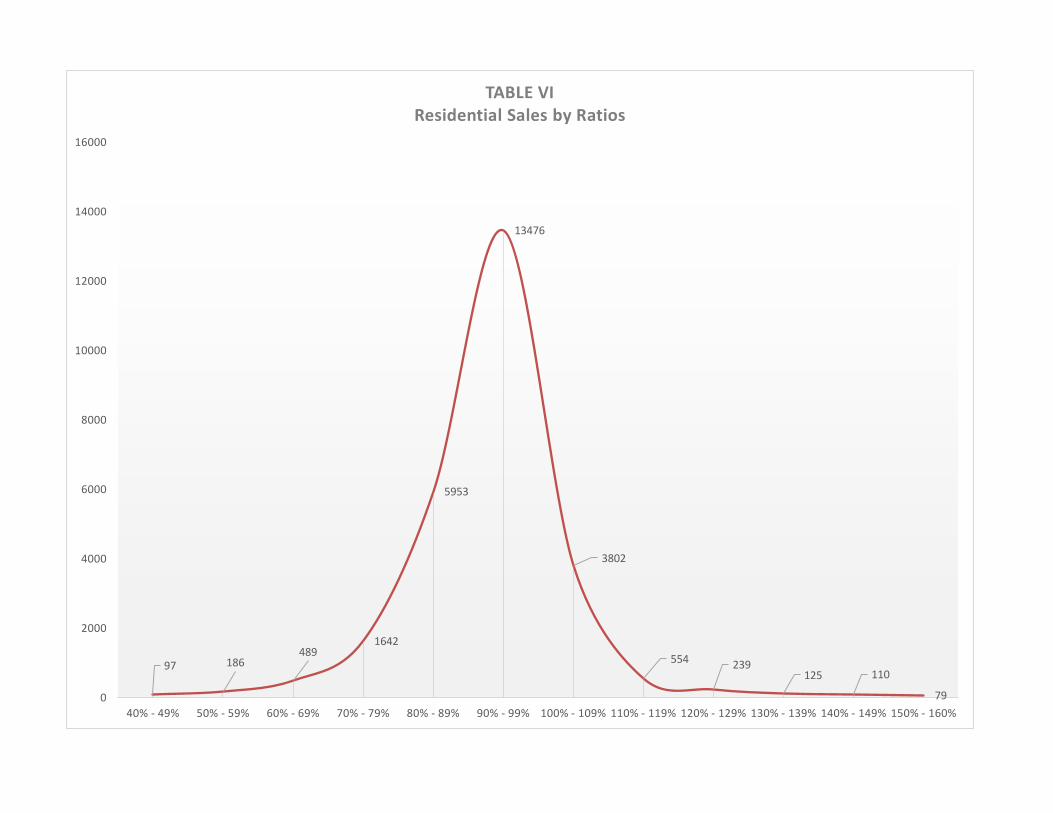
TABLE VI
Residential Sales by Ratios 16000
14000 13476
12000
10000
8000
6000 5953
4000 3802
2000
0
97
40% - 49%
186
50% - 59%
489
60% - 69%
1642
70% - 79% 80% - 89% 90% - 99%
554 239 125 110
79 100% - 109% 110% - 119% 120% - 129% 130% - 139% 140% - 149% 150% - 160%

300 West Preston St. Room 605 Baltimore, MD 21201