Embed Size (px)
Citation preview


IntroductorySectionBoardofTrustees.................................................................................................................................... 3ProfessionalAwards................................................................................................................................ 4LetterofTransmittal................................................................................................................................ 6OrganizationChart................................................................................................................................... 10StaffandAdvisors.................................................................................................................................... 11Membership............................................................................................................................................ 12
FinancialSectionIndependentAuditor'sReport................................................................................................................. 17Management'sDiscussionandAnalysis.................................................................................................. 21BasicFinancialStatementsExhibitI-StatementofFiduciaryNetPosition..................................................................................... 32ExhibitII-StatementofChangesinFiduciaryNetPosition.................................................................. 36ExhibitIII-StatementofNetPosition-ProprietaryFunds................................................................... 40ExhibitIV-StatementofRevenues,ExpensesandChangesinNetPosition-ProprietaryFunds........ 41ExhibitV-StatementofCashFlows-ProprietaryFunds...................................................................... 42NotestotheFinancialStatements........................................................................................................ 45
RequiredSupplementaryInformationPensionTrustFundScheduleofChangesintheEmployers'NetPensionLiabilityandRelatedRatios................................ 88ScheduleoftheNetPensionLiability.................................................................................................... 90ScheduleofEmployerandNon-EmployerContributingEntityActuariallyDeterminedContributions 91ScheduleofInvestmentReturns........................................................................................................... 92ScheduleofEmployer's(TRS)ProportionateShareofERS'NetOPEBLiability..................................... 92ScheduleofEmployer's(TRS)ContributionstoERS'OPEBPlan............................................................ 92TRS-CareScheduleofChangesinEmployers'NetOPEBLiabilityandRelatedRatios.......................................... 93ScheduleoftheNetOPEBLiability........................................................................................................ 94
OtherSupplementaryInformationSchedule1-ScheduleofAdministrativeandInvestingActivityExpenses........................................... 96Schedule2-ScheduleofProfessionalandConsultingFees................................................................. 100
InvestmentSectionInvestmentOverview.............................................................................................................................. 104ReportonInvestmentActivitiesTable1:AssetAllocation........................................................................................................................ 109Table2:InvestmentSummary............................................................................................................... 110Table3:InvestmentAllocations............................................................................................................ 111Table4:LargestFixedIncomeInvestments........................................................................................... 112Table5:LargestEquityInvestments...................................................................................................... 112Table6:PolicyBenchmarks................................................................................................................... 113Table7:InvestmentPerformance:Time-WeightedReturns................................................................. 114Table8:InvestmentManagerFees........................................................................................................ 116Table9:BrokerCommissions................................................................................................................. 117
TableofContents

ActuarialSectionPensionTrustFundActuary'sCertificationLetter................................................................................................................ 122Table1:ActuarialPresentValueofFutureBenefits.............................................................................. 128Table2:SummaryofCostItems............................................................................................................ 128
FinancingObjectiveandFundingPolicy................................................................................................ 129
ActuarialMethodsandAssumptions................................................................................................... 129
Table3:PostRetirementMortalityProjections................................................................................... 130Table4:AssumedRetirementAge....................................................................................................... 131Table5:ProbabilityofDecrementDuetoDisability............................................................................ 131Table6:ProbabilityofDecrementDuetoDeath.................................................................................. 131Table7:ProbabilityofDecrementDuetoTermination........................................................................ 131Table8:RatesofSalaryIncreaseDuetoMeritandPromotion............................................................ 132Table9:ActiveMemberPayrollValuationData.................................................................................. 133
Table10:Retirees,Beneficiaries,andDisabledParticipantsAddedtoandRemovedfromMembership......................................................................................................................................... 133Table11:AnalysisofFinancialExperience............................................................................................ 134Table12:SolvencyTest......................................................................................................................... 134Table13:ScheduleofFundingProgress............................................................................................... 135
TRS-CareActuary'sCertificationLetter................................................................................................................ 138
FundingObjectiveandFundingPolicy.................................................................................................. 140Table1:RetireesandBeneficiariesAddedtoandRemovedfromMembership................................. 140
StatisticalSectionStatisticalSectionOverview.................................................................................................................... 143FinancialTrendsInformationChangesinFiduciaryNetPosition-PensionTrustFund....................................................................... 144ChangesinFiduciaryNetPosition-TRS-Care........................................................................................ 146Revenues,Expenses,andChangesinNetPosition-TRS-ActiveCare.................................................... 148BenefitandRefundDeductionsfromNetPositionbyType.................................................................. 150
OperatingInformationAverageBenefitPayments-PensionTrustFund.................................................................................. 152AverageMonthlyBenefits-PensionTrustFund................................................................................... 153AverageBenefitPayments-TRS-CareandTRS-ActiveCare.................................................................. 154RetiredMembersbyTypeofBenefit-PensionTrustFund................................................................. 155HealthBenefitPaymentsbyRange-TRS-CareandTRS-ActiveCare..................................................... 156PrincipalParticipatingEmployers-PensionTrustFundandTRS-Care.................................................. 157
ListofParticipatingEmployers................................................................................................................ 158
BenefitsSectionChangesintheLaw.................................................................................................................................. 170SummaryofBenefits............................................................................................................................... 172
TableofContents

Thispageisintentionallyleftblank.


Thispageisintentionallyleftblank.
2 TeacherRetirementSystemofTexas2020ComprehensiveAnnualFinancialReport

BoardofTrustees
3 TeacherRetirementSystemofTexas2020ComprehensiveAnnualFinancialReport

ProfessionalAwards
4 TeacherRetirementSystemofTexas2020ComprehensiveAnnualFinancialReport

ProfessionalAwards
5 TeacherRetirementSystemofTexas2020ComprehensiveAnnualFinancialReport
Brian K. GuthrieExecutive Director
1.800.223.8778 1000 Red River Streetwww.trs.texas.gov Austin, Texas 78701-2698
November20,2020
HonorableGregAbbott,GovernorHonorableGlennHegar,TexasComptrollerJerryMcGinty,LegislativeBudgetBoardLisaCollier,FirstAssistantStateAuditorTheBoardofTrusteesandMembersoftheTeacherRetirementSystem
LadiesandGentlemen,
Onbehalfoftheboardoftrustees,IampleasedtopresenttheComprehensiveAnnualFinancialReport(CAFR)oftheTeacherRetirementSystemofTexas(TRSorSystem)forthefiscalyearendedAugust31,2020,theSystem’s82ndyearofoperation.Duringthepastfiscalyear,theSystemexperiencedgrowthasmembershipincreasedby53,026,endingtheyearwith1,682,708participants.ThePensionTrustFundsawpositivereturnsinthepastyear,endingthe2020fiscalyearwithanetpositionof$165.4billioncomparedto$158.0billionatthecloseofthe2019fiscalyear.TRSinvestmentearnings,combinedwithcontributionincreasesandbenefitchangesapprovedbythe86thTexasLegislature,arecontinuingtoenableTRStoprovidesecurebenefitsforcurrentandfutureretirees.
TheStateAuditor'sOfficeperformedanaudit, inaccordancewithgenerallyacceptedauditingstandards,of theSystem'sfinancialstatements.Theopinionletterispresentedinthisreportprecedingthefinancialstatements.
ManagementResponsibility
This report consists of management’s representations concerning TRS finances. Management assumes fullresponsibility for the completeness and reliability of all information presented in this report. To provide areasonable basis for making these representations, management maintains a comprehensive internal controlframeworkdesignedtoprotectassetsfromloss,theft,ormisuseandtocompilesufficient,reliable informationfor the preparation of TRS' financial statements in conformity with Generally Accepted Accounting Principles(GAAP).Theobjectiveoftheinternalcontrolframeworkistoprovidereasonableratherthanabsoluteassurancethatthefinancialstatementswillbefreefrommaterialmisstatementsincethecostofcontrolsshouldnotexceedthebenefitstobederived.Tothebestofourknowledgeandbelief,managementassertsthisfinancialreport iscompleteandreliableinallmaterialrespects.
CertificateofAchievementforExcellenceinFinancialReporting
TheGovernmentFinanceOfficersAssociationoftheUnitedStatesandCanada(GFOA)awardedTRStheCertificateofAchievementforExcellenceinFinancialReportingforitsCAFRforthepreviousfiscalyear.Tobeawardedthecertificate, a reportmustmeet or exceed program standards andmust satisfy bothGAAP and applicable legalrequirements.TRShasreceivedaCertificateofAchievementforeachofthelast30years.Webelievethatthecurrent report continues tomeet program requirements andwill be submitted to the GFOA for considerationagainthisyear.
FinancialInformation
The Basic Financial Statements have been prepared in accordancewith GAAP applied on a consistent basis aspromulgated by the Governmental Accounting Standards Board (GASB). The Management's Discussion andAnalysis(MD&A)includesanarrativeintroduction,overview,andanalysistoaccompanythefinancialstatements.ThetransmittalletterisdesignedtocomplementtheMD&Aandshouldbereadinconjunctionwithit.TheMD&AcanbefoundimmediatelyfollowingtheIndependentAuditor'sReport.
LetterofTransmittal
6 TeacherRetirementSystemofTexas2020ComprehensiveAnnualFinancialReport
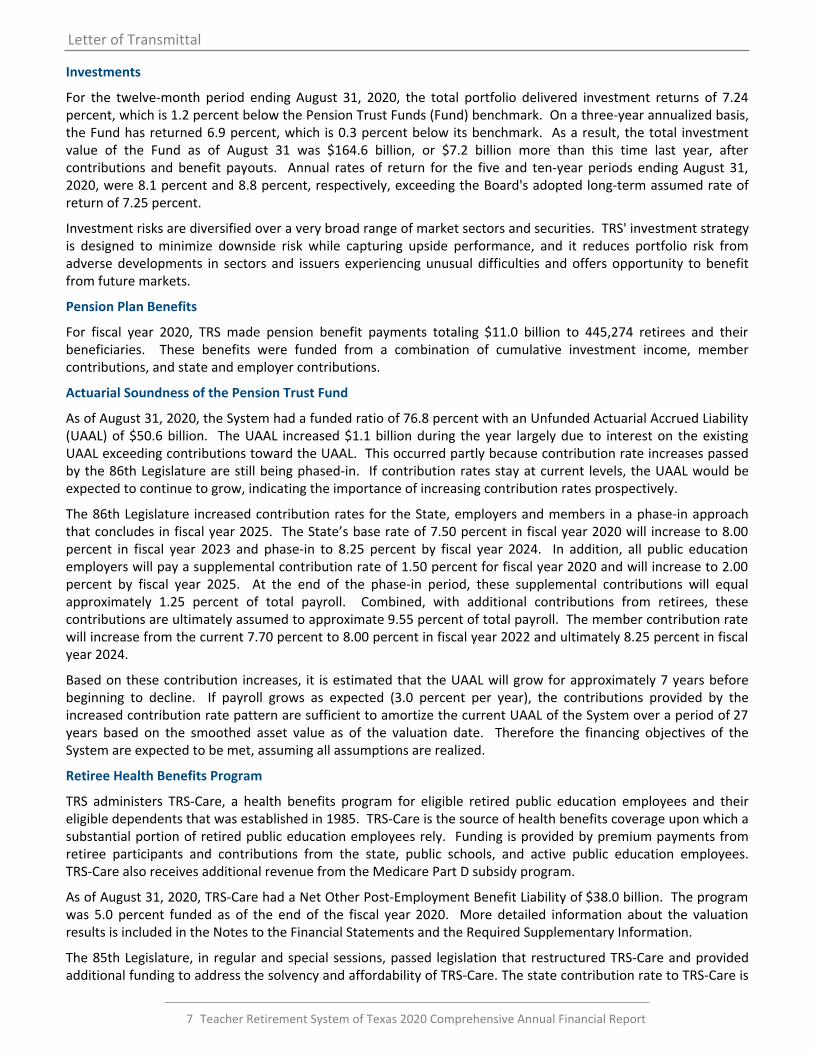
Investments
For the twelve-month period ending August 31, 2020, the total portfolio delivered investment returns of 7.24percent,whichis1.2percentbelowthePensionTrustFunds(Fund)benchmark.Onathree-yearannualizedbasis,theFundhasreturned6.9percent,which is0.3percentbelowitsbenchmark. Asaresult, thetotal investmentvalue of the Fund as of August 31 was $164.6 billion, or $7.2 billion more than this time last year, aftercontributions andbenefit payouts. Annual rates of return for the five and ten-year periods endingAugust 31,2020,were8.1percentand8.8percent,respectively,exceedingtheBoard'sadoptedlong-termassumedrateofreturnof7.25percent.
Investmentrisksarediversifiedoveraverybroadrangeofmarketsectorsandsecurities.TRS'investmentstrategyis designed tominimize downside risk while capturing upside performance, and it reduces portfolio risk fromadversedevelopments in sectors and issuers experiencingunusual difficulties andoffersopportunity tobenefitfromfuturemarkets.
PensionPlanBenefits
For fiscal year 2020, TRS made pension benefit payments totaling $11.0 billion to 445,274 retirees and theirbeneficiaries. These benefits were funded from a combination of cumulative investment income, membercontributions,andstateandemployercontributions.
ActuarialSoundnessofthePensionTrustFund
AsofAugust31,2020,theSystemhadafundedratioof76.8percentwithanUnfundedActuarialAccruedLiability(UAAL)of$50.6billion. TheUAAL increased$1.1billionduring theyear largelydue to intereston theexistingUAALexceedingcontributionstowardtheUAAL.Thisoccurredpartlybecausecontributionrateincreasespassedbythe86thLegislaturearestillbeingphased-in. Ifcontributionratesstayatcurrent levels,theUAALwouldbeexpectedtocontinuetogrow,indicatingtheimportanceofincreasingcontributionratesprospectively.
The86thLegislature increasedcontributionratesfortheState,employersandmembers inaphase-inapproachthatconcludesinfiscalyear2025. TheState’sbaserateof7.50percentinfiscalyear2020will increaseto8.00percent in fiscal year 2023 and phase-in to 8.25 percent by fiscal year 2024. In addition, all public educationemployerswillpayasupplementalcontributionrateof1.50percentforfiscalyear2020andwillincreaseto2.00percent by fiscal year 2025. At the end of the phase-in period, these supplemental contributions will equalapproximately 1.25 percent of total payroll. Combined, with additional contributions from retirees, thesecontributionsareultimatelyassumedtoapproximate9.55percentoftotalpayroll.Themembercontributionratewillincreasefromthecurrent7.70percentto8.00percentinfiscalyear2022andultimately8.25percentinfiscalyear2024.
Basedonthesecontribution increases, it isestimatedthattheUAALwillgrowforapproximately7yearsbeforebeginning to decline. If payroll grows as expected (3.0 percent per year), the contributions provided by theincreasedcontributionratepatternaresufficienttoamortizethecurrentUAALoftheSystemoveraperiodof27years based on the smoothed asset value as of the valuation date. Therefore the financing objectives of theSystemareexpectedtobemet,assumingallassumptionsarerealized.
RetireeHealthBenefitsProgram
TRS administers TRS-Care, a health benefits program for eligible retired public education employees and theireligibledependentsthatwasestablishedin1985.TRS-Careisthesourceofhealthbenefitscoverageuponwhichasubstantialportionofretiredpubliceducationemployeesrely. Funding isprovidedbypremiumpaymentsfromretiree participants and contributions from the state, public schools, and active public education employees.TRS-CarealsoreceivesadditionalrevenuefromtheMedicarePartDsubsidyprogram.
AsofAugust31,2020,TRS-CarehadaNetOtherPost-EmploymentBenefitLiabilityof$38.0billion.Theprogramwas 5.0 percent funded as of the end of the fiscal year2020. More detailed information about the valuationresultsisincludedintheNotestotheFinancialStatementsandtheRequiredSupplementaryInformation.
The85thLegislature, inregularandspecialsessions,passed legislationthatrestructuredTRS-CareandprovidedadditionalfundingtoaddressthesolvencyandaffordabilityofTRS-Care.ThestatecontributionratetoTRS-Careis
LetterofTransmittal
7 TeacherRetirementSystemofTexas2020ComprehensiveAnnualFinancialReport

1.25percentofpublicschoolpayrollandthedistrictcontributionis0.75percent.Activeemployeecontributionsremainedunchangedat0.65percent.The86thTexasLegislaturealsoappropriated$231milliontokeepTRS-Carepremiumsconsistentthroughfiscalyear2021.
ActiveMemberHealthBenefitsProgram
TRS-ActiveCare,initiatedin2002,isaself-fundedhealthbenefitsprogramthatoffersplanoptionsthatrangefromcatastrophic coverage with reduced premiums to a comprehensive plan at higher premiums. TRS-ActiveCarecoversactiveemployeescurrentlyemployedbypubliceducationemployersthatparticipateintheprogram,alongwith the employees' eligible dependents. TRS-ActiveCare is funded by State, employer, and active employeecontributions. Each plan year, the TRS Board of Trustees hasmade plan changes and increased premiums tosustaintheprogram.
AgencyHighlights
TheSystemtransitioned theTEAMprogram in-houseandhas implementedanAgileapproach tomanaging thenext phase of the program. This approach involves incremental releases that give earlier benefits to bothmembers and the business. Benefits include: enhancedmember services, consistency in communications, andnew,helpfulfunctionalityfortheMyTRSportaldeliveredsooner.TheAgileapproachallowsTRStointroducenewfunctionalityincrementally,conductmorefocusedtestingforimprovedquality,enhanceddataconditioning,andfocusedincrementalend-usertrainingforalessdisruptivetransitionforTRSstaff.
Thehealthcareprogramsuccessfullycompletedthelargestprocurementinhistory,savingtheSystem$745millionoverthenextthreetofiveyears.
Informationtechnologyworkedtirelesslytotransitionalmost90percentofTRSstafffromon-sitetoremoteworkinresponseoftheCOVID19pandemic. Toassistwiththistransition,TRSleveragede-sign,automatedpaymentvouchersigningprocessesandautomatedworkflowstosecurelyperformbusinesstransactionsandoffermemberflexibilitywhileofficeswereclosedtothepublic. MainframesystemsweremigratedtoaMFaaSsystemtohelpmitigaterisksandimprovesupporttomembersandstaff.
Acknowledgments
Wewish to express our appreciation for the support of the Governor's, Lieutenant Governor's, and Speaker'sOffices,aswellasmembersofthelegislature,inmaintainingastrongretirementsystem,whichprovidesvaluablebenefitsforpubliceducationemployeesandretirees.
We are grateful for the dedicated service of all of our trustees. Trusteewillingness to accept the substantialresponsibilitiesofdirectingsystemadministration isagreat service to theStateand to themembersservedbyTRS.
TRS trustees and staff are keenly focused on prudent Pension Trust Fund portfoliomanagement and efficient,service-orienteddeliveryofvaluableretirementandrelatedbenefitsforpubliceducationemployeesandretirees.Wearepleasedtoreportonoperationalresultsfortheyearandtoacknowledgethesubstantialsupportofstateleadership,trustees,members,interestedassociations,andTRSstaff.
Respectfullysubmitted,
BrianK.Guthrie DonaldC.GreenExecutiveDirector ChiefFinancialOfficer
LetterofTransmittal
8 TeacherRetirementSystemofTexas2020ComprehensiveAnnualFinancialReport

Thispageisintentionallyleftblank.
9 TeacherRetirementSystemofTexas2020ComprehensiveAnnualFinancialReport

OrganizationChart
10 TeacherRetirementSystemofTexas2020ComprehensiveAnnualFinancialReport

StaffandAdvisors
11 TeacherRetirementSystemofTexas2020ComprehensiveAnnualFinancialReport

PensionTrustFundMembership of the Teacher Retirement System ofTexas includes employees and retirees of state-supported educational institutions in Texas.Participating employers for fiscal year 2020 aredisclosedinthefollowingtable.
NumberofParticipatingEmployers
ParticipatingEmployers 2020PublicSchoolDistricts 1,022CharterSchools 187CommunityandJuniorColleges 50SeniorCollegesandUniversities 48RegionalServiceCenters 20MedicalSchools 9OtherEducationDistricts 3StateAgencies 1TotalParticipatingEmployers 1,340
MembershipNumbersbyCategory
MemberCategories AsofAugust31,CurrentMembers 2020 2019ActiveContributing 914,752 884,540InactiveNon-vested 209,956 201,948InactiveVested 112,726 108,768TotalCurrentMembers 1,237,434 1,195,256
RetirementRecipientsService 415,696 405,236Disability 11,926 11,994Survivor 17,652 17,196TotalRetirementRecipients 445,274 434,426
TotalMembership 1,682,708 1,629,682
NetMembershipChanges
AsofAugust31,PopulationChanges 2020 2019ActiveMembership:NewMembers 80,540 88,953MembersWithdrawing (32,667) (37,806)ServiceRetirements (19,521) (22,160)DisabilityRetirements (671) (711)In-ServiceDeaths (1,520) (1,387)OtherChanges 16,017 (3,130)
NetIncrease 42,178 23,759
RetiredMembership:Retirements 20,192 22,871DeathsAfterRetirement (10,272) (9,433)OptionContinuations 2,999 2,939OtherChanges (2,071) (2,409)
NetIncrease 10,848 13,968
MembershipProfile
AsofAugust31, 2020 2019
ActiveMembershipAverageAnnualSalary $ 51,477 $ 49,495AverageAge 44.7 44.8AverageYearsofService 10.3 10.4
AnnuitantandBeneficiaryAverageMonthlyAnnuities
LifeAnnuities $ 2,118 $ 2,096DisabilityAnnuities 1,214 1,200AnnuitiesCertain 1,157 1,142
AverageAgeofCurrentRetirees 72.0 71.4AverageAgeatRetirement
AllRetirees 60.4 60.3CurrentYearRetirees 62.3 62.2
AverageYearsofServiceAllRetirees 24.1 24.2CurrentYearRetirees 22.8 22.6
AverageSalaryatRetirementAllRetirees $ 46,677 $ 45,951CurrentYearRetirees 55,500 53,278
RatioofMemberstoRetirees 2.8to1 2.8to1
TexasPublicSchoolRetiredEmployeesGroupInsuranceProgram(TRS-Care)Membership of TRS-Care is eligible to TRS publicschool retirees. There were 1,231 participatingemployersduringfiscalyear2020.
MembershipNumbersbyCategory
AsofAugust31,MemberCategories 2020 2019Retirees 178,771 181,409SurvivingSpouses 6,047 6,194SurvivingChildren 116 116
DependentSpousesandChildren 35,028 37,578TotalMembership 219,962 225,297
TRS-ActiveCareMembership of TRS-ActiveCare includes employeesof public school districts, open enrollment charterschools, regional service centers, and othereducationaldistricts.Therewere1,088participatingemployersduringfiscalyear2020.
MembershipNumbersbyCategory
AsofAugust31,MemberCategories 2020 2019Employees 307,264 306,897Dependents 165,507 168,842TotalMembership 472,771 475,739
MembershipInformation
12 TeacherRetirementSystemofTexas2020ComprehensiveAnnualFinancialReport

Thou
sand
s
CurrentMembershipbyYearPensionTrustFund
2016 2017 2018 2019 20201,100
1,120
1,140
1,160
1,180
1,200
1,220
1,240
Thou
sand
s
MembershipbyYearTRS-Care
2016 2017 2018 2019 2020210
220
230
240
250
260
270
Thou
sand
s
RetirementRecipientsbyYearPensionTrustFund
2016 2017 2018 2019 2020390
400
410
420
430
440
450
Th
ousand
s
MembershipbyYearTRS-ActiveCare
2016 2017 2018 2019 2020470
475
480
485
490
495
MembershipInformation
13 TeacherRetirementSystemofTexas2020ComprehensiveAnnualFinancialReport

Thispageisintentionallyleftblank.
14 TeacherRetirementSystemofTexas2020ComprehensiveAnnualFinancialReport


Thispageisintentionallyleftblank.
16 TeacherRetirementSystemofTexas2020ComprehensiveAnnualFinancialReport

FinancialSection
17 TeacherRetirementSystemofTexas2020ComprehensiveAnnualFinancialReport

IndependentAuditor'sReport
18 TeacherRetirementSystemofTexas2020ComprehensiveAnnualFinancialReport

FinancialSection
19 TeacherRetirementSystemofTexas2020ComprehensiveAnnualFinancialReport

IndependentAuditor'sReport
20 TeacherRetirementSystemofTexas2020ComprehensiveAnnualFinancialReport

Management'sDiscussionandAnalysis
We are pleased to provide this overview of theTeacher Retirement System's (TRS or System)financial performance for the fiscal year endedAugust31,2020. The informationpresentedhereinshould be read in conjunction with other areaswithintheFinancialSection.
FinancialHighlights
• The net position of the TRS Pension TrustFund was $165.4 billion as of August 31,2020, an increase of $7.4 billion from fiscalyear2019.
• Thenetpension liabilitywas$53.6billion,a$1.6 billion increase from the fiscal year2019liabilityof$52.0billion.
• Fiscal year 2020 investment income was$11.1billion,anincreaseof$3.4billionfromfiscalyear2019.
• PensionPlan investmentsexperienceda7.2percent annual rate of return for the yearended August 31, 2020, compared to a 5.2percent annual rateof return for fiscal year2019.
• ThenetpositionofTRS-Carewas$2.0billionasofAugust31,2020,anincreaseof$704.3millionfromfiscalyear2019.
• TRS-Care's net Other Post-EmploymentBenefit(OPEB)liabilitywas$38.0billion.Theliability decreased $9.3 billion from fiscalyear2019liabilityof$47.3billion.
• TRS-ActiveCarehadanetpositionof$168.3millionasofAugust31,2020,anincreaseof$3.3millionfromfiscalyear2019.
OverviewoftheFinancialStatements
This discussion and analysis is intended to serve asan introduction to the TRS financial presentation,whichconsistsofthefollowingcomponents:
• BasicFinancialStatements
• NotestotheFinancialStatements
• RequiredSupplementaryInformation
• OtherSupplementaryInformation
This informationpresents thenet position availableforthefundsTRSadministersasofAugust31,2020and any changes in net position for the year thenended. The information available in each of thesesectionsissummarizedbelow.
BasicFinancialStatements
Basic Financial Statements are presented for themajor funds for the fiscal year ended August 31,2020,alongwithcomparativedatafortheprioryear.FinancialspresentedincludethePensionTrustFund,TRS-Care Fund, TRS-ActiveCare Fund, and CustodialFund.
NotestotheFinancialStatements
The Notes to the Financial Statements provideadditional information that is essential to a fullunderstanding of the financial position and areconsidered an integral part of the financialstatements.
RequiredSupplementaryInformation
Required Supplementary Information (RSI) consistsof the Governmental Accounting Standards Board(GASB) related requirements for the Pension andTRS-CareFunds.
OtherSupplementaryInformation
OtherSupplementary Information includescustodialfundchanges inassetsand liabilities, administrativeand investing activity expenses, and payments forprofessionalandconsultingservices.
GrowthoftheSystem
AsofAugust2020, themonthlyannuitypayrollhaddecreased to $914.4 million, and TRS was payingbenefitsto445,274recipients.Benefitpaymentsbytype of recipient are illustrated in the Total AnnualBenefit Payments chart in the financial analysis oftheTRSPensionTrustFundonthefollowingpages.
Pensionrecipientsincluderetireesandbeneficiaries.Disability recipients are disabledmembers who arereceivingdisabilitypayments.Survivorrecipientsarebeneficiaries who have elected to receive deathbenefits in the form of monthly payments. Thenumber of retiree accounts increased by 10,848duringfiscalyear2020.
OfthecurrentTRSmemberaccounts,914,752activecontributing and deferred retirement optionparticipantswere employed during fiscal year 2020and made contributions to the System. Theremaining 322,682 members were no longeremployedbyTRScoveredemployersbutmaintainedtheir membership in TRS by leaving theircontributions in the System. The number of totalcurrent member accounts increased by 42,178duringfiscalyear2020.
FinancialSection
21 TeacherRetirementSystemofTexas2020ComprehensiveAnnualFinancialReport

FinancialAnalysisofTRSFunds
PensionTrustFund
Netpositionheld in trust forbenefitsatAugust31,2020was$165.4billion,anincreaseof $7.4billionfromthe$158.0billionatAugust31,2019.
Fiscal year 2020 investment income was$11.1billion,an increaseof $3.4billionover2019.The year presented unprecedented investmentchallenges due to the global COVID-19 pandemic.Despite an adverse impact to the economy, globalmarkets recovered in the finalmonthsof fiscalyear2020.
Total contributions and other additions increased$301.8 million, or 3.9 percent, during fiscal year2020.Theincreaseisduetonormalpayrollgrowth.
Deductions from net position are primarilyretirement pension payments. Fiscal year 2020,benefitpaymentstotaled$11.1billion,adecreaseof
$276.2million.Thisisinlinewiththeincreaseinthenumber of retirees from the prior year and thedecreaseof$588.8millionsupplementalfundingforthe one-time benefit payment made in 2019. Forfiscalyear2020,refundofcontributionswere$421.4million, a decrease of $65.1million over fiscal year2019, largely due to an increase in memberwithdrawals.
Administrative expenses, excluding investingactivitiesexpenses,onacostpermemberbasiswere$39.90 for fiscal year 2020 compared to $37.11 infiscalyear2019.
Investment cost permemberwas$132.12 for fiscalyear 2020 as compared to $126.66 in fiscal year2019. Investment expense in basis points of netposition was 14.1 for fiscal year 2020 and wascalculated using the average net asset value.Investment expense in basis points for fiscal year2019was13.6.
Billion
s
QuarterlyNetPositionPensionTrustFund
FiscalYears2019-2020
1Q19 2Q19 3Q19 4Q19 1Q20 2Q20 3Q20 4Q20$145
$150
$155
$160
$165
$170
Management'sDiscussionandAnalysis
22 TeacherRetirementSystemofTexas2020ComprehensiveAnnualFinancialReport
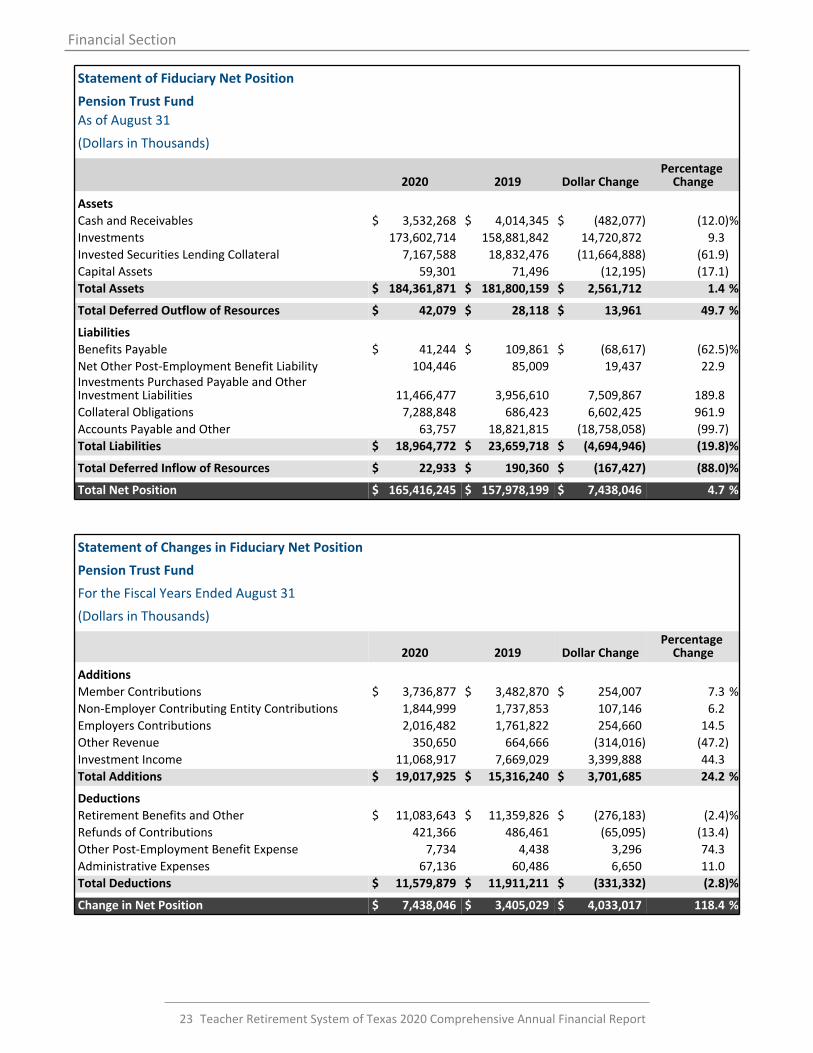
StatementofFiduciaryNetPosition
PensionTrustFundAsofAugust31
(DollarsinThousands)
2020 2019 DollarChangePercentageChange
AssetsCashandReceivables $ 3,532,268 $ 4,014,345 $ (482,077) (12.0)%Investments 173,602,714 158,881,842 14,720,872 9.3InvestedSecuritiesLendingCollateral 7,167,588 18,832,476 (11,664,888) (61.9)CapitalAssets 59,301 71,496 (12,195) (17.1)TotalAssets $ 184,361,871 $ 181,800,159 $ 2,561,712 1.4%
TotalDeferredOutflowofResources $ 42,079 $ 28,118 $ 13,961 49.7%
LiabilitiesBenefitsPayable $ 41,244 $ 109,861 $ (68,617) (62.5)%NetOtherPost-EmploymentBenefitLiability 104,446 85,009 19,437 22.9InvestmentsPurchasedPayableandOtherInvestmentLiabilities 11,466,477 3,956,610 7,509,867 189.8CollateralObligations 7,288,848 686,423 6,602,425 961.9AccountsPayableandOther 63,757 18,821,815 (18,758,058) (99.7)TotalLiabilities $ 18,964,772 $ 23,659,718 $ (4,694,946) (19.8)%
TotalDeferredInflowofResources $ 22,933 $ 190,360 $ (167,427) (88.0)%
TotalNetPosition $ 165,416,245 $ 157,978,199 $ 7,438,046 4.7%
StatementofChangesinFiduciaryNetPosition
PensionTrustFund
FortheFiscalYearsEndedAugust31
(DollarsinThousands)
2020 2019 DollarChangePercentageChange
AdditionsMemberContributions $ 3,736,877 $ 3,482,870 $ 254,007 7.3%Non-EmployerContributingEntityContributions 1,844,999 1,737,853 107,146 6.2EmployersContributions 2,016,482 1,761,822 254,660 14.5OtherRevenue 350,650 664,666 (314,016) (47.2)InvestmentIncome 11,068,917 7,669,029 3,399,888 44.3TotalAdditions $ 19,017,925 $ 15,316,240 $ 3,701,685 24.2%
DeductionsRetirementBenefitsandOther $ 11,083,643 $ 11,359,826 $ (276,183) (2.4)%RefundsofContributions 421,366 486,461 (65,095) (13.4)OtherPost-EmploymentBenefitExpense 7,734 4,438 3,296 74.3AdministrativeExpenses 67,136 60,486 6,650 11.0TotalDeductions $ 11,579,879 $ 11,911,211 $ (331,332) (2.8)%
ChangeinNetPosition $ 7,438,046 $ 3,405,029 $ 4,033,017 118.4%
FinancialSection
23 TeacherRetirementSystemofTexas2020ComprehensiveAnnualFinancialReport
Millions
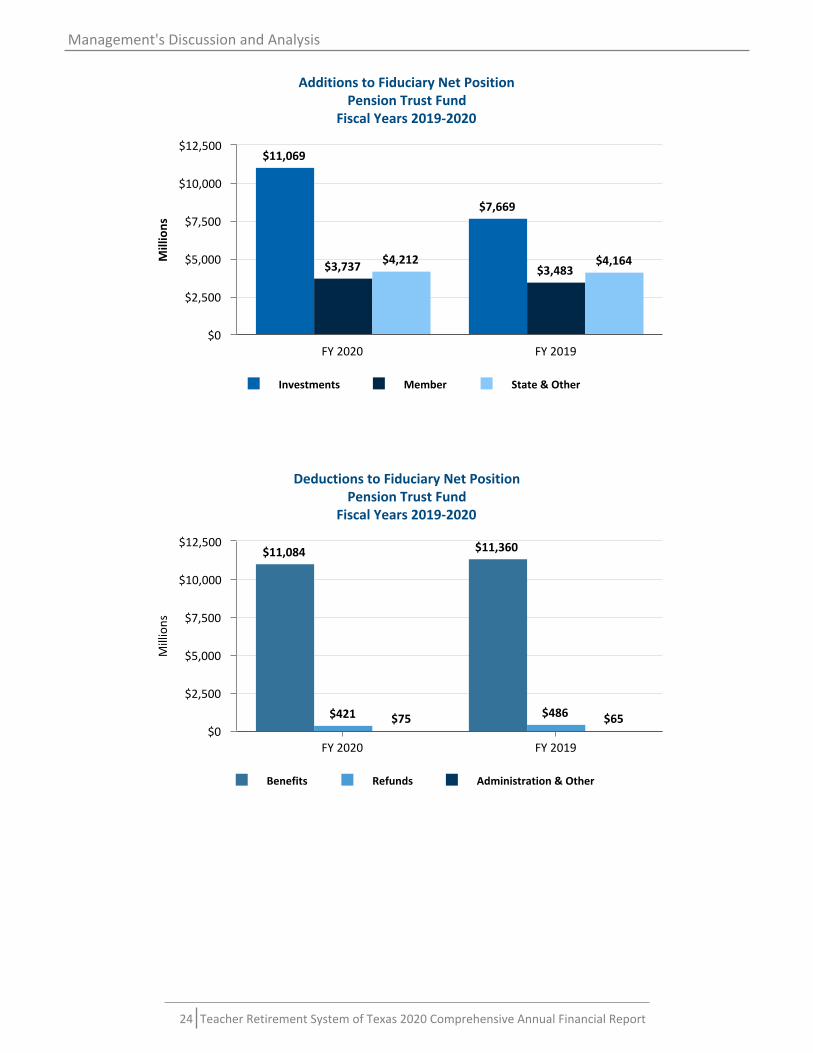
AdditionstoFiduciaryNetPositionPensionTrustFund
FiscalYears2019-2020
$11,069
$7,669
$3,737 $3,483$4,212 $4,164
Investments Member State&Other
FY2020 FY2019$0
$2,500
$5,000
$7,500
$10,000
$12,500Millions
DeductionstoFiduciaryNetPositionPensionTrustFund
FiscalYears2019-2020
$11,084 $11,360
$421 $486$75 $65
Benefits Refunds Administration&Other
FY2020 FY2019$0
$2,500
$5,000
$7,500
$10,000
$12,500
Management'sDiscussionandAnalysis
24 TeacherRetirementSystemofTexas2020ComprehensiveAnnualFinancialReport

Billion
s
TotalAnnualBenefitPaymentsPensionTrustFund
FiscalYears2015-2020
$8.94$8.94 $9.39$9.39 $9.78$9.78 $10.17$10.17$11.26$11.26 $11.21$11.21
Service,Disability&Survivor PartialLumpSumOption
DeferredRetirementOption
2015 2016 2017 2018 2019 2020$0
$2
$4
$6
$8
$10
$12
FinancialSection
25 TeacherRetirementSystemofTexas2020ComprehensiveAnnualFinancialReport

TRS-Care
ThenetpositionofTRS-CareatAugust31,2020was$2.0 billion, an increase of $704.3million from the$1.3billionatAugust31,2019.
Total contributions of $1.0 billion increased $66.6million from $937.6 million over 2019 due to anincrease in theemployer contribution rate.Rebatesincreased by $66.9 million due to an increase inrebates for specialty drugs by contract. Federalrevenue decreased by $34.6 million due to areduction in program usage and a change in thesubsidy rate. Investment income totaled $25.5million,whichwas an increase of $0.5million fromfiscalyear2019.
Deductions from net position totaled $1.2 billionduring fiscal year 2020 which was an increase of$45.8million from fiscal year 2019. The increase ismainlyduetoachanges intheAffordableCareAct,theHealthInsurerProviderfeeresuming,adecreaseinenrollment,andanincreaseonretailandspecialtypharmacyclaims.
Millions
QuarterlyNetPositionTRS-Care
FiscalYears2019-2020
1Q19 2Q19 3Q19 4Q19 1Q20 2Q20 3Q20 4Q20$500
$750
$1,000
$1,250
$1,500
$1,750
$2,000
$2,250
Management'sDiscussionandAnalysis
26 TeacherRetirementSystemofTexas2020ComprehensiveAnnualFinancialReport

StatementofFiduciaryNetPosition
TRS-Care
AsofAugust31
(DollarsinThousands)
2020 2019DollarChange
PercentageChange
AssetsCash,ReceivablesandCapitalAssets $ 2,146,681 $ 1,475,509 $ 671,172 45.5%TotalAssets $ 2,146,681 $ 1,475,509 $ 671,172 45.5%
LiabilitiesAccountsPayablesandOther $ 3,740 $ 9,984 $ (6,244) (62.5)%HealthCareFeesPayable 30,657 — 30,657 —HealthCareClaimsPayables 115,966 154,660 (38,694) (25.0)TotalLiabilities $ 150,363 $ 164,644 $ (14,281) (8.7)%
TotalDeferredInflowofResources $ — $ 18,843 $ (18,843) (100.0)%
NetPosition $ 1,996,318 $ 1,292,022 $ 704,296 54.5%
StatementofChangesinFiduciaryNetPosition
TRS-Care
FortheFiscalYearsEndedAugust31
(DollarsinThousands)
2020 2019DollarChange
PercentageChange
AdditionsMemberContributions $ 243,532 $ 227,338 $ 16,194 7.1%
Non-EmployerContributingEntityContributions 435,769 404,937 30,832 7.6
ParticipatingEmployersContributions 324,973 305,362 19,611 6.4
RebatesandDiscountIncome 423,426 356,440 66,986 18.8
FederalRevenue 186,169 220,784 (34,615) (15.7)
OtherRevenue 18 — 18 —
InvestmentIncome 25,537 25,047 490 2.0
SupplementalAppropriationfromState'sGeneralFund-Non-EmployerContributingEntity 230,757 73,642 157,115 213.3TotalAdditions $ 1,870,181 $ 1,613,550 $ 256,631 15.9%
DeductionsHealthCareClaims $ 1,538,212 $ 1,515,398 $ 22,814 1.5%
Less:HealthCarePremiumsPaidbyRetirees (499,058) (517,965) 18,907 (3.7)
HealthCareClaimsProcessing 37,420 38,982 (1,562) (4.0)
InsurancePremiumPayments 51,410 71,795 (20,385) (28.4)
HealthCareFees 30,833 5,887 24,946 423.7
AdministrativeExpenses 7,068 6,005 1,063 17.7TotalDeductions $ 1,165,885 $ 1,120,102 $ 45,783 4.1%
ChangeinNetPosition $ 704,296 $ 493,448 $ 210,848 42.7%
FinancialSection
27 TeacherRetirementSystemofTexas2020ComprehensiveAnnualFinancialReport

TRS-ActiveCare
The net position was $168.3 million at August 31,2020, an increase of $3.3 million from $165.0millionthepreviousfiscalyear.
Total revenue of $2.31 billion decreased $26.3million from $2.34 billion in 2019 mostly due tolowerhealthcareclaimscausedbylowerenrollmentanda$2.8decreaseininvestmentincome.
Total expenses of $2.31 billion increased $79.0million from$2.23billion in fiscal year 2019due tohigherenrollmentintheHMOplans,andbetterthanexpectedclaimsexperience.
Millions
QuarterlyNetPositionTRS-ActiveCare
FiscalYears2019-2020
1Q19 2Q19 3Q19 4Q19 1Q20 2Q20 3Q20 4Q20$50
$100
$150
$200
$250
$300
Management'sDiscussionandAnalysis
28 TeacherRetirementSystemofTexas2020ComprehensiveAnnualFinancialReport

StatementofFiduciaryNetPosition
TRS-ActiveCare
AsofAugust31
(DollarsinThousands)
2020 2019DollarChange
PercentageChange
AssetsCashandReceivables $ 430,506 $ 414,096 $ 16,410 4.0%TotalAssets $ 430,506 $ 414,096 $ 16,410 4.0%
LiabilitiesAccountsPayableandOther $ 31,636 $ 9,933 $ 21,703 218.5%PremiumsandFeesPayable 953 20,932 (19,979) (95.4)HealthCareClaimsPayable 228,723 216,387 12,336 5.7TotalLiabilities $ 261,312 $ 247,252 $ 14,060 5.7%
TotalDeferredInflowofResources $ 895 $ 1,891 $ (996) (52.7)%
TotalNetPosition $ 168,299 $ 164,953 $ 3,346 2.0%
StatementofChangesinFiduciaryNetPosition
TRS-ActiveCare
FortheFiscalYearsEndedAugust31
(DollarsinThousands)
2020 2019DollarChange
PercentageChange
Revenues(OperatingandNon-Operating)HealthCarePremiums $ 2,304,205 $ 2,327,440 $ (23,235) (1.0)%InvestmentIncome 7,854 10,623 (2,769) (26.1)OtherRevenue 413 686 (273) (39.8)TotalRevenue $ 2,312,472 $ 2,338,749 $ (26,277) (1.1)%
OperatingExpensesHealthCareClaims $ 1,932,461 $ 1,863,374 $ 69,087 3.7%HealthCareClaimsProcessing 115,227 118,883 (3,656) (3.1)HealthCareFees 841 929 (88) (9.5)PremiumPaymentstoHMO's 256,851 243,199 13,652 5.6AdministrativeExpenses 3,746 3,703 43 1.2TotalExpenses $ 2,309,126 $ 2,230,088 $ 79,038 3.5%
ChangeinNetPosition $ 3,346 $ 108,661 $ (105,315) (96.9)%
RequestforInformation
Questions concerning any of the informationprovided in this report or requests for additionalinformationshouldbeaddressedtothe
Communications Department of the TeacherRetirement System, 1000 Red River Street, Austin,Texas78701.
FinancialSection
29 TeacherRetirementSystemofTexas2020ComprehensiveAnnualFinancialReport

Thispageisintentionallyleftblank.
30 TeacherRetirementSystemofTexas2020ComprehensiveAnnualFinancialReport

BasicFinancialStatements
ExhibitI StatementofFiduciaryNetPosition.......................................................................... 32ExhibitII StatementofChangesinFiduciaryNetPosition....................................................... 36ExhibitIII StatementofNetPosition-ProprietaryFunds......................................................... 40
ExhibitIVStatementofRevenues,Expenses,andChangesinNetPosition-ProprietaryFunds......................................................................................................................... 41
ExhibitV StatementofCashFlows-ProprietaryFunds............................................................ 42
FinancialSection
31 TeacherRetirementSystemofTexas2020ComprehensiveAnnualFinancialReport

ExhibitIStatementofFiduciaryNetPositionFiduciaryFundsAsofAugust31,2020(WithComparativeDataasofAugust31,2019)
PensionandOtherPost-EmploymentBenefit(OPEB)TrustFunds
PensionTrustFund TRS-Care
AssetsCashCashinStateTreasury $ 352,604,861 $ 1,753,803,542CashinBank(Note3B) 320,110,687 —CashonHand(Note3B) 7,092,327 —TotalCash $ 679,807,875 $ 1,753,803,542
ReceivablesSaleofInvestments $ 2,077,559,628 $ —InterestandDividends 258,550,465 4,768,114MemberandRetiree 5,891,006 —ServiceCreditPurchase 12,490,993 —DuefromEmployers 458,396,038 37,551,554DuefromState'sGeneralFund 30,615,231 5,360,412DuefromEmployeesRetirementSystemofTexas 2,339,914 —PrepaidExpensesandDeposits 2,799,025 —Other 3,817,940 337,627,401TotalReceivables $ 2,852,460,240 $ 385,307,481
Investments(Note1Fand3)Short-TermInvestments $ 9,470,466,884 $ —EquityInvestments 47,146,352,906 —FixedIncomeInvestments 23,812,737,094 —AlternativeInvestments 75,588,432,067 —DerivativeInvestments 523,025,238 —PooledInvestments 17,061,700,017 —TotalInvestments $ 173,602,714,206 $ —
InvestedSecuritiesLendingCollateral $ 7,167,587,747 $ —
CapitalAssets(Note2)IntangibleAssets $ 54,668,221 $ —LessAccumulatedAmortization (32,676,259) —DepreciableAssets 61,607,091 —LessAccumulatedDepreciation (40,551,623) —Non-DepreciableAssets 16,253,083 7,570,121TotalCapitalAssets $ 59,300,513 $ 7,570,121
TotalAssets $ 184,361,870,581 $ 2,146,681,144
BasicFinancialStatements
32 TeacherRetirementSystemofTexas2020ComprehensiveAnnualFinancialReport

(Continued)
TotalPensionandOtherPost-EmploymentBenefit(OPEB)TrustFunds CustodialFunds
2020 2019 ChildSupportEmployeeDeductions
$ 2,106,408,403 $ 2,059,991,246 $ 6,082 320,110,687 109,659,682 — 7,092,327 5,604,880 —$ 2,433,611,417 $ 2,175,255,808 $ 6,082
$ 2,077,559,628 $ 2,165,471,676 $ — 263,318,579 260,976,058 — 5,891,006 3,511,529 — 12,490,993 12,727,015 — 495,947,592 621,147,260 — 35,975,643 5,971 — 2,339,914 2,236,438 — 2,799,025 2,010,812 — 341,445,341 242,811,443 —$ 3,237,767,721 $ 3,310,898,202 $ —
$ 9,470,466,884 $ 5,806,805,988 $ — 47,146,352,906 43,357,913,826 — 23,812,737,094 24,173,126,105 — 75,588,432,067 73,111,856,573 — 523,025,238 110,009,349 — 17,061,700,017 12,322,129,864 —$ 173,602,714,206 $ 158,881,841,705 $ —
$ 7,167,587,747 $ 18,832,476,273 $ —
$ 54,668,221 $ 55,247,353 $ — (32,676,259) (22,376,923) — 61,607,091 60,249,806 — (40,551,623) (37,877,121) — 23,823,204 19,952,666 —$ 66,870,634 $ 75,195,781 $ —
$ 186,508,551,725 $ 183,275,667,769 $ 6,082
FinancialSection
33 TeacherRetirementSystemofTexas2020ComprehensiveAnnualFinancialReport

ExhibitIStatementofFiduciaryNetPositionFiduciaryFundsAsofAugust31,2020(WithComparativeDataasofAugust31,2019)
PensionandOtherPost-EmploymentBenefit(OPEB)TrustFunds
PensionTrustFund TRS-Care
DeferredOutflowofResourcesRelatedtoParticipationinERS'OPEBPlan $ 42,079,979 $ —TotalDeferredOutflowofResources $ 42,079,979 $ —
Liabilities(Note1F)
AccountsPayable $ 3,263,039 $ 1,974,148PayrollPayable 13,472,663 778,367InvestmentFeesPayable 24,291,628 —BenefitsPayable 41,243,854 —HealthCareClaimsPayable — 115,966,236FeesPayable — 30,657,148NetOtherPost-EmploymentBenefitLiability 104,446,218 —InvestmentsPurchasedPayable 2,721,473,295 —SecuritiesSoldShort 1,594,473,921 —ObligationsUnderReverseRepurchaseAgreements 7,150,529,625 —CollateralObligations 7,288,847,952 —DuetoState'sGeneralFund 103,286 —DuetoEmployeesRetirementSystemofTexas 9,194,156 —EmployeeCompensableAbsencesPayable(Note4) 13,354,446 987,313OtherLiabilities 77,899 —FundsHeldforOthers — —TotalLiabilities $ 18,964,771,982 $ 150,363,212
DeferredInflowofResourcesUnrealizedLeaseIncentives $ 119,153 $ —DeferredRevenue-SchoolDistricts — —RelatedtoParticipationinERS'OPEBPlan 22,814,182 —TotalDeferredInflowofResources $ 22,933,335 $ —
NetPositionNetInvestmentinCapitalAssets $ 59,300,513 $ 7,570,121RestrictedforPensions/OtherPost-EmploymentBenefits 165,356,944,730 1,988,747,811NetPositionRestrictedforPensionsandOtherPost-EmploymentBenefits $ 165,416,245,243 $ 1,996,317,932
SeeaccompanyingNotestotheFinancialStatements.
BasicFinancialStatements
34 TeacherRetirementSystemofTexas2020ComprehensiveAnnualFinancialReport

(Continued)
TotalPensionandOtherPost-EmploymentBenefit(OPEB)TrustFunds CustodialFunds
2020 2019 ChildSupportEmployeeDeductions
$ 42,079,979 $ 28,118,303 $ —$ 42,079,979 $ 28,118,303 $ —
$ 5,237,187 $ 599,804,948 $ — 14,251,030 6,032,462 — 24,291,628 21,081,478 — 41,243,854 109,861,304 — 115,966,236 154,659,738 — 30,657,148 — — 104,446,218 85,009,492 — 2,721,473,295 2,242,052,271 — 1,594,473,921 1,714,558,083 — 7,150,529,625 — — 7,288,847,952 18,821,814,504 — 103,286 46,376,313 — 9,194,156 10,920,557 — 14,341,759 11,987,292 — 77,899 203,986 — — — 6,082$ 19,115,135,194 $ 23,824,362,428 $ 6,082
$ 119,153 $ 119,153 $ — — 178,899,437 — 22,814,182 30,183,630 —$ 22,933,335 $ 209,202,220 $ —
$ 66,870,634 $ 75,195,781 $ — 167,345,692,541 159,195,025,643 —$ 167,412,563,175 $ 159,270,221,424 $ —
FinancialSection
35 TeacherRetirementSystemofTexas2020ComprehensiveAnnualFinancialReport
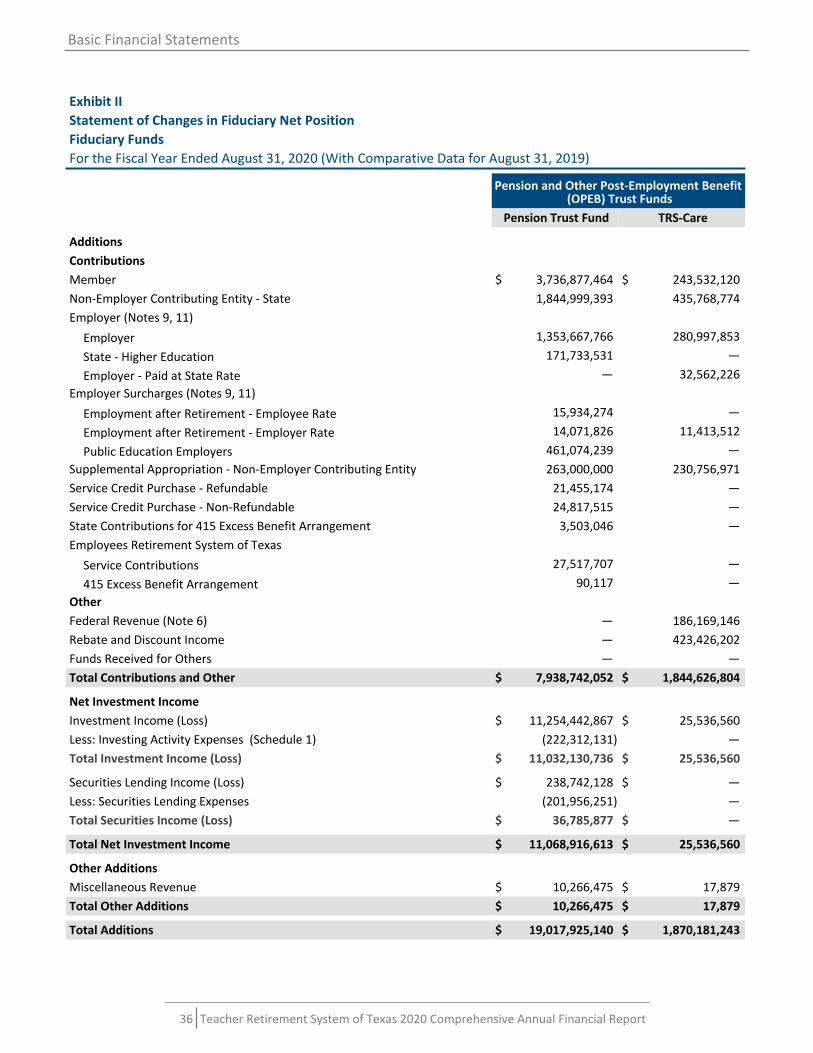
ExhibitIIStatementofChangesinFiduciaryNetPositionFiduciaryFundsFortheFiscalYearEndedAugust31,2020(WithComparativeDataforAugust31,2019)
PensionandOtherPost-EmploymentBenefit(OPEB)TrustFunds
PensionTrustFund TRS-Care
AdditionsContributionsMember $ 3,736,877,464 $ 243,532,120Non-EmployerContributingEntity-State 1,844,999,393 435,768,774Employer(Notes9,11)
Employer 1,353,667,766 280,997,853
State-HigherEducation 171,733,531 —
Employer-PaidatStateRate — 32,562,226EmployerSurcharges(Notes9,11)
EmploymentafterRetirement-EmployeeRate 15,934,274 —
EmploymentafterRetirement-EmployerRate 14,071,826 11,413,512
PublicEducationEmployers 461,074,239 —SupplementalAppropriation-Non-EmployerContributingEntity 263,000,000 230,756,971ServiceCreditPurchase-Refundable 21,455,174 —ServiceCreditPurchase-Non-Refundable 24,817,515 —StateContributionsfor415ExcessBenefitArrangement 3,503,046 —EmployeesRetirementSystemofTexas
ServiceContributions 27,517,707 —
415ExcessBenefitArrangement 90,117 —OtherFederalRevenue(Note6) — 186,169,146RebateandDiscountIncome — 423,426,202FundsReceivedforOthers — —TotalContributionsandOther $ 7,938,742,052 $ 1,844,626,804
NetInvestmentIncomeInvestmentIncome(Loss) $ 11,254,442,867 $ 25,536,560Less:InvestingActivityExpenses(Schedule1) (222,312,131) —TotalInvestmentIncome(Loss) $ 11,032,130,736 $ 25,536,560
SecuritiesLendingIncome(Loss) $ 238,742,128 $ —Less:SecuritiesLendingExpenses (201,956,251) —TotalSecuritiesIncome(Loss) $ 36,785,877 $ —
TotalNetInvestmentIncome $ 11,068,916,613 $ 25,536,560
OtherAdditionsMiscellaneousRevenue $ 10,266,475 $ 17,879TotalOtherAdditions $ 10,266,475 $ 17,879
TotalAdditions $ 19,017,925,140 $ 1,870,181,243
BasicFinancialStatements
36 TeacherRetirementSystemofTexas2020ComprehensiveAnnualFinancialReport

(Continued)
TotalPensionandOtherPost-EmploymentBenefit(OPEB)TrustFunds CustodialFunds2020 2019 ChildSupportEmployeeDeductions
$ 3,980,409,584 $ 3,710,208,180 $ — 2,280,768,167 2,142,789,003 —
1,634,665,619 1,408,549,630 — 171,733,531 182,863,093 — 32,562,226 32,252,833 —
15,934,274 13,118,045 — 25,485,338 22,385,479 — 461,074,239 408,015,906 — 493,756,971 662,469,349 — 21,455,174 19,942,841 — 24,817,515 22,262,344 — 3,503,046 3,325,686 —
27,517,707 26,307,593 — 90,117 156,542 —
186,169,146 220,783,898 — 423,426,202 356,439,596 — — — 73,834$ 9,783,368,856 $ 9,231,870,018 $ 73,834
$ 11,279,979,427 $ 7,850,693,366 $ — (222,312,131) (206,415,457) —$ 11,057,667,296 $ 7,644,277,909 $ —
$ 238,742,128 $ 519,726,609 $ — (201,956,251) (469,928,873) —$ 36,785,877 $ 49,797,736 $ —
$ 11,094,453,173 $ 7,694,075,645 $ —
$ 10,284,354 $ 3,844,018 $ —$ 10,284,354 $ 3,844,018 $ —
$ 20,888,106,383 $ 16,929,789,681 $ 73,834
FinancialSection
37 TeacherRetirementSystemofTexas2020ComprehensiveAnnualFinancialReport

ExhibitIIStatementofChangesinFiduciaryNetPositionFiduciaryFundsFortheFiscalYearEndedAugust31,2020(WithComparativeDataforAugust31,2019)
PensionandOtherPost-EmploymentBenefit(OPEB)TrustFunds
PensionTrustFund TRS-Care
DeductionsBenefits $ 10,972,292,168 $ —RefundsofContributions-Active 415,829,519 —RefundsofContributions-Death 5,536,660 —
415ExcessBenefitArrangementPaidtoEmployeesRetirementSystemofTexas 3,346,831 —BenefitsPaidtoEmployeesRetirementSystemofTexas
ServiceContributions 107,757,217 —415ExcessBenefitArrangement 246,332 —
OtherPostEmploymentBenefitExpense 7,734,365 —HealthCareClaims — 1,538,211,599Less:HealthCarePremiumsPaidbyRetirees(Note1) — (499,057,861)HealthCareClaimsProcessing — 37,420,201InsurancePremiumPayments — 51,410,469AffordableCareActFees — 30,832,642FundsPaidtoOthers — —AdministrativeExpenses,ExcludingInvestingActivityExpenses
SalariesandWages 31,366,860 2,279,916PayrollRelatedCosts 608,583 636,255ProfessionalFeesandServices 6,537,419 2,056,684Travel 150,305 47,632MaterialsandSupplies 4,063,969 707,503CommunicationsandUtilities 803,628 90,667RepairsandMaintenance 2,849,252 427,408RentalsandLeases 374,584 79,908PrintingandReproduction 114,780 18,435DepreciationExpense 2,636,125 —AmortizationExpense 10,299,336 —Gain/LossonCapitalAssets — —OtherExpenses 7,331,039 724,202
TotalDeductions $ 11,579,878,972 $ 1,165,885,660
NetIncrease(Decrease)inNetPosition $ 7,438,046,168 $ 704,295,583
BeginningNetPositionRestrictedforPensionsandOtherPost-EmploymentBenefits $ 157,978,199,075 $ 1,292,022,349PriorPeriodAdjustments — —BeginningNetPosition,asRestated $ 157,978,199,075 $ 1,292,022,349
EndingNetPositionRestrictedforPensionsandOtherPost-EmploymentBenefits $ 165,416,245,243 $ 1,996,317,932
SeeaccompanyingNotestotheFinancialStatements.
BasicFinancialStatements
38 TeacherRetirementSystemofTexas2020ComprehensiveAnnualFinancialReport

(Continued)
TotalPensionandOtherPost-EmploymentBenefit(OPEB)TrustFunds CustodialFunds2020 2019 ChildSupportEmployeeDeductions
$ 10,972,292,168 $ 11,253,728,973 $ — 415,829,519 480,400,199 — 5,536,660 6,060,703 —
3,346,831 3,052,513 —
107,757,217 102,787,422 — 246,332 257,502 — 7,734,365 4,438,264 — 1,538,211,599 1,515,397,609 — (499,057,861) (517,965,033) — 37,420,201 38,982,314 — 51,410,469 71,794,507 — 30,832,642 5,886,524 — — — 73,834
33,646,776 29,612,513 — 1,244,838 1,755,244 — 8,594,103 10,557,113 — 197,937 303,275 — 4,771,472 3,018,722 — 894,295 1,579,623 — 3,276,660 2,564,202 — 454,492 402,632 — 133,215 244,588 — 2,636,125 2,449,013 — 10,299,336 12,133,546 — — (893) — 8,055,241 1,872,296 —$ 12,745,764,632 $ 13,031,313,371 $ 73,834
$ 8,142,341,751 $ 3,898,476,310 $ —
$ 159,270,221,424 $ 155,367,476,466 $ — — 4,268,648 —$ 159,270,221,424 $ 155,371,745,114 $ —
$ 167,412,563,175 $ 159,270,221,424 $ —
FinancialSection
39 TeacherRetirementSystemofTexas2020ComprehensiveAnnualFinancialReport

ExhibitIII
StatementofNetPosition
ProprietaryFunds
AsofAugust31,2020(WithComparativeDataasofAugust31,2019)
EnterpriseFunds-MajorTRS-ActiveCare
2020 2019
AssetsCurrentAssets
CashCashInStateTreasury $ 368,971,478 $ 354,492,676CashOnHand — —TotalCash $ 368,971,478 $ 354,492,676
ReceivablesInterest $ 1,667,199 $ 1,402,451HealthCarePremiums — —COBRAPremiumsandOther 59,867,660 58,201,031TotalReceivables $ 61,534,859 $ 59,603,482
TotalAssets $ 430,506,337 $ 414,096,158
Liabilities(Note1F)
CurrentLiabilitiesAccountsPayable $ 31,528,523 $ 9,441,177PayrollPayable 54,938 231,592FeesPayable 952,996 1,043,296PremiumsPayabletoHMOs — 19,889,074HealthCareClaimsPayable 228,723,434 216,386,981EmployeeCompensableAbsencesPayable(Note4) 30,461 72,420TotalCurrentLiabilities $ 261,290,352 $ 247,064,540
Non-CurrentLiabilitiesEmployeeCompensableAbsencesPayable(Note4) $ 22,045 $ 187,671TotalNon-CurrentLiabilities $ 22,045 $ 187,671
TotalLiabilities $ 261,312,397 $ 247,252,211
DeferredInflowofResourcesDeferredRevenue-SchoolDistricts $ 894,596 $ 1,890,716TotalDeferredInflowofResources $ 894,596 $ 1,890,716
NetPositionRestrictedforHealthCarePrograms $ 168,299,344 $ 164,953,231TotalNetPosition $ 168,299,344 $ 164,953,231
SeeaccompanyingNotestotheFinancialStatements.
BasicFinancialStatements
40 TeacherRetirementSystemofTexas2020ComprehensiveAnnualFinancialReport
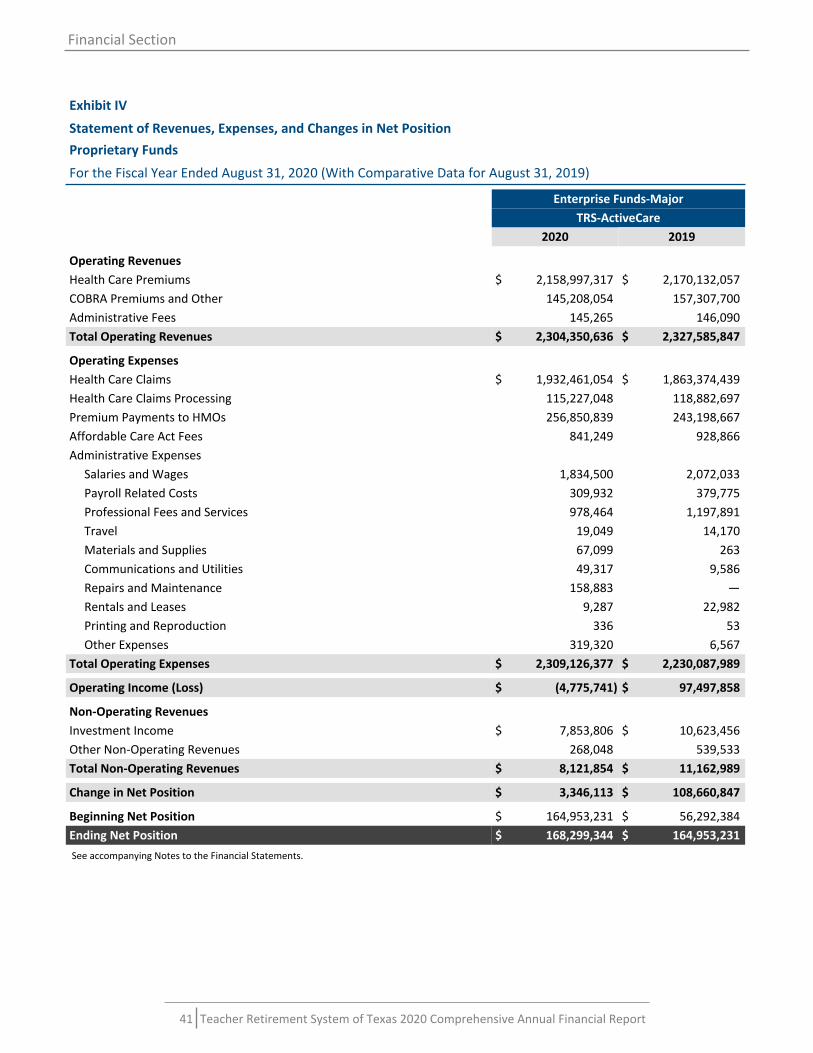
ExhibitIV
StatementofRevenues,Expenses,andChangesinNetPosition
ProprietaryFunds
FortheFiscalYearEndedAugust31,2020(WithComparativeDataforAugust31,2019)
EnterpriseFunds-MajorTRS-ActiveCare
2020 2019
OperatingRevenuesHealthCarePremiums $ 2,158,997,317 $ 2,170,132,057COBRAPremiumsandOther 145,208,054 157,307,700AdministrativeFees 145,265 146,090TotalOperatingRevenues $ 2,304,350,636 $ 2,327,585,847
OperatingExpensesHealthCareClaims $ 1,932,461,054 $ 1,863,374,439HealthCareClaimsProcessing 115,227,048 118,882,697PremiumPaymentstoHMOs 256,850,839 243,198,667AffordableCareActFees 841,249 928,866AdministrativeExpenses
SalariesandWages 1,834,500 2,072,033PayrollRelatedCosts 309,932 379,775ProfessionalFeesandServices 978,464 1,197,891Travel 19,049 14,170MaterialsandSupplies 67,099 263CommunicationsandUtilities 49,317 9,586RepairsandMaintenance 158,883 —RentalsandLeases 9,287 22,982PrintingandReproduction 336 53OtherExpenses 319,320 6,567
TotalOperatingExpenses $ 2,309,126,377 $ 2,230,087,989
OperatingIncome(Loss) $ (4,775,741)$ 97,497,858
Non-OperatingRevenuesInvestmentIncome $ 7,853,806 $ 10,623,456OtherNon-OperatingRevenues 268,048 539,533TotalNon-OperatingRevenues $ 8,121,854 $ 11,162,989
ChangeinNetPosition $ 3,346,113 $ 108,660,847
BeginningNetPosition $ 164,953,231 $ 56,292,384EndingNetPosition $ 168,299,344 $ 164,953,231
SeeaccompanyingNotestotheFinancialStatements.
FinancialSection
41 TeacherRetirementSystemofTexas2020ComprehensiveAnnualFinancialReport

ExhibitV
StatementofCashFlows
ProprietaryFunds
FortheFiscalYearEndedAugust31,2020(WithComparativeDataforAugust31,2019)
EnterpriseFunds-MajorTRS-ActiveCare
2020 2019
CashFlowsfromOperatingActivitiesReceiptsfromHealthCarePremiums $ 2,158,001,197 $ 2,178,892,340ReceiptsfromCOBRAPremiumsandOther 143,541,426 153,104,257ReceiptsfromLong-TermCareAdministrativeFees 145,265 146,090PaymentsforAdministrativeExpenses 17,956,920 5,748,993PaymentsforHealthCareClaims (1,920,124,602) (1,921,329,495)PaymentsforHealthCareClaimsProcessing (115,227,048) (118,882,697)PaymentsforHMOPremiums (276,739,913) (242,700,044)PaymentsforAffordableCareActFees (931,549) (921,570)NetCashProvided(Used)byOperatingActivities $ 6,621,696 $ 54,057,874
CashFlowsfromNon-CapitalFinancingActivitiesProceedsfromOtherNon-OperatingRevenues $ 268,048 $ 539,533NetCashProvided(Used)byNon-CapitalFinancingActivities $ 268,048 $ 539,533
CashFlowsfromInvestingActivitiesInterestReceived $ 7,589,058 $ 9,838,595NetCashProvided(Used)byInvestingActivities $ 7,589,058 $ 9,838,595
NetIncrease(Decrease)inCash $ 14,478,802 $ 64,436,002
BeginningCashandCashEquivalents $ 354,492,676 $ 290,056,674EndingCashandCashEquivalents $ 368,971,478 $ 354,492,676
SeeaccompanyingNotestotheFinancialStatements.
BasicFinancialStatements
42 TeacherRetirementSystemofTexas2020ComprehensiveAnnualFinancialReport

ExhibitV
StatementofCashFlows
ProprietaryFunds
FortheFiscalYearEndedAugust31,2020(WithComparativeDataforAugust31,2019)
EnterpriseFunds-MajorTRS-ActiveCare
2020 2019
ReconciliationofOperatingIncome(Loss)toNetCashProvided(Used)byOperatingActivities
OperatingIncome(Loss) $ (4,775,741)$ 97,497,858
AdjustmentstoReconcileOperatingIncome(Loss)toNetCashProvided(Used)byOperatingActivitiesChangesinAssets&Liabilities(Increase)DecreaseinHealthCarePremiumReceivables $ (996,120)$ 8,760,283(Increase)DecreaseinCOBRAPremiumsandOtherReceivables (1,666,628) (4,203,443)Increase(Decrease)inPremiumsPayabletoHMOs (19,889,074) 498,623Increase(Decrease)inHealthCareClaimsPayable 12,336,452 (57,955,056)Increase(Decrease)inAffordableCareActFeesPayable (90,300) 7,296Increase(Decrease)inAccountsPayable 22,087,346 9,327,892Increase(Decrease)inPayrollPayable (176,654) 47,476Increase(Decrease)inEmployeeCompensableAbsencesPayable (207,585) 76,945TotalAdjustments $ 11,397,437 $ (43,439,984)
NetCashProvided(Used)byOperatingActivities $ 6,621,696 $ 54,057,874SeeaccompanyingNotestotheFinancialStatements.
FinancialSection
43 TeacherRetirementSystemofTexas2020ComprehensiveAnnualFinancialReport

Thispageisintentionallyleftblank.
44 TeacherRetirementSystemofTexas2020ComprehensiveAnnualFinancialReport

NotestotheFinancialStatements
Note1: SummaryofSignificantAccountingPolicies.............................................................. 46Note2: CapitalAssets............................................................................................................. 50Note3: DepositsandInvestments......................................................................................... 52Note4: EmployeeCompensableLeave.................................................................................. 72Note5: OperatingLeases....................................................................................................... 72Note6: FringeBenefitsPaidbytheStateofTexasandtheFederalGovernment................. 72Note7: ContingentLiabilities................................................................................................. 72Note8: ContinuanceSubjecttoReview................................................................................. 73Note9: OtherPost-EmploymentBenefits(OPEB)-TRS-Care................................................ 73Note10: OtherPost-EmploymentBenefits(OPEB)-TRSEmployees....................................... 77Note11: TRSPensionPlan........................................................................................................ 80Note12: RiskManagement...................................................................................................... 84Note13: ComponentUnits....................................................................................................... 84
FinancialSection
45 TeacherRetirementSystemofTexas2020ComprehensiveAnnualFinancialReport

Note1:SummaryofSignificant
AccountingPolicies
A.ReportingEntity
The Teacher Retirement System of Texas (TRS orSystem) is a separate legal entity and considered adiscretecomponentunitof theStateofTexas. TheSystem is governed by a nine member board oftrustees which has significant independence in theoperationandmanagementoftheSystemundertheprovisions of the state constitution and laws. Thetrustees serve staggered six-year terms that expireon August 31 of odd numbered years and are allappointed by the Governor pursuant to TexasGovernment Code Title 8, Subtitle C, Chapter 825.Thetrusteesareappointedasfollows:
• ThreedirectappointmentsbytheGovernor
• Twoappointments froma listnominatedbytheStateBoardofEducation
• Two appointments from three activemember candidates from a public school,charter school, regional service center,nominatedbymembersofthosedistricts
• One appointment from three retiredmember candidates nominated by TRSretirees
• One at-large appointment selected fromthree candidates nominated from activemembers of any public or charter school,regional service center, institute of higherlearning,orfromTRSretirees
Thestate legislatureconfirmstrusteesappointedbythe governor, establishes laws with regard tostructure,benefitsandcontributions,andauthorizesPension Trust Fund administrative expenses. StatecontributionsandappropriationsreceivedbyTRSaredeterminedbythelegislature.
This report includes all activities and programs forwhich TRS exercises fiscal control and responsibilityand includes all funds that comprise the System'slegalentity.
TRS administers retirement and related benefits toemployeesandbeneficiariesofemployeesofpublic,state-supported,educationalinstitutionsofTexas.ItoperatesprimarilyundertheprovisionsoftheTexasConstitution, Article XVI, Section 67 and TexasGovernment Code, Title 8, Subtitle C. The PensionTrust Fund is a multiple-employer, cost-sharing,
defined benefit pension planwith a special fundingsituation that is a qualified pension trust underSection401(a)oftheInternalRevenueCode.
The System administers the Texas Public SchoolRetiredEmployeesGroupInsuranceProgramandtheTexas Active School Employees Uniform GroupBenefits Program. These programs provide twoseparate health care plans, TRS-Care and TRS-ActiveCare,respectively.
TRS-Care is considered an employee benefit trustfund and provides health care coverage for certainpersons, and their dependents, who retire underTRS. The statutory authority for the program isTexas Insurance Code, Title 8, Subtitle H, Chapter1575andTexasAdministrativeCode,Title34,Part3,Chapter41.Theinceptionoftheplanwasfiscalyear1986.
TRS-ActiveCare provides health care coverage toemployees, and their dependents, of participatingpublic education entities. Optional life and long-term care insurance, which are provided to activemembersandretirees,arealsoaccountedforinthefund. Authority for the plan can be found in theTexas Insurance Code, Title 8, Subtitle H, Chapter1579andintheTexasAdministrativeCode,Title34,Part 3, Chapter 41. The plan began operations onSeptember1,2002.
The System administered a 403(b) AdministrativeProgram in which companies were required to becertified by TRS to offer qualified investmentproducts to public education employees throughpayroll deductions in accordance with InternalRevenueCodesection403(b).InMay2019,the86thTexas Legislature passed House Bill 2820 removingthe System as the program administrator effectiveAugust31,2019.
ACustodialFundisusedtoaccountforgarnishmentsof salaries and wages for child support paymentsfromTRSemployees.
B. Measurement Focus, Basis of Accounting, andBasisofPresentation
TheSystem'saccountsareorganizedonthebasisoffunds, each of which is considered a separateaccountingentity. Theoperationsofeach fundareaccounted for with a self-balancing set of accountsthat comprise its assets, liabilities, additions/revenues and deductions/expenses. The followingfund types are used to reflect the System'stransactions:
NotestotheFinancialStatements
46 TeacherRetirementSystemofTexas2020ComprehensiveAnnualFinancialReport

• Fiduciary Funds include the Pension TrustFund, TRS-Care (employee benefits trustfund),andtheCustodialFund.
• Proprietary Funds include TRS-ActiveCarewhich isanEnterprisefund. TRS-ActiveCareisconsideredamajorfund.
Fiduciary funds are used to report assets held in atrustee or custodial capacity for others. Thereportingfocusisonnetpositionandchangesinnetposition. The pension and other post-employmentbenefittrustfundsareusedtoreportresourcesheldin trust for the members and beneficiaries of thedefined benefit pension plan and the other post-employmentbenefitplan.CustodialfundsareatypeoffiduciaryfundusedtoreportassetscollectedandtransferredtotheStateorotherentities. Custodialfunds do not measure the results of operations.Assets and liabilities are recorded using the accrualbasisofaccounting.
Enterprisefundsareatypeofproprietaryfundusedto report any activity forwhich a fee is charged toexternal users for goods or services. The reportingfocus is on the determination of operating income,changes innetposition, financial position, and cashflows. Proprietary funds distinguish operatingactivities from non-operating. Operating activitiesgenerally result from providing services andproducing or delivering goods. Operating revenuesfor the System's proprietary fund is derived fromself-insurance premiums. Operating expensesincludethecostsofclaimsandrelatedadministrativeexpenses.Non-operatingrevenuesandexpensesarethose items that do not meet any of the abovedefinitions.
Separate financial statementsareprovided foreachfund. The fiduciary, excluding custodial funds, andproprietary financial statements are reported usingtheeconomicresourcesmeasurementfocusandtheaccrualbasisofaccounting.Additionsarerecognizedwhen earned, and deductions are recognizedwhenthe liability is incurred, regardless of the timing ofrelated cash flows. Contributions are recognized inthe period in which amounts are due, pursuant tostatelaw.Benefitsandrefundsofcontributionsarerecognized when due and payable in accordancewiththetermsoftheplan. Alleconomicresources,including financial and capital assets, and relatedliabilities, both current and long-term, and thechangesthereinarereportedineachfunds'financialstatements.
C.NewAccountingPronouncements
The accompanying financial statements wereprepared in conformity with generally acceptedaccounting principles (GAAP) as prescribed by theGovernmental Accounting Standards Board (GASB).GASB issuedthe followingstatements that relate toTRS.
GASB StatementNo. 84, Fiduciary Activities, relatesto custodial fundsused to report fiduciaryactivitiesthatarenotrequiredtobereportedinpensionandotherpost-employmentbenefittrustfunds.TRShascustodial funds that represent child supportgarnishments that are remitted to the appropriateagency. This is the only item that is subject to thisstatement.
GASB StatementNo. 92.Omnibus 2020,was issuedJanuary 2020 with relevant requirements effectiveupon issuance. The Standard enhances compara-bility in accounting and financial reporting andimproves theconsistencyofauthoritative literature.The requirements of this statement were imple-mentedbyTRSthisfiscalyear.
GASB Statement No. 95, Postponement of theEffective Dates of Certain Authoritative Guidance,relatestoprovidingtemporaryrelieftogovernmentsand other stakeholders in light of the COVID-19pandemic.
GASB Statement No. 97, Certain Component UnitCriteria, relates to determining whether a primarygovernmentisfinanciallyaccountableforcomponentunits. TRS was already in compliance with thisstandardbeforeitwasissued.
D.ComparativeDatainTotal
The basic financial statements include certain prioryear summarized comparative data in total but notat the level of detail required for a presentation inconformity with generally accepted accountingprinciples. Accordingly, such information shouldberead in conjunction with the System's financialstatementsforthefiscalyearendedAugust31,2019,from which the summarized information wasderived.
E.BudgetsandAppropriations
Theadministrativecostsandcapitalassetoutlayforeach of the System's funds and programs arecontrolledbyannualbudgetsapprovedbytheBoardofTrustees.
FinancialSection
47 TeacherRetirementSystemofTexas2020ComprehensiveAnnualFinancialReport

ThePensionTrustFund receives statecontributionsfrom the Texas Legislature's general revenueappropriations for retirement benefits for activemembersemployedbyaparticipatingemployer. Infiscal year 2020, contributions were made by theState of Texas to the System at the rate of 7.5percent of the pensionable compensation paid toactivemembersforeachyear.
Although appropriated by the legislature, expensesforthePensionTrustFundadministrativeoperationsand capital expenditures are paid from the PensionTrustFundandnotfromtheState'sGeneralFund.
TRS-Care received contributions from the State'sGeneral Fundequal to1.25percentof salariespaidto public education employees in fiscal year 2020.Administrative expenses for this program are paidfromthetrustfund.
The 86th Texas legislature enacted SB1264 thatappropriated funding to TRS-Care for consumerprotectionagainstmedicalandhealthcarebillingbyout-of-network providers. $2,208,137.00 for fiscalyear2020and$3,312,206.00forfiscalyear2021willbefundedinfiscalyear2021.
TRS-ActiveCare is an Enterprise Fund supported byfees and receives no appropriations from the Stateforadministrativeexpenses.
TRS administers a governmental excess benefitarrangement under section 415(m) of the InternalRevenueCodeof1986(26U.S.C.).Authorizedundertheprovisionsof the TexasGovernmentCode, Title8,SubtitleC,Section825.517,thisprogramcreatedaseparate, non-qualified, unfunded excess benefitarrangementoutside thePension Trust Fundof theretirementsystem.
Contributionstotheexcessbenefitarrangementaremade from the State's general revenueappropriations. Thesecontributionsarenotheld intrust andmaynotbe commingledwithother fundsoftheretirementsystem.Theyyieldnonetposition.Therefore, for reporting purposes, only thecontributionsandbenefitsarereflectedonExhibitII,StatementofChangesinFiduciaryNetPosition.
F.Assets,Liabilities,andLegalReserves
CashandCashEquivalents
Cashandcashequivalents include investmentswithanoriginalmaturityofthreemonthsorlessthatareused for cash management instead of investingactivities.
Highlyliquidassetsofashort-terminvestmentfundarenotconsideredcashequivalents.
Receivables
ReceivablesrepresenttheamountofmoneyowedtoTRSforgoodsorservicesdeliveredorusedthathavenotbeenreceivedatfiscalyear-end.
• Sale of Investments receivables occurwhenthe trade date is before the fiscal year-endand thesettlementdate is in thenext fiscalyear.
• InterestandDividendsreceivablesrepresentdistributions of income made on bankaccounts and other investments that TRSearned inthecurrentfiscalyearbutdidnotreceiveuntilafterfiscalyear-end.
• Member and Retiree receivables representcontributionsthatareduefrommembersforthecurrentfiscalyearbutnotreceiveduntilafterfiscalyear-end.
• Service Credit Purchase receivablesrepresenttheoutstandingbalanceduefrommembers on service credit purchaseinstallment contracts at fiscal year-end.Payments can bemade on amonthly basisforuptofiveyearsforpurchasingadditionalcreditable service. Receivables arerecognizedwhenanagreementissigned.
• Due from State's General Fund representsamounts owed to TRS for contributions notreceivedatfiscalyear-end.
• Due from Employers receivables representcontributionsthatareduefromparticipatingemployersforthecurrentfiscalyearbutnotreceiveduntilafterfiscalyear-end.
• Due from Employees Retirement System(ERS) of Texas receivables represent ERS'share of current year retirement benefitsthat are due to TRS for retirees' serviceearnedfromERS.
• Prepaid Expenses and Deposits receivablesrepresent refundable security deposits paidon lease agreements that TRS has enteredinto.
• Other Receivables represent amounts owedtoTRSsuchasrefundorannuityrepaymentsdueat fiscalyear-endbutnot receiveduntilthenextfiscalyear.
NotestotheFinancialStatements
48 TeacherRetirementSystemofTexas2020ComprehensiveAnnualFinancialReport

Investments
Investmentsarereportedatfairvalue.Fairvalueisamarket-based measurement, not an entity-specificmeasurement.Itisthepricethatwouldbereceivedto sell an asset or paid to transfer a liability in anorderly transaction between market participants atthemeasurementdate.
Measurement,recognition,ordisclosureofanassetor liability depends on the aggregation or disag-gregation of the unit of account of the asset orliability. TRS utilizes one or more of the followingvaluationtechniques inordertomeasurefairvalue:the market approach, the cost approach, and theincome approach. TRS has investments that havevaluesnotbasedonquotedmarketprices.
CapitalAssets
Capital assets associated with the funds' activitiesare included in the Statement of Net Position.Purchasesofcapitalassetsbythefundarereportedat cost on the acquisition date. Donated capitalassets, donatedworks of art, and similar items arereported at acquisition value. Depreciation of allexhaustible capital assets is charged as an expenseagainst the fund's operations. Depreciation is cal-culated using the straight-line method over theasset'susefullife.Note2includesatableidentifyingthecapitalizationthresholdandestimatedusefullifebyassettype.
DeferredOutflowofResources
Deferred outflow of resources represent aconsumption of net assets that applies to a futureperiodandwillnotberecognizedasanexpenseuntilthatfutureperiod.
• Related to Participation in ERS' Other Post-EmploymentBenefit (OPEB)plan representsamounts for OPEB expenses that will berecognizedinfutureperiods.SeeNote10.
Liabilities
• AccountsPayablerepresentstheliabilitythatexists at year-end for goods and servicesreceived for which payment has not beenmade.
• Payroll Payable represents the liability foremployeesalariesthatisdueandpayableatfiscalyear-end.
• InvestmentFeesPayablerepresentfeesdueto external investment managers and the
custodian bank that are due at fiscal year-end.
• Benefits Payable represent the liability forretirement,disability,anddeathbenefitsdueat fiscal year-end and payable within thenext30days.
• Health Care Claims Payable includes anestimate forhealthcareclaims incurredbutnot reported to the System at fiscal year-end.
• Fees Payable represent health insuranceproviderfeespayableatfiscalyear-end.
• NetOtherPost-EmploymentBenefitLiabilityrepresents TRS' share of the ERS plan netOPEBliability.
• Investments Purchased Payable representthe liability for securitiespurchasedprior tofiscal year-end for which payment has notbeenmade. Foreigninvestmentspurchasedpayable is reported at current exchangerates.
• SecuritiesSoldShortrepresentobligationstodeliver securitieswhich includeEquitiesandRights.
• Collateral Obligations represent cashcollateral received from borrowers forderivative instruments and the securitieslendingprogram.
• Due to State's General Fund representsamounts owed to the State for excesscontributionsreceivedatfiscalyear-end.
• Due to Employees Retirement System ofTexas represents amountsowed for currentyear retirement benefits due to ERS forretirees'serviceearnedfromTRS.
• Employee Compensable Absences Payablerepresents amountsowed to employees forcompensatorytimeunpaidatfiscalyear-end.
• Other Liabilities represent taxes payable bythe blended component unit, TeacherRetirement Investment Company of Texas,Ltd.(TRICOT)atfiscalyear-end.SeeNote13.
DeferredInflowofResources
Deferred Inflow of Resources represent an acquis-itionofnetassetsthatappliestoafutureperiodand
FinancialSection
49 TeacherRetirementSystemofTexas2020ComprehensiveAnnualFinancialReport
will not be recognized as income until that futureperiod.
• Unrealized Lease Incentives representamounts for lease incentivesgrantedtoTRSat the inceptionofa leasethat isamortizedoverfutureperiods.
• UnearnedRevenuerepresentspayments forfuture contributions received during thefiscalyear.
• Related to Participation in ERS' OPEB Planrepresentsamounts forOPEB revenues thatwill be recognized in future periods. SeeNote10.
Interfund/InteragencyTransactionsandBalances
The Pension Trust Fund provides variousadministrative services to other TRS programs andaccounts for these services as reciprocal interfundactivity. These transactions are reported using theappropriate classification accounts for additions/revenues or deductions/expenses as if transactedwith parties external to the State. They are notpresented as transfers. The interfund receivablesandpayables related to reciprocal interfundactivityareclassifiedasreceivablesandaccountspayableonthefinancialstatements.
lnteragency transactions have been classified usingtheabovecriteriaforreciprocalinterfundactivity.
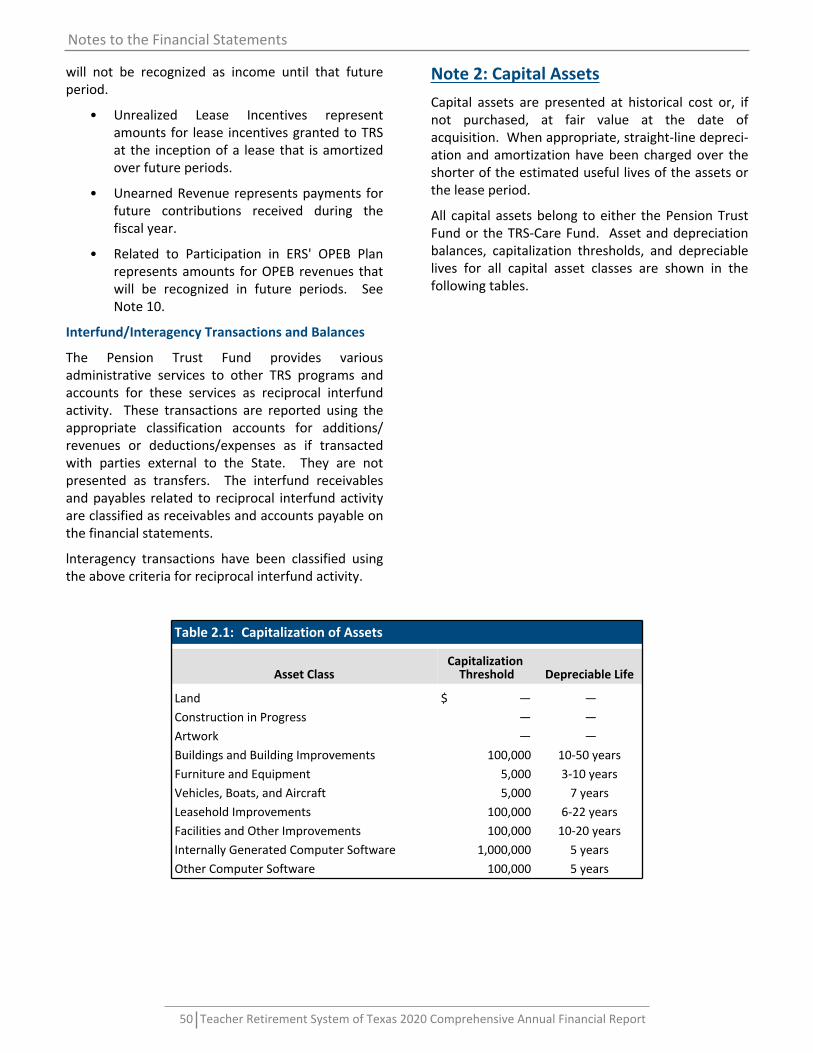
Note2:CapitalAssets
Capital assets are presented at historical cost or, ifnot purchased, at fair value at the date ofacquisition.Whenappropriate,straight-linedepreci-ationandamortizationhavebeen chargedover theshorteroftheestimatedusefullivesoftheassetsortheleaseperiod.
All capital assetsbelong toeither thePensionTrustFundor theTRS-CareFund. Assetanddepreciationbalances, capitalization thresholds, and depreciablelives for all capital asset classes are shown in thefollowingtables.
Table2.1: CapitalizationofAssets
AssetClassCapitalizationThreshold DepreciableLife
Land $ — —ConstructioninProgress — —Artwork — —BuildingsandBuildingImprovements 100,000 10-50yearsFurnitureandEquipment 5,000 3-10yearsVehicles,Boats,andAircraft 5,000 7yearsLeaseholdImprovements 100,000 6-22yearsFacilitiesandOtherImprovements 100,000 10-20yearsInternallyGeneratedComputerSoftware 1,000,000 5yearsOtherComputerSoftware 100,000 5years
NotestotheFinancialStatements
50 TeacherRetirementSystemofTexas2020ComprehensiveAnnualFinancialReport

Table2.2: CapitalAssetActivity
AssetClassBalance9/1/2019 Adjustments
Reclasses&CompletedCIP Additions Deletions
Balance8/31/2020(ExhibitI)
Non-DepreciableAssetsLandandLandImprovements $ 1,658,310 $ — $ — $ — $ — $ 1,658,310ConstructioninProgress 18,170,220 — — 3,870,538 — 22,040,758Artwork 124,136 — — — — 124,136TotalNon-DepreciableAssets $19,952,666 $ — $ — $ 3,870,538 $ — $ 23,823,204
DepreciableAssets
BuildingsandBuildingImprovements $43,048,735 $ — $ — $ — $ — $ 43,048,735FurnitureandEquipment 12,799,558 — — 1,357,285 — 14,156,843Vehicle,Boats,andAircraft 47,113 — — — — 47,113LeaseholdImprovements 3,712,318 — — — — 3,712,318
FacilitiesandOtherImprovements 642,082 — — — — 642,082TotalDepreciableAssets $60,249,806 $ — $ — $ 1,357,285 $ — $ 61,607,091
AccumulatedDepreciation
BuildingsandBuildingImprovements $(24,902,168)$ — $ — $ (1,425,005)$ — $(26,327,173)FurnitureandEquipment (9,439,578) — — (1,165,974) — (10,605,552)Vehicles,Boats,andAircraft (38,293) — — (6,232) — (44,525)LeaseholdImprovements (3,180,618) (28,006) — (3,208,624)
FacilitiesandOtherImprovements (316,464) — — (49,285) — (365,749)
TotalAccumulatedDepreciation $(37,877,121)$ — $ — $ (2,674,502)$ — $(40,551,623)
TotalNetDepreciableAssets $22,372,685 $ — $ — $ (1,317,217)$ — $ 21,055,468
IntangibleAssetsComputerSoftware $55,247,353 $ (579,132)$ — $ — $ — $ 54,668,221TotalIntangibleAssets $55,247,353 $ (579,132)$ — $ — $ — $ 54,668,221
AccumulatedAmortizationComputerSoftware $(22,376,923)$ 353,277 $ — $(10,652,613)$ — $(32,676,259)
TotalAccumulatedAmortization $(22,376,923)$ 353,277 $ — $(10,652,613)$ — $(32,676,259)
TotalNetIntangibleAssets $32,870,430 $ (225,855)$ — $(10,652,613)$ — $ 21,991,962
TotalNetCapitalAssets $75,195,781 $ (225,855)$ — $ (8,099,292)$ — $ 66,870,634
FinancialSection
51 TeacherRetirementSystemofTexas2020ComprehensiveAnnualFinancialReport

Note3:DepositsandInvestments
A.InvestmentPolicyandTargetAssetAllocation
The Board of Trustees has the primary fiduciaryresponsibility for investing TRS trust assets inaccordancewithArticleXVI,Section67oftheTexasConstitution and with applicable law. The Boardadopts the Investment Policy Statement whichestablishesinvestmentobjectivesandpolicy,obtainsexpert advice and assistance, and oversees theemployment of a qualified and competentinvestment staff (InvestmentManagementDivision)andlegalstaff.TheBoardalsomonitorstheactionsof staff, consultants, and advisors to ensurecompliancewithitspolicies.ThecurrentInvestmentPolicyStatementhasbeenineffectsinceOctober1,2019, and there were no significant investmentpolicychangesduringthereportingperiod. For thefiscal year ended August 31, 2020, there were nosignificant violations of state statute, investmentpolicy, or contractual provisions. The Statement initsentiretycanbeaccessedatwww.trs.texas.gov.
Thetotaloroverall investmentportfolio includesallassetsinvestedbyTRStoprovideretirement,death,health, and disability benefits administered by theSystem, and is structured and managed to achievethefollowingobjectives:
a. Controlriskthroughproperdiversificationofasset classes and by establishing long-termriskandreturnexpectations;and
b. Asapplicable to thepensionplan,achievealong-termrateofreturnthat:
i. Exceeds the assumed actuarial rate ofreturnadoptedbytheBoard;
ii. Exceeds the long-term rate of inflationbyanannualized5percent;and
iii. Exceeds the return of the Fund PolicyBenchmark.
Categories of permissible investments include cashequivalents, debt securities, private markets,derivative instruments, mutual funds, closed-endfunds, publicly traded or Rule 144A assets, andcommingledfunds.Thetargetassetallocation,long-term expected real rate of return, and expectedcontribution to long-termportfolio returns by assetclasssetforth inthe InvestmentPolicyStatement isshownasofAugust31,2020
NotestotheFinancialStatements
52 TeacherRetirementSystemofTexas2020ComprehensiveAnnualFinancialReport

Table3.A.1: AssetAllocations
AssetClassTargetAllocation1
%
Long-TermExpected
GeometricRealRateofReturn2
ExpectedContributiontoLong-
TermPortfolioReturns
GlobalEquityUSA 18.0% 3.9% 0.99%Non-U.S.Developed 13.0 5.1 0.92EmergingMarkets 9.0 5.6 0.83PrivateEquity 14.0 6.7 1.41
StableValueGovernmentBonds 16.0% (0.7)% (0.05)%
AbsoluteReturn(IncludingCreditSensitiveInvestments) — 1.8 —
StableValueHedgeFunds 5.0 1.9 0.11
RealReturnRealEstate 15.0% 4.6% 1.02%
Energy,NaturalResources,andInfrastructure 6.0 6.0 0.42
Commodities — 0.8 —
RiskParityRiskParity 8.0% 3.0% 0.30%
AssetAllocationLeverageCash 2.0% (1.5)% (0.03)%AssetAllocationLeverage (6.0) (1.3) 0.08
InflationExpectation 2.00%VolatilityDrag3 (0.67)%ExpectedReturn 100.0% 7.33%1TargetallocationsarebasedontheFY2020policymodel.2CapitalMarketAssumptionscomefromAonHewitt(asof08/31/2020).3Thevolatilitydragresultsfromtheconversionbetweenarithmeticandgeometricmeanreturns.
ForthefiscalyearendedAugust31,2020,theannualmoney-weighted rate of return on pension planinvestments was 7.2 percent. The annual money-weighted rate of return expresses investmentperformance, net of investment expense, adjustedforthechangingamountsactuallyinvested.
B.CashandDeposits
Cash and deposits of the System aremaintained inbank accounts and in the State of Texas Treasury.The Treasury invests funds in time deposits,repurchaseandreverserepurchaseagreements,
obligations of the United States government, andobligations of federal credit organizations. TheTreasury has an arrangement with financialinstitutionstocollateralizestatedepositsinexcessofdepository insurance. As of August 31, 2020. Thecarrying amount of the system's bank accountstotaled $320,110,687, the bank balance totaled$320,110,883,andcashonhandtotaled$7,092,327.
FinancialSection
53 TeacherRetirementSystemofTexas2020ComprehensiveAnnualFinancialReport

C.Investments
The chart below presents net investments of theSystem (excluding securities lending collateral andobligations) allocated based on investmentclassificationswithin theStatementofFiduciaryNetPositionasofJune30,2020.
AssetAllocationofInvestmentsbasedontheStatementofFiduciaryNetPosition*
FixedIncomeInvestments:13.7%
PooledInvestments:9.8%
ShortTermInvestments:5.5%
DerivativeInstruments**:0.3%
AlternativeInvestments:43.5%
EquityInvestments:27.2%
*AnoverviewofeachinvestmenttypeisprovidedinNote3.C.oftheNotestotheFinancialStatementsincludingthefairvalueofeachcomponent.
**Derivativeinstrumentsarereportedonanetbasisinthechartabove.PleaserefertoNote3.D.oftheNotestotheFinancialStatementsformoreinformation.
FairValueMeasurementTechniques
Fairvaluemaximizes theuseof relevantobservableinputsandminimizestheuseofunobservableinputs.A fair value hierarchy prioritizes the inputs tovaluation techniques used to measure fair value,assigning the highest priority to unadjusted quotedprices in active markets for identical assets orliabilities (Level 1) and the lowest priority tounobservable inputs (Level 3). A financialinstrument's level within the fair value hierarchy isbased on the lowest level of any input that issignificanttothefairvaluemeasurement.Fairvalueinputsarecategorizedintothefollowingthreelevels:
• Level1-Quotedprices(unadjusted)inactivemarketsforidenticalassetsorliabilitiesthatcan be accessed at the System'smeasurementdate;
• Level 2 - Inputs other than quoted pricesincludedwithin Level 1 that are observablefor an asset or liability, either directly orindirectly;
• Level3-Unobservableinputsforanassetorliability.
NotestotheFinancialStatements
54 TeacherRetirementSystemofTexas2020ComprehensiveAnnualFinancialReport

For investments that do not have a readilydeterminable fair value and fall outside of the fairvaluehierarchy,theSystemestablishesfairvaluebyutilizingtheNetAssetValuePerShare(NAVPS),oritsequivalent, as a practical expedient, provided all ofthefollowingcriteriaaremet:
• Fairvalueisnotreadilydeterminable;
• TheNAVPSiscalculatedconsistentlywiththeFinancial Accounting Standards Board'smeasurement principles for investmentcompanies (Accounting and StandardsCodificationTopic946);
• TheNAVPSrepresentsaproportionateshareofthenetassetstowhichitisattributed;
• AndtheNAVPSisprovidedbytheinvestee.
TheSystemobtainstheNAVPSfromthemostrecentcapital account statement or audited financialstatement issued by a General Partner or FundAdministrator. If either statement's fiscal year-enddoesnotcoincidewith theSystem's fiscalyear-end,the NAVPS is adjusted for any distributions orcontributions that occur subsequent to thestatement'smeasurementdatethroughtheSystem'sfiscalyear-end.
Short-TermInvestments
Short-Term Investments include Short-TermForeignCurrency Contracts, Short-Term Investment Funds(STIF), Short-TermCommingledFunds,andTreasuryBills.
Short-TermForeignCurrencyContractsarepricedatthespotrateinactivemarketsandvaluedatLevel1.U.S.TreasuryBillsarepricedatthelastsalepriceoftheprimaryexchangeandvaluedatLevel1.
The STIF is a 2a-7 like fund and is priced at theNAVPSbythecustodianbank,StateStreetBankandTrustCompany. Short-TermCommingledFundsarevaluedattheNAVPSbytheGeneralPartnerorFundAdministrator.
EquityInvestments
Equity Investments include both Domestic andInternationalEquities.
Equities priced at the last sale price in theirrespectiveactivemarketsarevaluedatLevel1.
Equitiesthatarenotactivelytradedandhaveastaleprice as of the System's measurement date arevaluedatLevel3.
FixedIncomeInvestments
Fixed Income Investments include Asset andMortgageBackedBonds,DomesticCorporateBonds,International Corporate Bonds, SovereignGovernment Issue Bonds, U.S. Government AgencyBonds, U.S. Treasury Bonds, U.S. Treasury STRIPS,andU.S.TIPS.
U.S. Treasury Bonds priced at the last sale price oftheprimaryexchangearevaluedatLevel1.
Fixed Income Investments priced using a bidevaluationmatrixpricingtechniquethat isbasedontheir relationship to non-proprietary index marketquotations, yields, maturities, call features, andratingsarevaluedatLevel2.
Corporate Bonds priced at Level 3 are valued by athirdparty.
AlternativeInvestments
Alternative Investments include Privately HeldEquity,PrivatelyHeldDebt,AbsoluteReturn,HedgeFunds,Energy,NaturalResourcesandInfrastructure,PrivateEquity,RealAssets,RiskParity.
PrivatelyHeldEquityandDebtarepricedbya thirdparty that uses a guideline market multiplesapproach and a sum of parts valuation analysis isvaluedatLevel3.
All other Alternative Investments are valued at theNAVPS by the General Partners or FundAdministrators.
DerivativeInstruments
Derivative Instruments include Forwards, Futures,Options,Rights, Swaps, andWarrants, and they areeitherexecutedonanexchangeorinabilateraldealin an over-the-counter (OTC) market with anInternational Swaps and Derivatives Association(ISDA)counterpartyasabroker.
DerivativeInstrumentspricedatthelastsalepriceintheirrespectiveactivemarketsarevaluedatLevel1.
DerivativeInstrumentthatarevaluedusingamatrixpricingtechniquethatarebasedontheirrelationshiptobenchmarkquotedpricesarevaluedatLevel2.
Derivative Instruments that are not actively tradedand have a stale price as of the System'smeasurementdatearevaluedatLevel3.
FinancialSection
55 TeacherRetirementSystemofTexas2020ComprehensiveAnnualFinancialReport

PooledInvestments
Pooled Investments include Commingled Equity,Commingled Fixed Income, and Mutual Funds andarepricedat theNAVPSby theGeneralPartnersorFundAdministrators.
OtherFairValueMeasurements
InvestedSecuritiesLendingCollateraliscomprisedofthe reinvested cash collateral received fromborrowers in the securities lending program, inaddition to the operating costs of the program.Securities priced at the last sale price in theirrespective active markets are valued at Level 1.Securitiespricedusingabidevaluationmatrixpricingtechniquethatisbasedontheirrelationshipstonon-proprietary index market quotations, yields,maturities, call features, and ratings are valued atLevel2.
SecuritiesSoldShortrepresentobligationstodeliversecuritieswhich include Equities and Rights. Theseobligations are priced at fair value at the last salepriceintheirrespectiveactivemarketsandvaluedatLevel1inthefairvaluehierarchy.
Fair Value Measurements and Unfunded Commit-ments
TherecurringfairvaluemeasurementoftheSystemasofAugust31,2020arereportedonthefollowingpage.
TheSystemmanagesunfundedcapitalcommitmentsthat it is legally obligated to fundwhen called by aGeneral Partner. Funding of committed capitaloccurs over an extended timeperiod andmay takeseveralyearsbeforethetotalallocationtoeachassetclass is fully invested. Because an individualinvestmentmaybegintoreturncapitaltothesystempriortothefullfundingofthesystem'scommitment,the outstanding invested capital of the investmentmight at times be substantially less than the totalcommitment.
TheSystem'sunfundedcapitalcommitmentbalanceispresentedasofAugust31,2020. Additionally,asofAugust31,2020,theSystemreportedanunfund-ed capital commitment balance of $1,439,873,003that has not yet been allocated to a specificAlternativeInvestmenttypeandanunfundedcapitalcommitment balance of $39,000,000 for externallymanagedfundsthatarenotreportedattheNAVPS.
AsofAugust31,2020,theSystemhasnoplanstosellinvestmentsforanamountdifferentfromtheNAVPS(oritsequivalent),andallinvestmentstobesoldhavebeenidentified.
NotestotheFinancialStatements
56 TeacherRetirementSystemofTexas2020ComprehensiveAnnualFinancialReport

Table3.C.1: FairValueMeasurement
InvestmentsandOtherItems TotalFairValue
QuotedPricesinActiveMarketsforIdenticalAssets
(Level1)
SignificantOtherObservableInputs
(Level2)
Significant
UnobservableInputs
(Level3)
Short-TermInvestments
Short-TermForeignCurrencyContracts $ 11,710 $ 11,710 $ — $ —
U.S.TreasuryBills 32,997,761 32,997,761 — —TotalShort-TermInvestments $ 33,009,471 $ 33,009,471 $ — $ —
EquityInvestmentsDomesticEquity $17,842,856,445 $ 17,842,818,527 $ — $ 37,918InternationalEquity 29,303,496,461 29,301,098,566 — 2,397,895TotalEquityInvestments $47,146,352,906 $ 47,143,917,093 $ — $ 2,435,813
FixedIncomeInvestmentsAssetandMortgageBackedBonds $ 100,813,749 $ — $ 100,813,749 $ —DomesticCorporateBonds 63,040,287 — 63,040,037 250InternationalCorporateBonds 27,655,607 — 27,655,607 —SovereignGovernmentIssueBonds 1,948,432,837 — 1,948,428,903 3,934U.S.GovernmentAgencyBonds 14,731,213 — 14,731,213 —U.S.TreasuryBonds 19,394,910,800 19,394,910,800 — —U.S.TreasurySTRIPS 35,876,575 — 35,876,575 —U.S.TIPS 2,227,276,026 — 2,227,276,026 —TotalFixedIncomeInvestments $23,812,737,094 $ 19,394,910,800 $ 4,417,822,110 $ 4,184
AlternativeInvestmentsPrivatelyHeldDebt $ 130,690,751 $ — $ — $ 130,690,751PrivatelyHeldEquity 703,853,780 — — 703,853,780TotalAlternativeInvestments $ 834,544,531 $ — $ — $ 834,544,531
DerivativeInstrumentsForwards $ (163,076,495)$ — $ (163,076,495)$ —Futures 559,470,486 559,470,486 — —Options (17,743,030) — (17,743,030) —Rights 81,018 74,305 — 6,713Swaps 129,681,884 — 129,681,884 —Warrants 14,611,375 2,555,655 — 12,055,720TotalDerivativeInstruments $ 523,025,238 $ 562,100,446 $ (51,137,641)$ 12,062,433
OtherFairValueMeasurements
InvestedSecuritiesLendingCollateral* $7,165,280,719 $ — $ 7,117,187,261 $ 48,093,458SecuritiesSoldShort (1,594,473,921) (1,594,407,263) — (66,658)
TotalOtherFairValueMeasurements $5,570,806,798 $ (1,594,407,263)$ 7,117,187,261 $ 48,026,800
Total $77,920,476,038 $ 65,539,530,547 $ 11,483,871,730 $ 897,073,761
*ExcludesreceivablesandpayablesrelatedtotheSecuritiesLendingPool.
FinancialSection
57 TeacherRetirementSystemofTexas2020ComprehensiveAnnualFinancialReport

Table3.C.2: NetAssetValueandUnfundedCapitalCommitments
InvestmentsNetAssetValuePerShare
(NAVPS)UnfundedCapitalCommitments
Short-TermInvestmentsShort-TermInvestmentFunds $ 9,356,108,619 $ —Short-TermCommingledFunds 81,348,794 —TotalShort-TermInvestments $ 9,437,457,413 $ —
AlternativeInvestmentsAbsoluteReturn $ 4,338,844,848 $ 2,836,848,500HedgeFunds 14,128,276,041 314,743,691
Energy,NaturalResources,andInfrastructure 8,032,651,549 6,526,871,795PrivateEquity 23,565,034,262 13,460,122,266RealEstate 21,708,595,774 14,573,997,967RiskParity 2,980,485,062 —TotalAlternativeInvestments $ 74,753,887,536 $ 37,712,584,219
PooledInvestmentsCommingledDomesticEquity $ 9,496,807,882 $ —CommingledFixedIncome 207,234,000 —CommingledInternationalEquity 6,709,522,987 —DomesticMutualFunds 648,135,148 —TotalPooledInvestments $ 17,061,700,017 $ —
Total $ 101,253,044,966 $ 37,712,584,219
SignificantInvestmentStrategies
The System achieves portfolio diversification byinvesting inavarietyofstrategies,geographies,andindustry sectors for investments reported at theNAVPS.
AbsoluteReturn
U.S. Investment Grade - Invests in U.S. dollar-denominatedinvestmentgradesecurities.
U.S.HighYield - Invests inU.S.dollar-denominated,high-yieldcorporatebondsissuedintheU.S.
U.S.Securitized/Structured-Investsinbondsbackedbysecurities.
Non-U.S.DevelopedFixedIncome-Primarilyinvestsin sovereign debt issued by developed countriesoutsideoftheU.S.
Emerging Market Debt - Invests in debt issued bycorporations or governments in emerging marketcountries.
Partnerships - Invests in fixed income relatedportfoliosmanagedbystrategicpartners.
Commingled Equity, Fixed Income, and MutualFunds
ExternalPublicTotalNon-U.S.Developed-Investsinlongpositions in equity securities aswell as certainderivative instruments in non-U.S. developedmarkets.
ExternalPublicTotalU.S.-Investsinlongpositionsinequity securities as well as certain derivativeinstrumentsinUSmarkets.
ExternalPublicTotalWorldEquity-InvestsinequitysecuritiesincountriesrepresentedintheMSCIACWIValueIndex,aswellascertainotherglobalmarkets.Instruments used include but are not limited toADRs, swaps, warrants, and other derivativeinstruments, money market instruments, andcurrencyforwardsand/orfutures.
ExternalPublicStrategicPartnership -Allocations tostrategic partners that have a broad mandate toinvestinavarietyofpublicmarkets.
External Public Total Emerging Markets - Investsmainlyinequityandequity-relatedsecuritiestraded
NotestotheFinancialStatements
58 TeacherRetirementSystemofTexas2020ComprehensiveAnnualFinancialReport
in the securities markets of newly industrializingcountriesandemergingmarkets.
Energy,NaturalResources,andInfrastructure
Energy Diversified - Invests in exploration,production, or distribution of oil, gas and otherenergysources.
Infrastructure- Invests ininfrastructureprojects likeroads, railways, ports, airports, telecommunicationsfacilities,etc...
NaturalResources-Investsincompaniesengagedinextractivepracticesofcommodities,includingminingfor coal, metallic ore, sand, gravel and oil shale;logging of naturally occurring trees; and drilling foroilandgas.
HedgeFunds
Commodities and Trends - Trades in a number ofdebt, equity, foreign exchange and commodityinstruments and derivative instrument contractsrelating to those instruments, including swaps,indices,forwards,futuresandoptioncontracts.
EquityMarketNeutral -Seeks toexploitdifferencesin stock prices by being long and short in stockswithin the same sector, industry, marketcapitalization,country,etc.
EventDriven - Seeks toexploitpricing inefficienciesthat may occur before or after a corporate event,such as an earnings call, bankruptcy, merger,acquisition,orspinoff.
Fixed Income - Assumesopposing positions in fixedincome products to take advantage of small pricediscrepancieswhilelimitinginterestraterisk.
LongShortEquity-Involvesbuyinglongequitiesthatare expected to increase in value and selling shortequitiesthatareexpectedtodecreaseinvalue.
Macro andVolatility - Invests in instrumentswhoseprices fluctuate based on the changes in economicpolicies, along with the flow of capital around theglobe.
Multi-Strategy - Engages in a variety of investmentstrategies with the objective to smooth returns,reducevolatility,anddecreaseasset-classandsingle-strategyrisks.Strategiesadoptedinamulti-strategyfundmayinclude,butarenotlimitedto,convertiblebond arbitrage, equity long/short, statisticalarbitrageandmergerarbitrage.
Other-Tradesinabroadrangeofinstruments.
Reinsurance - Provides property catastrophe andspecialty reinsurance coverages to insurers andreinsurersonaworldwidebasis.
PrivateEquity
Buyouts - Acquires shares of a company to gain acontrollinginterest.
Credit/Special Situations - Invests and trades inpublic and private debt obligations or equitysecurities or other indebtedness of companiesundergoing financial distress, a turn-around inbusiness operations, or companies whichmanagementbelievesareundervaluedbecauseofadiscreteextraordinaryevent.
Emerging Managers - Trades in a broad range ofinstrumentswithemergingmanagers.
Venture/Growth Equity - Invests in companieswithpotentialforsignificantgrowth.
RealAssets
Core - Invests in stable, fully leased, multi-tenantproperties typically within strong, diversifiedmetropolitanmarkets.
Emerging Managers - Trades in a broad range ofinstrumentswithemergingmanagers.
Opportunistic - Targets underperforming and/orunder managed properties, or properties that aretemporarilydepressedinvalue.
Other-Tradesinabroadrangeofinstruments.
REIT - Invests in companies that own or financeincome-producingrealestate.
Special Situations - Typically provides both equityanddebtcapitaltodistressedproperties.
ValueAdded-Involvesbuyingaproperty,improvingit in someway, and selling it at an opportune timefor gain. Properties are considered value addedwhen they exhibit management or operationalproblems, require physical improvement, and/orsufferfromcapitalconstraints.
RiskParity
Targetsspecificlevelsofrisktocertainfactorsand/orassets in order to achieve increased portfoliodiversification.
Short-TermInvestmentandCommingledFunds
Investsinhighlyliquidshort-term(cash-like)funds.
FinancialSection
59 TeacherRetirementSystemofTexas2020ComprehensiveAnnualFinancialReport

Redemptions
The System's Hedge Funds, Commingled DomesticEquity, and Commingled International Equity aresubjecttoredemptionrestrictionsthatconstraintheSystem'sabilitytoredeemthesetypesofAlternativeandPooledInvestments.Thefollowingtabledetailsthe redemption frequency, redemption noticeperiod,redemptionrestrictions,suchaslockupsandgates,andanestimateoftheeventuallapseofthoserestrictions, or, if an estimate cannot bemade, thefiscalyearinwhichtherestrictiontookplace,byfairvalueasofAugust31,2020.
NotestotheFinancialStatements
60 TeacherRetirementSystemofTexas2020ComprehensiveAnnualFinancialReport

Table3.C.3: RedemptionsandTerms
FairValueRedemptionFrequency
RedemptionNoticePeriod RedemptionRestrictions
RedemptionRestrictionsLapse
$ 1,799,691,917 N/A N/A N/A N/A
1,298,236,542 Bi-Monthly 9Days 30%FundGate NoEstimate;Effective2017
2,122,629,509 Daily 1-5Days N/A N/A
2,368,031,179 Monthly 10-30Days N/A N/A
(231,510) Quarterly 95Days N/A N/A
16,085,252 3months 45days N/A N/A
642,727,539 Annually 90Days 25%FundGate NoEstimate,Effective2010
1,249,637,454 N/A 30Days N/A N/A
$ 9,496,807,882 TotalCommingledDomesticEquity
$ 346,988,601 Monthly 90Days36Months,10%ofCapital
LockupPeriod Lapsed2019
1,795,717,204 N/A N/A N/A N/A
428,305,836 Quarterly 60Days 15%FundGate N/A
1,562,923,394 Monthly 30Days N/A N/A
740,300,431 Monthly 90Days 12,36,48MonthLockupNoEstimate;Rolling3Year
LockUpPeriod
149,898,255 Quarterly 90Days 15%FundGateQuarterlyLiquidity;Four
QuarterLockup
620,289,934 Quarterly 60Days N/A N/A
373,220,574 Quarterly 45Days12monthlockupwith10%
fundgate N/A
691,878,758 Monthly N/A N/A N/A
$ 6,709,522,987 TotalCommingledInternationalEquity
$ 12,081,194 24Months 90Days 2YearLockup LockupLapsed2019
25,619,262 Daily 30Days N/A N/A
491,904,071 Monthly 60Days1YearLockup;20%FundGate;25%InvestorGate
LockupLapsed2019;Gate-NoEstimate;Effective2018
18,549,157 Monthly 60Days 25%InvestorGate N/A
1,852,473,643 Monthly 2-90days N/A N/A
859,168,551 N/A N/A N/A N/A
1,856,344,330 Quarterly 40-90Days 10-25%FundGateNoestimate;Effective
2011-2017
611,743 Quarterly 60Days 20%QuarterlyFundGate NoEstimate;Effective2010
935,332,458 Quarterly 30-90Days 25%InvestorGateNoEstimate;Effective2012
-2017
1,498,094,092 Quarterly 65-90Days 25%QuarterlyInvestorGateNoEstimate;Effective2014
-2016
121,236,093 Quarterly 24Months 35%InvestorGate NoEstimate;Effective2014
FinancialSection
61 TeacherRetirementSystemofTexas2020ComprehensiveAnnualFinancialReport

Table3.C.3: RedemptionsandTerms(Continued)
FairValueRedemptionFrequency
RedemptionNoticePeriod RedemptionRestrictions
RedemptionRestrictionsLapse
93,817,751 Quarterly 45Days3YearLockup;25%Fund
GateLockupLapsed2019;Gate-NoEstimate;Effective2017
291,750,701 Quarterly 90Days25%FundGate;3Year
RollingHardLock
LockupLapsedJune2019;Gate-NoEstimate;Effective
2017
1,370,117,320 Quarterly 45-95Days N/A N/A
71,292,757 Semi-Annually 90Days 20%FundGate NoEstimate;Effective2010
238,479,153 Semi-Annually 95Days N/A N/A
255,840,760 Yearly 60Days N/A N/A
527,657,005 Yearly 90Days 25%InvestorGate N/A
5,149,688 Bi-Monthly 15or30Days10%FundGatefor15Day
Notice Noestimate;Effective2013
294,498,004 Monthly 25-90Days 20%-25%InvestorGateNoestimate;Effective2010
-2017
425,121,000
Monthly&QuarterlyDealing
Day 30Days N/A N/A
576,428,226Monthly,
Quarterly,12/31
Monthly-45-90Days;Quarterly-45Days;12/31-
90Days 1/6thInvestorGate Noestimate;Effective2014
322,887,870Monthly;Semi-
Annual
Monthly,20DayNotice;Semi-Annual,10/31or
03/31Notice N/A N/A
563,339,803 Quarterly 90Days1-YearSoftLock;25%
InvestorLevelperQuarterLockupLapsed2019;Gate-NoEstimate;Effective2018
580,048,004 Semi-Annually 90Days16.67%Semi-Annual
InvestorGate Noestimate;Effective2013
178,267,883 Monthly 30Days 24MonthLockup N/A
12,026,316 3months 45days 12monthlockup Outoforiginallock
48,223,298 3months 60-90Days12-24monthlockupand
25%quarterlygateLockupexpiresApril12021
andApril12022
287,116,326 Monthly Monthly,30DayNotice N/A N/A
314,799,582 N/A 90Days N/A N/A
$ 14,128,276,041 TotalHedgeFunds
Liquidations
The System receives distributions through theliquidationof theunderlyingassetsof the investeesforamajorityof itsAlternativeInvestment interestsin Private Equity, Real Assets, and Energy, NaturalResources, and Infrastructure since these
investments can never be redeemed with theinvestees.ThefollowingtabledisclosestheSystem'sestimate of the period over which the underlyingassetsareexpectedtobeliquidatedbytheinvesteesasofAugust31,2020.
NotestotheFinancialStatements
62 TeacherRetirementSystemofTexas2020ComprehensiveAnnualFinancialReport

Table3.C.4: AlternativeInvestmentsLiquidationPeriods
InvestmentTypeLessthan1
Year 1-5Years 6-10YearsGreaterthan
10Years N/A Total
AbsoluteReturn $ 40,410,452 $1,739,048,717 $ — $ — $2,559,385,679 $4,338,844,848
Energy,NaturalResources,andInfrastructure 828,395,709 2,847,838,611 3,809,019,269 547,397,960 — 8,032,651,549PrivateEquity 1,488,032,633 10,191,015,451 10,187,079,263 1,698,906,915 — 23,565,034,262RealEstate 588,477,117 5,980,087,515 8,115,129,708 7,024,901,434 — 21,708,595,774RiskParity — — — — 2,980,485,062 2,980,485,062Total $2,945,315,911 $20,757,990,294$22,111,228,240$9,271,206,309 $5,539,870,741 $60,625,611,495
D.DerivativeInstruments
Derivative instruments are used to efficientlymanage and reduce the risk of the overallinvestmentportfolio. Throughtheuseofderivativeinstruments, the risks that are bound together intraditional cash market investments can beseparated and managed independently. DerivativeInstruments are classified as Investments on theStatementofFiduciaryNetPosition,andthechangesin their fair value are classified as InvestmentRevenue on the Statement of Changes in FiduciaryNet Position. The fair value, changes in fair value,and notional value of the System's DerivativeInstruments,classifiedbyderivativeinstrumenttype,
aredisplayedinthefollowingtableasofAugust31,2020.
The System's over-the counter (OTC) DerivativeInstrumentsincludecontingentfeaturesthatrequirethe System to post collateral in the event that thefair value surpasses a specified contractualthreshold. TheaggregatefairvalueofallDerivativeInstrumentswith these collateral posting provisionsis $(71,645,037), and as of August 31, 2020, theSystem has posted $65,994,072 in collateral. AtAugust 31, 2020, the System has not triggered anyevents thatwould require the posting of additionalcollateraltoitscounterparties.
FinancialSection
63 TeacherRetirementSystemofTexas2020ComprehensiveAnnualFinancialReport

Table3.D.1: DerivativeInstruments
FiduciaryFundsDerivativeInstruments FairValue
ChangeinFairValueGain/(Loss) NotionalValue
ForwardsFXForwards $ (163,076,495)$ (255,352,768)$ (2,663,390,010)TotalForwards $ (163,076,495)$ (255,352,768)
FuturesCommodityFutures $ 149,117,122 $ (59,674,693)$ 1,850,072,191FixedIncomeFutures (72,622,427) 1,174,061,295 12,164,727,384ForeignCurrencyFutures — 5,469,993 —IndexFutures 482,975,791 (287,399,252) 5,296,094,837TotalFutures $ 559,470,486 $ 832,457,343
OptionsEquityOptions $ — $ — $ —FuturesOptions — — —IndexOptions (17,743,030) (182,470,233) (28,542,998)TotalOptions $ (17,743,030)$ (182,470,233)
RightsRights $ 81,018 $ 1,712,032 $ 305,837TotalRights $ 81,018 $ 1,712,032
SwapsCreditDefaultSwaps $ 14,648,033 $ (180,316,830)$ 661,109,971InterestRateSwaps 5,897,743 5,549,211 (98,332,666)TotalReturnSwaps 109,136,108 235,903,785 3,199,954,027TotalSwaps $ 129,681,884 $ 61,136,166
WarrantsWarrants $ 14,611,375 $ 12,775,073 $ 20,914,431TotalWarrants $ 14,611,375 $ 12,775,073
Total $ 523,025,238 $ 470,257,613
E.SecuritiesLending
TheSystem is authorizedby Section825.303, GovtCode, to lend securities in accordance with theSecurities Lending Policy adopted effective May 1,2017 by the Board of Trustees and as required bystatute. The system's custodian and lending agent,State Street Bank and Trust Company, administersthe securities lending program for domestic andinternationalequityandfixedincomesecurities.TRSsecuritiesheldbyaprimebrokerarenoteligibleforsecurities lending by the prime broker. During thereporting period, Securities Lending Policy changespermitted the lendingagent toact as aprincipal toborrow TRS securities for its own account. Thischange facilitates the system's participation in thecustodian'senhancedcustodyprogram,whichallowsthe retirement system to self-borrow securities forshort sale deliveries and to finance market
borrowingthroughloansofsecuritiestothelendingagent.TheSecuritiesLendingPolicycanbeaccessedat www trs texas gov. There were no significantpolicyviolationsduringthefiscalyear.
Collateral received from borrowers is delivered tothelendingagentintheformofcashorgovernmentsecuritieseligibleforbookentryineithertheFederalReserve system or the Participants Trust Company,or their respective successors. The initial collateraldelivered to secure a loan of domestic securitiesmusthaveamarketvalueofatleast102percentofthe initial market value of domestic loanedsecurities and at least 105 percent of the initialmarket value of international loaned securities.Collateral is marked to market daily. If, while theloan isoutstanding,thecurrentmarketvalueofthecollateral initially delivered is less than 100 percentor 105 percent of the current market value of the
NotestotheFinancialStatements
64 TeacherRetirementSystemofTexas2020ComprehensiveAnnualFinancialReport

domesticorinternationalsecurities,respectively,thelending agentmust require the borrower to deliveradditional collateral to restore the value to 102percentor105percentof thecurrentmarketvalueoftheloanedsecuritiesfordomesticorinternationalsecurities,respectively. Thesystemisauthorizedtoinvest cash collateral in the following types ofinstruments: U.S. government securities or U.S.government-sponsored enterprise (GSE) securities,moneymarketinstruments,repurchaseagreements,fixedorfloatingratedebtobligations,andderivativeinstruments.
The securities lending contracts require thecustodian to indemnify the system against lossresulting from borrower default or failure of theagent to properly execute its responsibilities underthe lending agreement as required by Section825.303(b)(3), Govt Code. Non-cash collateralcannot be pledged or sold unless the borrowerdefaults. All securities loans can be terminated ondemand by the System or the borrower, and thereareno restrictionson theamountof loans that canbemade.
The par value, dollar-weighted average maturity ofthe collective cash collateral investment portfoliomay not exceed 120 days. The expected finalmaturityofany individual fixed-rate instrumentandindividual floating-rate instrument may not exceed36 months and seven years, respectively. As ofAugust 31, 2020, thematurities of the investmentsmade with cash collateral generally match thematurities of their securities loans, with theweighted average maturity of the invested cashcollateralat15days,andtheweightedaveragetermofallsecuritiesonloanat17days.
AsofAugust31,2020,thesystemreportedInvestedSecurities Lending Collateral worth $7,167,587,747.The system holds $7,165,996,116 in cash collateraland $843,500,444 in non-cash collateral. Securitieson loan totaled $8,472,750,036, which included$601,404,911lenttothelendingagent.Securitiesonloan include investments in Domestic CorporateBonds,DomesticEquities,InternationalEquities,U.S.GovernmentAgencyBonds,andU.S.TreasuryBonds.
F.DepositandInvestmentRiskFactors
CustodialCreditRisk
Custodial credit risk for deposits is the risk that, inthe event of the failure of a depository financialinstitution, the System will not be able to recover
deposits or will not be able to recover collateralsecurities that are in the possession of an outsideparty.Custodialcreditriskforinvestmentsistheriskthat, in theeventof the failureof thecounterpartyto a transaction, the System will not be able torecover the value of investment or collateralsecurities that are in the possession of an outsideparty.
Deposits
TheSystemdoesnothaveaformaldepositpolicyforcustodial credit risk. Deposits held at the State ofTexasTreasuryarenotsubjecttocustodialcreditrisksince the Treasury holds collateral in the System'sname in excess of depository insurance. Depositsheld in bank accounts in excess of depositoryinsuranceareuninsuredanduncollateralized. AsofAugust31,2020,$319,545,479oftheSystem'sbankbalancewasuninsuredanduncollateralized.
Investments
The System has contracted with State Street BankandTrustCompanyandGoldmanSachs to serve ascustodiansfortheSystem'sinvestments.TheSystemdoes not have a formal investment policy forcustodial credit risk. As of August 31, 2020, theShort-TermInvestmentFundisheldbythecustodianin a 2a-7 like investment pool not evidenced by asecurity and is not exposed to custodial credit risk.Thesesecuritiesareheld inthenameofthesystemby the custodian. All other investments areregistered in the name of the Teachers RetirementSystem of Texas or in the name of the System'scustodian.
FinancialSection
65 TeacherRetirementSystemofTexas2020ComprehensiveAnnualFinancialReport

SecuritiesLending
TheSystemdoesnothaveaformalinvestmentpolicyfor custodial credit risk for its securities lendingprogram. The System reinvests all cash collateralreceived in an unrated cash collateral pool held bythe System's securities lending agent and is,therefore,notexposedtocustodialcreditrisk.Sincenon-cash collateral is not reported on the balancesheet, it isexposedtocustodialcreditrisk,as is therelatedunderlyingsecuritiesonloan.Thefollowing
table shows the underlying securities for the non-cash collateral loans, which are held by thecounterparty,thesecuritieslendingagent,butnotintheSystem'snameandarenotinsuredasofAugust31,2020.
Table3.F.1: SecuritiesLendingCustodialCreditRisk(ExcludingCash)
InvestmentTypeSecuritiesonLoan
FairValueNon-Cash
CollateralValue
DomesticCorporateBonds $ 2,088 $ 2,130DomesticEquity 520,113,521 525,737,425InternationalEquity 312,194,116 317,760,889Total $ 832,309,725 $ 843,500,444
CreditRisk
Credit risk is the risk that an issuer or othercounterparty to an investment will not fulfill itsobligations.
Investments
TheSystemdoesnothaveaformalcreditriskpolicyfor its investments. The S&P credit rating and fairvalueoftheSystem'sFixedIncomeInvestmentsasofAugust31,2020isdisclosedinthefollowingtable.
Credit ratings of U.S. Treasuries, U.S. TreasurySTRIPS, and U.S. TIPS are not disclosed since theseinvestments are explicitly guaranteed by the U.S.Government. The System's Short-Term InvestmentFunds and Short-Term Commingled Funds areunrated.
NotestotheFinancialStatements
66 TeacherRetirementSystemofTexas2020ComprehensiveAnnualFinancialReport

Table3.F.2: CreditRisk:FixedIncomeCreditRating
FixedIncomeInvestmentType
S&PRating
AssetandMortgage
BackedBonds
DomesticCorporateBonds
InternationalCorporateBonds
SovereignGovernmentIssueBonds
U.S.Government
AgencyBonds1 Total
AAA $ 6,213,800 $ — $ — $ — $ 1,103,424 $ 7,317,224AA+ 1,024,129 — — — 7,628,367 8,652,496AA 1,101,208 — — — — 1,101,208AA- 2,236,220 — — — — 2,236,220A+ 2,294,535 — — — — 2,294,535A 11,742,644 — — — — 11,742,644A- 2,812,774 — — — — 2,812,774BBB+ 2,104,112 8,642,520 — 68,718,245 — 79,464,877BBB 7,017,584 22,292,436 2,292,900 — — 31,602,920BBB- 2,248,056 26,590,075 — — 943,706 29,781,837BB+ 896,719 5,505,736 — — — 6,402,455BB 1,149,816 — 8,171,760 — — 9,321,576BB- 1,016,511 — 7,615,600 80,376,472 — 89,008,583B+ 817,388 — 3,163,050 — — 3,980,438B 2,344,694 — — — — 2,344,694B- 2,078,088 — — — — 2,078,088CCC+ — — — — — —CCC 13,798,036 — — — — 13,798,036CCC- — — — — — —CC 1,304,720 — — — — 1,304,720D 963,730 — — 6,470,525 — 7,434,255NR2 37,648,985 9,520 6,412,297 1,792,867,595 5,055,716 1,841,994,113Total $ 100,813,749 $ 63,040,287 $ 27,655,607 $1,948,432,837$ 14,731,213 $2,154,673,6931U.S.GovernmentAgencyBonds(FHLB,FNMA,FHLMC)areimplicitlyguaranteedbytheU.S.Government.2NRrepresentsunratedsecurities.
DerivativeInstruments
The maximum allowable unsecured counter-partyexposure for over-the-counter (OTC) derivativeinstrumenttransactionsis$500million,basedonthetotalnetmarketvalueofallOTCpositionsheldwitheachcounterparty.Thetotalcounterpartyexposurefor each counterparty, including the collateralizedportions of these agreements, may not exceed 5percentoftheSystem'stotalfundmarketvalue.Theminimum credit rating, based on a NationallyRecognized Statistical Rating Organization (NRSRO),mustberatedatleastA-orbetterattheinceptionofthecontract.ForanycounterpartythatexperiencesdeteriorationincreditqualitythatresultsinaNRSROrating below the A- level, subsequent to theinceptionoftransaction,additionaleligiblecollateralmay be posted, or the transaction may beterminated. AllOTCderivativeinstrumentsmustbe
governedbyan InternationalSwapsandDerivativesAssociation (ISDA) Master Agreement and CreditSupport Annex or, if centrally cleared by clearingagreements, the close-out netting provisions andcollateralizationprovisionsmustbeincluded.
The following table discloses the net DerivativeInstrumentsexposure to credit riskby counterpartyandtheircorrespondingcreditratingbyeachoftheBig Three credit rating agencies as of August 31,2020.
TheaggregatefairvalueofDerivativeInstrumentsinasset positions as of August 31, 2020, was$283,304,831, which represents the maximumamount of loss due to credit risk that would berecognized if all counterparties failed toperformascontracted. The exposure is reduced by$111,945,660ofcollateralheldand$164,510,151of
FinancialSection
67 TeacherRetirementSystemofTexas2020ComprehensiveAnnualFinancialReport

liabilities included in netting arrangements withthose counterparties, resulting in anetexposure tocreditriskof$6,849,020.
CollateralheldbytheSystemincludes$645,076heldincustodialaccountswhicharenotavailableforusein any other purposes. This collateral has beenexcluded from the Statement of Net Position as itdoes not represent an asset to the System.Additional collateral of $122,851,836 is held by theSystem and under the terms of the related ISDAs,may be rehypothecated by the System. Dependingon the nature of the collateral held and the abilityrehypothecatethecollateral,thisbalanceisincluded
withinshort-terminvestmentswithintheStatementofNetPosition, and isoffsetbya relatedCollateralObligationsliability
TheSystem'snetexposuretocreditriskislimitedto5percent of themarket valueof the system's totalfund value. As of August 31, 2020, significantconcentrationsofnetexposuretocreditriskexistedat Citibank (84.1 percent) and some at Bank ofAmerica Merrill Lynch (15.9 percent), but the netexposure for the counterparty did not surpass 5percentoftheSystem'stotalfundmarketvalue.
Table3.F.3: CreditRisk:DerivativeCounterparty
Counterparty NetExposurePercentageofNet
ExposureS&PRating
FitchRating
Moody'sRating
Citibank $ 5,760,188 84.1% A+ A+ Aa3
BankofAmericaMerrillLynch 1,088,831 15.9 A+ AA- Aa2
Total $ 6,849,019 100.0%
ReverseRepurchaseAgreements
TRS held $7,150,529,625 in reverse repurchaseagreements at August 31, 2020. The System’sInvestment Policy Statement permits TRS to enterintoreverserepurchaseagreements,thatis,asaleofsecurities with a simultaneous agreement torepurchasetheminthefutureatthesamepriceplusa contract rateof interest. Themarket valueof thesecuritiesunderlyingreverserepurchaseagreementsnormally exceeds the cash received, providingcounterpartiesamarginagainst adecline inmarketvalueofthesecurities. Ifacounterpartydefaultsonits obligations to resell these securities to TRS orprovidesecuritiesorcashofequalvalue,theSystemwould suffer an economic loss equal to thedifference between the market value plus accruedinterest of the underlying securities and theagreementobligation,includingaccruedinterest.Nolosses were recognized during the year due todefault by counterparties to reverse repurchaseagreements.
The counterparty limits for reverse repurchasetransactions and tri-party reverse repurchase
transactions may not exceed 5 percent of theSystem's total fund market value, unless thetransactions are covered by a third-partyindemnification agreement by an organization thatbearsalong-termNRSROcreditratingofA-orbetterand is enhanced by acceptable collateral. EachrepurchaseagreementwillbeenteredintounderthePublic SecuritiesAssociation (PSA)and InternationalSecuritiesMarket Association (ISMA) GlobalMasterRepurchase Agreement. Each ISDA MasterAgreementmustalsoincludeatablethatdelineatesthe excess purchased securities margin (haircut)required,basedonthecollateraltype,duration,andcredit quality. There were no significant policyviolations during the fiscal year. The System’scounterpartycreditexposureforreverserepurchaseagreementsatAugust31,2020issummarizedinthefollowingtable.
NotestotheFinancialStatements
68 TeacherRetirementSystemofTexas2020ComprehensiveAnnualFinancialReport

Table3.F.4: CreditRisk:ReverseRepurchaseAgreements
CounterpartyFairValueofCollateralHeldbyCounterparty1
CashandInterestDuetoCounterparty1 NetCreditRisk
Barclays $ 281,818,744 $ 279,531,294 $ 2,287,450GoldmanSachs 2,028,441,080 1,964,313,345 64,127,735JPMorganChase 4,559,502,043 4,444,540,838 114,961,205
BNPParibas 469,806,480 463,725,252 6,081,228
TotalReverseRepurchaseAgreements $ 7,339,568,347 $ 7,152,110,729 $ 187,457,6181Includesaccruedinterest.
The cash proceeds from reverse repurchaseagreementsarereinvestedbytheSystem.Purchasesmade with the proceeds of reverse repurchaseagreementsarenotnecessarily restricted to certaininvestment types or maturities. The cash due tocounterparties resulting from reverse repurchaseagreementsisreportedas“ObligationUnderReverseRepurchase Agreements” and the interest due tocounterparties is included in “Investment Payables”on the Statement of Fiduciary Net Position. Theunderlyingassets,aswellasthereinvestedproceeds,are reported in the “Investments at Fair Value”sectionontheStatementofFiduciaryNetPosition.
SecuritiesLending
Instruments having a maturity at the time ofpurchase of less than 13 months must be rated inoneofthetwohighestshort-termratingscategoriesof the following Nationally Recognized StatisticalRatings Organizations (NRSRO) -Moody's, Standard& Poor's, Fitch or DBRS - or be considered by theBoard of Trustees to be of comparable quality.Instruments having a maturity at the time ofpurchase greater than 13monthsmust be rated atthetimeofpurchasewithinthehighestmajor,long-termratingcategoryofanNRSRO(e.g.,Moody'sA3
or Standard & Poor's A-), or, if unrated, bedeterminedtobeofcomparablequalitybytheBoardof Trustees. As of August 31, 2020, there was nocredit risk exposure because the amounts owed toborrowers exceeded the amounts owed to thesystem.
InterestRateRisk
Interest rate risk is the risk that changes in interestrates will adversely affect the fair value of aninvestment.
Investments
TheSystemdoesnothaveaformalinterestrateriskpolicyforitsinvestments.ThefollowingtablepresentsthefairvalueandtheweightedeffectivedurationratefortheSystem'sFixedIncomeInvestmentsthataresubjecttointerestrateriskasofAugust31,2020.
AssetandMortgageBackedBondsarebasedoncashflows from interest payments on underlyingmortgages, whichmakes them sensitive to interestrate changes when mortgagees make prepaymentsinperiodsofdeclininginterestrates.
Table3.F.5: InterestRateRisk:FixedIncomeWeightedEffectiveDurationRate
FixedIncomeInvestmentType FairValueWeightedEffective
DurationRate
AssetandMortgageBackedBonds $ 100,813,749 1.1DomesticCorporateBonds 63,040,287 14.6InternationalCorporateBonds 27,655,607 4.6SovereignGovernmentIssueBonds 1,948,432,837 9.8U.S.GovernmentAgencyBonds 14,731,213 (4.0)U.S.TreasuryBonds 19,394,910,800 18.5U.S.TreasurySTRIPS 35,876,575 17.6U.S.TIPS 2,227,276,026 8.0Total $ 23,812,737,094 16.7
FinancialSection
69 TeacherRetirementSystemofTexas2020ComprehensiveAnnualFinancialReport

DerivativeInstruments
TheSystemdoesnothaveaformalinterestrateriskpolicy for its Derivative instruments. The System’sinvestmentsinSwapsarehighlysensitivetointerestrate changesbecause theyarebasedon fluctuatingInterbankOfferedRates.
AstheRatesfluctuate,thetotalexpectedcashflowswill fluctuate. The reference rates, embeddedoptions,fairvalue,andnotionalvalueofthesystem’sInterestRateandReturnSwapsthatareexposedtointerest rate risk, as of August 31, 2020, arepresentedinthefollowingtable.
Table3.F.6: InterestRateRisk:DerivativeInstrumentsbyMaturities
InvestmentMaturities(inYears)
ReferenceRate&EmbeddedOptions FairValue Lessthan1 1-5 6-10NotionalValue
InterestRateSwaps
ReceiveVariable12-monthUSCPI,PayFixed1.29750% $ 573,495 $ — $ — $ 573,495 $ (9,329,442)
ReceiveVariable12-monthUSCPI,PayFixed1.26937% 2,406,151 — — 2,406,151 (37,312,419)
ReceiveVariable12-monthUSCPI,PayFixed1.23500% 635,772 — — 635,772 (9,327,442)
ReceiveVariable12-monthUSCPI,PayFixed1.17600% 1,157,390 — — 1,157,390 (15,551,363)
ReceiveVariable12-monthUSCPI,PayFixed1.31125% 386,155 — — 386,155 (6,337,000)
ReceiveVariable12-monthUSCPI,PayFixed1.36700% 316,093 — — 316,093 (5,098,000)
ReceiveVariable12-monthUSCPI,PayFixed1.74500% 384,307 — — 384,307 (10,797,000)
ReceiveVariable12-monthUSCPI,PayFixed1.95600% 38,379 — — 38,379 (4,580,000)
TotalInterestRateSwaps $ 5,897,742 $ — $ — $ 5,897,742
TotalReturnSwaps
ReceiveEquity,PayVariable3-monthLIBOR $ 192,256,983 $ 192,256,983 $ — $ — $3,283,132,296
ReceiveEquity,PayVariable3-monthEURIB (2,119,515) (2,119,515) — — 50,915,674
ReceiveEquity,PayVariable12-monthFEDL (14,522,438) (13,829,831) (692,607) — 1,540,328,041
ReceiveVariable3-monthLIBOR,PayEquity (66,075,161) (65,835,064) (240,097) — (1,869,135,205)
ReceiveVariable3-monthEURIB,PayEquity 909,905 909,905 — — (48,703,849)
ReceiveVariable12-monthFEDL,PayEquity (477,990) 207,975 (685,965) — (48,783,152)
ReceiveVariable12-monthSOFR,PayEquity (460,606) (460,606) — — (34,334,331)
TotalReturnSwaps $ 109,511,178 $ 111,129,847 $ (1,618,669) $ —
Total $ 115,408,920 $ 111,129,847 $ (1,618,669) $ 5,897,742
ForeignCurrencyRisk
Foreign currency risk is the risk that changes inexchangerateswilladverselyaffectthefairvalueofa deposit or an investment. The System does nothaveaformaldepositpolicyforforeigncurrencyrisk.Theriskofholdinginvestmentsinforeigncurrencyismanaged by applying currency hedge ratios to thesystem’spublic
markets and private markets non-dollar exposures.Each currency hedge ratio is the percentage ofaggregate, non-dollar currency exposure to bepassively hedged, and the hedging horizon isintermediate (one to three years). The System'sexposure to foreign currency risk as of August 31,2020ispresentedinthefollowingtable.
NotestotheFinancialStatements
70 TeacherRetirementSystemofTexas2020ComprehensiveAnnualFinancialReport

Table3.F.7: ForeignCurrencyRisk
CurrencybyCountry Cash
AlternativeInvestments
DerivativeInstruments
EquityInvestments
FixedIncomeInvestments
PooledInvestments Total
AustraliaDollar $ 1,879,744 $ — $ (34,585,321) $ 934,370,266 $ 371,919,784 $ — $ 1,273,584,473BangladeshTaka 3 — — — — — 3BotswanaPula 6,257 — — 51,157 — — 57,414BrazilReal 197,710 — (5,130,211) 355,216,883 — — 350,284,382CanadaDollar 46,746,068 — 16,885,516 1,699,922,635 — — 1,763,554,219ChilePeso 9,386 — 240,822 15,791,638 — — 16,041,846ChinaYuanRenminbi 15,515,547 — — 465,762,526 — — 481,278,073ChinaYuanRenminbiOffshore (1,891,853) — 1,779,147 — — — (112,706)ColombiaPeso — — 96,820 5,506,189 — — 5,603,009CzechRepublicKoruna 3,884,861 — (1,213,934) 12,798,132 — — 15,469,059DenmarkKrone (6) — 23,945 354,189,647 — — 354,213,586EgyptPound — — — 4,252,855 — — 4,252,855EuroMemberCountries 37,635,054 3,881,291,479 (20,200,160) 5,274,277,264 555,820,799 740,300,431 10,469,124,867HongKongDollar 2,034,692 — (7,693,567) 3,605,844,371 — — 3,600,185,496HungaryForint — — (495,951) 42,929,385 — — 42,433,434IndiaRupee 4,618,586 — 47,372 1,021,889,370 277 — 1,026,555,605IndonesiaRupiah 22,731 — 415,595 219,436,297 — — 219,874,623IsraelShekel 391 — 137,315 39,334,061 — — 39,471,767JapanYen (270,631) — (1,536,899) 4,004,983,609 — — 4,003,176,079Korea(South)Won 518,514 — 2,807,836 1,288,942,173 — — 1,292,268,523KuwaitDinar — — — 5 — — 5MalaysiaRinggit 7,004 — — 97,725,834 — — 97,732,838MexicoPeso 100,405 — 213,047 283,653,182 68,718,245 — 352,684,879NewZealandDollar 3,343 — (4,502,591) 34,726,818 — — 30,227,570NigeriaNaira 118 — — 3,576 — — 3,694NorwayKrone 28,654 — 6,558,780 285,305,186 — — 291,892,620PakistanRupee — — — 15,729,748 — — 15,729,748PeruSol — — (10,094) — — — (10,094)PhilippinesPeso — — (75,679) 30,139,515 — — 30,063,836PolandZloty 113,612 — 685,843 81,575,948 — — 82,375,403QatarRiyal — — — 34,364,443 — — 34,364,443RussiaRuble — — (70,763) 143,968,468 — — 143,897,705SaudiArabiaRiyal 292,215 — — 115,114,341 — — 115,406,556SingaporeDollar 498,955 — (1,307,440) 97,913,631 — — 97,105,146SouthAfricaRand 85,379 — 753,776 353,835,349 — — 354,674,504SwedenKrona 132,853 — 2,564,580 352,721,191 — — 355,418,624SwitzerlandFranc 959 — (7,730,735) 1,361,695,551 — — 1,353,965,775TaiwanNewDollar 1,483,723 — (10,483) 1,269,505,179 — — 1,270,978,419ThailandBaht 472,617 — (57,485) 179,011,340 — — 179,426,472TurkeyLira 6,346 — 1,259,395 46,302,446 — — 47,568,187UnitedArabEmiratesDirham 4,275 — — 33,519,987 — — 33,524,262
UnitedKingdomPound 3,788,348 607,261,680 (86,201,664) 2,191,456,338 945,503,485 — 3,661,808,187VietNamDong 1 — — 78 — — 79Total $117,925,861 $4,488,553,159$(136,353,188) $26,353,766,612 $1,941,962,590 $ 740,300,431 $33,506,155,465
FinancialSection
71 TeacherRetirementSystemofTexas2020ComprehensiveAnnualFinancialReport

Note4:EmployeeCompensableLeave
Salary costs related to an employees' right to becompensated for leave balances are accrued asexpenses in the period in which the services arerendered.Accumulatedcompensableleaveliabilitiesare reported in the Statement of Fiduciary NetPositionforthePensionandOtherPost-EmploymentBenefit Trust Funds and in the Statement of NetPositionfortheProprietaryFunds.
Note5:OperatingLeases
In the fiscal year 2014, TRS entered into a non-cancelable operating lease agreement for buildingspacewhichexpiresMarch31,2021.Aspartofthebuildinglease,TRSreceivedaconstructionallowancewhichisbeingamortizedonastraight-linebasisoverthe life of the lease as a reduction of rentalexpenses.
Rental expenses related to the building space leasefor the fiscal year ended August 31, 2020 for thePension Trust Fund were $3,702,921, including anadjustment for amortization of unrealized leaseincentives of $73,234. Fees for off-site storage fordata security, copier rentals, and a mail machinewere $14,773, $310,034, and $42,795, respectively.Rental expenses related to the Teacher RetirementInvestment Company of Texas (TRICOT) located inLondonwere$436,980forleases.
Thefutureminimumleasepaymentsforthenexttenyearsarelistedinthefollowingtable.
Table5.1: OperatingLeaseObligations
FiscalYear Amount
2021 $ 2,420,1422022 854,4042023 324,9172024 212,8752025 195,148
2026-2030 780,591Total $ 4,788,077
Note6:FringeBenefitsPaidbytheStateofTexasandtheFederalGovernment
TheStatehasajointcontributoryretirementplanforsubstantially all its employees. The employees ofTRS participate in the same pension plan theyadminister(Note11).
Federal legislation enacted in January 2006establishedprescriptiondrugcoverageforMedicarebeneficiariesknownasMedicarePartD.OneoftheprovisionsofMedicarePartDprovidedRetireeDrugSubsidy(RDS)reimbursementstoTRS-Careonbehalfof certain planparticipants totaling$62,358 for thefiscal year ended August 31, 2020. TRS-Care'sEmployer Group Waiver Plan (EGWP)reimbursements totaled $14,505,350 for MedicarePart D direct subsidies, $165,907,865 forcatastrophic reinsurance subsidies, and $5,693,573forlowincomesubsidies.
Note7:ContingentLiabilities
Sickleave,theaccumulationofwhichisunlimited,isearned at the rate of eight hours permonth and istakenonlyintheeventofillnessorpaidtotheestateof anemployee in theeventofdeath. Pursuant toTexasGovernmentCode661.033,themaximumsickleave that may be paid to an employee's estate isone-halfoftheemployee'saccumulatedentitlementor 336 hours, whichever is less. The balance ofvacation leave, theaccumulationofwhich is limitedbasedonyearsofserviceisalsopaidtotheestateofan employee in the event of death. The System'spolicyistorecognizethecostofanysickleavewhenpaidandtorecognizethecostofanyvacationleavewhenearned.
The System is contingently liable for retro-activeretirement benefits payable to retiring memberswho complete the retirement process within oneyear of applying for retirement benefits. As ofAugust 31, 2020, themaximum liability for pendingretirementbenefitspayableis$17.2million.
In addition, under Texas Insurance Code, Article3.51-7,theSystemisliabletopayalump-sumdeathbenefit of $2,500when added to the deathbenefitauthorized under Texas Government Code, Title 8,Chapter824,tothebeneficiariesofdeceased,retiredemployees.
A Performance Incentive Compensation Plan wasestablished by the Board in September 2007 andmost recently amended in September 2018, toenable the system to remain competitive in itsefforts to attract, retain and motivate high caliberinvestmentdivisionstaff.ThepurposeofthePlanisto provide the opportunity for investment divisionemployeestoearnperformanceincentivepaybasedon the fund's investment performance and theemployee's job performance. The performanceincentive pay is paid over the subsequent 2 years.
NotestotheFinancialStatements
72 TeacherRetirementSystemofTexas2020ComprehensiveAnnualFinancialReport

Theremainingliabilityfortheincentivepayplanyearending September 30, 2019 will not exceed $6.1million. For the incentive pay plan year endingSeptember30,2020,theliabilityisestimatednottoexceed$17.4million. Paymentscanonlybeearnedfollowing years in which the Pension Trust Fundexperiences a positive return, and employeesmustbeemployedbyTRSonthedesignateddates in thePlan in order to earn and receive payment. TheBoardofTrusteesmaycancelormodify thePlanatanytime.
An Executive Performance Incentive Plan wasadopted effective July 1, 2016 in order to remaincompetitive in its efforts to attract and retain highcaliber executives. The purpose of the plan is toprovide an opportunity for select executivemanagement to earn performance incentive paybasedonkeyobjectivestiedtotheoverallsuccessofTRS.Theperformanceincentivepayispaidoverthesubsequent2years.FortheincentivepayplanyearendingSeptember30,2019,theremainingliabilityisestimated at $24,383. For the incentive pay planyear ending September 30, 2020, the liability isestimatedat$213,100.
TRSisadefendantinlitigationinvolvingissuesarisingfrom its normal activities. The outcome of thislitigationcannotbedeterminedat this time. Basedupon consultation with legal counsel, managementbelieves therewillbenomaterialadverseeffectonthe basic financial statements as a result of theultimateoutcomeofthesematters.
Note8:ContinuanceSubjecttoReview
As provided by Texas Government Code, Title 8,Section 825.006, "The Board of Trustees of theTeacher Retirement System of Texas is subject toreviewunderChapter325(TexasSunsetAct),but isnotabolishedunderthatchapter.Theboardshallbereviewed during the period inwhich state agenciesabolished in 2021, and every 12th year after thatyear,arereviewed."ThestaffoftheSunsetAdvisoryCommission concluded a review of the agency inMay2020andisawaitingfinalreview.
Note9:OtherPost-EmploymentBenefits(OPEB)Plan-TRS-Care
A.PlanDescription
The Texas Public School Retired Employees GroupInsurance Program (TRS-Care) is a multiple-employer, cost-sharing, defined Other Post-Employment Benefit (OPEB) plan with a specialfunding situation. The TRS-Care program wasestablishedin1986bytheTexasLegislature.
The Board of Trustees of TRS administers the TRS-Care program and the related fund in accordancewithTexasInsuranceCodeChapter1575.TheBoardofTrusteesisgrantedtheauthoritytoestablishbasicand optional group insurance coverage forparticipants as well as to amend benefit terms asneeded under Chapter 1575.052. The Board mayadopt rules, plans, procedures, and ordersreasonably necessary to administer the program,includingminimumbenefitsandfinancingstandards.Information regarding the TRS-Care board and itscompositioncanbefoundonpage3andinNote1.
B.BenefitsProvided
TRS-Care provides health insurance coverage toretirees from public schools, charter schools,regional service centers, and other educationaldistricts who are members of the TRS pensionsystem. Eligible non-Medicare retirees and theirdependentsmayenrollinTRS-CareStandard,ahigh-deductible health plan. Eligible Medicare retireesand their dependents may enroll in the TRS-CareMedicareAdvantagemedicalplanand theTRS-CareMedicare Rx prescription drug plan. To qualify forTRS-Care coverage, a retireemust have at least 10years of service credit in the TRS pension system.For more information on TRS-Care eligibility anddetailedinformationonTRS-Care,pleaserefertotheBenefitssection.
TheGeneral AppropriationsAct passed by the 86thLegislature included funding to maintain TRS-Carepremiums at their current level through 2021. The86th legislature also passed Senate Bill 1682whichrequiresTRStoestablishacontingencyreserveintheTRS-Carefundequalto60daysofexpenditures.Thisamount is estimated at $277,490,586 as of August31,2020.
FinancialSection
73 TeacherRetirementSystemofTexas2020ComprehensiveAnnualFinancialReport

C.ContributorstothePlan
Contributors to the plan include active and retiredmembers,employers, and theStateofTexasas theonlynon-employercontributingentity.
During fiscalyear2020, thenumberofparticipatingemployersarepresentedinthefollowingtable.
Table9.C.1: NumberofParticipatingEmployers
ParticipatingEmployers Number
IndependentSchoolDistricts* 1,021OpenEnrollmentCharterSchools 187RegionalServiceCenters 20OtherEducationalDistricts 3Total 1,231
*ExcludesWindhamSchoolDistrictwhichisnotcoveredbyTRS-Care.
TRS-CareplanmembershipasofAugust31,2019isshowninthefollowingtable.Becausetheactuarialvaluationwasbasedonaroll-forward(SeeSectionF),thecountsareasofthatdate.
Table9.C.2: TRS-CarePlanMembershipNumbersbyCategory
MembershipType Number
Activeplanmembers 725,690
Inactiveplanmemberscurrentlyreceivingbenefits 191,250
Inactiveplanmembersentitledtobutnotyetreceivingbenefits 11,785Total 928,725
TheAverageExpectedRemainingServiceLife(AERSL)of 9.1073 is based on themembership informationasofthebeginningofthefiscalyear.
D.Contributions
Contribution rates for the TRS-Care plan areestablishedinStateStatutebytheTexasLegislature,and there is no continuing obligation to providebenefitsbeyondeachfiscalyear.TheTRS-Careplanis currently funded on a pay-as-you-go basis and issubject to change based on available funding.FundingforTRS-Careisprovidedbyretireepremiumcontributions; and contributions from the state,active employees, and participating employers arebased on active employee compensation. The TRSBoarddoesnothave theauthority to setoramendcontributionrates.
At the inceptionof theplan, fundingwasprojectedtolast10yearsthroughfiscalyear1995.Theoriginalfunding was sufficient to maintain the solvency ofthe fund through fiscal year 2000. Since that time,appropriations and contributions have beenestablished to fund thebenefits foreachsuccessivebiennium.
Section 1575.202 of the Texas Insurance CodeestablishestheState'scontributionratewhichis1.25percentof theemployee'ssalary. Section1575.203establishes the active employee rate which is 0.65percent of salary. Section 1575.204 establishes apublicschoolcontributionrateofnot lessthan0.25percentornotmorethan0.75percentofthesalaryofeachactiveemployeeoftheemployer.Theactualpublic school contribution rate is prescribed by theLegislatureintheGeneralAppropriationsAct,whichis 0.75 percent of each active employee's pay forfiscal year 2020. The following table showscontributions to the TRS-Care plan by type ofcontributor.
Table9.D.1: ContributionRatesandAmountsbyContributor
Contributor Rate Amount
ActiveEmployee 0.65% $ 243,532,120
Non-EmployerContributingEntity(State) 1.25 435,768,774ParticipatingEmployers 0.75 280,997,853Federal/PrivateFunding* 1.25 32,562,226Total $ 992,860,973
*ContributionspaidfromfederalfundsandprivategrantsareremittedbytheemployerandpaidattheStaterate.
Allemployerswhoseemployeesare coveredby theTRS pension plan are also required to pay asurcharge of $535 per month when employing aretireeoftheTRS.TheTRS-Caresurchargesforfiscalyear2020totaled$11,413,512.
A supplemental appropriation was authorized bySenate Bill 1264 of the 86th Texas Legislature toprovide $2,208,137 for fiscal year 2020 and$3,312,206 for fiscal year 2021, for consumerprotectionsagainstmedicalandhealthcarebillingbycertainout-of-networkproviders. Fundingwill be infiscalyear2021.
NotestotheFinancialStatements
74 TeacherRetirementSystemofTexas2020ComprehensiveAnnualFinancialReport

The premium rates for retirees are reflected in thefollowingtable.
Table9.D.2: 2020MonthlyPremiumRate
RetireeType MedicareNon-
Medicare
RetireeorSurvivingSpouse $ 135 $ 200RetireeandSpouse 529 689
RetireeorSurvivingSpouseandChildren 468 408
RetireeandFamily 1,020 999
E.NetOPEBLiability
Components of the Net OPEB Liability of the TRS-CareplanasofAugust31,2020aredisclosedinthefollowingtable.
Table9.E.1: NetOPEBLiability
ComponentsofLiability Amount
TotalOPEBLiability $40,010,833,815Less:PlanFiduciaryNetPosition (1,996,317,932)NetOPEBLiability $38,014,515,883
NetPositionasaPercentageofTotalOPEBLiability 4.99%
The primary reasons for this year's $12.0billion liability reduction related to thedifference between expected and actualexperienceandweredueto(a)savingstothefully-insured Medicare Advantage premiums,which resulted from Congress' repeal of theHealth Insurer Fee in December 2019 andvendorpremiumguarantees,and(b)favorableclaims and rebate experience for theprescription drug benefits provided toMedicareretirees.
F.ActuarialMethodsandAssumptionsRollForward
Theactuarial valuationwasperformedasofAugust31, 2019. Update procedures were used to rollforwardtheTotalOPEBLiabilitytoAugust31,2020.
The actuarial valuation of the OPEB plan offeredthroughTRS-Careissimilartotheactuarialvaluationperformed for the pension plan, except that theOPEB valuation is more complex. All of thedemographic assumptions, including rates ofretirement, termination, anddisability, andmost ofthe economic assumptions, including generalinflation and salary increases, used in the OPEBvaluation were identical to those used in therespectiveTRSpensionvaluation. ThedemographicassumptionsweredevelopedintheexperiencestudyperformedforTRS for theperiodendingAugust31,2017.
ThefollowingassumptionsusedformembersofTRSare identical to the assumptions employed in theAugust 31, 2020 TRS annual pension actuarialvaluation:
• RatesofMortality
• RatesofRetirement
• RatesofTermination
• RatesofDisability
• GeneralInflation
• WageInflation
• SalaryIncreases
Theactivemortalityrateswerebasedon90percentoftheRP-2014EmployeeMortalityTablesformalesand females, with full generational mortality usingScale BB. The post-retirement mortality rates forhealthy liveswere based on the 2018 TRS of TexasHealthy Pensioner Mortality Tables, with fullgenerational projection using the ultimateimprovementratesfromthemostrecentlypublishedscale(U-MP).
HealthCareTrendRates
Theinitialmedicaltrendrateswere9.00percentforMedicare retirees and 7.30 percent for non-Medicare retirees. Therewasan initialprescriptiondrugtrendrateof9.00percentforall retirees. Theinitialtrendratesdecreasetoanultimatetrendrateof4.25percentoveraperiodof13years.
FinancialSection
75 TeacherRetirementSystemofTexas2020ComprehensiveAnnualFinancialReport

Table9.F.1: ActuarialMethodsandAssumptions
Component Result
ValuationDate August31,2019rolledforwardtoAugust31,2020
ActuarialCostMethod IndividualEntry-AgeNormal
Inflation 2.30%SingleDiscountRate 2.33%asofAugust31,2020AgingFactors Basedonplanspecificexperience
ElectionRates
NormalRetirement:65%participationpriortoage65and40%participationafterage65,25%ofpre-65retireesareassumedtodiscontinuecoverageatage65
Expenses
Third-partyadministrativeexpensesrelatedtothedeliveryofhealthcarebenefitsareincludedintheage-adjustedclaimscosts.
SalaryIncreases 3.05%to9.05%,includinginflation
AdHocPost-EmploymentBenefitChanges
None
G.DiscountRate
A single discount rate of 2.33 percent was used tomeasurethetotalOPEBliability.Thiswasadecreaseof.30percentinthediscountratesincethepreviousyear. Since the plan is a pay-as-you-go plan, thesingle discount rate is equal to the prevailingmunicipalbondrate.
H.ChangeofAssumptionsSincethePriorMeasurementDate
The following assumptions, methods and planchangeswhicharespecifictoTRS-Carewereupdatedfromtheprioryear’sreport:
• The discount rate changed from 2.63percent as of August 31, 2019 to 2.33percent,asofAugust31,2020.ThischangeincreasedtheTotalOPEBLiability.
• The participation rate for post-65 retireeswasloweredfrom50percentto40percent.This change lowered the Total OPEBLiability.
• Theultimatehealth care trend assumptionwas lowered from 4.50 percent to 4.25percent as a result of Congress' repeal ofthe excise (Cadillac) tax on high-cost
employer health plans in December 2019.This change lowered the Total OPEBLiability.
I.ChangeofBenefitTermsSincethePriorMeasurementDate
There were no changes in benefit terms since thepriormeasurementdate.
J.SensitivityoftheNetOPEBLiabilitytotheSingleDiscountRateAssumption
ThefollowingpresentstheNetOPEBLiabilityoftheplanusingthediscountratefor20-year,tax-exemptgeneralobligationmunicipalbondswithanaveragerating of AA/Aa or higher, as well as what the NetOPEBLiabilitywouldbe if itwerecalculatedusingadiscount rate that is one-percentage point lower,1.33 percent, or one-percentage point higher, 3.33percent,thantheAA/Aarate.
Table9.J.1: SensitivityoftheNetOPEBLiabilitytotheSingleDiscountRateAssumption
1%DecreaseCurrentSingleDiscountRate 1%Increase
1.33% 2.33% 3.33%$ 45,617,332,072 $ 38,014,515,883 $32,009,382,286
K. Sensitivity of the Net OPEB Liability to theHealthcareCostTrendRateAssumption
The following presents the netOPEB liability of theplanusingtheassumedhealthcarecosttrendrate,aswellaswhatthenetOPEBliabilitywouldbeifitwerecalculatedusinga trendrate that isone-percentagepointlowerorone-percentagepointhigherthantheassumedhealthcarecosttrendrate.
Table9.K.1: SensitivityoftheNetOPEBLiabilitytotheHealthCareCostTrendRateAssumption
1%Decrease
CurrentHealthcare
CostTrendRate 1%Increase$ 31,052,989,071 $ 38,014,515,883 $47,286,285,654
NotestotheFinancialStatements
76 TeacherRetirementSystemofTexas2020ComprehensiveAnnualFinancialReport

Note 10: Other Post-EmploymentBenefits(OPEB)Plan-TRSEmployees
A. PlanDescription
The employees of TRS are provided post-employment health care and basic life insurancebenefits through the Texas Employees GroupBenefitsProgram(GBP).TheGBPisadministeredbythe board of trustees of the Employees RetirementSystem (ERS) of Texas and operates under theprovisions of the Texas Insurance Code, Chapter1551. TheGBP is a cost-sharing,multiple-employer,post-employmentbenefitplanwithaspecialfundingsituation.Benefitandcontributionprovisionsoftheplan are authorized by state law and may beamendedbytheTexasLegislature.
B. BenefitsProvided
ThePlancoversretiredemployeesoftheStateandotherentitiesasspecifiedbytheStatelegislature.
Eligibilityislimitedtoretirees:
• with10ormoreyearsofservicecredit,andwhoareatleast65yearsofage,or
• whenthesumofamember’sageandyearsofservicecreditequalsorexceeds80,and
• if the individual was employed, as the laststate employment before retirement, by astate agency whose employees areauthorized to participate in the groupbenefitsprogram,or
• iftheindividualretiresunderthejurisdictionof the Employees Retirement System ofTexas or the Teacher Retirement System ofTexas
Thebenefitsincludeahealthplanprovidingmedicaland prescription drug coverage and $2,500 of lifeinsurance. A retiree may pay for spouse anddependent coverageaswell as coverage fordental,vision,lifeanddependentlifeinsurance.
C.ContributorstothePlan
Contributors to the plan include state agencies,universities, junior and community colleges, otherentities,theStateofTexasastheonlynon-employercontributingentity,activeandretiredemployeesandtheirdependents.
D.Contributions
Employer and employee contribution rates aredetermined annually by the ERS Board of Trusteesbased upon the total amount appropriated by theTexasLegislature.TheStateofTexasistheonlynon-employer contributing entity in the plan and isrequiredtocontributethecostoftheretiree’sgrouphealthcoveragetotheplan.Employersarerequiredto contribute 1 percent of base payroll for grouphealthinsurance.TRSpaystheStatecontributionforitsemployeesandretirees.ForthefiscalyearendedAugust31,2020,therearefourprogramsofferedbyERS. The tablebelow represents contribution ratesforthemostprevalentprogram.
Table10.D.1: 2020ContributionRatesHealthandBasicLifePremium
TypeofCoverageEmployer
PaysEmployee
Pays
EmployeeOnly $ 624.82 $ —Employee+Spouse 982.82 358.00Employee+Children 864.52 239.70Employee+Family 1,222.52 597.70
TRScovers100percentofamemberonlypremiumand50percentoftheadditionalpremiumforfamilycoverage.Theretireecontributesanypremiumoverand above the system’s contribution for additionalcoverage. The amount of TRS contributionsrecognized by the OPEB plan during the reportingperiodwas$8,954,706.
E.OPEBPlanFiduciaryNetPosition
The fiduciary net position of the EmployeesRetirement System of Texas (ERS) and their OPEBplanhasbeendeterminedusingthefullaccrualbasisofaccountingandtheeconomicresourcesmeasure-mentfocus.ForpurposesofmeasuringtheNetOPEBLiability, this includesdeferredoutflowof resourcesand deferred inflow of resources related to OPEB,OPEB expense, and information about assets,liabilitiesandadditionstoanddeductionsfromERS’fiduciary net position. Benefits and refunds ofcontributionsarerecognizedwhendueandpayableinaccordancewiththetermsoftheplan.
FinancialSection
77 TeacherRetirementSystemofTexas2020ComprehensiveAnnualFinancialReport

TheStateRetireeHealthPlanisapay-as-you-goplanand does not accumulate funds in advance ofretirement. The ERS Board of Trustees adopted anamendmenttotheinvestmentpolicyinAugust2017requiring that all funds be invested in short-termfixed income securities and specified that theexpected rateof returnon these investments is2.4percent.
F.NetOPEBLiability
AtAugust31,2020, theamountsrecognizedbyTRSas its proportionate share of the ERS Net OPEBLiability,therelatedStatesupportandtheTotalNetOPEBLiabilityattributabletoTRSaredisclosedinthefollowingtable.
Table10.F.1: ERSNetOPEBLiability
ComponentsoftheERSOPEBLiability Amount
TRS'proportionateshareofthecollectiveNetOPEBLiability $ 104,446,218
State'sproportionateshareofthecollectiveNetOPEBLiabilityassociatedwithTRS
N/A*
Total $ 104,446,218
*PursuanttoTexasInsuranceCode,Sec.1551.315,TRSpaidtheStatecontributionforTRSemployeessincetheywerecompensatedfromfundsnotappropriatedintheGeneralAppropriationsAct;theStatewasnotallocatedanyproportionateshareofTRS’NetOPEBLiability.
TRS’ portion of the collective Net OPEB Liability atAugust 31, 2020was 0.30219368 percent andwasbased on TRS’ employer contributions to the OPEBplan relative to the employer contributions of allemployers to the plan for the period September 1,2018 through August 31, 2019. There was anincreaseof.01536518percentinTRS’proportionatesharefromtheprioryearof.2868285percent.
TheNetOPEBLiabilityatAugust31,2020wasbasedonameasurementdateofAugust31,2019,andtheTotalOPEB Liability used to calculate theNetOPEBLiabilitywasdeterminedbyanactuarialvaluationasofAugust31,2019.
G.ActuarialAssumptions
Significant assumptions and other inputs used tomeasure the Total OPEB Liability for the GroupBenefitsProgram(GPB)aredisclosedinthefollowingtable.
Table10.G.1: GroupBenefitsProgramActuarialMethodsandAssumptions
Component Result
ValuationDate August31,2019DiscountRate 2.97%ActuarialCostMethod EntryAge
AmortizationMethod LevelPercentofPayroll,Open
AmortizationPeriod 30YearsAssetValuationMethod N/A
SalaryIncreases 2.50%to9.50%includinginflation
Inflation 2.50%AdHocPost-EmploymentBenefitChanges
None
AnnualHealthcareTrendRates
HealthSelect
7.30%forFY21,7.40%forFY22,7.00%forFY23,decreasing50basispointsperyeartoanultimaterateof4.50%forFY28andlateryears
AnnualHealthcareTrendRates
HealthSelectMedicareAdvantage
10.80%forFY21,7.40%forFY22,7.00%forFY23,decreasing50basispointsperyeartoanultimaterateof4.50%forFY28andlateryears
Projectionsofthesharingofbenefit-relatedcostsarebasedonanestablishedpatternofpractice.
The sources of themortality assumptions for StateAgencyMembersare:
• For Service Retirees, Survivors and otherInactiveMembers -The2017StateRetireesof Texas Mortality table with a 1 year setforward for male CPO/CO members andUltimateMPProjectionScaleprojectedfromtheyear2017
• For Disability Retirees - The RP-2014DisabledRetireeMortalitywithUltimateMPProjection Scale projected from the year2014
• For Active Members - RP-2014 ActiveMemberMortality tables with UltimateMPProjectionScalefromtheyear2014
NotestotheFinancialStatements
78 TeacherRetirementSystemofTexas2020ComprehensiveAnnualFinancialReport

ThesourcesofthemortalityassumptionsforHigherEducationMembersare:
• For Service Retirees, Survivors and otherInactive Members - Tables based on TRSexperience with Ultimate MP ProjectionScalefromtheyear2018
• Disability Retirees - Tables based on TRSexperience with Ultimate MP ProjectionScale from theyear2018usinga3year setforward and minimum mortality rates of 4per100malemembersand2per100femalemembers
• Active Members - Sex Distinct RP-2014EmployeeMortalitymultipliedby90percentwithUltimateMPProjection Scale from theyear2014
H.DiscountRate
The discount rate used tomeasure the Total OPEBLiability was 2.97 percent. The change in thediscountratesincetheOPEBplan'spriorfiscalyear-endisadecreaseof0.99percent(from3.96percentto2.97percent),inordertoreflecttherequirementsofGASBStatement74.
Projected cash flows into the plan are equal toprojectedbenefitpaymentsoutoftheOPEBplan.
Thelong-termexpectedrateofreturnonOPEBplaninvestments, the assumed asset allocation and thearithmetic versus geometric means are notapplicable since theplanoperates on a pay-as-you-gobasisandisnotintendedtoaccumulateassets.
Themunicipal bond ratewas 2.97 percent and thesourceoftherateistheBondBuyerIndexofgeneralobligation bonds with 20 years to maturity andmixed credit quality. The bonds’ average creditquality is roughly equivalent to Moody’s InvestorsService’sAa2ratingandStandard&Poor’scorporateAArating.
Theperiodsofprojectedbenefitpaymentstowhichthelong-termexpectedrateofreturnappliesiszeroyears.
I.SensitivityoftheNetOPEBLiability
ThesensitivityoftheNetOPEBLiabilitytochangesinthe healthcare cost trend rate assumptions aredisclosedinthefollowingtable.
Table10.I.1: SensitivityoftheNetOPEBLiabilitytotheHealthcareCostTrendRateAssumptions
1%Decrease
CurrentHealthcareCost
TrendRate 1%Increase$ 87,702,565 $ 104,446,218 $ 126,326,338
ThesensitivityoftheNetOPEBLiabilitytovariationsinthesinglediscountrateassumptionisdisclosedinthefollowingtable.
Table10.I.2: SensitivityoftheNetOPEBLiabilitytotheSingleDiscountRateAssumption
1%Decrease
CurrentHealthcareCost
TrendRate 1%Increase$124,636,825 $104,446,218 $88,910,279
J. Changes of Assumptions Since the PriorMeasurementDate
DemographicAssumptions
Thefollowingassumptionshavebeenupdatedsincethe previous valuation to reflect recent planexperienceandexpectedtrends.
• Percentage of current retirees and retireespousesnotyeteligibletoparticipate intheHealthSelect Medicare Advantage Plan andfuture retireesand retiree spouseswhowillelecttoparticipateintheplanattheearliestdateatwhichcoveragecancommence
• Percentageof futuremale retireesassumedtobemarriedandelectingcoveragefortheirspouse
• Percentage of future retirees and futureretireespousesassumedtousetobacco
EconomicAssumptions
Assumedpercapitahealthbenefitcosts,andhealthbenefit costs and retiree contribution trends havebeenupdatedsincethepreviousvaluationtoreflectrecent health plan experience and its effects onshort-termexpectations.
Thediscountratewaschangedfrom3.96percentto2.97 percent as a result of requirements by GASBStatement74toutilizetheyieldorindexratefor20-year,tax-exemptgeneralobligationbondsratedAA/Aa (or equivalent) or higher in effect on themeasurementdate.
FinancialSection
79 TeacherRetirementSystemofTexas2020ComprehensiveAnnualFinancialReport

The minor benefit changes described below havebeen reflected in the FY 2020 assumed per capitahealthbenefitcosts.
K. Changes of Benefit Terms since priorMeasurementDate
TheonlybenefitchangeforHealthSelectretireesanddependentsforwhomMedicareisnotprimaryisanincrease in the out-of-pocket maximums for bothHealthSelect and Consumer Directed HealthSelecteffectiveJanuary1,2020.Theychangedfrom$6,650to $6,750 for individuals and from $13,300 to$13,500 for families in order to remain consistentwithInternalRevenueServicemaximums.
There were no benefit changes for HealthSelectretirees and the dependents forwhomMedicare isprimary.
L. OPEBExpenseandDeferredInflowandOutflowofResources
TRS recognized $7,734,365 in OPEB expense duringfiscalyear2020.
At August 31, 2020, TRS reported its proportionateshare of the ERS collective deferred outflow anddeferred inflow of resources related to OPEB fromthesourceslistedinthefollowingtable.
Table10.L.1: ERSPlanLevelDeferredInflowandOutflowofResources
Category
DeferredOutflowofResources
DeferredInflowofResources
Differencesbetweenexpectedandactualexperience
$ 39,069 $ (2,485,913)
Changesinassumptions 7,432,881 (20,328,269)
Netdifferencebetweenprojectedandactualearnings
Changesinproportionanddifferencesbetweenemployer'scontributionsandemployer'sproportionateshareofcontributions
24,979,266
EmployercontributionssubsequenttothemeasurementdateoftheendingNetOPEBLiability
$ 9,628,763
Total $ 42,079,979 $ (22,814,182)
TheOPEBexpense that TRSwill recognize in futureyearsandtheremainingbalanceofdeferredoutflowand deferred inflow of resources each year isdisclosedinthefollowingtable.
Table10.L.2: FutureYearOPEBExpenseandBalancesofDeferredInflowsandOutflows
MeasurementYearEndedAugust31,
OPEBExpenseAmounts
BalanceofDeferredOutflows(Inflows)
2020 $ 409,830 $ 9,227,2042021 409,831 8,817,3732022 2,686,336 6,131,0372023 4,217,345 1,913,6922024 1,913,692 —
Thereafter — —Total $ 9,637,034
M.OPEBPlanFinancialReport
ERS issues a publicly available financial report thatincludes financial statements and requiredsupplementaryinformationfortheGBP. Thereportmay be obtained by visiting www.ers.texas.gov, bywriting to the Finance Division of the EmployeesRetirementSystemofTexasat200East18th Street,Austin,Texas78701,orbycalling1-877-275-4377.
Note11:TRSPensionPlan
A.PlanDescription
The Teacher Retirement System of Texas (TRS orSystem or Plan) is a public employee retirementsystem (PERS) that is a multiple-employer, cost-sharing,definedbenefitpensionplanwitha specialfunding situation. The Plan is administered by theBoardofTrusteesofTRS. InformationregardingtheBoardanditscompositioncanbefoundonpage3orinNote1.
Benefits are established or amended under theauthority of the Texas Constitution, Article XVI,Section 67 and by the Legislature in the TexasGovernmentCode,Title8,SubtitleC. TheBoardofTrusteesdoesnothavetheauthoritytoestablishoramendbenefits.
NotestotheFinancialStatements
80 TeacherRetirementSystemofTexas2020ComprehensiveAnnualFinancialReport

B.BenefitsProvided
TRS provides retirement, disability, and deathbenefits. Membership in the Plan includes allemployees of public, state-supported educationalinstitutions inTexaswhoareemployed forone-halformoreofthestandardworkloadandwhoarenotexempt frommembershipunderTexasGovernmentCode,Title8,Section822.002.
Statelawrequirestheplantobeactuariallysoundinorder for the legislature to consider a benefitenhancement, such as a supplemental payment totheretirees.
InMay2019,the86thTexaslegislatureapprovedtheTRS Pension Reform Bill (SB12) that provides forgradual contribution increases from the state,participating employers and active employees tomake the pension fund actuarially sound. Theseincreases immediately made the pension fundactuarially sound and the legislature approvedfundingfora13thcheck.
AlleligiblemembersretiredasofDecember31,2018receivedanextraannuitycheckinSeptember2019in either the matching amount of their monthlyannuitypaymentor$2,000,whicheverwasless.
C.ContributorstothePlan
Contributors to the Plan include active members,employers, and the State of Texas as the only non-employer contributing entity. The State is also theemployer for senior colleges, medical schools, andstate agencies, including TRS. In each respectiverole,theStatecontributestotheplaninaccordancewith State Statutes and the General AppropriationsAct.
Thenumberofparticipatingemployersduring fiscalyear2020aredisclosedinthefollowingtable.
Table11.C.1: NumberofParticipatingEmployers
EmployerType Number
IndependentSchoolDistricts 1,022
CharterSchools(openenrollmentonly) 187
CommunityandJuniorColleges 50SeniorCollegesandUniversities 48RegionalServiceCenters 20MedicalSchools 9EducationalDistricts 3StateAgency 1Total 1,340
PlanmembershipasofAugust31,2019 isshown inthefollowingtable. Becausetheactuarialvaluationwas based on a roll forward from fiscal year 2019(see Section F), thePlanmembership counts are asofAugust31,2019.
Table11.C.2: PensionPlanMembershipNumbersbyCategory
PensionPlanMemberType Number
Retiredplanmembersorbeneficiariescurrentlyreceivingbenefits 434,426
Inactiveplanmembersentitledtobutnotyetreceivingbenefits 310,716Activeplanmembers 884,540Total 1,629,682
TheAverageExpectedRemainingServiceLife(AERSL)of6.2975yearsisbasedonmembershipinformationasofthebeginningofthefiscalyear.
D.Contributions
Contribution requirements are established oramendedpursuanttothefollowingstatelaws:
• Article 16, Section 67 of the TexasConstitution requires the legislature toestablishamembercontributionrateofnotless than6percentof themember'sannualcompensation and a state contribution rateofnotlessthan6percentandnotmorethan10 percent of the aggregate annualcompensation paid to members of theSystemduringthefiscalyear.
• GovernmentCodesection821.006prohibitsbenefit improvements if it increases theamortization period of TRS' unfundedactuarialliabilitytogreaterthan31yearsor,iftheamortizationperiodalreadyexceeds31years,theperiodwouldbeincreasedbysuchaction.Actuarial implicationsofthefundingprovided in thismanner are determined bytheSystem'sactuary.
Asthenon-employercontributingentity,theStateofTexas contributes to the retirement system thecurrent employer contribution rate times theaggregate annual compensation of all members ofthe Plan during the fiscal year, reduced by theemployercontributionsdescribedbelow.
AllparticipatingemployersandtheStateofTexas,asthe employer for senior universities and medicalschools, are required to pay the employercontributionrateinthefollowingsituations:
FinancialSection
81 TeacherRetirementSystemofTexas2020ComprehensiveAnnualFinancialReport

• On the portion of a member's salary thatexceedsthestatutoryminimumformembersentitled to the statutory minimum underSection21.402oftheTexasEducationCode
• During a new member's first 90 days ofemployment
• When any or all of an employee's salary ispaid by federal, private, local or non-educationalandgeneralfunds
• Whentheemployingdistrictisapublicjuniorcollege or junior college district, theemployer shall contribute to the retirementsystemanamountequalto50percentofthestate contribution rate for certaininstructional or administrative employeesand 100 percent of the state contributionrateforallotheremployees.
The following table showscontributions to thePlanbytypeofcontributorforthefiscalyear2020.
Table11.D.1: ContributionRatesandAmountsbyContributor
ContributorContribution
Rate Amount
Member 7.7% $ 3,736,877,464
Non-EmployerContributingEntity(State) 7.5 1,844,999,393Employers 7.5 1,525,401,297Total $ 7,107,278,154
Employersarealsorequiredtopaysurchargesinthefollowingcases:
• All public schools, charter schools andregional education service centers mustcontribute 1.5 percent of the member'ssalarybeginninginfiscalyear2020,graduallyincreasingto2percentinfiscalyear2025.
• When employing a retiree of TRS, theemployer shall pay an amount equal to themember contribution and the statecontribution as an employment afterretirementsurcharge.
Employersurchargespaidforthefiscalyear2020areshownbelow.
Table11.D.2: EmployerSurcharges
Surcharge Rate Amount
PublicEducationEmployers 1.5% $ 461,074,239
EmploymentafterRetirement-Employer 7.5 14,071,826
EmploymentafterRetirement-Employee 7.7 15,934,274Total $ 491,080,339
Thecurrentandfuturecontributionratesareshownbelow.
Table11.D.3: ContributionRatesbyContributor
FiscalYear State
PublicEducationEmployer
ActiveEmployee
2020 7.50% 1.50% 7.70%2021 7.50 1.60 7.702022 7.75 1.70 8.002023 8.00 1.80 8.002024 8.25 1.90 8.252025 8.25 2.00 8.25
E.NetPensionLiability
ComponentsoftheNetPensionLiabilityofthePlanasofAugust31,2020aredisclosedbelow.
Table11.E.1: NetPensionLiability
ComponentsofLiability Amount
TotalPensionLiability $ 218,974,205,084
Less:PlanFiduciaryNetPosition (165,416,245,243)NetPensionLiability $ 53,557,959,841
NetPositionasPercentageofTotalPensionLiability 75.54%
F.ActuarialMethodsandAssumptions
RollForward
Theactuarial valuationwasperformedasofAugust31, 2019. Update procedures were used to rollforward the total pension liability to August 31,2020.
Thetotalpensionliabilityisdeterminedbyanannualactuarial valuation. The actuarial methods andassumptionswereselectedbytheBoardofTrusteesbased upon analysis and recommendations by theSystem's actuary. The Board of Trustees has soleauthority to determine the actuarial assumptionsused for the Plan. The actuarial methods and
NotestotheFinancialStatements
82 TeacherRetirementSystemofTexas2020ComprehensiveAnnualFinancialReport

assumptions were primarily based on a study ofactual experience for the three year period endingAugust31,2017andwereadoptedinJuly2018.
Theactivemortalityrateswerebasedon90percentoftheRP2014EmployeeMortalityTablesformalesand females with full generational mortality. Thepost-retirement mortality rates for healthy liveswere based on the 2018 TRS of Texas HealthyPensioner Mortality Tables with full generationalprojection using the ultimate improvement ratesfromthemostrecentlypublishedprojectionscaleU-MP.
The long-term expected rate of return on pensionplan investments is 7.25 percent. The long-termexpected rate of return on plan investments wasdetermined using a building-blockmethod inwhichbest-estimaterangesofexpectedfuturerealratesofreturn (expected returns, net of pension planinvestmentexpense,andinflation)aredevelopedforeachmajorassetclass. Theserangesarecombinedtoproducethelong-termexpectedrateofreturnbyweightingtheexpectedfuturerealratesofreturnbythetargetassetallocationpercentageandbyaddingexpectedinflation.BestestimatesofgeometricrealratesofreturnforeachmajorassetclassincludedintheSystem'stargetassetallocationasofAugust31,2019aresummarizedinNote3.
The following table discloses the assumptions thatwereappliedtothismeasurementperiod.
Table11.F.1: ActuarialMethodsandAssumptions
Component Result
ValuationDate August31,2019rolledforwardtoAugust31,2020
ActuarialCostMethod IndividualEntryAgeNormal
AssetValuationMethod MarketValue
SingleDiscountRate 7.25%
Long-termExpectedRate 7.25%
MunicipalBondRateasofAugust2020
2.33%-SourcefortherateistheFixedIncomeMarketData/YieldCurve/DataMunicipalbondswith20yearstomaturitythatincludeonlyfederallytax-exemptmunicipalbondsasreportedinFidelityIndex's"20-YearMunicipalGOAAIndex"
LastyearendingAugust31inProjectionPeriod(100years)
2119
Inflation 2.30%
SalaryIncreases 3.05%to9.05%includinginflation
Adhocpost-employmentbenefitchanges
None
Theactuarialassumptionsusedinthedeterminationof the total pension liability are the sameassumptions used in the actuarial valuation as ofAugust 31, 2019. For a full description of theseassumptions please see the actuarial valuationreportdatedNovember14,2019
FinancialSection
83 TeacherRetirementSystemofTexas2020ComprehensiveAnnualFinancialReport

G.DiscountRate
A single discount rate of 7.25 percent was used tomeasure the total pension liability. The singlediscount rate was based on the expected rate ofreturn on plan investments of 7.25 percent. Theprojectionofcashflowsusedtodeterminethissinglediscountrateassumedthatcontributionsfromactivemembers, employers and the non-employercontributing entitywill bemadeat the rates set bytheLegislatureduringthe2019legislativesession.Itis assumed that future employer and statecontributionswillbe8.50percentofpayroll infiscalyear 2020 gradually increasing to 9.55 percent ofpayrolloverthenextseveralyears.Thisincludesallemployer and state contributions for active andrehiredretirees.
Based on these assumptions, the pension plan’sfiduciary net positionwas projected to be availableto make all projected future benefit payments ofcurrent plan members. Therefore, the long-termexpectedrateofreturnonpensionplaninvestmentswas applied to all periods of projected benefitpaymentstodeterminethetotalpensionliability.
H.ChangeofAssumptionsSincethePriorMeasure-mentDate
There were no changes in assumptions since thepriormeasurementdate.
I. Sensitivity of the Net Pension Liability to theSingleDiscountRateAssumption
Thefollowingtablepresentsthenetpensionliabilityof theplanusing thediscount rateof7.25percent,andwhatthenetpensionliabilitywouldbeifitwerecalculated using a discount rate that is onepercentage point lower (6.25 percent) or onepercentage point higher (8.25 percent) than thecurrentrate.
Table11.I.1: SensitivityoftheNetPensionLiabilitytotheSingleDiscountRateAssumption
1%DecreaseCurrentSingleDiscountRate 1%Increase
6.25% 7.25% 8.25%
$ 82,585,415,626 $53,557,959,841 $29,973,787,965
J.DeferredRetirementOptionProgram
The Deferred Retirement Option Plan (DROP) wasclosedtonewmembersonDecember31,2005.ThePlan was available for active members who were
eligible for normal age retirement with at least 25yearsofcreditedservice.Participationoptionswerein 12-month increments for up to five years. Fordetailed information on the Plan, see the SummaryofBenefitssection.ThebalanceintheDROPreserveaccountatAugust31,2020was$2,600,898.
K.FundingProgress
TherequiredScheduleofChangesintheEmployer'sNetPensionLiabilityandRelatedRatiosimmediatelyfollowing the Notes to the Financial Statementspresents multi-year trend information aboutwhetherthenetpositionofthePlanisincreasingordecreasingrelativetothepensionliabilityovertime.
Note12:RiskManagement
The77thTexasLegislatureenactedtheTexasActiveSchoolEmployeesUniformGroupBenefitsAct (H.B.3343),establishinganewstatewidehealthcoverageprogram for public school employees and theirdependents.TRSbeganadministeringthisprogram,known as TRS-ActiveCare, September 1, 2002. Theplanisavailabletoallpublicschooldistricts,charterschools with open enrollment, regional servicecenters and certain other employers. The riskassociatedwiththisprogramisretainedbytheplan'sparticipants, andno risk is transferred to theplan'sadministrators,toemployers,ortothestate.
Note13:ComponentUnits
A.Description
Teacher Retirement Investment Company of Texas,Ltd. (TRICOT) is a limited liability corporationorganized under United Kingdom (UK) law thatbeganoperating inNovember2015. TRS isthesoleshareholderof TRICOT. TRS formedTRICOT for thepurposeofopeningaLondon investmentofficeandincreasing investment opportunities for the TRSportfolio. TRICOT is presented as a blendedcomponentunit in thePensionTrust Fund fiduciaryfundtypeofTRSwithafiscalyear-endofAugust31.
B.CriteriaforInclusionasaComponentUnit
TRS used the following criteria and determinedTRICOT to be a component unit according to GASB14,asmodifiedbyGASB39and61:
• TRICOT is considered a special-purposegovernmententityengagedonly in fiduciaryactivitiesonbehalfofTRS.
NotestotheFinancialStatements
84 TeacherRetirementSystemofTexas2020ComprehensiveAnnualFinancialReport

• TRICOT is a part of the System. TRSmaintainscompletecontroloverTRICOTandall relatedassets. IfTRICOTweredissolved,anyremainingassets,netofliabilities,wouldrevertbacktoTRS.
• Asa"privatelimitedliabilitycompany"intheUK, TRICOT is legally separate according toGASB14,paragraph15.
• TRS' executive director, as a shareholderrepresentative,appointsthesoledirectorofTRICOT.
• TRICOT is financially dependent upon TRSandhasnoothersourcesoffunding.
• TRICOTprovidesservicesexclusivelytoTRS.
• It would be misleading to excludeTRICOTinthefinancialstatements.
Written requests for TRICOT's financial statementsshouldbeaddressedto:
CommunicationsDepartmentTeacherRetirementSystemofTexas
1000RedRiverStreetAustin,TX787011-800-223-8778
FinancialSection
85 TeacherRetirementSystemofTexas2020ComprehensiveAnnualFinancialReport

Thispageisintentionallyleftblank.
86 TeacherRetirementSystemofTexas2020ComprehensiveAnnualFinancialReport

RequiredSupplementaryInformation
PensionTrustFund
ScheduleofChangesintheEmployers'NetPensionLiabilityandRelatedRatios....................... 88ScheduleoftheNetPensionLiability............................................................................................ 90
ScheduleofEmployerandNon-EmployerContributingEntityActuariallyDeterminedContributions(ADC)...................................................................................................................... 91NotestotheScheduleofActuariallyDeterminedContributions................................................. 91
MethodsandAssumptionsUsedtoDetermineContributionRates............................................. 91ScheduleofInvestmentReturns.................................................................................................. 92ScheduleofEmployer's(TRS)ProportionateShareofERS'NetOPEBLiability............................ 92ScheduleofEmployer's(TRS)ContributionstoERS'OPEBPlan................................................... 92TRS-Care
ScheduleofChangesinEmployers'NetOPEBLiabilityandRelatedRatios 93ScheduleoftheNetOPEBLiability............................................................................................... 94
FinancialSection
87 TeacherRetirementSystemofTexas2020ComprehensiveAnnualFinancialReport

ScheduleofChangesintheEmployers'NetPensionLiabilityandRelatedRatiosPensionTrustFundFortheFiscalYearsEndedAugust31LastTenFiscalYears*(DollarsinThousands)
2020 2019 2018 2017
TotalPensionLiabilityServiceCost $ 5,651,647 $ 5,642,075 $ 4,654,171 $ 4,489,046InterestontheTotalPensionLiability 15,014,048 14,267,256 14,109,277 13,515,486BenefitChanges — 588,828 — —
DifferencesbetweenExpectedandActualExperience (259,157) (982,694) — (969,831)ChangesofActuarialAssumptions — (7,425,279) 22,106,679 700,880BenefitPayments (10,972,292) (11,253,729) (10,172,997) (9,775,775)RefundsofMemberAccounts (421,366) (486,461) (422,336) (420,421)NetChangeinTotalPensionLiability $ 9,012,880 $ 349,996 $ 30,274,794 $ 7,539,385
BeginningTotalPensionLiability $ 209,961,325 $ 209,611,329 $ 179,336,535 $ 171,797,150EndingTotalPensionLiability(a) $ 218,974,205 $ 209,961,325 $ 209,611,329 $ 179,336,535
PlanFiduciaryNetPositionEmployerContributions $ 2,016,482 $ 1,761,822 $ 1,671,257 $ 1,588,309MemberContributions 3,736,877 3,482,870 3,360,773 3,242,556
Non-EmployerContributingEntityContributions 1,844,999 1,737,852 1,715,785 1,697,963NetInvestmentIncome*** 11,032,131 7,669,029 11,242,814 17,079,807BenefitPayments (10,972,292) (11,253,729) (10,172,997) (9,775,775)RefundsofMemberAccounts (421,366) (486,461) (422,336) (420,421)AdministrativeExpenses (67,136) (60,486) (64,926) (44,190)Other 268,351 558,400 (123,390) (14,964)NetChangeinPlanFiduciaryNetPosition** $ 7,438,046 $ 3,409,297 $ 7,206,980 $ 13,353,285
BeginningPlanFiduciaryNetPosition $ 157,978,199 $ 154,568,902 $ 147,361,922 $ 134,008,637EndingPlanFiduciaryNetPosition(b) $ 165,416,245 $ 157,978,199 $ 154,568,902 $ 147,361,922
EndingNetPensionLiability(a)-(b) $ 53,557,960 $ 51,983,126 $ 55,042,427 $ 31,974,613*ScheduleispresentedonaprospectivebasisinaccordancewithGASB67,paragraph50.
**PriorperiodadjustmentisreportedinNetChangeinPlanFiduciaryNetPosition.
***ExcludesSecuritiesLending,whichisreportedinOther.
RequiredSupplementaryInformation
88 TeacherRetirementSystemofTexas2020ComprehensiveAnnualFinancialReport

(Continued)
2016 2015 2014
$ 4,392,077 $ 4,225,449 $ 3,965,994 12,896,571 12,555,646 11,813,446 — — —
373,669 (1,588,619) 482,639 — (1,474,724) 2,028,541 (9,379,123) (8,935,112) (8,548,643) (373,419) (391,341) (410,600)$ 7,909,775 $ 4,391,299 $ 9,331,377
$ 163,887,375 $ 159,496,076 $ 150,164,699$ 171,797,150 $ 163,887,375 $ 159,496,076
$ 1,483,390 $ 1,377,973 $ 984,552 2,943,669 2,576,024 2,357,686
1,675,631 1,591,483 1,530,624 9,193,281 (412,759) 19,434,430 (9,379,123) (8,935,112) (8,548,643) (373,419) (391,341) (410,600) (44,403) (35,557) (41,904) (29,095) (11,248) 84,954$ 5,469,931 $ (4,240,537)$ 15,391,099
$ 128,538,706 $ 132,779,243 $ 117,388,144$ 134,008,637 $ 128,538,706 $ 132,779,243
$ 37,788,513 $ 35,348,669 $ 26,716,833
FinancialSection
89 TeacherRetirementSystemofTexas2020ComprehensiveAnnualFinancialReport

ScheduleoftheNetPensionLiabilityPensionTrustFundFortheFiscalYearsEndedAugust31LastTenFiscalYears*
FiscalYearTotalPension
Liability PlanNetPositionNetPension
Liability
PlanNetPositionasa%ofTotalPensionLiability CoveredPayroll
NetPensionLiabilityasa
%ofCoveredPayroll
2014 $ 159,496,075,886 $132,779,243,085 $ 26,716,832,801 83.25% $ 36,654,290,800 72.89%2015 163,887,375,172 128,538,706,212 35,348,668,960 78.43 38,448,124,045 91.942016 171,797,150,487 134,008,637,473 37,788,513,014 78.00 40,742,826,333 92.752017 179,336,534,819 147,361,922,120 31,974,612,699 82.17 42,111,120,273 75.932018 209,611,328,793 154,568,901,833 55,042,426,960 73.74 43,646,405,156 126.112019 209,961,325,288 157,978,199,075 51,983,126,213 75.24 45,232,074,364 114.932020 218,974,205,084 165,416,245,243 53,557,959,841 75.54 48,530,876,156 110.36
*ThisscheduleispresentedonaprospectivebasisinaccordancewithGASB67,paragraph50
RequiredSupplementaryInformation
90 TeacherRetirementSystemofTexas2020ComprehensiveAnnualFinancialReport

ScheduleofEmployerandNon-EmployerContributingEntityActuariallyDeterminedContributions(ADC)PensionTrustFundFortheFiscalYearsEndedAugust31
FiscalYear
ActuariallyDeterminedContribution
ActualContribution
ContributionDeficiency(Excess) CoveredPayroll
ActualContributionasa%ofCovered
Payroll
2014 $ 3,177,927,012 $ 2,515,176,220 $ 662,750,792 $ 36,654,290,800 6.86%2015 3,171,970,234 2,969,455,641 202,514,593 38,448,124,045 7.722016 3,226,831,846 3,159,020,596 67,811,250 40,742,826,333 7.752017 3,343,622,950 3,286,271,953 57,350,997 42,111,120,273 7.802018 3,426,242,805 3,387,041,853 39,200,952 43,646,405,156 7.762019 4,288,000,650 3,499,674,404 788,326,246 45,232,074,364 7.742020 4,527,930,745 3,861,481,029 666,449,716 48,530,876,156 7.96
Thisschedulewillultimatelycontain10yearsofinformation.AdditionalyearswillbepresentedonaprospectivebasisinaccordancewithGASB67,paragraph50
NotestotheScheduleofActuariallyDeterminedContributions
ValuationDate August31,2019(todeterminecontributionrateforfiscalyearendingAugust31,2020)
Notes ActuariallydeterminedcontributionratesarecalculatedasofAugust31oftheprecedingfiscalyear.
Membersandemployerscontributebasedonstatutorilyfixedrates.
MethodsandAssumptionsUsedtoDetermineContributionRates
Component Result
ActuarialCostMethod IndividualEntryAgeNormalactuarialcostmethodAmortizationMethod LevelPercentageofPayroll,Floating
RemainingAmortizationPeriod
29yearsbasedonincreasedemployerandmembercontributionratesenactedduringthe2019legislativesession
AssetValuationMethod 5yearsmoothedmarket
Inflation 2.30%SalaryIncreases 3.05%to9.05%,includinginflation
InvestmentRateofReturn 7.25%
RetirementAgeExperience-basedtableofratesthatarespecifictothetypeofeligibilitycondition.Lastupdatedforthe2018valuationpursuanttoanexperiencestudyconductedfortheperiodendingonAugust31,2017.
Mortality Theactivemortalityrateswerebasedon90%oftheRP-2014EmployeeMortalityTablesformalesandfemaleswithfullgenerationalmortality.
Post-Retirement:Thepost-retirementmortalityratesforhealthyliveswerebasedonthe2018TRSofTexasHealthyPensionerMortalityTables,withfullgenerationalprojectionusingtheultimateimprovementratesfromthemostrecentlypublishedprojectedscale"U-MP".
BenefitImprovements None
BenefitChanges None
FinancialSection
91 TeacherRetirementSystemofTexas2020ComprehensiveAnnualFinancialReport

ScheduleofInvestmentReturnsAnnualMoney-WeightedRateofReturn,NetofInvestmentExpensePensionTrustFundFortheFiscalYearsEndedAugust31LastTenFiscalYears
2020 2019 2018 2017 2016 2015 2014 2013 2012 2011
7.2% 5.1% 7.8% 13.0% 7.3% (0.3)% 16.9% 9.0% 7.4% 15.6%
ScheduleofEmployer's(TRS)ProportionateShareofERS'NetOPEBLiabilityPensionTrustFundFortheFiscalYearsEndedAugust31LastTenFiscalYears*
FiscalYear
Employer's(TRS)Proportionate
ShareofCollectiveNetOPEBLiability
Employer's(TRS)Proportionate
ShareofCollectiveNetOPEBLiability%
Employer's(TRS)CoveredEmployee
Payroll
Employer'sProportionateShareofCollectiveNetOPEBLiabilityasa%ofEmployer's(TRS)CoveredEmployee
Payroll
ERSFiduciaryNetPositionasa%ofTotalOPEBLiability
2018 $ 81,850,260 0.2402202% $ 53,125,065 154.07% 2.04%2019 85,009,492 0.2868285 60,679,696 140.10 1.272020 104,446,218 0.3021937 67,365,146 155.04 0.17
TheamountspresentedaboveareasofthemeasurementdateofthecollectiveNetOPEBLiabilityfortherespectivefiscalyear.
*Thisschedulewillultimatelycontain10yearsofinformation.AdditionalyearswillbepresentedonaprospectivebasisinaccordancewithGASB75,paragraph245.
ScheduleofEmployer's(TRS)ContributionstoERS'OPEBPlanPensionTrustFundFortheFiscalYearsEndedAugust31LastTenFiscalYears*
FiscalYear
StatutoryEmployer(TRS)Contributions**
ActualEmployer(TRS)
Contributions***
ContributionsDeficiency(Excess)
Employer's(TRS)Covered
EmployeePayroll
Employer(TRS)Contributionsasa%ofCoveredEmployee
Payroll
2018 $ 2,251,441 $ 2,251,441 $ — $ 53,125,065 4.24%2019 8,954,706 8,954,706 — 60,679,696 14.762020 9,628,763 9,628,763 — 67,365,146 14.29
Theamountspresentedaboveareasoftheemployer'smostrecentfiscalyearend.
*Thisschedulewillultimatelycontain10yearsofinformation.AdditionalyearswillbepresentedonaprospectivebasisinaccordancewithGASB75,paragraph245.
**ERSexcludedActiveEmployeeHealthInsuranceContributionsinfiscalyear2018only.
***Contributionsarenotbasedonameasurementofpay.
RequiredSupplementaryInformation
92 TeacherRetirementSystemofTexas2020ComprehensiveAnnualFinancialReport

ScheduleofChangesinEmployers'NetOPEBLiabilityandRelatedRatiosTRS-CareFortheFiscalYearsEndedAugust31LastTenFiscalYears*(DollarsinThousands)
2020 2019 2018 2017**
TotalOPEBLiabilityServiceCost $ 2,580,691 $ 2,306,961 $ 2,284,418 $ 4,312,406InterestontheTotalOPEBLiability 1,304,452 1,904,512 1,524,880 2,356,367ChangesofBenefitTerms — — — (18,610,363)
DifferencesbetweenExpectedandActualExperience (11,973,222) (7,950,584) 2,979,259 (1,027,634)ChangesofActuarialAssumptions 64,950 2,133,219 936,862 (19,563,767)BenefitPayments (549,284) (540,351) (881,714) (995,486)NetChangeinTotalOPEBLiability $ (8,572,413)$ (2,146,243)$ 6,843,705 $ (33,528,477)
BeginningTotalOPEBLiability $ 48,583,247 $ 50,729,490 $ 43,885,785 $ 77,414,262EndingTotalOPEBLiability(a) $ 40,010,834 $ 48,583,247 $ 50,729,490 $ 43,885,785
PlanFiduciaryNetPositionEmployerContributions $ 324,974 $ 305,363 $ 296,098 $ 215,361
Non-EmployerContributingEntityContributions 666,588 482,056 789,870 324,662MemberContributions 243,532 227,338 221,325 213,241NetInvestmentIncome 25,537 25,047 10,127 4,697BenefitPayments**** (549,284) (540,351) (881,714) (995,486)AdministrativeExpense (7,069) (6,006) (6,672) (4,954)Other 18 — (29,995) 529
NetChangeinPlanFiduciaryNetPosition*** $ 704,296 $ 493,447 $ 399,039 $ (241,950)
BeginningPlanFiduciaryNetPosition $ 1,292,022 $ 798,575 $ 399,536 $ 641,486EndingPlanFiduciaryNetPosition(b) $ 1,996,318 $ 1,292,022 $ 798,575 $ 399,536
EndingNetOPEBLiability(a)-(b) $ 38,014,516 $ 47,291,225 $ 49,930,915 $ 43,486,249
*TotalOPEBliabilityispresentedonaprospectivebasisinaccordancewithGASB74,paragraph62.
**2017wasrevisedduetoanamendedGASB74report.
***PriorperiodadjustmentisreportedinNetChangeinPlanFiduciaryNetPosition.
****BenefitPaymentsareshownnetofHealthCarePremiumspaidbyRetirees
FinancialSection
93 TeacherRetirementSystemofTexas2020ComprehensiveAnnualFinancialReport

ScheduleoftheNetOPEBLiability
TRS-Care
FortheFiscalYearsEndedAugust31
LastTenFiscalYears*
FiscalYear TotalOPEBLiability PlanNetPosition NetOPEBLiability
PlanNetPositionasa%ofTotalOPEBLiability CoveredPayroll
NetOPEBLiabilityasa
%ofCoveredPayroll
2017 $ 43,885,784,621 $ 399,535,986 $ 43,486,248,635 0.91% $ 32,806,335,231 132.55%
2018 50,729,490,103 798,574,633 49,930,915,470 1.57 34,050,058,000 146.64
2019 48,583,247,239 1,292,022,349 47,291,224,890 2.66 34,975,146,769 135.21
2020 40,010,833,815 1,996,317,932 38,014,515,883 4.99 37,466,480,000 101.46
*ThisscheduleispresentedonaprospectivebasisinaccordancewithGASB74,paragraph62.
RequiredSupplementaryInformation
94 TeacherRetirementSystemofTexas2020ComprehensiveAnnualFinancialReport

OtherSupplementaryInformation
Schedule1 ScheduleofAdministrativeandInvestingActivityExpenses........................ 96Schedule2 ScheduleofProfessionalandConsultingServices......................................... 100
FinancialSection
95 TeacherRetirementSystemofTexas2020ComprehensiveAnnualFinancialReport

Schedule1ScheduleofAdministrativeandInvestingActivityExpensesAllFundsFortheFiscalYearEndedAugust31,2020
PensionTrustFund
Benefits Investments
AdministrativeExpensesPersonnelServicesSalariesandWages $ 31,366,860 $ 56,461,931PayrollRelatedCosts 608,583 3,873,079TotalPersonnelServices $ 31,975,443 $ 60,335,010
TotalProfessionalFeesandServices $ 6,537,419 $ 3,212,615
OtherOperatingExpensesTravel $ 150,305 $ 813,674MaterialsandSupplies
ConsumableSuppliesandFuels 201,218 71,404SubscriptionsandReferenceInformation 1,199,712 1,019,027Postage,MailingandDeliveryServices 2,301,422 106,908FurnitureandEquipment-Expensed 361,617 1,122,925
CommunicationsandUtilities 803,628 1,122,499RepairsandMaintenance
SoftwarePurchasesandMaintenance 1,844,318 2,703,911ComputerHardwareMaintenance 129,056 1,265,761BuildingsandEquipmentMaintenance 875,878 652,292
RentalsandLeases 374,584 4,268,661PrintingandReproduction 114,780 56,474DepreciationExpense 2,636,125 38,378AmortizationExpense 10,299,336 —Gain/LossonCapitalAssets — —OtherExpenses
Dues,FeesAndStaffDevelopment 143,338 280,288InsurancePremiums 272,839 410,882MiscellaneousExpenses 6,914,860 1,802,432
TotalOtherOperatingExpenses $ 28,623,016 $ 15,735,516
TotalAdministrativeExpenses $ 67,135,878 $ 79,283,141
OtherSupplementaryInformation
96 TeacherRetirementSystemofTexas2020ComprehensiveAnnualFinancialReport

(Continued)
TRS-CareTRS-
ActiveCare Total
$ 2,279,916 $ 1,834,500 $ 91,943,207 636,255 309,932 5,427,849$ 2,916,171 $ 2,144,432 $ 97,371,056
$ 2,056,684 $ 978,464 $ 12,785,182
$ 47,632 $ 19,049 $ 1,030,660
33,016 2,969 308,607 82,943 31,604 2,333,286 502,701 6 2,911,037 88,843 32,520 1,605,905 90,667 49,317 2,066,111
238,647 88,640 4,875,516 110,996 41,227 1,547,040 77,765 29,016 1,634,951 79,908 9,287 4,732,440 18,435 336 190,025 — — 2,674,503 — — 10,299,336 — — —
47,132 23,440 494,198 35,786 13,296 732,803 641,279 282,582 9,641,153$ 2,095,750 $ 623,289 $ 47,077,571
$ 7,068,605 $ 3,746,185 $ 157,233,809
FinancialSection
97 TeacherRetirementSystemofTexas2020ComprehensiveAnnualFinancialReport
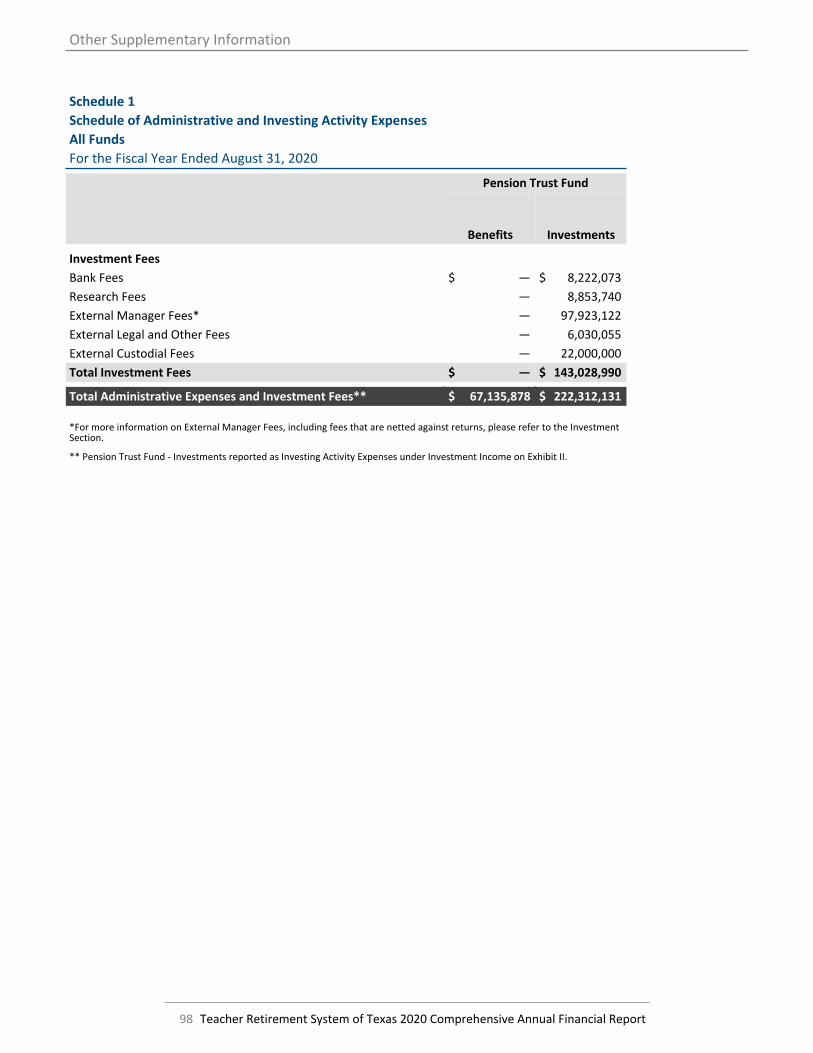
Schedule1ScheduleofAdministrativeandInvestingActivityExpensesAllFundsFortheFiscalYearEndedAugust31,2020
PensionTrustFund
Benefits Investments
InvestmentFeesBankFees $ — $ 8,222,073ResearchFees — 8,853,740ExternalManagerFees* — 97,923,122ExternalLegalandOtherFees — 6,030,055ExternalCustodialFees — 22,000,000TotalInvestmentFees $ — $ 143,028,990TotalAdministrativeExpensesandInvestmentFees** $ 67,135,878 $ 222,312,131
*FormoreinformationonExternalManagerFees,includingfeesthatarenettedagainstreturns,pleaserefertotheInvestmentSection.
**PensionTrustFund-InvestmentsreportedasInvestingActivityExpensesunderInvestmentIncomeonExhibitII.
OtherSupplementaryInformation
98 TeacherRetirementSystemofTexas2020ComprehensiveAnnualFinancialReport

(Continued)
TRS-CareTRS-
ActiveCare Total
$ — $ — $ 8,222,073 — — 8,853,740 — — 97,923,122 — — 6,030,055 — — 22,000,000$ — $ — $ 143,028,990
$ 7,068,605 $ 3,746,185 $ 300,262,799
FinancialSection
99 TeacherRetirementSystemofTexas2020ComprehensiveAnnualFinancialReport

Schedule2ScheduleofProfessionalandConsultingServicesAllFundsFortheFiscalYearEndedAugust31,2020
Amount AmountConsultingServices InvestmentResearchFeesProvaliantHoldingsLLC $ 1,013,040 WolfeAdvisorsLP $ 1,200,000AddisonProfFinancialSearchLLC 227,620 JPMorganSecurities 1,109,294CornerstoneOnDemandInc 126,148 MacquarieGroup 980,156CBREInc 94,154 CreditSuisse 965,380FocusConsultingGroupInc 87,583 Jefferies&Company 432,401ReengineConsultingLLC 83,765 ExaneBNP 427,662SquareOneConsultantsInc 79,557 SanfordBernstein 350,000InternationalCenterforManagement 77,000 BankofAmericaMerrillLynch 346,303RhyanTechnologyServicesLLC 48,612 HSBCBank 333,016CEBInc 19,880 NomuraGroup 250,000RabaKistnerInc 17,800 GreenStreetAdvisors 215,000GuidehouseLLP 17,428 CLSALimited 200,288TroyLColemanPHDInc 17,127 EvercoreISI 187,500IntegroInc 11,166 DeutscheBank 185,747TotalConsultingServices $ 1,920,880 SMBCNikko 166,139Financial&AccountingServices KeplerCheuvreux 155,397GabrielRoederSmith&Company $ 962,099 RSEnergyGroupResearch 127,500Ernst&YoungLLP 608,387 RaymondJames 122,627SegalCompany(Southeast)Inc 607,833 RobertWBaird 111,821DeloitteConsultingLLP 551,990 GLGResearch 90,000TexasStateAuditor'sOffice 289,000 GartnerResearch 75,000GallagherBenefitServicesInc 124,136 GrupoSantander 65,140CEMBenchmarkingInc 120,000 CornerstoneMacro 62,500MillimanInc 88,000 BCAResearch 62,500GrantThorntonLLP 54,880 BMOCapitalMarkets 62,500MyersandStaufferLC 46,692 Keefe,Bruyette&Woods 62,500TotalFinancial&AccountingServices $ 3,453,017 Redburn(Europe)Limited 62,500InvestmentConsultingServices KeyBancCapitalMarkets 58,256Albourne $ 1,319,600 StifelNicolaus&Co. 54,965AONHewittConsultingServices 1,261,900 RBCCapitalMarkets 51,126AlliedConsultantsInc 150,554 ReorgAmericas 45,000KeithCBrown 80,000 PiperJaffray 43,764TotalInvestmentConsultingServices $ 2,812,054 Zelman&Associates 37,500ITConsultingServices TheLeutholdGroup 32,000PerspectaInc $ 2,629,244 EmpiricalResearchPartners 25,000NeosConsultingGroupLLC 1,310,903 YardeniResearch 25,000AdvancedCallCenterTechLLC 579,665 BerenbergCapitalMarkets 24,758CatapultSystemsLLC 398,223 RenaissanceMacro 15,000ApexSystemsInc 333,343 BTGPactual 12,500TalendInc 136,850 InstitutionalResearch 12,500PresidioNetworkedSolGroupLLC 39,161 TotalInvestmentResearchFees $ 8,846,240GTSTechnologySolutionsInc 32,089 LegalServicesAndisitesInc 10,000 NortonRoseFulbrightUSLLP $ 908,943TotalITConsultingServices $ 5,469,478 SeyfarthShawLLP 799,153
MorganLewis&BockiusLLP 795,652
OtherSupplementaryInformation
100 TeacherRetirementSystemofTexas2020ComprehensiveAnnualFinancialReport

(Continued)
Amount AmountFosterPepperPLLC 699,112 TemporaryEmploymentServicesJacksonWalkerLLP 547,376 TEKsystemsInc $ 555,350Foley&LardnerLLP 297,458 RobertHalf 418,133KattenMuchinRosenmanLLP 275,222 StateStreetBank 396,837DLAPiperLLPUS 257,894 Kforce 252,975IceMillerLLP 171,328 HorizonsHRSLLC 200,190PurringtonMoodyWeilLLP 136,130 V-SoftConsultingGroupInc 187,150CohenMilsteinSellers&TollPLLC 98,723 MitchellMartin 82,753ReinhartBoernerVanDeurenSC 72,748 SOALTechnologiesLLC 81,048BLASchwartzPC 64,279 Accountemps 79,746SimpsonThacher&BartlettLP 40,694 OfficeTeam 66,597GoodwinProcterLLP 15,791 TheComputerMerchant 66,500Debevoise&Plimpton 11,400 TotalTemporaryEmploymentServices $ 2,387,279TotalLegalServices $ 5,191,903MedicalServicesAliceDCoxMD $ 44,000 TotalProfessionalandConsulting
Services $ 31,976,864BrianBuckMD 44,000DavidERothschildMD 44,000TotalMedicalServices $ 132,000OtherProfessionalServicesValuationResearchCorporation $ 265,845InternationalBusinessMachinesCorp 256,753Studio8ArchitectsInc 178,003CoachingByCornerstone 105,640UniversityofTexas-Austin 86,240TexasA&MUniversity 58,493 AmericanRealtyProjectMgmtLLC 52,381Perkins+WillInc 42,194LeanneLowishConsulting 31,394HRLegalSearchLLC 30,000Jordan-MarkhamExecutiveCoaching 27,600HorizonsSouthwestManagementLP 21,233QVerityInc 20,458WorkersAssistanceProgramInc 15,780LinkedInCorporation 14,707SHIGovernmentSolutionsInc 11,850SCGatton&AssociatesInc. 10,144AggregatePayeeslessthan$10,000 125,413TotalOtherProfessionalServices $ 1,354,128ResearchServices
AeroTek $ 351,205Info-TechResearchGroupInc 58,680TotalResearchServices $ 409,885
FinancialSection
101 TeacherRetirementSystemofTexas2020ComprehensiveAnnualFinancialReport

Thispageisintentionallyleftblank.
102 TeacherRetirementSystemofTexas2020ComprehensiveAnnualFinancialReport

Fiscal Year 2020 presented the TRS Pension Fund (Trust) with unprecedented challenges due to the globalCOVID-19 pandemic. The first quarter of 2020 was a period of historically high volatility in the markets thatresultedinadrawdownfortheS&P500andtheTrust.Attheendofthefirstquarter,March31,2020,theS&P500wasdown-19.6%whiletheTRSPensionFundonlydropped-8.3%,adirectresultofTRS’diversifiedportfolio.Despiteanadverseimpacttotheeconomyandrecessionaryconditions,globalmarketsstagedahistoricrecoverythroughoutthefinalmonthsofFY2020,andtheTrustreturned7.24%foryearendedAugust31,2020,ontargetwiththe7.25%investmentreturnassumption.Asaresult,thetotalinvestmentvalueofthefundasofAugust31,2020stoodat$164.6billion,a$7.2billionincreaseoverlastyear,netofbenefitpayments.Annualratesofreturnfor the 5-year and 10-year periods ending August 31, 2020, were 8.1% and 8.8%, respectively. Investmentperformance is independently calculated using a time-weighted rate of return by State Street Bank and TrustCompany,thefund’scustodianbank,usingindustrybestpractices.
InFY2020,theTRSInvestmentManagementDivision(IMD)completedanextensiveprocesstoimplementtheTRSBoard of Trustee’s approved recommendations to the Trust’s Strategic Asset Allocation. The implementationrefined the Strategic Asset Allocation tomake itmore balanced and efficient through increased allocations toPrivate Markets as well as the increased use of Risk Parity and Asset Allocation Leverage. TRS’ long-terminvestment strategy is centered on a broad diversification of assets so the total portfolio canweather volatilemarketconditionssuchas thoserecentlybroughtonduringtheCOVID-19pandemic.Thecurrentmixofpublic,private,U.S.and internationalassetsalongwithactiveandpassiveassetmanagementprovided the fundmuchneededdiversificationwhilepreservingtheflexibilitytoquicklycapitalizeonchangingconditions.Giventhehighlevel of uncertainty driven by the economic slowdown, TRS’s investment division also tookmultiple protectivemeasuresby re-prioritizingand focusingon liquidity,portfolio rebalancing, riskmitigation (especially those thatmightdemandcapital)andidentifyingnewopportunities.
TheBuild theFleetandReduce InvestmentFees initiativealsocontinued itsefforts throughFY2020despite thechallengespresentedbyCOVID-19.Whiletheoriginalgoalofhiring120investorandoperationalsupportpositionsremainsunchanged,theexpecteddurationoftheprogramwasextendedfromaFY2023completiontoFY2025.Since the inception of this initiative, TRS hired an additional 42 investment professionals, bolstering TRS’scapability to increasedirectprincipal investmentsandsignificantly lowermanagement feesandcarried interestthatwouldhaveotherwisebeenincurredusingexternalmanagers.
OnthePrivateMarketsside,aslowdowninmarketactivityduetothepandemichastemporarilyimpededIMD’sabilitytoachieve2020investmentgoals.TheIMDinitiallysetagoalfor2020ofcommitting$2.8billiontoPrivateEquityopportunities,$2.0billiontoEnergy,NaturalResourcesandInfrastructureinvestments,and$4.2billiontoReal Estate. In light of the current market conditions, IMD’s Private Markets investment teams continue tocarefully source and perform due diligence on select deals that will be accretive to Trust performance in thisenvironment. The teams also completed deep dive reviews on all assetswith adverse exposure to the currentenvironment and continue close monitoring. The current Private Markets component of the asset allocationcomprised33%oftheTrustandasofAugust31,2020wasvaluedat$54.2billionwithareturnof0.7%forthecurrentyear.
In Public Markets, IMD’s investment portfolios endured a historic market drawdown event and subsequentlybenefittedfromthefastestrecoveryonrecord.AmongtheTrust’smoredefensiveStableValueassets,the$23.7billion Government Bonds portfolio returned 12.9% for the fiscal-year ended August 31, 2020. Global stockmarkets increased sharply since themarket trough inMarch, and the Trust’s Public Equity investments had apositive return of 11.9% for the year. Within the portfolio, US Equities and EmergingMarkets Equities had a
InvestmentOverview
104 TeacherRetirementSystemofTexas2020ComprehensiveAnnualFinancialReport

particularlystrongyear, returning13.4%and15.4%,respectively.TheTrustassetallocationhad41.3% inPublicEquityinvestmentsvaluedat$67.9billionasofAugust31,2020,includingover$30billionininternally-managedstrategies.
TRS continues to develop ongoing relationships with emerging managers as an additional diversificationcomponentfortheTrust’s long-termgrowth.Sinceinception,$4.4billionhasbeencommittedwithfundsunderfourmajorassetclasses.TheteambeganimplementationofEmergingManagerSelect,a$1billionprogramwithincreased allocations to two existing Emerging Managers within Real Estate. This capital will promote andstrengthentherelationshipswiththesemanagersastheytransitionfromtheEmergingManagerProgram(EMP)intothemainTrust.
The IMDRisk andPortfolioManagement (RPM)Teamplayeda critical role innavigating theTrust through thisyear’svolatilemarketconditionsbysuccessfullymanagingliquidityandapplyingseveralriskmitigationmeasures.Throughouttheturbulentmarketconditions,theRPMteamwasabletomonitortheTrust’sintradaycashneedsand impactsona real timebasis,ultimatelyprotectingTRS’ability toensureongoingdeliveryofbenefits to itsmembers.ThroughoutFY2020, theRPMGroupalso furtherdevelopedand integrated thecapability toproducedynamicdatatoenhanceportfoliomanagementdecisionmakingthatisusefultomanagetheTrustthroughhighriskeventssuchastheCOVID-19pandemic.Duetothesignificantmarketvolatilityandshockeventtofinancialmarkets,theRiskParityportfoliostruggledinthesecondhalfofFY2020,resultinginareturnof-1.9%forFY2020.TRSwill continue to conscientiously andprudentlymanage theTrust for the long-term financial interestof themembersweserve. Ifwecanprovideyouwithadditional informationontheTrust’sperformance,please letusknow.
Preparedby:InvestmentStaffoftheSystem
InvestmentSection
105 TeacherRetirementSystemofTexas2020ComprehensiveAnnualFinancialReport

Thispageisintentionallyleftblank.
106 TeacherRetirementSystemofTexas2020ComprehensiveAnnualFinancialReport

ReportonInvestmentActivities
Table1: AssetAllocation......................................................................................................... 109Table2: InvestmentSummary................................................................................................. 110Table3: InvestmentAllocations.............................................................................................. 111Table4: LargestFixedIncomeInvestments............................................................................ 112Table5: LargestEquityInvestments........................................................................................ 112Table6: PolicyBenchmarks..................................................................................................... 113Table7: InvestmentPerformance:Time-WeightedReturns................................................... 114Table8: InvestmentManagerFees........................................................................................ 116Table9: BrokerCommissions.................................................................................................. 117
InvestmentSection
107 TeacherRetirementSystemofTexas2020ComprehensiveAnnualFinancialReport

A.InvestmentPolicy
The Board of Trustees (Board) has the primaryfiduciary responsibility for investing the TeacherRetirement System of Texas (TRS or System) trustassets in accordancewith Article XVI, Section 67 oftheTexasConstitutionandwithapplicablelaw.TheBoard establishes investment objectives and policy,obtains expert advice and assistance, and overseesthe employment of a qualified and competentinvestment staff, the Investment ManagementDivision (IMD), and legal staff. The Board alsomonitors the actions of staff, consultants andadvisorstoensurecompliancewithitspolicies. TheBoard has a Policy Committee of the Board, anInvestment Management Committee of the Boardand a Risk Management Committee of the Board,eachofwhich isastandingcommitteeoftheBoardcharged with those responsibilities set forth in theBylaws of the Board. The Board and the IMD areassisted by outside investment consultants andinternalandexternallegalcounsel.
Thetotaloroverall investmentportfolio includesallassetsinvestedbyTRStoprovideretirement,death,health, and disability benefits administered by theSystem, and is structured and managed to achievethefollowingobjectives:
a. Controlriskthroughproperdiversificationofasset classes and by establishing long-termriskandreturnexpectations;and
b. Asapplicable to thepensionplan,achievealong-termrateofreturnthat:
i. Exceeds the assumed actuarial rateofreturnadoptedbytheBoard;
ii. Exceeds the long-term rate ofinflationbyanannualized5percent;and
iii. Exceeds the return of the FundPolicyBenchmark.
B.PortfolioStructure
TRS follows a diversified investment approach thatfocusesonthethreemostcommoneconomic
scenarios. Scenario One is characterized byfavorableGrossDomesticProduct(GDP)growthandmoderate inflation as measured by the ConsumerPrice Index (CPI), which has been the prevailingeconomic condition 68 percent of the time since1948. Scenario Two is oneof lowGDPgrowthandhigh inflation,whichhasoccurred18percentofthetime. Finally, Scenario Three is characterized bystagnant GDP growth and low inflation, which hasoccurred14percentofthetime.TRSispositionedtotake advantage of any of these various marketscenarios.
TRS' long-term asset allocation target is 54 percenttoGlobalEquitymarkets,whichshouldperformwellunder Scenario One, 21 percent to Real Return,which should perform well in Scenario Two, 21percent to a Stable Value portfolio, which shouldperformwellandminimizedownsideriskinScenarioThree, and 8 percent to the Risk Parity strategy,whichhasabalancedexposuretoallthreeeconomicscenarios.
C.AssetAllocation
The normal portfolio mix represents the portfoliothatisexpectedtomeettheBoard'sactuarialreturnobjectivesforthePensionTrustFundwithintherisktolerances specified in the Investment PolicyStatement. Each asset class allocation percentagehas a "long-term target" positionwithin the overallportfolio and a maximum and minimum rangearound that targetallocation. Allpercentages refertomarketvalue.
Generally Accepted Accounting Principles (GAAP)and the Governmental Accounting Standards Board(GASB) require that investmentsbe reportedat fairvalueinthebasicfinancialstatements(Exhibit1andNote 3). However, the System's asset allocation isbased onmarket value,which includes investment-relatedcash,receivables,andpayablesandsecuritiessoldshort.Theseitemscannotbeincludedaspartofthe fair value of investments underGAAP. Table 1presents the asset allocation policy ranges andmarketvaluesasofAugust31,2020.AreconciliationtofairvalueisprovidedfollowingTable1.
ReportonInvestmentActivities
108 TeacherRetirementSystemofTexas2020ComprehensiveAnnualFinancialReport

Table1: AssetAllocationasofAugust31,2020
PolicyRange ActualValue
AssetClassMinimumRange
MaximumRange Target MarketValue
%ofTotalFund
GlobalEquityPublicEquityUSA 13% 23% 18% $ 29,891,445,394 18.2%Non-USDeveloped 8 18 13 22,899,071,492 13.9EmergingMarkets 4 14 9 15,132,251,309 9.2PrivateEquity 9 19 14 23,926,520,448 14.5TotalGlobalEquity 47% 61% 54% $ 91,849,288,643 55.8%
StableValueGovernmentBonds —% 21% 16% $ 23,680,390,453 14.4%StableValueHedgeFunds — 10 5 8,219,074,368 5.0AbsoluteReturn — 20 — 6,052,166,750 3.7TotalStableValue 14% 28% 21% $ 37,951,631,571 23.1%
RealReturnRealEstate 10% 20% 15% $ 22,023,052,723 13.4%Energy,NaturalResources&Infrastructure 1 11 6 8,224,730,641 5.0Commodities — 5 — 342,168,423 0.2TotalRealReturn 14% 28% 21% $ 30,589,951,787 18.6%
TotalRiskParity 0% 13% 8% $ 13,255,957,133 8.1%
AssetAllocationLeverageCash —% 7% 2% $ 2,545,971,089 1.5%AssetAllocationLeverage — — (6) (11,551,276,554) (7.0)NetAssetAllocationLeverage (4)% $ (9,005,305,465) (5.5)%
TotalFundMarketValue 100% $ 164,641,523,669 100.0%
ReconcilingItemsInvestmentRelatedCash $ (319,585,957)InvestmentRelatedReceivables (2,332,843,811)InvestmentRelatedPayables 2,745,764,923SecuritiesSoldShort 1,594,473,921ObligationsunderReverseRepurchaseAgreements 7,150,529,625CollateralObligations* 122,851,836TotalReconcilingItems $ 8,961,190,537
TotalFundFairValue(Exhibit1) $ 173,602,714,206
*ExcludesSecuritiesLendingCollateralObligations.
InvestmentSection
109 TeacherRetirementSystemofTexas2020ComprehensiveAnnualFinancialReport

Table2: InvestmentSummaryasofAugust31(DollarsinBillions)
MarketValueAssetClass 2010 2015 2017 2019 2020
GlobalEquityPublicEquityUSA1 $ 27.389 $ 26.355 $ 27.404 $ 22.813 $ 26.006Non-USDeveloped1 9.126 20.175 19.655 19.825 21.237EmergingMarkets1 12.848 11.437 14.231 13.187 15.090DirectionalHedgeFunds1,4 N/A 6.222 5.894 5.841 5.589PrivateEquity 8.501 16.032 18.488 23.055 23.927TotalGlobalEquity $ 57.864 $ 80.221 $ 85.672 $ 84.721 $ 91.849
StableValueGovernmentBonds2 $ 18.214 $ 16.980 $ 20.816 $ 21.363 $ 23.680StableValueHedgeFunds4 3.947 5.395 5.642 6.588 8.219AbsoluteReturn4 4.786 2.961 2.349 5.756 6.052TotalStableValue $ 26.947 $ 25.336 $ 28.807 $ 33.707 $ 37.952
RealReturnRealEstate4 $ 7.664 $ 16.495 $ 17.802 $ 21.534 $ 22.023
Energy,NaturalResources&Infrastructure4 N/A 2.259 5.650 8.933 8.225Commodities 2.068 0.244 0.075 0.192 0.342TotalRealReturn $ 9.732 $ 18.998 $ 23.527 $ 30.659 $ 30.590
TotalRiskParity4 N/A $ 2.715 $ 7.307 $ 8.459 $ 13.256
AssetAllocationLeverageAssetAllocationLeverage N/A N/A N/A $ (2.835)$ (11.551)Cash3 $ 0.700 $ 0.673 $ 0.814 2.722 2.546
NetAssetAllocationLeverage N/A N/A N/A $ (0.113)$ (9.005)
TotalFund $ 95.243 $ 127.943 $ 146.127 $ 157.433 $ 164.641
1InFiscalYear2020DirectionalHedgeFundswereallocatedacrossUSA,NonUS-Developed,andEmergingMarketEquities.2InFiscalYear2020TIPSandUSTreasurieswerecombinedundertheStableValueAllocationintoGovernmentBonds.3CashwasincludedwiththeStableValueAllocationthroughFY2018.4AllocationincludesAlternativeInvestments.
ReportonInvestmentActivities
110 TeacherRetirementSystemofTexas2020ComprehensiveAnnualFinancialReport

Table3: InvestmentAllocationsofAugust31
%ofTotalFundAssetClass 2010 2015 2017 2019 2020
GlobalEquityPublicEquityUSA1 28.8% 20.6% 18.8% 14.5% 15.8%Non-USDeveloped1 9.6 15.8 13.5 12.6 12.9EmergingMarkets1 13.5 8.9 9.7 8.4 9.2DirectionalHedgeFunds1,4 N/A 4.9 4.0 3.7 3.4PrivateEquity4 8.9 12.5 12.7 14.6 14.5TotalGlobalEquity 60.8% 62.7% 58.6% 53.8% 55.8%
StableValueGovernmentBonds2 19.1% 13.3% 14.2% 13.6% 14.4%StableValueHedgeFunds4 4.1 4.2 3.9 4.2 5.0AbsoluteReturn4 5.0 2.3 1.6 3.7 3.7TotalStableValue 28.3% 19.8% 19.7% 21.4% 23.1%
RealReturnRealEstate4 8.0% 12.9% 12.2% 13.7% 13.4%
Energy,NaturalResources&Infrastructure4 N/A 1.8 3.9 5.7 5.0Commodities 2.2 0.2 0.1 0.1 0.2TotalRealReturn 10.2% 14.8% 16.1% 19.5% 18.6%
TotalRiskParity4 N/A 2.1% 5.0% 5.4% 8.1%
AssetAllocationLeverageAssetAllocationLeverage N/A N/A N/A (1.8)% (7.0)%Cash3 0.7% 0.5% 0.6% 1.7 1.5NetAssetAllocationLeverage N/A N/A N/A (0.1)% (5.5)%
TotalFund 100.0% 100.0% 100.0% 100.0% 100.0%
1InFiscalYear2020DirectionalHedgeFundswereallocatedacrossUSA,NonUS-Developed,andEmergingMarketEquities.2InFiscalYear2020TIPSandUSTreasurieswerecombinedundertheStableValueAllocationintoGovernmentBonds.3CashwasincludedwiththeStableValueAllocationthroughFY2018.4AllocationincludesAlternativeInvestments.
InvestmentSection
111 TeacherRetirementSystemofTexas2020ComprehensiveAnnualFinancialReport

D.LargestHoldings
FixedIncomeInvestments
Table4disclosestheFund'stenlargestfixedincomeinvestmentsasofAugust31,2020reportedatGAAPfair valuewhich constitute 27.7 percent of all fixedincome securities. A complete list of fixed incomeinvestments is available by contacting the TRSCommunicationsDepartment.
Table4: LargestFixedIncomeInvestmentsasofAugust31,2020
Rank FixedIncomeSecurities ParValueGAAP
FairValue
%ofTotalFixedIncomeInvestments
1 U.STreasuryBond3.375%Due11/15/2048 $ 656,785,000 $ 956,443,156 4.0%2 U.STreasuryBond3.000%Due05/15/2047 619,697,500 838,915,491 3.53 U.STreasuryBond2.875%Due11/15/2046 612,225,000 809,093,602 3.44 U.STreasuryBond3.000%Due05/15/2049 477,400,000 640,088,969 2.75 U.STreasuryBond2.000%Due02/15/2050 562,010,000 636,827,581 2.76 U.STreasuryBond1.250%Due05/15/2050 583,320,000 554,154,000 2.37 U.STreasuryBond3.000%Due02/15/2049 404,605,000 553,739,874 2.38 U.STreasuryBond2.250%Due08/15/2049 459,234,500 546,991,343 2.39 U.STreasuryBond3.000%Due02/15/2047 399,960,000 540,883,406 2.310 U.STreasuryBond3.125%Due05/15/2048 378,070,000 525,930,814 2.2
TotalTopTen $ 5,153,307,000 $ 6,603,068,236 27.7%
TotalFixedIncomeSecurities $ 23,812,737,094
EquityInvestments
Table 5 discloses the Fund's ten largest equityinvestmentsasofAugust31,2020reportedatGAAPfairvaluewhichconstitute11.7percentoftheFund'stotalequityexposure.
Acomplete listofequity investments isavailablebycontactingtheTRSCommunicationsDepartment.
Table5: LargestEquityInvestmentsasofAugust31,2020
Rank EquityHoldings TotalSharesGAAP
FairValue
%ofTotalEquity
Investments
1 ALIBABAGROUPHOLDINGSPADR 3,000,652 $ 861,277,144 1.8%2 TENCENTHOLDINGSLTD 11,774,855 805,992,217 1.73 APPLEINC 6,213,933 801,845,914 1.74 MICROSOFTCORP 2,922,071 659,014,673 1.45 AMAZON.COMINC 176,808 610,157,336 1.36 TAIWANSEMICONDUCTORMANUFAC 37,713,970 548,199,929 1.2
7 SAMSUNGELECTRONICSCOLTD 7,434,707 337,969,676 0.78 ALPHABETINCCLA 196,139 319,614,385 0.79 FACEBOOKINCCLASSA 996,369 292,135,391 0.610 PERSHINGSQUAREHOLDINGSLTD/F 10,303,383 286,949,217 0.6
TotalTopTen 80,732,887 $ 5,523,155,882 11.7%
TotalEquityHoldings $ 47,146,352,906
ReportonInvestmentActivities
112 TeacherRetirementSystemofTexas2020ComprehensiveAnnualFinancialReport

E.InvestmentResults
PerformanceReporting
Each asset class is described by an associatedbenchmark that describes, in general terms, theopportunitysetandreturncharacteristicsassociatedwiththeassetclass.Forcertainprivateormore
complex asset classes, the benchmark serves as aproxy for expected returns rather than anapproximation of the actual investments that willcharacterizethatcomponentoftheportfolio.ThosebenchmarksareidentifiedinTable6andarereferredtoasthe"PolicyBenchmarks".
Table6: PolicyBenchmarks
AssetClass BenchmarkPortfolio
GlobalEquityUSA MSCIUSAInvestableMarketNon-USDeveloped MSCIEAFEandCanadaEmergingMarkets MSCIEMPrivateEquity CustomizedStateStreetPrivateEquityIndex–laggedone
quarterStableValue
GovernmentBonds BloombergBarclaysLongTreasuryIndexAbsoluteReturn 3MonthLIBOR+2%StableValueHedgeFunds HFRIFundofFundsConservative
RealReturnRealEstate NCREIFODCE–laggedonequarterEnergy,NaturalResources&Infrastructure
40%CambridgeAssociatesNaturalResources40%CambridgeAssociatesInfrastructure20%quarterlyConsumerPriceIndex–laggedonequarter
Commodities GoldmanSachsCommodityIndexRiskParity
RiskParity HFRRiskParityVol12InstitutionalIndexAssetAllocationLeverage
Cash FTSE3MonthTreasuryBillAssetAllocationLeverage 3MonthLIBOR
PerformanceResults
Investment performance is calculated using a time-weighted rate of return. Returns are calculated byStateStreetBankandTrustCompany,TRS'custodianbank, independently and using industry bestpractices. The total time-weighted rates of returnhavebeenadjustedforcashflowsandarecalculatednet of bank fees, external manager fees, externallegalfees,andexternalcustodialfees.
Administrativeexpenses for the IMDarenotnettedagainstorincludedinperformancecalculations.
Due to TRS' fiscal year ending on August 31, 2020,the most complete performance and benchmarkinformationbyassetclass isavailableasofJune30,2020, presented in Table 7. For a complete list ofcompositebenchmarkcompositions,contacttheTRSCommunicationsDepartment.
InvestmentSection
113 TeacherRetirementSystemofTexas2020ComprehensiveAnnualFinancialReport

Table7: InvestmentPerformance:Time-WeightedReturnsasofJune30,2020
AssetClass 2020 3Years 5Years 10Years
GlobalEquityUSA 0.2% 6.7% 7.3% 11.8%USACompositeBenchmark 6.7 10.2 10.1 13.8
Non-USDeveloped (3.8) 1.1 2.1 6.2Non-USDevelopedCompositeBenchmark (5.3) 0.9 2.0 5.4
EmergingMarkets (2.2) 2.5 3.7 4.0EmergingMarketsCompositeBenchmark (3.2) 2.0 2.9 3.3
PrivateEquity (1.9) 7.8 8.6 12.4PrivateEquityCompositeBenchmark (1.7) 7.9 8.5 10.6
TotalGlobalEquity (1.7)% 4.6% 5.4% 8.7%GlobalEquityCompositeBenchmark (0.6)% 5.5% 6.1% 8.8%
StableValueGovernmentBonds 26.3% 12.4% 9.6% 8.3%GovernmentBondsBenchmark 25.4 12.0 9.3 7.7
AbsoluteReturn (1.0) 3.8 4.8 9.3AbsoluteReturnCompositeBenchmark 3.6 4.0 3.5 2.9
StableValueHedgeFunds 2.4 3.8 4.1 4.0StableValueHedgeFundsCompositeBenchmark (0.6) 1.9 1.5 2.7
TotalStableValue 16.2% 8.9% 7.9% 7.3%StableValueCompositeBenchmark 19.1% 9.7% 7.4% 6.5%
RealReturnRealEstate 4.6% 8.5% 9.6% 12.0%RealEstateCompositeBenchmark 3.9 5.9 7.5 10.4
Energy,NaturalResources&Infrastructure (13.1) 0.4 N/A N/A
Energy,NaturalResources&InfrastructureCompositeBenchmark (10.7) 0.6 N/A N/A
Commodities 40.6 (5.0) — (8.3)CommoditiesCompositeBenchmark (33.9) (8.7) (12.5) (8.5)
TotalRealReturn (0.6)% 5.4% 6.7% 8.2%RealReturnCompositeBenchmark (0.2)% 3.9% 5.2% 7.6%
TotalRiskParity (5.7)% 3.9% 4.3% —%RiskParityBenchmark 0.3% 5.6% 4.9% —%
AssetAllocationLeverageCash 1.0% 1.8% 1.8% 1.7%CashCompositeBenchmark 1.6 1.8 1.2 0.6
NetAssetAllocationLeverage
TRS 1.8% 5.8% 6.3% 8.5%CustomBenchmark 3.3% 6.2% 6.3% 8.4%
ReportonInvestmentActivities
114 TeacherRetirementSystemofTexas2020ComprehensiveAnnualFinancialReport

%Return
Time-WeightedReturnsasofJune30,2020
1.8
5.86.3
8.5
3.3
6.2 6.3
8.4
TRS Benchmark
2020 3Years 5Years 10Years0.0
2.5
5.0
7.5
10.0
F.FeesandCommissions
InvestmentManagerFees
Management and Performance Fees that are paidfrom the Pension Trust Fund are charged by themanager or general partner to cover normaloperating costs and the expenses of administeringthe partnership. The manager or general partnerusually receives an annualmanagement fee paid inquarterly, but sometimes in semi-annual or annualinstallments, from the limited partners.Management fees are typically 1.5 percent to 2percent of the investment or the investmentcommitment during the investment period and aresometimesscaleddownaftertheinvestmentperiod.Themanagement fee rate,basis for thecalculation,and specific terms are agreed to in the LimitedPartnershipAgreement(LPA).
Performance fees/carried interest are accrued andpaid based on the amount of profit or returns inexcessofabenchmarkorhurdlerateestablished inthe LPA. Certain other management fees arecharged by investment partnerships and nettedagainst the investment earnings of the partnership.For investments in Private Equity, Real Assets,Energy, Natural Resources and Infrastructure,Performance Fees/Carried Interest represent thegeneral partner's share of the partnership's profits,
which is typically20percent,with80percentgoingtolimitedpartners,suchasTRS.
Carriedinterestiscalculatedandpaidaspartnershipinvestmentsarerealized,andcarriedinterestontheunrealizedinvestmentsisaccruedoverthelifeofthepartnershipbasedonthecurrentvaluation.
FeespaidfromthePensionTrustFundarebookedasexpenses on the income statement. Fees nettedagainst returns are charged by investmentpartnerships and netted against the investmentearnings of the partnership. Generally, theinformation for fees netted against returns arerequestedand received fromFundgeneralpartnerson a quarterly basis. Due to the timing ofinformation received from Fund general partners,feespaidoraccrued inconjunctionwith investmentactivities, along with the related market value ofassets under management, is presented for thecalendaryearendedJune30,2020inTable8.
TheamountoffeespaidfromthePensionTrustFundand booked as expenses in Table 8 are for thecalendaryearendedJune30,2020. TheamountoffeespaidfromthePensionTrustFundandbookedasexpenses for the fiscalyearendedAugust31,2020,whichappearinExhibitIIandSchedule1asExternalManager Fees, amounted to $97,923,122, whichincludes $48,440,261 in management fees and$49,482,861inperformancefees.
InvestmentSection
115 TeacherRetirementSystemofTexas2020ComprehensiveAnnualFinancialReport

Table8: InvestmentManagerFees1
forthePeriodEndedJune30,2020
FeesPaidfromthePensionTrustFund2 FeesNettedAgainstReturns
AssetClass
MarketValueofAssetsUnderManagement
ManagementFees
PerformanceFees
ManagementFees
PerformanceFees/Carried
Interest
GlobalEquityPublicEquityUSA $ 26,563,708,023 $ 17,949,271 $ 19,148,216 $ 48,103,217 $ 68,731,800Non-USDeveloped 21,280,847,381 11,193,386 9,700,275 28,612,866 9,686,674EmergingMarkets 14,541,293,813 13,973,801 13,593,173 6,568,244 25,289,897
PrivateEquity 21,744,755,968 — — 200,966,527 197,886,121TotalGlobalEquity $ 84,130,605,185 $ 43,116,458 $ 42,441,664 $ 284,250,854 $ 301,594,492
StableValueGovernmentBonds $ 23,425,117,736 $ 3,492,004 $ 2,239,261 $ — $ —AbsoluteReturn 5,515,765,871 1,299,338 833,206 19,928,838 8,924,756StableValueHedgeFunds 8,126,573,680 — — 104,906,927 85,765,407TotalStableValue $ 37,067,457,287 $ 4,791,342 $ 3,072,467 $ 124,835,765 $ 94,690,163
RealReturnRealAssets $ 22,044,831,805 $ 715,695 $ 1,590,084 $ 158,184,942 $ 78,801,925
Energy,NaturalResources&Infrastructure 7,969,748,572 618,405 571,724 77,923,573 43,195,601Commodities 270,417,739 66,176 42,435 — —TotalRealReturn $ 30,284,998,116 $ 1,400,276 $ 2,204,243 $ 236,108,515 $ 121,997,526
TotalRiskParity $ 12,544,141,216 $ 2,017,867 $ — $ 11,605,719 $ 337,445
AssetAllocationLeverage $(12,621,860,823)$ — $ — $ — $ —
Cash 3,797,149,202 — — — —TotalAssetAllocationLeverage $ (8,824,711,621)$ — $ — $ — $ —
TotalFund $155,202,490,183 $ 51,325,943 $ 47,718,374 $ 656,800,853 $ 518,619,626
1FeespresentedareforthecalendaryearendedJune30,2020.Theyareunauditedandsubjecttochange.FinalauditednumberswillbepresentedintheTRS2020ComprehensiveAnnualFinancialreport.
2TheamountoffeespaidfromthePensionTrustFundandbookedasexpensesforthefiscalyearendedAugust31,2020amountedto$97,923,122,whichincludes$48,440,261inmanagementfeesand$49,482,861inperformancefees.
BrokerCommissions
Brokercommissionsaretheincrementaldirectcostsincurred to purchase, sell, or transfer investmentassets and liabilities. Table 9 presents thecommissionspaidtobrokersforthefiscalyearendedAugust31,2020.Over32trillionsharesweretradedby183brokers,andcommissionspaidamountedtoover$50million.
ForthefiscalyearendedAugust31,2020,aportionof the total commissions was paid through variousCommissionSharingArrangements(CSA)and
Commission Recapture Arrangements (CRA). CSAproceeds generated $14,519,545 and were used inaccordance with Section 28(e) of the SecuritiesExchange Act of 1934 to acquire research servicesfrom various investment-related firms, totaling$13,373,452. CRAproceedsgenerated$59,183andwere used to acquire services totaling $233,773.Unspent CSA proceeds, totaling $8,741,846, andunspentCRAproceeds,totaling$376,172,wereheldby State Street Bank and Trust Company as theFund'sCSAandCRAAdministrator.
ReportonInvestmentActivities
116 TeacherRetirementSystemofTexas2020ComprehensiveAnnualFinancialReport

Vendor paid expenses are legal arrangements thatare used to acquire investment-related items otherthanthosepaidforwithcommissioncreditproceeds.Throughcontractualagreementswithvariousfirms,
theFundbenefitedfrom$7,758,922invendorpaidexpensesandcontractualallowancesforthefiscalyearendedAugust31,2020.
Table9: BrokerCommissionsfortheFiscalYearEndedAugust31,2020
BrokerageFirm SharesTraded CommissionsPaid*GOLDMANSACHS 12,057,545,042,860 $ 8,037,603BANKOFAMERICAMERRILLLYNCH 190,351,411,791 5,199,841CREDITSUISSEFIRSTBOSTON 962,007,614,676 5,074,744JPMORGANCHASE 687,337,037,609 4,149,663CITIBANK 8,294,992,492,293 2,780,148MORGANSTANLEY 825,367,899,564 2,705,672JEFFERIES+COMPANYINC 134,853,113,716 1,995,464UBSAG 603,325,715,989 1,918,024BANKOFNEWYORK 624,034,365 1,819,896CLSA 332,820,438,940 1,606,426
Summaryofremaining173brokeragefirms 8,628,242,430,342 14,985,350
Total 32,717,467,232,145 $ 50,272,831*Commissionspaidpershareislessthan$0.01.
InvestmentSection
117 TeacherRetirementSystemofTexas2020ComprehensiveAnnualFinancialReport

Thispageisintentionallyleftblank.
ReportonInvestmentActivities
118 TeacherRetirementSystemofTexas2020ComprehensiveAnnualFinancialReport


Thispageisintentionallyleftblank.
120 TeacherRetirementSystemofTexas2020ComprehensiveAnnualFinancialReport

PensionTrustFundActuarialInformation
Actuary'sCertificationLetter........................................................................................ 122Table1: ActuarialPresentValueofFutureBenefits................................................................... 128Table2: SummaryofCostItems................................................................................................. 128
FinancingObjectiveandFundingPolicy........................................................................ 129ActuarialMethodsandAssumptions............................................................................ 129
Table3: PostRetirementMortalityProjections........................................................................ 130Table4: AssumedRetirementAge............................................................................................. 131Table5: ProbabilityofDecrementDuetoDisability.................................................................. 131Table6: ProbabilityofDecrementDuetoDeath....................................................................... 131Table7: ProbabilityofDecrementDuetoTermination............................................................. 131Table8: RatesofSalaryIncreaseDuetoMeritandPromotion.................................................. 132Table9: ActiveMemberPayrollValuationData........................................................................ 133
Table10: Retirees,Beneficiaries,andDisabledParticipantsAddedtoandRemovedfromMembership................................................................................................................. 133
Table11: AnalysisofFinancialExperience................................................................................... 134Table12: SolvencyTest................................................................................................................. 134Table13: ScheduleofFundingProgress...................................................................................... 135
ActuarialSection
121 TeacherRetirementSystemofTexas2020ComprehensiveAnnualFinancialReport

PensionTrustFund
122 TeacherRetirementSystemofTexas2020ComprehensiveAnnualFinancialReport

ActuarialSection
123 TeacherRetirementSystemofTexas2020ComprehensiveAnnualFinancialReport

PensionTrustFund
124 TeacherRetirementSystemofTexas2020ComprehensiveAnnualFinancialReport
ActuarialSection
125 TeacherRetirementSystemofTexas2020ComprehensiveAnnualFinancialReport

PensionTrustFund
126 TeacherRetirementSystemofTexas2020ComprehensiveAnnualFinancialReport

ActuarialSection
127 TeacherRetirementSystemofTexas2020ComprehensiveAnnualFinancialReport

ActuarialDisclosureTheActuarialSectionisbasedonavaluationasofAugust31,2019.
Table1: ActuarialPresentValueofFutureBenefits(WithComparativeDataforAugust31,2018)
2019 2018
PresentValueofBenefitsPresentlyBeingPaidServiceRetirementBenefits $ 101,448,968,265 $ 97,778,733,445DisabilityRetirementBenefits 1,289,682,794 1,262,559,579DeathBenefits 959,742,481 945,102,660PresentSurvivorBenefits 306,369,380 294,529,850TotalPresentValueofBenefitsPresentlyBeingPaid $ 104,004,762,920 $ 100,280,925,534
PresentValueofBenefitsPayableintheFuturetoPresentActiveMembersServiceRetirementBenefits $ 124,636,617,005 $ 117,752,030,618DisabilityRetirementBenefits 2,794,848,963 2,473,609,365TerminationBenefits 12,528,081,082 11,614,967,251DeathandSurvivorBenefits 2,380,100,956 2,253,693,291TotalActiveMemberLiabilities $ 142,339,648,006 $ 134,094,300,525
PresentValueofBenefitsPayableintheFuturetoPresentInactiveMembersInactiveVestedParticipants $ 5,035,114,478 $ 4,931,520,979RefundsofContributionstoInactiveNon-vestedMembers 549,266,564 501,473,614FutureSurvivorBenefitsPayableOnBehalfofPresentAnnuitants 1,697,553,914 1,630,036,961TotalInactiveLiabilities $ 7,281,934,956 $ 7,063,031,554
TotalActuarialPresentValueofFutureBenefits $ 253,626,345,882 $ 241,438,257,613
Table2: SummaryofCostItems(WithComparativeDataforAugust31,2018)
2019 2018
PresentValueofFutureBenefits $ 253,626,345,882 $ 241,438,257,613PresentValueofFutureNormalCosts (43,906,658,835) (41,221,951,786)ActuarialAccruedLiability $ 209,719,687,047 $ 200,216,305,827
ActuarialValueofAssets $ (160,233,295,324)$ (154,050,930,573)UnfundedActuarialAccruedLiability $ 49,486,391,723 $ 46,165,375,254
PensionTrustFund
128 TeacherRetirementSystemofTexas2020ComprehensiveAnnualFinancialReport

FinancingObjectiveandFundingPolicy
The financing objective of the pension plan is theresponsibility of the legislature. The contributionrates are established by the Legislature, that overtime, are intended to remain level as a percent ofpayroll, and provide assets to cover benefits whendue.
The funding policy of the pension plan is theresponsibility of the TRS Board of Trustees. TheBoardsupportscontributionandbenefitpoliciesthatwill systematically decrease theUnfunded ActuarialAccrued Liability (UAAL) over time in order toachieveafundedratioofthesystemthatisequaltoorgreaterthan100percent. AdecliningUAALovertime will evidence that contribution and benefitpolicies are being implemented consistent withTexasGovernmentCode§802.2011.
The contribution rates and scheduled increases, asdescribed in Texas Government Code §§825.402,825.4035,and825.404areexpectedtoeliminatetheUAALoveraperiodof29years.
Contribution rates may not be reduced oreliminated,andbenefitsmaynotbeimproved,ifasaresult of the particular action, the time required toamortize the unfunded actuarial liabilities of theSystem,wouldbeincreasedtoaperiodthatexceeds31years.Fordetailedinformation,seeNote11.
PlanProvisions
Forplanprovisions,seeNote11.
ActuarialMethodsandAssumption
TheactuarialvaluationfortheTRSpensionfundwasprepared by Gabriel, Roeder, Smith & Company(GRS). Theactuary reliedonmembershipdata andassetinformationprovidedbyTRSstaff.WhileGRSdidnotauditthisdata,anumberofteststothedatawere performed, and they concluded it wasreasonableandconsistentwiththeprioryear'sdata.
House Bill (HB) 3 in the 2019 Legislative sessioncreatedanewmechanismforsalary increasestobeprovidedbytheState.Itappearsthatapproximately$825 million was budgeted to provide salaryincreases to teachers, librarians, counselors, andnurseswithat least5yearsof service. Toestimatetheimpactinthisvaluation,itwasassumedthe$825millionwouldbeprovideduniformlytoallmembersinthedatawiththeapplicablepositioncodesandatleast5yearsofservice.Inaddition,itwasassumedaggregatecoveredpayrollforfiscalyear2020would
be $825 million more than the typical 3 percentannual growth from actual fiscal year 2019 payroll.Lastly,itwasassumedhalfofthe$825millionwouldbe eligible for the supplemental contribution fromemployers. All assumptions are then assumed tocontinue thereafter without adjustment. Thisincreased the UAAL in this valuation by ap-proximately $1.4 billion and increased the fundingperiodby1year.
TheactualdatacollectedasofAugust31,2020willprovide the actual amount and distribution of thesalary increases, as well as the actual increase inaggregate payroll and the portion eligible forsupplemental contributions, meaning the 2020valuation will provide more clarity on the actualimpactfromtheHB3astheschooldistrictsdohavediscretion on how the actual increases aredistributed.Inaddition,thetrueultimatecostoftheincreaseswillnotbefullyknownuntilthevaluationsforthefollowingyearsarecompletedasitispossiblethat future salary decisions by employers areimpacted by this one large decision. It is possiblethat overall salary increases for the next fewvaluation cycles could be dampened compared tocurrent assumptions and believe the proposedapproach to projecting the impact ismore likely tooverestimate the impact than underestimate, butgiventhelackofdetailfromhowlocalemployerswilldistribute the increases and how it may impactfuture decisions, it is believed themethods used inthisvaluationareappropriateandreasonable.
Since the data in this report is based on the roll-forwardmethod,theresultsofthedatacollectedasofAugust31,2020willnotbereportedherein.
The actuarial methods and assumptions have beenselected by the TRS Board of Trustees based uponGRSanalysisand recommendations. TheBoardhassole authority to determine the actuarial assump-tions used for the plan. Except for the assumptionabout potential impact from the salary increasesprovided by the 2019 Legislature to be effectiveSeptember 1, 2019, the actuarial methods andassumptionsareprimarilybasedonastudyofactualexperience for the period ending August 31, 2017andadoptedonJuly27,2018.
Theresultsoftheactuarialvaluationaredependenton the assumptions used. Actual results can andalmost certainly will differ, as actual experiencedeviates from the assumptions. Seemingly minorchanges in assumptions can materially change the
ActuarialSection
129 TeacherRetirementSystemofTexas2020ComprehensiveAnnualFinancialReport

liabilities, calculated contribution rates, and fundingperiods.
ActuarialMethods
The actuarial cost method used for both financialreporting purposes and funding purposes was theIndividualEntryAgeNormalmethodasprescribedbyGASB 67. The Individual EAN cost method is usedbecause it creates the most level funding require-ment across the generations of members andstakeholders.UnderIndividualEAN,thenormalcostforeachmemberisbasedonthebenefittierforthatmember.
ActuarialAssumptions
Theactuarialassumptionsusedforfundingpurposeswere the same assumptions used for financialreportingpurposes.
A.InvestmentRateofReturn
The investment rate of return for the fiscal yearending August 31, 2018 was 7.25 percent,compounded annually, which was composed of anassumed 2.30 percent inflation rate and a 4.95percent real rate of return, net of investmentexpenses. Thiswas the same rate used to discounttheactuarialaccruedliability.Therateofreturnforfiscalyear2019wasusedbecauseoftheselectionoftheRollForwardMethodforGASB67.
B.Post-RetirementMortality,AssumedRetirementAge,DisabilityRetirement,Death, andWithdrawalfromSystem
Rates and scales were developed based on theexperienceintheactuarialinvestigationasofAugust31,2017,withvaluesatspecimenagesshowninthetablesbelow.
Table3: PostRetirementMortalityProjections
Age MaleMembers FemaleMembers
40 0.000615 0.00038850 0.001652 0.00108060 0.004651 0.00266870 0.014356 0.00896980 0.046716 0.03227090 0.152340 0.116359100 0.490265 0.422361110 0.496658 0.496658120 1.000000 1.000000
Rates for members younger than age 65 will bereduced by 15 percent to reflect anticipatedbehavior changes stemming from themodificationstoTRS-Careinthe2017legislature.Fivepercentwillbe added to the rate at age 65 for members whoreachnormalretirementagepriortoage65.
Formembers hired after August 31, 2007 andwhoare vested as of August 31, 2014, the retirementrates for members once they reach unreducedretirement eligibility at age 60 are increased 10percent for each year the member is beyond theRuleof80(i.e.ifthememberreachedtheRuleof80atage58thentheprobabilityofretirementatage60is120percentoftherateshowninTable4below).
Formembers hired after August 31, 2007 andwhoare not vested as of August 2014 or for membershired after August 2014, the retirement rates formembers once they reach unreduced retirementeligibilityatage62areincreased10percentforeachyearthememberisbeyondtheRuleof80(i.e.ifthememberreachedtheRuleof80atage58,thentheprobabilityofretirementatage62is140percentofthe rate shown in Table 4 below). The followingtable shows the probability of retirement at thevariousagebrackets.
PensionTrustFund
130 TeacherRetirementSystemofTexas2020ComprehensiveAnnualFinancialReport

Table4: AssumedRetirementAge
NormalRetirement EarlyRetirementAge Male Female Age Male Female
50-54 0.13 0.14 45-59 0.01 0.0155 0.13 0.15 60 0.01 0.0256 0.14 0.16 61 0.02 0.0257 0.15 0.17 62 0.04 0.0458 0.16 0.18 63-65 0.05 0.0559 0.17 0.1960 0.18 0.2061 0.19 0.2162 0.20 0.2263 0.21 0.2364 0.22 0.24
65-74 0.25 0.2575 1.00 1.00
The disability retirement rates for members oncethey reach the Rule of 80 but not eligible forunreducedretirementareadjustedbyanadditional1percent.
Table 5 below shows the rates of disabilityretirementbyage.
Table5: ProbabilityofDecrementDuetoDisability
ForService>=10 ForService<10Age Male Female Male Female
20 0.000147 0.000262 0.000018 0.00002830 0.000147 0.000262 0.000018 0.00002840 0.000344 0.000446 0.000043 0.00004750 0.001594 0.001726 0.000199 0.00018260 0.002804 0.002616 0.000351 0.000275
TheprobabilityofdecrementduetodeathisshowninTable6below.
Table6: ProbabilityofDecrementDuetoDeath*
Age MaleMembers FemaleMembers
20 0.000351 0.00014030 0.000391 0.00018840 0.000543 0.00034250 0.001458 0.00095360 0.004053 0.00211170 0.011977 0.00545480 0.033554 0.01589090 0.119209 0.089535
*RP-2014EmployeeMortalityTablesformaleandfemalemultipliedby90%,withfullgenerationalprojectionassumingimmediateconvergenceofratesinthemortalityprojectionscaleMP-2018,2Dformaleandfemale.
TheprobabilityofdecrementduetoterminationisshowninTable7below.
Table7: ProbabilityofDecrementDuetoTermination
YearsofService MaleMembers FemaleMembers
1 0.155507 0.1622962 0.124963 0.1330703 0.100839 0.1110304 0.075417 0.0870645 0.065169 0.0776256 0.057971 0.0684677 0.049227 0.0562908 0.043267 0.0488919 0.038586 0.04363910 0.035246 0.039995
ActuarialSection
131 TeacherRetirementSystemofTexas2020ComprehensiveAnnualFinancialReport

C.RatesofSalaryIncrease
TheratesofsalaryincreaseinTable8belowreflectsan inflation rate of 2.30 percent, plus productivitycomponent of 0.75 percent, plus step-rate/promotionalcomponentasshown.
Table8: RatesofSalaryIncreaseDuetoMeritandPromotion
YearsofService
Merit,Promotion,Longevity General Total
1 6.00% 3.05% 9.05%2 2.50 3.05 5.553 1.90 3.05 4.954 1.50 3.05 4.555 1.40 3.05 4.456 1.20 3.05 4.257 1.10 3.05 4.15
8-10 1.00 3.05 4.0511-12 0.90 3.05 3.9513 0.80 3.05 3.8514 0.70 3.05 3.7515 0.60 3.05 3.65
16-17 0.50 3.05 3.5518 0.40 3.05 3.45
19-20 0.30 3.05 3.3521-22 0.20 3.05 3.2523-24 0.10 3.05 3.15
25ormore 0.00 3.05 3.05
D.ActuarialValueofAssets
Theintentoftheactuarialassetvaluationmethodisto smooth out year-to-year fluctuations in marketratesofreturn.Theactuarialvalueofassetsisequaltothemarketvalueofassetslessafiveyearphase-inof the excess/(shortfall) between expectedinvestment returns and actual income. The actualcalculationisbasedonthedifferencebetweenactualmarket value and the expected actuarial value ofassets each year and recognizes the cumulativeexcess return (or shortfall) over aminimum rate of20 percent per year. Each year a base is set up toreflectthisdifference.Ifthecurrentyear'sbaseisoftheoppositesignfromtheremainingdeferredbasesthen it is offset against any prior deferred bases ofthe opposite sign. Any remaining bases are thenrecognizedovertheremainingnumberofyears.Thisis intended toensure the smoothedvalueof assetswill converge towards the market value in areasonableandfiniteamountoftime.
Thisyear's shortfall in investment incomeof$3,337million was partially offset with the prior years'remaining gains, with $2,819 million remaining.After recognizing 20 percent of the amount ($564million) inthisyear'sactuarialassets,$2,255millionin deferred investment losses remain to berecognized in futurevaluations. Theactuarialvalueofassetswas$160.2billionat08/31/2019.
Expected earnings are determined using theassumed investment rate of return and thebeginning of year actuarial value of assets adjustedforreceiptsanddisbursementsduringtheyear.Thereturnsarecomputednetofinvestmentexpenses.
E. Funding of Unfunded Actuarial AccruedLiability
The Unfunded Actuarial Accrued Liability (UAAL) isfunded by the excess of future State and employercontributions required by law over the amount ofsuchcontributionsrequiredtofundthenormalcostofbenefits.
The normal cost for the System is deemed to beequal to the average cost of benefits for activemembersateachvaluationdate.Thenormalcosttopay for the benefits earned under the retirementsystem is 11.65 percent of pay, this amount beinginclusive of the amount contributed by theemployees. In addition, to the cost of benefits anadditionismadetothenormalcosttocoverannualadministrative expenses. It is estimated thatadministrative expenses will be approximately 0.11percent of payroll. For fiscal year 2020 the totalnormal cost is 11.76 percent of pay and the netemployer cost is 4.06 percent of pay based on thefiscal year 2020 member contribution rate of 7.70percent.
Theactuarialaccruedliabilityforbenefitspayableinthefuturetopresentactivemembersiscalculatedasthepresentvalueofbenefitspayableinthefuturetopresent active members less the present value offuturenormalcosts.
Fromanactuarialperspective, thecontribution ratein excess of the System's normal cost should besufficient to amortize the UAAL over a reasonableperiodoftime.Basedonthefutureincreasesinthemember and employer contribution rates, thecontributionsinexcessoftheSystem'snormalcostissufficient to amortize the System's UAAL over aperiod of 29.0 years (assuming all actuarialassumptionsaremet).
PensionTrustFund
132 TeacherRetirementSystemofTexas2020ComprehensiveAnnualFinancialReport

TheactivemembervaluationdataisshowninTable9below.
Table9: ActiveMemberPayrollValuationData
ValuationYear ActiveMembersAnnualizedPayrollin
Thousands AverageAnnualSalaryAnnual%Increasein
AverageSalary
2010 834,060 $ 36,628,579 $ 43,916 2.3%2011 828,919 36,797,372 44,392 1.12012 815,155 36,309,449 44,543 0.32013 831,302 37,104,333 44,634 0.22014 857,342 39,195,104 45,717 2.42015 828,851 37,121,750 44,787 (2.0)2016 847,631 39,281,763 46,343 3.52017 864,233 40,904,148 47,330 2.12018 872,978 42,105,475 48,232 1.92019 884,522 43,779,416 49,495 2.6
TheScheduleofretirees,beneficiariesanddisabledparticipantsaddedtoandremovedfromtherollsisshowninTable10.
Table10: Retirees,Beneficiaries,andDisabledParticipantsAddedtoandRemovedfromMembership
AddedtoRolls RemovedfromRolls Rolls-EndofYear
ValuationasofAugust31 Number
AnnualBenefits Number
AnnualBenefits Number
AnnualBenefits
AverageAnnualBenefits
%IncreaseAverageAnnualBenefits
2010 20,076 $473,512,423 8,199 $ 142,187,645 296,491 $6,331,161,469 $ 21,354 5.5%2011 24,688 620,038,676 8,499 147,985,004 312,680 6,803,215,141 21,758 7.52012 27,915 697,134,389 8,848 155,597,838 331,747 7,344,751,692 22,140 8.02013 25,825 743,998,946 9,344 165,231,795 348,228 7,923,518,843 22,754 7.92014 24,429 573,876,713 9,475 174,915,127 363,182 8,322,480,429 22,915 5.02015 25,134 604,436,264 10,578 191,966,951 377,738 8,734,949,742 23,124 5.02016 27,018 673,313,552 10,842 195,097,916 393,914 9,213,165,378 23,389 5.52017 24,739 613,145,920 10,885 203,792,399 407,768 9,622,518,899 23,598 4.42018 24,317 611,173,964 11,627 219,236,845 420,458 10,014,456,018 23,818 4.12019 25,420 642,167,173 11,452 217,977,284 434,426 10,438,645,907 24,029 4.2
ActuarialSection
133 TeacherRetirementSystemofTexas2020ComprehensiveAnnualFinancialReport

TheanalysisoffinancialtrendsisshowninTable11.
Table11: AnalysisofFinancialExperience(DollarsinBillions)*
AsofAugust31
InvestmentGains/(Losses)
ContributionExperience
AssumptionChanges
LiabilityExperience
NetIncrease/(Decrease)
BeginningUAAL EndingUAAL
2010 $ (1.161)$ 0.797 $ — $ (0.705)$ 1.253 $ 21.646 $ 22.8992011 (1.958) 0.826 (0.271) (1.350) 1.163 22.899 24.0622012 (2.208) 1.258 — (1.427) 2.039 24.062 26.1012013 (2.045) 1.911 0.708 (1.829) 2.835 26.101 28.9362014 1.095 1.157 2.282 0.358 2.702 28.936 31.6382015 (1.237) 0.912 0.682 (1.501) 1.330 31.638 32.9682016 (1.504) 0.525 — (0.460) 2.485 32.968 35.4532017 0.270 0.415 (0.701) 0.828 0.018 35.453 35.4712018 0.173 0.371 (10.592) 0.095 10.694 35.471 46.1652019 (0.564) 0.961 (1.997) 0.200 3.321 46.165 49.486
*Resultingfromdifferencesbetweenassumedexperienceandactualexperience.Calculatedona5-yearsmoothedmarketbasis.
SolvencyTest
Ashort-termsolvencytestisonemeansofcheckinga retirement System's progress under its fundingprogram. The schedule below provides a historicalillustration of a short-term solvency test for TRSwhereinpresentassetsarecomparedwith:
• activemembercontributionsondeposit
• the liabilities for future benefits to presentannuitants(RetireesandBeneficiaries)
• the liabilities for activemembers under theentry age normal actuarial cost methodincluding a projection of future salaryincreases and anticipated future serviceActiveMembers-StateFinancedPortion
UnderthelevelpercentofpayrollfinancingfollowedbyTRS,liabilitiesforactivemembercontributionsondeposit and the liabilities for future benefits topresent retirees and beneficiaries will be fullycovered by present assets except in rarecircumstances. In addition, liabilities for activemember benefits earned or to be earned in thefuturewill bepartially coveredby the remainderofpresent assets. Generally, if the System has beenusing level cost financing, the funded portion ofactivememberbenefitswillincreaseovertime.ThesolvencytestisshowninTable12.
Table12: SolvencyTest(DollarsinMillions)
AggregateActuarialAccruedLiabilitiesForPortionofAggregateActuarialAccruedLiabilitiesCoveredbyValuationAssets
Valuationasof
August31
ActiveMember
Contributions(1)
RetireesandBeneficiaries
(2)
ActiveMembers(State
FinancedPortion)
(3)ValuationAssets
ActiveMember
Contributions(1)
RetireesandBeneficiaries
(2)
ActiveMembers(State
FinancedPortion)
(3)2010 $ 27,559 $ 58,476 $ 48,156 $ 111,293 100% 100% 52.5%2011 28,911 63,470 46,934 115,253 100 100 48.72012 30,006 68,449 45,972 118,326 100 100 43.22013 31,365 73,841 45,460 121,730 100 100 36.32014 33,028 78,431 48,576 128,398 100 100 34.92015 33,856 82,535 50,062 133,485 100 100 34.12016 34,803 86,986 52,451 138,786 100 100 32.42017 36,513 90,573 54,667 146,282 100 100 35.12018 37,834 101,911 60,472 154,051 100 100 23.72019 39,212 105,702 64,806 160,233 100 100 23.6
PensionTrustFund
134 TeacherRetirementSystemofTexas2020ComprehensiveAnnualFinancialReport

ScheduleofFundingProgress
Taking into account only the dollar amounts ofaggregateactuarialaccruedliabilitiesandUnfunded
Actuarial Accrued Liabilities (UAAL) can bemisleading. Thedollaramountsof these two itemscan be increasing at a time when their actualsubstance may be decreasing. Dividing valuationassetdollarsbyaggregateactuarialaccruedliabilitydollars anddividingUAALdollarsby activememberpayroll dollarsprovide clarifying indices. The largerthe ratio of valuation assets to aggregate actuarialaccruedliabilities,thestrongerthesystem.
ObservationoftheserelativeindicesoveraperiodofyearswillgiveanindicationofwhethertheSystemisbecoming stronger or weaker. The schedule offundingprogressisshowninTable13.
The 10-year Schedule of Actuarially DeterminedContributions is located in the Required Sup-plementaryInformationsection.
Table13: ScheduleofFundingProgress(DollarsinMillions)
ValuationasofAugust31
ActuarialValueofAssets
ActuarialAccruedLiability(AAL)
UnfundedAAL(UAAL)
FundedRatioAssetsasa%ofAAL
CoveredPayroll
UAALasa%ofCoveredPayroll
[1] [2] [3] [4] [5] [6] [7]2010 $ 111,293 $ 134,191 $ 22,899 82.9% $ 36,629 62.5%2011 115,253 139,315 24,062 82.7 36,797 65.42012 118,326 144,427 26,101 81.9 36,310 71.92013 121,730 150,666 28,936 80.8 37,104 78.02014 128,398 160,036 31,638 80.2 38,522 82.12015 133,485 166,453 32,968 80.2 39,620 83.22016 138,786 174,239 35,453 79.7 42,376 83.72017 146,282 181,753 35,471 80.5 43,164 82.22018 154,051 200,216 46,165 76.9 44,956 102.72019 160,233 209,720 49,486 76.4 47,414 104.4
ActuarialSection
135 TeacherRetirementSystemofTexas2020ComprehensiveAnnualFinancialReport

Thispageisintentionallyleftblank.
PensionTrustFund
136 TeacherRetirementSystemofTexas2020ComprehensiveAnnualFinancialReport

TRS-CareActuarialInformation
Actuary'sCertificationLetter..................................................................................... 138
FundingObjectiveandFundingPolicy....................................................................... 140
Table1: RetireesandBeneficiariesAddedtoandRemovedfromMembership................... 140
ActuarialSection
137 TeacherRetirementSystemofTexas2020ComprehensiveAnnualFinancialReport

TRS-Care
138 TeacherRetirementSystemofTexas2020ComprehensiveAnnualFinancialReport

ActuarialSection
139 TeacherRetirementSystemofTexas2020ComprehensiveAnnualFinancialReport

ActuarialDisclosure
TheActuarialSectionisbasedonavaluationasofAugust31,2019.
FundingObjectiveandFundingPolicy
ThecurrentfundingobjectivefortheTRS-CareOPEBTrust fund is to provide sufficient funding throughindividual biennial legislative periods. There is noarrangement where the participating employerswould make contributions to advance-fund theobligation. However, participating employers andthe State are making contributions based on thecurrent funding policy. The Texas Legislature isresponsible for establishing and maintaining thefundingpolicy.
There was not an actuarial valuation prepared forfundingpurposesbecausetheTRS-Careplanisapay-as-you-go-plan.
The actuarial valuation of TRS-Care for financialreportingpurposeswaspreparedbyGabriel,Roeder,Smith & Company. The valuation was based oninformation provided by TRS concerning retireehealth benefits, member census and financial data.While not auditing the data, the actuary checks forinternalconsistency.
The actuarial calculations were prepared forpurposes of complying with the requirements ofGASB Statement No. 74 for financial reportingpurposesonly. Thecalculationoftheplan’s liabilityisnotapplicableforfundingpurposesoftheplan.Acalculation of the Plan’s liability for purposes otherthansatisfyingtherequirementsofGASBStatementNo.74mayproducesignificantlydifferentresults.
TheTRS-CareOPEBplanisdiscussedindetailinNote9andprovidesthefollowinginformation.
• Planprovisions
• IdentificationofthePlantype
• Numberofcoveredindividuals
Table1: RetireesandBeneficiariesAddedtoandRemovedfromMembership
AddedtoRolls RemovedfromRolls Rolls-EndofYear
Valuationasof
August31 NumberAnnual
Allowances NumberAnnual
Allowances NumberAnnual
Allowances*
%IncreaseinAnnual
Allowances
AverageAnnual
Allowances
2010 14,996 $ 71,136,696 7,924 $ 21,837,784 210,006 $757,979,912 9.2% $ 3,6092011 20,467 109,331,023 8,019 24,802,618 222,454 898,001,599 18.5 4,0372012 19,407 92,279,848 8,220 28,700,248 233,641 768,682,199 (14.4) 3,2902013 19,798 98,603,255 10,176 25,946,471 243,263 824,715,257 7.3 3,3902014 18,916 97,956,524 10,656 27,648,497 251,523 933,885,969 13.2 3,7132015 19,171 106,177,651 11,116 31,400,277 259,578 1,050,329,854 12.5 4,0462016 20,883 120,035,127 12,250 48,462,388 268,211 1,132,169,358 7.8 4,2212017 19,121 105,535,109 13,113 59,695,737 274,219 986,039,302 (12.9) 3,5962018 11,101 79,394,032 48,958 150,243,653 236,362 955,490,192 (3.1) 4,0422019 14,066 95,931,742 21,253 69,775,594 229,175 839,871,317 (12.1) 3,665
*Expectedemployerprovidedclaimsandexpenses(netofretireepremiums).AnnualallowancesinColumn(7)includeincreasesduetohealthcareinflationandtheimpactofplanchanges.Asaresult,theannualallowancesarenotequaltothebeginningofyearallowancesplusthe"AddedtoRolls"allowancesminusthe"RemovedfromRolls"allowances.
TRS-Care
140 TeacherRetirementSystemofTexas2020ComprehensiveAnnualFinancialReport


Thispageisintentionallyleftblank.
142 TeacherRetirementSystemofTexas2020ComprehensiveAnnualFinancialReport

StatisticalSectionOverview
TheStatisticalSectionpresentsadditional informationtoprovidefinancialstatementuserswithaddedhistoricalperspective,context,anddetailtoassistinusingtheinformationintheBasicFinancialStatements,NotestotheFinancialStatements,andRequiredSupplementary Information tounderstandandassess theSystem's financialcondition.InformationispresentedforthePensionTrustFund,TRS-Care,andTRS-ActiveCare.
FinancialTrendsInformationThefinancialtrendschedulesassistusersinunderstandingandassessinghowtheSystem'sfinancialpositionhaschangedovertimeandinclude:
ChangesinFiduciaryNetPosition-PensionTrustFund............................................................... 144ChangesinFiduciaryNetPosition-TRS-Care............................................................................... 146Revenues,Expenses,andChangesinNetPosition-TRS-ActiveCare........................................... 148BenefitandRefundDeductionsfromNetPositionbyType-PensionTrustFund...................... 150BenefitDeductionsfromNetPositionbyType-TRS-Care.......................................................... 150BenefitDeductionsfromNetPositionbyType-TRS-ActiveCare................................................ 150
OperatingInformationTheoperating informationschedulesprovide informationcontainingcontextualdataabouttheSystem'sbenefitoperations,resources,andthebenefitservicesitprovidesandinclude:
AverageBenefitPayments-PensionTrustFund.......................................................................... 152AverageMonthlyBenefits-PensionTrustFund........................................................................... 153AverageBenefitPayments-TRS-Care......................................................................................... 154AverageBenefitPayments-TRS-ActiveCare................................................................................ 154RetiredMembersbyTypeofRetirementBenefitandOptionSelected-PensionTrustFund.... 155HealthBenefitPaymentsbyRange-TRS-Care............................................................................. 156HealthBenefitPaymentsbyRange-TRS-ActiveCare................................................................... 156PrincipalParticipatingEmployers-PensionTrustFund............................................................... 157PrincipalParticipatingEmployers-TRS-Care............................................................................... 157
Inaddition,acompletelistofparticipatingemployershasbeenincluded.Theinformationwasderivedfrominternalsources.
StatisticalSection
143 TeacherRetirementSystemofTexas2020ComprehensiveAnnualFinancialReport

ChangesinFiduciaryNetPositionPensionTrustFundFortheFiscalYearsEndedAugust31
2020 2019 2018 2017
AdditionsMemberContributions $ 3,999,877,464 $ 3,482,869,726 $ 3,360,773,197 $ 3,242,556,261Non-EmployerContributingEntityContributions 1,844,999,393 1,737,852,502 1,715,784,550 1,697,962,608EmployerContributions 2,016,481,636 1,761,821,902 1,671,257,303 1,588,309,345PurchaseofServiceCredit 46,272,689 42,205,185 41,538,371 55,092,741ContributionsfromERS 31,110,870 29,789,821 27,670,302 24,974,328NetInvestmentIncome 11,068,916,613 7,669,028,874 11,242,813,657 17,079,807,347Other* 10,266,475 592,671,805 8,108,248 1,299,284TotalAdditions $19,017,925,140 $15,316,239,815 $18,067,945,628 $23,690,001,914
DeductionsBenefits $10,975,638,999 $11,256,781,486 $10,176,447,093 $ 9,778,497,039RefundsofContributions 421,366,179 486,460,902 422,335,740 420,421,056ServiceContributionsTransferredtoERS 108,003,549 103,044,924 97,333,401 93,609,174OtherPost-EmploymentBenefitExpense 7,734,365 4,438,264 4,380,304 —
AdministrativeExpenses,ExcludingInvestingActivityExpenses 67,135,880 60,485,645 64,926,169 44,189,998TotalDeductions $11,579,878,972 $11,911,211,221 $10,765,422,707 $10,336,717,267
NetIncrease(Decrease) $ 7,438,046,168 $ 3,405,028,594 $ 7,302,522,921 $13,353,284,647
BeginningNetPosition $157,978,199,075 $154,568,901,833 $147,361,922,120 $134,008,637,473PriorPeriodAdjustments(Note14) — 4,268,648 (95,543,208) —BeginningNetPosition,asRestated $157,978,199,075 $154,573,170,481 $147,266,378,912 $134,008,637,473EndingNetPosition $165,416,245,243 $157,978,199,075 $154,568,901,833 $147,361,922,120
*SupplementalAppropriation-Non-EmployerContributingEntityincludedinOther.
Billion
s
NetPositionPensionTrustFund
LastTenYears
2011 2012 2013 2014 2015 2016 2017 2018 2019 2020$100
$120
$140
$160
$180
FinancialTrends
144 TeacherRetirementSystemofTexas2020ComprehensiveAnnualFinancialReport

(Continued)
2016 2015 2014 2013 2012 2011
$ 2,943,669,320 $ 2,576,024,311 $ 2,357,686,000 $ 2,252,094,934 $ 2,188,020,423 $ 2,243,954,725
1,675,631,248 1,591,482,988 1,530,623,829 1,337,214,693 1,299,077,635 1,484,285,519 1,483,389,348 1,377,972,653 984,552,391 925,693,992 760,837,633 856,219,491 37,389,534 50,089,106 143,534,091 148,400,880 125,971,764 105,177,104 23,950,878 21,205,594 19,714,145 18,885,872 17,423,597 14,379,300 9,193,280,560 (412,759,100) 19,434,430,034 9,834,136,005 7,847,298,290 14,636,935,228 1,993,029 3,733,133 4,143,449 2,629,383 1,867,389 1,576,613$ 15,359,303,917 $ 5,207,748,685 $ 24,474,683,939 $ 14,519,055,759 $ 12,240,496,731 $ 19,342,527,980
$ 9,382,696,876 $ 8,937,328,045 $ 8,550,916,357 $ 8,077,729,314 $ 7,726,105,535 $ 7,175,255,376 373,418,687 391,341,181 410,600,319 391,292,412 381,231,352 334,268,822
88,854,383 84,059,353 80,163,847 75,513,146 70,985,963 64,772,079
— — — — — —
44,402,710 35,556,979 41,904,190 36,264,062 33,073,740 35,849,819$ 9,889,372,656 $ 9,448,285,558 $ 9,083,584,713 $ 8,580,798,934 $ 8,211,396,590 $ 7,610,146,096
$ 5,469,931,261 $ (4,240,536,873)$ 15,391,099,226 $ 5,938,256,825 $ 4,029,100,141 $ 11,732,381,884
$128,538,706,212 $132,779,243,085 $117,388,143,859 $111,449,887,034 $107,420,786,893 $ 95,688,405,009 — — — — — —$128,538,706,212 $132,779,243,085 $117,388,143,859 $111,449,887,034 $107,420,786,893 $ 95,688,405,009$134,008,637,473 $128,538,706,212 $132,779,243,085 $117,388,143,859 $111,449,887,034 $107,420,786,893
StatisticalSection
145 TeacherRetirementSystemofTexas2020ComprehensiveAnnualFinancialReport

ChangesinFiduciaryNetPositionTRS-CareForFiscalYearsEndedAugust31
2020 2019 2018 2017
AdditionsMemberContributions $ 243,532,120 $ 227,338,454 $ 221,325,377 $ 213,241,179
Non-EmployerContributingEntity-StateContributions 435,768,774 404,936,501 395,588,628 303,760,632EmployerContributions 324,973,591 305,363,084 296,098,420 215,360,520FringeBenefitsPaidbyState'sGeneralFundonBehalfofTRSEmployees — — — —SupplementalAppropriation-Non-EmployerContributingEntity 230,756,971 73,641,562 394,600,000 15,559,552FederalRevenue 186,169,146 220,783,898 103,402,579 101,718,551RebateandDiscountIncome* 423,426,202 356,439,596 284,291,173 291,725,635InvestmentIncome 25,536,560 25,046,771 10,127,259 4,696,973MiscellaneousRevenue 17,879 — 803,022 529,020TotalAdditions $ 1,870,181,243 $ 1,613,549,866 $ 1,706,236,458 $ 1,146,592,062
DeductionsHealthCareClaims $ 1,538,211,599 $ 1,515,397,609 $ 1,593,381,709 $ 1,678,892,217
Less:HealthCarePremiumsPaidbyRetirees (499,057,861) (517,965,033) (488,069,004) (404,027,710)HealthCareClaimsProcessingandOther 68,252,843 44,868,838 80,585,608 46,931,559InsurancePremiumPayments 51,410,469 71,794,507 83,828,910 61,792,671AdministrativeExpenses 7,068,610 6,006,229 6,672,488 4,953,492TotalDeductions $ 1,165,885,660 $ 1,120,102,150 $ 1,276,399,711 $ 1,388,542,229
NetIncrease(Decrease) $ 704,295,583 $ 493,447,716 $ 429,836,747 $ (241,950,167)
BeginningNetPosition $ 1,292,022,349 $ 798,574,633 $ 399,535,986 $ 641,486,153PriorPeriodAdjustments(Note14) — — (30,798,100) —BeginningNetPosition,asRestated $ 1,292,022,349 $ 798,574,633 $ 368,737,886 $ —EndingNetPosition $ 1,996,317,932 $ 1,292,022,349 $ 798,574,633 $ 399,535,986
*Priortofiscalyear2013,rebateswereoffsetwithinhealthcareclaims.
Millions
NetPositionTRS-Care
LastTenYears
2011 2012 2013 2014 2015 2016 2017 2018 2019 2020$0
$500
$1,000
$1,500
$2,000
$2,500
FinancialTrends
146 TeacherRetirementSystemofTexas2020ComprehensiveAnnualFinancialReport

(Continued)
2016 2015 2014 2013 2012 2011
$ 208,581,990 $ 198,196,273 $ 189,003,903 $ 180,824,523 $ 176,751,407 $ 183,808,580
297,070,920 281,098,358 267,497,910 139,095,786 271,925,242 282,782,431 212,936,351 202,976,470 193,124,772 160,952,396 154,607,926 158,724,010
— — 139,422 117,770 103,676 108,440
— 768,100,754 36,058,148 102,363,704 — — 124,739,649 126,806,652 78,589,415 74,511,473 68,633,946 136,887,805 218,995,436 231,569,472 200,859,859 82,074,803 — — 5,421,446 1,495,680 2,061,745 3,041,001 5,189,934 8,168,640 89,388 — — — — —$ 1,067,835,180 $ 1,810,243,659 $ 967,335,174 $ 742,981,456 $ 677,212,131 $ 770,479,906
$ 1,651,712,836 $ 1,554,181,197 $ 1,347,532,839 $ 1,240,508,361 $ 1,142,131,410 $ 992,478,380
(374,736,269) (369,066,459) (363,631,292) (355,685,504) (363,348,030) (345,164,271) 48,361,151 47,380,407 45,387,769 43,577,852 44,470,323 44,007,586 69,228,872 59,000,081 27,507,106 1,148,013 101,060 108,286 4,701,677 3,769,680 3,646,546 3,398,109 3,714,018 3,143,922$ 1,399,268,267 $ 1,295,264,906 $ 1,060,442,968 $ 932,946,831 $ 827,068,781 $ 694,573,903
$ (331,433,087)$ 514,978,753 $ (93,107,794)$ (189,965,375)$ (149,856,650)$ 75,906,003
$ 972,919,240 $ 457,940,487 $ 551,048,281 $ 741,013,656 $ 890,870,306 $ 814,964,303 — — — — — —$ — $ — $ — $ — $ — $ —$ 641,486,153 $ 972,919,240 $ 457,940,487 $ 551,048,281 $ 741,013,656 $ 890,870,306
StatisticalSection
147 TeacherRetirementSystemofTexas2020ComprehensiveAnnualFinancialReport

Revenues,Expenses,andChangesinNetPositionTRS-ActiveCareFortheFiscalYearsEndedAugust31
2020 2019 2018 2017
RevenuesHealthCarePremiums $2,158,997,317 $2,170,132,057 $2,171,125,097 $2,119,959,039COBRAPremiumsandOther 145,208,054 157,307,700 144,543,929 120,049,492AdministrativeFeesandNon-OperatingRevenue 413,313 685,623 259,417 321,030
InvestmentIncome 7,853,806 10,623,456 6,883,872 4,668,888FederalRevenueARRA-COBRAReimbursements — — — —
FringeBenefitsPaidbyState'sGeneralFundonBehalfofTRSEmployees — — — —TotalRevenues $2,312,472,490 $2,338,748,836 $2,322,812,315 $2,244,998,449
ExpensesHealthCareClaims 1,932,461,054 1,863,374,439 2,002,142,744 1,846,526,430HealthCareClaimsProcessingandOther 116,068,297 119,811,563 121,483,408 123,783,747PremiumPaymentstoHMOs 256,850,839 243,198,667 237,386,929 227,088,895AdministrativeExpenses 3,746,187 3,703,320 3,311,679 3,345,442TotalExpenses $2,309,126,377 $2,230,087,989 $2,364,324,760 $2,200,744,514
NetIncrease(Decrease) $ 3,346,113 $ 108,660,847 $ (41,512,445)$ 44,253,935BeginningNetPosition 164,953,231 56,292,384 97,804,829 53,550,894EndingNetPosition $ 168,299,344 $ 164,953,231 $ 56,292,384 $ 97,804,829
Millions
NetPositionTRS-ActiveCareLastTenYears
2011 2012 2013 2014 2015 2016 2017 2018 2019 2020$-200
$-100
$0
$100
$200
$300
FinancialTrends
148 TeacherRetirementSystemofTexas2020ComprehensiveAnnualFinancialReport

(Continued)
2016 2015 2014 2013 2012 2011
$2,055,658,822 $1,938,621,262 $1,919,557,855 $1,797,745,785 $1,738,705,410 $1,540,604,828 17,904,885 5,328,003 9,337,610 10,775,898 11,199,707 8,926,063 356,054 236,749 139,608 137,630 136,324 135,917 3,079,039 1,537,408 940,022 746,936 1,697,553 3,387,062 — — — — 29,706 667,746
— — 79,792 75,664 72,094 67,373$2,076,998,800 $1,945,723,422 $1,930,054,887 $1,809,481,913 $1,751,840,794 $1,553,788,989
1,768,287,120 1,565,255,957 1,521,834,989 1,785,069,768 1,718,903,645 1,510,090,981 125,802,110 135,073,416 109,925,954 84,903,101 83,346,223 76,960,951 214,529,160 178,192,468 154,913,859 100,905,702 89,706,406 76,270,706 2,644,792 2,225,417 2,569,850 2,351,802 2,176,610 2,207,051$2,111,263,182 $1,880,747,258 $1,789,244,652 $1,973,230,373 $1,894,132,884 $1,665,529,689
$ (34,264,382)$ 64,976,164 $ 140,810,235 $ (163,748,460)$ (142,292,090)$ (111,740,700)
$ 87,815,276 $ 22,839,112 $ (117,971,123)$ 45,777,337 $ 188,069,427 $ 299,810,127$ 53,550,894 $ 87,815,276 $ 22,839,112 $ (117,971,123)$ 45,777,337 $ 188,069,427
StatisticalSection
149 TeacherRetirementSystemofTexas2020ComprehensiveAnnualFinancialReport

BenefitandRefundDeductionsfromNetPositionbyTypePensionTrustFundFortheFiscalYearsEndedAugust31
2020 2019 2018 2017
BenefitsServiceRetirements $10,272,047,096 $10,503,570,237 $ 9,495,487,665 $ 9,059,855,790DeferredRetirementOption 2,488,283 2,871,239 3,407,936 5,231,060PartialLumpSumOption 237,796,738 258,417,662 234,071,031 263,705,342DisabilityRetirements 189,250,368 199,708,594 181,817,426 177,627,306DeathandSurvivorBenefits:AnnualSalary 38,560,083 45,133,662 35,735,208 44,398,830SurvivorAnnuities 116,051,294 116,094,299 106,201,977 109,519,771LifeAnnuities 93,091,163 102,595,155 94,809,551 93,714,87160MonthlyPayments 15,786,007 17,326,148 16,184,228 15,518,472RemainderofContributions 7,221,136 8,011,977 5,281,986 6,204,030
TotalBenefits $10,972,292,168 $11,253,728,973 $10,172,997,008 $ 9,775,775,472
RefundsDeath $ 5,536,660 6,060,703 5,574,637 6,371,748Separation 415,829,519 480,400,199 416,761,103 414,049,308TotalRefunds $ 421,366,179 $ 486,460,902 $ 422,335,740 $ 420,421,056
BenefitDeductionsfromNetPositionbyTypeTRS-CareFortheFiscalYearsEndedAugust31
2020 2019 2018 2017
ClaimsMedicalClaimsandInsurancePremiums $ 659,834,968 $ 688,148,610 $ 840,420,584 $ 807,831,048PrescriptionDrugs** 668,307,637 648,749,351 669,082,905 734,805,874TotalClaims $ 1,328,142,605 $ 1,336,897,961 $ 1,509,503,489 $ 1,542,636,922
**Note:ForTRS-Care,2013and2014prescriptionclaimamountshavebeenrevisedtoreflectclaimsnetofrebates.Thesetwoyearswerereportedgrossofrebates.
BenefitDeductionsfromNetPositionbyTypeTRS-ActiveCareForFiscalYearsEndedAugust31
2020 2019 2018 2017
ClaimsMedicalClaimsandInsurancePremiums $ 1,780,181,703 $ 1,702,719,298 $ 1,826,632,040 $ 1,653,483,496PrescriptionDrugs 271,480,530 254,168,852 275,730,514 306,703,364TotalClaims $ 2,051,662,233 $ 1,956,888,150 $ 2,102,362,554 $ 1,960,186,860
FinancialTrends
150 TeacherRetirementSystemofTexas2020ComprehensiveAnnualFinancialReport

(Continued)
2016 2015 2014 2013 2012 2011
$ 8,633,505,859 $ 8,215,765,876 $ 7,795,690,586 $ 7,251,369,740 $ 6,808,592,209 $ 6,241,946,655 5,166,851 9,643,121 14,974,505 17,223,523 22,361,937 27,822,115 300,420,702 288,923,266 322,033,388 410,323,790 501,152,157 524,925,790 173,464,936 169,318,064 164,299,506 156,308,471 150,238,202 144,865,109
44,952,730 39,574,595 44,846,010 41,219,707 46,859,444 47,295,194 108,509,074 100,150,048 97,822,817 94,563,001 92,126,049 86,898,720 92,087,967 90,563,081 89,547,742 87,044,328 85,816,402 84,893,007 15,523,059 14,443,193 13,415,885 12,659,471 11,816,313 11,564,275 5,491,553 6,730,215 6,012,086 4,496,453 4,659,453 3,293,923$ 9,379,122,731 $ 8,935,111,459 $ 8,548,642,525 $ 8,075,208,484 $ 7,723,622,166 $ 7,173,504,788
$ 7,379,576 $ 5,474,475 $ 5,455,829 $ 4,705,228 $ 5,294,006 $ 3,984,340 366,039,111 385,866,706 405,144,490 386,587,184 375,937,346 330,284,482$ 373,418,687 $ 391,341,181 $ 410,600,319 $ 391,292,412 $ 381,231,352 $ 334,268,822
(Continued)
2016 2015 2014 2013 2012 2011
$ 858,985,138 $ 805,668,819 $ 691,283,731 $ 687,469,016 $ 687,987,585 $ 608,461,321 716,536,786 649,457,501 539,842,962 496,229,923 454,143,825 384,017,059$ 1,575,521,924 $ 1,455,126,320 $ 1,231,126,693 $ 1,183,698,939 $ 1,142,131,410 $ 992,478,380
(Continued)
2016 2015 2014 2013 2012 2011
$ 1,644,795,868 $ 1,479,302,696 $ 1,397,249,236 $ 1,613,167,792 $ 1,450,574,875 $ 1,242,673,156 325,475,512 264,145,729 279,499,612 272,807,678 268,328,770 267,417,825$ 1,970,271,380 $ 1,743,448,425 $ 1,676,748,848 $ 1,885,975,470 $ 1,718,903,645 $ 1,510,090,981
StatisticalSection
151 TeacherRetirementSystemofTexas2020ComprehensiveAnnualFinancialReport

AverageBenefitPaymentsPensionTrustFundLastTenFiscalYears
YearsofCreditedServiceRetirementsEffective 5-10 11-15 16-20 21-25 26-30 30+
2020AverageMonthlyBenefit* $ 515 $ 966 $ 1,594 $ 2,235 $ 3,214 $ 4,294AverageFinalAverageSalary $ 39,708 $ 43,700 $ 50,048 $ 53,700 $ 61,708 $ 71,273NumberofRetirees 1,551 1,880 2,507 2,994 3,205 2,939
2019AverageMonthlyBenefit* $ 480 $ 939 $ 1,507 $ 2,107 $ 3,076 $ 4,154AverageFinalAverageSalary $ 37,089 $ 43,568 $ 48,060 $ 51,224 $ 61,133 $ 69,764NumberofRetirees 1,755 2,137 2,704 3,449 3,561 3,134
2018AverageMonthlyBenefit* $ 480 $ 905 $ 1,430 $ 2,125 $ 3,001 $ 4,141AverageFinalAverageSalary $ 36,815 $ 42,857 $ 46,291 $ 51,591 $ 59,757 $ 69,063NumberofRetirees 2,071 2,478 3,405 4,246 4,320 4,192
2017AverageMonthlyBenefit* $ 446 $ 867 $ 1,410 $ 2,078 $ 2,959 $ 4,052AverageFinalAverageSalary $ 34,635 $ 41,504 $ 45,942 $ 50,617 $ 58,755 $ 67,598NumberofRetirees 2,211 2,452 3,524 4,331 4,568 4,632
2016AverageMonthlyBenefit* $ 444 $ 837 $ 1,348 $ 2,050 $ 2,894 $ 4,053AverageFinalAverageSalary $ 33,907 $ 40,408 $ 44,703 $ 50,290 $ 57,750 $ 67,429NumberofRetirees 2,184 2,278 3,195 4,300 4,290 4,668
2015AverageMonthlyBenefit* $ 424 $ 825 $ 1,345 $ 2,008 $ 2,852 $ 3,992AverageFinalAverageSalary $ 33,580 $ 40,064 $ 44,613 $ 49,606 $ 56,892 $ 66,598NumberofRetirees 2,274 2,234 3,101 4,131 4,392 4,413
2014AverageMonthlyBenefit* $ 413 $ 801 $ 1,327 $ 1,964 $ 2,847 $ 3,877AverageFinalAverageSalary $ 32,906 $ 39,263 $ 43,884 $ 49,222 $ 56,835 $ 65,447NumberofRetirees 2,291 2,285 3,082 4,252 4,429 4,197
2013AverageMonthlyBenefit* $ 389 $ 742 $ 1,291 $ 1,939 $ 2,800 $ 3,866AverageFinalAverageSalary $ 31,582 $ 37,078 $ 43,056 $ 49,217 $ 26,453 $ 65,472NumberofRetirees 2,234 2,380 3,067 4,388 4,675 4,952
2012AverageMonthlyBenefit* $ 389 $ 727 $ 1,308 $ 1,925 $ 2,785 $ 3,867AverageFinalAverageSalary $ 32,113 $ 36,522 $ 43,164 $ 49,383 $ 56,755 $ 66,322NumberofRetirees 2,138 2,226 2,853 4,257 4,372 5,207
2011AverageMonthlyBenefit* $ 390 $ 711 $ 1,269 $ 1,872 $ 2,671 $ 3,778AverageFinalAverageSalary $ 32,134 $ 35,562 $ 42,122 $ 48,196 $ 55,191 $ 64,951NumberofRetirees 2,092 2,045 2,873 4,545 4,983 6,394*AveragemonthlybenefitshavebeenreducedforPartialLumpSumOptionpaymentsof$524.9,$501.2,$410.3,$322.0,$288.9,$300.4,$263.7,$234.1,$258.4,and$237.8millioninfiscalyears2011,2012,2013,2014,2015,2016,2017,2018,2019,and2020respectively.
OperatingInformation
152 TeacherRetirementSystemofTexas2020ComprehensiveAnnualFinancialReport

AverageMonthlyBenefitsPensionTrustFundForFiscalYearsEndedAugust31
1990 1995 2000 2005 2010 2015 2020
BenefitsOriginalBenefits* $ 1,274 $ 1,369 $ 1,689 $ 1,892 $ 2,188 $ 2,208 $ 2,365Increase(Decrease)SinceRetirement 850 568 253 11 9 4 (1)CurrentBenefits $ 2,124 $ 1,937 $ 1,942 $ 1,903 $ 2,197 $ 2,212 $ 2,364
NumberofRetirees** 2,314 4,215 8,972 9,559 15,400 19,901 15,093
*BeforeadjustmentforthePartialLumpSumOption,averageoriginalbenefitswere$1,827,$2,068,$2,367,$2,318,and$2,454forfiscalyears2000,2005,2010,2015,and2020,respectively.
**Foreachoftheretirementyearsshown,numberofserviceretireescurrentlyreceivingbenefits.
The following graph of service retiree accounts as ofAugust 31, 2020 reflects benefit increases and decreasessinceretirement.
ChangesinAverageMonthlyBenefitbyYearofRetirementPensionTrustFund
$2,124$2,124
$1,937$1,937 $1,942$1,942 $1,903$1,903
$2,197$2,197 $2,212$2,212$2,364$2,364
OriginalBenefits* Increase(Decrease)SinceRetirement
1990 1995 2000 2005 2010 2015 2020$0
$500
$1,000
$1,500
$2,000
$2,500
StatisticalSection
153 TeacherRetirementSystemofTexas2020ComprehensiveAnnualFinancialReport

AverageBenefitPayments AverageBenefitPaymentsTRS-Care TRS-ActiveCareLastTenFiscalYears LastTenFiscalYears
2020 2020AverageBenefitPerParticipant $ 5,917 AverageBenefitPerParticipant $ 4,312BenefitPayments $ 1,328,142,605 BenefitPayments $ 2,051,662,233AverageParticipants 224,476 AverageParticipants 475,749
2019 2019AverageBenefitPerParticipant $ 5,818 AverageBenefitPerParticipant $ 4,051BenefitPayments $ 1,336,897,961 BenefitPayments $ 1,956,888,150AverageParticipants 229,775 AverageParticipants 483,113
2018 2018AverageBenefitPerParticipant $ 6,074 AverageBenefitPerParticipant $ 4,267BenefitPayments $ 1,509,503,489 BenefitPayments $ 2,102,362,554AverageParticipants 248,515 AverageParticipants 492,746
2017 2017AverageBenefitPerParticipant $ 5,755 AverageBenefitPerParticipant $ 3,932BenefitPayments $ 1,542,636,922 BenefitPayments $ 1,960,186,861AverageParticipants 268,066 AverageParticipants 498,462
2016 2016AverageBenefitPerParticipant $ 6,062 AverageBenefitPerParticipant $ 4,053BenefitPayments $ 1,575,521,924 BenefitPayments $ 1,970,271,380AverageParticipants 259,889 AverageParticipants 486,139
2015 2015AverageBenefitPerParticipant $ 5,780 AverageBenefitPerParticipant $ 3,607BenefitPayments $ 1,455,126,320 BenefitPayments $ 1,743,448,426AverageParticipants 251,758 AverageParticipants 483,299
2014 2014AverageBenefitPerParticipant $ 5,059 AverageBenefitPerParticipant $ 3,603BenefitPayments $ 1,231,126,693 BenefitPayments $ 1,676,748,847AverageParticipants 243,336 AverageParticipants 465,330
2013 2013AverageBenefitPerParticipant $ 5,053 AverageBenefitPerParticipant $ 3,966BenefitPayments $ 1,183,698,939 BenefitPayments $ 1,885,975,470AverageParticipants 234,277 AverageParticipants 475,508
2012 2012AverageBenefitPerParticipant $ 5,115 AverageBenefitPerParticipant $ 3,868BenefitPayments $ 1,142,131,410 BenefitPayments $ 1,718,903,645AverageParticipants 223,287 AverageParticipants 444,382
2011 2011AverageBenefitPerParticipant $ 4,718 AverageBenefitPerParticipant $ 3,662BenefitPayments $ 992,478,380 BenefitPayments $ 1,510,090,981AverageParticipants 210,353 AverageParticipants 412,385
OperatingInformation
154 TeacherRetirementSystemofTexas2020ComprehensiveAnnualFinancialReport

RetiredMembersbyTypeofBenefitPensionTrustFundFortheFiscalYearEndedAugust31,2020
AmountsofMonthlyBenefits
NumberofRetiredMembers
TypeofRetirement*1 2 3 4 5 6 7
$1-200 15,111 6,017 6,933 179 1,883 52 31 16201-400 43,344 11,909 12,024 614 3,038 922 1,126 13,711401-600 27,493 14,211 8,702 1,254 2,764 372 190 —601-800 25,379 15,640 5,571 1,272 2,270 419 207 —
801-1,000 24,770 17,042 3,949 1,154 2,026 434 165 —1,001-1,200 22,789 16,795 2,687 959 1,853 367 128 —1,201-1,400 19,527 14,549 2,019 776 1,811 275 97 —1,401-1,600 19,460 14,586 2,136 701 1,688 283 66 —1,601-1,800 19,411 14,965 2,041 613 1,497 237 58 —1,801-2,000 20,396 16,637 1,685 511 1,288 241 34 —2,001-3,000 103,110 90,728 4,905 1,369 5,134 901 73 —3,001-4,000 64,528 60,410 981 218 2,473 438 8 —4,001-5,000 24,949 23,680 215 31 858 160 5 —Over5,000 15,007 14,314 88 5 510 89 1 —
Totals 445,274 331,483 53,936 9,656 29,093 5,190 2,189 13,727
*TypeofRetirement:1NormalRetirementofAgeandService 5SurvivorPayment,DeathinService2EarlyRetirement 6SurvivorPayment,AfterDisabilityRetirement3DisabilityRetirement 7SurvivorPayment,AfterServiceRetirement4SurvivorPayment,JointLifeorGuarantee
RetiredMembersbyTypeofBenefitPensionTrustFundFortheFiscalYearEndedAugust31,2020
OptionSelected**
AmountsofMonthlyBenefits
NumberofRetiredMembers 1 2 3 4 5 6
$1-200 15,111 6,551 5,210 1,630 562 1,109 49201-400 43,344 12,214 9,141 3,177 1,220 2,174 15,418401-600 27,493 12,254 8,461 3,634 1,241 1,903 —601-800 25,379 11,150 7,679 3,859 1,162 1,529 —
801-1,000 24,770 10,955 7,347 4,014 1,175 1,279 —1,001-1,200 22,789 9,534 7,136 3,879 1,016 1,224 —1,201-1,400 19,527 7,754 6,483 3,570 808 912 —1,401-1,600 19,460 7,576 6,572 3,555 803 954 —1,601-1,800 19,411 7,529 6,589 3,636 711 946 —1,801-2,000 20,396 7,759 7,106 3,817 728 986 —2,001-3,000 103,110 37,656 37,502 19,581 3,425 4,946 —3,001-4,000 64,528 24,260 22,471 12,873 1,984 2,940 —4,001-5,000 24,949 9,811 8,026 5,498 696 918 —Over5,000 15,007 5,552 5,217 3,440 332 466 —
Totals 445,274 170,555 144,940 76,163 15,863 22,286 15,467
**OptionSelected:
Option1-LifeAnnuity Option4-5-yearGuaranteeOption2-JointtoSurvivor Option5-10-yearGuarantee
Option3-JointtoSurvivor50%/JointtoSurvivor75%
Option6-SurvivorBenefit
StatisticalSection
155 TeacherRetirementSystemofTexas2020ComprehensiveAnnualFinancialReport

HealthBenefitPaymentsbyRangeTRS-CareFortheFiscalYearEndedAugust31,2020
BenefitRange AverageParticipants
$0 8,2271-5,000 160,933
5,001-10,000 27,83710,001-20,000 14,67320,001-30,000 3,89630,001-40,000 2,03240,001-50,000 1,42350,001-100,000 3,256
over100,000 2,199Total 224,476
HealthBenefitPaymentsbyRangeTRS-ActiveCareFortheFiscalYearEndedAugust31,2020
BenefitRange AverageParticipants
$0 80,3641-5,000 312,236
5,001-10,000 50,06110,001-20,000 16,79620,001-30,000 5,26430,001-40,000 2,97340,001-50,000 1,87650,001-100,000 3,752
over100,000 2,427Total 475,749
OperatingInformation
156 TeacherRetirementSystemofTexas2020ComprehensiveAnnualFinancialReport

PrincipalParticipatingEmployersPensionTrustFundFortheFiscalYearsEndedAugust31
2020 2011
ParticipatingReportingEntityCoveredEmployees Rank
PercentageofTotalCoveredEmployment
CoveredEmployees Rank
PercentageofTotalCoveredEmployment
HoustonISD 25,132 1 2.43% 23,777 1 2.92%DallasISD 23,364 2 2.26 19,780 2 2.43UTMDAndersonCancerCenter 22,341 3 2.16 16,254 3 1.99UTSWMedicalCenter 17,403 4 1.68 — —CypressFairbanksISD 16,901 5 1.64 13,193 4 1.62NorthsideISD 16,113 6 1.56 12,775 5 1.57UTatAustin 13,760 7 1.33 10,111 8 1.24KatyISD 13,032 8 1.26 — —UTMedicalBranchatGalveston 12,880 9 1.25 9,128 9 1.12AustinISD 12,369 10 1.20 12,299 6 1.51FortWorthISD — — 10,987 7 1.35NorthEastISD — — 8,956 10 1.10AllOthers 860,201 83.23 678,029 83.15Total 1,033,496 100.00% 815,289 100.00%
Source:InformationsubmittedtoTRSbyparticipatingemployers.
PrincipalParticipatingEmployersTRS-CareFortheFiscalYearsEndedAugust31
2020 2011
ParticipatingReportingEntity
CoveredOPEB
Employees Rank
PercentageofTotalCovered
OPEBEmployment
CoveredOPEB
Employees Rank
PercentageofTotalCovered
OPEBEmployment
HoustonISD 25,131 1 3.03% 23,777 1 3.52%DallasISD 23,364 2 2.82 19,780 2 2.92CypressFairbanksISD 16,901 3 2.04 13,193 3 1.95NorthsideISD 16,113 4 1.94 12,775 4 1.89KatyISD 13,032 5 1.57 — —AustinISD 12,368 6 1.49 12,299 5 1.82FortWorthISD 12,015 7 1.45 10,987 6 1.62FortBendISD 11,564 8 1.39 — —NortEastISD 10,442 9 1.26 8,956 7 1.32AldineISD 9,860 10 1.19 8,538 9 1.26ElPasoISD — — 8,860 8 1.31ArlingtonISD — — 8,119 10AllOthers 679,040 81.82 548,992 81.19Total 829,830 100.00% 676,276 100.00%
Source:InformationsubmittedtoTRSbyparticipatingemployers.
StatisticalSection
157 TeacherRetirementSystemofTexas2020ComprehensiveAnnualFinancialReport

PublicSchools AvingerISD BovinaISD
AbbottISD AxtellISD BowieISD
AbernathyISD AzleISD BoydISD
AbileneISD BairdISD BoysRanchISD
AcademyISD BallingerISD BrackettISD
AdrianISD BalmorheaISD BradyISD
AguaDulceISD BanderaISD BrazosISD
AlamoHeightsISD BangsISD BrazosportISD
Alba-GoldenISD BanqueteISD BreckenridgeISD
AlbanyISD BarbersHillISD BremondISD
AldineISD BartlettISD BrenhamISD
AledoISD BastropISD BridgeCityISD
AliceISD BayCityISD BridgeportISD
AliefISD BeaumontISD BroaddusISD
AllenISD BeckvilleISD BrockISD
AlpineISD BeevilleISD BronteISD
AltoISD BellevueISD BrookelandISD
AlvaradoISD BellsISD BrookesmithISD
AlvinISD BellvilleISD BrooksCountyISD
AlvordISD BeltonISD BrownfieldISD
AmarilloISD BenBolt-PalitoISD BrownsboroISD
AmherstISD BenavidesISD BrownsvilleISD
AnahuacISD BenjaminISD BrownwoodISD
Anderson-ShiroCISD BigSandyISD-BigSandy Bruceville-EddyISD
AndrewsISD BigSandyISD-Dallardsville BryanISD
AngletonISD BigSpringISD BrysonISD
AnnaISD BirdvilleISD BuckholtsISD
AnsonISD BishopCISD BuenaVistaISD
AnthonyISD BlackwellCISD BuffaloISD
AntonISD BlancoISD BullardISD
AppleSpringsISD BlandISD BunaISD
AquillaISD BlanketISD BurkburnettISD
AransasCountyISD BloomburgISD BurkevilleISD
AransasPassISD BloomingGroveISD BurlesonISD
ArcherCityISD BloomingtonISD BurnetCISD
ArgyleISD BlueRidgeISD BurtonISD
ArlingtonISD BluffDaleISD BushlandISD
ArpISD BlumISD BynumCISD
AspermontISD BoerneISD CaddoMillsISD
AthensISD BolesISD CalallenISD
AtlantaISD BolingISD CaldwellISD
AubreyISD BonhamISD CalhounCountyISD
AustinISD BookerISD CallisburgISD
Austwell-TivoliISD BordenCountyISD CalvertISD
AvalonISD BorgerISD CameronISD
AveryISD BosquevilleISD CampbellISD
ListofParticipatingEmployers
158 TeacherRetirementSystemofTexas2020ComprehensiveAnnualFinancialReport

CanadianISD CoahomaISD Cypress-FairbanksISD
CantonISD Coldspring-OakhurstCISD Daingerfield-LoneStarISD
CanutilloISD ColemanISD DalhartISD
CanyonISD CollegeStationISD DallasISD
CarlisleISD CollinsvilleISD DamonISD
CarrizoSpringsCISD ColmesneilISD DanburyISD
CarrollISD ColoradoISD DarrouzettISD
Carrollton-FarmersBranchISD Columbia-BrazoriaISD DawsonISD-Dawson
CarthageISD ColumbusISD DawsonISD-Welch
CastleberryISD ComalISD DaytonISD
CayugaISD ComancheISD DeLeonISD
CedarHillISD ComfortISD DecaturISD
CelesteISD CommerceISD DeerParkISD
CelinaISD CommunityISD DeKalbISD
CenterISD Como-PicktonCISD DelValleISD
CenterPointISD ComstockISD DellCityISD
CentervilleISD-Centerville ConnallyISD DenisonISD
CentervilleISD-Groveton ConroeISD DentonISD
CentralHeightsISD CoolidgeISD DenverCityISD
CentralISD CooperISD DeSotoISD
ChannelviewISD CoppellISD DetroitISD
ChanningISD CopperasCoveISD DeversISD
ChapelHillISD-MountPleasant CorpusChristiISD DevineISD
ChapelHillISD-Tyler Corrigan-CamdenISD DewISD
CharlotteISD CorsicanaISD DeweyvilleISD
CherokeeISD CottonCenterISD D'HanisISD
ChesterISD CotullaISD DibollISD
ChicoISD CouplandISD DickinsonISD
ChildressISD CovingtonISD DilleyISD
ChillicotheISD CrandallISD DimeBoxISD
ChiltonISD CraneISD DimmittISD
ChinaSpringISD CranfillsGapISD DivideISD
ChirenoISD CrawfordISD DoddCityISD
ChisumISD CrockettCountySchoolDistrict DonnaISD
ChristovalISD CrockettISD DossConsolidatedCSD
CiscoISD CrosbyISD DouglassISD
CityViewISD CrosbytonCISD DrippingSpringsISD
ClarendonISD CrossPlainsISD DriscollISD
ClarksvilleISD CrossRoadsISD DublinISD
ClaudeISD CrowellISD DumasISD
ClearCreekISD CrowleyISD DuncanvilleISD
CleburneISD CrystalCityISD EagleMountain-SaginawISD
ClevelandISD CueroISD EaglePassISD
CliftonISD CulbersonCounty-AllamooreISD EanesISD
ClintISD CumbyISD EarlyISD
ClydeISD CushingISD EastBernardISD
StatisticalSection
159 TeacherRetirementSystemofTexas2020ComprehensiveAnnualFinancialReport

EastCentralISD FortElliottCISD GrandPrairieISD
EastChambersISD FortHancockISD GrandSalineISD
EastlandISD FortSamHoustonISD Grandfalls-RoyaltyISD
EctorCountyISD FortStocktonISD GrandviewISD
EctorISD FortWorthISD Grandview-HopkinsISD
Edcouch-ElsaISD FranklinISD GrangerISD
EdenCISD FrankstonISD GrapeCreekISD
EdgewoodISD-Edgewood FredericksburgISD GrapelandISD
EdgewoodISD-SanAntonio FreerISD Grapevine-ColleyvilleISD
EdinburgCISD FrenshipISD GreenvilleISD
EdnaISD FriendswoodISD GreenwoodISD
ElCampoISD FrionaISD Gregory-PortlandISD
ElPasoISD FriscoISD GroesbeckISD
ElectraISD FrostISD GroomISD
ElginISD FruitvaleISD GrovetonISD
ElkhartISD GainesvilleISD GruverISD
ElysianFieldsISD GalenaParkISD GunterISD
EnnisISD GalvestonISD GustineISD
EraISD GanadoISD GuthrieCSD
EtoileISD GarlandISD HaleCenterISD
EulaISD GarnerISD HallettsvilleISD
EustaceISD GarrisonISD HallsburgISD
EvadaleISD GaryISD HallsvilleISD
EvantISD GatesvilleISD HamiltonISD
EvermanISD GauseISD HamlinISD
ExcelsiorISD GeorgeWestISD Hamshire-FannettISD
EzzellISD GeorgetownISD HappyISD
FabensISD GholsonISD HardinISD
FairfieldISD GiddingsISD Hardin-JeffersonISD
FallsCityISD GilmerISD HarlandaleISD
FannindelISD GladewaterCountyLineISD HarletonISD
FarmersvilleISD GlasscockCountyISD HarlingenCISD
FarwellISD GlenRoseISD HarmonyISD
FayettevilleISD GodleyISD HarperISD
FerrisISD GoldburgISD HarroldISD
FlatoniaISD GoldthwaiteISD HartISD
FlorenceISD GoliadISD HartleyISD
FloresvilleISD GonzalesISD HartsBluffISD
FlourBluffISD GoodrichISD HaskellCISD
FloydadaISD GooseCreekCISD HawkinsISD
FollettISD GordonISD HawleyISD
ForestburgISD GormanISD HaysCISD
ForneyISD GradyISD HearneISD
ForsanISD GrafordISD HedleyISD
FortBendISD GrahamISD HemphillISD
FortDavisISD GranburyISD HempsteadISD
ListofParticipatingEmployers
160 TeacherRetirementSystemofTexas2020ComprehensiveAnnualFinancialReport

HendersonISD JacksboroISD LaPorteISD
HenriettaISD JacksonvilleISD LaPryorISD
HerefordISD JarrellISD LaVegaISD
HermleighISD JasperISD LaVerniaISD
HicoISD Jayton-GirardISD LaVillaISD
HidalgoISD JeffersonISD LacklandISD
HigginsISD JimHoggCountyISD LagoVistaISD
HighIslandISD JimNedCISD LakeDallasISD
HighlandISD JoaquinISD LakeTravisISD
HighlandParkISD-Amarillo JohnsonCityISD LakeWorthISD
HighlandParkISD-Dallas JonesboroISD LamarCISD
HillsboroISD JoshuaISD LamesaISD
HitchcockISD JourdantonISD LampasasISD
HollandISD JudsonISD LancasterISD
HollidayISD JunctionISD LanevilleISD
HondoISD KarnackISD LaPoynorISD
HoneyGroveISD KarnesCityISD LaredoISD
HooksISD KatyISD LasaraISD
HoustonISD KaufmanISD LatexoISD
HoweISD KeeneISD LazbuddieISD
HubbardISD-DeKalb KellerISD LeakeyISD
HubbardISD-Hubbard KeltonISD LeanderISD
HuckabayISD KempISD LearyISD
HudsonISD KenedyCountyWideCSD LeforsISD
HuffmanISD KenedyISD LeggettISD
HughesSpringsISD KennardISD LeonISD
Hull-DaisettaISD KennedaleISD LeonardISD
HumbleISD KerensISD LevellandISD
HuntISD KermitISD LeverettsChapelISD
HuntingtonISD KerrvilleISD LewisvilleISD
HuntsvilleISD KilgoreISD LexingtonISD
Hurst-Euless-BedfordISD KilleenISD LibertyHillISD
HuttoISD KingsvilleISD LibertyISD
IdalouISD KirbyvilleCISD Liberty-EylauISD
IndustrialISD KleinISD LindaleISD
InglesideISD KlondikeISD Linden-KildareCISD
IngramISD KnippaISD LindsayISD
IolaISD KnoxCity-O'BrienCISD LinglevilleISD
IowaParkCISD KopperlISD LipanISD
IraISD KountzeISD LittleCypress-MauricevilleCISD
Iraan-SheffieldISD KressISD LittleElmISD
IredellISD KrumISD LittlefieldISD
IrionCountyISD LaFeriaISD LivingstonISD
IrvingISD LaGloriaISD LlanoISD
ItalyISD LaGrangeISD LockhartISD
ItascaISD LaJoyaISD LockneyISD
StatisticalSection
161 TeacherRetirementSystemofTexas2020ComprehensiveAnnualFinancialReport

LohnISD McDadeISD MountVernonISD
LometaISD McGregorISD MuensterISD
LondonISD McKinneyISD MuleshoeISD
LoneOakISD McLeanISD MullinISD
LongviewISD McLeodISD MumfordISD
LoopISD McMullenCountyISD MundayCISD
LoraineISD MeadowISD MurchisonISD
LorenaISD MedinaISD NacogdochesISD
LorenzoCISD MedinaValleyISD NataliaISD
LosFresnosCISD MelissaISD NavarroISD
LouiseISD MemphisISD NavasotaISD
LovejoyISD MenardISD NazarethISD
LoveladyISD MercedesISD NechesISD
LubbockISD MeridianISD NederlandISD
Lubbock-CooperISD MerkelISD NeedvilleISD
Lueders-AvocaISD MesquiteISD NewBostonISD
LufkinISD MexiaISD NewBraunfelsISD
LulingISD MeyersvilleISD NewCaneyISD
LumbertonISD MiamiISD NewDealISD
LyfordCISD MidlandISD NewDianaISD
LytleISD MidlothianISD NewHomeISD
MabankISD MidwayISD-Henrietta NewSummerfieldISD
MadisonvilleCISD MidwayISD-Woodway NewWaverlyISD
MagnoliaISD MilanoISD NewcastleISD
MalakoffISD MildredISD NewtonISD
MaloneISD MilesISD Nixon-SmileyCISD
MaltaISD MilfordISD NoconaISD
ManorISD MillerGroveISD NordheimISD
MansfieldISD MillsapISD NormangeeISD
MarathonISD MineolaISD NorthEastISD
MarbleFallsISD MineralWellsISD NorthHopkinsISD
MarfaISD MissionCISD NorthLamarISD
MarionISD Monahans-Wickett-PyoteISD NorthZulchISD
MarlinISD MontagueISD NorthsideISD-SanAntonio
MarshallISD MonteAltoISD NorthsideISD-Vernon
MartISD MontgomeryISD NorthwestISD
MartinsMillISD MoodyISD NuecesCanyonCISD
MartinsvilleISD MoranISD NurseryISD
MasonISD MorganISD OakwoodISD
MatagordaISD MorganMillISD Odem-EdroyISD
MathisISD MortonISD O'DonnellISD
MaudISD MotleyCountyISD OglesbyISD
MayISD MoultonISD OlfenISD
MaypearlISD MountCalmISD OlneyISD
McAllenISD MountEnterpriseISD OltonISD
McCameyISD MountPleasantISD OnalaskaISD
ListofParticipatingEmployers
162 TeacherRetirementSystemofTexas2020ComprehensiveAnnualFinancialReport

OrangeGroveISD PortNeches-GrovesISD RobinsonISD
OrangefieldISD PostISD RobstownISD
OreCityISD PoteetISD RobyCISD
OvertonISD PothISD RochelleISD
PaducahISD PottsboroISD RockdaleISD
PaintCreekISD PrairieLeaISD RockspringsISD
PaintRockISD PrairieValleyISD RockwallISD
PalaciosISD PrairilandISD RogersISD
PalestineISD PremontISD RomaISD
PalmerISD PresidioISD RooseveltISD
PaloPintoISD PriddyISD RopesISD
PampaISD PrincetonISD RoscoeCollegiateISD
PanhandleISD Pringle-MorseCISD Rosebud-LottISD
PantherCreekCISD ProgresoISD RotanISD
ParadiseISD ProsperISD RoundRockISD
ParisISD QuanahISD RoundTop-CarmineISD
PasadenaISD QueenCityISD RoyalISD
PattonSpringsISD QuinlanISD RoyseCityISD
PawneeISD QuitmanISD RuleISD
PearlandISD RainsISD RungeISD
PearsallISD RallsISD RuskISD
PeasterISD RamirezCommonSD S&SCISD
Pecos-Barstow-ToyahISD RandolphFieldISD SabinalISD
PenelopeISD RangerISD SabineISD
Perrin-WhittCISD RankinISD SabinePassISD
PerrytonISD RaymondvilleISD SaintJoISD
PetersburgISD ReaganCountyISD SaladoISD
PetroliaISD RedLickISD SaltilloISD
PettusISD RedOakISD SamRayburnCISD
PewittCISD RedwaterISD SanAngeloISD
PflugervilleISD RefugioISD SanAntonioISD
Pharr-SanJuan-AlamoISD RicardoISD SanAugustineISD
PilotPointISD RiceCISD SanBenitoCISD
PineTreeISD RiceISD SanDiegoISD
PittsburgISD RichardsISD SanElizarioISD
PlainsISD RichardsonISD SanFelipe-DelRioCISD
PlainviewISD RichlandSpringsISD SanIsidroISD
PlanoISD RieselISD SanMarcosCISD
PleasantGroveISD RioGrandeCityCISD SanPerlitaISD
PleasantonISD RioHondoISD SanSabaISD
Plemons-Stinnett-PhillipsCISD RioVistaISD SanVicenteISD
PointIsabelISD RisingStarISD SandsCISD
PonderISD RiverRoadISD Sanford-FritchISD
PoolvilleISD RivercrestISD SangerISD
PortAransasISD RivieraISD SantaAnnaISD
PortArthurISD RobertLeeISD SantaFeISD
StatisticalSection
163 TeacherRetirementSystemofTexas2020ComprehensiveAnnualFinancialReport

SantaGertrudisISD SpearmanISD ThrockmortonISD
SantaMariaISD SplendoraISD TidehavenISD
SantaRosaISD SpringBranchISD TimpsonISD
SantoISD SpringCreekISD TiogaISD
SavoyISD SpringHillISD TolarISD
Schertz-Cibolo-UniversalCityISD SpringISD TomBeanISD
SchleicherCountyISD Springlake-EarthISD TomballISD
SchulenburgISD SpringtownISD TornilloISD
Scurry-RosserISD SpurISD TrentISD
SeagravesISD SpurgerISD TrentonISD
SealyISD StaffordMunicipalSchoolDistrict TrinidadISD
SeguinISD StamfordISD TrinityISD
SeminolePublicSchools StantonISD TroupISD
SeymourISD StephenvilleISD TroyISD
ShallowaterISD SterlingCityISD TuliaISD
ShamrockISD StockdaleISD Tuloso-MidwayISD
SharylandISD StratfordISD Turkey-QuitaqueISD
ShelbyvilleISD StrawnISD TylerISD
SheldonISD SudanISD UnionGroveISD
ShepherdISD SulphurBluffISD UnionHillISD
ShermanISD SulphurSpringsISD UnitedISD
ShinerISD SundownISD UtopiaISD
SidneyISD SunnyvaleISD UvaldeCISD
SierraBlancaISD SunrayISD ValentineISD
SilsbeeISD SweenyISD ValleyMillsISD
SilvertonISD SweetHomeISD ValleyViewISD-Pharr
SimmsISD SweetwaterISD ValleyViewISD-ValleyView
SintonISD TaftISD VanAlstyneISD
SivellsBendISD TahokaISD VanISD
Skidmore-TynanISD TarkingtonISD VanVleckISD
SlatonISD TatumISD VegaISD
SlidellISD TaylorISD VenusISD
SlocumISD TeagueISD VeribestISD
SmithvilleISD TempleISD VernonCISD
SmyerISD TenahaISD VictoriaISD
SnookISD TerlinguaCSD VidorISD
SnyderISD TerrellCountyISD VysehradISD
SocorroISD TerrellISD WacoISD
SomersetISD TexarkanaISD WaelderISD
SomervilleISD TexasCityISD WalcottISD
SonoraISD TexhomaISD WallISD
SouthSanAntonioISD TexlineISD WallerISD
SouthTexasISD ThorndaleISD WalnutBendISD
SouthlandISD ThrallISD WalnutSpringsISD
SouthsideISD ThreeRiversISD WarrenISD
SouthwestISD ThreeWayISD WaskomISD
ListofParticipatingEmployers
164 TeacherRetirementSystemofTexas2020ComprehensiveAnnualFinancialReport

WaterValleyISD WoodvilleISD CollegiateEdu-Nation
WaxahachieISD WorthamISD CompassAcademy
WeatherfordISD WylieISD-Abilene CompassRoseEducationInc
WebbCISD WylieISD-Wylie ComquestAcademy
WeimarISD YantisISD CorpusChristiMontessoriSchool
WellingtonISD YoakumISD CrosstimbersAcademy
Wellman-UnionISD YorktownISD CumberlandAcademy
WellsISD YsletaISD DemocracyPrepPublicSchools
WeslacoISD ZapataCountyISD DrMLGarza-GonzalezCharterSchool
WestHardinCountyCISD ZavallaISD DrawAcademy
WestISD ZephyrISD EagleAdvantageSchool
WestOrange-CoveCISD EastFortWorthMontessoriSchool
WestOsoISD CharterSchools EastTexasAdvancedAcademies
WestRuskCountyCISD APlusAcademy EastTexasCharterSchool
WestSabineISD APlusUnlimitedPotential EctorSuccessAcademyNetwork
WestbrookISD AWBrownFellowshipCharterSchool EducationCenterInternationalAcademy
WesthoffISD AcademyofAcceleratedLearningInc ElPasoAcademyEast
WestphaliaISD AcademyofDallas ElPasoLeadershipAcademy
WestwoodISD AcceleratedIntermediateAcademy EleanorKolitzHebrewLanguageAcademy
WhartonISD AliefMontessoriSchool ElementarySchoolforEducationInnovation
WheelerISD AmbassadorsPreparatoryAcademy ElevateCollegiateCharterSchool
WhiteDeerISD AmigosPorVida-FriendsForLifeChSch ErathExcelsAcademy
WhiteOakISD AristoiClassicalAcademy EtoileAcademyCharterSchool
WhiteSettlementISD ArlingtonClassicsAcademy EvolutionAcademyCharterSchool
WhitefaceISD ArrowAcademy ExcellenceinLeadershipAcademy
WhitehouseISD AustinAchievePublicSchools FaithFamilyAcademyWaxahachie
WhitesboroISD AustinDiscoverySchool FortWorthAcademyFineArts
WhitewrightISD BasisSanAntonio GatewayCharterAcademy
WhitharralISD BeatriceMayesInstituteCharterSchool GeorgeGervinAcademy
WhitneyISD BenMilamInternationalAcademy GeorgeISanchezCharterSchool
WichitaFallsISD BetaAcademy GoldenRuleCharterSchool
WildoradoISD BexarCountyAcademy GoodwaterMontessoriSchool
WillisISD BigSpringsCharterSchool GreatHeartsAcademy-SanAntonio
WillsPointISD BloomAcademyCharterSchool GulfCoastTradesCenter
WilsonISD BobHopeSchool HarmonySchoolofExcellence-Houston
WimberleyISD BrazosRiverCharterSchool HarmonySchoolofScience-Houston
WindhamSchoolDistrict BrazosSchoolforInquiry&Creativity HarmonyScienceAcademy-Austin
WindthorstISD BridgewayPreparatoryAcademy HarmonyScienceAcadamy-ElPaso
Wink-LovingCISD BrooksAcademyofScience&Engineering HarmonyScienceAcademy-Houston
WinnsboroISD BurnhamWoodCharterSchoolDistrict HarmonyScienceAcademy-SanAntonio
WinonaISD CalvinNelmsCharterSchools HarmonyScienceAcademy-Waco
WintersISD CarverCenter HenryFordAcademyAlamedaSchool
WodenISD CedarsInternationalAcademy HeritageAcademy
WolfeCityISD ChaparralStarAcademy HighPointAcademy
WoodsboroISD ChapelHillAcademy HoustonClassicalCharterSchool
WoodsonISD CityscapeSchoolsInc HoustonGatewayCharterSchool
StatisticalSection
165 TeacherRetirementSystemofTexas2020ComprehensiveAnnualFinancialReport

HoustonHeightsHighSchool RanchAcademy TriviumAcademy
IdeaPublicSchools RapoportAcademy TwoDimensionsPrepAcademy
InspiredAcademies RaulYzaguirreSchool UmePreparatoryAcademy
InspiredVisionAcademy REACHNetwork UniversalAcademy
InternationalLeadershipofTexas RelayLabSchoolsTexas UpliftEducation
JeanMassieuAcademy RevePreparatoryCharterSchool ValorPublicSchools
JubileeAcademies RichardMilburn-Killeen VanguardAcademy
KatherineAnnePorterSchool RiseAcademy VarnettCharterSchool
KauffmanLeadershipAcacemy RuralSchoolsInnovationZone VillageTechSchools
KiCharterAcademy SanAntonioPreparatoryCharterSchool VistaDelFuturoCharterSchool
KippTexasPublicSchools SchoolInnovationCollaborative WacoCharterSchool
LaAcademiaDeEstrellas SchoolofExcellenceinEducation WaysideSchools
LaFePreparatorySchool SchoolofScience&Tech-Discovery WestlakeAcademy
LeadershipAcademyNetwork SchoolofScience&Technology WinfreeAcademyCharterSchools
LeadershipPrepSchool SeashoreCharterSchools YellowstoneCollegePreparatory
LegacyPreparatory Ser-NinosCharterSchool YESPrepPublicSchools
LegacySchoolofSportSciences SouthTexasEducationalTech
LifeSchool SouthwestHighSchool CommunityandJuniorColleges
LighthouseCharterSchool SouthwestPreparatorySchool AlamoCommunityCollegeDistrict
LubbockPartnershipNetwork StAnthonySchool AlvinCommunityCollege
LuminEducation StMarysCharterSchool AmarilloCollege
ManaraAcademy SteppingStonesCharterElementary AngelinaCollege
MeadowlandCharterDistrict TekoaAcademy AustinCommunityCollege
MeridianWorldSchoolLLC TexansCanAcademies BlinnCollege
MeyerparkElementaryCharter TexasCollegePreparatoryAcademies BrazosportCollege
MidlandAcademyCharterSchool TexasCouncilforInternationalStudies CentralTexasCollege
MontessoriForAll TexasEducationCenter CiscoJuniorCollege
MoodyEarlyChildhoodCenter TexasEmpowermentAcademy ClarendonCollege
NewFrontiersPublicSchools TexasPreparatorySchool CoastalBendCollege
NewmanInternationalAcademy TexasSerenityAcademy CollegeoftheMainland
NorthTexasElementarySchoolofArts TheEhrhartSchool CollinCountyCommunityCollege
NovaCharterSchool TheExcelCenter DallasCountyCommunityCollegeDistrict
NovaCharterSoutheast TheGatheringPlace DelMarCollege
NYOSCharterSchool TheLawsonAcademy ElPasoCommunityCollege
OdysseyAcademy TheLoneStarLanguageAcademy FrankPhillipsCollege
OrendaCharterSchool ThePro-VisionAcademy GalvestonCollege
PanolaCharterSchool TheRhodesSchool GraysonCountyCollege
PegasusSchoolofLiberalArts&Science TLCAcademy HillCollege
PineywoodsAcademy TransformationWaco HoustonCommunityCollegeSystem
PioneerTechnology&ArtsAcademy TreetopsInternational HowardCountyJuniorCollegeDistrict
PorVidaAcademy TrinityBasinPreparatory KilgoreCollege
PremierHighSchools TrinityCharterSchool LaredoCommunityCollege
PriorityCharterSchools TriumphPublicHighSchools-ElPaso LeeCollege
PromesaAcademyCharterSchool TriumphPublicHighSchools-Laredo LoneStarCollegeSystem
PromesaPublicSchools TriumphPublicHighSchools-Lubbock McLennanCommunityCollege
PromiseCommunitySchool TriumphPublicHighSchools-RioGrandeValley
MidlandCollege
ListofParticipatingEmployers
166 TeacherRetirementSystemofTexas2020ComprehensiveAnnualFinancialReport

NavarroCollege TexasA&MUniversity-Galveston Region08EducationServiceCenter
NorthCentralTexasCollege TexasA&MUniversity-Kingsville Region09EducationServiceCenter
NortheastTexasCommunityCollege TexasA&MUniversity-SanAntonio Region10EducationServiceCenter
OdessaCollege TexasA&MUniversity-Texarkana Region11EducationServiceCenter
PanolaCollege TexasA&MUniversitySystemsOffice Region12EducationServiceCenter
ParisJuniorCollege TexasDivisionofEmergencyManagement Region13EducationServiceCenter
RangerJuniorCollege TexasSouthernUniversity Region14EducationServiceCenter
SanJacintoCollegeDistrict TexasStateTechnicalCollege Region15EducationServiceCenter
SouthPlainsCollege TexasStateUniversity-SanMarcos Region16EducationServiceCenter
SouthTexasCollege TexasStateUniversitySystem Region17EducationServiceCenter
SouthwestTexasJuniorCollege TexasTechUniversity Region18EducationServiceCenter
TarrantCountyCollegeDistrict TexasWoman'sUniversity Region19EducationServiceCenter
TempleCollege UniversityofHouston Region20EducationServiceCenter
TexarkanaCollege UniversityofNorthTexas
TexasSouthmostCollege UniversityofNorthTexasatDallas OtherEducationDistricts
TrinityValleyJuniorCollege UniversityofNorthTexasSystemAdmin AndersonCountySpecialEducationCo-Op
TylerJuniorCollege UniversityofTexasSystem BowieCountySchoolDistrict
VernonCollege UniversityofTexasatArlington HarrisCountyDeptofEducation
VictoriaCollege UniversityofTexasatAustin
WeatherfordCollege UniversityofTexasatDallas OtherEntities
WesternTexasCollege UniversityofTexasatElPaso TeacherRetirementSystemofTexas
WhartonCountyJuniorCollege UniversityofTexasatPermianBasin
UniversityofTexasatRioGrandeValley
SeniorCollegesandUniversities UniversityofTexasatSanAntonio
AngeloStateUniversity UniversityofTexasatTyler
LamarInstituteofTechnology WestTexasA&MUniversity
LamarStateCollege-Orange
LamarStateCollege-PortArthur MedicalSchools
LamarUniversity-Beaumont TexasA&MUniversitySystemHSC
MidwesternStateUniversity TexasA&MVetMedicalDiagnosticLab
PrairieViewA&MUniversity UnivofNorthTexasHSCatFortWorth
SamHoustonStateUniversity UnivofTexasHealthCenteratTyler
StephenFAustinStateUniversity UnivofTexasHSCatHouston
SulRossStateUniversity UnivofTexasHSCatSanAntonio
TarletonStateUniversity UnivofTexasMDAndersonCancerCenter
TexasA&MAgrilifeExtensionService UnivofTexasMedicalBranchatGalveston
TexasA&MAgrilifeResearch UnivofTexasSouthwesternMedicalCenter
TexasA&MEngineeringExperimentStation
TexasA&MEngineeringExtensionService RegionalServiceCenters
TexasA&MForestService Region01EducationServiceCenter
TexasA&MInternationalUniversity Region02EducationServiceCenter
TexasA&MTransportationInstitute Region03EducationServiceCenter
TexasA&MUniversity Region04EducationServiceCenter
TexasA&MUniversity-CentralTexas Region05EducationServiceCenter
TexasA&MUniversity-Commerce Region06EducationServiceCenter
TexasA&MUniversity-CorpusChristi Region07EducationServiceCenter
StatisticalSection
167 TeacherRetirementSystemofTexas2020ComprehensiveAnnualFinancialReport

Thispageisintentionallyleftblank.
168 TeacherRetirementSystemofTexas2020ComprehensiveAnnualFinancialReport


ChangesinStateLaw
The Texas Legislature did not meet in fiscal year2020. No noteworthy state law developmentsaffecting TRS occurred during the current fiscalyear.
ChangesinFederalLaw
A.Investments
Implementation of Rulemaking Under the Dodd-FrankWallStreetReformandConsumerProtectionAct(2010)(Dodd-Frank)
Duringthisfiscalyear,TRScontinuedmonitoringthesecond implementation phase of the new marginrequirements for uncleared swaps, which willaddress initial margin, for example requiring two-way posting and segregation of initialmargin. Thetimetable for complying with these rules has beenpushed back due to COVID-19, so the initial-marginregulationsshouldapplytoTRSeffectiveSeptember2022.Aheadofthatdeadline,TRSwillamendsomeor all of its International Swaps and DerivativesAssociation agreements to account for the newrequirements and also put into place arrangementsforthird-partycustodyofinitialmargin.
B.HealthCareBenefits
FederalPatientProtectionandAffordableCareActof2010(PPACA)
During this fiscal year, in a continued effort toidentify any impact upon the health benefitprograms administered by TRS, TRS continued tomonitorregulationsissuedwithregardtothePPACA.
TRS continues to allow certain participatingemployersinTRS-ActiveCaretodesignateTRS,actingin its capacityas trusteeofTRS-ActiveCare, to fulfillthe reporting requirements under Internal RevenueCode Section 6055 for months of enrollment incalendar year 2020. Section 6055 addresses thereportingofhealthcarecoverageselectedbyactiveemployees and COBRA qualified beneficiaries (andtheir dependents) who are enrolled in one of thePPOplansofferedunderTRS-ActiveCare.
TRSalsocontinuestomakeeffortstoensurethatthecoverage it offers under TRS-ActiveCare meets thePPACA'sminimumvalueandaffordabilitystandards,inordertoassisttheparticipatingentities’effortstoavoidthePPACA'ssharedresponsibilitypenalties.
TRS also continues tomonitor the litigation relatedto the constitutionality of the PPACA. InMarch of2020, the United States Supreme Court agreed toreview the case of California v. Texas (formerlyknownasTexasv.U.S.)aftertheFifthCircuitCourtofAppeals determined that the PPACA's individualmandatewasunconstitutional,but failed to ruleonwhether that conclusion renders the remainingprovisionsofthePPACAinvalid.TheSupremeCourtcouldhear thecaseasearlyasOctober2020,butadecision could come as late as June 2021. TRS willcontinuetofollowthislitigationandassessitsimpactontheTRS-CareandTRS-ActiveCareplansanduponTRSoperations.
TheFurtherConsolidatedAppropriationsActof2020repealed Internal Revenue Code Section 4980I(introduced by the PPACA and informally known as"theCadillac Tax")whichwouldhave imposed a 40percentexcisetaxoncertainhighcostgrouphealthplans.Itseffectivedatehadpreviouslybeendelayeduntil2022,butitisnowcompletelyrepealed.Ontheother hand, thisAct extended thePatient CenteredOutcomes Research Institute Fee for an additionaltenyearsuntil2029.Thisisafeeimposedongrouphealthplansbasedontotalenrollmentandthefundsraisedaretobeusedforspecifiedmedicalresearch.The current fee is $2.54 per covered life, butincreaseseachyear.
HighDeductibleHealthPlans
TRS continues to monitor changes that affect TRS-ActiveCare1-HDplan(ahighdeductiblehealthplan).Forexample, the IRSannually releasescost-of-livingincreases related to the minimum deductibles andmaximum out-of-pocket amounts allowed under ahigh deductible health plan. TRS ensures TRS-ActiveCare1-HDplanmeetsthoserequirements.
COVID-19
Thefederalgovernment’sresponsetotheCOVID-19pandemic resulted in changes to the health plansoffered under TRS-Care and TRS-ActiveCare. TheFamilies First Coronavirus Response Act ("FFCRA")and the Coronavirus Aid, Relief, and EconomicSecurity ("CARES")Act requiremandatory coverage,withoutcostsharing,ofCOVID-19diagnostictestingand related services under TRS' health programs incertain circumstances. TheCARESActalso requirestherapidcoverageofaCOVID-19vaccinewhenoneisdevelopedandapprovedbyfederalgovernmentalentities and provides a temporary safe harbor thatallows thehighdeductible health plans of TRS-Care
ChangesintheLaw
170 TeacherRetirementSystemofTexas2020ComprehensiveAnnualFinancialReport

and TRS-ActiveCare to cover telehealth and otherremote health services without a deductible.Guidance from the U.S. Department of Health andHumanServicesalsoallowsTRS'healthprogramstoextend certain deadlines for participants to providenotice of special enrollment events and COBRAelections, to pay COBRA premiums, and to appealadversebenefitdeterminations,amongotherthings.
C.Pension
TaxLaws,Regulations,andGuidance
The Coronavirus Aid, Relief, and Economic SecurityAct (“CARES Act”) went into effect on March 27,2020. TRS implemented certain provisions of theCARES Act related to Coronavirus DistributionPayments.
Duringthisfiscalyear,TRScontinuedtomonitorthestatusofproposedregulationsregardingincometaxwithholding on certain periodic retirement andannuity payments, the applicability of normalretirementageregulations,andthedeterminationofgovernmentalplanstatus.
D.OtherDevelopments
DataPrivacy
TheGeneralDataProtectionAct(“GDPR”)wentintoeffectonMay25,2018.ThisRegulationrestrictstheuse and storage of the personal information ofindividuals in the European Union and restricts theinternationaltransferofsuchdata.TRSiscontinuingto implement and apply the GDPR restrictions as itapplies to the operations of TRS’ subsidiary in theUK.
MarketAbuseRegulation
MAR took effect on July 3, 2016, and contains therulesoninsiderdealing,unlawfuldisclosureofinsideinformationandmarketmanipulationthatappliesintheEuropeanUnion. Itaffectsany firm that tradeson an in-scope European Economic Area (EEA)market,regardlessofwhetherthefirmiswithintheEEA. MAR includescomplianceand legalprovisionsthataresimilartoU.Sinsidertradinglawsaswellasadditionalrequirementssuchas“marketsoundings”thatinvolvethecommunicationofpotentiallyinsiderinformationbythesellsidetothebuyside.
MarketsinFinancialInstrumentsDirectiveII
MiFIDIItookeffectonJanuary3,2018andregulatescertain investment services across the EEA. Inparticular, it requires unbundling of trading costsbetween research and execution services and feessuchthatEEAmanagersmusteitherpayforresearchthemselves or set up a research payment account,where the budget has been agreedwith the client.Manymanagershavedeterminedtopayforresearchthemselves, which has led to a drop in researchbudgets.SomeUSmanagershaveadoptedasimilarapproach.
BenefitsSection
171 TeacherRetirementSystemofTexas2020ComprehensiveAnnualFinancialReport

SummaryofBenefits
The Teacher Retirement System of Texas (TRS)administers the TRS Pension Trust Fund, a definedbenefit retirement plan that is a qualified pensiontrust under Section 401(a) of the Internal RevenueCode. The Pension Trust Fund provides serviceretirement,disabilityretirement,deathandsurvivorbenefits to eligible employees of public and highereducation in Texas. The TRS Benefits Handbook, ageneral information booklet, is available to TRSmembers, annuitants, and the public on the TRSwebsite,www.trs.texas.gov.
TRS also administers two separate health carerelatedtrustfunds:
• TRS-ActiveCare is the statewide healthbenefits program for eligible active publiceducation employees of participatingemployersandtheireligibledependents.
• TRS-Care is the statewide health benefitsprogramforeligibleretiredpubliceducationemployeesandtheireligibledependents.
TRS also administers an optional long-term careinsuranceprogramforeligibleretirees,publicschoolemployees, their dependents, and other familymembers. ThePlan isavailableonanenrollee-pay-all-basis.
RetirementPlanBenefits
This summary of benefits is based on statutoryprovisionsoftheplan,effectiveforfiscalyear2020.
A.ServiceRetirement
NormalRetirementEligibility
For members whose membership began prior toSeptember 1, 2007, who had at least five years ofservice credit as of August 31, 2014, and whomaintainedmembershipuntilretirement:
• Age 65 with at least five years of creditedservice,or
• The sum of themember's age and years ofcreditedserviceequalsorexceeds80withatleastfiveyearsofcreditedservice.
FormemberswhosemembershipbeganonorafterSeptember1,2007butprior toSeptember1,2014,who had at least five years of service credit as ofAugust 31, 2014, andwhomaintainedmembershipuntilretirement:
• Age 65 with at least five years of creditedservice,or
• Age 60 and the sum of the member's ageand years of credited service equals orexceeds 80 with at least five years ofcreditedservice.
FormemberswhodidnothaveatleastfiveyearsofservicecreditasofAugust31,2014,whoestablishedTRSmembershiponor after September1, 2014,orwho had at least five years of service credit as ofAugust31,2014butterminatedmembership inTRSby withdrawal of accumulated contributions andlaterresumedTRSmembership:
• Age 65 with at least five years of creditedservice,or
• Age 62 and the sum of the member's ageand years of credited service equals orexceeds 80 with at least five years ofcreditedservice.
StandardAnnuity
Amonthlybenefitpayableatretirementthroughouttheretiree'slifetimeandcalculatedaccordingtothestatutorybenefitformula.
BenefitFormula
Theannualstandardannuityisbasedontheaverageof the five highest annual creditable salariesmultipliedbytheyearsofcreditedservicemultipliedby 2.3 percent. For members who aregrandfathered,thethreehighestannualsalariesareusedinthebenefitformula.
MinimumBenefit
$150 per month less any reduction for early ageretirementoroptionalannuityselection.
EarlyAgeRetirementEligibility
For members whose membership began prior toSeptember 1, 2007, who had at least five years ofservice credit as of August 31, 2014, and whomaintainedmembershipuntilretirement:
• Atleast55withfiveormoreyearsofservicecredit,butthesumofthemember'sageandyearsofservicecredittotallessthan80,or
• 30 or more years of service credit, but thesum of the member's age and years ofservicecredittotallessthan80.
SummaryofBenefits
172 TeacherRetirementSystemofTexas2020ComprehensiveAnnualFinancialReport

FormemberswhosemembershipbeganonorafterSeptember1,2007butprior toSeptember1,2014,who had at least five years of service credit as ofAugust 31, 2014, andwhomaintainedmembershipuntilretirement:
• Atleast55withfiveormoreyearsofservicecredit,butthesumofthemember'sageandyearsofservicecredittotallessthan80,or
• 30 or more years of service credit, but thesum of the member's age and years ofservice credit total less than 80, and thememberislessthanage60,or
• The sum of themember's age and years ofservice credit total at least 80, but thememberislessthanage60.
For members who met the requirements to begrandfatheredbeforeSeptember1,2005,thereisnoreductiontotheirbenefitbasedonactuarialtablesifthey are at least age 55, the sum of their age andyearsofservicecredittotalatleast80,andtheyarebelow age 60. These members are still consideredearly-ageretirees.
FormemberswhodidnothaveatleastfiveyearsofservicecreditasofAugust31,2014,whoestablishedTRSmembershiponor after September1, 2014,orwho had at least five years of service credit as ofAugust31,2014butterminatedmembership inTRSby withdrawal of accumulated contributions andlaterresumedTRSmembership:
• Atleast55withfiveormoreyearsofservicecredit,butthesumofthemember'sageandyearsofservicecredittotallessthan80,or
• 30 or more years of service credit, but thesum of the member's age and years ofservice credit total less than 80, and thememberislessthanage62,or
• the sum of themember's age and years ofservice credit total at least 80, but thememberislessthanage62.
For members who met the requirements to begrandfatheredbeforeSeptember1,2005,thereisnoreductiontotheirbenefitbasedonactuarialtablesifthey are at least age 55, have at least 20 years ofservice credit, the sum of their age and years ofservice credit total at least 80, and they are below
age 62. These members are still considered early-ageretirees.
EarlyAgeRetirementBenefit
The standard annuity amount calculated under thebenefit formula (or the minimum benefit, ifapplicable)andusedtodeterminetheamountofanyoptionalretirementannuity isreducedforearlyageretirement. The amount of the reduction variesdepending on age, years of service credit, andwhetheramemberisgrandfathered.
B.DisabilityRetirement
Eligibility
Physicalormentaldisabilityprecludesthemember'scontinued performance of current duties and thedisability is probablypermanent, as certifiedby theTRSMedicalBoard.
Benefit
For disabled members with at least 10 years ofcreditedservice,thegreaterofthestandardannuityunreduced for early age or $150 per monthminimum benefit, less any reduction for theselection of an optional annuity. For disabledmembers with fewer than 10 years of creditedservice, $150 per month. The minimum benefitamountsaresubjecttoreductionfortheselectionofanoptionalretirementannuity.
Duration
For retirees with 10 or more years of creditedservice, payments continue for as long as thedisability continues. For those with fewer than 10yearsofcreditedservice,paymentscontinueforthelife of the retiree, the duration of the disability, orthenumberofmonthsofcreditedservice,whicheverisshorter.
EarningsLimit
Disability retirees who applied and retired afterAugust 31, 2007 are subject to an annual limit onearningsfromanyemployment.Thecurrentlimitisthe greater of the highest annual salary beforeretirement or $40,000. Excess earnings will causebenefitstobeforfeiteduntilsuchtimeastheexcessearnings cease or are reduced to an allowableamount.
BenefitsSection
173 TeacherRetirementSystemofTexas2020ComprehensiveAnnualFinancialReport
C.AnnuityPaymentOptions
All service and eligible disability retireesmay selectan optional form of payment that reduces thestandard annuity by application of actuarialreductionfactors inordertocontinuepaymenttoabeneficiary after the retiree's death. Actuarialfactorsfordisabilityretireesaredifferentfromthoseforserviceretireesbecauseofdifferentassumptionsabout life expectancy for the two groups. Theavailable options include 100, 75, and 50 percentjoint and survivor annuities, and five and ten yearguaranteed period annuities. Selection of a 100 or75 percent joint and survivor annuity and a five orten year guaranteed period annuity may not beallowedincertainsituationsbasedontheminimumdistributionprovisionsoffederaltaxlaw.
D.ThePop-UpProvision
Ifadesignatedbeneficiaryunderanyofthejointandsurvivor options dieswhile the retiree is still living,the retiree's future monthly payment increases totheamountofthestandardannuity.
E.PartialLumpSumOption
UnderthePartialLumpSumOption(PLSO),availablefor election at the time of retirement, eligiblemembersmayelecttoreceiveanactuariallyreducedservice retirement annuity plus a lump sumdistribution.
Members may elect to receive a PLSO if they areeligible for service retirement,meet the Rule of 90(ageandyearsofservicecreditequalatleast90),arenotparticipating in theDeferredRetirementOptionPlan (DROP), and are not retiring with disabilityretirement benefits. Grandfathered members mayelect PLSO at retirement if they are eligible fornormal age service retirement under the pre-September 1, 2005 law (age 65 with at least fiveyears of credited service, or the sum of themember'sageandyearsofcreditedserviceequalsorexceeds 80 with at least five years of creditedservice), are not participating inDROP, and are notretiringwithdisabilityretirementbenefits.MembersretiringundertheproportionateretirementprogramarenoteligibletoelectthePLSO.
Partiallumpsumdistributionsequalto12,24,or36monthsofastandardserviceretirementannuitymaybeselected.Whenamemberselectsthisoption,themonthlyannuity isactuariallyreducedtoreflectthelump sum distribution. Flexible annual distribution
options are available, including rollovers to anothereligibleretirementplan.
F.DeferredRetirementOptionPlan
TheTRSPensionPlanpermittedeligiblememberstoparticipate in a Deferred Retirement Option Plan(DROP) by enrolling no later than December 31,2005. DROP participants continued employmentwhile accumulating a portion of their standardretirement annuity in a special account that isdisbursed beginning at the time of their retirementordeath.
MemberswhoelectedDROPchosetoparticipate in12-month increments for up to five years. DuringDROP participation, the member did not accrueadditional service credit for their pension annuity,nor is any compensation earned during DROPparticipation considered in calculating the standardpensionannuity.
During DROP participation, the member's statutorycontributions to TRS continue. However,contributions were not credited to the member'scontributionaccountandarenotrefundable.
Interest on the DROP account balance prior toSeptember1,2014wascomputedatanannualrateoffivepercent.Subsequenttothatdate,theinterestratechangedtotwopercent.
Members who participated in DROP but continuedworking in membership eligible employment afterthe close of their participation period earn post-DROPretirementbenefitsbasedsolelyoncreditablecompensation received and service credit earnedafter their DROP participation period ended. Post-DROP benefits are distributed with the retirementandDROPbenefits.
G. Minimum Service Credit Required for ServiceRetirementBenefits
Undercurrentlaw,amemberwhohascompletedatleastfiveyearsofcreditedservicehasearnedarighttoserviceretirementbenefitsafterreachingeligibleretirement age, provided that the member'saccumulated contributions are not withdrawn fromthesystem.
Service credited in another retirement system thatparticipates in the Proportionate RetirementProgrammaybecombinedwithTRSservicecredittodetermine eligibility for TRS service retirementbenefits. AnyqualifyingUSERRAmilitaryservice,uptoamaximumoffiveyears,mayalsobecountedin
SummaryofBenefits
174 TeacherRetirementSystemofTexas2020ComprehensiveAnnualFinancialReport

determining eligibility for TRS service retirementbenefits. TheUSERRAserviceand/orcompensationcreditmayalsobepurchasedtoincreasetheamountof the retirement benefit ormay simply be verifiedandusedtoestablisheligibility.
Aneligiblemembermustapplyforbenefitsandmeetother requirements, such as termination of Texaspublic education employment, in order to beginreceivingbenefits.
H.DeathandSurvivorBenefits
ActiveMembers
The beneficiary of an active member may elect toreceiveoneofthefollowingbenefitsintheeventofthemember'sdeathbeforeretirementinanyofthefollowingsituations:
• if themember dies during a school year inwhichthememberperformedservice,or
• if the member was absent from servicebecause of sickness, accident or anotherreasonTRSdeterminesisinvoluntary,or
• infurtheranceoftheobjectivesorwelfareofthepublicschoolsystem,or
• ifthememberdieswheneligibletoretire,or
• wouldhavebecomeeligiblewithout furtherservice before the fifth anniversary of themember'slastdayofserviceasamember
• if the member dies while performingqualified military service as defined byapplicablefederallaw
• whenthemember isabsent fromserviceasdescribedbylaw,suchaswhentheabsenceis due to sickness, accident, or otherinvoluntarycause
• when the member is within five years ofbeing eligible to retire when leavingemployment.
BenefitOptions
• A lump sum payment equal to twice themember’s annual rate of compensation or$80,000,whicheverisless,or
• Sixty monthly payments equal to themember’s standard annuity withoutreduction for early age, provided the
member had at least five years of servicecreditatthetimeofdeath,or
• Lifetime payments equal to a 100 percentjoint and survivor annuity, provided themember had at least five years of servicecredit, and is subject to any reductionapplicable for early age. This benefit is onlyavailablewhenthereisasolebeneficiary,or
• An amount equal to a return of themember’s contributions with accumulatedinterest,or
• Survivor benefits of $2,500 lump sumpayment plus a monthly benefit to eligiblebeneficiaries. For example, $350 permonthtoabeneficiaryspousewithminorchildren,continuing until the youngest child reachesage 18. When the spouse turns age 65, orwhen the youngest child reaches age 18,whichever is later, the spouse would beginreceiving$250permonthforlife.
Inaddition to these fiveoptions,a lumpsumdeathbenefitof$160,000isavailableiftheactivememberisemployedinaTRS-coveredpositionanddiesastheresultofaphysicalassaultduringtheperformanceoftheemployee'sregularjobduties.
Also, the beneficiary of a DROP participant willreceive the accumulated DROP account balance,payableasalumpsumorinperiodicinstallments.
Retirees
In addition to any joint and survivor or guaranteedperiod annuity that may be payable under anoptional form of payment a retiree elected, thebeneficiaryofaserviceordisabilityretireeisentitledto a $10,000 lump sumpayment. Eligible survivorsmay select alternatepaymentoptions in lieuof thelump sum benefit. The alternate payment optionsinclude a lump sum payment of $2,500 plus anapplicablemonthlysurvivorbenefit.
If total payments made before death to a retireeand,whenapplicable,toabeneficiaryforanoptionalservice retirement annuity, are less thanaccumulatedcontributionsatretirement,anamountequal to the remainder of the balance ofaccumulatedcontributions ispaidtothebeneficiaryorasotherwiseprovidedbylaw.Shouldaretireedieprior to receiving all PLSO payments that are due,TRSwillpayanyremainingPLSOpaymentsinasinglelumpsumpaymenttothebeneficiary.Iftheretireeparticipated in DROP and died before receiving all
BenefitsSection
175 TeacherRetirementSystemofTexas2020ComprehensiveAnnualFinancialReport

DROPdistributions, anyunpaidDROPpaymentsarepaidtothebeneficiarydesignatedbytheretiree.
I.GrandfatheredProvisions
A person who, as a member, met any one of thefollowing criteria on or before Aug. 31, 2005, isgrandfathered under plan provisions repealed withrespecttonon-grandfatheredmembers:
• thememberwasatleast50yearsold,or
• themember'sageandyearsofservicecreditequaledatleast70("Ruleof70"),or
• thememberhadat least25yearsofservicecredit.
Members who are grandfathered will have theirbenefitsdeterminedinthefollowingmanner:
• Final Average Salary at retirement will bedetermined by the highest three years(insteadoffiveyears)ofsalary.
• Preservationofcertainretirementreductionfactorsmeansthatmembersage55orolderwith20 to24yearsof credited servicewhotake early retirement will receive a lesserreduction to their annuities than thosememberswhoarenotgrandfathered.
• Partial Lump Sum Option eligibility willrequireeitherage65withatleastfiveyearsof service credit, or a combined age plusyearsofcreditedservicethatequalsat least80("Ruleof80")insteadof90.
HealthBenefits
A. Health Benefits for Active Public SchoolEmployees
TRS-ActiveCare, the statewide health benefitsprogram for eligible full-time and part-timeemployees of participating employers of publicschools, open enrollment charter schools, regionalservicecenters,andothereducationaldistricts,wentinto effect on September 1, 2002. The programinitially focused on smaller districts, whereaffordablehealthcoveragewasoftenhardertofind,andlaterexpandedtoincludelargerschooldistricts.Employees can choose from threeplanoptions andin certain areas, employees alsohave theoptionofenrollinginahealthmaintenanceorganization.
For information on TRS-ActiveCare, please refer totheTRSwebsite.
B.RetireeHealthCoverage
TRSadministersTRS-Care,ahealthbenefitsprogramfor eligible retired public education employees andtheir eligible dependents that was established in1985. TRS-Care is the source of health benefitscoverage which a substantial portion of retiredpubliceducationemployeesrelyupon.DetailsoftheplancanbefoundinNote9.
For information on TRS-Care eligibility, please refertotheTRSwebsite.
C.Long-TermCareInsuranceProgram
Eligibleretireesandeligiblepublicschoolemployees,their eligible dependents, and certain other familymembersmayparticipate in theTRS long-termcareinsurance program. The plan pays benefits if theparticipantbecomesunable toperformat least twoactivitiesofdailylivingwithoutsubstantialassistancefromanotherperson.Theplanalsopaysbenefitsasa result of a severe cognitive impairment thatrequiressupervisionorverbaldirectionfromanotherperson in order to protect the member or othersfromseriousinjury.
SummaryofBenefits
176 TeacherRetirementSystemofTexas2020ComprehensiveAnnualFinancialReport