Embed Size (px)
Citation preview
1Investor Relations 2019
2019 Woongjin Coway Overview
2Investor Relations 2019
Disclaimer
This presentation contains historical information of the company which should not be
regarded as an indication of the future performance or results.
This presentation also contains forward-looking statements that are, by the nature,
subject to significant risks and uncertainties.
These forward-looking statements reflect our current views with respect to future
events and are not a guarantee of future performance or results.
Actual results may differ materially from information contained in the forward-looking
statements as a results of a number of factors beyond our control.
3Investor Relations 2019
Contents
Company Overview
Business Overview
Financial Report
Appendix
4Investor Relations 2019
Company Overview
5Investor Relations 2019
Company Overview
Business Overview
Financial Reports
Appendix
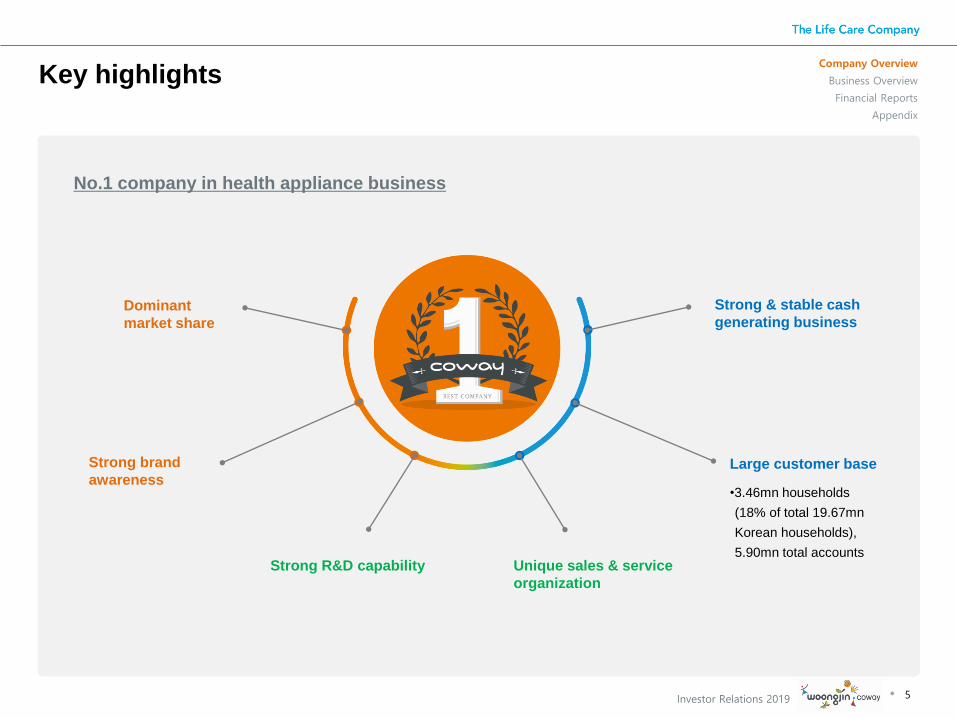
Key highlights
No.1 company in health appliance business
Dominant
market share
Strong brand
awarenessLarge customer base
Strong & stable cash
generating business
Strong R&D capability Unique sales & service
organization
•3.46mn households
(18% of total 19.67mn
Korean households),
5.90mn total accounts
6Investor Relations 2019
Company Overview
Business Overview
Financial Reports
Appendix
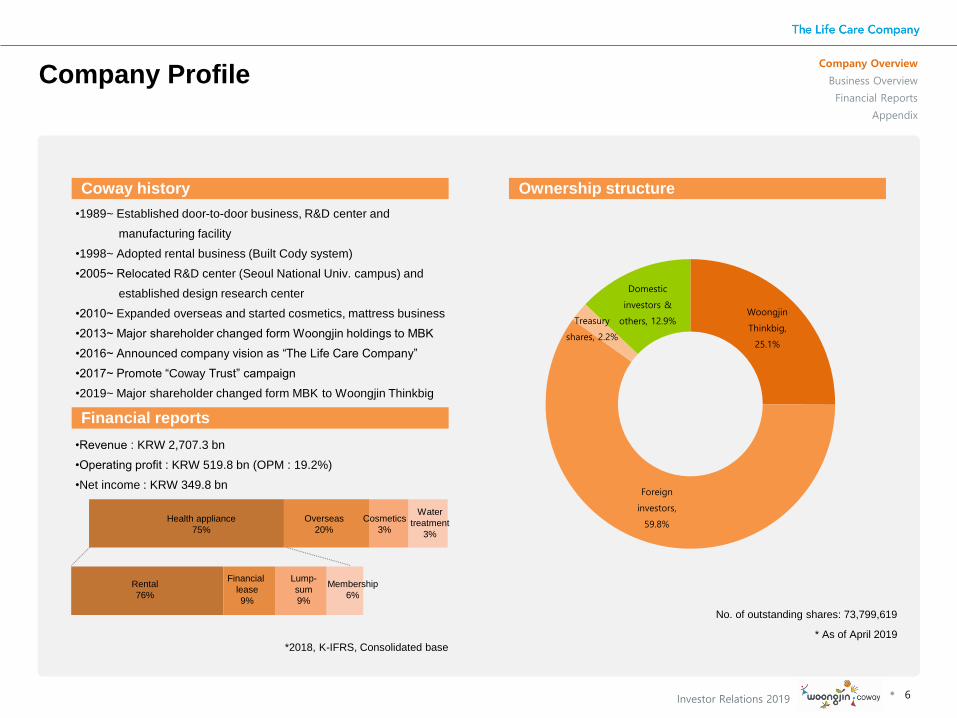
Company Profile
Coway history Ownership structure
•1989~ Established door-to-door business, R&D center and
manufacturing facility
•1998~ Adopted rental business (Built Cody system)
•2005~ Relocated R&D center (Seoul National Univ. campus) and
established design research center
•2010~ Expanded overseas and started cosmetics, mattress business
•2013~ Major shareholder changed form Woongjin holdings to MBK
•2016~ Announced company vision as “The Life Care Company”
•2017~ Promote “Coway Trust” campaign
•2019~ Major shareholder changed form MBK to Woongjin Thinkbig
•Revenue : KRW 2,707.3 bn
•Operating profit : KRW 519.8 bn (OPM : 19.2%)
•Net income : KRW 349.8 bn
*2018, K-IFRS, Consolidated base
Financial reports
No. of outstanding shares: 73,799,619
* As of April 2019
Woongjin
Thinkbig,
25.1%
Foreign
investors,
59.8%
Treasury
shares, 2.2%
Domestic
investors &
others, 12.9%
Cosmetics
3%
Overseas
20%
Health appliance
75%
Rental
76%
Membership
6%
Lump-
sum
9%
Financial
lease
9%
Water
treatment
3%
7Investor Relations 2019
Business Overview
8Investor Relations 2019
Company Overview
Business Overview
Financial Reports
Appendix
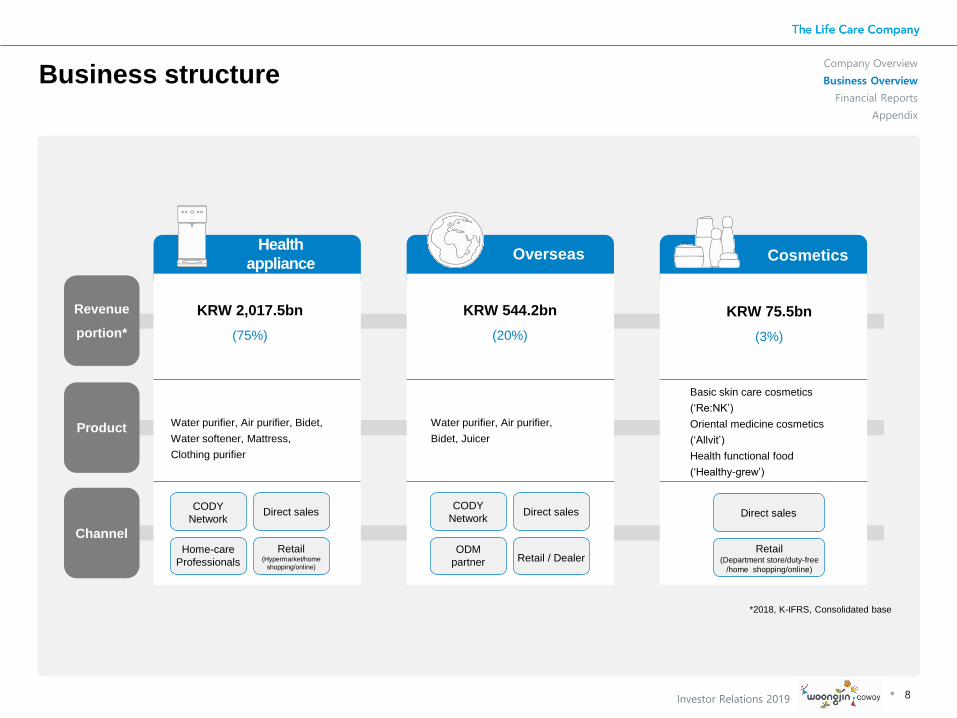
Business structure
Revenue
portion*
Product
Channel
*2018, K-IFRS, Consolidated base
Health
appliance
KRW 2,017.5bn
(75%)
Water purifier, Air purifier, Bidet,
Water softener, Mattress,
Clothing purifier
CODY
NetworkDirect sales
Home-care
Professionals
Retail(Hypermarket/home
shopping/online)
Overseas
KRW 544.2bn
(20%)
Water purifier, Air purifier,
Bidet, Juicer
CODY
NetworkDirect sales
ODM
partner Retail / Dealer
Cosmetics
KRW 75.5bn
(3%)
Basic skin care cosmetics
(‘Re:NK’)
Oriental medicine cosmetics
(‘Allvit’)
Health functional food
(‘Healthy-grew’)
Direct sales
Retail(Department store/duty-free
/home shopping/online)
9Investor Relations 2019
Company Overview
Business Overview
Financial Reports
Appendix
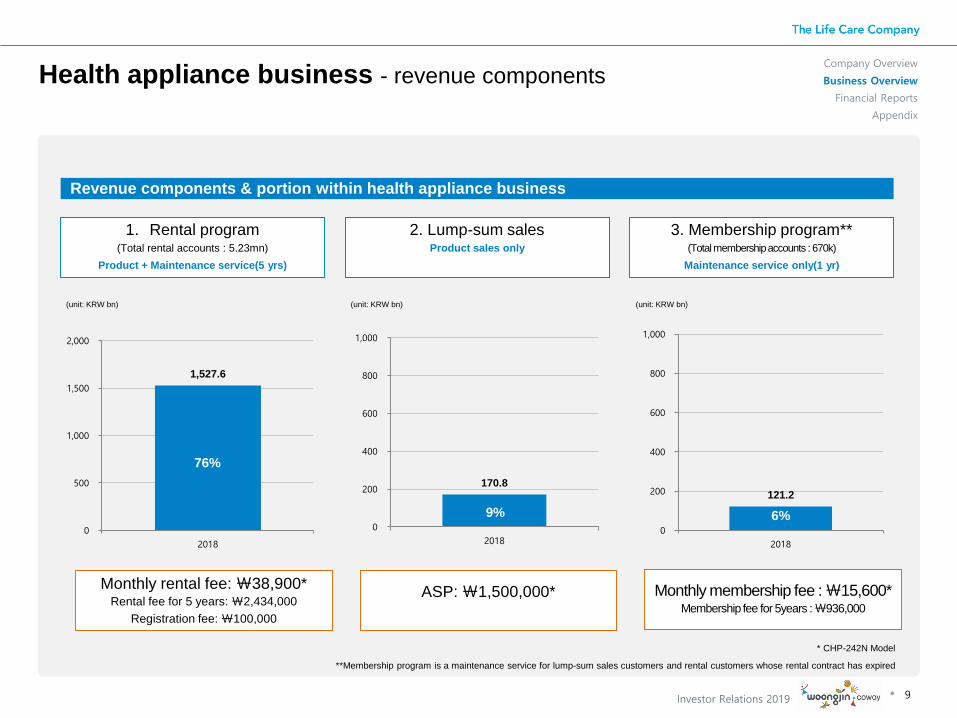
1,527.6
0
500
1,000
1,500
2,000
2018
76%
170.8
0
200
400
600
800
1,000
2018
121.2
0
200
400
600
800
1,000
2018
Health appliance business - revenue components
Revenue components & portion within health appliance business
(unit: KRW bn)
1. Rental program (Total rental accounts : 5.23mn)
Product + Maintenance service(5 yrs)
2. Lump-sum salesProduct sales only
3. Membership program**(Total membership accounts : 670k)
Maintenance service only(1 yr)
Monthly rental fee: ₩38,900*Rental fee for 5 years: ₩2,434,000
Registration fee: ₩100,000
ASP: ₩1,500,000* Monthly membership fee : ₩15,600*Membership fee for 5years : ₩936,000
(unit: KRW bn) (unit: KRW bn)
* CHP-242N Model
**Membership program is a maintenance service for lump-sum sales customers and rental customers whose rental contract has expired
9% 6%
10Investor Relations 2019
Company Overview
Business Overview
Financial Reports
Appendix
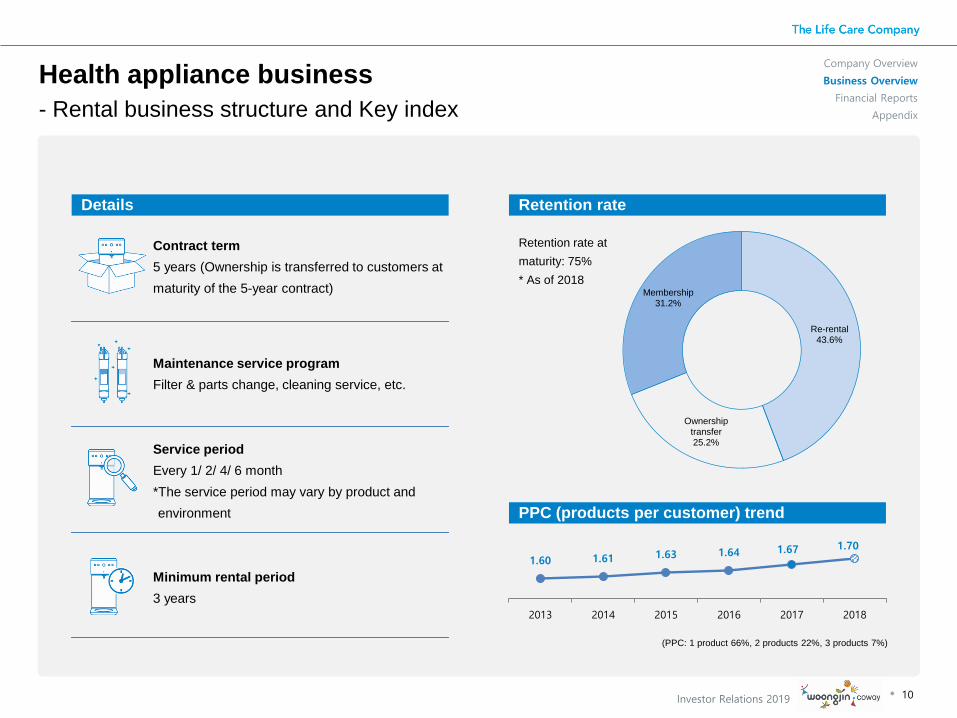
Health appliance business
- Rental business structure and Key index
Details Retention rate
Contract term
5 years (Ownership is transferred to customers at
maturity of the 5-year contract)
Maintenance service program
Filter & parts change, cleaning service, etc.
Service period
Every 1/ 2/ 4/ 6 month
*The service period may vary by product and
environment
Minimum rental period
3 years
Retention rate at
maturity: 75%
* As of 2018
PPC (products per customer) trend
(PPC: 1 product 66%, 2 products 22%, 3 products 7%)
Re-rental 43.6%
Ownership transfer 25.2%
Membership 31.2%
1.60 1.61 1.63 1.64 1.67 1.70
2013 2014 2015 2016 2017 2018
11Investor Relations 2019
Company Overview
Business Overview
Financial Reports
Appendix
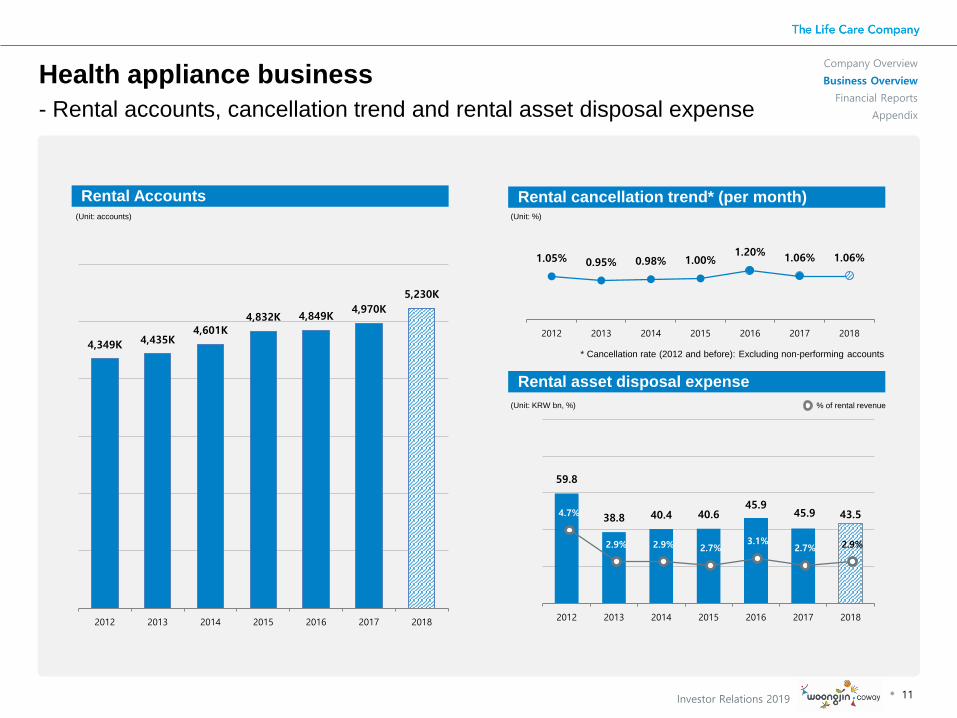
Health appliance business
- Rental accounts, cancellation trend and rental asset disposal expense
Rental Accounts Rental cancellation trend* (per month)
Rental asset disposal expense
% of rental revenue(Unit: KRW bn, %)
* Cancellation rate (2012 and before): Excluding non-performing accounts
(Unit: %)(Unit: accounts)
4,349K 4,435K4,601K
4,832K 4,849K4,970K
5,230K
2012 2013 2014 2015 2016 2017 2018
1.05% 0.95% 0.98% 1.00%1.20%
1.06% 1.06%
2012 2013 2014 2015 2016 2017 2018
59.8
38.8 40.4 40.6 45.9
45.9 43.5
2012 2013 2014 2015 2016 2017 2018
4.7%
2.9% 2.9% 2.7%3.1%
2.7% 2.9%
12Investor Relations 2019
Company Overview
Business Overview
Financial Reports
Appendix
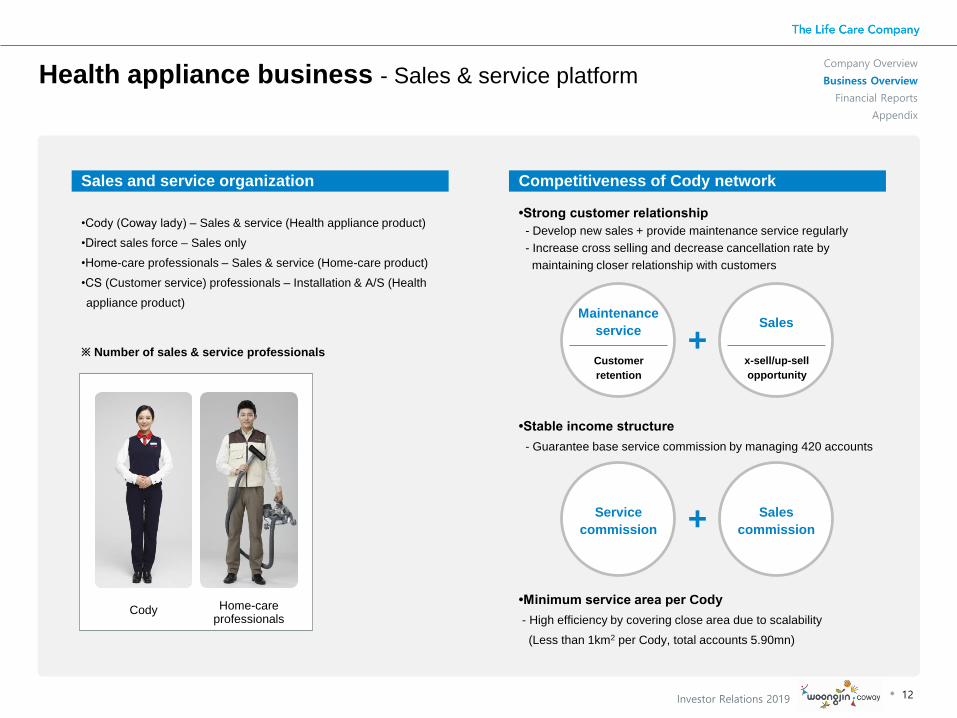
Health appliance business - Sales & service platform
Sales and service organization Competitiveness of Cody network
•Cody (Coway lady) – Sales & service (Health appliance product)
•Direct sales force – Sales only
•Home-care professionals – Sales & service (Home-care product)
•CS (Customer service) professionals – Installation & A/S (Health
appliance product)
Cody
※ Number of sales & service professionals
Home-care professionals
•Strong customer relationship
- Develop new sales + provide maintenance service regularly
- Increase cross selling and decrease cancellation rate by
maintaining closer relationship with customers
Maintenance
service
Customer
retention
Sales
x-sell/up-sell
opportunity
+
•Stable income structure
- Guarantee base service commission by managing 420 accounts
Service
commission
Sales
commission+
•Minimum service area per Cody
- High efficiency by covering close area due to scalability
(Less than 1km2 per Cody, total accounts 5.90mn)
13Investor Relations 2019
Company Overview
Business Overview
Financial Reports
Appendix
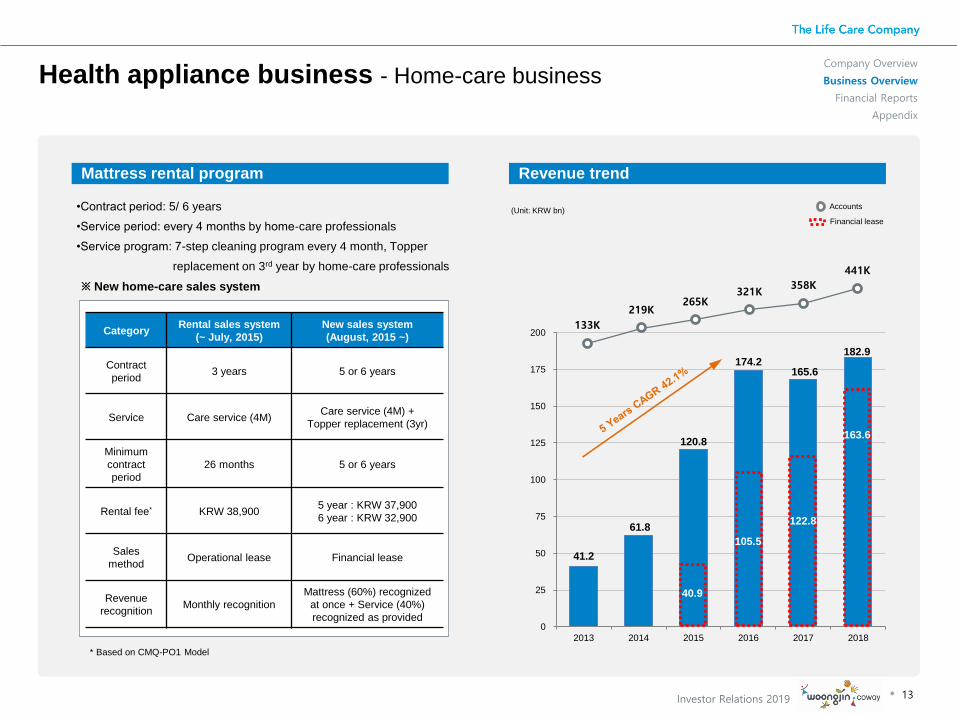
Health appliance business - Home-care business
Mattress rental program Revenue trend
•Contract period: 5/ 6 years
•Service period: every 4 months by home-care professionals
•Service program: 7-step cleaning program every 4 month, Topper
replacement on 3rd year by home-care professionals
※ New home-care sales system
Accounts(Unit: KRW bn)
Financial lease
CategoryRental sales system
(~ July, 2015)
New sales system
(August, 2015 ~)
Contract
period3 years 5 or 6 years
Service Care service (4M)Care service (4M) +
Topper replacement (3yr)
Minimum
contract
period
26 months 5 or 6 years
Rental fee* KRW 38,9005 year : KRW 37,900
6 year : KRW 32,900
Sales
methodOperational lease Financial lease
Revenue
recognitionMonthly recognition
Mattress (60%) recognized
at once + Service (40%)
recognized as provided
* Based on CMQ-PO1 Model
105.5
41.2
61.8
120.8
174.2 165.6
182.9
0
25
50
75
100
125
150
175
200
2013 2014 2015 2016 2017 2018
163.6
122.8
105.5
40.9
133K
219K265K
321K358K
441K
14Investor Relations 2019
Company Overview
Business Overview
Financial Reports
Appendix
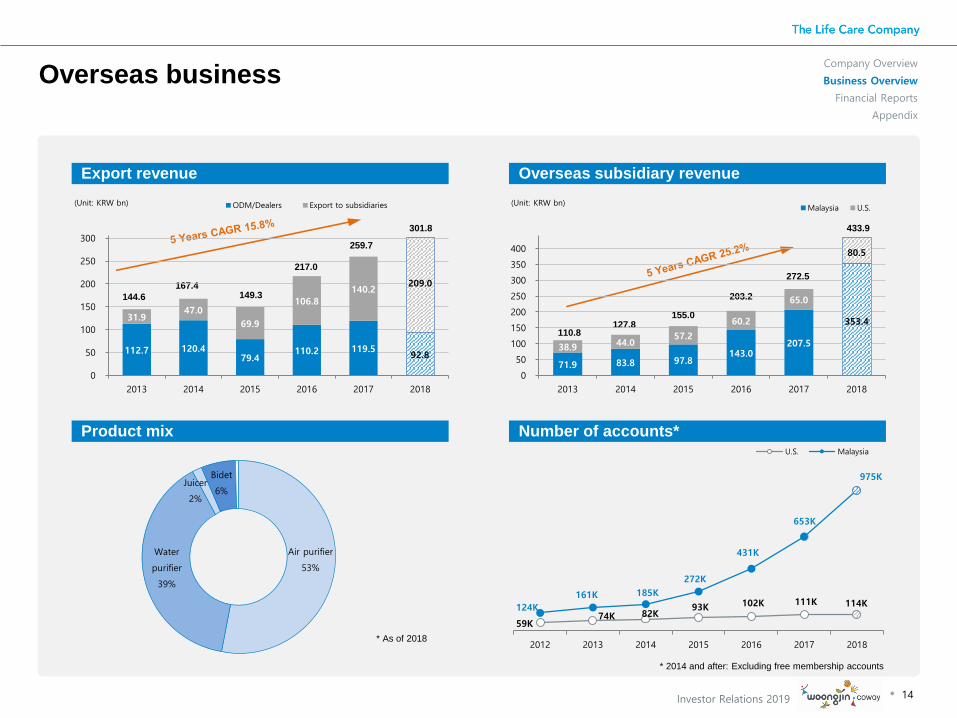
Overseas business
Export revenue Overseas subsidiary revenue
* As of 2018
Product mix Number of accounts*
* 2014 and after: Excluding free membership accounts
(Unit: KRW bn)(Unit: KRW bn)
110.8127.8
155.0
144.6
167.4149.3
217.0
203.2
112.7 120.4 79.4
110.2 119.5 92.8
31.9 47.0
69.9
106.8
140.2 209.0
0
50
100
150
200
250
300
2013 2014 2015 2016 2017 2018
ODM/Dealers Export to subsidiaries
259.7
301.8
71.9 83.8 97.8 143.0
207.5
353.4
38.9 44.0 57.2
60.2
65.0
80.5
0
50
100
150
200
250
300
350
400
2013 2014 2015 2016 2017 2018
Malaysia U.S.
272.5
433.9
59K74K 82K
93K 102K 111K 114K124K
161K 185K
272K
431K
653K
975K
2012 2013 2014 2015 2016 2017 2018
U.S. Malaysia
Air purifier
53%
Water
purifier
39%
Juicer
2%
Bidet
6%
15Investor Relations 2019
Company Overview
Business Overview
Financial Reports
Appendix
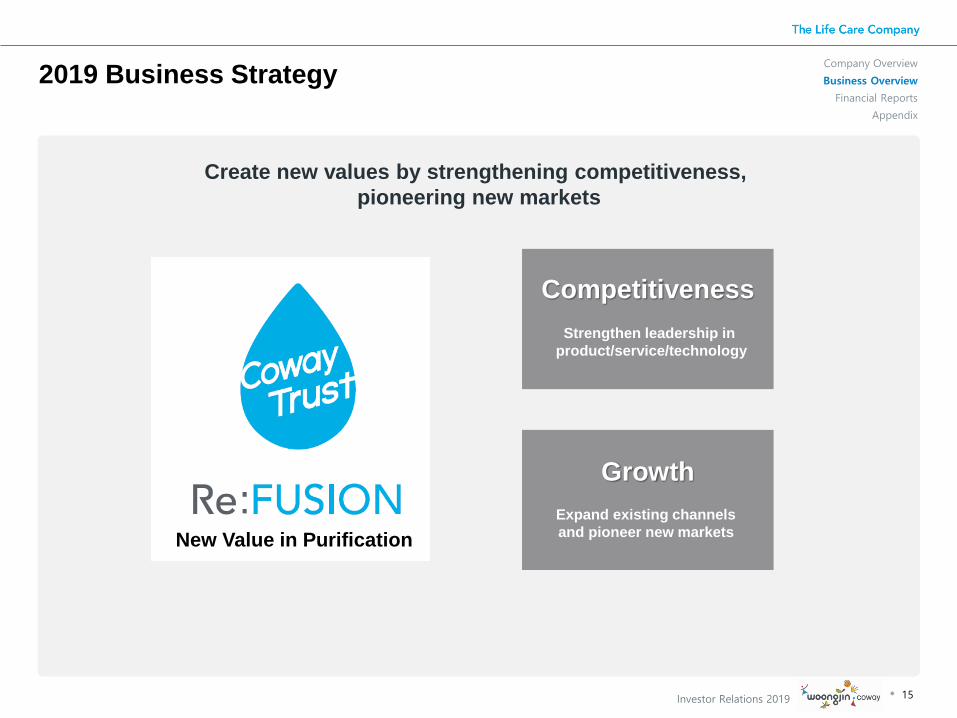
2019 Business Strategy
Create new values by strengthening competitiveness,
pioneering new markets
Competitiveness
Strengthen leadership in
product/service/technology
Growth
Expand existing channels
and pioneer new marketsNew Value in Purification
16Investor Relations 2019
Company Overview
Business Overview
Financial Reports
Appendix
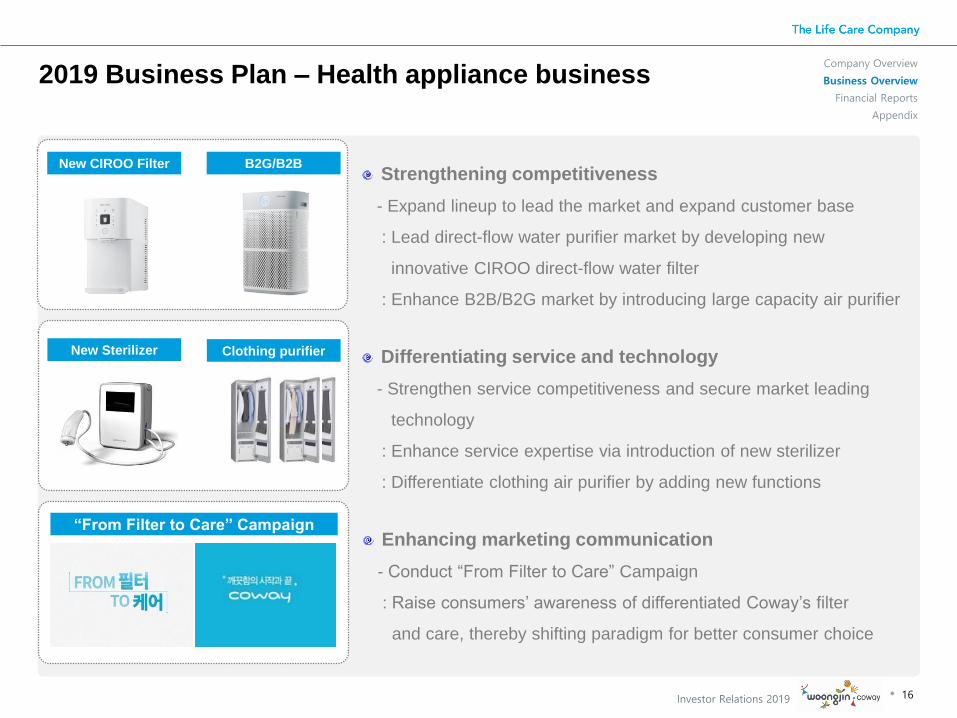
2019 Business Plan – Health appliance business
Differentiating service and technology
- Strengthen service competitiveness and secure market leading
technology
: Enhance service expertise via introduction of new sterilizer
: Differentiate clothing air purifier by adding new functions
Strengthening competitiveness
- Expand lineup to lead the market and expand customer base
: Lead direct-flow water purifier market by developing new
innovative CIROO direct-flow water filter
: Enhance B2B/B2G market by introducing large capacity air purifier
Enhancing marketing communication
- Conduct “From Filter to Care” Campaign
: Raise consumers’ awareness of differentiated Coway’s filter
and care, thereby shifting paradigm for better consumer choice
New CIROO Filter B2G/B2B
New Sterilizer Clothing purifier
“From Filter to Care” Campaign
17Investor Relations 2019
Company Overview
Business Overview
Financial Reports
Appendix
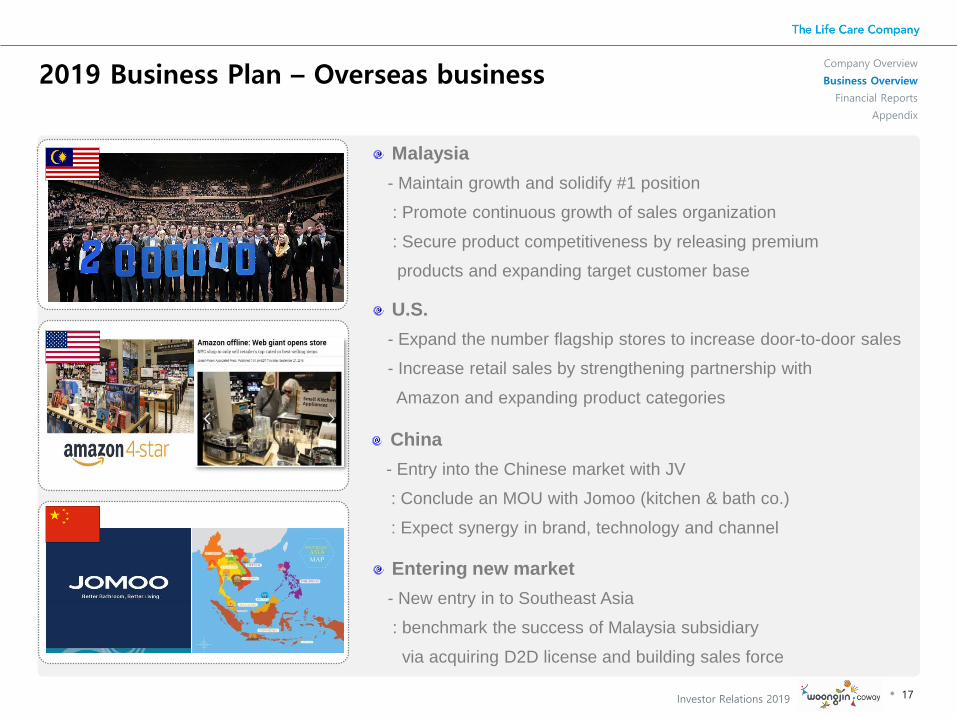
2019 Business Plan – Overseas business
Malaysia
- Maintain growth and solidify #1 position
: Promote continuous growth of sales organization
: Secure product competitiveness by releasing premium
products and expanding target customer base
U.S.
- Expand the number flagship stores to increase door-to-door sales
- Increase retail sales by strengthening partnership with
Amazon and expanding product categories
China
- Entry into the Chinese market with JV
: Conclude an MOU with Jomoo (kitchen & bath co.)
: Expect synergy in brand, technology and channel
Entering new market
- New entry in to Southeast Asia
: benchmark the success of Malaysia subsidiary
via acquiring D2D license and building sales force
18Investor Relations 2019
Company Overview
Business Overview
Financial Reports
Appendix
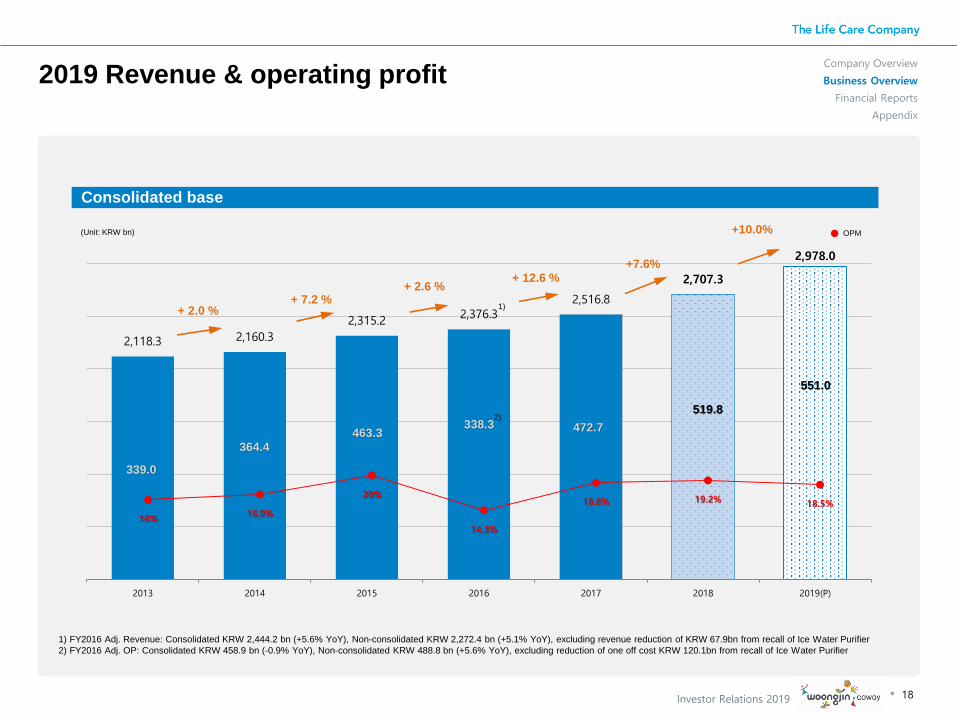
2019 Revenue & operating profit
Consolidated base
2,118.3 2,160.3
2,315.2 2,376.3
2,516.8
2,707.3
2,978.0
2013 2014 2015 2016 2017 2018 2019(P)
551.0
519.8
(Unit: KRW bn) OPM
+ 2.0 %+ 7.2 %
+ 2.6 %+ 12.6 %
16%16.9%
20%
14.3%
18.8% 19.2% 18.5%
364.4
463.3338.3
339.0
472.7
+7.6%
1)
2)
1) FY2016 Adj. Revenue: Consolidated KRW 2,444.2 bn (+5.6% YoY), Non-consolidated KRW 2,272.4 bn (+5.1% YoY), excluding revenue reduction of KRW 67.9bn from recall of Ice Water Purifier
2) FY2016 Adj. OP: Consolidated KRW 458.9 bn (-0.9% YoY), Non-consolidated KRW 488.8 bn (+5.6% YoY), excluding reduction of one off cost KRW 120.1bn from recall of Ice Water Purifier
+10.0%
19Investor Relations 2019
Financial Report
20Investor Relations 2019
Company Overview
Business Overview
Financial Reports
Appendix
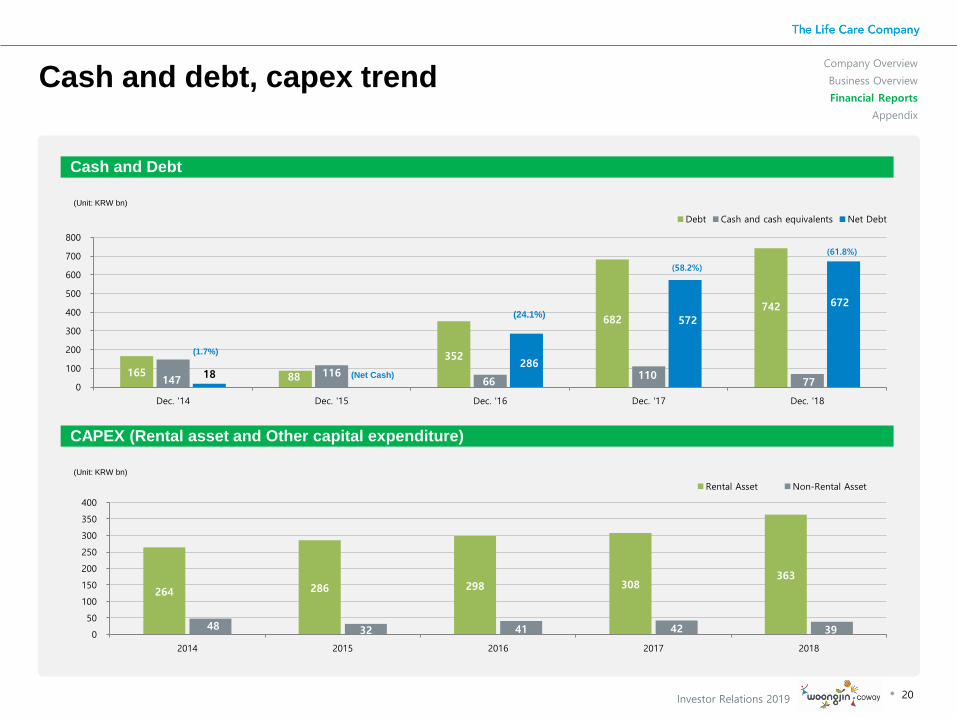
Cash and debt, capex trend
Cash and Debt
CAPEX (Rental asset and Other capital expenditure)
80165 88
352
682 742
147 116
66 110
7718
286
572
672
0
100
200
300
400
500
600
700
800
Dec. '14 Dec. '15 Dec. '16 Dec. '17 Dec. '18
Debt Cash and cash equivalents Net Debt
(58.2%)
(61.8%)
(Unit: KRW bn)
(1.7%)
(24.1%)
(Net Cash)
264 286 298 308 363
48 32 41 42 39 0
50
100
150
200
250
300
350
400
2014 2015 2016 2017 2018
Rental Asset Non-Rental Asset
(Unit: KRW bn)
21Investor Relations 2019
Company Overview
Business Overview
Financial Reports
Appendix
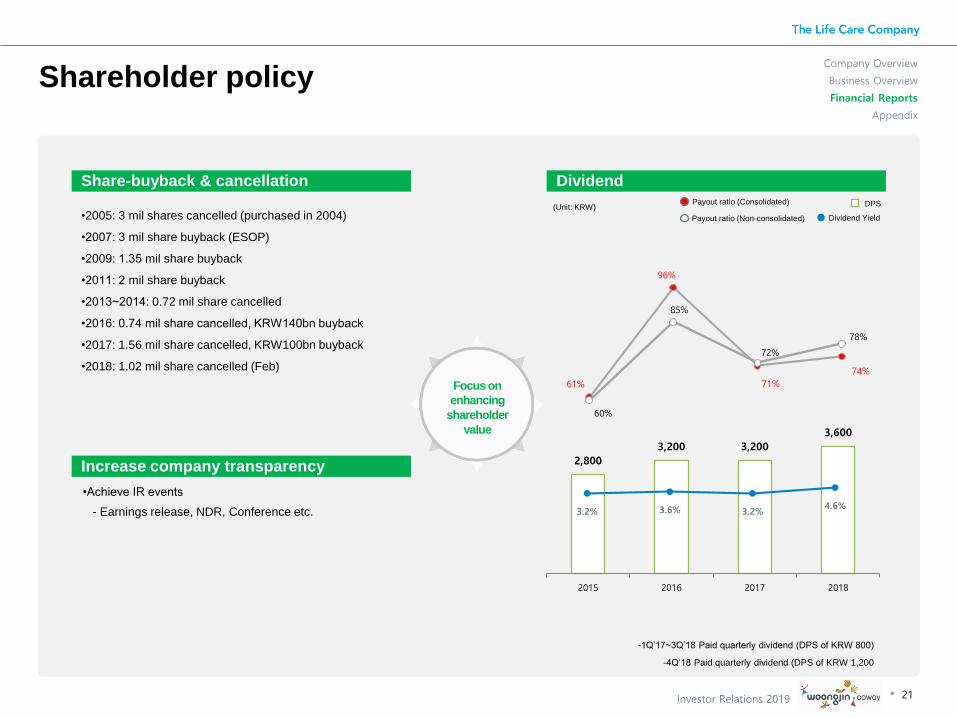
Shareholder policy
Share-buyback & cancellation Dividend
Increase company transparency
•2005: 3 mil shares cancelled (purchased in 2004)
•2007: 3 mil share buyback (ESOP)
•2009: 1.35 mil share buyback
•2011: 2 mil share buyback
•2013~2014: 0.72 mil share cancelled
•2016: 0.74 mil share cancelled, KRW140bn buyback
•2017: 1.56 mil share cancelled, KRW100bn buyback
•2018: 1.02 mil share cancelled (Feb)
•Achieve IR events
- Earnings release, NDR, Conference etc.
Focus on
enhancing
shareholder
value
(Unit: KRW)
Dividend Yield
DPS
Payout ratio (Non-consolidated)
Payout ratio (Consolidated)
-1Q’17~3Q’18 Paid quarterly dividend (DPS of KRW 800)
-4Q’18 Paid quarterly dividend (DPS of KRW 1,200
2,800
3,200 3,200
3,600
2015 2016 2017 2018
3.2% 3.6% 3.2%4.6%
61%
96%
71%
74%
60%
85%
72%
78%
22Investor Relations 2019
Appendix
23Investor Relations 2019
Company Overview
Business Overview
Financial Reports
Appendix
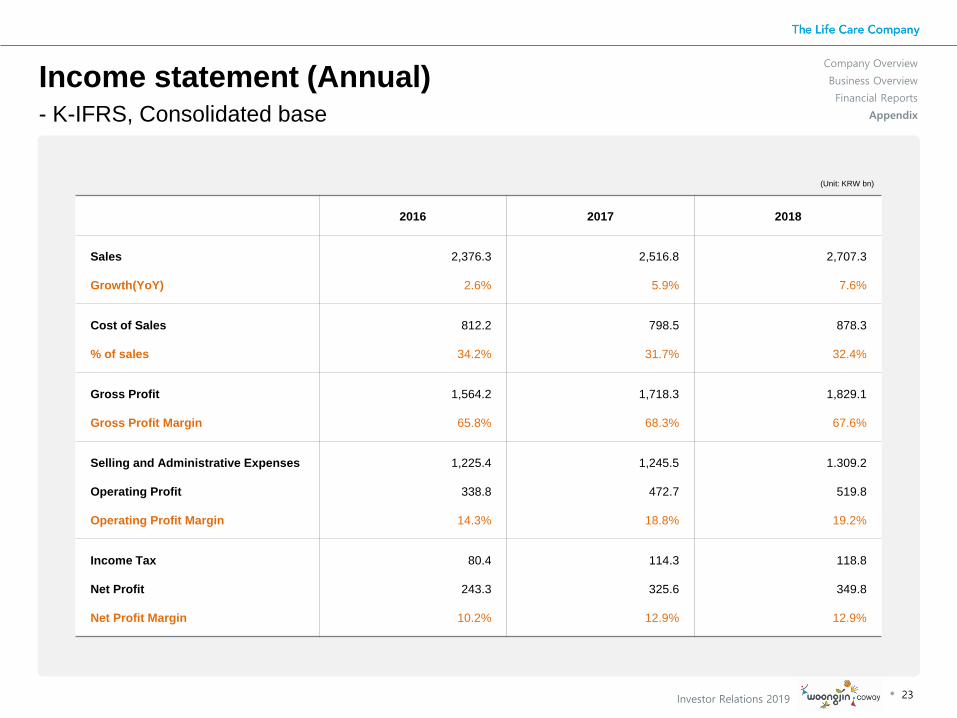
2016 2017 2018
Sales
Growth(YoY)
2,376.3
2.6%
2,516.8
5.9%
2,707.3
7.6%
Cost of Sales
% of sales
812.2
34.2%
798.5
31.7%
878.3
32.4%
Gross Profit
Gross Profit Margin
1,564.2
65.8%
1,718.3
68.3%
1,829.1
67.6%
Selling and Administrative Expenses
Operating Profit
Operating Profit Margin
1,225.4
338.8
14.3%
1,245.5
472.7
18.8%
1.309.2
519.8
19.2%
Income Tax
Net Profit
Net Profit Margin
80.4
243.3
10.2%
114.3
325.6
12.9%
118.8
349.8
12.9%
Income statement (Annual)- K-IFRS, Consolidated base
(Unit: KRW bn)
24Investor Relations 2019
Company Overview
Business Overview
Financial Reports
Appendix
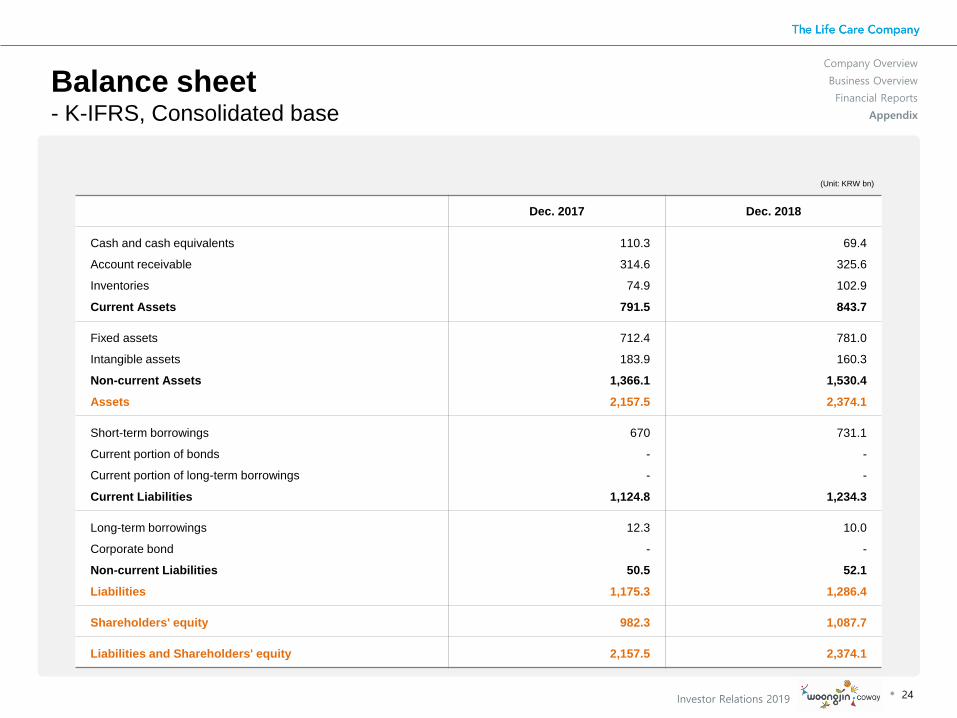
Dec. 2017 Dec. 2018
Cash and cash equivalents
Account receivable
Inventories
Current Assets
110.3
314.6
74.9
791.5
69.4
325.6
102.9
843.7
Fixed assets
Intangible assets
Non-current Assets
Assets
712.4
183.9
1,366.1
2,157.5
781.0
160.3
1,530.4
2,374.1
Short-term borrowings
Current portion of bonds
Current portion of long-term borrowings
Current Liabilities
670
-
-
1,124.8
731.1
-
-
1,234.3
Long-term borrowings
Corporate bond
Non-current Liabilities
Liabilities
12.3
-
50.5
1,175.3
10.0
-
52.1
1,286.4
Shareholders' equity 982.3 1,087.7
Liabilities and Shareholders' equity 2,157.5 2,374.1
(Unit: KRW bn)
Balance sheet- K-IFRS, Consolidated base
25Investor Relations 2019
이종목의더많은 IR정보 확인하기
주주와 기업을 연결하고 응원합니다.