Embed Size (px)
Citation preview

2018-19 School Accountability Report Card for Stanislaus County Office-Special Education Page 1 of 14
Stanislaus County Office-Special Education
School Accountability Report Card
Reported Using Data from the 2018-19 School Year
Published During 2019-20
By February 1 of each year, every school in California is required by state law to publish a School Accountability Report Card (SARC). The SARC contains information about the condition and performance of each California public school. Under the Local Control Funding Formula (LCFF) all local educational agencies (LEAs) are required to prepare a Local Control and Accountability Plan (LCAP), which describes how they intend to meet annual school-specific goals for all pupils, with specific activities to address state and local priorities. Additionally, data reported in an LCAP is to be consistent with data reported in the SARC. • For more information about SARC requirements, see the California Department of Education (CDE) SARC web page at
https://www.cde.ca.gov/ta/ac/sa/. • For more information about the LCFF or LCAP, see the CDE LCFF web page at https://www.cde.ca.gov/fg/aa/lc/. • For additional information about the school, parents/guardians and community members should contact the school
principal or the district office. DataQuest DataQuest is an online data tool located on the CDE DataQuest web page at https://dq.cde.ca.gov/dataquest/ that contains additional information about this school and comparisons of the school to the district and the county. Specifically, DataQuest is a dynamic system that provides reports for accountability (e.g., test data, enrollment, high school graduates, dropouts, course enrollments, staffing, and data regarding English learners). Internet Access Internet access is available at public libraries and other locations that are publicly accessible (e.g., the California State Library). Access to the Internet at libraries and public locations is generally provided on a first-come, first-served basis. Other use restrictions may include the hours of operation, the length of time that a workstation may be used (depending on availability), the types of software programs available on a workstation, and the ability to print documents. About This School School Contact Information (School Year 2019-20)
Entity Contact Information
School Name Stanislaus County Office-Special Education
Street 1336 Stonum Rd
City, State, Zip Modesto, CA 95351
Phone Number (209) 541-2200
Principal Sarah Grantano
Email Address [email protected]
County-District-School (CDS) Code 50-10504-6069546

2018-19 School Accountability Report Card for Stanislaus County Office-Special Education Page 2 of 14
Entity Contact Information
District Name Stanislaus County Office of Education
Phone Number (209) 238-1900
Superintendent Scott Kuykendall
Email Address [email protected]
Website www.stancoe.org School Description and Mission Statement (School Year 2019-20)
Stanislaus County Office of Education’s (SCOE) Special Education programs serve students from birth to 22 years of age in severe and non-severe programs throughout the county in the following disability categories: intellectual disabilities, speech or language impairment, visual impairment, emotional disturbance, orthopedic impairment, other health impairment, specific learning disability, deafness, hard of hearing, deaf-blindness, multiple disabilities, autism, and traumatic brain injury. The Early Start program (birth to age 3) serves 83 students in their natural environment; playgroups located within their community, in the home, and at the special education center. SCOE has 2 special education centers (1 serving Early Intervention students (ages 3-5), 1 serving severely handicapped behavioral and medically fragile students (ages 5-22) and 28 classrooms located on public integrated school sites. All of our employees strive to provide rich and caring educational experiences in the least restrictive setting possible. SCOE’s Special Education department has over 500 employees providing services in homes and on 35 school and community sites throughout the county to approximately 1400 students, in addition to providing services for students in their home school district. Services provided include special day classes, speech and language therapy, occupational and physical therapy, adaptive PE, nursing and audiological services, services to the visually impaired, deaf and hard of hearing, orientation mobility, vocational training, inclusion, assistive technology, resource, counseling and assessments. Mission Statement: Through the caring and commitment of public education and effective leadership and instruction, we empower students and parents by supporting independence, providing opportunities through implementation of best practices, and establishing partnerships for life-long learning. Vision Statement: Our impact on individuals with disabilities and their families will provide independence, opportunity and hope for the future.

2018-19 School Accountability Report Card for Stanislaus County Office-Special Education Page 3 of 14
Student Enrollment by Grade Level (School Year 2018-19) Grade Level Number of Students
Kindergarten 39
Grade 1 30
Grade 2 35
Grade 3 33
Grade 4 38
Grade 5 24
Grade 6 24
Grade 7 36
Grade 8 26
Grade 9 9
Grade 10 17
Grade 11 15
Grade 12 38
Total Enrollment 364 Student Enrollment by Group (School Year 2018-19)
Student Group Percent of Total Enrollment
Black or African American 5.5
American Indian or Alaska Native 1.1
Asian 3
Filipino 0.5
Hispanic or Latino 50
Native Hawaiian or Pacific Islander 0.5
White 35.4
Two or More Races 2.5
Socioeconomically Disadvantaged 69.8
English Learners 19
Students with Disabilities 99.7
Foster Youth 1.1
Homeless 0.5 A. Conditions of Learning State Priority: Basic The SARC provides the following information relevant to the State priority: Basic (Priority 1): • Degree to which teachers are appropriately assigned and fully credentialed in the subject area and for the pupils they
are teaching; • Pupils have access to standards-aligned instructional materials; and • School facilities are maintained in good repair

2018-19 School Accountability Report Card for Stanislaus County Office-Special Education Page 4 of 14
Teacher Credentials
Teachers School 2017-18
School 2018-19
School 2019-20
District 2019-20
With Full Credential 68.4 67.8 66.2
Without Full Credential 12 19 22.0
Teaching Outside Subject Area of Competence (with full credential) 0 0 0 Teacher Misassignments and Vacant Teacher Positions
Indicator 2017-18 2018-19 2019-20
Misassignments of Teachers of English Learners 0 0 0
Total Teacher Misassignments* 0 0 0
Vacant Teacher Positions 2 3 3 Note: “Misassignments” refers to the number of positions filled by teachers who lack legal authorization to teach that grade level, subject area, student group, etc. *Total Teacher Misassignments includes the number of Misassignments of Teachers of English Learners. Quality, Currency, Availability of Textbooks and Instructional Materials (School Year 2019-20) Year and month in which data were collected: 1-22-19 All students in our programs have goals written into their IEP's (Individual Education Plan) that align to the state standards. Each integrated classroom's curriculum aligns to the school district adopted materials of that school campus. Each classroom's instruction is designed on the results of formative and summative assessment and is implemented in alignment with standards based curriculum. Each classroom has the core curriculum of that school site for easy integration and inclusion opportunities. In addition to the standards-based materials adopted by the State Board of Education and the local governing board of our special day class sites that are integrated on to general education campuses across the county, the following is a list of supplemental materials and academic intervention programs used in the classrooms, adopted by the local governing board that are also in alignment with content standards and are core content connectors. There were zero percent of students who lacked their own assigned textbooks and/or instructional materials. Super Skills Social Language Program Room 14 Social Language Program Social Thinking Series- Michelle Garcia Winner Jedi Baker Social Skills Training Skills for School Success- Anita Archer Word Knowledge- Gene Tucker Social Mapping- Michelle Garcia Winner R.A.N. - Elizabeth Haughten Phonemic Awareness- Elizabeth Haughten Math Foundations- Elizabeth Haughten Skill Builders- Math and Language Arts Morphographic Spelling- Bob Dixon Handwriting Without Tears- Haughten News to You- Scripted Current Events Curriculum Unique Learning System Second Step Social Emotional Curriculum Pearson- Life Science, Physical Science, Earth Science Holt- US History, Ancient Civilizations, Early Modern Times NatGeo- National Geographic Harcourt- Social Studies

2018-19 School Accountability Report Card for Stanislaus County Office-Special Education Page 5 of 14
Subject Textbooks and Other Instructional Materials/year of Adoption
From Most Recent
Adoption?
Percent Students Lacking Own
Assigned Copy Reading/Language Arts Edmark Reading Program 1 & 2 Reading
Intervention K-12 Handwriting without Tears Writing Intervention K-6 Phonics Library, Houghton Mifflin Reading K-2 Horizons 3.2, Harcourt Brace/Houghton 3 Language for Learning, McGraw Hill Language for Thinking, McGraw Hill Language for Writing, McGraw Hill Reasoning and Writing, McGraw Hill Expressive Writing, McGraw Hill Rewards Reading Program Reading Mastery, McGraw Hill Spelling Mastery, McGraw Hill Read 180, Houghton Mifflin-Harcourt
Yes
Mathematics Touch Math ILC K - 2 Saxon Math 2-4, Houghton Mifflin-Harcourt Connecting Math Concepts, McGraw-Hill Engage New York Morningside Math Program Numberworld's, McGraw-Hill
Yes
School Facility Conditions and Planned Improvements (Most Recent Year)
Margaret L. Annear
2018-19 School Accountability Report Card for Stanislaus County Office-Special Education Page 6 of 14
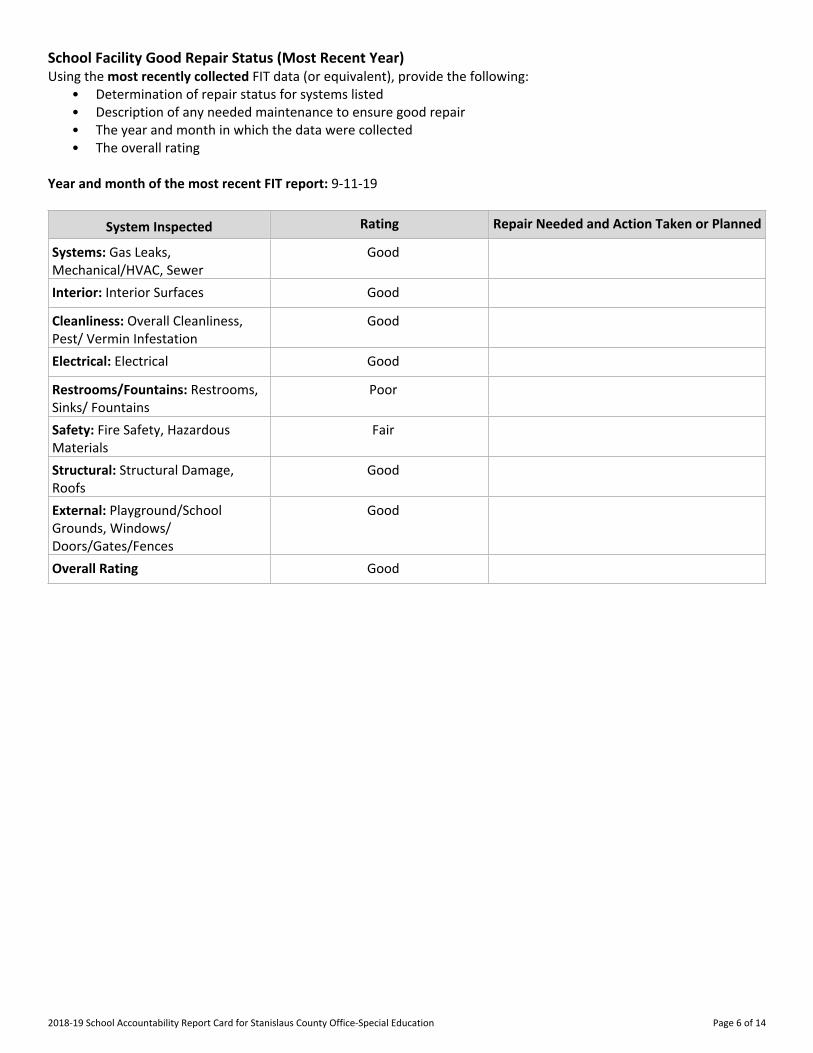
School Facility Good Repair Status (Most Recent Year) Using the most recently collected FIT data (or equivalent), provide the following:
• Determination of repair status for systems listed • Description of any needed maintenance to ensure good repair • The year and month in which the data were collected • The overall rating
Year and month of the most recent FIT report: 9-11-19
System Inspected Rating Repair Needed and Action Taken or Planned
Systems: Gas Leaks, Mechanical/HVAC, Sewer
XGood
Interior: Interior Surfaces XGood
Cleanliness: Overall Cleanliness, Pest/ Vermin Infestation
XGood
Electrical: Electrical XGood
Restrooms/Fountains: Restrooms, Sinks/ Fountains
XPoor
Safety: Fire Safety, Hazardous Materials
XFair
Structural: Structural Damage, Roofs
XGood
External: Playground/School Grounds, Windows/ Doors/Gates/Fences
XGood
Overall Rating XGood

2018-19 School Accountability Report Card for Stanislaus County Office-Special Education Page 7 of 14
B. Pupil Outcomes State Priority: Pupil Achievement The SARC provides the following information relevant to the State priority: Pupil Achievement (Priority 4): • Statewide assessments (i.e., California Assessment of Student Performance and Progress [CAASPP] System, which
includes the Smarter Balanced Summative Assessments for students in the general education population and the California Alternate Assessments [CAAs] for English language arts/literacy [ELA] and mathematics given in grades three through eight and grade eleven. Only eligible students may participate in the administration of the CAAs. CAAs items are aligned with alternate achievement standards, which are linked with the Common Core State Standards [CCSS] for students with the most significant cognitive disabilities); and
• The percentage of students who have successfully completed courses that satisfy the requirements for entrance to the University of California and the California State University, or career technical education sequences or programs of study.
CAASPP Test Results in ELA and Mathematics for All Students Grades Three through Eight and Grade Eleven Percentage of Students Meeting or Exceeding the State Standard
Subject School 2017-18
School 2018-19
District 2017-18
District 2018-19
State 2017-18
State 2018-19
English Language Arts/Literacy (grades 3-8 and 11) 11 11 34 37 50 50
Mathematics (grades 3-8 and 11) 4 6 24 28 38 39
Note: Percentages are not calculated when the number of students tested is ten or less, either because the number of students in this category is too small for statistical accuracy or to protect student privacy. Note: ELA and mathematics test results include the Smarter Balanced Summative Assessment and the CAA. The “Percent Met or Exceeded” is calculated by taking the total number of students who met or exceeded the standard on the Smarter Balanced Summative Assessment plus the total number of students who met the standard (i.e., achieved Level 3-Alternate) on the CAAs divided by the total number of students who participated in both assessments. CAASPP Test Results in ELA by Student Group Grades Three through Eight and Grade Eleven (School Year 2018-19)
Student Group Total Enrollment
Number Tested
Percent Tested
Percent Not
Tested
Percent Met or
Exceeded All Students 94 80 85.11 14.89 11.39
Male 71 58 81.69 18.31 10.53
Female 23 22 95.65 4.35 13.64
Black or African American -- -- -- -- --
American Indian or Alaska Native
Asian -- -- -- -- --
Filipino
Hispanic or Latino 47 40 85.11 14.89 10.00
Native Hawaiian or Pacific Islander
White 36 29 80.56 19.44 10.71

2018-19 School Accountability Report Card for Stanislaus County Office-Special Education Page 8 of 14
Student Group Total Enrollment
Number Tested
Percent Tested
Percent Not
Tested
Percent Met or
Exceeded Two or More Races -- -- -- -- --
Socioeconomically Disadvantaged 71 59 83.10 16.90 10.34
English Learners 15 12 80.00 20.00 0.00
Students with Disabilities 94 80 85.11 14.89 11.39
Students Receiving Migrant Education Services
Foster Youth -- -- -- -- --
Homeless
Note: ELA test results include the Smarter Balanced Summative Assessment and the CAA. The “Percent Met or Exceeded” is calculated by taking the total number of students who met or exceeded the standard on the Smarter Balanced Summative Assessment plus the total number of students who met the standard (i.e., achieved Level 3-Alternate) on the CAAs divided by the total number of students who participated in both assessments. Note: Double dashes (--) appear in the table when the number of students is ten or less, either because the number of students in this category is too small for statistical accuracy or to protect student privacy. Note: The number of students tested includes all students who participated in the test whether they received a score or not; however, the number of students tested is not the number that was used to calculate the achievement level percentages. The achievement level percentages are calculated using only students who received scores. CAASPP Test Results in Mathematics by Student Group Grades Three through Eight and Grade Eleven (School Year 2018-19)
Student Group Total Enrollment
Number Tested
Percent Tested
Percent Not
Tested
Percent Met or
Exceeded All Students 94 71 75.53 24.47 5.71
Male 71 54 76.06 23.94 5.56
Female 23 17 73.91 26.09 6.25
Black or African American -- -- -- -- --
American Indian or Alaska Native
Asian -- -- -- -- --
Filipino
Hispanic or Latino 47 33 70.21 29.79 6.06
Native Hawaiian or Pacific Islander
White 36 27 75.00 25.00 3.85
Two or More Races -- -- -- -- --
Socioeconomically Disadvantaged 71 52 73.24 26.76 5.88
English Learners 15 10 66.67 33.33 0.00
Students with Disabilities 94 71 75.53 24.47 5.71
Students Receiving Migrant Education Services

2018-19 School Accountability Report Card for Stanislaus County Office-Special Education Page 9 of 14
Student Group Total Enrollment
Number Tested
Percent Tested
Percent Not
Tested
Percent Met or
Exceeded Foster Youth -- -- -- -- --
Homeless Note: Mathematics test results include the Smarter Balanced Summative Assessment and the CAA. The “Percent Met or Exceeded” is calculated by taking the total number of students who met or exceeded the standard on the Smarter Balanced Summative Assessment plus the total number of students who met the standard (i.e., achieved Level 3-Alternate) on the CAAs divided by the total number of students who participated in both assessments. Note: Double dashes (--) appear in the table when the number of students is ten or less, either because the number of students in this category is too small for statistical accuracy or to protect student privacy. Note: The number of students tested includes all students who participated in the test whether they received a score or not; however, the number of students tested is not the number that was used to calculate the achievement level percentages. The achievement level percentages are calculated using only students who received scores.
CAASPP Test Results in Science for All Students Grades Five, Eight, and Ten Percentage of Students Meeting or Exceeding the State Standard
Subject School 2017-18
School 2018-19
District 2017-18
District 2018-19
State 2017-18
State 2018-19
Science (grades 5, 8 and high school) N/A N/A N/A N/A N/A N/A Note: Cells with N/A values do not require data. Note: This is a placeholder for the California Science Test (CAST) which was administered operationally during the 2018-19 school year. However, these data are not available for inclusion in the 2018-19 SARC posting due February 1, 2020. These data will be included in the 2019-20 SARC posting due February 1, 2021. Career Technical Education Programs (School Year 2018-19)
Career Technical Education Participation (School Year 2018-19)
Measure CTE Program Participation
Number of Pupils Participating in CTE 6
Percent of Pupils that Complete a CTE Program and Earn a High School Diploma
Percent of CTE Courses that are Sequenced or Articulated Between the School and Institutions of Postsecondary Education
Courses for University of California (UC) and/or California State University (CSU) Admission
UC/CSU Course Measure Percent
2018-19 Pupils Enrolled in Courses Required for UC/CSU Admission 0.21
2017-18 Graduates Who Completed All Courses Required for UC/CSU Admission 0

2018-19 School Accountability Report Card for Stanislaus County Office-Special Education Page 10 of 14
State Priority: Other Pupil Outcomes The SARC provides the following information relevant to the State priority: Other Pupil Outcomes (Priority 8): • Pupil outcomes in the subject areas of physical education. California Physical Fitness Test Results (School Year 2018-19)
Grade Level Percentage of Students
Meeting Four of Six Fitness Standards
Percentage of Students Meeting Five of Six Fitness Standards
Percentage of Students Meeting Six of Six Fitness Standards
5 10.0 10.0
7 20.0 10.0 6.7 Note: Percentages are not calculated and double dashes (--) appear in the table when the number of students tested is ten or less, either because the number of students in this category is too small for statistical accuracy or to protect student privacy. C. Engagement State Priority: Parental Involvement The SARC provides the following information relevant to the State priority: Parental Involvement (Priority 3): • Efforts the school district makes to seek parent input in making decisions for the school district and each school site. Opportunities for Parental Involvement (School Year 2019-20)
The Stanislaus County Office of Education ensures parental involvement through the Individual Education Program (IEP) meeting process. Parents participate in not less than one IEP meeting per year with their child's full educational team and more if needed. Parents play a vital role in the education of their children. There are many opportunities for parental involvement in the educational settings that include: regularly scheduled parent trainings, regular home visits, assisting in classrooms, and attending group sessions with their children. The Community Advisory Committee meets once a month to involve parents in a variety of special education issues and establish a network of support. The Stanislaus County Office of Education also holds conferences designed to educate, support, and empower parents in the journey of raising a child with special needs. State Priority: Pupil Engagement The SARC provides the following information relevant to the State priority: Pupil Engagement (Priority 5): • High school dropout rates; and • High school graduation rates. Dropout Rate and Graduation Rate (Four-Year Cohort Rate)
Indicator School 2015-16
School 2016-17
School 2017-18
District 2015-16
District 2016-17
District 2017-18
State 2015-16
State 2016-17
State 2017-18
Dropout Rate 54.8 4.5 23.5 55.4 46.9 43.3 9.7 9.1 9.6
Graduation Rate 22.6 50 29.4 16.9 22.4 24 83.8 82.7 83 For the formula to calculate the 2016-17 and 2017-18 adjusted cohort graduation rate, see the 2018-19 Data Element Definitions document located on the SARC web page at https://www.cde.ca.gov/ta/ac/sa/.

2018-19 School Accountability Report Card for Stanislaus County Office-Special Education Page 11 of 14
State Priority: School Climate The SARC provides the following information relevant to the State priority: School Climate (Priority 6): • Pupil suspension rates; • Pupil expulsion rates; and • Other local measures on the sense of safety. Suspensions and Expulsions
Rate School 2016-17
School 2017-18
School 2018-19
District 2016-17
District 2017-18
District 2018-19
State 2016-17
State 2017-18
State 2018-19
Suspensions 7.4 6.1 2.4 6.5 5.6 2.9 3.6 3.5 3.5
Expulsions 0.0 0.0 0.0 0.0 0.0 0.0 0.1 0.1 0.1 School Safety Plan (School Year 2019-20)
Facilities owned, operated, and utilized by the Stanislaus County Office of Education are maintained and reviewed regularly by our maintenance staff to ensure all facilities are safe and in good condition. A very high standard of classroom hygiene standards have been adopted throughout the County programs and daily custodial services guarantee sanitation and cleanliness in our restrooms and classrooms. In June of 2012, a new special education facility was opened (JFK) serving our severe behavioral, medically fragile, and transition students. August 2013, the renovation of the special education facility (Margaret L. Annear) serving the Early Intervention students was completed on the same campus. Every classroom and common area has a School Emergency Response- Procedures and Guidelines binder posted for easy access to assist in emergency situations. Our campus is wired with a Bogan Emergency Response System, which allows communication in emergency situations. Additionally, we have cameras outside of the facilities to assist with safety issues. Our site receives annual safety reviews by the SCOE Safety Director, SCOE maintenance staff, the Ceres Fire Department, and a representative from our insurance carrier. All site concerns are handled immediately by our custodian, SCOE maintenance, administration or the safety team. Our Site Safety team meets twice a year, we have crisis simulation drills at least once per month, exceeding the requirements by law. The comprehensive safe school site plan was reviewed and discussed with faculty by the regional health and safety plan coordinator after board approval. New SELPA policy mandates that all SCOE classrooms operated on district sites will be included in their comprehensive school safety plans, crisis simulation and safety requirements per ed code, fire code and ADA regulations. D. Other SARC Information The information in this section is required to be in the SARC but is not included in the state priorities for LCFF.

2018-19 School Accountability Report Card for Stanislaus County Office-Special Education Page 12 of 14
Average Class Size and Class Size Distribution (Elementary)
Grade Level
2016-17 Average
Class Size
2016-17 # of
Classes* Size 1-20
2016-17 # of
Classes* Size
21-32
2016-17 # of
Classes* Size 33+
2017-18 Average
Class Size
2017-18 # of
Classes* Size 1-20
2017-18 # of
Classes* Size
21-32
2017-18 # of
Classes* Size 33+
2018-19 Average
Class Size
2018-19 # of
Classes* Size 1-20
2018-19 # of
Classes* Size
21-32
2018-19 # of
Classes* Size 33+
K
9 6 8 7 8 9
2
1 1
3
11 1 9 1
4
8 1 10 2
5
8 4 5 2 6 2
6
4 2 7 1 6 3
Other**
10 7 8 8 9 7 *Number of classes indicates how many classes fall into each size category (a range of total students per class). ** “Other” category is for multi-grade level classes. Average Class Size and Class Size Distribution (Secondary)
Subject
2016-17 Average
Class Size
2016-17 # of
Classes* Size 1-22
2016-17 # of
Classes* Size
23-32
2016-17 # of
Classes* Size 33+
2017-18 Average
Class Size
2017-18 # of
Classes* Size 1-22
2017-18 # of
Classes* Size
23-32
2017-18 # of
Classes* Size 33+
2018-19 Average
Class Size
2018-19 # of
Classes* Size 1-22
2018-19 # of
Classes* Size
23-32
2018-19 # of
Classes* Size 33+
English 1 1 3 11 2 5
Mathematics 2 6 3 4
Science 2 4 2 4
Social Science 3 7 2 5 *Number of classes indicates how many classrooms fall into each size category (a range of total students per classroom). At the secondary school level, this information is reported by subject area rather than grade level. Ratio of Academic Counselors to Pupils (School Year 2018-19)
Title Ratio
Academic Counselors* .0 *One Full Time Equivalent (FTE) equals one staff member working full time; one FTE could also represent two staff members who each work 50 percent of full time. Student Support Services Staff (School Year 2018-19)
Title Number of FTE* Assigned to School
Counselor (Academic, Social/Behavioral or Career Development)
Library Media Teacher (Librarian)
Library Media Services Staff (Paraprofessional)
Psychologist
Social Worker
Nurse
Speech/Language/Hearing Specialist

2018-19 School Accountability Report Card for Stanislaus County Office-Special Education Page 13 of 14
Title Number of FTE* Assigned to School
Resource Specialist (non-teaching) 2.2
Other *One Full Time Equivalent (FTE) equals one staff member working full time; one FTE could also represent two staff members who each work 50 percent of full time. Expenditures Per Pupil and School Site Teacher Salaries (Fiscal Year 2017-18)
Level Total
Expenditures Per Pupil
Expenditures Per Pupil
(Restricted)
Expenditures Per Pupil
(Unrestricted)
Average Teacher Salary
School Site $104,014
District N/A N/A
Percent Difference - School Site and District N/A N/A -1.8
State N/A N/A $7,506.64
Percent Difference - School Site and State N/A N/A Note: Cells with N/A values do not require data. The California Department of Education issued guidance to LEAs on August 1, 2018, regarding how to calculate school-level per-pupil expenditures that will be reported on 2018-19 report cards. Types of Services Funded (Fiscal Year 2018-19)
Special education funds are used to provide all required interventions and services as specified by each students Individual Education Program and/or Individual Family Service Plan per IDEA part C and part B. All services provided follow best practices as indicated by SELPA policies and procedures, including caseloads, class size, and specialized classroom supports. Teacher and Administrative Salaries (Fiscal Year 2017-18)
Category District Amount
State Average For Districts
In Same Category Beginning Teacher Salary $ $
Mid-Range Teacher Salary $ $
Highest Teacher Salary $ $
Average Principal Salary (Elementary) $ $
Average Principal Salary (Middle) $ $
Average Principal Salary (High) $ $
Superintendent Salary $ $
Percent of Budget for Teacher Salaries % %
Percent of Budget for Administrative Salaries % % For detailed information on salaries, see the CDE Certificated Salaries & Benefits web page at https://www.cde.ca.gov/ds/fd/cs/.

2018-19 School Accountability Report Card for Stanislaus County Office-Special Education Page 14 of 14
Advanced Placement (AP) Courses (School Year 2018-19)
Subject Number of AP Courses Offered*
Percent of Students In AP Courses
Computer Science N/A
English------- N/A
Fine and Performing Arts N/A
Foreign Language N/A
Mathematics N/A
Science------- N/A
Social Science N/A
All courses Note: Cells with N/A values do not require data. *Where there are student course enrollments of at least one student. Professional Development (Most Recent Three Years)
Measure 2017-18 2018-19 2019-20
Number of school days dedicated to Staff Development and Continuous Improvement 4
SCOE is committed to providing professional development opportunities for all staff. This year, 4 additional days of professional development were added to the school year. Most trainings are specific to the area of expertise and are offered as conferences and workshops. Some programs have weekly training components to support their specific programs. A professional development plan was created to offer opportunities for certificated and non-certificated staff to choose from a variety of sessions, selecting one of four topics offered each month for professional growth. Additionally, a monthly staff training implemented in a Professional Learning Community format is conducted in two groups. Having an opportunity for staff development at least 2 times per month has proven very powerful and has positively impacted the services that we provide to students with special needs. We have also added a para educator training, sub training and an annual behavior intervention certification program.