Embed Size (px)
Citation preview
2019 Preqin Global Hedge Fund
Report
Sample Pages
ISBN: 978-1-912116-15-7$175 / £125 / €150www.preqin.com

2 0 1 9 P R E Q I N G L O B A L H E D G E F U N D R E P O R T
2 © P r e q i n L t d . / w w w . p r e q i n . c o m
CONTENTS
CEO's Foreword – Mark O'Hare 3
1. 2019 PREQIN GLOBAL HEDGE FUND REPORT
Hedge Funds and Institutional Investors: A Partnership Continues – Richard H. Baker, Managed Funds Association
6
Key Trends of 2018 8
2. HEDGE FUND MANAGEMENT
AUM Grows amid Performance Concerns 10
Asset Flows 12
Fund Managers and Funds 14
Fund Terms and Conditions 16
3. PERFORMANCE
Investors Find Value amid Rocky Performance 18
Performance Benchmarks 20
Performance in 2018 22
Performance over the Longer Term 23
4. INVESTORS
Investors Taking Defensive Approach 26
Investor Overview 28
Fund Searches and Mandates 30
5. INDUSTRY OVERVIEW
Hedge Funds in 2019 – Tom Kehoe, Alternative Investment Management Association (AIMA)
32
Volatile Markets: A Hindrance and a Help 34
Equity Strategies 36
Macro Strategies 37
Event Driven Strategies 38
Credit Strategies 39
Relative Value Strategies 40
Multi-Strategy 41
Niche/Cryptocurrency Strategies 42
Activist Funds 43
Alternative Risk Premia 44
Discretionary vs. Systematic 45
Emerging Markets 46
Volatility Trading 47
6. FUNDS OF HEDGE FUNDS
Funds of Hedge Funds and Their Changing Profile
50
Fund of Hedge Funds Overview 52
Fund of Hedge Funds Performance 54
Outlook for Funds of Hedge Funds 55
7. CTAs
CTA Overview 58
8. LIQUID ALTERNATIVES
Liquid Alternatives Overview 62
9. OUTLOOK
Hedge Fund Outlook: An Asset Class Becoming an Industry – William J. Kelly, CAIA Association
67
Hedge Funds Still Key to Diversification 68
Outlook for Hedge Funds 70
DATA PACK FOR 2019 PREQIN GLOBAL HEDGE FUND REPORTThe data behind all of the charts and infographics featured in this report, plus additional datasets for each of the chapters in the book, is available to purchase in Excel format. Ready-made charts and graphs are also available, and can be used in marketing materials, presentations or company reports.
To purchase the data pack, please contact your Preqin representative or download an order form here:
www.preqin.com/ghfr

2 0 1 9 P R E Q I N G L O B A L H E D G E F U N D R E P O R T
8 © P r e q i n L t d . / w w w . p r e q i n . c o m
KEY TRENDS OF 2018
Amid uncertainty in equity markets, hedge funds continue to offer investors diversification and uncorrelated returns for their respective portfolios. Despite a turbulent 2018, which culminated in negative returns at the end of the year, assets under management (AUM) in the hedge fund industry are forecast to increase over the coming year and beyond as investors continue to look to the asset class for downside protection.
AUM HITS RECORD LEVELS UNFAVOURABLE RETURNS
MARKET CORRECTION LOOMING? CREDIT STRATEGIES SEE LARGEST INFLOWS
A CHALLENGING ENVIRONMENT FOR FUNDS OF HEDGE FUNDS
INVESTORS STILL LOOK TO HEDGE FUNDS FOR DOWNSIDE PROTECTION
$3.62tnThe industry reached a record level of AUM in Q3 2018, before falling to $3.53tn as at November 2018
52%of surveyed fund managers believe AUM will increase further in 2019
15 Monthsof consecutive positive performance ended in February 2018, when hedge funds made their first loss (-0.91%)
59%of surveyed investors believe we are at the top of the equity cycle
+2.09%Credit strategies outperformed all other hedge fund strategies for 2018 (as at December 2018)
47%of surveyed fund of hedge funds managers believe the fundraising environment has become more challenging over the past 12 months
-3.41% The Preqin All-Strategies Hedge Fund benchmark return for 2018 (as at December 2018)
40%of surveyed investors intend to position their portfolios defensively amid concerns of a correction
Credit strategies recorded$22bnin inflows over 2018, a 12% increase in AUM from 2017
79%of surveyed investors intend to maintain or increase their level of allocation to hedge funds over the next 12 months
29%of surveyed investors plan to increase their exposure to macro strategies, the largest proportion for any strategy
$745bnFund of hedge funds AUM (as at November 2018)

2 0 1 9 P R E Q I N G L O B A L H E D G E F U N D R E P O R T
6 © P r e q i n L t d . / w w w . p r e q i n . c o m
Despite the ups and down of 2018, I am bullish on the hedge fund industry.
And I am not alone: nearly 80% of institutional investors surveyed by Preqin
plan to maintain or increase their allocation to hedge funds in 2019. This figure is higher than in each of the previous three years.
Why do institutional investors and others continue to rely on our industry to help meet their fiduciary responsibilities? Because these funds provide value by diversifying portfolios, managing risk and helping deliver reliable returns over time. Since the first hedge fund was created 70 years ago, the industry has played an active and dynamic role in capital markets by partnering with investors to help meet their unique investment goals.
As our diverse membership of large, medium and small funds work to deliver for their investors, MFA is helping them reduce operational expense and manage regulatory and tax risk. With a robust presence and strong record of offering helpful recommendations to policymakers across the globe, MFA is helping to set the stage for the industry’s future growth. Our members have identified targeted legislative and regulatory solutions which, if implemented, would stimulate investment, reduce duplicative regulatory requirements, promote fair and accessible capital markets and enhance the security of the confidential data that registrants are required to provide regulatory agencies.
For example, MFA members for years have expressed concern with the regulatory framework for proprietary exchange market data and consolidated market data. Ensuring timely and affordable access to market data is a vital part of trading in the 21st century and a key component of promoting equal access to markets. For many firms this data is the lifeblood of their trading strategies.
MFA members and other market participants believe the current regulatory framework does not adequately protect investors from unreasonably discriminatory pricing. In some cases, market data fees may even impose an unnecessary and inappropriate burden on competition. That is why MFA and AIMA submitted letters to the Securities and Exchange Commission (SEC) and the European Securities and Markets Authority (ESMA) requesting that they take action to help ensure investors are protected from unfair market data fees and practices.
Among other steps, we believe regulators and policymakers should request financial information from exchanges on market data operating costs and revenue to ensure that fees are fair and not unreasonably discriminatory. Increasing transparency with respect to market data fees will help protect investors and better ensure fair access for all market participants. The SEC’s recent long-awaited ruling requiring an exchange to justify previous fee increases – along with a public roundtable on market data fees which included an MFA member panelist – shows the Commission is listening to concerns raised by MFA and others on these issues.
HEDGE FUNDS AND INSTITUTIONAL INVESTORS: A PARTNERSHIP CONTINUES
RICHARD H. BAKERPresident & CEO,
Managed Funds Association

1 . 2 0 1 9 P R E Q I N G L O B A L H E D G E F U N D R E P O R T
7
MFA also engaged European regulators on market data issues in 2018, helping to ensure exchanges follow the letter and the spirit of the Market in Financial Instruments Regulation’s post-trade transparency requirements.
Over the past decade, MFA has worked closely with policymakers and regulators as they built the post-crisis financial regulatory structure. We believe it is one of the reasons capital markets are as efficient, transparent and fair as they are today.
MFA members have valuable insight into the impacts, unintended and otherwise, that these regulations have on market participants and capital markets. To assist regulators, we have developed thoughtful, obtainable solutions to decrease duplicative and overlapping regulations that impose undue costs on fund managers and their investors – and create more work for already overburdened regulators.
One example involves firms that are registered with the SEC as investment advisers and the Commodities Futures Trading Commission (CFTC) as commodity pool operators. MFA believes that the commissions could greatly enhance regulatory efficiency by taking a more coordinated and harmonized approach to the regulation and examination of such dual registrants.
Through discussions with regulators, MFA developed a “primary regulator safe harbor” framework, where a firm would remain registered with both agencies but establish a primary regulator. A dual registrant who complies with its primary regulator’s requirements would be deemed to have met the requirements of the other. Such a proposal would meet the CFTC, SEC and Treasury Department’s own goals relating to increased coordination and efficiency across regulatory bodies.
It would also assist regulators in prioritizing resources. Something as simple as having SEC and CFTC examiners conduct exams jointly could save countless hours and taxpayers dollars.
MFA’s membership and our mandate are global, which is why MFA has closely engaged regulators on the potential impacts of Brexit on our industry and capital markets in general. As I write this – and very possibly as you read this – much about the process and endgame remains unknown.
In discussing the issue with our members, it is clear that they remain concerned that equivalence arrangements, which take significant time to negotiate, may not be finalized before the withdrawal. Our focus has been on ensuring that our members have continued access to EU markets and that EU investors have access to our members. We have met and spoken with regulators and policymakers on both sides of the Channel and both sides of the Atlantic to articulate these points.
This issue dovetails with our work on the Investment Firms Review, the EU’s ongoing effort to develop tailored prudential requirements for our industry. MFA has advocated consistently that managers do not pose a systemic risk and that any prudential requirements should reflect this fundamental fact.
On these and other policies MFA operates entirely at the direction of our members, who identify our priorities based on the issues most likely to impact the industry and our investors. We have established a track record of thoughtful advocacy of which I am tremendously proud.
Of course, our work is never done. If you are not a part of our dynamic efforts on behalf of the industry, we would welcome your voice and input as we address these issues and others in 2019.
ABOUT MANAGED FUNDS ASSOCIATIONMr. Baker is president and CEO of Managed Funds Association – the alternative industry’s authoritative voice on policy and premier platform for peer-to-peer networking and operational, legal and compliance training.
www.managedfunds.org

2 0 1 9 P R E Q I N G L O B A L H E D G E F U N D R E P O R T
14 © P r e q i n L t d . / w w w . p r e q i n . c o m
FUND MANAGERS AND FUNDS
Manager Headquarters Dec-17 AUM ($bn) Q4 2018 AUM ($bn) % Change in AUM over 2018
US 2,570 2,568 0%
UK 506 486 -4%
Hong Kong 69 62 -10%
Canada 41 50 22%
Sweden 50 44 -12%
France 51 41 -20%
Brazil 46 37 -20%
Australia 29 34 17%
Switzerland 33 30 -9%
Singapore 20 22 10%
Source: Preqin Pro. Data as at November 2018
Fig. 2.5: Hedge Fund Manager Assets under Management by Manager Headquarters
Fig. 2.4: Distribution of Hedge Fund Managers and Industry Assets under Management by Fund Manager Headquarters
Source: Preqin Pro. Data as at November 2018
3,906
2,638
NORTH AMERICA
1,051686
EUROPE
862150
ASIA
23152
REST OF WORLDNo. of Fund Managers
Q4 2018 AUM ($bn)
2 0 1 9 P R E Q I N G L O B A L H E D G E F U N D R E P O R T
36 © P r e q i n L t d . / w w w . p r e q i n . c o m
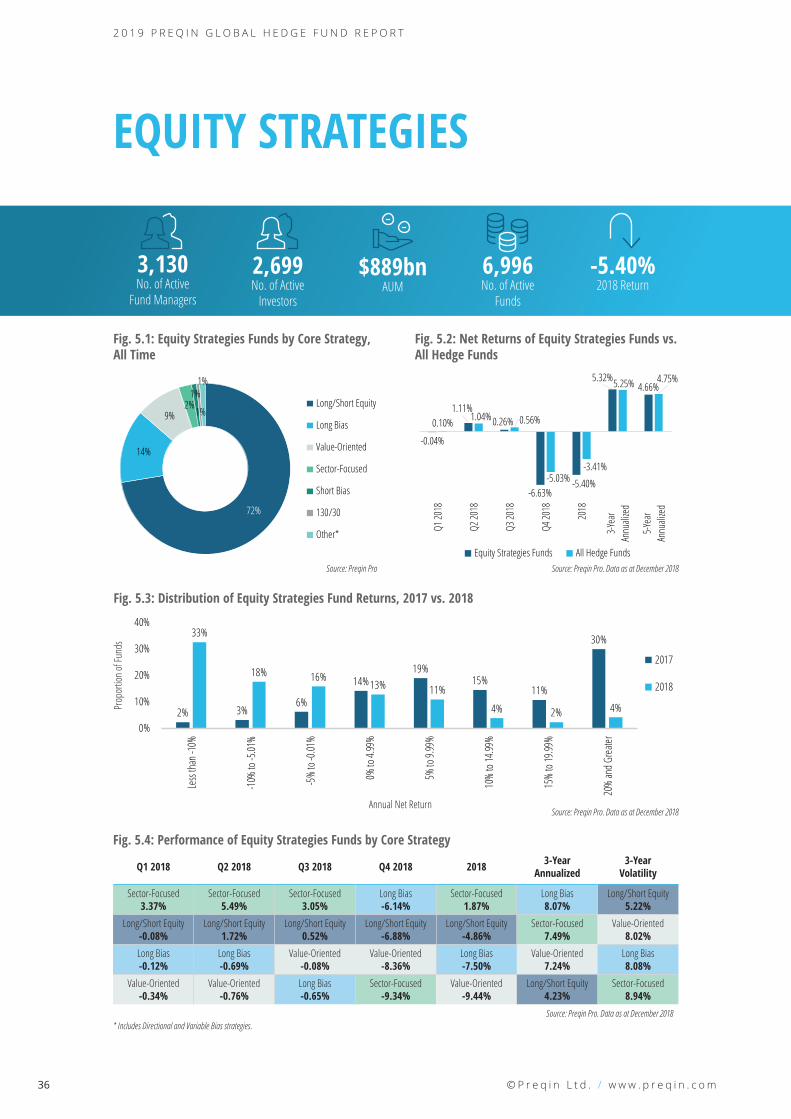
EQUITY STRATEGIES
Fig. 5.2: Net Returns of Equity Strategies Funds vs. All Hedge Funds
-0.04%
1.11%0.26%
-6.63%-5.40%
5.32%4.66%
0.10% 1.04% 0.56%
-5.03%-3.41%
5.25% 4.75%
Q1 20
18
Q2 20
18
Q3 20
18
Q4 20
18
2018
3-Yea
rAn
nuali
zed
5-Yea
rAn
nuali
zed
Equity Strategies Funds All Hedge FundsSource: Preqin Pro. Data as at December 2018
Fig. 5.1: Equity Strategies Funds by Core Strategy, All Time
72%
14%
9%2%
1%
1%
1%
Long/Short Equity
Long Bias
Value-Oriented
Sector-Focused
Short Bias
130/30
Other*
Source: Preqin Pro
Q1 2018 Q2 2018 Q3 2018 Q4 2018 2018 3-Year Annualized
3-YearVolatility
Sector-Focused 3.37%
Sector-Focused 5.49%
Sector-Focused 3.05%
Long Bias -6.14%
Sector-Focused 1.87%
Long Bias 8.07%
Long/Short Equity 5.22%
Long/Short Equity -0.08%
Long/Short Equity 1.72%
Long/Short Equity 0.52%
Long/Short Equity -6.88%
Long/Short Equity -4.86%
Sector-Focused 7.49%
Value-Oriented 8.02%
Long Bias -0.12%
Long Bias -0.69%
Value-Oriented -0.08%
Value-Oriented -8.36%
Long Bias -7.50%
Value-Oriented 7.24%
Long Bias 8.08%
Value-Oriented -0.34%
Value-Oriented -0.76%
Long Bias -0.65%
Sector-Focused -9.34%
Value-Oriented -9.44%
Long/Short Equity 4.23%
Sector-Focused 8.94%
Source: Preqin Pro. Data as at December 2018
Fig. 5.4: Performance of Equity Strategies Funds by Core Strategy
2,699No. of Active
Investors
3,130No. of Active
Fund Managers
6,996No. of Active
Funds
$889bnAUM
-5.40%2018 Return
* Includes Directional and Variable Bias strategies.
Fig. 5.3: Distribution of Equity Strategies Fund Returns, 2017 vs. 2018
2% 3%6%
14%19%
15%11%
30%33%
18% 16%13% 11%
4% 2% 4%
0%
10%
20%
30%
40%
Less
than
-10%
-10%
to -5
.01%
-5%
to -0
.01%
0% to
4.99
%
5% to
9.99
%
10%
to 14
.99%
15%
to 19
.99%
20%
and G
reate
r
2017
2018
Source: Preqin Pro. Data as at December 2018Annual Net Return
Prop
ortio
n of F
unds
2 0 1 9 P R E Q I N G L O B A L H E D G E F U N D R E P O R T
52 © P r e q i n L t d . / w w w . p r e q i n . c o m
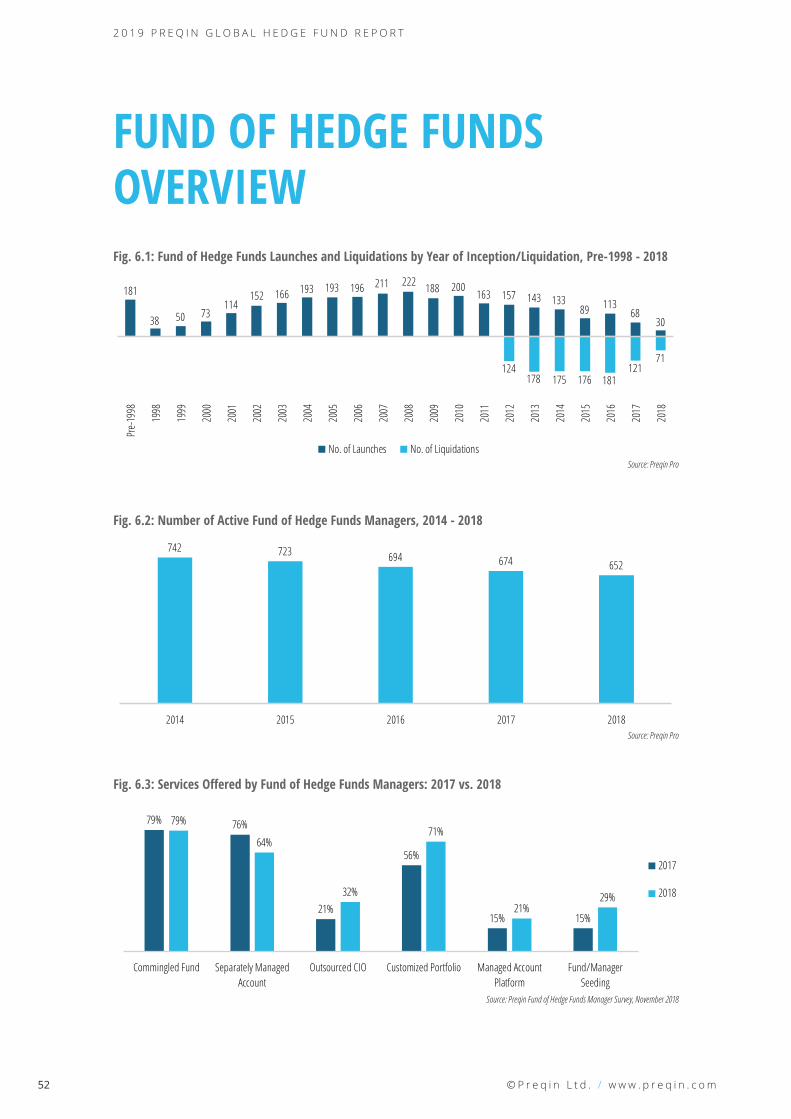
Fig. 6.3: Services Offered by Fund of Hedge Funds Managers: 2017 vs. 2018
79% 76%
21%
56%
15% 15%
79%
64%
32%
71%
21%29%
Commingled Fund Separately ManagedAccount
Outsourced CIO Customized Portfolio Managed AccountPlatform
Fund/ManagerSeeding
2017
2018
Source: Preqin Fund of Hedge Funds Manager Survey, November 2018
Fig. 6.1: Fund of Hedge Funds Launches and Liquidations by Year of Inception/Liquidation, Pre-1998 - 2018
Source: Preqin Pro
Fig. 6.2: Number of Active Fund of Hedge Funds Managers, 2014 - 2018
742 723 694 674 652
2014 2015 2016 2017 2018Source: Preqin Pro
181
38 50 73114
152 166 193 193 196 211 222 188 200163 157 143 133
89 11368
30
124178 175 176 181
12171
Pre-
1998
1998
1999
2000
2001
2002
2003
2004
2005
2006
2007
2008
2009
2010
2011
2012
2013
2014
2015
2016
2017
2018
No. of Launches No. of Liquidations
FUND OF HEDGE FUNDS OVERVIEW

9 . O U T L O O K
69
investors remain positive on the strategy as more are looking to increase exposure than those looking to pull back (Fig. 9.6).
CONSIDERATIONS FOR INVESTORSFor investors active in the industry, the challenge of portfolio selection persists. With nearly 15,000 funds open to investment, navigating the saturated landscape and performing due diligence to construct a portfolio is no mean feat. Over the past two years, the number of active hedge funds has declined for the first time since the GFC – a welcome contraction for fund managers, where the competitive landscape has only become more congested over the course of the decade. Preqin’s ‘Future of Alternatives’ report found that consolidation will impact the hedge fund industry through to 2023: 91% of fund managers expect some or significant consolidation to occur over the next five years.1 What is left behind should be a leaner market place for investors to optimize their portfolios.
How to access hedge funds is another important consideration for investors when assessing portfolio selection. While 70% of investors view pooled structures as the leading route to market, managed accounts are increasingly offered. One in every three fund managers now provides a managed account offering and, over the next five years, 39% of fund managers expect managed account offerings to increase as appetite for the structure shows no sign of abating.
AROUND THE CORNEROpportunities exist for hedge funds to demonstrate their true value in the investment portfolio; investors are backing the asset class over the short and long term as concerns around market and economic conditions intensify. Preqin predicts that hedge fund industry AUM will grow by 31% in the next five years, reaching $4.7tn by 2023, as investors’ requirements for alpha uncorrelated to public markets continue to push them towards hedge funds. However, fund managers will need to survive a timely industry consolidation in order to prosper.
1 ‘The Future of Alternatives’, Preqin: www.preqin.com/future

The 2019 Preqin Global Alternatives Reports are the most detailed and comprehensive reviews of the alternative assets industry available, offering exclusive insight into the latest developments in the private equity, hedge fund, real estate, infrastructure, private debt and natural resources asset classes.
Access in-depth analysis and comprehensive statistics to understand the latest trends in fundraising, performance, investors, deals and fund managers.■ View historical data alongside the most important industry developments. Read contributions from
some of the industry’s leading igures.■ Improve your presentations, marketing materials and company reports.
■ Answer key questions: Who is investing? How much has been raised? Where are the centres of activity? Where is the capital going? What are the biggest deals? What is the outlook for the industry?
2019 PREQIN GLOBAL ALTERNATIVES REPORTS
For more information visit: www.preqin.com/reports
PAYMENT DETAILS: SHIPPING DETAILS:
Cheque enclosed (cheque payable to ‘Preqin’) Name:_______________________________________
Telephone:_______________________________________
Charge my: Visa Firm:_______________________________________
Email:_______________________________________
Mastercard Job Title:_______________________________________
Amex Address:_______________________________________
Please invoice me _______________________________________
Currency: USD GBP EUR _______________________________________
Card Number:_______________________________________
City:_______________________________________
Name on Card:_______________________________________
State:_______________________________________
Expiration Date:_______________________________________
Post/Zip:_______________________________________
Security Code:_______________________________________
Country:_______________________________________
COMPLETED ORDER FORMSPost (to Preqin):
NEW YORKOne Grand Central Place60 E 42nd StreetSuite 630New YorkNY 10165Tel: +1 212 350 0100Fax: +1 440 445 9595
LONDON3rd FloorVintners’ Place68 Upper Thames StreetLondonEC4V 3BJTel: +44 (0)20 3207 0200Fax: +44 (0)870 330 5892
SINGAPOREOne Finlayson Green#11-02Singapore049246
Tel: +65 6305 2200Fax: +65 6491 2240
SAN FRANCISCOOne Embarcadero CenterSuite 2850San FranciscoCA 94111
Tel: +1 415 316 0580 Fax: +1 440 445 9595
HONG KONGLevel 9, Central Building1-3 Pedder StreetCentral, Hong Kong
Tel: +852 3892 0200
American Express, four-digit code printed on the front of the card.
Visa and Mastercard, last three digits printed on the signature strip.
I would like to purchase:
PRINTName First Copy Each Additional Copy Quantity Data Pack* Private Equity & Venture Capital $175/£125/€150 $90/£65/€75 $300/£215/€260Hedge Funds $175/£125/€150 $90/£65/€75 $300/£215/€260Real Estate $175/£125/€150 $90/£65/€75 $300/£215/€260Infrastructure $175/£125/€150 $90/£65/€75 $300/£215/€260Private Debt $175/£125/€150 $90/£65/€75 $300/£215/€260Natural Resources $175/£125/€150 $90/£65/€75 $300/£215/€260All Six Titles (25% Saving!) $785/£560/€675 $395/£280/€340 $1,350/£965/€1,160Shipping Costs: $40/£10/€25 for single publication
$20/£5/€12 for additional copies(Shipping costs will not exceed a maximum of $60/£15/€37 per order when all shipped to same address. If shipped to multiple addresses then full postage rates apply for additional copies.)
If you would like to order more than 10 copies of one title, please contact us for a special rate
DIGITALName Single-User Licence Each Additional
Copy Quantity Enterprise Licence** Data Pack*
Private Equity & Venture Capital $175/£125/€150 $90/£65/€75 $1,000/£715/€860 $300/£215/€260Hedge Funds $175/£125/€150 $90/£65/€75 $1,000/£715/€860 $300/£215/€260Real Estate $175/£125/€150 $90/£65/€75 $1,000/£715/€860 $300/£215/€260Infrastructure $175/£125/€150 $90/£65/€75 $1,000/£715/€860 $300/£215/€260Private Debt $175/£125/€150 $90/£65/€75 $1,000/£715/€860 $300/£215/€260Natural Resources $175/£125/€150 $90/£65/€75 $1,000/£715/€860 $300/£215/€260All Six Titles (25% Saving!) $785/£560/€675 $395/£280/€340 $4,500/£3,215/€3,860 $1,350/£965/€1,160*Data packs feature all the chart and league table data in an Excel file. Must be purchased alongside the associated report.**Enterprise Licence allows for team-wide digital access.Please note all prices quoted throughout are exclusive of sales taxes.