Embed Size (px)
Citation preview

1
2019 pig cost of production in selected countries

2
Contents
2 Introduction
4 Methodology
5 Key points
6 Cost of productionAggregate results for 2019Comparisons with previous years (sterling)Comparisons with previous years (euro)
9 Financial performance summaryFeed prices and costsSummary of financial performanceNet margins in Great Britain
17 Physical performance summaryPigs weaned per sow per yearPigs finished per sow per year
22 Appendix 1InterPIG members’ pig industry trends, 2019Additional tables and figuresStandardising the physical resultsComparison GB and EU physical performance
30 Appendix 2List of tables and charts
3
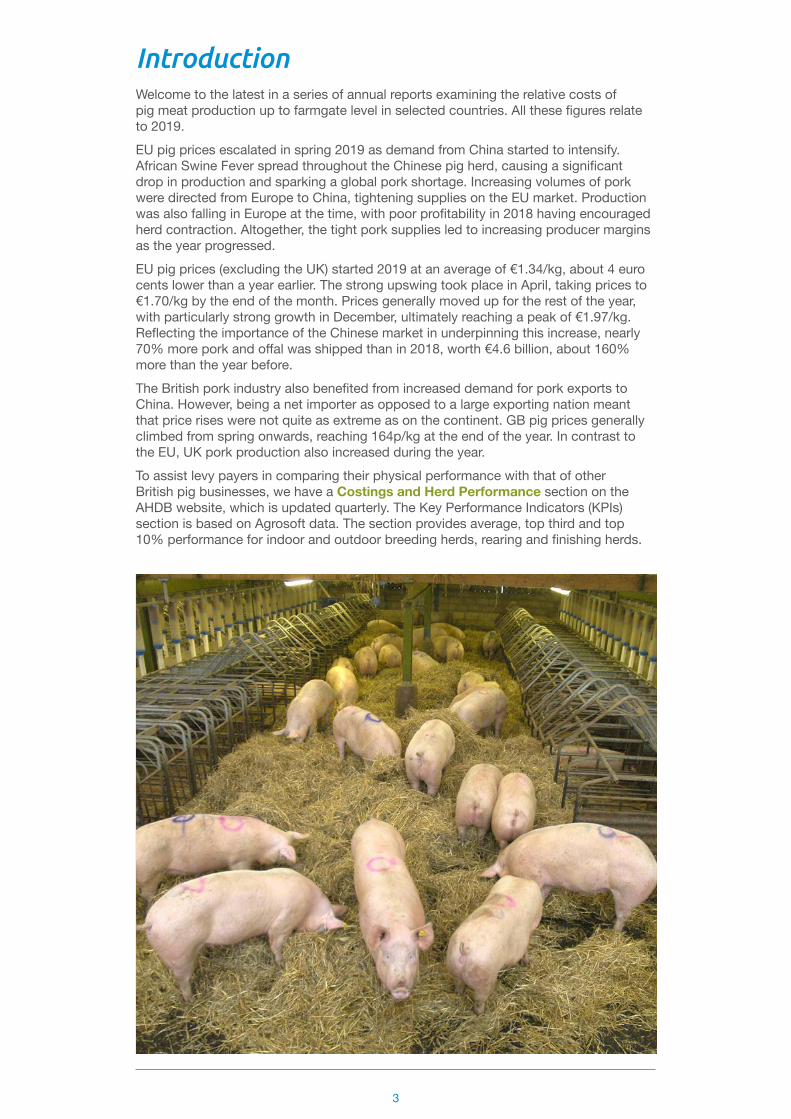
IntroductionWelcome to the latest in a series of annual reports examining the relative costs of pig meat production up to farmgate level in selected countries. All these figures relate to 2019.EU pig prices escalated in spring 2019 as demand from China started to intensify. African Swine Fever spread throughout the Chinese pig herd, causing a significant drop in production and sparking a global pork shortage. Increasing volumes of pork were directed from Europe to China, tightening supplies on the EU market. Production was also falling in Europe at the time, with poor profitability in 2018 having encouraged herd contraction. Altogether, the tight pork supplies led to increasing producer margins as the year progressed.EU pig prices (excluding the UK) started 2019 at an average of €1.34/kg, about 4 euro cents lower than a year earlier. The strong upswing took place in April, taking prices to €1.70/kg by the end of the month. Prices generally moved up for the rest of the year, with particularly strong growth in December, ultimately reaching a peak of €1.97/kg. Reflecting the importance of the Chinese market in underpinning this increase, nearly 70% more pork and offal was shipped than in 2018, worth €4.6 billion, about 160% more than the year before.The British pork industry also benefited from increased demand for pork exports to China. However, being a net importer as opposed to a large exporting nation meant that price rises were not quite as extreme as on the continent. GB pig prices generally climbed from spring onwards, reaching 164p/kg at the end of the year. In contrast to the EU, UK pork production also increased during the year.To assist levy payers in comparing their physical performance with that of other British pig businesses, we have a Costings and Herd Performance section on the AHDB website, which is updated quarterly. The Key Performance Indicators (KPIs) section is based on Agrosoft data. The section provides average, top third and top 10% performance for indoor and outdoor breeding herds, rearing and finishing herds.
4
MethodologyThis report examines the relative costs of production in selected countries. This is a joint project, involving the following organisations in 17 countries, known collectively as InterPIG:
● Great Britain – Agriculture and Horticulture Development Board (AHDB) ● Austria – VLV Upper Austria and Chamber of Agriculture Lower Austria ● Flemish Government and Boerenbond Belgie ● Brazil – Embrapa Swine and Poultry
Brazil submits data for two regions: Mato Grosso (MT) and Santa Catarina (SC) ● Canada – Canadian Pork Council ● Czech Republic – Institute of Agricultural Economics and Information (UZEI) ● Denmark – SEGES ● Finland – Atria ● France – Institute of Pork (IFIP) ● Germany – Thuenen Institute of Farm Economics and Interessengemeinschaft der
Schweinehalter (ISN) ● Hungary – AKI Research Institute of Agricultural Economics ● Ireland – Teagasc ● Italy – Research Centre for Animal Production (CRPA) ● Netherlands – Wageningen Economic Research ● Spain – SIP Consultors ● Sweden – Svenska Pig ● USA – Iowa State University
Czech Republic is not included due to deadlines. InterPIG continues to work with other countries and organisations wishing to participate in international comparison. Where EU averages are in tables, they are the averages of the EU participating countries.Cost and performance data relate to average performance data from national recording systems operating in the participating countries. Definitions have been standardised across countries. For example, the definition of a sow is from first insemination to slaughter, and the results are based on average present sows (average daily number of sows in the year). The methodology is based on compound feed for sows, rearing and finishing, to ensure consistency of approach. However, this is in the knowledge that there are farmers in the different countries who grow their own crops and home-mix their pig feed. The proportion of farmers in each country who home-mix varies, depending on infrastructure, tradition, ingredient availability and prices.There will inevitably still be some national differences in definition but, where this has occurred, the data is adjusted in the most appropriate way. The results are believed to provide an indication of the relative average costs of production within each country and to deliver an accurate comparison. In an attempt to continue to improve the accuracy of the data provided, the glossary of terms and formulae used in calculations is monitored and updated. In some instances, due to changes in data or participating countries, previous years’ analyses may be updated. As a result, there may be some discrepancies between previous publications as definitions and formulae are realigned.NOTE: In Great Britain, there is a difference between the methodology used for producing the national quarterly cost of production and the methodology used by InterPIG. In Great Britain, abattoir costs (transport to slaughter, meat hygiene, carcase classification and statutory levy) are included in the quarterly published cost of production figures. In InterPIG, these costs are excluded from the cost of production and are deducted from the price received at sale.In this 2019 report, EU averages are the averages for the EU countries that record with InterPIG, and include GB, except for the EU reference price, which is quoted excluding the UK.
5
Key points• The cost of pig meat production for indoor pigs in Great Britain decreased by
3% in 2019, to £1.42 per kg. The average cost of production in the EU was also £1.42 per kg deadweight – a 1% decrease in sterling terms compared with 2018
• Sampled EU countries experienced differing changes in their costs of production (in sterling terms) compared with 2018, with some seeing an increase and others a decrease
• EU average reference price of £1.48 per kg was higher in 2019 than 2018, an increase of 18%, and above the cost of production of most EU countries
• Average feed prices were lower in 2019 than in 2018, decreasing across the participating EU countries by an average of 2%
• In 2019 as a whole, EU feed costs per kg in sterling terms decreased by less than 1% compared with a year earlier
• The majority of InterPIG member countries experienced a decrease in feed costs compared with 2018, with some notable exceptions including the USA, Denmark, Netherlands and France
• The overall average number of pigs weaned per sow per year in the EU InterPIG countries showed a 1% increase in 2019, up from 28.1 in 2018 to 28.4. Denmark again achieved over 33
• Pigs weaned per sow per year in Great Britain’s indoor herds remained the same in 2019 at 27.4 – still below the EU InterPIG average. Great Britain’s outdoor herds bounced back from the weather effect of 2018, achieving 24.1 in 2019, an increase of 4%
• Excluding Great Britain’s outdoor herds, there is a difference of 8.7 pigs weaned per sow per year between the highest- and lowest-performing EU countries
• The average number of pigs finished per sow in Great Britain’s indoor herds was maintained in 2019 at 25.4 – still lower than the EU average of 26.7
• Great Britain’s indoor herds continued to produce over 2 tonnes of carcase meat per sow in 2019 – 1% higher than in 2018 – mainly due to the increase in liveweight at slaughter

6
Cost of production
Aggregate results for 2019The production costs of pig meat in 2019 for all of the countries covered in this report are shown below in Figure 1. This data includes all variable and overhead costs, other than transport of pigs to abattoirs and abattoir-related deductions, such as carcase classification and statutory levies paid at slaughter. Overhead costs include depreciation and interest costs for capital items such as buildings and equipment. Costs for regular and casual labour are included but directors’ salaries or partners’ drawings are not.
0.00
0.20
0.40
0.60
0.80
1.00
1.20
1.40
1.60
1.80
£ pe
r dw
kg
AUS BEL BRA(MT)
BRA(SC)
CAN DEN FIN FRA GER GB(IN)
GB(OUT)
HUN IRE ITA NL SPA SWE USA
Feed Other variable costs Labour Depreciation and finance
UK average price EU average price
AUS BEL BRA(MT)
BRA(SC)
CAN DEN FIN FRA GER GB(IN)
GB(OUT)
HUN IRE ITA NL SPA SWE USA
Feed Other variable costs Labour Depreciation and finance
UK average price EU average price
AUS BEL BRA(MT)
BRA(SC)
CAN DEN FIN FRA GER GB(IN)
GB(OUT)
HUN IRE ITA NL SPA SWE USA
Feed Other variable costs Labour Depreciation and finance
UK average price EU average price
0.59
0.12
0.12 0.03
0.06
0.80
0.18
0.17
0.60
0.13
0.11
0.09
0.90
0.22
0.13
0.18
0.87
0.23
0.15
0.28
0.05 0.08
0.72
0.10
0.79
0.19
0.13
0.16
0.83
0.24
0.12
0.17
0.77
0.27
0.14
0.23
0.91
0.27
0.14
0.13
0.92
0.23
0.12
0.20
0.95
0.23
0.13
0.20
1.07
0.22
0.15
0.22
0.29
0.15
0.16
0.930.83
0.22
0.09
0.12
0.64
0.12
0.12 0.07
0.77
0.35
0.15
0.22
0.80
0.31
0.12
0.16
Figure 1. Cost of production in selected countries, 2019
The average cost of production in the EU in 2019 for the countries above was £1.42 per kg deadweight – a 1% decrease on the previous year. Costs of production in Great Britain for pork from indoor sows were the same as the EU average at £1.42, although this was a 3% decrease on the previous year. In 2019, Italy continued to have the highest costs, at £1.66 per kg deadweight. The country with the lowest production costs in the EU was Belgium (£1.22).The average UK reference price was 2% higher in 2019 compared with 2018, averaging £1.49 per kg, and less than 1% above the EU average (excluding UK) of £1.48 per kg. The EU reference price increased by 18% compared with £1.26 in 2018. On average, margins as a whole were positive for the UK in 2019 but with mixed results during the year (see Net Margin section).Across the EU countries sampled, there was a technical margin of 7p on every kg of pig meat produced, with all countries except Austria, Ireland, Italy and Sweden having production costs lower than the EU average reference price.
Reference pricesThe UK reference price is gross, before abattoir deductions such as carcase classification. It includes premium pigs (e.g. outdoor bred) and point-of-sale price adjustments, such as those based on probe measurements.The EU reference price (excluding UK) is usually after deductions of any abattoir-paid costs, which, in many countries, include transport to abattoir, carcase classification and insurance.
7
Neither price includes any bonus or price adjustment paid later than the point-of-sale transaction such as end-of-year cooperative bonuses.
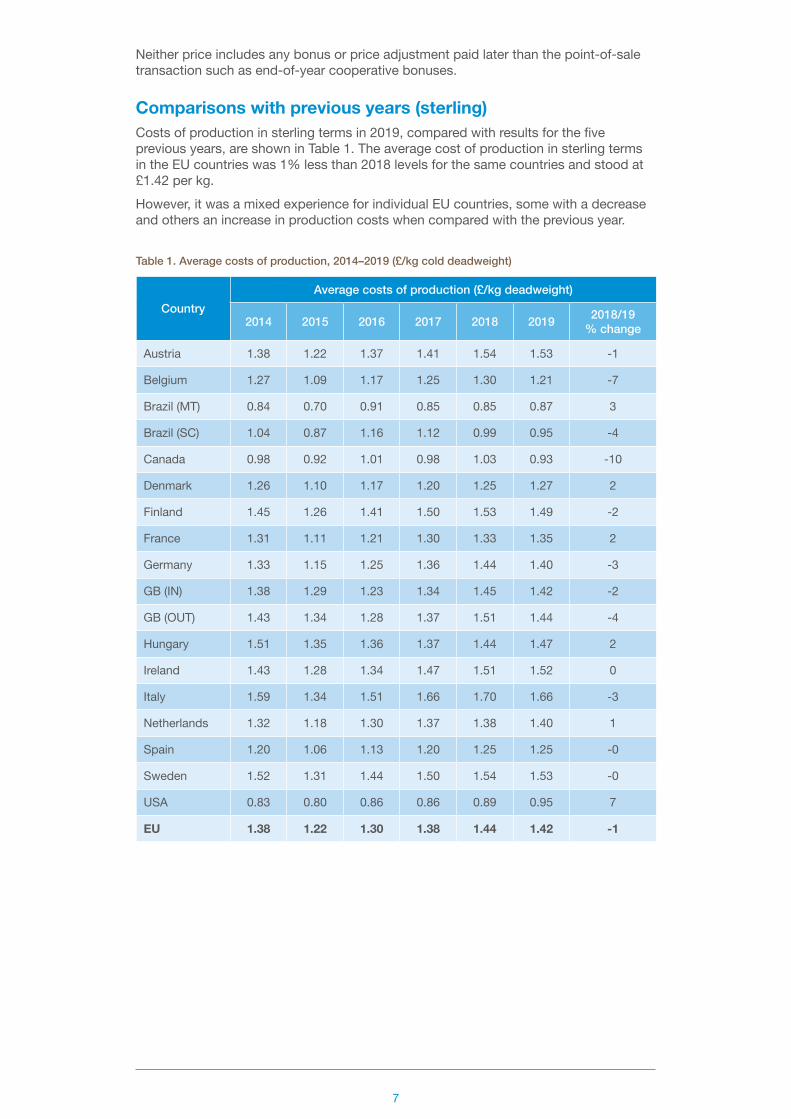
Comparisons with previous years (sterling)Costs of production in sterling terms in 2019, compared with results for the five previous years, are shown in Table 1. The average cost of production in sterling terms in the EU countries was 1% less than 2018 levels for the same countries and stood at £1.42 per kg. However, it was a mixed experience for individual EU countries, some with a decrease and others an increase in production costs when compared with the previous year.
Table 1. Average costs of production, 2014–2019 (£/kg cold deadweight)
CountryAverage costs of production (£/kg deadweight)
2014 2015 2016 2017 2018 2019 2018/19% change
Austria 1.38 1.22 1.37 1.41 1.54 1.53 -1
Belgium 1.27 1.09 1.17 1.25 1.30 1.21 -7
Brazil (MT) 0.84 0.70 0.91 0.85 0.85 0.87 3
Brazil (SC) 1.04 0.87 1.16 1.12 0.99 0.95 -4
Canada 0.98 0.92 1.01 0.98 1.03 0.93 -10
Denmark 1.26 1.10 1.17 1.20 1.25 1.27 2
Finland 1.45 1.26 1.41 1.50 1.53 1.49 -2
France 1.31 1.11 1.21 1.30 1.33 1.35 2
Germany 1.33 1.15 1.25 1.36 1.44 1.40 -3
GB (IN) 1.38 1.29 1.23 1.34 1.45 1.42 -2
GB (OUT) 1.43 1.34 1.28 1.37 1.51 1.44 -4
Hungary 1.51 1.35 1.36 1.37 1.44 1.47 2
Ireland 1.43 1.28 1.34 1.47 1.51 1.52 0
Italy 1.59 1.34 1.51 1.66 1.70 1.66 -3
Netherlands 1.32 1.18 1.30 1.37 1.38 1.40 1
Spain 1.20 1.06 1.13 1.20 1.25 1.25 -0
Sweden 1.52 1.31 1.44 1.50 1.54 1.53 -0
USA 0.83 0.80 0.86 0.86 0.89 0.95 7
EU 1.38 1.22 1.30 1.38 1.44 1.42 -1

8
Comparisons with previous years (euro)Costs of production in euro terms in 2019 are shown in Table 2. This reflects a similar picture to the comparisons in sterling terms, with some countries experiencing an increase and some a decrease in production costs when compared with 2018. Overall, in the EU countries, 2019 production costs in euro terms were very similar to those of 2018.
Table 2. Average costs of production, 2014–2019 (€/kg cold deadweight)
CountryAverage costs of production (€/kg deadweight)
2014 2015 2016 2017 2018 2019 2018/19% change
Austria 1.71 1.68 1.67 1.61 1.74 1.74 0
Belgium 1.57 1.50 1.43 1.43 1.47 1.38 -6
Brazil (MT) 1.05 0.96 1.11 0.97 0.96 0.99 3
Brazil (SC) 1.29 1.19 1.42 1.28 1.12 1.08 -3
Canada 1.22 1.27 1.24 1.11 1.16 1.06 -9
Denmark 1.56 1.52 1.43 1.37 1.41 1.45 3
Finland 1.80 1.74 1.72 1.71 1.73 1.70 -2
France 1.62 1.53 1.48 1.48 1.51 1.54 2
Germany 1.65 1.58 1.53 1.56 1.63 1.60 -2
GB (IN) 1.71 1.78 1.50 1.53 1.64 1.62 -1
GB (OUT) 1.77 1.85 1.56 1.56 1.70 1.65 -3
Hungary 1.87 1.86 1.66 1.56 1.63 1.68 3
Ireland 1.78 1.76 1.64 1.68 1.71 1.73 1
Italy 1.97 1.85 1.84 1.89 1.93 1.89 -2
Netherlands 1.64 1.62 1.58 1.57 1.56 1.59 2
Spain 1.49 1.46 1.38 1.37 1.41 1.42 1
Sweden 1.88 1.80 1.76 1.71 1.74 1.75 1
USA 1.02 1.10 1.05 0.98 1.01 1.08 8
EU 1.72 1.68 1.58 1.57 1.63 1.62 -0
9
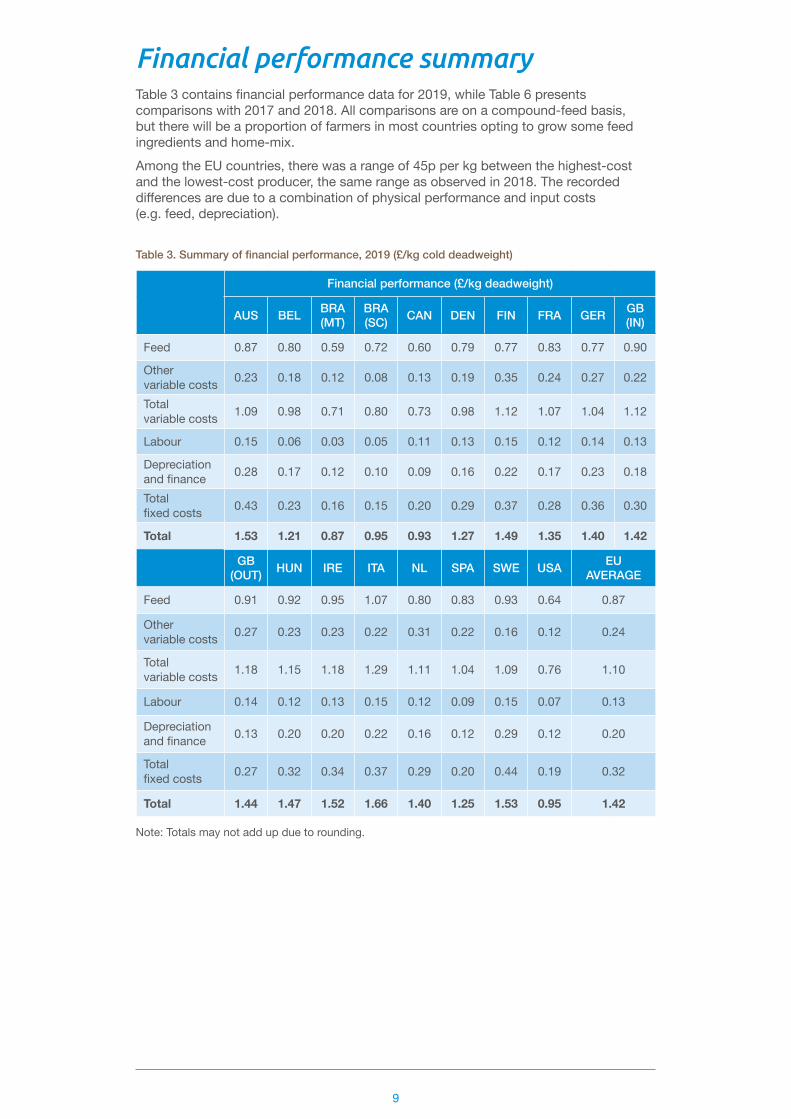
Financial performance summaryTable 3 contains financial performance data for 2019, while Table 6 presents comparisons with 2017 and 2018. All comparisons are on a compound-feed basis, but there will be a proportion of farmers in most countries opting to grow some feed ingredients and home-mix. Among the EU countries, there was a range of 45p per kg between the highest-cost and the lowest-cost producer, the same range as observed in 2018. The recorded differences are due to a combination of physical performance and input costs (e.g. feed, depreciation).
Table 3. Summary of financial performance, 2019 (£/kg cold deadweight)
Financial performance (£/kg deadweight)
AUS BEL BRA(MT)
BRA(SC) CAN DEN FIN FRA GER GB
(IN)
Feed 0.87 0.80 0.59 0.72 0.60 0.79 0.77 0.83 0.77 0.90
Other variable costs 0.23 0.18 0.12 0.08 0.13 0.19 0.35 0.24 0.27 0.22
Total variable costs 1.09 0.98 0.71 0.80 0.73 0.98 1.12 1.07 1.04 1.12
Labour 0.15 0.06 0.03 0.05 0.11 0.13 0.15 0.12 0.14 0.13
Depreciation and finance 0.28 0.17 0.12 0.10 0.09 0.16 0.22 0.17 0.23 0.18
Total fixed costs 0.43 0.23 0.16 0.15 0.20 0.29 0.37 0.28 0.36 0.30
Total 1.53 1.21 0.87 0.95 0.93 1.27 1.49 1.35 1.40 1.42
GB (OUT) HUN IRE ITA NL SPA SWE USA EU
AVERAGE
Feed 0.91 0.92 0.95 1.07 0.80 0.83 0.93 0.64 0.87
Other variable costs 0.27 0.23 0.23 0.22 0.31 0.22 0.16 0.12 0.24
Total variable costs 1.18 1.15 1.18 1.29 1.11 1.04 1.09 0.76 1.10
Labour 0.14 0.12 0.13 0.15 0.12 0.09 0.15 0.07 0.13
Depreciation and finance 0.13 0.20 0.20 0.22 0.16 0.12 0.29 0.12 0.20
Total fixed costs 0.27 0.32 0.34 0.37 0.29 0.20 0.44 0.19 0.32
Total 1.44 1.47 1.52 1.66 1.40 1.25 1.53 0.95 1.42
Note: Totals may not add up due to rounding.

10
Feed prices and costs
Market developments in 2019/202019 saw a year of two halves regarding feed wheat markets and price. In the UK, a large 16 million tonne harvest and excellent weather conditions through spring saw prices reduce into harvest reaching a low of £129.75 per tonne at the end of August 2019. The UK crop was large enough to push a big volume of exports out of the country and increased the use of feed wheat in animal feed rations at the expense of barley and maize.However, from the end of September 2019 onwards, the feed wheat prices started to rise as rainfall severely disrupted the winter crop plantings for harvest 2020. The rain continued through the winter, leading to feed wheat prices for 2020 reaching a high of £162 per tonne at the end of 2019. This helped the 2019 harvest prices rise even though grain was plentiful.As we moved through 2020, the small wheat crop for the UK was confirmed as being the smallest crop in 40 years. Again, prices continued to move higher and increased from circa £160 per tonne pre-harvest to over £190 per tonne after harvest.Feed barley, however, has seen a varying trend into 2020. Despite harmed wheat plantings, spring barley plantings increased to compensate for the lost area. As such, barley prices have traded at historically large discounts to feed wheat of over £40 per tonne. In 2019, the relationship was more ‘normal’ with a £15-£20 discount. As we moved from 2019 and into 2020, the volume of barley in feed rations increased sharply due to the more competitive prices.For protein meal, soya markets steadily dropped through 2019 as demand was subdued from China, and both South America and the US had favourable harvests. Soya meal prices reduced by 9% over the course of 2019 as a result of the large supply. However, as 2020 progressed, both lower US supply and a huge increase in Chinese demand from a replenishment of their pig herd has increased soya prices. Soya meal prices increased by 34% from August to December in 2020 in response to this demand and do not look likely to reduce amid continued strong Chinese demand.

11
Table 4. Compound-feed prices per tonne (sterling), 2019
Compound-feed prices (£/tonne)
AUS BEL BRA(MT)
BRA(SC) CAN DEN FIN FRA GER GB
(IN)
Sow 232.41 235.22 160.08 178.38 156.77 208.13 217.59 229.99 206.19 225.77
Rearer 317.49 338.85 276.90 385.23 261.09 297.84 292.05 321.45 301.96 288.54
Finisher 213.12 219.57 150.54 201.76 140.24 207.66 182.86 207.25 196.98 237.23
Average farm feed price
230.14 231.83 166.48 212.55 155.07 219.73 202.03 224.21 210.53 244.54
GB (OUT) HUN IRE ITA NL SPA SWE USA EU
AVERAGE
Sow 223.34 220.07 249.08 236.35 235.92 209.91 236.97 156.94 226.21
Rearer 268.57 310.75 349.28 322.13 329.41 359.38 325.03 378.09 315.91
Finisher 237.23 212.72 238.55 225.40 221.39 223.71 212.94 141.31 216.90
Average farm feed price
239.93 221.22 261.07 233.70 233.11 231.33 229.77 162.01 229.51
Table 5. Compound-feed prices per tonne (euro), 2019
Compound-feed prices (€/tonne)
AUS BEL BRA(MT)
BRA(SC) CAN DEN FIN FRA GER GB
(IN)
Sow 265.00 268.20 182.52 203.39 178.75 237.32 248.10 262.24 235.10 257.43
Rearer 362.00 386.36 315.72 439.24 297.70 339.60 333.00 366.52 344.30 329.00
Finisher 243.00 250.36 171.65 230.05 159.90 236.78 208.50 236.31 224.60 270.49
Average farm feed price
262.40 264.33 189.82 242.35 176.81 250.54 230.36 255.65 240.04 278.76
GB (OUT) HUN IRE ITA NL SPA SWE USA EU
AVERAGE
Sow 254.65 250.93 284.00 269.49 269.00 239.34 270.20 178.94 257.93
Rearer 306.22 354.32 398.25 367.30 375.60 409.77 370.60 431.10 360.20
Finisher 270.49 242.55 272.00 257.00 252.43 255.08 242.80 161.12 247.31
Average farm feed price
273.57 252.23 297.67 266.47 265.79 263.77 261.98 184.73 261.68

12
Summary of financial performance
The impact on pig producers’ feed costs in 2019With fluctuating feed prices in 2019, the overall average farm feed price for EU members of InterPIG decreased (in sterling terms) by an average of 2% compared with the previous year. There was a range of feed prices across the EU countries, with a difference of £59 per tonne between the highest and lowest average farm feed price in 2019.
-15.0
-10.0
-5.0
0
5.0
10.0
FIN ITA BEL
SWEFRADENUSA BRA(MT)
+0GERGB
(IN)IRE
-1
SPA
-0
BRA(SC)
GB(OUT)
NLHUN
AUS CAN
% c
hang
e 20
18/2
019 +7 +6 +6
+4 +4
+1
-13
-5-5-4-4-4-4-2-2
Figure 2. Changes in feed costs, 2019
The impact of feed prices on the feed cost per kg is also affected by physical performance. As shown in Figure 2, the mixture of physical performance and feed prices resulted in varying impacts on feed costs in the InterPIG countries. The USA had an overall 7% increase in feed costs per kg, while Canada saw a 13% decrease. Within the EU countries, overall 2019 feed costs decreased on average by less than 1% compared with 2018.
0.00
0.20
0.40
0.60
0.80
1.00
1.20
£/kg
2018 2019
BRA(MT)
CAN USA BRA(SC)
GER FIN DEN NL BEL SPA FRA AUS GB(IN)
GB(OUT)
HUN SWE IRE ITA
0.60 0.
64
0.69
0.60
0.59
0.59
0.81
0.770.
800.
77
0.75
0.72
0.84
0.80
0.77 0.
80
0.75 0.
79
0.89
0.87
0.80 0.
83
0.83
0.83
0.95
0.910.92
0.90
0.96
0.95
1.12
1.07
0.92 0.93
0.87 0.
92
Figure 3. Feed costs, 2019
13
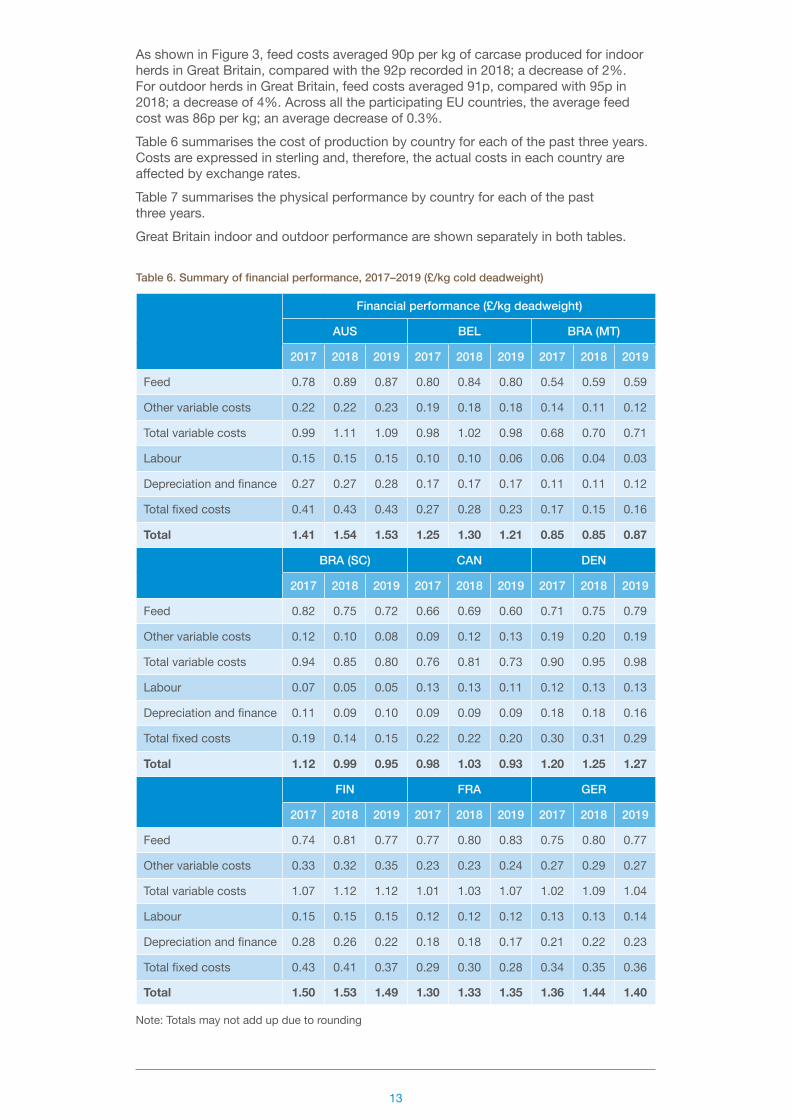
As shown in Figure 3, feed costs averaged 90p per kg of carcase produced for indoor herds in Great Britain, compared with the 92p recorded in 2018; a decrease of 2%. For outdoor herds in Great Britain, feed costs averaged 91p, compared with 95p in 2018; a decrease of 4%. Across all the participating EU countries, the average feed cost was 86p per kg; an average decrease of 0.3%.Table 6 summarises the cost of production by country for each of the past three years. Costs are expressed in sterling and, therefore, the actual costs in each country are affected by exchange rates. Table 7 summarises the physical performance by country for each of the past three years.Great Britain indoor and outdoor performance are shown separately in both tables.
Table 6. Summary of financial performance, 2017–2019 (£/kg cold deadweight)
Financial performance (£/kg deadweight)
AUS BEL BRA (MT)
2017 2018 2019 2017 2018 2019 2017 2018 2019
Feed 0.78 0.89 0.87 0.80 0.84 0.80 0.54 0.59 0.59
Other variable costs 0.22 0.22 0.23 0.19 0.18 0.18 0.14 0.11 0.12
Total variable costs 0.99 1.11 1.09 0.98 1.02 0.98 0.68 0.70 0.71
Labour 0.15 0.15 0.15 0.10 0.10 0.06 0.06 0.04 0.03
Depreciation and finance 0.27 0.27 0.28 0.17 0.17 0.17 0.11 0.11 0.12
Total fixed costs 0.41 0.43 0.43 0.27 0.28 0.23 0.17 0.15 0.16
Total 1.41 1.54 1.53 1.25 1.30 1.21 0.85 0.85 0.87
BRA (SC) CAN DEN
2017 2018 2019 2017 2018 2019 2017 2018 2019
Feed 0.82 0.75 0.72 0.66 0.69 0.60 0.71 0.75 0.79
Other variable costs 0.12 0.10 0.08 0.09 0.12 0.13 0.19 0.20 0.19
Total variable costs 0.94 0.85 0.80 0.76 0.81 0.73 0.90 0.95 0.98
Labour 0.07 0.05 0.05 0.13 0.13 0.11 0.12 0.13 0.13
Depreciation and finance 0.11 0.09 0.10 0.09 0.09 0.09 0.18 0.18 0.16
Total fixed costs 0.19 0.14 0.15 0.22 0.22 0.20 0.30 0.31 0.29
Total 1.12 0.99 0.95 0.98 1.03 0.93 1.20 1.25 1.27
FIN FRA GER
2017 2018 2019 2017 2018 2019 2017 2018 2019
Feed 0.74 0.81 0.77 0.77 0.80 0.83 0.75 0.80 0.77
Other variable costs 0.33 0.32 0.35 0.23 0.23 0.24 0.27 0.29 0.27
Total variable costs 1.07 1.12 1.12 1.01 1.03 1.07 1.02 1.09 1.04
Labour 0.15 0.15 0.15 0.12 0.12 0.12 0.13 0.13 0.14
Depreciation and finance 0.28 0.26 0.22 0.18 0.18 0.17 0.21 0.22 0.23
Total fixed costs 0.43 0.41 0.37 0.29 0.30 0.28 0.34 0.35 0.36
Total 1.50 1.53 1.49 1.30 1.33 1.35 1.36 1.44 1.40
Note: Totals may not add up due to rounding
14
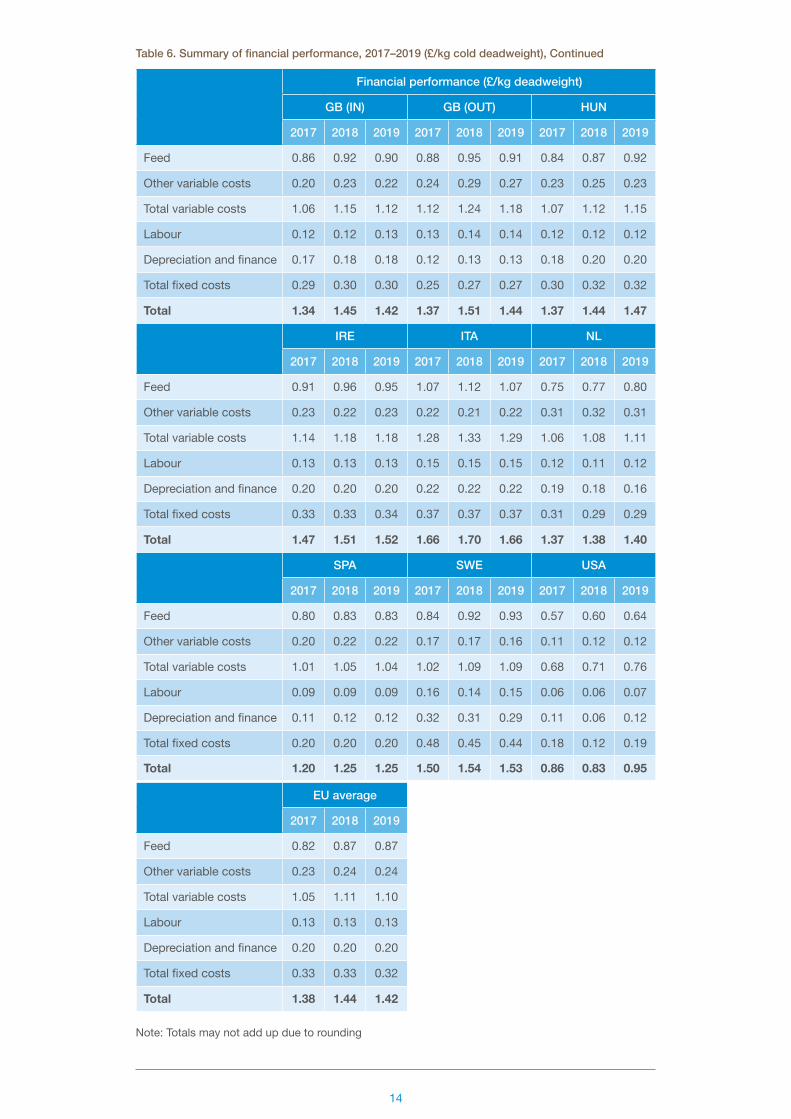
Table 6. Summary of financial performance, 2017–2019 (£/kg cold deadweight), Continued
Financial performance (£/kg deadweight)
GB (IN) GB (OUT) HUN
2017 2018 2019 2017 2018 2019 2017 2018 2019
Feed 0.86 0.92 0.90 0.88 0.95 0.91 0.84 0.87 0.92
Other variable costs 0.20 0.23 0.22 0.24 0.29 0.27 0.23 0.25 0.23
Total variable costs 1.06 1.15 1.12 1.12 1.24 1.18 1.07 1.12 1.15
Labour 0.12 0.12 0.13 0.13 0.14 0.14 0.12 0.12 0.12
Depreciation and finance 0.17 0.18 0.18 0.12 0.13 0.13 0.18 0.20 0.20
Total fixed costs 0.29 0.30 0.30 0.25 0.27 0.27 0.30 0.32 0.32
Total 1.34 1.45 1.42 1.37 1.51 1.44 1.37 1.44 1.47
IRE ITA NL
2017 2018 2019 2017 2018 2019 2017 2018 2019
Feed 0.91 0.96 0.95 1.07 1.12 1.07 0.75 0.77 0.80
Other variable costs 0.23 0.22 0.23 0.22 0.21 0.22 0.31 0.32 0.31
Total variable costs 1.14 1.18 1.18 1.28 1.33 1.29 1.06 1.08 1.11
Labour 0.13 0.13 0.13 0.15 0.15 0.15 0.12 0.11 0.12
Depreciation and finance 0.20 0.20 0.20 0.22 0.22 0.22 0.19 0.18 0.16
Total fixed costs 0.33 0.33 0.34 0.37 0.37 0.37 0.31 0.29 0.29
Total 1.47 1.51 1.52 1.66 1.70 1.66 1.37 1.38 1.40
SPA SWE USA
2017 2018 2019 2017 2018 2019 2017 2018 2019
Feed 0.80 0.83 0.83 0.84 0.92 0.93 0.57 0.60 0.64
Other variable costs 0.20 0.22 0.22 0.17 0.17 0.16 0.11 0.12 0.12
Total variable costs 1.01 1.05 1.04 1.02 1.09 1.09 0.68 0.71 0.76
Labour 0.09 0.09 0.09 0.16 0.14 0.15 0.06 0.06 0.07
Depreciation and finance 0.11 0.12 0.12 0.32 0.31 0.29 0.11 0.06 0.12
Total fixed costs 0.20 0.20 0.20 0.48 0.45 0.44 0.18 0.12 0.19
Total 1.20 1.25 1.25 1.50 1.54 1.53 0.86 0.83 0.95
EU average
2017 2018 2019
Feed 0.82 0.87 0.87
Other variable costs 0.23 0.24 0.24
Total variable costs 1.05 1.11 1.10
Labour 0.13 0.13 0.13
Depreciation and finance 0.20 0.20 0.20
Total fixed costs 0.33 0.33 0.32
Total 1.38 1.44 1.42
Note: Totals may not add up due to rounding

15
Net margins in Great BritainThe net margins shown in Figure 4 are based on the difference between the monthly price and the estimated total cost of producing pig meat (including depreciation costs) for an average producer. The results shown in the chart should only be considered as indicative of general trends because:
● Physical and financial performance levels can vary greatly between producers ● The assumptions used for feed costs using spot compound prices will not apply
to all producers, due to the range of feed procurement strategies in the industry ● There are various rearing and finishing production systems for weaned piglets,
including fully slatted, semi-slatted, straw barns and outdoor optionsThe monthly price used to calculate net margins for indoor-bred pigs is the SPP (Standard Pig Price) and the monthly price used to calculate net margins for outdoor-bred pigs is the APP (All Pig Price). Therefore, these differ from the overall UK Reference Price and explain why indoor-bred and outdoor-bred pigs had a different experience in 2019 to what may be concluded from overall figures.Details of these prices can be found on the AHDB website.
-13
-8
-3
+2
+7
+12
+17
2012 201820172016201520142013 2019
-£5
-£8
£3
-£1
£12
£9
-£3-£4
-£1 -£1
£13 £14
-£4-£6
-£0
£1
£/he
ad
Indoor Outdoor
Figure 4. Estimated net margins in Great Britain, 2012–2019
The volatility of net margin returns for pig producers in Great Britain is clearly illustrated in the above chart. From 2012–2019 inclusive, indoor and outdoor pig producers achieved positive margins in only three out of the eight years.During prolonged periods of negative margins, specialist pig producers with no other farm enterprises or farm diversification are particularly vulnerable and may leave the industry. Many producers make little or no investment during these periods and some depopulate for a period of time.Annual averages can mask volatility within years.In 2014, early higher pig prices were followed by declining prices, resulting in a negative margin in the last month of 2014 and a positive average margin overall. With lower feed costs but continued declining prices, 2015 resulted in an average negative margin for both indoor and outdoor pig producers. In 2016, low prices in the first seven months of the year resulted in negative margins estimated at up to £12 per pig for indoor and outdoor producers. During the rest of 2016, rising prices covered increasing feed costs, with the end of 2016 resulting in positive net margins estimated at around £14 per pig for indoor producers and £13 for outdoor producers. This resulted in an overall small negative margin for 2016. In 2017, despite an increase in the cost of production, rising pig prices resulted in healthy margins throughout the year.

16
In 2018, the combination of increasing costs of production and lower pork prices resulted in significantly lower, but still positive, net margins for indoor producers in the first half of 2018. However, outdoor producers went into negative margins after the first quarter. The following negative margins estimated at up to £10 per pig for both indoor and outdoor producers resulted in negative margins on average for the year.The start of 2019, with still relatively high feed prices and low pig prices, was challenging, resulting in estimated negative margins in the first quarter of up to £16 per pig for indoor and £13 per pig for outdoor pig producers. Falling feed prices, improved performance and rising pig prices turned this around, with the second half of 2019 returning positive margins of up to £12 per pig for both indoor and outdoor pig producers. For 2019 as a whole, estimates for indoor pig producers show them breaking even overall, just dipping into a small negative margin. Overall estimates for outdoor pig producers indicate they achieved a small positive margin of nearly £1 per pig.At the start of 2020, both indoor and outdoor pig producers were achieving positive margins estimated at £13 per pig. Pig prices continued to increase until August and then prices declined month on month for the rest of 2020, hitting a low in December 2020. For indoor pig producers, standard pig prices fell by 8% from January to December 2020. For outdoor pig producers attracting a premium, prices fell by 6% over the same period. Even though there was a continued improvement in physical performance within the industry during 2020, there were fluctuating feed prices and, together with the fall in pig prices, it is estimated that both indoor and outdoor pig producers started experiencing negative margins by the last quarter of 2020.

17
Physical performance summary
Table 7. Summary of physical performance, 2017–2019
Physical performance
AUS BEL BRA (MT)
2017 2018 2019 2017 2018 2019 2017 2018 2019
Pigs weaned/sow/year 24.90 24.79 25.27 29.83 29.63 28.97 27.40 28.71 28.34
Pigs reared/sow/year 24.15 24.19 24.51 28.64 28.30 27.72 26.86 27.85 27.49
Pigs sold/sow/year 23.71 23.72 24.04 27.75 27.31 26.83 26.27 27.15 26.80
Litters/sow/year 2.29 2.29 2.29 2.34 2.34 2.27 2.41 2.43 2.41
Rearing mortality (%) 3.00 2.40 3.00 4.00 4.50 4.30 2.00 3.00 3.00
Finishing mortality (%) 1.81 1.96 1.90 3.10 3.50 3.20 2.20 2.50 2.50
Finishing daily liveweight gain (g/day) 810 805 810 694 700 701 831 880 880
Finishing feed conversion ratio 2.86 2.87 2.88 2.76 2.78 2.74 2.60 2.50 2.50
Average liveweight at slaughter (kg) 121 121 122 116 116 116 120 110 110
Average carcase weight – cold (kg) 94.7 95.0 95.1 94.4 95.7 96.3 89.3 82.0 82.0
Carcase meat production/sow/year (kg) 2,245 2,252 2,286 2,620 2,615 2,585 2,346 2,226 2,197
BRA (SC) CAN DEN
2017 2018 2019 2017 2018 2019 2017 2018 2019
Pigs weaned/sow/year 27.72 27.87 28.09 25.68 25.34 25.34 33.29 33.57 33.60
Pigs reared/sow/year 27.17 27.27 27.48 25.17 24.83 24.83 32.26 32.49 32.39
Pigs sold/sow/year 26.35 26.66 26.87 24.29 23.96 23.96 31.26 31.42 31.29
Litters/sow/year 2.33 2.33 2.32 2.30 2.30 2.30 2.28 2.26 2.26
Rearing mortality (%) 2.00 2.16 2.16 2.00 2.00 2.00 3.10 3.20 3.60
Finishing mortality (%) 3.00 2.25 2.25 3.50 3.50 3.50 3.10 3.30 3.40
Finishing daily liveweight gain (g/day) 820 827 827 876 876 876 971 975 991
Finishing feed conversion ratio 2.60 2.44 2.44 3.00 3.00 3.00 2.66 2.63 2.63
Average liveweight at slaughter (kg) 122 121 120 127 128 130 114 113 115
Average carcase weight – cold (kg) 90.7 90.1 89.3 100.0 100.8 101.8 85.8 86.0 86.6
Carcase meat production/sow/year (kg) 2,390 2,401 2,400 2,428 2,415 2,438 2,683 2,704 2,711

18
Table 7. Summary of physical performance, 2017–2019, Continued
Physical performance
FIN FRA GER
2017 2018 2019 2017 2018 2019 2017 2018 2019
Pigs weaned/sow/year 27.13 27.46 28.47 28.05 28.49 29.37 29.66 30.10 29.95
Pigs reared/sow/year 26.51 26.80 27.79 27.28 27.69 28.55 28.74 29.22 28.99
Pigs sold/sow/year 25.77 26.07 27.04 26.26 26.62 27.47 27.96 28.49 28.21
Litters/sow/year 2.23 2.23 2.25 2.34 2.34 2.35 2.33 2.32 2.30
Rearing mortality (%) 2.30 2.40 2.40 2.74 2.81 2.79 3.10 2.90 3.20
Finishing mortality (%) 2.80 2.70 2.70 3.74 3.89 3.80 2.70 2.50 2.70
Finishing daily liveweight gain (g/day) 970 980 972 803 803 812 832 842 849
Finishing feed conversion ratio 2.70 2.70 2.70 2.77 2.75 2.75 2.81 2.79 2.78
Average liveweight at slaughter (kg) 121 122 123 120 120 121 122 122 122
Average carcase weight – cold (kg) 90.3 90.7 91.5 91.9 92.0 92.4 94.2 94.6 94.5
Carcase meat production/sow/year (kg) 2,326 2,365 2,473 2,414 2,448 2,538 2,634 2,695 2,665
GB (IN) GB (OUT) HUN
2017 2018 2019 2017 2018 2019 2017 2018 2019
Pigs weaned/sow/year 26.97 27.35 27.35 23.95 23.22 24.12 25.47 25.74 27.77
Pigs reared/sow/year 25.96 26.24 26.28 23.05 22.28 23.17 24.99 25.25 27.24
Pigs sold/sow/year 25.23 25.41 25.45 22.41 21.57 22.44 24.00 24.32 26.57
Litters/sow/year 2.30 2.28 2.28 2.28 2.20 2.25 2.25 2.31 2.36
Rearing mortality (%) 3.78 4.06 3.93 3.78 4.06 3.93 1.90 1.90 1.90
Finishing mortality (%) 2.79 3.19 3.16 2.79 3.19 3.16 3.96 3.68 2.47
Finishing daily liveweight gain (g/day) 833 866 860 833 866 860 710 696 700
Finishing feed conversion ratio 2.86 2.79 2.68 2.86 2.79 2.68 3.04 3.14 3.18
Average liveweight at slaughter (kg) 110 110 110 109 109 110 111 109 115
Average carcase weight – cold (kg) 83.6 83.6 84.3 83.0 83.1 84.1 87.6 86.1 91.0
Carcase meat production/sow/year (kg) 2,110 2,123 2,145 1,859 1,793 1,887 2,103 2,094 2,418

19
Table 7. Summary of physical performance, 2017–2019, Continued
Physical performance
IRE ITA NL
2017 2018 2019 2017 2018 2019 2017 2018 2019
Pigs weaned/sow/year 28.45 28.48 28.56 24.77 25.08 24.85 30.25 30.55 30.10
Pigs reared/sow/year 27.62 27.65 27.73 23.75 23.93 23.80 29.49 29.76 29.38
Pigs sold/sow/year 27.01 26.98 26.99 23.15 23.33 23.20 28.78 29.01 28.68
Litters/sow/year 2.36 2.34 2.28 2.25 2.24 2.22 2.36 2.35 2.33
Rearing mortality (%) 2.91 2.90 2.89 4.13 4.60 4.25 2.50 2.60 2.40
Finishing mortality (%) 2.21 2.43 2.67 2.50 2.50 2.50 2.40 2.50 2.40
Finishing daily liveweight gain (g/day) 866 885 904 687 690 694 822 829 847
Finishing feed conversion ratio 2.66 2.72 2.68 3.75 3.74 3.71 2.58 2.56 2.56
Average liveweight at slaughter (kg) 111 113 114 168 170 170 121 121 122
Average carcase weight – cold (kg) 82.9 84.5 85.9 135.0 136.6 136.6 94.1 94.4 95.4
Carcase meat production/sow/year (kg) 2,240 2,279 2,320 3,126 3,187 3,169 2,708 2,738 2,737
SPA SWE USA
2017 2018 2019 2017 2018 2019 2017 2018 2019
Pigs weaned/sow/year 26.98 27.45 27.58 26.62 26.83 27.16 26.43 26.80 27.91
Pigs reared/sow/year 25.99 26.18 26.15 26.09 26.29 26.62 25.32 25.70 26.79
Pigs sold/sow/year 25.06 25.19 25.06 25.67 25.82 26.17 24.15 24.54 25.53
Litters/sow/year 2.31 2.31 2.30 2.24 2.23 2.23 2.44 2.44 2.47
Rearing mortality (%) 3.69 4.63 5.20 2.00 2.00 2.00 4.20 4.10 4.00
Finishing mortality (%) 3.56 3.80 4.14 1.60 1.80 1.70 4.64 4.54 4.70
Finishing daily liveweight gain (g/day) 701 726 742 947 946 948 857 860 854
Finishing feed conversion ratio 2.46 2.48 2.48 2.87 2.85 2.86 2.71 2.68 2.73
Average liveweight at slaughter (kg) 110 112 115 122 124 123 127 127 128
Average carcase weight – cold (kg) 83.0 84.5 86.7 89.8 90.6 89.8 94.7 92.9 93.5
Carcase meat production/sow/year (kg) 2,081 2,129 2,174 2,304 2,338 2,349 2,287 2,280 2,387

20
Pigs weaned per sow per yearThe overall average number of pigs weaned per sow per year in the EU InterPIG countries showed a 1% increase in 2019, up from 28.1 in 2018 to 28.4 in 2019. As shown in Figure 5, performance continued to improve in many EU countries, with Great Britain’s outdoor herds showing an increase of 4% compared with 2018, making up for the decrease in 2017. Denmark and the Netherlands had the best results for pigs weaned, with Denmark yet again achieving an average of over 33 pigs weaned per sow per year. The non-EU countries continued to perform below the EU average.Excluding Great Britain’s outdoor herds, there is a difference of 8.7 pigs weaned per sow per year between the worst-performing EU InterPIG country (Italy at 24.9) and the best-performing country (Denmark at 33.6).The number of pigs weaned per sow per year in Great Britain indoor herds was the same in 2018 and 2019 at 27.4. Great Britain’s outdoor herds bounced back from the weather effect in 2018, with an increase of 4% to 24.1, compared with 23.2 in 2018.While Great Britain has a significant proportion of sows kept outdoors, the lower number of pigs weaned per sow per year in all systems is still a major cause of the relatively high cost of production compared with many other EU countries, and needs to be addressed if Great Britain want to be competitive with the rest of Europe.Pigs weaned per sow per year is a result of three different elements: pigs born alive per litter, litters per sow per year and pre-weaning mortality.
● Great Britain’s indoor herds averaged 2.28 litters per sow per year, the same as 2018. Outdoor herds averaged 2.25, compared with 2.20 in 2018. The EU average is 2.28, with a variation between countries ranging from 2.22 (Italy) to the highest at 2.36 (Hungary
● Pre-weaning mortality (indoor sows 11.6%; outdoor sows 12.3%) was similar to 2018 and lower than the EU average of 13.2%
● A significant impact on pigs weaned per sow per year in Great Britain is the number of pigs born alive per litter. The 2019 average for indoor sows, at 13.6, was the same as the previous year. With 12.2, outdoor sows increased slightly from 12.1 in 2018. The 2018 average for participating EU countries was 14.4.
Table 7. Summary of physical performance, 2017–2019, Continued
Physical performance
EU average
2017 2018 2019
Pigs weaned/sow/year 27.60 27.77 28.08
Pigs reared/sow/year 26.75 26.88 27.17
Pigs sold/sow/year 26.00 26.09 26.39
Litters/sow/year 2.30 2.29 2.28
Rearing mortality (%) 3.07 3.21 3.27
Finishing mortality (%) 2.79 2.92 2.85
Finishing daily liveweight Gain (g/day) 820 829 835
Finishing feed conversion ratio 2.83 2.83 2.81
Average liveweight at slaughter (kg) 120 120 121
Average carcase weight – cold (kg) 92.2 92.7 93.6
Carcase meat production/sow/year (kg) 2,389 2,411 2,461

21
17 18 19 20 21 22 23 24 25 26 27 28 29 30 31 32 33 34 35
Pigs
wea
ned
per s
ow
2018 2019
GB(OUT)
ITA AUS CAN SWE GB(IN)
SPA HUN USA BRA(SC)
BRA(MT)
FIN IRE BEL FRA GER NL DEN
24.8
25
.3
25.1
24.9
23.2
24.1
27.4
27
.4
26.8 27
.2
25.3
25
.3
26.8
27.9
25.7
27.8
27.5
27.6
27.5
28.5
28.7
28.3
27.9
28
.1
29.6
29.0
28.5
28
.6
30.6
30.1
33.6
33.6
30.1
29.9
28.5 29
.4
Figure 5. Pigs weaned per sow per year, 2018–2019
Pigs finished per sow per yearAs shown in Figure 6, the average number of pigs finished per sow in Great Britain was maintained at 25.4 in 2019. For outdoor sows, pigs finished per sow per year increased in 2019 by 4% to 22.4, compared with 21.6 in 2018.In 2019, the EU average for pigs finished per sow per year was 26.7 – 1% higher than in 2018. Denmark still has the highest numbers, finishing more than 31 pigs per sow per year. Within the InterPIG group, Great Britain outdoor herds have the lowest number of pigs finished per sow per year in 2019.
Figure 6. Estimated net margins in Great Britain, 2012–2019
17 16
18 19 20 21 22 23 24 25 26 27 28 29 30 31 32 33 34 35
Pigs
fini
shed
per
sow
2018 2019
24.0
24.0
23.3
23.2
21.6 22
.4
25.4
25.4
25.2
25.1
23.7
24
.0 24.3
26.6
25.8 26
.2
24.5
25.5
26.7 26.927
.326
.827.2
26.8
26.1 27
.0
27.0
27
.0
29.0
28.7
31.4
31.3
28.5
28.2
26.6 27
.5
GB(OUT)
ITA CAN AUS SPA GB(IN)
USA SWE HUN BRA(MT)
BEL BRA(SC)
IRE FIN FRA GER NL DEN
22
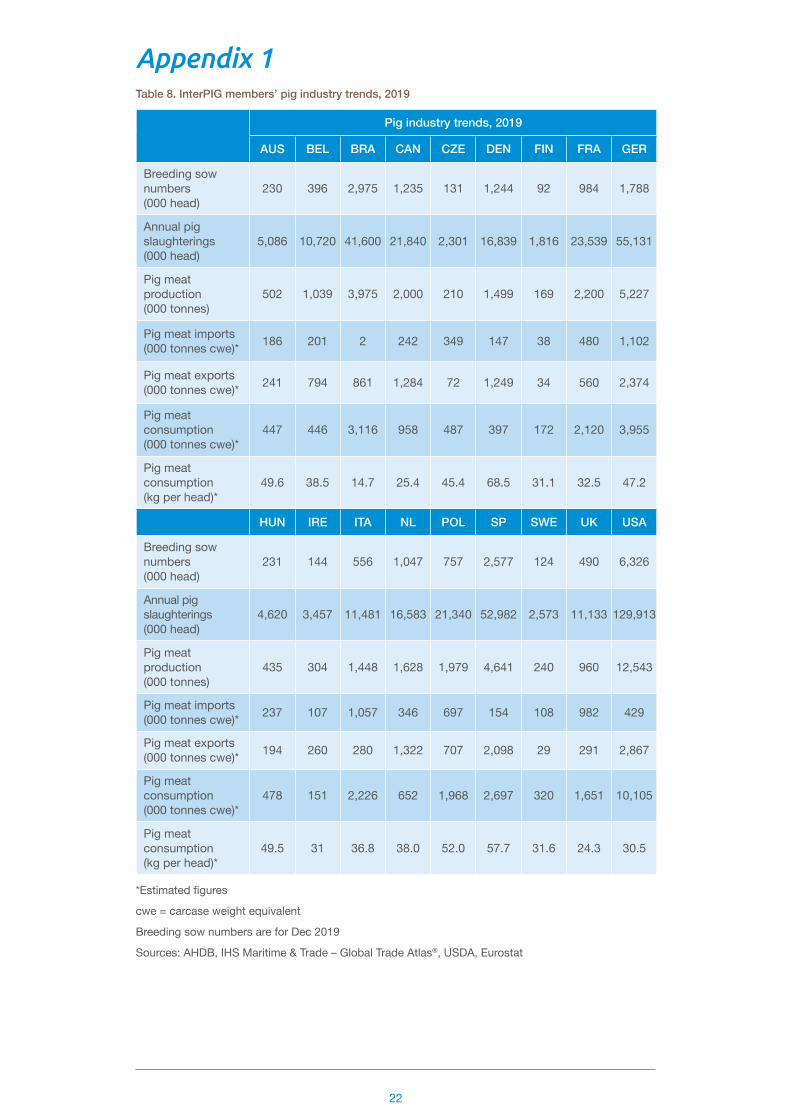
Table 8. InterPIG members’ pig industry trends, 2019
Pig industry trends, 2019
AUS BEL BRA CAN CZE DEN FIN FRA GER
Breeding sow numbers (000 head)
230 396 2,975 1,235 131 1,244 92 984 1,788
Annual pig slaughterings(000 head)
5,086 10,720 41,600 21,840 2,301 16,839 1,816 23,539 55,131
Pig meat production(000 tonnes)
502 1,039 3,975 2,000 210 1,499 169 2,200 5,227
Pig meat imports(000 tonnes cwe)* 186 201 2 242 349 147 38 480 1,102
Pig meat exports(000 tonnes cwe)* 241 794 861 1,284 72 1,249 34 560 2,374
Pig meat consumption(000 tonnes cwe)*
447 446 3,116 958 487 397 172 2,120 3,955
Pig meat consumption(kg per head)*
49.6 38.5 14.7 25.4 45.4 68.5 31.1 32.5 47.2
HUN IRE ITA NL POL SP SWE UK USA
Breeding sow numbers (000 head)
231 144 556 1,047 757 2,577 124 490 6,326
Annual pig slaughterings(000 head)
4,620 3,457 11,481 16,583 21,340 52,982 2,573 11,133 129,913
Pig meat production(000 tonnes)
435 304 1,448 1,628 1,979 4,641 240 960 12,543
Pig meat imports(000 tonnes cwe)* 237 107 1,057 346 697 154 108 982 429
Pig meat exports(000 tonnes cwe)* 194 260 280 1,322 707 2,098 29 291 2,867
Pig meat consumption(000 tonnes cwe)*
478 151 2,226 652 1,968 2,697 320 1,651 10,105
Pig meat consumption(kg per head)*
49.5 31 36.8 38.0 52.0 57.7 31.6 24.3 30.5
*Estimated figures
cwe = carcase weight equivalent
Breeding sow numbers are for Dec 2019
Sources: AHDB, IHS Maritime & Trade – Global Trade Atlas®, USDA, Eurostat
Appendix 1

23
Additional tables and figuresLabels on bar charts are rounded and may indicate the same results when the bars do not appear equal.
Table 9. Ranking of EU production costs, 2014–2019
Ranking of EU production costs
2014 2015 2016 2017 2018 2019 % of EU average
Belgium 3 2 2 3 3 1 85.0
Spain 1 1 1 2 1 2 87.5
Denmark 2 3 3 1 2 3 89.3
France 4 4 4 4 4 4 95.0
Netherlands 5 6 8 9 5 5 98.0
Germany 6 5 6 6 7 6 98.4
GB (IN) 7 10 5 5 8 7 99.6
GB (OUT) 9 13 7 7 9 8 101.3
Hungary 12 14 10 8 6 9 103.4
Finland 11 8 12 12 11 10 104.7
Ireland 10 9 9 11 10 11 106.4
Austria 8 7 11 10 13 12 107.3
Sweden 13 11 13 13 12 13 107.6
Italy 14 12 14 14 14 14 116.3
Note: Rankings – 1 = lowest cost; 14 = highest cost

24
UK
penc
e
Jan-14 Jan-15 Jan-19Jan-18Jan-17Jan-16 Jan-20
Euro
65
70
75
80
85
90
95
UK
penc
eU
K pe
nce
Jan-14 Jan-15 Jan-19Jan-18Jan-17Jan-16 Jan-20
US Dollar
55
60
65
70
75
80
85
UK
penc
eU
K pe
nce
Jan-14 Jan-15 Jan-19Jan-18Jan-17Jan-16 Jan-20
Canadian dollar
45
50
55
60
65
70
75
UK
penc
e
Brazilian real
Jan-13 Jan-14 Jan-18Jan-17Jan-16Jan-15 Jan-19
25
20
15
10
UK
penc
e
Figure 7. Exchange rate movements, 2014–2020

25
Figure 8. Depreciation and finance costs, 2018–2019
£/kg
2018 2019
0.12
0.12
0.9 0.
10
0.09
0.09
0.13
0.13
0.12
0.12
0.11 0.
12
0.18
0.170.
180.
16
0.18
0.16
0.20
0.20
0.18
0.18
0.17
0.17
0.22
0.22
0.20
0.20
0.27 0.
28
0.31
0.29
0.22 0.
23
0.26
0.22
0.00
0.05
0.10
0.15
0.20
0.25
0.30
0.35
CAN BRA(SC)
SPA BRA(MT)
USA GB(OUT)
DEN NL FRA BEL GB(IN)
HUN IRE ITA FIN GER AUS SWE
Table 10. Annual exchange rates
Year 1€ = € to £ $US to £ $C to £ Real to £
2014 80.6p 1.24 1.65 1.82 3.87
2015 72.6p 1.38 1.53 1.95 5.01
2016 81.9p 1.22 1.35 1.79 4.66
2017 87.6p 1.14 1.29 1.67 4.11
2018 88.5p 1.13 1.33 1.73 4.86
2019 88.0p 1.14 1.27 1.69 5.00
26
gram
s/da
y
2018 2019
500
550
600
650
700
750
800
850
900
950
1,000
HUN BEL SPA AUS FRA BRA(SC)
NL GER USA GB(IN)
GB(OUT)
CAN BRA(MT)
IRE SWE FIN DENITA
700
701
696
700
690
694
803 81
2
805
810
726 74
2
842 849
829 84
7
827
827
866
860866
860
860
854
880
880
876
876
980
972
975 99
1
946
948
885 90
4
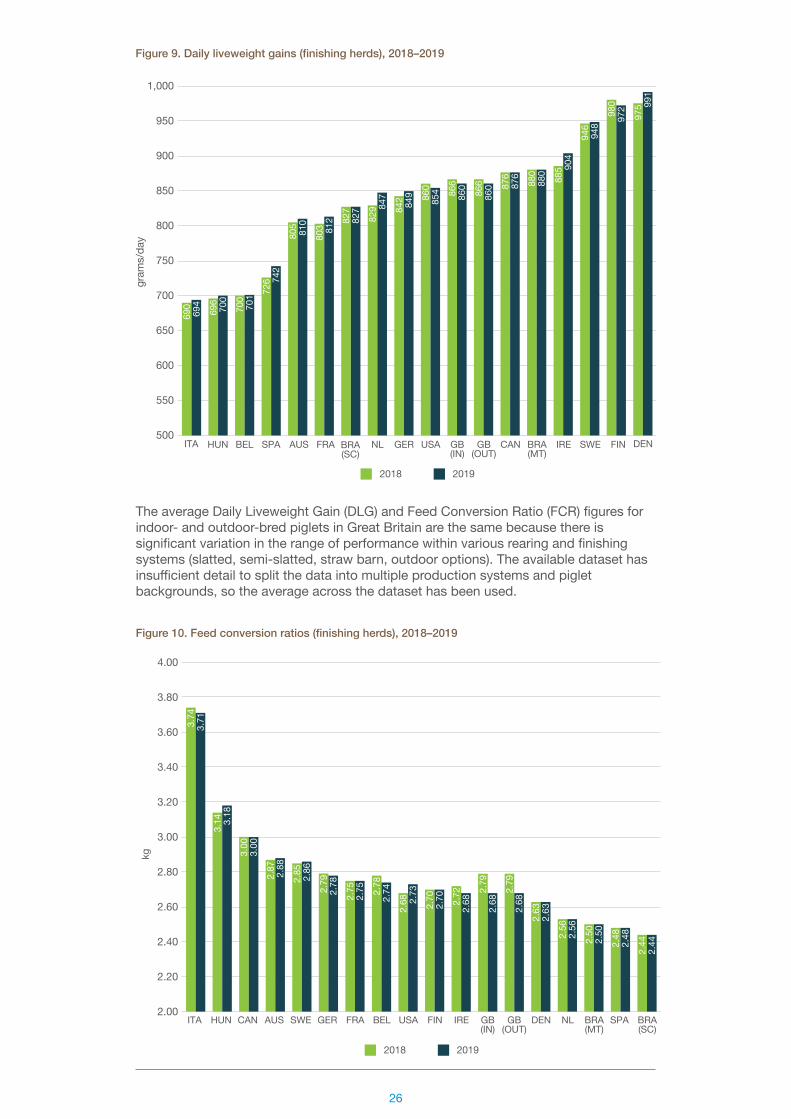
Figure 9. Daily liveweight gains (finishing herds), 2018–2019
The average Daily Liveweight Gain (DLG) and Feed Conversion Ratio (FCR) figures for indoor- and outdoor-bred piglets in Great Britain are the same because there is significant variation in the range of performance within various rearing and finishing systems (slatted, semi-slatted, straw barn, outdoor options). The available dataset has insufficient detail to split the data into multiple production systems and piglet backgrounds, so the average across the dataset has been used.
2018 2019
3.00
3.
00 3.
14
3.18
3.74
3.71
2.79
2.782.
85 2.862.87 2.88
2.68 2.
732.78
2.742.75
2.75 2.
792.
682.72
2.682.70
2.70
2.63
2.63
2.79
2.68
2.48
2.48
2.44
2.442.
502.
502.56
2.56
2.00
2.20
2.40
2.60
2.80
3.00
3.20
3.40
3.60
3.80
4.00
ITA HUN CAN AUS SWE GER FRA BEL USA FIN IRE GB(IN)
GB(OUT)
DEN NL BRA(MT)
SPA BRA(SC)
kg
Figure 10. Feed conversion ratios (finishing herds), 2018–2019

27
kg/s
ow
2018 2019
2,12
92,
174
2,12
32,
145
1,79
3 1,88
7
2,27
92,
320
2,25
22,
286
2,22
62,
197
2,40
12,
400
2,28
0 2,38
7
2,33
82,
349
2,36
5 2,47
3
2,41
52,
438
2,09
42,
418
2,61
52,
585
2,44
8 2,53
8
2,73
82,
737
3,18
73,
169
2,70
42,
711
2,69
52,
665
1,200
1,400
1,600
1,800
2,000
2,200
2,400
2,600
2,800
3,000
3,200
3,400
GB(OUT)
GB(IN)
SPA BRA(MT)
AUS IRE SWE USA BRA(SC)
HUN CAN FIN FRA BEL GER DEN NL ITA
Figure 11. Carcase meat production per sow per year, 2018–2019
Standardising the physical results
MethodologyThere is a wide variation in physical performance measures reported by InterPIG countries. Some of these variations could be due to differences between countries in the weight of animals produced. Other things being equal, an increase in slaughter weights and the length of time an animal is in the system will lead to a worsening in both the marginal daily liveweight gain (DLG) and the marginal feed conversion ratio (FCR).Using methodology created by our French InterPIG partner ITP, the figures have been standardised on the basis of three weights:
● Transfer from breeding unit to rearing unit: 8 kg (GB (IN) = 7.1; GB (OUT) = 7.5 kg in 2019)
● Transfer from rearing unit to finishing unit: 30 kg (GB = 36.5 kg in 2019) ● Liveweight at slaughter: 120 kg (GB (IN) = 110.5; GB (OUT) = 110.3 kg in 2019)
This section examines the adjustments made to the finishing FCR and DLG figures in the European InterPIG countries, to exclude the differences caused by variations in national transfer and slaughter weights.

28
Live
wei
ght g
ains
(gra
ms/
day)
Actual Standardised
500
550
600
650
700
750
800
850
900
950
1,000
880
864
701
79181
0 825
991
954
876 89
5
827
821
849 855
812
812
972
931
700
747
860
833
860
833
694
819
904
863
948
883
854
821
742 76
0
847
873
AUS BEL BRA(MT)
BRA(SC)
CAN DEN FIN FRA GER GB(IN)
GB(OUT)
HUN IRE ITA NL SPA SWE USA
Figure 12. Standardised daily liveweight gains (finishing herds), 2019
Feed
con
vers
ion
ratio
s
Actual Standardised
2.50
2.
76
2.74
2.52
2.88
2.76
2.63
2.
79
3.00
2.
86
2.44
2.
65
2.78
2.742.75
2.
75
2.70
2.82
3.18
3.17
2.68 2.
75
2.68 2.
75
3.71
3.00
2.68
2.76
2.86
3.08
2.73
2.96
2.48
2.
73
2.56
2.
55
AUS BEL BRA(MT)
BRA(SC)
CAN DEN FIN FRA GER GB(IN)
GB(OUT)
HUN IRE ITA NL SPA SWE USA 2.0
2.2
2.4
2.6
2.8
3.0
3.2
3.4
3.6
3.8
4.0
Figure 13. Standardised feed conversion ratios (finishing herds), 2019
29
Table 11. GB and EU physical results, 2019
Physical results – GB and EU
GB indoor
GB outdoor
GB Overall60% indoor: 40% outdoor
EU average (inc GB)
GB overall difference with EU average %
Pigs weaned/sow/year 27.4 24.1 26.1 28.1 -7
Pigs reared/sow/year 26.3 23.2 25.0 27.2 -8
Pigs sold/sow/year 25.4 22.4 24.2 26.4 -8
Pigs born alive/litter 13.6 12.2 13.0 14.2 -8
Pigs weaned/litter 12.0 10.7 11.5 12.3 -6
Litters/sow/year 2.28 2.25 2.3 2.28 -1
Sow mortality (%) 6.1% 5.3% 5.8% 7.1% -19
Pre-weaning mortality (%) 11.6% 12.3% 11.9% 13.2% -10
Rearing mortality (%) 3.9% 3.3% +20
Finishing mortality (%) 3.2% 2.8% +11
Transfer weight from breeding to rearing unit (kg) 7.1 7.5 7.3 7.2 +1
Lactation period (days) 26.3 26.3 26.3 27.4 -4
Transfer weight from rearing to finishing unit (kg) 36.5 36.5 36.5 29.6 +23
Rearing daily liveweight gain (g/day) 484 484 484 421 +15
Rearing feed conversion ratio 1.8 1.8 1.8 1.8 +3
Finishing daily liveweight gain (g/day) 860 860 860 835 +3
Finishing feed conversion ratio 2.7 2.7 2.7 2.8 -5
Average number of days in rearing unit 61 60 60 53 +15
Average number of days in finishing unit 86 86 86 112 -23
Empty finishing unit days per cycle 7 7 7 9 -24
Pigs/pig place/year (finishing) 3.9 3.9 3.9 3.2 +24
Average live weight at slaughter (kg) 110.5 110.3 110.4 121.2 -9
Average carcase weight – cold (kg) 84.3 84.1 84.2 93.6 -10
Killing-out percentage (cold weight) 76.3% 77.1% -1
Carcase meat production/ sow/year (kg) 2,145 1,887 2,042 2,461 -17
Sow feed/sow/year (kg) 1,370 1,420 1,390 1,343 +3
Weaner/rearer feed/reared pig (kg) 54 54 54 41 +33
Finishing pigs feed consumption/slaughter (kg) 200 200 200 263 -24
GB Overall is an average of GB indoor- and outdoor-bred, with a weighting of 60% indoor and 40% outdoor for sow performance.

30
Appendix 2List of tables and charts
7 Table 1. Average costs of production, 2014–2019 (£ per kg dw)
8 Table 2. Average costs of production, 2014–2019 (€ per kg dw)
9 Table 3. Summary of financial performance, 2019 (£ per kg dw)
11 Table 4. Compound feed prices per tonne (sterling), 2019
11 Table 5. Compound feed prices per tonne (euros), 2019
13 Table 6. Summary of financial performance, 2017–2019 (£ per kg dw)
17 Table 7. Summary of physical performance, 2017–2019
22 Table 8. InterPIG members pig industry trends, 2019
23 Table 9. Ranking of EU production costs, 2014–2019
25 Table 10. Annual exchange rates
29 Table 11. GB and EU physical results, 2019
6 Figure 1. Cost of production in selected countries, 2019
12 Figure 2. Changes in feed costs, 2019
12 Figure 3. Feed costs, 2019
15 Figure 4. Estimated net margins in Great Britain, 2012–2019
21 Figure 5. Pigs weaned per sow per year, 2018–2019
21 Figure 6. Pigs finished per sow per year, 2018–2019
24 Figure 7. Exchange rate movements, 2014–2019
25 Figure 8. Depreciation and finance costs, 2018–2019
26 Figure 9. Daily liveweight gains (finishing herds), 2018–2019
26 Figure 10. Feed conversion ratios (finishing herds), 2018–2019
27 Figure 11. Carcase meat production per sow per year, 2018–2019
28 Figure 12. Standardised daily liveweight gains (finishing herds), 2019
28 Figure 13. Standardised feed conversion ratios (finishing herds), 2019
22 Appendix 1. Additional tables and figures

31
AHDB is a statutory levy board, funded by farmers, growers and others in the supply chain. Our purpose is to inspire our farmers, growers and industry to succeed in a rapidly changing world. We equip the industry with easy to use, practical know-how which they can apply straight away to make better decisions and improve their performance. Established in 2008 and classified as a Non-Departmental Public Body, it supports the following industries: meat and livestock (cattle, sheep and pigs) in England; horticulture, milk and potatoes in Great Britain; and cereals and oilseeds in the UK. AHDB’s remit covers 72 per cent of total UK agricultural output. Further information on AHDB can be found at ahdb.org.uk
While the Agriculture and Horticulture Development Board seeks to ensure that the information contained within this document is accurate at the time of printing, no warranty is given in respect thereof and, to the maximum extent permitted by law, the Agriculture and Horticulture Development Board accepts no liability for loss, damage or injury howsoever caused (including that caused by negligence) or suffered directly or indirectly in relation to information and opinions contained in or omitted from this document.
© Agriculture and Horticulture Development Board 2021. All rights reserved.
50014 0122
Produced for you by:AHDB Pork Stoneleigh Park Kenilworth Warwickshire CV8 2TL
T 024 7669 2051 E [email protected] W ahdb.org.uk
If you no longer wish to receive this information, please email us on [email protected]