Embed Size (px)
Citation preview
2019 Outdoor Recreation Economic Impact Analysis in the Fraser Valley Regional District

REPORT PREPARED BY ACKNOWLEDGEMENTSThis report could not have been developed without the support and assistance of dozens of individuals and organizations. The project was also guided by a Project Working Group that provided oversight and direction to the project in seven half-day planning sessions held between December 2018 and January 2020. A special thank you to Bonny Graham of Stó:lō Tourism and Al Stobbart of the Sts’ailes Development Corporation for their participation in the Project Working Group, alongside FVRD staff and the consulting team.
The project also benefited from financial contributions from Tourism Chilliwack and Tourism Abbotsford. Thank you to Recreation Sites & Trails BC, BC Parks, and BC Hydro for providing project support and data.
Many outdoor recreation organizations contributed data, reports, and other perspectives that assisted in the development of this report. A special thank you to the following organizations:
» Coquihalla Summit Snowmobile Club
» Fraser Valley Mountain Bikers Association
» Chilliwack Outdoor Club
» Dual Sport BC
» Chilliwack Snowmobile Club
» BC Off-Road Motorcycle Association
» Fraser Valley Dirt Riders Association
» Greater Vancouver Motorcycle Club
» Lost Traction ATV & SxS Club
» Valley Outdoor Association
» Hope Mountain Centre for Outdoor Learning
» Chilliwack Search and Rescue
» Central Fraser Valley Search and Rescue
» Vancouver Soaring Association
» Fishing BC

Key Terms | 54 | Outdoor Recreation Economic Impact Analysis
KEY TERMS
Client Days: The number of clients an outdoor recreation business has multiplied by the number of days they enjoy that experience.
Direct Economic Output: Direct expenditures of local residents and visitors on outdoor recreation-related items in the Fraser Valley region, minus consumption taxes.
Direct Expenditures: spending by local residents and FVRD visitors on items related to outdoor recreation such as equipment rental/purchase, transportation, accommodation, food & beverage, and shopping. Direct outdoor recreation expenditures have also been referred to as spending throughout the body of the report.
Economic Impact: The effects of any event, activity, or other economic phenomenon in a specified area, typically including changes in business revenue, profits, wages, taxes, and/or jobs.
Gravel Grinding: Cycling with specialized bicycles that are durable “road bikes” on surfaces such as asphalt, gravel, dirt, beginner single-track trails, and Forest Service Roads.
Indirect Economic Output: Expenditures by recreation-related businesses on input items, such as a hotel purchasing, financial services and insurance, or physical assets such as beds, televisions, etc.)
Induced Economic Output: Primarily expenditures by employees of recreation-related businesses in the local economy, on items such as food, entertainment, housing, etc.
Intercept Survey: On-location face-to-face surveys of outdoor recreation participants, conducted with a standardized questionnaire script.
Jobs: The number of specific jobs offered by recreation-related businesses as a result of recreationist expenditures in the study region.
Recreation Day: One day or a partial day of participation in an outdoor recreation activity by one person. Recreation days are a common measure for the volume of people participating in outdoor recreation activities. For example, an angler day is the time spent fishing by one person for any part of a day. Similarly, a skier day, is the time spent skiing by one person for any part of the day.
Resident: Someone living within the Fraser Valley Regional District.
Sampling Plan: A detailed outline of which measurements will be taken at what times, in what manner, and by whom. In this case, it was the detailed plan about when and where researchers conducted vehicle counts and intercept interviews.
Tax Revenues: The total amount of direct taxation revenue resulting from i) recreationist consumer taxes; ii) business income taxes; iii) Employee income taxes; and iv) other fees/surcharges/taxes.
Visitor: Someone living outside of the FVRD but visiting to participate in outdoor recreation activities. Visitors range from Metro Vancouver to those from Washington State and Europe.
TABLE OF CONTENTS
KEY TERMS ............................................................ 5
EXECUTIVE SUMMARY .......................................... 7Key Findings .......................................................................... 7
Total Economic Impacts ..................................................... 12
Indigenous Awareness ....................................................... 12
Recreationist Satisfaction ................................................... 13
Net Promoter Scores ........................................................... 14
Looking to the Future ........................................................ 14
Climate Change and Air Quality ........................................ 14
Summary Conclusions ...................................................... 15
BACKGROUND AND CONTEXT ........................... 16Study Purpose ...................................................................... 16
Study Area ............................................................................ 16
RESEARCH APPROACH ....................................... 20Planning and Data Collection ............................................. 20
Estimating Volume and Spending ...................................... 27
Estimating Total Economic Impact Estimates ................... 28
RESULTS .............................................................. 30Volume and Spending ......................................................... 30
Economic Impacts ............................................................... 40
Characteristics of Outdoor Recreation Participants ........ 41
Characteristics of Visitor Trips ........................................... 48
Indigenous Cultural Experiences ....................................... 50
Experience Evaluation ......................................................... 52
Insights From Outdoor Recreation Businesses ................ 61
CONCLUSIONS .................................................... 64Key Findings and Considerations ...................................... 64
Economic Impacts .............................................................. 66
Concluding Remarks .......................................................... 68
APPENDIX ........................................................... 71Appendix A: Detailed Sector Activity Analysis ................... 71
Appendix B: Visitor Survey.................................................. 93
Appendix C: Sampling Routes and Locations ................... 98
Illal PeakCredit Hamish Baird
Executive Summary | 76 | Outdoor Recreation Economic Impact Analysis
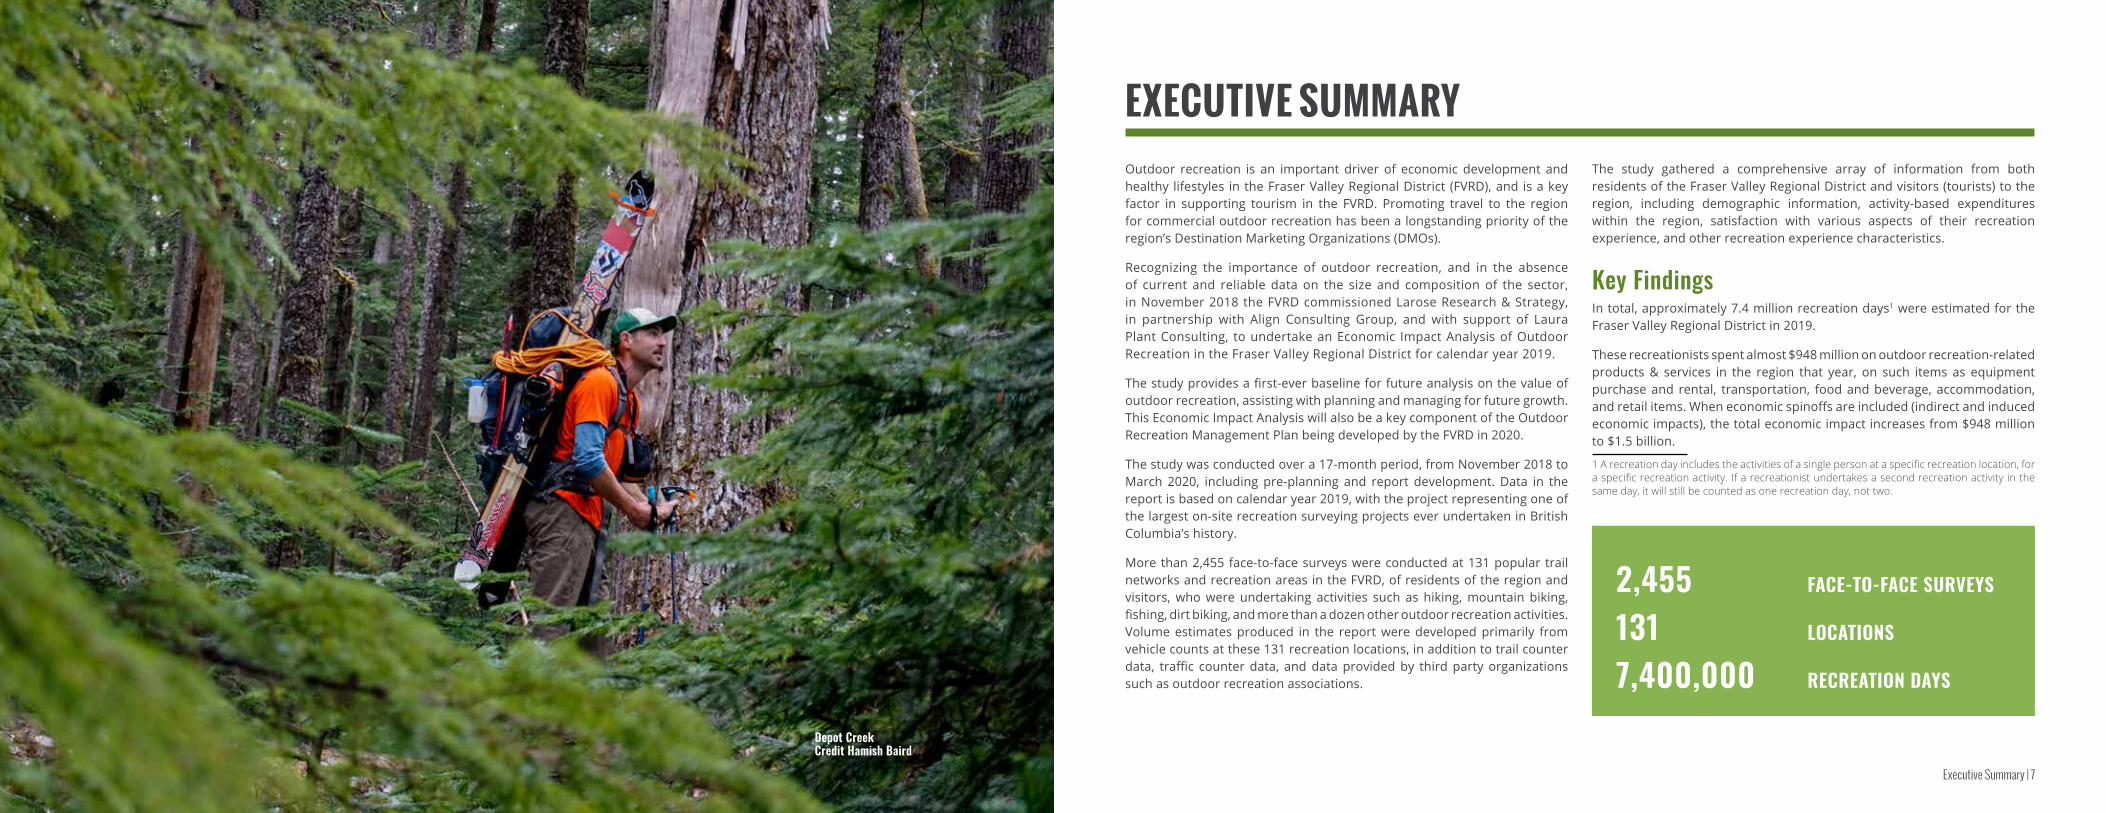
EXECUTIVE SUMMARYOutdoor recreation is an important driver of economic development and healthy lifestyles in the Fraser Valley Regional District (FVRD), and is a key factor in supporting tourism in the FVRD. Promoting travel to the region for commercial outdoor recreation has been a longstanding priority of the region’s Destination Marketing Organizations (DMOs).
Recognizing the importance of outdoor recreation, and in the absence of current and reliable data on the size and composition of the sector, in November 2018 the FVRD commissioned Larose Research & Strategy, in partnership with Align Consulting Group, and with support of Laura Plant Consulting, to undertake an Economic Impact Analysis of Outdoor Recreation in the Fraser Valley Regional District for calendar year 2019.
The study provides a first-ever baseline for future analysis on the value of outdoor recreation, assisting with planning and managing for future growth. This Economic Impact Analysis will also be a key component of the Outdoor Recreation Management Plan being developed by the FVRD in 2020.
The study was conducted over a 17-month period, from November 2018 to March 2020, including pre-planning and report development. Data in the report is based on calendar year 2019, with the project representing one of the largest on-site recreation surveying projects ever undertaken in British Columbia’s history.
More than 2,455 face-to-face surveys were conducted at 131 popular trail networks and recreation areas in the FVRD, of residents of the region and visitors, who were undertaking activities such as hiking, mountain biking, fishing, dirt biking, and more than a dozen other outdoor recreation activities. Volume estimates produced in the report were developed primarily from vehicle counts at these 131 recreation locations, in addition to trail counter data, traffic counter data, and data provided by third party organizations such as outdoor recreation associations.
The study gathered a comprehensive array of information from both residents of the Fraser Valley Regional District and visitors (tourists) to the region, including demographic information, activity-based expenditures within the region, satisfaction with various aspects of their recreation experience, and other recreation experience characteristics.
Key Findings In total, approximately 7.4 million recreation days1 were estimated for the Fraser Valley Regional District in 2019.
These recreationists spent almost $948 million on outdoor recreation-related products & services in the region that year, on such items as equipment purchase and rental, transportation, food and beverage, accommodation, and retail items. When economic spinoffs are included (indirect and induced economic impacts), the total economic impact increases from $948 million to $1.5 billion.
1 A recreation day includes the activities of a single person at a specific recreation location, for a specific recreation activity. If a recreationist undertakes a second recreation activity in the same day, it will still be counted as one recreation day, not two.
2,455 FACE-TO-FACE SURVEYS
131 LOCATIONS
7,400,000 RECREATION DAYS
Depot CreekCredit Hamish Baird

Executive Summary | 98 | Outdoor Recreation Economic Impact Analysis
Table A: 2019 FVRD Outdoor Recreation Days by Activity (Independent & Guided)
Activity Resident Visitor Total % of TotalHiking/Trail Running 999,893 664,451 1,664,344 22.48%
Camping 547,851 967,825 1,515,676 20.47%
Walking/Dog Walking 1,112,717 341,237 1,453,954 19.63%
Sport Fishing 325,530 255,812 581,342 7.85%
Swimming/Beach/Waterside Activities 268,158 115,669 383,826 5.18%
Park/Picnic/Play in Park 218,718 61,066 279,784 3.78%
Canoeing/Kayaking/SUP 137,242 94,323 231,565 3.13%
Mountain Biking 125,363 64,018 189,380 2.56%
Sightseeing/General Leisure 134,731 53,556 188,287 2.54%
Nature Interpretation/Ecotours/Wildlife Viewing 97,807 89,628 187,435 2.53%
Motorized Boating/Jet Skiing/Waterskiing/Boat Rentals 105,926 36,421 142,347 1.92%
Adventure Race/Event (Participating, Watching, Volunteering) 86,170 30,974 117,143 1.58%
Attraction (e.g. Watersports, Nature at Farms) 66,325 49,625 115,950 1.57%
Road Cycling/Gravel Grinding/Cycling Tours 71,601 14,524 86,125 1.16%
Downhill Skiing/Snowboarding/Cross Country and Backcountry Skiing 58,162 10,481 68,643 0.93%
Photography 37,546 14,212 51,758 0.70%
Motorized Off Road Vehicles (ATV/dirt bike/other) 32,065 18,779 50,844 0.69%
Hunting 35,495 1,244 36,739 0.50%
Rafting 2,201 21,678 23,878 0.32%
Flight Tours 2,181 17,820 20,001 0.27%
Caving 4,308 2,419 6,728 0.09%
Snowmobiling 1,995 2,072 4,067 0.05%
Climbing/Scrambling 985 2,536 3,521 0.05%
Horseback Riding 334 594 927 0.01%
Sky Diving/Paragliding/Air Sports 411 334 746 0.01%
Grand Total 4,473,714 2,931,296 7,405,010 100%
12345
Top 5 Activitiesby # Rec Days
Flood Hope FallsCredit Jenn Kleingeltink

Executive Summary | 1110 | Outdoor Recreation Economic Impact Analysis
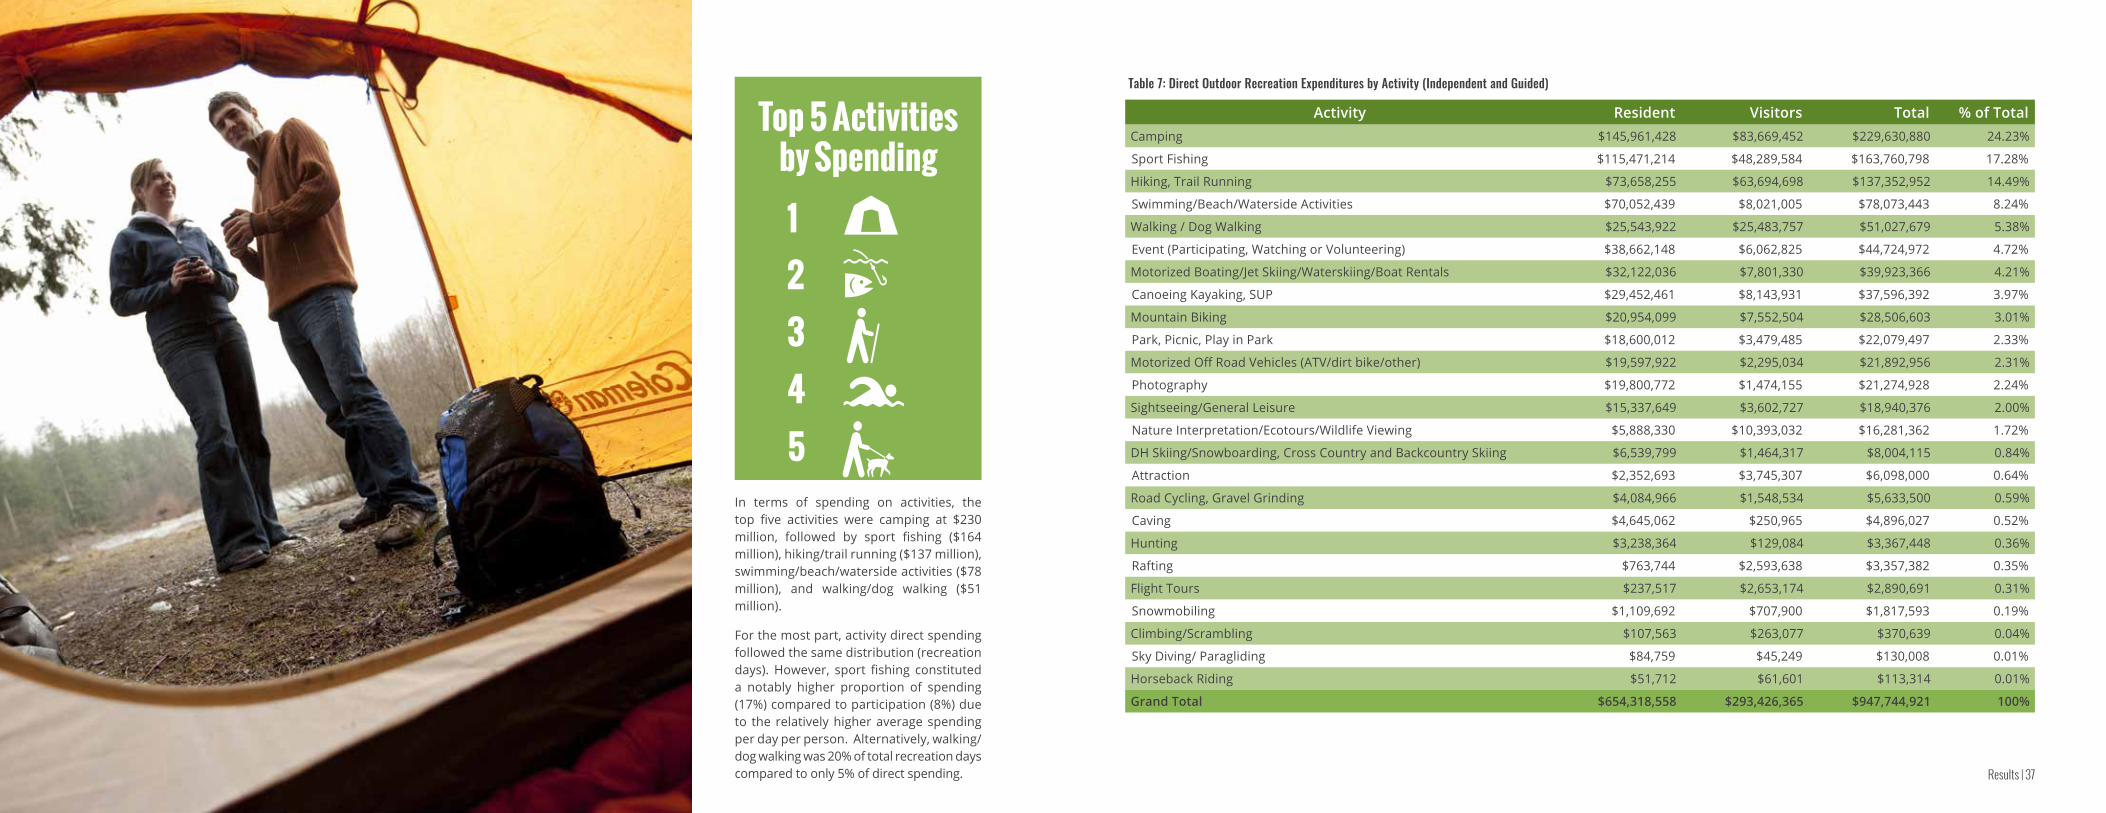
Table B: FVRD Direct Outdoor Recreation Expenditures by Activity (Independent & Guided)
Activity Resident Visitors Total % of TotalCamping $145,961,428 $83,669,452 $229,630,880 24.23%
Sport Fishing $115,471,214 $48,289,584 $163,760,798 17.28%
Hiking, Trail Running $73,658,255 $63,694,698 $137,352,952 14.49%
Swimming/Beach/Waterside Activities $70,052,439 $8,021,005 $78,073,443 8.24%
Walking / Dog Walking $25,543,922 $25,483,757 $51,027,679 5.38%
Event (Participating, Watching or Volunteering) $38,662,148 $6,062,825 $44,724,972 4.72%
Motorized Boating/Jet Skiing/Waterskiing/Boat Rentals $32,122,036 $7,801,330 $39,923,366 4.21%
Canoeing Kayaking, SUP $29,452,461 $8,143,931 $37,596,392 3.97%
Mountain Biking $20,954,099 $7,552,504 $28,506,603 3.01%
Park, Picnic, Play in Park $18,600,012 $3,479,485 $22,079,497 2.33%
Motorized Off Road Vehicles (ATV/dirt bike/other) $19,597,922 $2,295,034 $21,892,956 2.31%
Photography $19,800,772 $1,474,155 $21,274,928 2.24%
Sightseeing/General Leisure $15,337,649 $3,602,727 $18,940,376 2.00%
Nature Interpretation/Ecotours/Wildlife Viewing $5,888,330 $10,393,032 $16,281,362 1.72%
DH Skiing/Snowboarding, Cross Country and Backcountry Skiing $6,539,799 $1,464,317 $8,004,115 0.84%
Attraction $2,352,693 $3,745,307 $6,098,000 0.64%
Road Cycling, Gravel Grinding $4,084,966 $1,548,534 $5,633,500 0.59%
Caving $4,645,062 $250,965 $4,896,027 0.52%
Hunting $3,238,364 $129,084 $3,367,448 0.36%
Rafting $763,744 $2,593,638 $3,357,382 0.35%
Flight Tours $237,517 $2,653,174 $2,890,691 0.31%
Snowmobiling $1,109,692 $707,900 $1,817,593 0.19%
Climbing/Scrambling $107,563 $263,077 $370,639 0.04%
Sky Diving/ Paragliding $84,759 $45,249 $130,008 0.01%
Horseback Riding $51,712 $61,601 $113,314 0.01%
Grand Total $654,318,558 $293,426,365 $947,744,921 100%
12345
Top 5 Activitiesby Spending
Sumas MountainCredit Tourism Abbotsford

Executive Summary | 1312 | Outdoor Recreation Economic Impact Analysis
More than half (53%) of respondents indicated a very high level of interest in seeing Indigenous cultural interpretation information in recreation areas (staging areas, parking lots, on-trail). This suggests a strong opportunity to raise awareness of Indigenous culture and heritage among recreationists, and to enhance recreational experiences by providing information about local Indigenous culture.
Recreationist SatisfactionOne of the key elements of the report was a comprehensive evaluation of recreationist satisfaction with a number of aspects of their recreation experiences. Future growth potential of outdoor recreation, as well as management considerations related to infrastructure and policy, are all informed by recreationist satisfaction at each location, and for specific activity sectors.
Satisfaction was evaluated in a number of aspects of recreation, including recreationist perspectives on the overall quality of recreation at each location, friendliness of locals, quality of signage/wayfinding information, parking/access, and crowding. The study also included the analysis of Net Promoter Scores (NPS), which estimates the likelihood that recreationists will recommend the FVRD as an outdoor recreation destination. Overall, there was a very high level of satisfaction with most aspects of recreation, with the “friendliness of locals” being the highest-rated aspect of recreation in the region (9.5/10).
Figure A: Outdoor Recreationist Satisfaction Scores
Q. On a scale of 1 - 10, how would you rate the following?
Total Economic Impacts The project estimated the total economic impacts of outdoor recreation in the FVRD. Table C summarizes these impacts.
Table C: Total Economic Impacts
2019 FVRD Outdoor Recreation Economic ImpactsDirect Outdoor Recreation Expenditures $947,750,730
Direct Economic Output $853,356,486
Total Impact (includes indirect and induced impacts) $1,519,749,122
GDP $568,206,819
Employment (jobs) 10,262
Total Taxes $257,788,199
Federal Taxes $116,004,689
Provincial Taxes $126,058,429
Municipal Taxes $15,725,080
Indigenous Awareness The surveys included a series of questions regarding recreationist awareness of Indigenous communities in the areas where they are recreating, and for visitors to the region, whether Indigenous culture/heritage was a motivating factor in their trip decision. The final survey question on this topic asked about recreationist interests in learning more about Indigenous culture and heritage in the recreation area. Indigenous cultural/heritage tourism is a rapidly growing economic sector that is a key focus of tourism marketing for the region, and therefore understanding the intersections between Indigenous cultural/heritage tourism and outdoor recreation is important for recreation planning, product enhancement, and marketing.
Overall, approximately one-third of recreationists (visitors and residents) were able to name the local Indigenous Peoples, whether a Band, Tribal Council, Nation, or broader ethnic/linguistic group (e.g. “Coast Salish”).
The lowest-scoring aspect of recreation was related to “crowding” on trails and in recreation areas overall. This score was still strong at 8.0/10, and it should also be noted that most activities registered above 8.5/10 for crowding, with sport fishing and lakeside activities pulling down the overall average.
Sta’ailes Drummers celebrating opening of East Sector LandsCredit David Urban
Overall QualityFriendliness of LocalsAccess/ParkingSignage/Wayfinding
Crowding
8.99.5
8.6
8.5
8.0

Executive Summary | 1514 | Outdoor Recreation Economic Impact Analysis
Climate Change and Air Quality Climate change and its related impacts is an increasingly prominent factor that must be considered with regard to outdoor recreation planning in the region.
Climate change poses a number of threats to sustainable outdoor recreation development and management in the FVRD, and elsewhere. Hot, dry summers, erratic weather, wildfires, flooding, deteriorating air quality, and other impacts of climate change are already posing significant threats to outdoor recreation in the FVRD. Climate change can degrade the natural environment upon which outdoor recreation is dependent, deteriorate outdoor recreation infrastructure, and diminish recreationist satisfaction.
Climate change impacts are already apparent in trends from data gathered as a part of this project, including multi-year recreation volume data gathered by the FVRD, other levels of government, and sector associations such as those representing snowmobiling and mountain biking. Analysis of this data demonstrate a strong generalized trend of reduced outdoor recreation in the region in summer months of the two years that had widespread forest fires in British Columbia: 2017 and 2018, which are broadly believed to be the result of climate change impacts on the landscape.2 As an illustration, in August 2017, recreation visits in the Mt. Cheam area, gathered via automated vehicle counters on Chipmunk Creek FSR, declined by over 60% in August 2017 compared to the same month in 2016. These declines in recreation coincided with weeks-long air quality advisories from wildfires in the B.C. Interior and Pacific Northwest, and health authority advisories for local residents to remain indoors or limit activities outdoors. While the sampling year for this project (2019) was a reprieve year from wildfires, this is likely to be an ongoing issue that must be addressed in the future, with a higher likelihood of wildfires constraining recreation levels during poor air quality events in particular. These air quality impacts are compounded in the Fraser Valley, which already faces air quality challenges, particularly in summer months.
2 For example see Jeff Lewis, “B.C. Wildfires Stoked by Climate Change, Likely to Become Worse: Study,” The Globe and Mail (Canada), January 8, 2019. https://www.theglobeandmail.com/canada/article-bc-wildfires-stoked-by-climate-change-likely-to-become-worse-study/
Net Promoter ScoresFor the first time, a Net Promoter Score (NPS)1 was calculated for recreation in the region, assessing the likelihood that resident and visitor recreationists would recommend the FVRD as a recreation destination. Net Promoter Scores range from a possible low of -100 to a possible high of 100.
The region’s NPS of 83 is among the highest Net Promoter Scores registered for any region of the world for tourism or recreation. By way of comparison, the NPS for British Columbia overall as a travel destination is one of the highest in the world, typically around 70. For the accommodation and food services sector, the majority of successful businesses score in the 15-45 range.
When analyzing the individual Net Promoter Scores for specific activity sectors, and analyzing trends in the NPS for each location and activity, it can be inferred that the region possesses a wide diversity of high calibre outdoor recreation activities, but without the levels of crowding often experienced in Metro Vancouver, the Sea to Sky corridor, and the U.S. Pacific Northwest.
Looking to the Future By 2040, the population of Metro Vancouver is expected to increase by over 50% to 3.4 million, while the FVRD’s population is projected to increase by over 40% to 450,000 resulting in a Lower Mainland population of 3.8 million by 2040. Like any growth, this will create both challenges and opportunities for outdoor recreation in the FVRD. As the primary link between Metro Vancouver and the rest of Canada, the FVRD will continue to be impacted by visitors traversing the region seeking to escape the more crowded urban periphery recreation areas of Metro Vancouver, as well as growth of the local population. To continue providing high quality outdoor recreation experiences for residents and visitors alike, it will be important to have current information on outdoor recreation activity levels, overall and for specific areas and activities, as well as the economic value of this activity, and the satisfaction of recreationists. This study addresses, in part, this need.
1 Net Promoter, NPS and the NPS-related emoticons are registered service marks, and Net Promoter Score and Net Promoter System are service marks, of Bain & Company, Inc., Satmetrix Systems, Inc. and Fred Reichheld.
Additional climate change impacts include radical fluctuations in the winter snowpack, spring flooding, erratic general precipitation patterns, and highly fluctuant water levels. These impact outdoor recreation by deteriorating winter sport activities due to reduced/fluctuant snowfall and the winter snowpack for activities such as skiing and snowmobiling. Erratic water levels, particularly in rivers, can impact fish abundance, and deteriorate water activities such as whitewater rafting and kayaking.
Summary Conclusions The results of this first-ever comprehensive analysis of outdoor recreation use levels, expenditures, user characteristics, satisfaction levels, and user perceptions provides critical information to support outdoor recreation development and management in the region.
Compared with world-recognized outdoor recreation regions such as Vancouver’s North Shore, the Sea to Sky corridor, and the Canadian Rockies, the FVRD has not traditionally been considered a major outdoor recreation destination. The results of this analysis suggest, however, that this may be changing.
With over 7 million recreation days registered in the region in 2019, and over $948 million in direct spending on outdoor recreation by residents and tourists, the FVRD must be considered a bona fide outdoor recreation destination. The diversity of activities, relative lack of crowding, and world-class recreation assets all suggest there is a strong opportunity to sustainably manage outdoor recreation in the region. This will provide ongoing opportunities for economic development, improved quality of living and health outcomes, as well as a sense of pride amongst the region’s residents. Hayward Lake, Mission
Credit Tourism Abbotsford

Background & Context | 1716 | Outdoor Recreation Economic Impact Analysis
BACKGROUND AND CONTEXT
Study PurposeThe Fraser Valley Regional District (FVRD) is blessed with an abundance of awe-inspiring scenery, countless recreational opportunities, a broad range of services, growing employment opportunities close to home, and housing costs which are more affordable than many other Lower Mainland communities. Combined with the region’s productive farmland, historic rural communities, and many wilderness areas, residents of the Fraser Valley enjoy a high quality of life in one of the most livable environments in North America.
These contextual factors led the FVRD to identify outdoor recreation and tourism as strategic priorities for economic diversification. In 2017, the FVRD hosted a visioning workshop to discuss the future potential of outdoor recreation and tourism in the region. The workshop identified information gaps relating to outdoor recreation use and the economic value of the outdoor recreation sector. One of the recommendations generated was:
“To undertake a region wide economic impact study to inform an outdoor recreation strategic plan and to support ongoing tourism marketing and economic development initiatives.”
In 2018, the FVRD obtained funding to conduct a comprehensive outdoor recreation economic impact analysis and to develop an outdoor recreation management plan (ORMP). This report is a key factor for determining management strategies to support outdoor recreation for both residents and tourists to the region.
The purpose of the study was to quantify the value of outdoor recreation activities, including motorized and non-motorized activities, occurring within the region, and to provide current and credible estimates on spending patterns, travel behaviours and characteristics of outdoor recreation users in the region. To do so, nearly 2,500 intercept surveys were completed (face-to-face questionnaires administered in recreation areas) of outdoor recreation participants at 131 sites throughout the FVRD.
Estimates of recreation use volumes were developed primarily from vehicle counts at recreation areas in the region, in addition to administrative data sources such as FVRD trail counters, BC Parks and Recreation Sites and Trails B.C. camping statistics, and Fisheries and Oceans Canada (DFO) angling effort. An online business survey was also used to develop visitor volume and spending estimates.
Study results provide important baseline estimates of outdoor recreation activity volume and economic value which can be used to manage and plan for future growth. In addition, resident and visitor characteristics and perceptions will provide key insights for management, marketing and development of outdoor recreation in the FVRD.
One of the key focal points for the analysis was the intersection of Indigenous culture/heritage with outdoor recreation. From a visitor economy perspective, outdoor recreation and Indigenous cultural/adventure tourism are considered highly compatible experience categories. Understanding the awareness, interest, and perspectives of both locals and visitors with respect to Indigenous culture is a key aspect in tourism and outdoor recreation planning, which in turn enhances opportunities for economic development within Indigenous communities.
Study AreaThe FVRD comprises six member municipalities and eight electoral areas, and features a wide range of communities, from small rural hamlets to the fifth-largest city in British Columbia. Situated just east of Metro Vancouver, the boundaries of the FVRD extend from Abbotsford to the border of Manning Park in the east, sharing a southern border with Washington State and extending north just past Boston Bar and the north end of Harrison Lake and Little Lillooet Lake. The region’s total land base is 13,361 square kilometers.
Figure 1: Map of Fraser Valley Regional District Area
The FVRD is one of the fastest growing regional districts in British Columbia. As of 2019, the region was home to 320,000 residents. According to planning and forecasting undertaken by the FVRD, by 2041, the population is expected to increase by 41% to around 450,000. Anticipating and accommodating this growth over the next 20 to 30 years will offer both opportunities and challenges for the region in the context of outdoor recreation growth and management. Close proximity to Metro Vancouver causes increasing external pressures as a result of growth occurring within Metro Vancouver.
Populations of FVRD municipalities are listed in Table 1, and Electoral Area populations are listed in Table 2. These figures include Indigenous populations.
Table 1: Municipalities in the FVRD
Municipality Population (2016)
City of Abbotsford 141,397City of Chilliwack 83,788District of Mission 38,833District of Hope 6,181District of Kent 6,067Village of Harrison Hot Springs 1,468
Table 2: Electoral Areas in the FVRD
Electoral Areas Population (2016)
A - Boston Bar/North Bend/Canyon Alpine
551
B - Yale/Choate/Dogwood Valley/Emory Creek/Laidlaw/Othello/Ruby Creek/Spuzzum/Sunshine Valley
1,495
C - Hemlock Valley/Harrison Mills/Lake Errock/Weaver Creek
2,218
D - Popkum/Bridal Falls 1,741
E - Chilliwack River Valley 1,540
F - McConnell Creek - Hatzic Prairie 1,293G – Nicomen Island/ Deroche/Dewdney/Hatzic Island
2,166
H - Cultus Lake/Columbia Valley/Lindell Beach
2,094
Source: Canada Census of Population, 2016.
A
B
C
D
EHG
F
Metro Vancouver
Squamish-LillooetRegional District
Thompson-NicolaRegional District
Okanagan-SimilkameenRegional District
Abbotsford
MissionChilliwack
Kent
HopeHarrisonHot Springs

Background & Context | 1918 | Outdoor Recreation Economic Impact Analysis
The FVRD is immediately adjacent to Metro Vancouver and growth pressures in that region create both challenges and opportunities for the FVRD. The FVRD’s unique relationship with Metro Vancouver offers advantages by putting the region within easy reach of a large market, generating new potential in the tourism industry and creating opportunities for collaboration in areas such as outdoor recreation planning.
The FVRD is within the unceded traditional territories of the Stó:lō, St’átimc and Nlaka’pamux Peoples. Indigenous Peoples have lived in the region since time immemorial. The extensive network of rivers, lakes and mountains are central to past, present and future ways of life, and offer opportunities for Indigenous economic development through tourism and ways for non-Indigenous Peoples to learn about Indigenous cultures and heritage.
There are 30 Indigenous communities within the FVRD. There are also approximately 25 additional Indigenous organizations with land or resource interests in the region. Indigenous cultural awareness is an important component to be recognized in outdoor recreation, particularly in terms of use of the landscape, growth, and management. Indigenous communities developing economic opportunities are becoming more engaged with outdoor recreation and tourism opportunities, with prominent examples including Stó:lō Tourism, Sts’ailes festivals and campgrounds, Cheam Campground, and others.
Figure 2: Local Indigenous Communities Stó:lō Welcome Figures, Chilliwack Visitors CentreCredit Jenn Kleingeltink

Research Approach | 2120 | Outdoor Recreation Economic Impact Analysis
This section includes a summary of project planning steps, data collection, how outdoor recreation volume and direct spending were estimated and economic impact estimate development.
Planning and Data CollectionThe FVRD is a vast geographic area with many opportunities to participate in outdoor recreation. At the outset of the project it was determined that it would be necessary to estimate total outdoor recreation volume, which could then be combined with average spending data obtained from intercept surveys to estimate direct spending by activity.
The first step was to develop a comprehensive outdoor recreation site inventory. The inventory was developed by the project consultants with the Project Working Group. The inventory was informed by FVRD staff, Indigenous organizations, and outdoor recreation user groups/stakeholders. Also, mid-country and back-country access points/staging areas were reviewed and discussed with Chilliwack and Central Fraser Valley Search and Rescue (SAR) organizations. The site inventory included location, primary recreational activity, management organization, and whether existing recreation volume data was available. In total, 191 outdoor recreational sites were identified, from which intercept surveys were conducted in 131 locations.
The site inventory was then organized into 23 routes based on location and activities such as fishing, hiking, snowmobiling, or other recreation types. For example, 24 recreation locations (sites) in the Chilliwack River Valley were organized into three routes called CRV-1, CRV-2 and CRV-3. CRV-1 included sites the closest to Chilliwack and the furthest downstream whereas CRV–3 included sites in Chilliwack Lake Provincial Park. A complete list of routes and sites is included in Appendix C, as well as a map of the region’s sampling routes and sites.
The routes and sites were the basis of planning data collection actions. Data collection included vehicle counts and intercept interviews. Vehicle counts were necessary to estimate volume at sites without existing data. Intercept interviews were conducted at each site to understand factors associated with volume (e.g. # of people per vehicle), activity participation, spending, and other descriptive data.
The next step was to develop the sampling plan. The sampling plan outlined where and when the sampling research team would conduct vehicle counts and intercept interviews. A stratified, random sampling approach was developed, which means the study period (January – December 2019) was
segmented into seasons,1 months, and day type (weekends and weekdays). The amount of research effort (i.e. time spent on each route) was roughly proportional to expected volume for each season, activity and site. Outdoor recreational participants were randomly approached at each site.
Each sampler was provided with training on the survey questionnaire, as well as general sampling instructions related to approaching potential respondents, weather considerations, and safety. In total, 24 samplers were recruited, retained, trained, and deployed over the twelve-month sampling period, and completed 613 days of data collection. With the region possessing one of its tightest labour markets in history during the entire sampling period, consistently hovering around 5% unemployment, recruitment, retention, and training were identified as the greatest single risk to project success. Modifications were thus made on a continuous basis for aspects such as compensation, additional one-time financial incentives for completing distant and “gap” shifts” for a specific route/day-type that were not completed in the prior month but the same season, retention bonuses, enhanced safety protocols, and other measures to ensure a sufficient complement of field staff to complete the project.
It should be noted that throughout the study period sites and routes were modified on a continuous basis. Improvements and adjustments were made based on the observations of field staff hired to conduct vehicle counts and intercept interviews. Field staff remained in continual contact with the project consulting team, and with one-another, through an online group organized via the handheld application WhatsApp.
With the project’s user volume and economic impact estimates being based primarily on counts of vehicles at known recreation staging areas and parking lots, as well as vehicle traffic counters and third-party data, some activities that are more broadly distributed in the region were difficult to enumerate. In particular, activities such as horseback riding, gravel grinding, and road cycling are expected to have conservative user volume and economic impact estimates, as these activities often occur in areas that do not have established start and end points (e.g., trails), parking lots, or staging areas, and at the time no third-party reports were received upon which FVRD estimates could be extrapolated. For horseback riding, there is a considerable difference in reported numbers when compared with the Horse Council BC released the 2019 Equine Industry Economic Study which calculated the equine industry provincial economic benefit, so this study further expands on recreational riding in the Vancouver/South Coast region.
1 Winter = December, January, February, Spring = March, April, May, Summer = June, July, August, Fall = September, October, November. Note that winter 2019 included January, February, and December 2019. Preliminary vehicle count data gathered in December 2018 and intercept data were blended with December 2019 data.
RESEARCH APPROACH
Kayaking in Chilliwack River ValleyCredit Tourism Chilliwack/Robyn Bessenger
Ice Climbing in the Fraser CanyonCredit Andy Jackson

Research Approach | 2322 | Outdoor Recreation Economic Impact Analysis
Existing Outdoor Recreation Volume DataExisting outdoor recreation volume data was collected from the following sources:
» User statistics for 2019 and 2020 from the Coquihalla Snowmobile Club for the Britton Creek riding area
» Fraser Valley Mountain Bikers Association statistics for the Vedder Mountain Classic mountain bike race
» BC Enduro Series racer data for the 2019 Vedder Mountain/NCES Norco Canadian Enduro Series
» Recreation Sites & Trails B.C. overnight campground statistics for the region
» BC Parks camping statistics for all Provincial Parks in the region
» BC Ministry of Forest, Land, Natural Resource Operations and Rural Development (MFLNRORD) vehicle counter data for Chipmunk Creek FSR
» MFLNRORD steelhead licence questionnaire data
» MFLNRORD estimates on guided and non-guided sturgeon catch and effort
» Fisheries and Oceans Canada salmon fishing effort data (from recent creel surveys)
» BC Hydro data for same-day and overnight user volumes for rec sites
» The Chilliwack Outdoor Club group trip numbers
In some cases, outdoor recreation volume data was only available on an annual basis. Volume was distributed throughout the months to equal the total.
Vehicle Counts and Intercept SurveysFor each site, researchers/samplers would record the date, route, site, weather, time and number of vehicles counted at arrival and departure. Altogether, there were 613 days of data collection. This means that on many days multiple people were out on different routes collecting data.
In addition, dozens of individual recreationists also provided photographs and vehicle count information to support the project. Data and information were requested through outdoor recreation associations, clubs and social media requests to the public.
A total of 2,455 intercept surveys were completed in all four seasons of 2019. The intercept survey collected information about:
» Origin (resident, visitor)
» Detailed origin (city, country)
» Number of people in vehicle
» Number of people in travel party
» Hours at site
» Activity at site
» Other outdoor recreation activities in FVRD
» Days spent doing that activity each year
» Nights in FVRD (if visitor)
» Accommodation (if visitor)
» Activity experience level
» Outdoor club membership
» Detailed spending (daily and annual if resident)
» Net Promoter Score
» Overall Satisfaction
» Satisfaction with access/parking, signage/wayfinding, friendliness of locals and crowding
» Indigenous culture/heritage as a travel motivator
» Interest in Indigenous cultural interpretation in recreation areas (signage, kiosks, etc.)
» Ability to name local Indigenous Peoples
» Age
» Gender
Falls Lake - Coquihalla SummitCredit Peter Larose

Research Approach | 2524 | Outdoor Recreation Economic Impact Analysis
The following categories of expenditures were estimated for visitors and residents:
Resident Daily Expenditures:
» Transportation and Fuel
» Equipment Purchase
» Equipment Rental
» Food and Beverage
» Shopping
Resident Annual Expenditures:
» Equipment Rental
» Equipment Purchase
» Transportation and Fuel
Visitor Daily Expenditures:
» Local Transportation
» Equipment Rental or Guiding
» Equipment Purchase
» Accommodation
» Food and Beverage
» Shopping
» Other
The detailed intercept survey questions are in Appendix B.
Table 3 summarizes the data collection that was undertaken in the project. For the purposes of the project, a “research shift” is one shift of work undertaken by a sampler to conduct intercept surveys with recreationists on site, and count vehicles in recreation parking lots and staging areas.
Table 3: Data Collection Levels by Season Data Collection
Winter Spring Summer Fall TotalResearch Shifts (#s) 150 146 178 139 613
Research Days (% of Total) 24% 23% 29% 24% 100%
Intercept Surveys Completed 313 588 787 767 2,455
Intercept Surveys (% of Total) 13% 24% 32% 31% 100%
Note: Winter = Dec, Jan, Feb; Spring = Mar Apr May; Summer = Jun, Jul, Aug; Fall = Sep, Oct, Nov.
Analysis of survey responses is conducted for FVRD residents and visitors as well as by activity. Most graphs and tables presented in the following pages are expected to total to 100%. In some cases, the totals equal just over 100% (e.g. 101%) or just under (e.g. 98-99%), this is due to rounding of responses in each category.
Net Promoter ScoreGrowing customer service/experience expectations, changing tourism markets, and increasing worldwide competition have led to substantial shifts in the tourism marketplace over the past decade. The delivery of outstanding visitor experiences is critical to achieve higher revenues via increased spending, longer stays, repeat visits, and visitors’ positive word of mouth recommendations.
The Net Promoter Score® (NPS®)2 measures the intent to recommend a product, service, or in this case, an outdoor recreation destination, and is considered a robust indicator of overall satisfaction. NPS is measured by asking one question (likelihood of recommending the Fraser Valley as an outdoor recreation destination) on the intercept survey. The question results are used to categorize respondents into one of three groups – promoters (very/extremely likely to recommend), passives (may or may not recommend) and detractors (not likely to recommend). Overall, the percent of detractors is subtracted from the percent of promoters to equal the NPS (see below).
2 Net Promoter, NPS and the NPS-related emoticons are registered service marks, and Net Promoter Score and Net Promoter System are service marks, of Bain & Company, Inc., Satmetrix Systems, Inc. and Fred Reichheld.
%PROMOTERS - % DETRACTORS = NPS
1 2 3 4 5 6 7 8 9 10
DETRACTORS PASSIVES PROMOTERSNot at all likely Extremely likely
Fishing on the Fraser RiverCredit Jenn Kleingeltink
Credit Chilliwack Tourism/Robyn Bessenger

Research Approach | 2726 | Outdoor Recreation Economic Impact Analysis
Recreation Satisfaction Measures A series of questions were asked of recreationists regarding their satisfaction with various aspects of their recreation experiences. All respondents to the surveys, including residents and visitors to the FVRD, were asked to rate their satisfaction on a scale of 0 to 10 for the following aspects of their recreation experiences:
» Overall quality of the trail/recreation area
» Accessibility/parking
» Signage/wayfinding on-trail
» Crowding
» Friendliness of locals
The results for recreationist satisfaction with these different aspects of outdoor recreation were then compared between different activity sectors, and for different recreationist demographics (age, gender, origin, experience level, and others) to determine trends with satisfaction.
Business SurveyTo capture guided or commercial recreation activities, an online survey of businesses and associations that provide outdoor recreation experiences was conducted in February 2020. Businesses were included if they provided outdoor recreation experiences to visitors and locals in the Fraser Valley Regional District. This included businesses that provide camping (private campgrounds), sport fishing, nature and ecotours, winter sports (downhill skiing, snowboarding, backcountry skiing), attractions (water-based attractions, nature-based interpretative sites), flight tours, mountain biking, rafting, boat rentals, canoeing, kayaking, standup paddling, hiking, trail running, adventure race/event, cycling tours and air sports.
The online survey was distributed via email as well as a convenient online link distributed through working group members and the project sponsors. The survey collected information about:
» Business characteristics (operating season, employees, revenue generated from visitors, revenues, expenses)
» Client characteristics (length of stay, origin)
» Barriers to growth
» Optimism about growth of outdoor recreation/nature-based tourism in the FVRD
Multiple email and telephone call reminders were used to encourage survey responses. In total, there were 43 full or partial responses to the business survey.
Estimating Volume and Direct ExpendituresOutdoor Recreation VolumeAs previously stated, recreation volume was estimated by season from existing outdoor recreation data or from vehicle counts. For vehicle counts, the following steps were taken:
1. Calculated average vehicle count by day type (weekends or weekdays) for each site by each month.3
2. Multiplied the average day type vehicle counts by the number of weekdays or weekends in each month. This equaled the number of vehicles per site, per month for weekends and weekdays.
3. Multiplied the number of vehicles per site per month for weekends and weekdays by the average number of people per vehicle. This equaled the number of people (or recreation days) per month, for weekends and weekdays;
4. Given the vehicle counts were one point of time, for sites with shorter stays, a length of stay adjustment4 was used to adjust recreation days for all daylight hours. This equaled a revised number of recreation days by site, by month for weekends and weekdays.
5. Added the weekend and weekday estimate up by site and month. This equaled total recreation days by month.
6. Multiplied monthly recreation days by the percent of residents and visitors. This equaled the number of resident and visitor recreation days by site by month.
7. Multiplied the number of resident and visitor recreation days by site by month by the percentage of people participating in each activity (often there were multiple activities per site). This equaled the number of recreation days for residents and visitors by activity, by site and by month.
8. For each activity, summed the total recreation days for residents and visitors for all months and across all sites. This equalled the total recreation days for residents and visitors by activity.
3 If sufficient data was not available seasonal averages were used. On several occasions, annual averages were used. 4 The length of stay adjustment was daylight hours (minus 2 for dusk and dawn) divided by the average hours at the site.
Chilliwack River Rafting PrepCredit Tourism Chilliwack/Robyn Bessenger

28 | Outdoor Recreation Economic Impact Analysis
For mountain biking, volume estimates were triangulated with user-generated data on the popular mountain biking trail application, Trailforks. This method helped ensure consistency with estimates produced for mountain bike economic impact estimates produced in the Sea to Sky Mountain Bike Tourism Economic Impact Analysis managed by the Mountain Bike Tourism Association (MBTA) and allows for better data comparisons.
Estimating Total Economic Impact EstimatesTotal direct spending on 2019 FVRD outdoor recreation was used as an input into economic impact modeling using Statistics Canada’s Provincial-Territorial Input-Output Model (2013)5. This model estimates additional economic impacts beyond the initial expenditures, including induced, indirect, total economic impacts, and job estimates. The model uses multiplier coefficients to determine the above economic impact measures when the total economic output (consumer spending minus consumption taxes) are known for specific expenditure categories.
Tax Revenues were estimated using national and provincial taxation attribution tables developed by Statistics Canada.6
5 Statistics Canada, Input-Output Model Simulations (Interprovincial Model), 2015, 15F0009X2019001, release date April 4, 2019. https://www150.statcan.gc.ca/n1/en/catalogue/15F0009X2019001 6 Statistics Canada, “Government Revenues Attributable to Tourism, 2011.” Catalogue no. 13-604-M-No. 71.
Direct Outdoor Recreation ExpendituresTwo kinds of recreation spending were estimated: daily spending by residents and visitors, and annual spending by residents on equipment and transportation.
The following steps were taken to estimate spending:
1. To estimate daily spending for residents, total recreation days by activity were multiplied by average daily spending on transportation and fuel, equipment purchases, equipment rental (that day), food and beverages and shopping.
2. To estimate daily spending for visitors, total recreation days by activity were multiplied by average daily spending on accommodation, transportation and fuel, equipment purchases, equipment rental (that day), food and beverages and shopping.
3. To estimate annual spending for residents, total recreation days by activity were divided by the average number of days residents participated in that activity each year. This equalled the number of residents participating in each activity each year. The number of residents were multiplied by annual outdoor recreation expenditures on equipment rental, purchase and transportation.
4. All of these expenditures were added together to equal total direct spending on outdoor recreation in the FVRD in 2019.
Chilliwack RiverCredit Jan Wallin

Results | 3130 | Outdoor Recreation Economic Impact Analysis
RESULTS
Volume and ExpendituresOverviewOverall, in 2019, there were 7,405,010 outdoor recreation days in the FVRD, which generated $948 million in direct spending. In total, 60% of total recreation days were undertaken by FVRD residents while 40% were visitors.
This chapter includes results in the following sections:
» Outdoor Recreation Volume and Spending
» Economic Impacts
» Characteristics of Outdoor Recreation Participants
» Characteristics of Visitor Trips
» Indigenous Cultural Experiences
» Experience Evaluation
» Outdoor Recreation Business Insights
Table 4: Outdoor Recreation Days and Spending (2019)
2019 Outdoor Recreation Days and Spending
Residents Visitors TotalIndependent
Outdoor Recreation Days 4,053,477 1,976,779 6,030,256
Direct Outdoor Recreation Expenditure ($ million)
$194.9 $192.3 $387.2
Annual Equipment Spending ($ million) $433.7 $433.7
Guided/Commercial RecreationOutdoor Recreation Days 420,237 954,517 1,374,754
Direct Spending ($ million) $25.7 $101.1 $126.8
Total
Outdoor Recreation Days 4,473,714 2,931,296 7,405,010
Direct Spending ($ million) $654.3 $293.4 $947.7Note: People attending events are included as independent recreationists
Recreation DaysThe majority (81%) of outdoor recreation days were independent, while fewer (19%) were guided/commercial recreation. Not surprisingly, the majority of recreation days were in the summer, followed by the spring and fall. A higher proportion of visitor recreation days occurred in the summer than resident recreation days.
The most common activities were hiking/trail running at over 1,664,344 recreation days, followed by camping (1,515,676 recreation days), and walking/dog walking (1,453,954 recreation days). Sport fishing totalled 581,342 recreation days, followed by swimming/beach/waterside activities (383,826) or visiting a park, picnicking or using playground equipment (279,784).
As might be expected, more FVRD residents than visitors participated in almost all activities, with the exceptions being camping, rafting, flight tours, snowmobiling, climbing/scrambling and horseback riding.
Figure 3: Seasonality of Recreation Days (% of Total)
54%
28%
38%
24%
10%
22%19%
5%
Spring Summer Fall Winter
Visitor
Resident
The IllusionsCredit Hamish Baird

Results | 3332 | Outdoor Recreation Economic Impact Analysis
Table 5: 2019 FVRD Outdoor Recreation Days by Activity Type (Independent & Guided)
Activity Resident Visitor Total % of TotalHiking/Trail Running 999,893 664,451 1,664,344 22.48%
Camping 547,851 967,825 1,515,676 20.47%
Walking/Dog Walking 1,112,717 341,237 1,453,954 19.63%
Sport Fishing 325,530 255,812 581,342 7.85%
Swimming/Beach/Waterside Activities 268,158 115,669 383,826 5.18%
Park/Picnic/Play in Park 218,718 61,066 279,784 3.78%
Canoeing/Kayaking/SUP 137,242 94,323 231,565 3.13%
Mountain Biking 125,363 64,018 189,380 2.56%
Sightseeing/General Leisure 134,731 53,556 188,287 2.54%
Nature Interpretation/Ecotours/Wildlife Viewing 97,807 89,628 187,435 2.53%
Motorized Boating/Jet Skiing/Waterskiing/Boat Rentals 105,926 36,421 142,347 1.92%
Adventure Race/Event (Participating, Watching, Volunteering) 86,170 30,974 117,143 1.58%
Attraction (e.g. Watersports, Nature at Farms) 66,325 49,625 115,950 1.57%
Road Cycling/Gravel Grinding/Cycling Tours 71,601 14,524 86,125 1.16%
Downhill Skiing/Snowboarding/Cross Country and Backcountry Skiing 58,162 10,481 68,643 0.93%
Photography 37,546 14,212 51,758 0.70%
Motorized Off Road Vehicles (ATV/dirt bike/other) 32,065 18,779 50,844 0.69%
Hunting 35,495 1,244 36,739 0.50%
Rafting 2,201 21,678 23,878 0.32%
Flight Tours 2,181 17,820 20,001 0.27%
Caving 4,308 2,419 6,728 0.09%
Snowmobiling 1,995 2,072 4,067 0.05%
Climbing/Scrambling 985 2,536 3,521 0.05%
Horseback Riding 334 594 927 0.01%
Sky Diving/Paragliding/Air Sports 411 334 746 0.01%
Grand Total 4,473,714 2,931,296 7,405,010 100%
In 2019, there were an estimated 1,374,754 guided/commercial recreation days in the FVRD. Visitors (non-residents of the Fraser Valley) constituted the majority (69%) of those recreation days. Camping at private campgrounds was the most popular activity, followed by visits to attractions, nature interpretation/ecotours, winter sports, sport fishing, mountain biking and rafting.
Figure 4: Outdoor Recreation Days by Activity and User Type (% of Total)
Hiking/Trail Running
Camping
Walking/Dog Walking
Sport Fishing
Swimming/Beach/Waterside Activities
Park/Picnic/Play in Park
Canoeing/Kayaking/SUP
Mountain Biking
Sightseeing/General Leisure
Nature Interpretation/Ecotours/Wildlife Viewing
Motorized Boating/Jet Skiing/Waterskiing/Boat Rentals
Adventure Race/Event (Participating, Watching, Volunteering)
Attraction (e.g. Watersports, Nature at Farms)
Road Cycling/Gravel Grinding/Cycling Tours
Downhill Skiing/Snowboarding/Cross Country and Backcountry Skiing
Photography
Motorized Off Road Vehicles (ATV/dirt bike/other)
Hunting
Rafting
Flight Tours
Caving
Snowmobiling
Climbing/Scrambling
Horseback Riding
Sky Diving/ Paragliding/Air Sports
Visitor
Resident
0%
0%
0%0%
0%
22%
12%23%
33%
12%25%
7%9%
6%4%
5%2%
3%3%3%2%3%2%
2%3%
2%1%2%1%
1%2%2%
0%1%
1%
1%1%1%
0.7%
0.6%
0.1%0.1%
0.07%0.04%
0.09%0.02%
0.02%0.01%
0.01%0.01%

Results | 3534 | Outdoor Recreation Economic Impact Analysis
Table 6: Guided/Commercial Recreation Business Recreation Days
Resident Visitor Total % of TotalCamping 245,988 737,965 983,953 71.57%
Attraction 66,325 49,625 115,950 8.43%
Nature Interpretation and Ecotours 28,666 59,741 88,407 6.43%Winter Sports (Skiing/Snowboarding/Backcountry Skiing)
56,020 7,130 63,150 4.59%
Sport Fishing 3,970 36,957 40,927 2.98%
Mountain Biking 8,864 15,725 24,589 1.79%
Rafting 1,556 20,092 21,648 1.57%
Flight Tours 2,181 17,820 20,001 1.45%
Boat Rentals 4,590 4,590 9,180 0.67%
Canoein/Kayaking/SUP 1,658 2,490 4,147 0.30%
Adventure Race/Event 203 958 1,161 0.08%
Hiking/Trail Running 79 965 1,044 0.08%
Cycling Tours 2 401 403 0.03%
Air Sports 135 60 195 0.01%
Total 420,237 954,517 1,374,754 100%
Outdoor Recreation SpendingIn total, $948 million was spent directly on outdoor recreation activities in the FVRD in 2019. The majority (69%) of direct spending was attributed to FVRD residents while the remaining 31% was from visitors. The proportion of resident spending was much higher than visitors for at least two reasons:
1. There were 1.5 million more resident than visitor outdoor recreation days, and
2. For resident expenditure estimates, both daily equipment purchases/rentals, and larger, annual equipment purchases (e.g. snowmobile, bike, etc.) made within the FVRD were included. For visitors, only equipment purchases/rentals made within the FVRD that day were included.
Figure 5: Total Recreation Days and Direct Spending
Outdoor recreation spending by FVRD residents was $654.3 million which included items associated with daily trips to outdoor recreation places (34%) and annual spending on equipment purchase and maintenance (66%). The daily spending includes $25.7 million at FVRD outdoor recreation businesses.
Figure 6: FVRD Resident Outdoor Recreation Spending (Total - $654.3 m)
Visitors spent $293.4 million in the FVRD on outdoor recreation, just over a third (34%, $101.1 million) was spent on guided/commercial recreation experiences. Daily visitor expenditures totalled $192.3 million.
Altogether, resident daily independent direct spending totalled $628.6 million. Resident expenditures were more than three-quarters (77%) of daily spending, while the remaining 23% was spent by visitors to the region.
Residents spent most on food and beverages (36%) equipment purchases (32%), local transportation (22%), followed by and shopping (14%) and equipment rental (1%). Visitors spent the most on food and beverage (30%), followed by local transportation (20%), equipment purchase (14%), accommodation (20%) and shopping (8%). Note that many visitors were in the FVRD for the day and did not need overnight accommodation.
Figure 7: Daily Outdoor Recreation Spending (% of Total)
31%
60%69%
40%
Recreation Days
Direct Spending
Visitor
Resident
Vedder Mountain ClassicCredit David Urban
Food & Beverage 36%30%
Equipment Purchase 32%14%
Local Transportation 22%20%
Shopping 8%8%
Equipment Rental 1%4%
Accommodation 0%20%
Other 0%3% Visitor
Resident
Annual equipment purchase,
maintenance, transportation
66%Daily fuel,
equipment, food, beverage and shopping
34%
Results | 3736 | Outdoor Recreation Economic Impact Analysis
In terms of spending on activities, the top five activities were camping at $230 million, followed by sport fishing ($164 million), hiking/trail running ($137 million), swimming/beach/waterside activities ($78 million), and walking/dog walking ($51 million).
For the most part, activity direct spending followed the same distribution (recreation days). However, sport fishing constituted a notably higher proportion of spending (17%) compared to participation (8%) due to the relatively higher average spending per day per person. Alternatively, walking/dog walking was 20% of total recreation days compared to only 5% of direct spending.
Table 7: Direct Outdoor Recreation Expenditures by Activity (Independent and Guided)
Activity Resident Visitors Total % of TotalCamping $145,961,428 $83,669,452 $229,630,880 24.23%
Sport Fishing $115,471,214 $48,289,584 $163,760,798 17.28%
Hiking, Trail Running $73,658,255 $63,694,698 $137,352,952 14.49%
Swimming/Beach/Waterside Activities $70,052,439 $8,021,005 $78,073,443 8.24%
Walking / Dog Walking $25,543,922 $25,483,757 $51,027,679 5.38%
Event (Participating, Watching or Volunteering) $38,662,148 $6,062,825 $44,724,972 4.72%
Motorized Boating/Jet Skiing/Waterskiing/Boat Rentals $32,122,036 $7,801,330 $39,923,366 4.21%
Canoeing Kayaking, SUP $29,452,461 $8,143,931 $37,596,392 3.97%
Mountain Biking $20,954,099 $7,552,504 $28,506,603 3.01%
Park, Picnic, Play in Park $18,600,012 $3,479,485 $22,079,497 2.33%
Motorized Off Road Vehicles (ATV/dirt bike/other) $19,597,922 $2,295,034 $21,892,956 2.31%
Photography $19,800,772 $1,474,155 $21,274,928 2.24%
Sightseeing/General Leisure $15,337,649 $3,602,727 $18,940,376 2.00%
Nature Interpretation/Ecotours/Wildlife Viewing $5,888,330 $10,393,032 $16,281,362 1.72%
DH Skiing/Snowboarding, Cross Country and Backcountry Skiing $6,539,799 $1,464,317 $8,004,115 0.84%
Attraction $2,352,693 $3,745,307 $6,098,000 0.64%
Road Cycling, Gravel Grinding $4,084,966 $1,548,534 $5,633,500 0.59%
Caving $4,645,062 $250,965 $4,896,027 0.52%
Hunting $3,238,364 $129,084 $3,367,448 0.36%
Rafting $763,744 $2,593,638 $3,357,382 0.35%
Flight Tours $237,517 $2,653,174 $2,890,691 0.31%
Snowmobiling $1,109,692 $707,900 $1,817,593 0.19%
Climbing/Scrambling $107,563 $263,077 $370,639 0.04%
Sky Diving/ Paragliding $84,759 $45,249 $130,008 0.01%
Horseback Riding $51,712 $61,601 $113,314 0.01%
Grand Total $654,318,558 $293,426,365 $947,744,921 100%
12345
Top 5 Activitiesby Spending

Results | 3938 | Outdoor Recreation Economic Impact Analysis
Figure 8 : Outdoor Recreation Direct Expenditures (% of Total) In 2019, there was an estimated $126 million of direct spending generated by guided/commercial recreation businesses in the FVRD. The majority (79%) of spending was attributed to visitors. Camping at private campgrounds generated 59% of commercial spending followed by sport fishing, nature interpretation and ecotours, winter sports and attractions.
Table 8: Guided/Commercial Recreation Business Revenues (Spending)
Resident Visitor Total % of TotalCamping (Private Campgrounds) $11,432,340 $63,815,603 $75,247,943 59.80%
Sport Fishing $1,513,792 $15,570,058 $17,083,850 13.58%
Nature Interpretation and Ecotours $2,546,777 $7,697,186 $10,243,963 8.14%Winter Sports (Downhill Skiing/Snowboarding, Backcountry Skiing)
$5,900,507 $964,893 $6,865,400 5.46%
Attraction $2,352,693 $3,745,307 $6,098,000 4.85%
Flight Tours $237,517 $2,653,174 $2,890,691 2.30%
Mountain Biking $776,972 $2,007,358 $2,784,330 1.42%
Rafting $110,342 $2,429,133 $2,539,475 2.02%
Boat Rentals $413,100 $688,500 $1,101,600 0.88%
Canoeing/Kayaking/SUP $334,651 $602,274 $936,925 0.74%
Hiking/Trail Running $33,428 $467,460 $500,888 0.40%
Adventure Race/Event $62,618 $353,807 $416,425 0.33%
Cycling Tours $297 $83,583 $83,880 0.07%
Air Sports $29,700 $16,800 $46,500 0.04%
Total $25,744,734 $101,095,135 $126,839,869 100%
Cascade Falls Regional ParkCredit Tourism Abbotsford
Camping
Sport Fishing
Hiking/Trail Running
Swimming/Beach/Waterside Activities
Walking/Dog Walking
Event (Participation, Watching or Volunteering
Motorized Boating/Jet Skiing/Waterskiing/Boat Rentals
Canoeing/Kayaking/SUP
Mountain Biking
Park/Picnic/Play in Park
Motorized Off Road Vehicles (ATV/dirt bike/other)
Photography
Sightseeing/General Leisure
Nature Interpretation/Ecotours/Wildlife Viewing
Downhill Skiing/Snowboarding, Cross Country and Backcountry Skiing
Attraction
Road Cycling/Gravel Grinding
Caving
Hunting
Rafting
Flight Tours
Snowmobiling
Climbing/Scrambling
Sky Diving/Paragliding
Horseback Riding
Visitor
Resident
29%22%
18%16%
11% 22%11%
3%4% 9%
6%2%
3%5%
3%5%
3%3%
3%1%
3%1%
3%1%
1%2%
1%4%
1%0%0%
1%
1%0%
0%1%
0.5%0%
1%0%
1%0%
0.2%0.17%
0.1%0.02%
0.02%0.01%
0.02%0.01%

Results | 4140 | Outdoor Recreation Economic Impact Analysis
Economic ImpactsIn total, there was $948 million in direct spending as a result of FVRD outdoor recreation in 2019. When direct, indirect and induced spending were accounted for, the economic impacts of the outdoor recreation industry in the FVRD totalled:
» $1.52 billion in total impact
» $568 million in Gross Domestic Product (GDP)
» 10,262 jobs
» $258 million paid in taxes, including $116 million in federal taxes (45%), $126 million (in provincial taxes (49%) and $15.7 million in municipal taxes (6%)
Table 9:Total Economic Impacts
2019 FVRD Outdoor Recreation Economic ImpactsDirect Outdoor Recreation Expenditures $947,750,730
Direct Economic Output1 $853,356,486
Total Impact (includes indirect2 and induced3 impacts) $1,519,749,122
GDP $568,206,819
Employment (jobs)4 10,262
Total Taxes5 $257,788,199
Federal Taxes $116,004,689
Provincial Taxes $126,058,429
Municipal Taxes $15,725,080
1. Direct economic output: Expenditures of local residents and visitors on recreation-related items in the Fraser Valley region, minus consumption taxes – including equipment, accommodation, food & beverage, local transportation, and other items.
2. Indirect economic output: Expenditures by recreation-related businesses on input items, such as a hotel purchasing financial services and insurance, or physical assets such as beds, televisions, etc.).
3. Induced economic output: Primarily expenditures by employees of recreation-related businesses in the local economy, on items such as food, entertainment, housing, etc.
Figure 9: Gender of Recreationists in FVRD
4. Jobs: the number of specific jobs offered by recreation-related businesses as a result of recreationist expenditures in the study region.
5. Tax Revenues: The total amount of direct taxation revenue resulting from i) recreationist consumer taxes; ii) business income taxes; iii) Employee income taxes; and iv) other fees/surcharges/taxes.
Estimating tax revenue attributable to recreation activity is challenging due to the multiple and varying layers of business taxes (income tax, property tax, payroll tax), employee income taxes, recreationist consumption taxes (GST/PST), municipal parking, and various other fees, levies, and surcharges. The tax revenues attributable to recreation in this study are therefore only initial, high-level estimates, based on national and provincial average tax revenues associated with recreation and tourism expenditures.
It should be noted that most, though not all of this $1.5 billion in economic impact would accrue directly to the Fraser Valley region. The Statistics Canada Input-Output Model allows estimates of economic impact to be constrained to (confined within) either Canada overall, or within each province/territory. The $1.5 billion in total economic output is the total economic impact to the BC economy – not just the FVRD area. In other words, recreationist spending in the Fraser Valley will create “spinoff” impacts throughout the BC economy, not just in the Fraser Valley. For example, if a hotel purchases furniture from the interior of BC or a retail outlet purchases business insurance from Metro Vancouver, these economic impacts would accrue to the BC economy but not directly to the Fraser Valley Regional District economy.
However, 100% of direct output will accrue to the Fraser Valley region, by definition, whereas the majority of induced and indirect economic impacts can be expected to accrue to the region. Indirect impacts result from recreation related businesses purchasing products and services from wholesalers and suppliers (for example, hotels/restaurants purchasing furniture, equipment, legal/accounting services, etc.). With the large geographic region and widespread availability of wholesalers and professional service providers in the region, similar studies would suggest that well over 50% of indirect impacts would accrue to the Fraser Valley region. Induced impacts are principally recirculated employee salaries throughout the local economy, on items such as housing, food, transportation, retail items, etc. Again, considering the large geographic size of the region and widespread availability of these products and services, well over 50% of induced impacts could be assumed to accrue directly to the Fraser Valley region.
Characteristics of Outdoor Recreation Participants
1 For the purposes of this study, gender was observed by the recording sampler; recreationists were not asked their gender.
More than half of outdoor recreation participants in the FVRD were male (61%)1. Interestingly, the trend was more pronounced in visitors (68% male) than residents (58% male), suggesting that male recreationists travel in higher relative proportion to female recreationists.
The region can be considered to have a comparatively broad distribution of recreation users, with nearly an equal proportion of trail users being 45-54 years old as 25-34 years old (20%). The most common age group of
recreationists was 35-44 years old (24%). Overall, residents and visitors had a similar age profile.
Proportions of males were more likely to be higher in activities such as mountain biking, sport fishing, and motorized off road vehicle recreation. In contrast, females were more likely to participate in hiking/trail running and walking/dog walking.
32%
58%42%
68%
Male Female
61%
39%
Visitor
Resident
Total
Figure 10: Age of Recreationists in FVRD
Under 24 years
25-34 years
35-44 years
45-54 years
54-64 years
65-74 years
75 years or older
25%23%24%
6%8%7%
20%22%20%
22%20%21%
15%18%16%
10%8%10%
2%2%2%
Visitor
Resident
Total
Results | 4342 | Outdoor Recreation Economic Impact Analysis
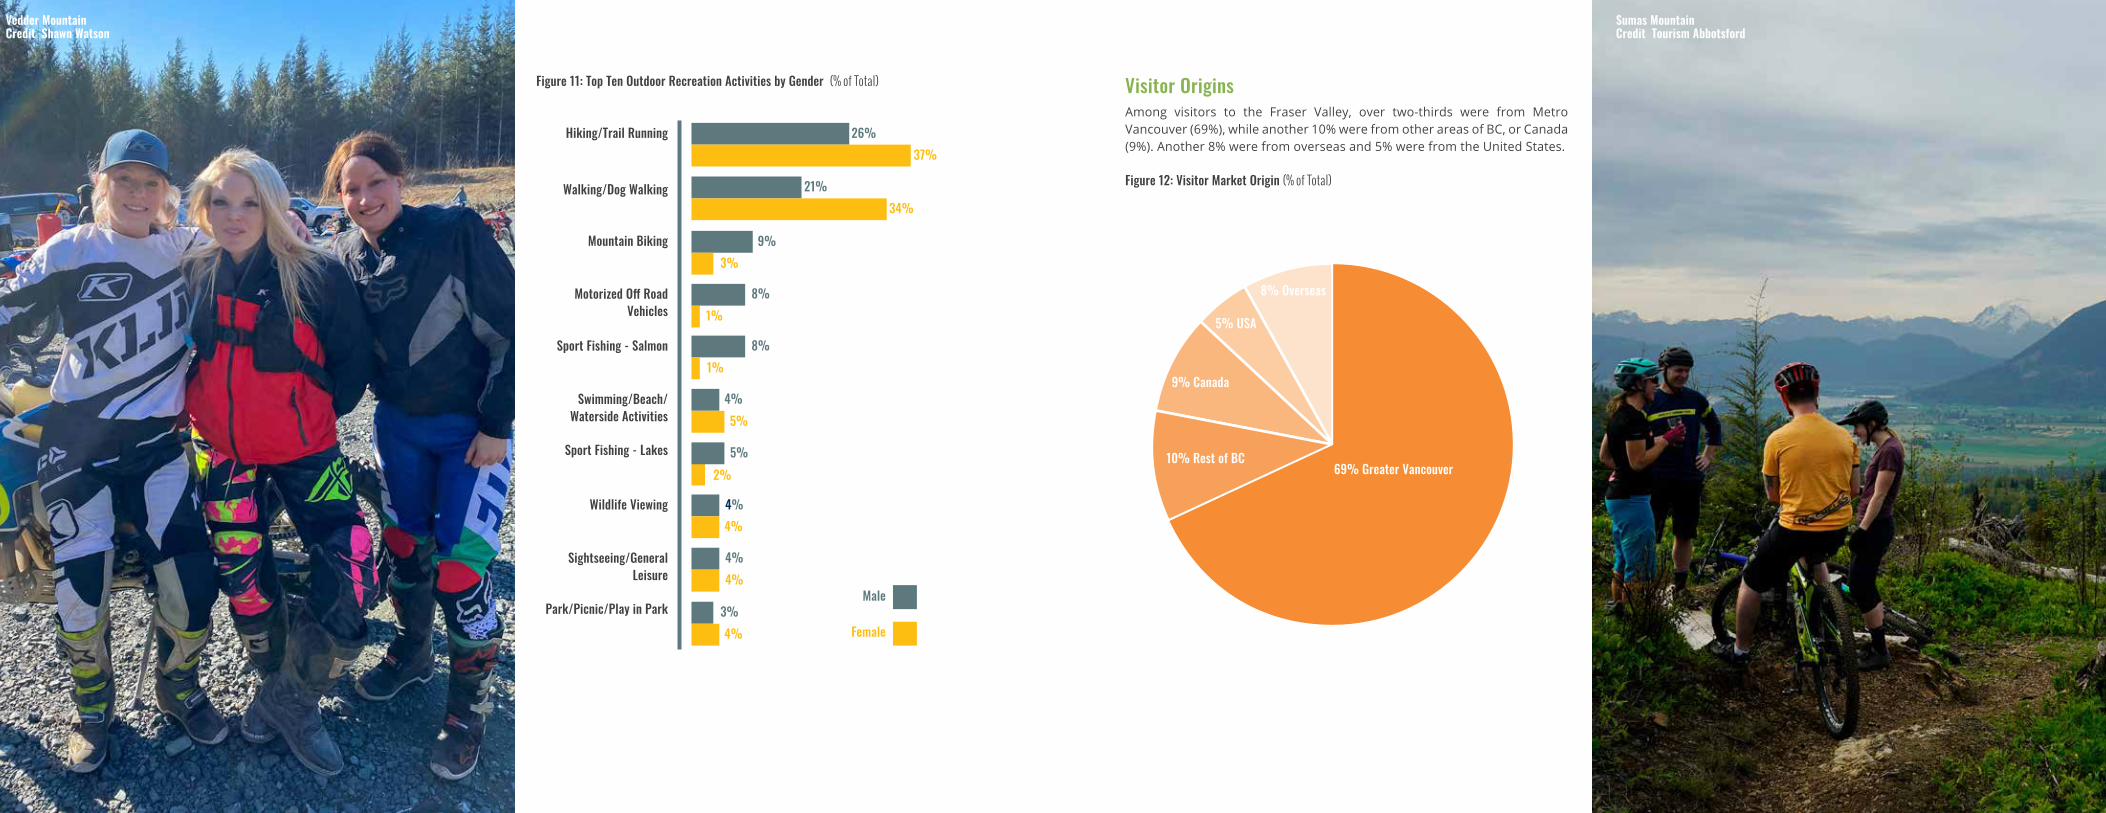
Visitor Origins Among visitors to the Fraser Valley, over two-thirds were from Metro Vancouver (69%), while another 10% were from other areas of BC, or Canada (9%). Another 8% were from overseas and 5% were from the United States.
Figure 12: Visitor Market Origin (% of Total)
Figure 11: Top Ten Outdoor Recreation Activities by Gender (% of Total)
Hiking/Trail Running 26%37%
Walking/Dog Walking 21%34%
Mountain Biking 9%3%
Motorized Off Road Vehicles
8%1%
Sport Fishing - Salmon 8%1%
Swimming/Beach/Waterside Activities
4%5%
Sport Fishing - Lakes 5%2%
Female
Male
Wildlife Viewing4%
Sightseeing/General Leisure
4%4%
Park/Picnic/Play in Park 3%4%
4%
Vedder MountainCredit Shawn Watson
69% Greater Vancouver10% Rest of BC
9% Canada
5% USA
8% Overseas
Sumas MountainCredit Tourism Abbotsford

Results | 4544 | Outdoor Recreation Economic Impact Analysis
Membership in an Outdoor Club An important aspect of recreation planning is whether recreationists belong to a formalized outdoor club, as outdoor clubs assist with the coordination of recreationists, enhanced recreation area management, and stronger compliance with rules and regulations.
Approximately 15% of FVRD outdoor recreation participants were members of a BC outdoor club. Residents and visitors were similar in their club membership.
Figure 13: BC Outdoor Club Membership (% of Total)
Among activity sectors, snowmobilers (53%) and mountain bikers (36%) were the most likely to belong to a BC outdoor club. The next highest proportion was for motorized off road vehicle users, for which nearly one-quarter (24%) of riders belong to a club.
Figure 14: Membership in BC Outdoor Club by Activity Type (% of Total)
86%
16%
84%
14%
Yes No
15%
85% Visitor
Resident
Total
Snowmobiling
36%Mountain Biking
24%Motorized Off Road Vehicles
17%
Motorized Boating
15%
Canoeing/Kayaking/SUP
16%
Hiking/Trail Running
12%
Sport Fishing
10%
Event Participation/Watching
Camping
2%
Backcountry Skiing/Snowshoeing
9%
13%Sightseeing/General Leisure
Wildlife Viewing
Road Cycling/Gravel Grinding
Swimming/Beach Activities
Walking/Dog Walking
Park/Picnic/Play in Park
53%
19%
18%
15%
15%
13%
Sumas MountainCredit Tourism Abbotsford

Results | 4746 | Outdoor Recreation Economic Impact Analysis
Experience Level Understanding the experience level of recreationists is a key factor when planning for infrastructure, marketing, and overall management systems. More experienced recreationists tend to desire more challenging terrain, more diverse and larger terrain in which to recreate. On the other hand, less experienced recreationists typically desire less challenging and safer terrain with lower associated risk levels, and additional clarity and support with aspects such as signage/wayfinding information, including maps and directional signage with marked distances.
The most common experience level stated by recreationists was “intermediate,” with nearly half (49%) of outdoor recreation participants rating their experience level thusly.
Fewer are advanced (23%) or expert (16%) or beginner (12%). More visitors rate their experience level as advanced or expert (50%) compared to residents (34%). This difference is sufficient to consider stratifying visitors and residents when developing and managing areas, to ensure the appropriate mix of more moderate, supported terrain with more challenging and “rugged” or “natural” terrain covering larger geographic areas for linear trails and managed recreation areas.
Figure 15: Activity Experience Level (% of Total)
Activities for which participants rated themselves as advanced/expert in the highest proportion (greater than 50%) were for sightseeing/general leisure, sport fishing, motorized boating, mountain biking, and snowmobiling.
Fewer outdoor recreation participants rated themselves as advanced/expert at backcountry skiing, snowshoeing/X-country skiing, wildlifed viewing, and road cycling/gravel grinding.
Figure 16: Advanced/Expert Experience Level by Activity (% of Total)
Beginner
Intermediate
Advanced
Expert
20%30%
23%
11%15%
12%
56%35%
49%
14%20%
16%
Visitor
Resident
Total
Total61%Sightseeing/General Leisure
56%Sport Fishing
50%
Motorized Boating
46%
Snowmobiling48%
Mountain Biking
31%
Canoeing/Kayaking/SUP
26%
Camping
Swimming/Beach Activities
24%
Hiking,/Trail Running
24%
36%Motorized Off Road
Walking Dog/Walking
Backcountry Skiing/Snowshoeing
Event Participation/Watching
Wildlife Viewing
Road Cycling/Gravel Grinding
39%
56%
55%
43%
36%
34%
19%Park/Picnic/Play in Park
Yale WaterfrontCredit Geoff Genge

Results | 4948 | Outdoor Recreation Economic Impact Analysis
Characteristics of Visitor TripsMost FVRD visitor trips were primarily to participate in outdoor recreation (80%). A lower proportion (12%) were motivated to travel primarily to visit friends and relatives (VFR) (12%), and to participate in other leisure activities (5%). Only 2% of recreationists were in the FVRD primarily for business. See Figure 17. These results suggest some opportunities to cross-market the region as a general leisure/VFR/recreation destination, and limited opportunities to market the region as a co-branded business/recreation destination.
Figure 17: Primary Reason for Trip (% of Total)
Figure 18: Visitor Length of Stay (% of Total)
Average Visitor Length of Stay Slightly more than half of outdoor recreation visitors (54%) were day visitors, while the remaining 46% were overnight visitors.
Half of visitors were in the FVRD for two to three nights (51%), while nearly one-quarter (23%) only stayed one night and an additional 26% stayed more than four nights. The average overnight visitor length of stay was 3.7 nights. See Figure 18.
With more than three-quarters of visitors staying more than one night, destination planners and marketers should consider ways to enhance visitor experiences by developing, managing, and promoting complementary activity sets for visitors.
Figure 19: Visitor Average Length of Stay (% of Total)
Fall visitors stayed in the region the longest, at 4.3 days per trip. Spring visitors stayed for just over half that duration on average, at 2.6 days. See Figure 20.
This may be a factor to consider in planning shoulder season destination marketing efforts for recreationists, in terms of generating the highest possible visitor “yields” (average expenditures per trip).
Figure 20: Visitor Length of Stay by Season (Average Nights in FVRD)
Visitor Accommodations Used By far the most common type of accommodation used by recreationists was campgrounds, with more than one-third (37%) of respondents camping in the region. These results here are more than three-times the percentage of camping as an accommodation type (10%) for B.C. residents on a trip within the province.1 This result demonstrates the importance of campground infrastructure for recreation travelers.
Figure 21: Overnight Visitor Accommodation Type (% of Total)
1 Destination B.C., “Market Profiles – British Columbia, October 2018.” .
Outdoor Recreation12%Visiting Friends & Relatives
5%Other Leisure Activities
1%
Business
Event Watching/Participation
Passing Through
80%
2%
2%
46%Overnight
54%Day
1 Night51%2 - 3 Nights
14%4 - 6 Nights
7+ Nights
23%
12%
Spring
Summer
Fall
Winter
Overall
2.6 days
3.8 days
4.3 days
3.2 days
3.7 days
Campground24%Hotel/Motel
23%Friends/Relatives
1%
Back Country/Car Camping
Own 2nd Home in FVRD
B & B/Air BnB
37%
8%
6%
0%
Home Outside FVRD
Hostel
Other 0%
0%
Bridal FallsCredit David Urban

Results | 5150 | Outdoor Recreation Economic Impact Analysis
Indigenous Cultural ExperiencesThe study also included a summary evaluation of the awareness, interest, and perspectives of FVRD residents and visitors to the region regarding Indigenous culture and history. Various studies on traveller motivations and intentions with regard to travel to/within BC have demonstrated an increasing interest in Indigenous culture among residents of BC and visitors to the Province. Considering the strong connection of Indigenous peoples to the land and natural resources, and shared interest with recreationists in environmental sustainability, this analysis will be crucial information for outdoor recreation and tourism planners in the region, including Indigenous community planners. More than half (53%) of outdoor recreation participants responded they were very interested (8+/10) in seeing Indigenous cultural interpretation information in the recreation area. One-third gave a 10/10 to this question, with both residents and visitors to the region registering similar results.
These results suggest a very strong linkage between outdoor recreation participant interest in expanding their knowledge and awareness of Indigenous culture and heritage, and opportunities to enhance visitor experiences and therefore grow the outdoor recreation economy. While raising awareness of Indigenous heritage and supporting reconciliation are desirable outcomes independent of economic considerations, there are also market opportunities with specific activity types. These activity areas could be prioritized for “experience enhancement” – the improvement of experiences through visual cues, educational information, wayfinding, itinerary development, and other experiential enhancers.
Another key finding is that despite strong interest in Indigenous cultural interpretation, only one-third of outdoor recreation participants could name the Indigenous Peoples on whose traditional lands they were recreating.
Figure 22: Interest in Indigenous Cultural Interpretation (% of Total) Figure 23: Awareness of Indigenous Peoples’ Traditional Lands
Q. Can you name the Indigenous Peoples on whose traditional lands we are on today?
Perhaps not surprisingly, nearly twice the proportion of FVRD residents (40%) compared with visitors (21%) were able to name the Indigenous Peoples on whose traditional lands they were on.
The sampling team indicated that several respondents were unclear about the difference between bands, nations, tribal councils, cultural/linguistic groups (e.g., Coast Salish), and other organizational structures representing Indigenous Peoples, and were therefore uncertain how to respond to this question. Combined with the generally low awareness levels, these suggest that awareness building opportunities exist for enhancing understanding about the Indigenous culture and heritage in recreation areas in the FVRD. This will, ultimately, improve recreationist experiences – especially for visitors but also locals – which should lead to higher participation rates, greater recreation satisfaction, and higher overall economic benefits to Indigenous and non-Indigenous communities.
In the survey, visitors were then asked about the importance of Indigenous culture and heritage learning opportunities as a trip motivator. On a scale of 0-10, only 3% of FVRD visitors responded their trip was motivated by Indigenous culture and heritage learning opportunities (scores of 8+/10). Most (89%) responded that Indigenous culture and heritage learning opportunities were not a primary motivating factor for their trip (0/10 on this question). This is perhaps not surprising, considering that recreation-focused travellers have a primary intention of specific recreation objectives, unlike general leisure travellers who have a broader diversity of motivations for travel.
0
1
2
3
4
5
6
4%2%
3%
13%16%
14%1%1%1%
1%2%2%2%2%2%
13%11%
12%6%
3%5%
Visitor
Resident
Total
7
8
9
6%10%
7%14%14%14%
7%5%
6%
1032%
35%33%
66%NO
34%YES
Bad Rock ToursCredit Robyn Bessenger

Results | 5352 | Outdoor Recreation Economic Impact Analysis
Experience EvaluationNet Promoter ScoreThe study calculated a Net Promoter Score (NPS) to assess the likelihood that recreationists in the Fraser Valley would recommend the region as a recreation destination to friends, family, and colleagues. Overall, 86% of outdoor recreation participants in the FVRD were classified as Promoters (9 or 10 out of 10). Only 3% of respondents were Detractors (0 to 6 out of 10), and 11% were Passives (7 or 8 out of 10).
A Net Promoter Score of 83 is exceptionally high for any type of tourism activity, tourism region, sector, or individual business. Consumer research commonly shows the NPS of individual businesses typically average in the +15 to +35 range, including restaurants, hotels, and guided tours. The NPS for B.C. resident travellers within the Province is typically in the low-to-mid 60s, while the NPS overall is typically around 70 for all travellers in B.C. according to visitor exit surveys conducted periodically by Destination BC.
FVRD residents (NPS = 86), overnight visitors (NPS = 82), females (NPS = 88) and middle-aged outdoor recreation participants (35 - 54; NPS = 86) registered higher NPSs than other outdoor recreation participants. Also, those with beginner (NPS = 81) and intermediate NPS = 87) skill levels had higher NPSs than those with intermediate (NPS = 80) and advanced (NPS = 75) skill levels. There was no difference in NPS scores between people who are B.C. outdoor recreation club members and those who are not.
Table 10: Net Promoter Score Summary
% of FVRD Outdoor Recreation ParticipantsPromoter Passive Detractor NPS
Total 86% 11% 3% 83.3 Resident 88% 10% 2% 85.7 Visitor 82% 13% 5% 77.6Length of Stay (Visitor Only) Day 80% 15% 6% 73.7 Overnight 85% 12% 3% 82.1Member of BC Outdoor Club Yes 87% 9% 4% 83.2 No 86% 11% 3% 83.2Level of Activity Experience Beginner 85% 12% 3% 81.1 Intermediate 89% 10% 1% 87.4 Advanced 84% 12% 4% 79.9 Expert 81% 13% 6% 74.8Gender Male 84% 12% 4% 80.5 Female 89% 9% 2% 87.6Age Under 24 Years 80% 15% 4% 75.9 25-34 Years 86% 11% 3% 82.9 35-44 Years 89% 9% 3% 86.1 45-54 Years 89% 9% 2% 86.4 55-64 Years 85% 11% 4% 81.1 65-74 Years 81% 16% 3% 77.8 75 Years or Older 87% 11% 2% 84.9
The Net Promoter Score varied moderately by activity, but all activities registered very high NPSs overall. The NPS was the highest for road cycling/gravel grinding (NPS = 92), walking/dog walking (NPS = 89), swimming/waterside activities (NPS = 88), snowmobiling (NPS = 88) and mountain biking (NPS = 87). Sightseeing/general leisure (NPS = 74), sport fishing (NPS = 67) and motorized boating (NPS = 64) had the lowest NPS scores. While these are still positive scores, and above the provincial average of 63 (2017 & 2018) for all BC tourists within the province, it is statistically lower than any other activity. Trends and possible explanations for this are identified in the following sections.
Figure 24: Net Promoter Score for Outdoor Recreation in FVRD
Q. On a scale of 0 to 10, with 10 being the highest, how likely are you to recommend the Fraser Valley as an outdoor recreation destination to a friend or colleague?
86%PROMOTER
11%PASSIVE
DETRACTOR3%
%PROMOTERS - % DETRACTORS = NPS
NPS = 83

Results | 5554 | Outdoor Recreation Economic Impact Analysis
Figure 25: Net Promoter Score by Activity There is little apparent correlation between the NPS and type/nature of activity, aside from motorized activities generally registering higher NPS than non-motorized. Front-country and mid/back-country activities are equally distributed through the NPS range, and both hard adventure activities (e.g., mountain biking, ski touring, snowmobiling, etc.) and soft adventure activities (e.g., hiking, dog walking, canoe/kayak/SUP, etc.) are similar.
NPS is also incorporated into the following section on recreationist satisfaction with various aspects of their outdoor recreation experiences, to determine whether various aspects of satisfaction – such as crowding, or signage/wayfinding for example – are strongly correlated with, and possibly impact overall satisfaction as represented by the NPS for each activity.
Satisfaction with Components of Outdoor Recreation ExperiencesOutdoor recreation participants were also asked to provide a rating of 0 to 10 on a variety of aspects associated with their recreation activities. These aspects include the following:
» Overall Quality of the Trail/Recreation Area
» Accessibility/Parking
» Signage/Wayfinding On-Trail
» Crowding on Trails/In Area
» Friendliness of Locals
In total, outdoor recreation participants gave an average score of 8.9/10 for the “overall quality” of recreation areas/trails in the region. This is another very positive result for the region’s outdoor recreation activities. Satisfaction scores were similar between residents and visitors. When broken down into components, “friendliness of locals” had the highest overall satisfaction level (9.5/10), followed by “access/parking,” (8.6/10) and “signage and wayfinding” (8.5/10). Crowding had somewhat lower scores overall, but was still quite positive with an average of 8.0/10.
By activity, backcountry skiing/snowshoeing/XC skiing, walking/dog walking, snowmobiling, event participation/watching, hiking/trail running, and camping had the highest overall quality ratings of the recreation site/trail scores. Sport fishing, sightseeing/general leisure, canoeing, kayaking, SUP and motorized boating had the lowest overall quality of their recreation site/trail scores.
Figure 26: Recreationist Satisfaction
As noted above, friendliness of locals had the highest overall score of all the quality rating components. By activity, friendliness of locals scores ranged from 8.9 to a very high 9.8. Snowmobiling (9.2) and sport fishing (8.9) had the lowest average scores for friendliness of locals.
Average access/parking scores ranged from a low of 7.4 for canoeing/ kayaking/SUP to a high of 9.0 for “hiking/trail running.” Swimming/waterside activities (8.0) and snowmobiling (8.0) also had relatively low scores for access/parking. The low scores for access/parking for canoeing/kayaking/SUP are most likely related to the difficulty in carrying large equipment to the lake/river/stream.
All Activities
0%Road Cycling/Gravel Grinding
2%Walking/Dog Walking
3%
Swimming/Beach Activities
3%
Mountain Biking
2%
Snowmobiling
0%
Motorized Off Road Vehicles
5%
Camping
Hiking/Trail Running
8%
Park/Picnic /Play in Park
7%
4%Canoeing/Kayaking/SUP
Event Participation, Watching
Backcountry Skiing/Snowshoeing
Wildlife Viewing
Sightseeing/General Leisure
Sport Fishing
3%
1%
0%
2%
4%
4%
6%Motorized Boating
92.0
88.7
86.7
85.5
86.5
77.1
75.0
67.2
73.9
80.6
83.2
87.7
87.5
84.7
81.5
78.8
63.6
NPS
8%
8%
7%
8%
9%
23%
15%
16%
13%
10%
11%
10%
13%
11%
11%
13%
24%
92%
91%
90%
89%
89%
77%
80%
75%
80%
85%
86%
89%
88%
87%
85%
83%
70%
Overall Quality
Friendliness of Locals
Access/Parking
Signage/Wayfinding
Crowding
8.68.78.6
8.98.88.9
9.69.59.5
8.58.38.5
7.98.18.0
Visitor
Resident
Visitor
PassivePromoter
Detractor

Results | 5756 | Outdoor Recreation Economic Impact Analysis
Figure 27: Overall Quality Rating by Activity (Average Score) Figure 28: Friendliness of Locals Rating by Activity (Average Score) Figure 29: Access/Parking Satisfaction Rating by Activity (Average Score) Figure 30: Signage/Wayfinding Satisfaction Rating by Activity (Average Score)
Backcountry Skiing9.2Walking/Dog Walking9.2Snowmobiling
8.9
Event Participation/Watching
Camping
Hiking/Trail Running
9.2
9.1
9.0
8.9
Park/Picnic/Play in Park
Motorized Off Road Vehicles
Road Cycling/Gravel Grinding 8.9
8.9
8.7
Swimming/Beach Activities
Mountain Biking
Wildlife Viewing
8.8
8.8
8.5
Motorized Boating
Sightseeing/General Leisure
Canoeing/Kayaking/SUP 8.5
8.5
8.4Sport Fishing
Backcountry Skiing9.7Walking/Dog Walking9.2Snowmobiling
9.6
Event Participation/Watching
Camping
Hiking/Trail Running
9.5
9.6
9.7
9.4
Park/Picnic/Play in Park
Motorized Off Road Vehicles
Road Cycling/Gravel Grinding 9.3
9.3
9.5
Swimming,/Beach Activities
Mountain Biking
Wildlife Viewing
9.5
9.8
9.4
Motorized Boating
Sightseeing/General Leisure
Canoeing/Kayaking/SUP 9.4
9.5
8.9Sport Fishing
Backcountry Skiing9.1Walking/Dog Walking9.8Snowmobiling
8.6
Event Participation/Watching
Camping
Hiking, Trail Running
8.3
8.3
8.5
9.0
Park/Picnic/Play in Park
Motorized Off Road Vehicles
Road Cycling/Gravel Grinding 8.8
8.5
8.5
Swimming/Beach Activities
Mountain Biking
Wildlife Viewing
8.3
8.7
8.8
Motorized Boating
Sightseeing/General Leisure
Canoeing/Kayaking/SUP 8.0
7.4
8.0Sport Fishing
Backcountry Skiing8.8Walking/Dog Walking9.0Snowmobiling
8.2
Event Participation/Watching
Camping
Hiking/Trail Running
7.7
9.0
8.6
8.1
Park/Picnic/Play in Park
Motorized Off Road Vehicles
Road Cycling/Gravel Grinding 8.6
8.7
7.9
Swimming/Beach Activities
Mountain Biking
Wildlife Viewing
8.6
8.6
8.0
Motorized Boating
Sightseeing/General Leisure
Canoeing/Kayaking/SUP 8.5
8.9
8.0Sport Fishing

Results | 5958 | Outdoor Recreation Economic Impact Analysis
Figure 31: Crowding Satisfaction Rating by Activity (Average Score)
Similarly, signage/wayfinding average rating scores ranged from a low of 7.7 (backcountry skiing, snowshoeing, XC skiing) to a high of 9.0 (snowmobiling, events). Other relatively low scores were for mountain biking, sightseeing/general leisure and sport fishing.
Overall, crowding in recreation areas is the lowest scoring category of all outdoor recreation performance components. This merits a deeper investigation to understand trends and issues specific to crowding.
Among activities, wildlife viewing was the least crowded, with an average score of 8.7/10, followed by sightseeing/general leisure (8.5), walking/dog
walking (8.3), hiking/trail running (8.1), camping (8.0) and park/picnic/play in park (8.0). The lowest average satisfaction with crowding levels were seen for motorized boating (6.6), sport fishing (6.7), backcountry skiing/ snowshoeing/cross country skiing (7.6), snowmobiling (7.7), and events, road cycling, gravel grinding, and mountain biking (all 7.8).
Not surprisingly, sport fishing scored very low in terms of crowding, with some of the region’s main river fisheries – salmon and steelhead in particular – often having significant user pressure and crowding along the Vedder/Chilliwack River. Some stakeholders indicated that the Vedder/Chilliwack River was more crowded than usual given the 2019 salmon fishing closure on the Lower Fraser River in the FVRD.
A notable trend in the data is that crowding is not correlated with satisfaction levels, as Figure 31 demonstrates. For example, “wildlife viewing” has high levels of satisfaction with crowding but a low overall satisfaction score (as indicated by its Net Promoter Score (NPS) of 7.7/10). On the other hand, sport fishing has very low levels of satisfaction with crowding, and a stronger NPS (8.3/10).
Examining the specific aspects of the recreation experience provides deeper insights into possible factors leading to lower Net Promoter Scores. For example, the activity with the lowest overall NPS is sport fishing. Examining trends in aspects of experiential quality shows that sport fishing generally trends similarly to other activities in terms of perceived overall quality of the recreation area, signage/wayfinding, and access/parking. However, the activity lags by a significant margin all other activities for “friendliness of locals” and “crowding”. These two factors can be highly inter-related as well, with crowded fishing areas leading to potential user conflicts.
Another notable trend is with regard to backcountry skiing, which trends similarly to other recreation activities in all aspects, except for signage/wayfinding. Further analysis of trends in the backcountry skiing activity sector also reveals that this is one of the least experienced groups of recreationists, with only 31% claiming to be either “advanced” or “expert” – compared with an average of 42% for all activities. The combination of being a relatively high-risk activity, coupled with lower skill/experience levels, and lack of directional signage, is the most logical explanation for relatively lower (but still high) NPS of 77 for backcountry skiing. This does raise the question, however, about the degree of user supports that should be maintained for backcountry activities where user responsibility is a paramount management consideration, and there is an expectation of high levels of experience, safety training, and self-sufficiency.
Backcountry Skiing8.3Walking/Dog Walking7.7Snowmobiling
8.0
Event Participation/Watching
Camping
Hiking/Trail Running
7.6
7.8
8.2
8.1
Park/Picnic/Play in Park
Motorized Off Road Vehicles
Road Cycling/Gravel Grinding 7.8
8.0
7.8
Swimming/Beach Activities
Mountain Biking
Wildlife Viewing
7.3
8.7
8.5
Motorized Boating
Sightseeing/General Leisure
Canoeing/Kayaking/SUP 7.5
6.6
6.7Sport Fishing
Hiking Mount Cheam Ridge TrailCredit Alison Stewart
Boat Launch at Island 22 Regional Park

Results | 6160 | Outdoor Recreation Economic Impact Analysis
Figure 32: Highest NPS by Activity with Satisfaction Component Comparison
A similar pattern to backcountry skiing can be found for wildlife viewing, which possesses a less experienced recreation user population and a low NPS. However, there are no specific aspects of the recreation experience that provide an explanation of this relatively lower NPS for wildlife viewing.
There were similar patterns of inter-relationships among satisfaction categories for the activities that had higher overall satisfaction levels. For example, one of the highest rated activities, snowmobiling, demonstrated a Net Promoter Score of 89, which is among the highest for all activity types. However, this activity sector also displayed significant concerns with crowding,
(second-lowest satisfaction level amongst all activities for crowding), but this did not have any apparent impact on overall satisfaction. Perhaps the best explanation for this outcome is that the crowding concerns must have been superseded by other factors, such as the strength of “signage/wayfinding,” satisfaction, for which snowmobiling scored higher than any other activity. This is likely due to the efforts of the Coquihalla Snowmobile Club to plough and groom its management area, including access roads, parking lots, and staging areas, at Britton Creek, while maintaining appropriate directional signage to and from the parking lots and staging areas.
Figure 33: Lowest NPS by Activity with Satisfaction Component Comparison Insights From Outdoor Recreation BusinessesA total of 87 commercial recreation businesses (also called “adventure tourism” businesses) were identified in the FVRD. One-third of those offered sport fishing experiences, while 20% were private campgrounds, and fewer offered nature interpretation/ecotours, flight tours or adventure races/events.
Business CharacteristicsA total of 43 businesses responded to the online business survey. The survey responses revealed that most businesses are small in nature, with revenues of less than $250,000 and fewer than 20 employees. Most businesses were open year-round.
Slightly less than half of the average business revenues were generated from FVRD visitors/tourists (47%). Most of those visitors were from Metro Vancouver (45%), Europe (17%), or the rest of BC (16%) and Alberta (13%). Not surprisingly, more commercial visitors were from international origins than for visitors intercepted in public recreation areas.
Nearly two-thirds (67%) of outdoor recreation business clients were day visitors to the FVRD, while just over one-third (37%) were overnight visitors. This is similar to the ratio of recreationists intercepted in public recreation areas.
Over the past five years, one-third of businesses saw increases in their number of clients, while only 12% responded that their number of clients had decreased. The average growth in client volume was 74%, the average decline in client volume was 9%.
Road Cycling/Gravel GrindingNPS = 92.0
8.99.38.88.67.8
9.29.79.18.88.3
8.89.58.08.67.3
9.29.28.09.07.7
8.79.58.37.97.8
Walking/Dog WalkingNPS = 88.7
Swimming/Beach ActivitiesNPS = 87.7
SnowmobilingNPS = 87.5
Mountain BikingNPS = 86.7
Back Country/X Country Skiing NPS = 77.1
9.29.58.57.77.6
8.89.88.68.68.7
8.59.49.88.08.5
8.48.98.88.06.7
8.59.58.38.96.6
Wildlife ViewingNPS = 75.0
Sightseeing/General LeisureNPS = 73.9
Sport FishingNPS = 67.2
Motorized BoatingNPS = 63.6
Friendliness of LocalsOverall Quality Access/Parking Signage/Wayfinding CrowdingSport Fishing
20%Camping10%Nature Interp/Ecotours
3%
Flight Tours
Airsports
Adventure Race/Event
33%
6%
3%
3%
Attraction
Canoeing/Kayaking/SUP
Boat Rentals 3%
3%
3%
Hiking/Trail Running
Rafting
Mountain Biking
3%
3%
Winter Sports
Cycling Tour 1%
2%
Figure 34: Primary Activity of Commercial Recreation Businesses (Total 87)

Results | 6362 | Outdoor Recreation Economic Impact Analysis
Table 11: Client Demographics for Commercial Recreation Businesses
Average Revenue From Tourism/Visitors 47%Average Number of Employees (range 1-212) 18.7Client Origin (average %)*
Greater Vancouver (outside FVRD) 45% Rest of BC 16% Alberta 13% Rest of Canada 9% Washington State 7% United States 7% Europe 17% Asia 7% Other International 5%Length of Stay*
Average % of Day Visitors 63% Average % of Overnight Visitors 37%Client Volume Increased or Deceased Over Past 5 Years Increased (%) 35% Average % increase in client volume 74% Decreased (%) 12% Average % decrease in client volume 9% No Change (%) 23% Not Operating/Don’t Know (%) 31%Seasonality Year-Round 63% Seasonal 37%Business Revenues Less than $250,000 58% $250,001 - $500,000 8% $501,000 - $750,000 8% $750,001 - $1,000,000 8% $1,250,001 - $1,500,000 4% $1,500,001 - $1,750,000 4% Prefer Not to Answer 12%
* Because reported values are averages, the total sums to more than 100%.
Looking ForwardOutdoor recreation businesses were asked about optimism in revenue growth over the next five years for their business and the overall outdoor recreation sector in the FVRD.1 Nearly two-thirds (63%) of businesses were either optimistic (42%) or very optimistic (21%) about their own business growth. Only 21% were not very optimistic about their own business growth. There were no clear trends in reasons for lack of optimism among these respondents, in either their activities, size of business, or in written comments.
In terms of overall outdoor recreation sector growth, more than half (56%) were either optimistic or very optimistic. More than one-third (36%) of businesses were very optimistic about sector growth, exceeding optimism for their own business. Also, only 4% were not optimistic about sector growth.
Respondents were asked about barriers to growth in the outdoor recreation industry in the FVRD. The most common responses were related to natural resource uncertainty, declining fish stocks, and the impacts of climate change on weather patterns and resources (e.g. rising river temperatures impacting fish populations). Many responses also indicated management concerns related to government policy, including but not limited to licensing, fees, tenure issues, and Indigenous land claims uncertainty.
1 It should be noted that the data gathering component of this study concluded prior to COVID-19 having a devastating impact on the commercial recreation and overall tourism sector in British Columbia. Optimism would almost certainly be considerably lower post-COVID.
1 - Not Optimistic At All 0%4%
2 - Not Very Optimistic 21%0%
3 - Somewhat Optimistic 13%32%
4 - Optimistic 42%20%
5 - Very Optimistic 21%36%
Don’t Know/Not Applicable 4%8%
Own Business
Outdoor Rec Sector
Figure 35: Optimism about the Future
Tamihi RapidsCredit James Wakeling

Conclusions | 6564 | Outdoor Recreation Economic Impact Analysis
CONCLUSIONS: THE FUTURE OF OUTDOOR RECREATION IN THE FVRD
The results of this first-ever comprehensive analysis of the value of outdoor recreation in the FVRD has produced many compelling insights that will be invaluable for understanding and managing this vital sector in the future.
Outdoor recreation provides the FVRD and its many communities with significant and diverse benefits, including economic benefits for recreation-related businesses, their suppliers, and employees, with a total economic impact of approximately $1.5 billion annually (2019). These economic benefits also extend to government taxation revenues at all three levels of government, at approximately $258 million annually (2019), which can be used, in part, to further enhance recreation infrastructure and other supports.
Perhaps just as importantly, or even more importantly, outdoor recreation provides social and environmental benefits to residents of the region, and visitors, with natural resources being conserved and managed for non-extractive purposes. The region’s vast array of generally un-crowded, well-managed recreation areas and trails support healthy lifestyles, help families and communities come together, and bridge inter-cultural differences for diverse peoples with coalescing objectives: getting outdoors for personal enjoyment, exercise, leaving behind the trappings of busy work lives, spiritual connection, and other purposes.
Outdoor recreation in the region also provides citizens with compelling reasons to carefully manage the resources in this vast and varied geography, ensuring that these shared resources are sustainably managed for a variety of environmental and ecosystem services,1 as well as personal enjoyment and fulfillment. Carefully managed natural resources and high-quality recreation areas are a primary component of community building, economic resilience, and are a key factor in drawing youth, families, skilled workers, and new immigrants to the region, through a process known as “amenity migration.”
1 The term “Ecosystem services” includes a wide variety of benefits – often non-economic – that result from having healthy and stable ecosystems. These include non-forest products such as mushrooms and herbs, medicinal resources, carbon sequestration, waste decomposition, flood protection, and a variety of “cultural” services such as film, photography, painting, ecotourism/recreation, spiritual, historical, and other valued uses of natural ecosystems.
Key Findings and Considerations This unprecedented (in British Columbia) and ambitious project, with nearly 2,500 surveys completed, has provided a high-resolution snapshot of outdoor recreation overall, and its many activity sectors, including their size, composition, and characteristics. The reliability of these results, due to the robust sampling program and four-season timeframe for data collection, will be invaluable for decision-makers not only in the Fraser Valley Regional District, but all levels of government, including Indigenous and municipal governments at the local level, as well as the Government of BC and Government of Canada.
Outdoor Recreation Volumes While the FVRD may not yet have an internationally recognized reputation as a world-class outdoor recreation destination, at least not at the level of Vancouver’s North Shore and Sea to Sky corridor, the results of this analysis suggest that, perhaps, it should be considered a strong competitor in the future.
With over 7.4 million recreation days in the FVRD in 2019, the region is already a leading destination for outdoor recreation not only in British Columbia but across Canada and around the world. With over 60% of recreation in the region being undertaken by local residents – and much higher for most trail-based activities such as hiking and mountain biking – the region can be characterized as a “built by locals for locals” destination, which provides for more robust, sustainable, and geographically distributed outdoor recreation opportunities than destinations built primarily for “export revenue,” which focus on a relatively smaller array of high-value, often commercial activities, designed for non-residents.
As this ratio of residents-to-visitors shifts in the future, with relatively more visitors almost certainly bound to recognize the region’s impressive outdoor recreation offerings, careful management will be required to integrate and balance the needs of local residents with visitors, who already provide immense economic benefits to the region.
Canadian Border PeakCredit Hamish Baird

Conclusions | 6766 | Outdoor Recreation Economic Impact Analysis
Economic Impacts The 7.4 million recreation days in the FVRD in 2019 produced more than $948 million in annual direct spending by residents and visitors combined, including public recreation and guided/commercial recreation. With nearly 70% of this spending originating from FVRD residents, we can conclude that the sector is primarily driven by local residents, with the visitor component believed to be growing at a robust but sustainable pace for most activity sectors, and overall.
“Soft” Outdoor Recreation Activities Three of the four most significant economic impacts were for the most common activity sectors, which are defined in tourism and recreation literature as “soft” adventure or recreation activities. These include camping ($230 million), hiking/trail running ($137 million), and swimming/waterside activities ($78 million).
The common characteristic among these three activities is their relative accessibility for a wide variety of outdoor recreationists. These urban interface activities, provide more accessible opportunities for people with disabilities, the elderly, families with young children, and others who are less comfortable venturing into more remote areas. Considering their low barriers to entry for most user demographics, and the associated benefits of outdoor recreation for these groups, these resources should be carefully stewarded in the future. The high Net Promoter Scores and overall satisfaction levels (with the exception of crowding in some areas) suggests that they are currently being managed effectively and sustainably.
Sport Fishing Sport fishing is another well-known activity for which the region is famous, registering $164 million in resident and visitor spending in 2019. This sector has many well-known challenges with crowding, particularly in years such as 2019 when many popular recreational salmon fisheries in the region were closed due to low returns. This, in turn, leads to lower scores related to “friendliness of locals” and produces management challenges for this sector that has robust and perhaps growing interest, amidst dwindling resources and conservation concerns. Due to salmon fishing closures in 2019,
expenditure values were significantly lower than they would have been in a year without closures. These closures caused displacement to other rivers and fishing areas for fisheries that were open at the time, causing additional crowding pressures.
Mountain Biking The highest-value “hard” recreation activity in the region – including higher-risk activities such as kayaking, ski touring, rock climbing, and others - was mountain biking, for which the 190,000 recreation days produced over $29 million in annual spending. The ongoing careful management of this fast-growing activity sector has resulted in very high user satisfaction levels across all categories, and a very strong Net Promoter Score of 87. The strong scores for crowding and friendliness of locals suggests that this activity sector has much growth potential and does not reveal any of the early warning indicators of being near its carrying capacity. Well-planned development and management of this activity sector should ensure its robust and sustainable growth into the mid-to-long-term future.
Total Economic Impacts The initial expenditures of local residents and visitors are only one component of the economic value of outdoor recreation. We must also consider the “spinoff” impacts, such as indirect impacts – primarily business purchases of inputs such as furniture, computers, and professional services, as well as induced impacts – primarily the recirculated income of individuals directly employed in the outdoor recreation sector.
When combined, these spinoff impacts increase the overall value of outdoor recreation in the FVRD from $948 million to nearly $1.5 billion for calendar year 2019. This is a key consideration that merits emphasis: the economic value of outdoor recreation is not solely confined to the sector itself, but is spread across a wide variety of supplier and beneficiary sectors, including manufacturing, professional services, transportation, energy/utilities, and others.
These benefits of indirect and induced impacts are shared broadly throughout the economy, including Indigenous communities, which are realizing increasing benefits from Indigenous cultural and adventure tourism.
Put into context, this $1.5 billion in economic impact results in more than $4,700 in economic value for each of the region’s 320,000 residents.
The $948 in initial recreationist expenditures also produced $568 million in GDP (new, value-added economic activity in the economy), and created jobs for 10,262 people in 2019 – over 3% of the region’s residents.
While generally considered an “expenditure” budgetary line item for most levels of government, it bears mentioning that outdoor recreation typically produces significantly more revenues than government outlays. In 2019, outdoor recreation produced over $257 million in taxation revenues to federal ($116 million), provincial ($126 million), and local governments ($15.7 million). This almost certainly exceeds the total expenditures on trailnetworks, infrastructure, staffing, and other costs to governments.
Quality of the Outdoor Recreation Experience Considering the relatively low profile of outdoor recreation in the Fraser Valley – at least compared to globally recognized destinations such as Vancouver’s North Shore and the Sea to Sky corridor, as well as the Canadian Rockies – the FVRD region produces remarkably high scores on recreationist satisfaction. The natural comparative advantage of the region is its vast terrain and almost unlimited recreation opportunities, which results in highly satisfied recreationists who are not impacted by excessive crowding, user conflicts, and antagonistic local residents.
With a Net Promoter Score of 83, the region will not remain a “secret” much longer, which suggests that growth should be supported and promoted, but this should be done carefully and with an eye on long-term sustainability, particularly related to negative impacts on local residents, Indigenous communities, and the environment. This “natural strength” could quickly become a management problem when the growth exceeds carrying capacities, and local residents become increasingly antagonistic toward one-another and visitors to the region.
With COVID-19 occurring at the tail end of this project, and not considered as part of the data gathering component, we can only assume that there will be at least short- to mid-term concerns about user crowding, not only from a quality of experience perspective, but now from a community health perspective.
Other Key Findings and Considerations Visitor Origins While nearly 40% of recreation days in the FVRD were from visitors to the region, the vast majority of these were from other areas of Metro Vancouver. Opportunities exist to spread awareness of the region’s diverse and exceptionally high-calibre outdoor recreation offerings to a global audience.
Signage and WayfindingCareful management of recreation areas is a key factor correlated with positive (and negative) visitor experiences. For example, the most significant concern of backcountry skiers was with regard to signage and wayfinding, and this appears to have detracted from overall experiential satisfaction.
Parking/AccessRecreation areas with challenges related to parking and access were shown to be strongly correlated with recreationist satisfaction. For example, activities with challenges related to user crowding, such as snowmobiling, appear to have ameliorated these concerns with careful management of parking, staging areas, and signage, such as the Britton Creek snowmobile area managed by the Coquihalla Snowmobile Club. Some activity sectors also displayed notable challenges with parking and access, such as watersports activities with limited “put-in” areas for canoes, kayaks, and SUPs.
Indigenous Cultural and Heritage Tourism Indigenous communities in the region are developing opportunities for economic growth in the outdoor recreation and tourism sectors. Considering the high level of interest of recreationists in Indigenous cultural and historical interpretation in recreation areas, and their low levels of awareness, this should be considered a priority development / management opportunity, from an economic opportunity perspective associated with enhancing recreation experiences and driving tourism and recreation economic activity.

Conclusions | 6968 | Outdoor Recreation Economic Impact Analysis
Climate ChangeOutdoor recreation and tourism are highly vulnerable to the direct and indirect impacts of climate change. The rapidly heating global climate results in direct impacts such as uncomfortably hot summer recreation periods, which discourages recreation during the peak travel and summer holiday season. Perhaps more importantly, climate change also produces indirect impacts such as lower water levels that deteriorate fish(ery) habitat, and limit watersports such as rafting and kayaking – among other impacts.
Perhaps most prominently, continuous hot and dry summers spanning at least the past fifteen years have also produced an unprecedented severity of forest fires in the province, which resulted in air quality levels that far exceeded public health guidelines, causing local residents to avoid outdoor recreation for extended periods, and travellers to stay at home. For example, vehicle counters on the Chipmunk Creek FSR (which accesses Mt. Cheam and other recreation attractions in the area) showed a staggering 60% decline in recreation use in August 2017 compared with August 2016, and a 37% decline in recreationists in August 2018 compared with August 2016. Assuming a relatively similar decline occurred for other outdoor recreation areas and activities in that period – a valid assumption considering the widespread advisories across British Columbia - poor air quality from wildfires likely cost the region close to $200 million in total (gross) economic impacts for 2017,2 and roughly half that amount in 2018.
For a region that already has challenges with air quality (ground level ozone and fine particulate matter), this must be factored into future management practices and policy. Unfortunately, there is little that can be done to support outdoor recreation when air quality reaches dangerous levels, particularly for intense outdoor activities.
2 The 60% decrease in vehicle traffic in the Mt. Cheam area for August 2017 alone resulted in an annualized decline of 12% for that year. A 12% annualized decline in outdoor recreation across the region would amount to a total negative economic impact (loss) of approximately $180 million, for a sector currently valued at $1.5 billion annually.
Concluding Remarks The Fraser Valley Regional District is in the auspicious situation of possessing immense natural competitive advantages to support the development and management of outdoor recreation, so that the already considerable benefits of this sector continue to grow sustainably into the future. This report provides key insights that should be considered when planning for recreation development, management, and engagement with key stakeholders in the region, as well as federal, provincial, and Indigenous governments.
Compared with other destinations, the FVRD possesses significantly more opportunities than challenges, with only a few activity sectors having sporadic issues with lacking infrastructure (parking, staging, wayfinding/signage, facilities) and user crowding. However, unlike other recreation destinations that have faced carrying capacity issues due to internal challenges (crowding/congestion, competing demands for resources), the FVRD will likely face more issues in its external environment that are beyond its control: climate change, resource scarcity, and now possibly future health pandemic issues.
With careful planning through evidence-based approaches, the region nonetheless remains poised to more fully capture the many benefits of a responsibly managed, sustainable outdoor recreation sector that provides significant economic, social/cultural, and environmental benefits to the area’s growing population for current and future generations.
Mount Larabee from TamihiCredit Hamish Baird

APPENDIX A
DETAILED ACTIVITY
SECTOR ANALYSIS
HIKING AND TRAIL RUNNINGaverage group size: 2.9 peopleaverage people in vehicle: 2.4average time at location: 4.5 hrsaverage nights spent in Fraser Valley: 2.9
SNOWMOBILINGaverage group size: 3 peopleaverage people in vehicle: 2.1average time at location: 11.1 hrsaverage nights spent in Fraser Valley: 3.6
MOUNTAIN BIKINGaverage group size: 2.8 peopleaverage people in vehicle: 2average time at location: 3 hrsaverage nights spent in Fraser Valley: 2.7
CAMPINGaverage group size: 3.7 peopleaverage people in vehicle: 2.7average time at location: 21.4 hrsaverage nights spent in Fraser Valley: 2.9
MOTORIZED OFF ROADINGaverage group size: 3.3 peopleaverage people in vehicle: 2.6average time at location: 8.5 hrsaverage nights spent in Fraser Valley: 2.8
DOG WALKING AND WALKINGaverage group size: 2.4 peopleaverage people in vehicle: 2.4average time at location: 1.9 hrsaverage nights spent in Fraser Valley: 3.4
BACKCOUNTRY SNOWSPORTSaverage group size: 3.6 peopleaverage people in vehicle: 2.3average time at location: 8.3 hrsaverage nights spent in Fraser Valley: 2.4
FISHINGaverage group size: 2.2 peopleaverage people in vehicle: 1.9average time at location: 6.2 hrsaverage nights spent in Fraser Valley: 4.2
WILDLIFE VIEWINGaverage group size: 5 peopleaverage people in vehicle: 2.9average time at location: 4.7 hrsaverage nights spent in Fraser Valley: 4.2
WATERSIDE ACTIVITIESaverage group size: 5.3 peopleaverage people in vehicle: 3.5average time at location: 6.1 hrsaverage nights spent in Fraser Valley: 3.5
NON MOTORIZED WATERSPORTSaverage group size: 5 peopleaverage people in vehicle: 2.5average time at location: 5.8 hrsaverage nights spent in Fraser Valley: 4.0

HIKING AND TRAIL RUNNING
17% BELONG TOAN OUTDOOR
CLUB
14% OF TOTAL OUTDOOR RECREATION SPENDING
EXPERIENCE LEVEL
POINT OF ORIGINOverseasUSA
CanadaBC (other)
Greater VancouverLocal
Expe
rt
Adva
nced
Inte
rmed
iate
Begi
nner
13%
64%22%
4%3%
5%2%
51%
26%
11% AGE
75 +65 - 7455 - 6445 - 5435 - 4425 - 34Under 24 * Satisfaction with outdoor recreation components (10 = very satisfied 1 = not at all)
INTEREST IN INDIGENOUS CULTURE37%
11% 10%
Not atall
Somewhat Interested
Very Interested
52%MEN
48%WOMEN
64%RESIDENTS
36%VISITORS
8%
25% 24%20%
12%
9%
2%
HIKING AND TRAIL RUNNING
NET PROMOTER SCORE (NPS)
85
ACCOMMODATIONTYPE
# NIGHTS
B&B/
AirB
&B
Car
Cam
ping
Frie
nd/R
elat
ive
Hot
el/M
otel
Cam
pgro
und
VISITORS: 49% DAY | 51% OVERNIGHT64%
26%
52%
14%
8%
36%
8.95
8.58
8.54
9.7
8.23
26%23%
11%
5%
* Likelihood of recommending the Fraser Valley as an outdoor recreation destination* Satisfaction with outdoor recreation components (10 = very satisfied 1 = not at all)
10%
DETRACTORSPASSIVESPROMOTERSNot at all likelyExtremely likely
% DETRACTORS - %PROMOTERS = NPS
87% 11% 2%
SATISFACTION SCORES
Crowding
Friendliness of locals
Access/Parking
Signage/Way�nding
Overall quality
$ AVERAGE VISITOR
$392/group/trip
$95/person/day $ AVERAGE RESIDENT
$73/group/day
$30/person/day
$1,378/person/year*
7+ Nights
4-6 Nights
2-3 Nights
1 Night
*Average resident spending per person per year includes equipment purchases,maintenance,equipment rental, guidings and transportation
Three Brothers Trail
Credit Melissa Geddert
Mount Cheam Ridge Trail
Credit David Urban

CAMPING
16% BELONG TOAN OUTDOOR
CLUB
24% OF TOTAL OUTDOOR RECREATION SPENDING
EXPERIENCE LEVEL
POINT OF ORIGINOverseasUSA
CanadaBC (other)
Greater VancouverLocal
Expe
rt
Adva
nced
Inte
rmed
iate
Begi
nner
5%
79%18%
2%2%
0%0%
48%
27%
20%
AGE
75 +65 - 7455 - 6445 - 5435 - 4425 - 34Under 24 * Satisfaction with outdoor recreation components (10 = very satisfied 1 = not at all)
INTEREST IN INDIGENOUS CULTURE34%
13% 8%
Not at all
SomewhatInterested
Very Interested
69%MEN
31%WOMEN
79%RESIDENTS
21%VISITORS
8%
20%
33%
21%
13%
3% 2%
CAMPING
NET PROMOTER SCORE (NPS)
86
ACCOMMODATIONTYPE
# NIGHTS
Back
coun
rty/
Car
Cam
ping
Cam
pgro
und
VISITORS: 7% DAY | 93% OVERNIGHT79% 23%
46%
31%
0%
77%
8.94
8.21
8.56
9.57
8.03
23%
* Likelihood of recommending the Fraser Valley as an outdoor recreation destination* Satisfaction with outdoor recreation components (10 = very satisfied 1 = not at all)
8%
DETRACTORSPASSIVESPROMOTERSNot at all likelyExtremely likely
% DETRACTORS - %PROMOTERS = NPS
89% 8% 3%
SATISFACTION SCORES
Crowding
Friendliness of locals
Access/Parking
Signage/Way�nding
Overall quality
$ AVERAGE VISITOR
$502/group/trip
$66/person/day $ AVERAGE RESIDENT
$475/group/day
$169/person/day
$2,851/person/year*
*Average resident spending per person per year includes equipment purchases,maintenance,equipment rental, guidings and transportation
7+ Nights
4-6 Nights
2-3 Nights
1 Night
Claimstake Camp
Credit Hamish BairdCredit Daniel Nainggolan
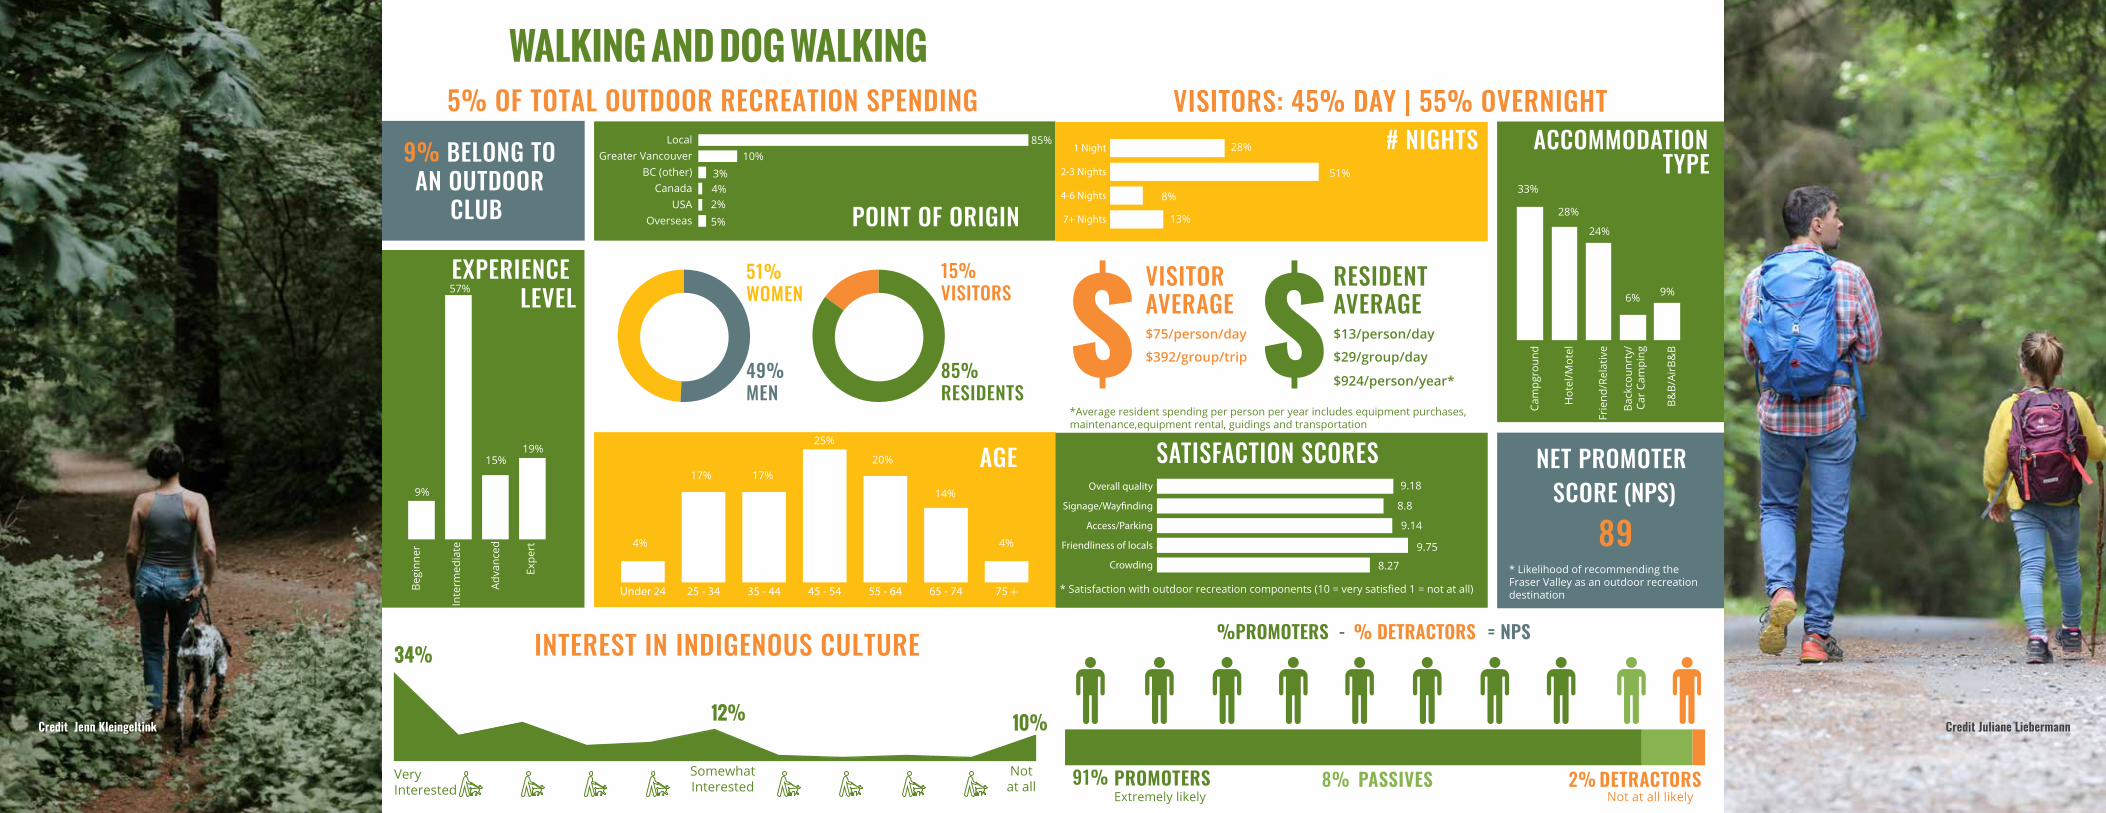
WALKING AND DOG WALKING
9% BELONG TOAN OUTDOOR
CLUB
5% OF TOTAL OUTDOOR RECREATION SPENDING
EXPERIENCE LEVEL
POINT OF ORIGINOverseasUSA
CanadaBC (other)
Greater VancouverLocal
Expe
rt
Adva
nced
Inte
rmed
iate
Begi
nner
9%
85%10%
4%3%
5%2%
57%
15%19% AGE
75 +65 - 7455 - 6445 - 5435 - 4425 - 34Under 24 * Satisfaction with outdoor recreation components (10 = very satisfied 1 = not at all)
INTEREST IN INDIGENOUS CULTURE34%
12% 10%
Not at all
SomewhatInterested
Very Interested
49%MEN
51%WOMEN
85%RESIDENTS
15%VISITORS
4%
17% 17%
25%
20%
14%
4%
WALKING AND DOG WALKING
NET PROMOTER SCORE (NPS)
89
ACCOMMODATIONTYPE
# NIGHTS
B&B/
AirB
&B
Back
coun
rty/
Car
Cam
ping
Frie
nd/R
elat
ive
Hot
el/M
otel
Cam
pgro
und
VISITORS: 45% DAY | 55% OVERNIGHT85% 28%
51%
8%
13%
33%
9.18
8.8
9.14
9.75
8.27
28%
24%
6% 9%
* Likelihood of recommending the Fraser Valley as an outdoor recreation destination* Satisfaction with outdoor recreation components (10 = very satisfied 1 = not at all)
10%
DETRACTORSPASSIVESPROMOTERSNot at all likelyExtremely likely
% DETRACTORS - %PROMOTERS = NPS
91% 8% 2%
SATISFACTION SCORES
Crowding
Friendliness of locals
Access/Parking
Signage/Way�nding
Overall quality
$ AVERAGE VISITOR
$392/group/trip
$75/person/day $ AVERAGE RESIDENT
$29/group/day
$13/person/day
$924/person/year*
*Average resident spending per person per year includes equipment purchases,maintenance,equipment rental, guidings and transportation
7+ Nights
4-6 Nights
2-3 Nights
1 Night
Credit Jenn Kleingeltink Credit Juliane Liebermann

FISHING
16% BELONG TOAN OUTDOOR
CLUB
17% OF TOTAL OUTDOOR RECREATION SPENDING
EXPERIENCE LEVEL
POINT OF ORIGINOverseasUSA
CanadaBC (other)
Greater VancouverLocal
9%
51%40%
4%2%
2%1%
34% 33%
24%
AGE
75 +65 - 7455 - 6445 - 5435 - 4425 - 34Under 24 * Satisfaction with outdoor recreation components (10 = very satisfied 1 = not at all)
INTEREST IN INDIGENOUS CULTURE24%
13%
26%
Notat all
Somewhat Interested
Very Interested
88%MEN
12%WOMEN
51%RESIDENTS
49%VISITORS
6%
12%
24% 25%
18%
11%
2%Expe
rt
Adva
nced
Inte
rmed
iate
Begi
nner
FISHING
NET PROMOTER SCORE (NPS)
68
ACCOMMODATIONTYPE
# NIGHTS
othe
r
B&B/
Airb
nb
Back
coun
rty/
Car
Cam
ping
Frie
nd/R
elat
ive
Hot
el/M
otel
Cam
pgro
und
VISITORS: 69% DAY | 31% OVERNIGHT14%
47%
19%
19%
53%
8.38
8.05
8.03
8.9
6.66
14% 17%
3%
11%
3%
* Likelihood of recommending the Fraser Valley as an outdoor recreation destination* Satisfaction with outdoor recreation components (10 = very satisfied 1 = not at all)
26%
DETRACTORSPASSIVESPROMOTERSNot at all likelyExtremely likely
% DETRACTORS - %PROMOTERS = NPS
76% 16% 8%
SATISFACTION SCORES
Crowding
Friendliness of locals
Access/Parking
Signage/Way�nding
Overall quality
$ AVERAGE VISITOR
$392/group/trip
$150/person/day$ AVERAGE RESIDENT
$415/group/day
$135/person/day
$3,683/person/year*
7+ Nights
4-6 Nights
2-3 Nights
1 Night
*Average resident spending per person per year includes equipment purchases,maintenance,equipment rental, guidings and transportation
Vedder Canal
Credit Bob Zheng
Fraser River
Credit Robin Bessenger

WATERSIDE ACTIVITIES
10% BELONG TOAN OUTDOOR
CLUB
8% OF TOTAL OUTDOOR RECREATION SPENDING
EXPERIENCE LEVEL
POINT OF ORIGINOverseasUSA
CanadaBC (other)
Greater VancouverLocal
11%
53%30%
4%6%
5%2%
46%
29%
15% AGE
75 +64 - 7555 - 6445 - 5435 - 4425 - 34Under 24 * Satisfaction with outdoor recreation components (10 = very satisfied 1 = not at all)
INTEREST IN INDIGENOUS CULTURE28%
14% 10%
Not at all
Somewhat Interested
Very Interested
50%MEN
50%WOMEN
53%RESIDENTS
47%VISITORS
10%
30%32%
15%
10%
2% 0%Ex
pert
Adva
nced
Inte
rmed
iate
Begi
nner
WATERSIDE ACTIVITIES
NET PROMOTER SCORE (NPS)
88
ACCOMMODATIONTYPE
# NIGHTS
B&B/
AirB
nB
Back
coun
try/
Car
Cam
ping
Frie
nd/R
elat
ive
Hot
el/M
otel
Cam
pgro
und
VISITORS: 24% DAY | 76% OVERNIGHT14%
62%
19%
5%
57%
19%
8.84
8.58
8.24
9.54
7.28
11% 11%
3%
* Likelihood of recommending the Fraser Valley as an outdoor recreation destination* Satisfaction with outdoor recreation components (10 = very satisfied 1 = not at all)
DETRACTORSPASSIVESPROMOTERSNot at all likelyExtremely likely
% DETRACTORS - %PROMOTERS = NPS
89% 10% 1%
SATISFACTION SCORES
Crowding
Friendliness of locals
Access/Parking
Signage/Way�nding
Overall quality
$ AVERAGE VISITOR
$603/group/trip
$69/person/day $ AVERAGE RESIDENT
$123/group/day
$37/person/day
$2,028/person/year*
7+ Nights
4-6 Nights
2-3 Nights
1 Night
*Average resident spending per person per year includes equipment purchases,maintenance,equipment rental, guidings and transportation
Lindemann Lake
Credit Jenn Kleingeltink
Main Beach Cultus Lake
Credit Kyle Pierce

MOUNTAIN BIKING
24% BELONG TOAN OUTDOOR
CLUB
3% OF TOTAL OUTDOOR RECREATION SPENDING
EXPERIENCE LEVEL
POINT OF ORIGINOverseasUSA
CanadaBC (other)
Greater Vancouverlocal
9%
72%21%
1%2%
1%1%
36%
38%
18%
AGE
75 +65 - 7455 - 6445 - 5435 - 4425 - 34Under 24 * Satisfaction with outdoor recreation components (10 = very satisfied 1 = not at all)
INTEREST IN INDIGENOUS CULTURE37%
13% 10%
Not at all
SomewhatInterested
Very Interested
82%MEN
18%WOMEN
73%RESIDENTS
27%VISITORS
6%
25%
34%
18%
13%
4%0%
Expe
rt
Adva
nced
Inte
rmed
iate
Begi
nner
MOUNTAIN BIKING
NET PROMOTER SCORE (NPS)
87
ACCOMMODATIONTYPE
# NIGHTS
Hom
e ou
tsid
e F
VRD
Back
coun
rty/
Car
Cam
ping
Frie
nd/R
elat
ive
Hot
el/M
otel
Cam
pgro
und
VISITORS: 68% DAY | 32% OVERNIGHT21%
71%
0%
7% 27%
8.71
7.89
8.53
9.5
7.84
33%
27%
7% 7%
* Likelihood of recommending the Fraser Valley as an outdoor recreation destination* Satisfaction with outdoor recreation components (10 = very satisfied 1 = not at all)
10%
DETRACTORSPASSIVESPROMOTERSNot at all likelyExtremely likely
% DETRACTORS - %PROMOTERS = NPS
90% 7% 3%
SATISFACTION SCORES
Crowding
Friendliness of locals
Access/Parking
Signage/Way�nding
Overall quality
$ AVERAGE VISITOR
$412/group/trip
$115/person/day$ AVERAGE RESIDENT
$148/group/day
$69/person/day
$4,948/person/year*
7+ Nights
4-6 Nights
2-3 Nights
1 Night
*Average resident spending per person per year includes equipment purchases,maintenance,equipment rental, guidings and transportation
Sumas Mountain
Credit Tourism Abbotsford
Vedder Mountain
Credit Tourism Chilliwack

MOTORIZED OFF ROADING
24% BELONG TOAN OUTDOOR
CLUB
2% OF TOTAL OUTDOOR RECREATION SPENDING
EXPERIENCE LEVEL
POINT OF ORIGINOverseasUSA
CanadaBC (other)
Greater VancouverLocal
9%
72%24%
0%2%
0%2%
59%
24%
11% AGE
75 +65 - 7455 - 6445 - 5435 - 4425 - 34Under 24 * Satisfaction with outdoor recreation components (10 = very satisfied 1 = not at all)
INTEREST IN INDIGENOUS CULTURE20% 18%
32
Not at all
SomewhatInterested
Very Interested
90%MEN
10%WOMEN
72%RESIDENTS
28%VISITORS
9%
30%35%
15%
10%
1% 0%Ex
pert
Adva
nced
Inte
rmed
iate
Begi
nner
MOTORIZED OFF ROADING
NET PROMOTER SCORE (NPS)
89
ACCOMMODATIONTYPE
# NIGHTS
Ow
n 2n
d ho
me
Back
coun
rty/
Car
Cam
ping
Frie
nd/R
elat
ive
Hot
el/M
otel
Cam
pgro
und
VISITORS: 46% DAY | 54% OVERNIGHT15%
65%
10%
10%
59%
8.85
8.11
9
9.37
8.07
6%
18%
12%6%
* Likelihood of recommending the Fraser Valley as an outdoor recreation destination* Satisfaction with outdoor recreation components (10 = very satisfied 1 = not at all)
32
DETRACTORSPASSIVESPROMOTERSNot at all likelyExtremely likely
% DETRACTORS - %PROMOTERS = NPS
89% 9% 2%
SATISFACTION SCORES
Crowding
Friendliness of locals
Access/Parking
Signage/Way�nding
Overall quality
$ AVERAGE VISITOR
$493/group/trip
$122/person/day$ AVERAGE RESIDENT
$188/group/day
$140/person/day
$7,342/person/year*
7+ Nights
4-6 Nights
2-3 Nights
1 Night
*Average resident spending per person per year includes equipment purchases,maintenance,equipment rental, guidings and transportation
Credit Ryan Thom
Memorial Rock
Credit David Wakely
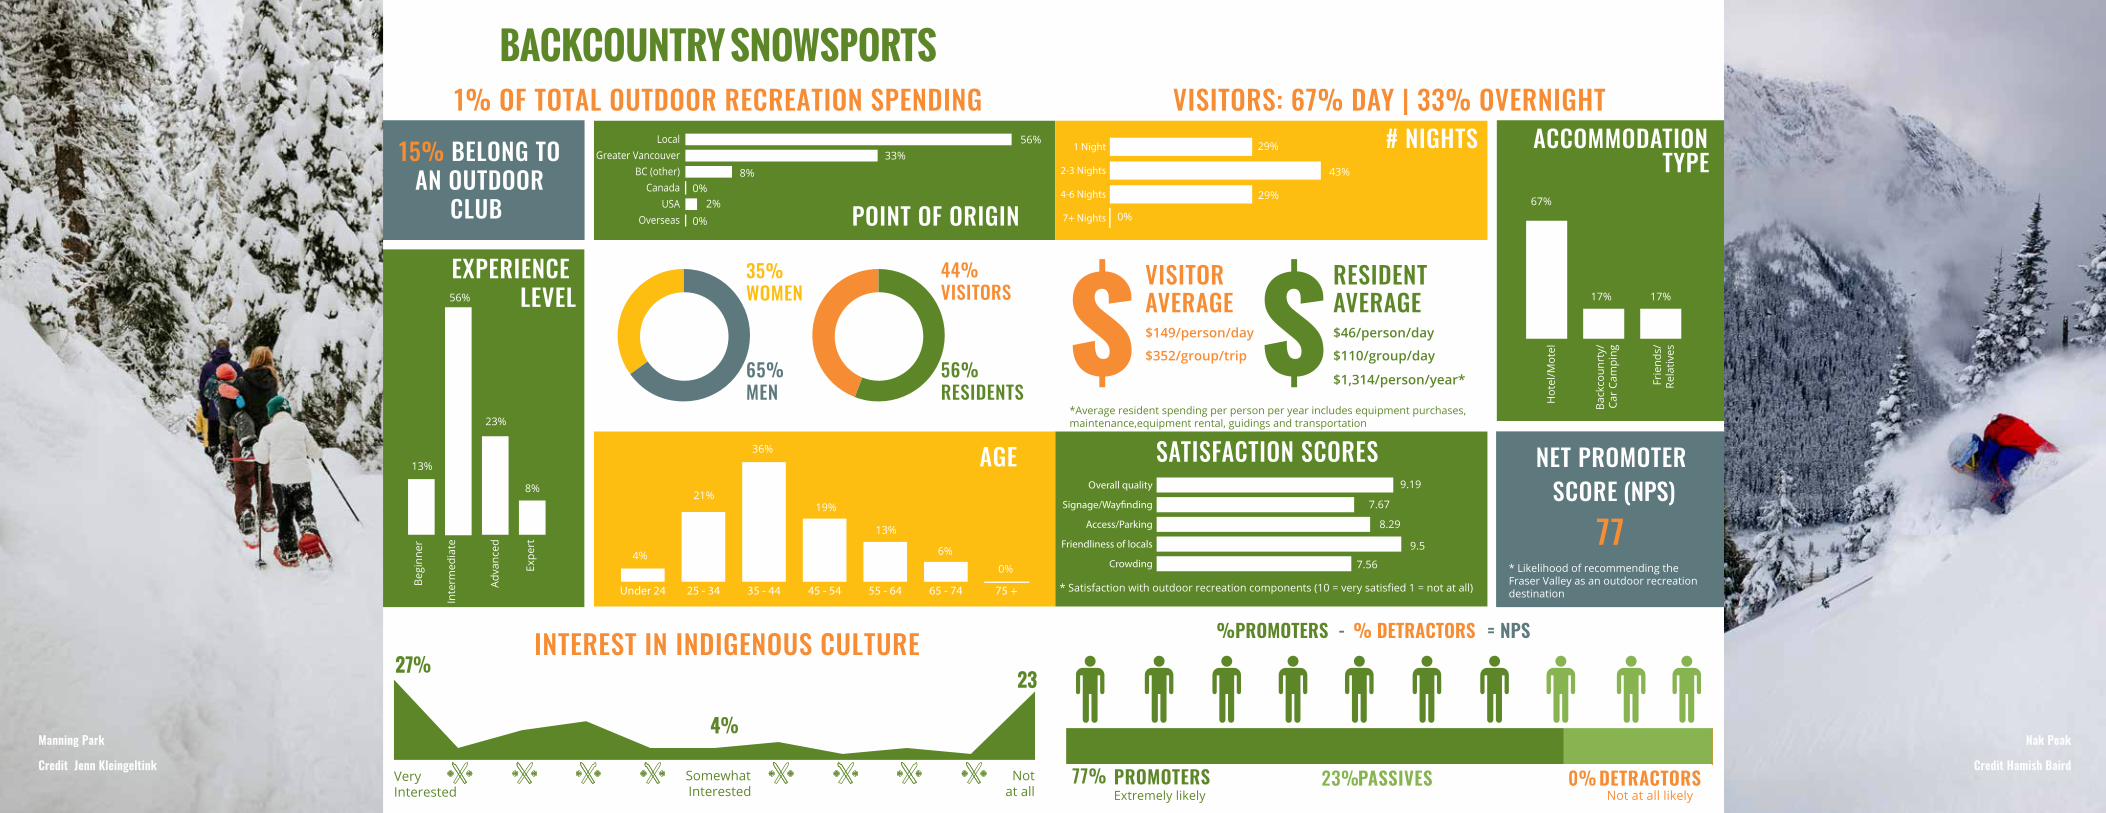
BACKCOUNTRY SNOWSPORTS
15% BELONG TOAN OUTDOOR
CLUB
1% OF TOTAL OUTDOOR RECREATION SPENDING
EXPERIENCE LEVEL
POINT OF ORIGINOverseasUSA
CanadaBC (other)
Greater VancouverLocal
Expe
rt
Adva
nced
Inte
rmed
iate
Begi
nner
13%
56%33%
0%8%
0%2%
56%
23%
8%
AGE
75 +65 - 7455 - 6445 - 5435 - 4425 - 34Under 24 * Satisfaction with outdoor recreation components (10 = very satisfied 1 = not at all)
INTEREST IN INDIGENOUS CULTURE27%
4%
23
Notat all
Somewhat Interested
Very Interested
65%MEN
35%WOMEN
56%RESIDENTS
44%VISITORS
4%
21%
36%
19%
13%
6%
0%
BACKCOUNTRY SNOWSPORTS
NET PROMOTER SCORE (NPS)
77
ACCOMMODATIONTYPE
# NIGHTS
Frie
nds/
Rela
tives
Back
coun
rty/
Car
Cam
ping
Hot
el/M
otel
VISITORS: 67% DAY | 33% OVERNIGHT29%
43%
29%
0%67%
9.19
7.67
8.29
9.5
7.56
17% 17%
* Likelihood of recommending the Fraser Valley as an outdoor recreation destination* Satisfaction with outdoor recreation components (10 = very satisfied 1 = not at all)
DETRACTORSPASSIVESPROMOTERSNot at all likelyExtremely likely
% DETRACTORS - %PROMOTERS = NPS
77% 23% 0%
SATISFACTION SCORES
Crowding
Friendliness of locals
Access/Parking
Signage/Way�nding
Overall quality
$ AVERAGE VISITOR
$352/group/trip
$149/person/day$ AVERAGE RESIDENT
$110/group/day
$46/person/day
$1,314/person/year*
*Average resident spending per person per year includes equipment purchases,maintenance,equipment rental, guidings and transportation
7+ Nights
4-6 Nights
2-3 Nights
1 Night
Nak Peak
Credit Hamish Baird
Manning Park
Credit Jenn Kleingeltink

WILDLIFE VIEWING
13% BELONG TOAN OUTDOOR
CLUB
2% OF TOTAL OUTDOOR RECREATION SPENDING
EXPERIENCE LEVEL
POINT OF ORIGINOverseasUSA
CanadaBC (other)
Greater VancouverLocal
42%
57%29%
3%4%
5%2%
34%
14%11% AGE
75 +64 - 7555 - 6445 - 5435 - 4425 - 34Under 24 * Satisfaction with outdoor recreation components (10 = very satisfied 1 = not at all)
INTEREST IN INDIGENOUS CULTURE57%
11% 10%
Notat all
SomewhatInterested
Very Interested
58%MEN
42%WOMEN
57%RESIDENTS
43%VISITORS
3%
14% 15%17%
26%
21%
5%Ex
pert
Adva
nced
Inte
rmed
iate
Begi
nner
WILDLIFE VIEWING
NET PROMOTER SCORE (NPS)
75
ACCOMMODATIONTYPE
# NIGHTS
Frie
nd/R
elat
ive
Hot
el/M
otel
Cam
pgro
und
VISITORS: 52% DAY | 48% OVERNIGHT32%
42%
5%
21%32%
8.75
8.6
8.74
9.8
8.69
47%
21%
* Likelihood of recommending the Fraser Valley as an outdoor recreation destination* Satisfaction with outdoor recreation components (10 = very satisfied 1 = not at all)
DETRACTORSPASSIVESPROMOTERSNot at all likelyExtremely likely
% DETRACTORS - %PROMOTERS = NPS
80% 15% 5%
SATISFACTION SCORES
Crowding
Friendliness of locals
Access/Parking
Signage/Way�nding
Overall quality
$ AVERAGE VISITOR
$669/group/trip
$88/person/day $ AVERAGE RESIDENT
$28/group/day
$10/person/day
$922/person/year*
7+ Nights
4-6 Nights
2-3 Nights
1 Night
*Average resident spending per person per year includes equipment purchases,maintenance,equipment rental, guidings and transportation
Blue Heron
Credit Gord Gadsden
Lakeside Trail
Credit Gillian Berger

NON MOTORIZED WATERSPORTS
18% BELONG TOAN OUTDOOR
CLUB
4% OF TOTAL OUTDOOR RECREATION SPENDING
EXPERIENCE LEVEL
POINT OF ORIGINOverseasUSA
CanadaBC (other)
Greater Vancouverlocal
14%
52%34%
3%
7%
3%6%
38%
29%
18%
AGE
75 +65 - 7455 - 6445 - 5435 - 4425 - 34Under 24 * Satisfaction with outdoor recreation components (10 = very satisfied 1 = not at all)
INTEREST IN INDIGENOUS CULTURE48%
10% 10%
Not at all
Somewhat Interested
VeryInterested
52%MEN
48%WOMEN
52%RESIDENTS
48%VISITORS
4%
12%
31%
22%
19%
9%
1%Ex
pert
Adva
nced
Inte
rmed
iate
Begi
nner
NON MOTORIZED WATERSPORTS
NET PROMOTER SCORE (NPS)
81
ACCOMMODATIONTYPE
# NIGHTS
Hom
e o
utsi
de F
VRD
Frie
nd/R
elat
ive
Hot
el/M
otel
Cam
pgro
und
VISITORS: 22% DAY | 78% OVERNIGHT52% 8%
58%
25%
8%
58%
8.52
8.48
8.04
9.44
7.51
8%
29%
4%
* Likelihood of recommending the Fraser Valley as an outdoor recreation destination* Satisfaction with outdoor recreation components (10 = very satisfied 1 = not at all)
DETRACTORSPASSIVESPROMOTERSNot at all likelyExtremely likely
% DETRACTORS - %PROMOTERS = NPS
85% 10% 4%
SATISFACTION SCORES
Crowding
Friendliness of locals
Access/Parking
Signage/Way�nding
Overall quality
$ AVERAGE VISITOR
$636/group/trip
$82/person/day $ AVERAGE RESIDENT
$155/group/day
$61/person/day
$3,900/person/year*
7+ Nights
4-6 Nights
2-3 Nights
1 Night
*Average resident spending per person per year includes equipment purchases,maintenance,equipment rental, guidings and transportation
Credit Benjamin Davies
Hope Slough
Credit Filip Mroz
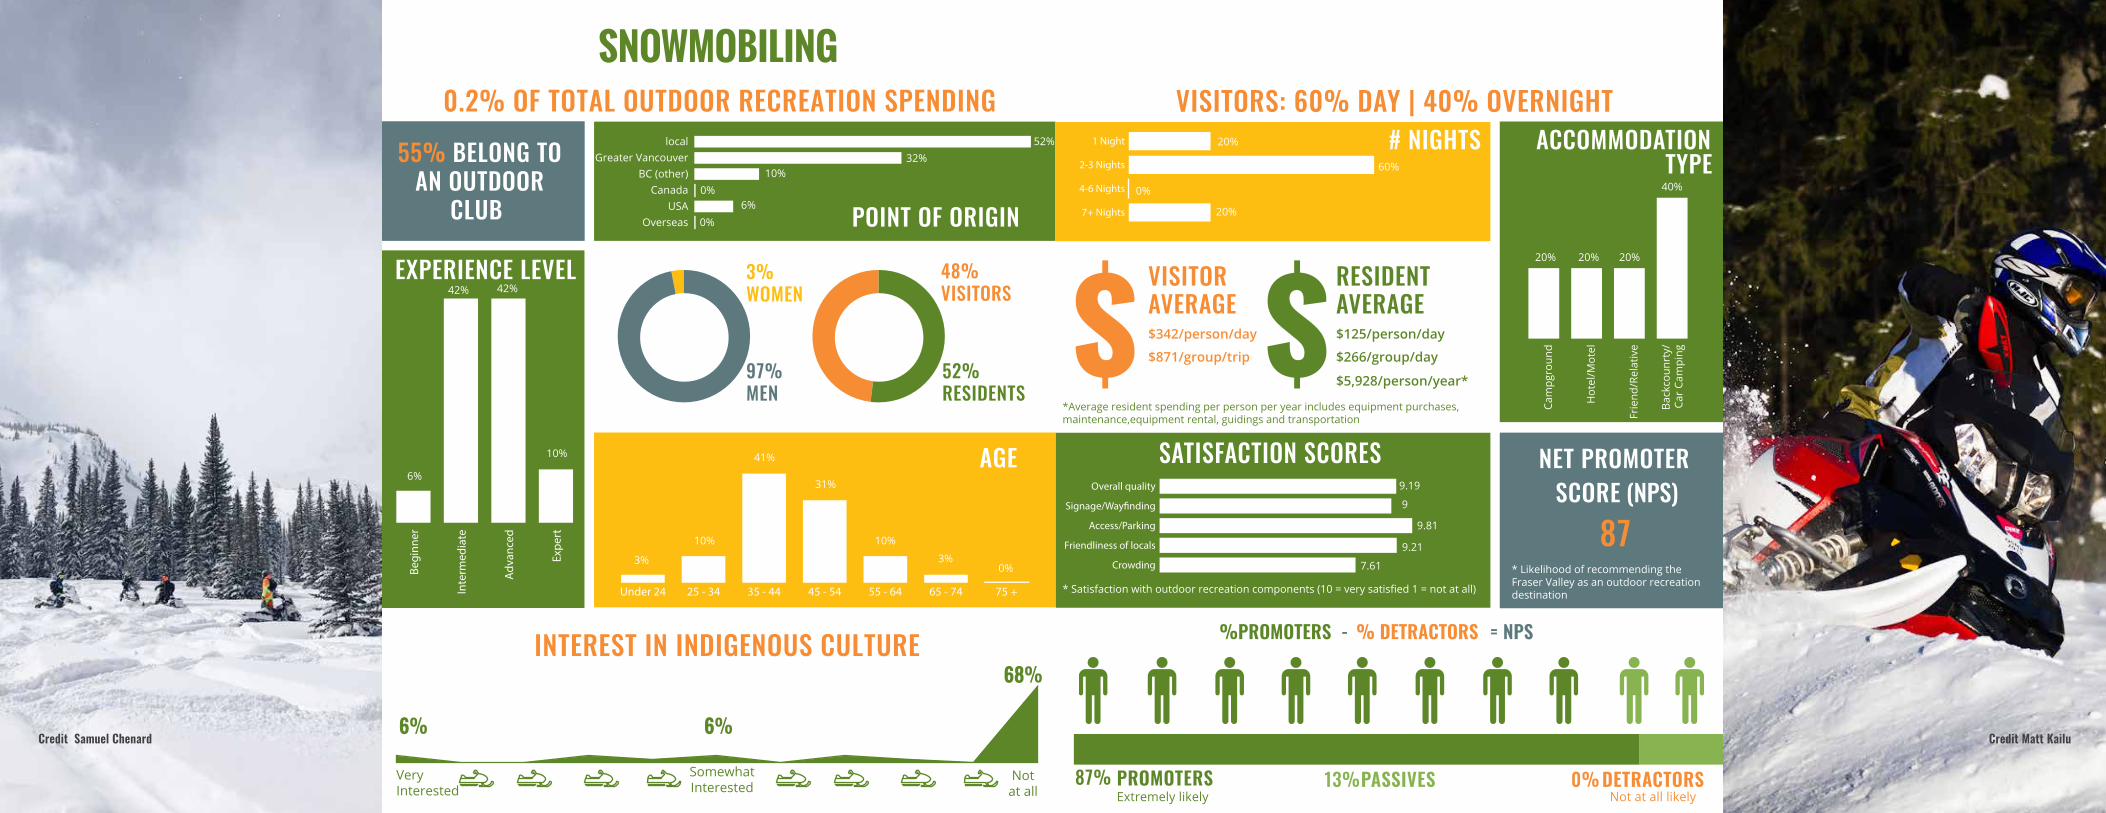
SNOWMOBILING
55% BELONG TOAN OUTDOOR
CLUB
0.2% OF TOTAL OUTDOOR RECREATION SPENDING
EXPERIENCE LEVEL
POINT OF ORIGINOverseasUSA
CanadaBC (other)
Greater Vancouverlocal
6%
52%32%
0%10%
0%6%
42% 42%
10% AGE
75 +65 - 7455 - 6445 - 5435 - 4425 - 34Under 24 * Satisfaction with outdoor recreation components (10 = very satisfied 1 = not at all)
INTEREST IN INDIGENOUS CULTURE
6% 6%
68%
Not at all
SomewhatInterested
Very Interested
97%MEN
3%WOMEN
52%RESIDENTS
48%VISITORS
3%
10%
41%
31%
10%
3%0%
Expe
rt
Adva
nced
Inte
rmed
iate
Begi
nner
SNOWMOBILING
NET PROMOTER SCORE (NPS)
87
ACCOMMODATIONTYPE
# NIGHTS
Back
coun
rty/
Car
Cam
ping
Frie
nd/R
elat
ive
Hot
el/M
otel
Cam
pgro
und
VISITORS: 60% DAY | 40% OVERNIGHT52% 20%
60%
0%
20%
20%
9.19
9
9.81
9.21
7.61
20% 20%
40%
* Likelihood of recommending the Fraser Valley as an outdoor recreation destination* Satisfaction with outdoor recreation components (10 = very satisfied 1 = not at all)
68%
DETRACTORSPASSIVESPROMOTERSNot at all likelyExtremely likely
% DETRACTORS - %PROMOTERS = NPS
87% 13% 0%
SATISFACTION SCORES
Crowding
Friendliness of locals
Access/Parking
Signage/Way�nding
Overall quality
$ AVERAGE VISITOR
$871/group/trip
$342/person/day$ AVERAGE RESIDENT
$266/group/day
$125/person/day
$5,928/person/year*
7+ Nights
4-6 Nights
2-3 Nights
1 Night
*Average resident spending per person per year includes equipment purchases,maintenance,equipment rental, guidings and transportation
Credit Matt KailuCredit Samuel Chenard

APPENDIX B
SURVEYQUESTIONNAIRES
» Visitor Survey Questionnaire
» Resident Survey Questionnaire

1. What city and country are you from?
2. What is your postal or zip code?
3. What was the primary reason for your travel to the Fraser Valley?
» Visiting Friends and Relatives (VFR) » Outdoor recreation » Business » Other leisure activities » Other (please specify)
4. Including you, how many people are in your travel party? A travel party is a group on the same itinerary who are sharing at least some expenses.
5. How many people are in your vehicle today?
6. How many nights will you be in the Fraser Valley on this trip?
7. What type of accommodation are you using on this trip in the Fraser Valley? Name all (e.g. hotel, motel, B&B, campground, backcountry camping, friends/relatives)
8. What outdoor recreation activities are you participating in at this location today?
9. How many hours did you spend, or plan to spend at this location today?
10. What is your estimated number of days visiting this specific location or area for this activity in the past year?
VISITOR SURVEY (Non-Residents of the Fraser Valley)
11. What is your level of experience at this activity? (beginner, intermediate, advanced, expert)
12. Are you participating in other outdoor recreation activities today in the Fraser Valley, and if so what and where?
13. What is your specific destination today?
14. Can you estimate the total number of days visiting this specific location or area for this activity this season?
15. Let’s talk about recreation related expenditures for your time in the Fraser Valley. About how much will you and your entire travel party spend on the following items on this trip to the Fraser Valley?
» Transportation and fuel costs » Equipment rental or guiding services » Equipment purchase, parts, and maintenance costs
16. Now, let’s talk about other trip related expenditures. Please provide your best estimate as to what you and your entire travel party will spend for your entire stay in the Fraser Valley
» Accommodations » Local Transportation including fuel » Food and Beverages » Other recreation and entertainment (ski passes, guided fishing,
movies, museums…) » Shopping
17. How many trips have you or will you make in the Fraser Valley Regional District to participate in this activity this year?
18. Are you a member of an outdoor club in BC, and if so which one?
19. On a scale of 0 to 10, where 10 is the highest, how would you rate the following:
» Overall quality of the trail or recreation area » Signage and wayfinding » Access and parking » Friendliness of locals » Crowding (10= not at all crowded)
20. On a scale of 0 to 10, with 10 being the highest, how likely are you to recommend the Fraser Valley as an outdoor recreation destination to a friend or colleague?
21. Can you name the Indigenous Peoples on whose traditional lands we are located today?
22. On a scale of 0 to 10, with 10 being the highest, how important was Indigenous culture as a motivating factor in your decision to travel to the Fraser Valley region?
23. Again from 0 to 10, what is your level of interest in seeing Indigenous cultural or environmental interpretation in the recreation area (signage, interpretation pullouts, etc.)
24. Can you tell me the year you were born?
25. Gender (complete this based on observation - don’t ask the respondent)
26. Do you have any other comments on how your recreation experience at this site could be improved?
Dock at Cultus LakeCredit Jenn Kleingeltink

» Local transportation including fuel » Equipment purchase, parts, and maintenance costs » Equipment rental or guiding services » Food and beverages » Shopping
13. Are you a member of an outdoor club in BC, and if so which one?
14. On a scale of 0 to 10, where 10 is the highest, how would you rate the following:
» Overall quality of this trail or recreation area » Signage and wayfinding » Access and parking » Crowding (10=not at all crowded)
15. On a scale of 0 to 10, with 10 being the highest, how likely are you to recommend the Fraser Valley as a recreation destination to a friend or colleague?
16. Can you name the Indigenous peoples on whose traditional lands we are located today?
17. Again from 0 to 10, what is your level of interest in seeing Indigenous cultural interpretation in the recreation area (signage, historical information, etc.)
18. Can you tell me the year you were born?
19. Gender (complete this based on observation - don’t ask the respondent)
20. Do you have any other comments on how your recreation
experience at this location could have been improved?
RESIDENT SURVEY
1. What city and country are you from?
2. What is your postal code?
3. Including you, how many people are in your group today?
4. How many people are in your vehicle today?
5. What outdoor recreation activities are you participating in at this location today?
6. How many hours did you spend, or plan to spend at this location today?
7. What is your estimated number of days visiting this specific location or area for this activity in the past year?
8. What is your level of experience at this activity? (beginner, intermediate, advanced, expert)
9. Are you participating in other outdoor recreation activities today in the Fraser Valley, and if so what and where?
10. What is your specific destination today?
11. Let’s talk about recreation related expenditures in the Fraser Valley. About how much did spend individually on the following items this past year in the Fraser Valley?
» Transportation and fuel costs » Equipment rental or guiding services » Equipment purchase, parts, and maintenance costs
12. Now let’s talk about today’s expenditures for your entire group. How much did your entire group spend, or will spend, on this recreation activity in the Fraser Valley today, on:
Chilliwack Community ForestCredit Tourism Chilliwack

APPENDIX C
Sampling & Vehicle Counting Routes &
Locations

» Coquihalla Summit Recreation Area, Henning and 10k Riding Areas
» Coquihalla River Provincial Park
» HBC Brigade Trail (cross- jurisdictional)
» HBC Brigade Trail (cross- jurisdictional)/Peers Creek Recreation Site
Harrison East » Bear Creek (40 sites )
» Cascade Peninsula (25 sites )
» Cogburn Beach (25 sites )
Harrison West-1 » Grace Lake ( 10 sites )
» Wolf Lake ( 3 sites )
» Francis Lake Harrison ( 4 sites )
» Weaver Lake ( 29 sites )
» Weaver Lake Group Site ( 10 sites )
Harrison West-2 » Hale Creek ( 5 sites )
» Sunrise Lake ( 4 sites )
» Statlu Lake Trail
» Twenty Mile Bay ( 59 sites )
» Skwellepil Creek ( 52 sites )
» Wilson Lake ( 1 sites )
» Wood Lake ( 30 sites )
» Lookout Lake ( 1 sites )
» Rainbow Falls ( 0 sites )
» Long Island Bay
Harrison/Kent-1 » Bear Mountain Trail
» Harrison Grind/ Campbell Lake Trail
» Harrison Lake and River Boat Launch
» Harrison Lake Beach
» Harrison Lookout Trail
» Harrison Bluffs
» East Sector Lands, Spirit Trail
» Sandy Cove
» Sasquatch Provincial Park
Harrison/Kent-2 » Bridal Veil Falls Provincial Park
» Cheam Lake Wetlands Regional Park
» Fraser River - Gill Road (Fishing)
» Cheam Fishing Village (Cheam First Nation)
» Chillliwack Community Forest
» Lexw Qwo:m Park
» Lower Bridal Falls
» Cheam Lake Wetlands Regional Park
» Upper Bridal Falls
Harrison/Kent-3 » Dewdney Regional Park
» Nourish Creek
» Kilby Historic Site
» Kilby Provincial Park
» Mount Woodside
Flood Hope FallsCredit Jenn Kleingeltink
LIST OF ROUTES & LOCATIONS
Abbotsford » Abby Grind
» Discovery Trail (multiple locations)
» Matsqui Trail Regional Park (three locations)
Vedder Mt/Cultus Lake » Cultus Lake Provincial Park (six locations)
» Vedder Mountain (three locations)
Chilliwack River Valley-1 » Pierce Creek/ Pierce Lake Trail (4 sites )
» Slesse Memorial Trail
» Tamihi Rapids Recreation Site (3 sites )
» Tamihi Creek Recreation Site (116 sites )
» Thompson Regional Park
» Tamihi OHV Staging Area
» Bridlewood Trail
» Mt. Archibald/Lady Peak/Mount Laughington
» Mt. Cheam
Chilliwack River Valley-2 » Allison Pool Recreation Site ( 7 sites )
» Camp Foley Recreation Site ( 4 sites )
» Williams Ridge/Peak
» Rapids Recreation Site (28 sites )
» Chipmunk Caves
» Slesse Creek (Downstream of Limit Hole)
Chilliwack River Valley-3 » Chilliwack Lake Provincial Park (six locations)
» Chilliwack - Vedder Greenway / Rotary Trail
» Chilliwack Rotary Trail/Vedder Greenway (five locations)
» Vedder River Campground
» Heritage Park
» Chilliwack - North
» Fraser River - Island 22 Regional Park (2 locations)
» Fraser River - Peg Leg
» Elk Mountain (hiking)
» Chilliwack - Promontory
» Mt. Thom - Horse Loop Trail (four locations)
Coquihalla » Coquihalla Summit Recreation Area,
Bombtram Trail
» Coquihalla Summit Recreation Area, Needle Peak/The FlatIron/Yak Peak/Iago Peak
» Coquihalla Summit Recreation Area, Falls Lake/Zoa Peak
Cultus LakeCredit Tourism Abbotsford

» Stave Lake Recreation Site - Sayres Lake (40 sites )
» East Stave Lake Recreation Site - Kenyon Lake ( 1 sites )
» Devil’s Lake
» Rolley Provincial Park
» Rolley Lake Provincial Park
» Ruskin Dam/BC Hydro Recreation Site
» Hunter Trail
» Hayward Reservoir Trail/BC Hydro Recreation Site (2 locations)
Mission-2 » Mission Harbour
» Mission Plateau
» Neilson Regional Park/Hatzic Lake
» Cascade Falls Regional Park
» Little Nicomen Mountain
Hope-1 » Thacker Regional Park
» Fraser River Fishing - Rupert St boat launch
» Hope Lookout Trail
» Kawkawa Lake
» Lake of the Woods
» Othello Tunnels/Coquihalla Canyon Park
Hope-2 » F.H. Barber Provincial Park
» Silver Lake Provincial Park
» Skagit Valley Provincial Park (three locations)
» BC Hydro Recreation Site, Jones Lake/Wahleach Lake
» Eaton Creek Recreation Site (3 sites)/Eaton Lake Trail (Silver Hope Creek)
Mission-1 » Bear Mountain (2 locations)
» Red Mountain
» Stave Area/Bell Road
» Stave Lake Recreation Site - Kearsley Creek ( 65 sites )
» Stave Lake Recreation Site - Rock Creek (49 sites )
» Stave Lake Recreation Site - Rocky Point (30 sites )
Chehalis » Chehalis River (56 sites)
» Chehalis River Bridge
» Tapadera Estates
Highway 1 » Tikwalus Heritage Trail
» Anderson Creek
» Apocynym RST ( 16 sites )
» Fir Flat RST ( 6 sites )
» Log Creek RST ( 6 sites )
» Mehatl Falls Trailhead (formerly called Creek Provincial Park on this form)
» Nahatlatch Lake Provincial Park (six locations)
» Scuzzy Creek RST ( 7 sites )
» Spirit Caves in Yale
Highway 3 » EC Manning Provincial Park
» EC Manning Provincial Park
» EC Manning Provincial Park
» EC Manning Provincial Park
» EC Manning Provincial Park
» Silvertip Bowl Sunshine Valley
» EC Manning Provincial Park