Embed Size (px)
Citation preview

Food Price Monitor - November2020 1
2019Food Price Monthly
November IssueMonitor
20

Food Price Monitor - November2020 I
EXECUTIVE SUMMARYDuring October 2020, the Consumer Price Index (CPI) released by Statistics South Africa (Stats SA) indicated that the headline CPI and the food and non-alcoholic beverage price indices reached 3.3% and 5.4%, respectively. The same indices were 3.0% and 3.9% during September 2020.
Prices were compared for selected food items in urban areas for October 2020 vs. September 2020. Food items showing the largest price differences between October 2020 vs. September 2020 urban areas: rice (2kg) at a difference of R3.58, Ceylon/black tea (62.5g) at a difference of R1.38, peanut butter (400g) at a difference of R1.26, super maize (2.5kg) at a difference of R0.64, margarine spread (500g) at a difference of R0.61, white sugar (2.5kg) at a difference of R0.53 and sunflower oil (750mℓ) at a difference of R0.27. This indicates that urban consumers paid R0.78 more on average, for these 11 food items during October 2020.
The FAO Food Price Index (FFPI) in nominal terms, averaged 100.9 points in October 2020, up 3.0 points (3.1%) from September and 5.7 points (6.0%) higher than its value a year ago. The October value, the highest since January 2020, represented the fifth consecutive monthly increase. Much firmer prices of sugar, dairy, cereals and vegetable oils were behind the latest rise in the FFPI, while the meat sub-index fell slightly for the second consecutive month.
Important note
Resulting from COVID-19 health protocols, retail-based prices recorded across all regions (including online prices) have been pooled to create national average price changes which are applied to each elementary index at a regional level. This means that the geographic index (including total country) changes will, vary according to different weights and not different price changes. The October 2020 CPI data was published on Wednesday November 25, 2020 (see the link below for the CPI publication):
http://www.statssa.gov.za/publications/P0141/P0141October2020.pdf
Certain price comparisons would not be feasible at this stage such as the urban vs. rural price comparison.

Food Price Monitor - November 2020II
In October 2020, the cost of the NAMC basic urban food basket was R955.71, increasing by 10.3% from October 2019 (year-on-year increase) and increasing by 0.4% from September 2020 (month-on-month change).
Comparing October 2019 to October 2020 retail prices, higher price inflation (6% or more) were observed for the following products within the NAMC food basket (in order from highest to lowest inflation): Rice, oranges, bananas, dried beans, cheddar cheese, eggs, potatoes, cabbage, brown bread, white sugar, white bread, tomatoes, sunflower oil, IQF chicken portions, peanut butter, milk, chicken giblets and beef mince.
The items with high inflation could have negative implication in terms of basic food security (staple food inflation in the case of rice and bread) as well as dietary diversity (e.g. inflation on fruit, vegetables, oil and meat). When comparing the inflation rates for October 2019 to October 2020, with July 2019 to July 2020 (i.e. the previous Food Price Monitor analysis period) the rate of inflation was higher for animal protein foods, fruit, dairy, fats & oils and sugar.
As we approach the festive season food prices are expected to be supported by stronger demand. This is however expected to vary across product categories.
Cost pressures on farm level have also manifested in milk with production tending lower in 2020Q3. This trend is expected to continue which will result in higher retail prices of milk and dairy products over the next 3 to 6 months.
Arguably the biggest wild-card associated with the inflation projections is the occurrence of a second wave of Covid-19 and how government will react to it. As seen from Wave 1, this can lead to severe supply chain disruptions in food processing and retailing, which could lead to intermittent price shocks in certain products.

Food Price Monitor - November2020 III
Table of ContentsIntroduction
Overall inflation and food inflation: South Africa and selected countries
Urban food price trends:October 2020 vs. October 2019
Comparison between urban prices: October 2020
vs September 2020
International food prices
Estimated impact of food inflation on consumers
Outlook
01
03
04
06
071014
Food Price Monitor - November2020 1
IntroductionAs November 2020 official CPI data will only be released by December 9th 2020, this section contains data up to October 2020.
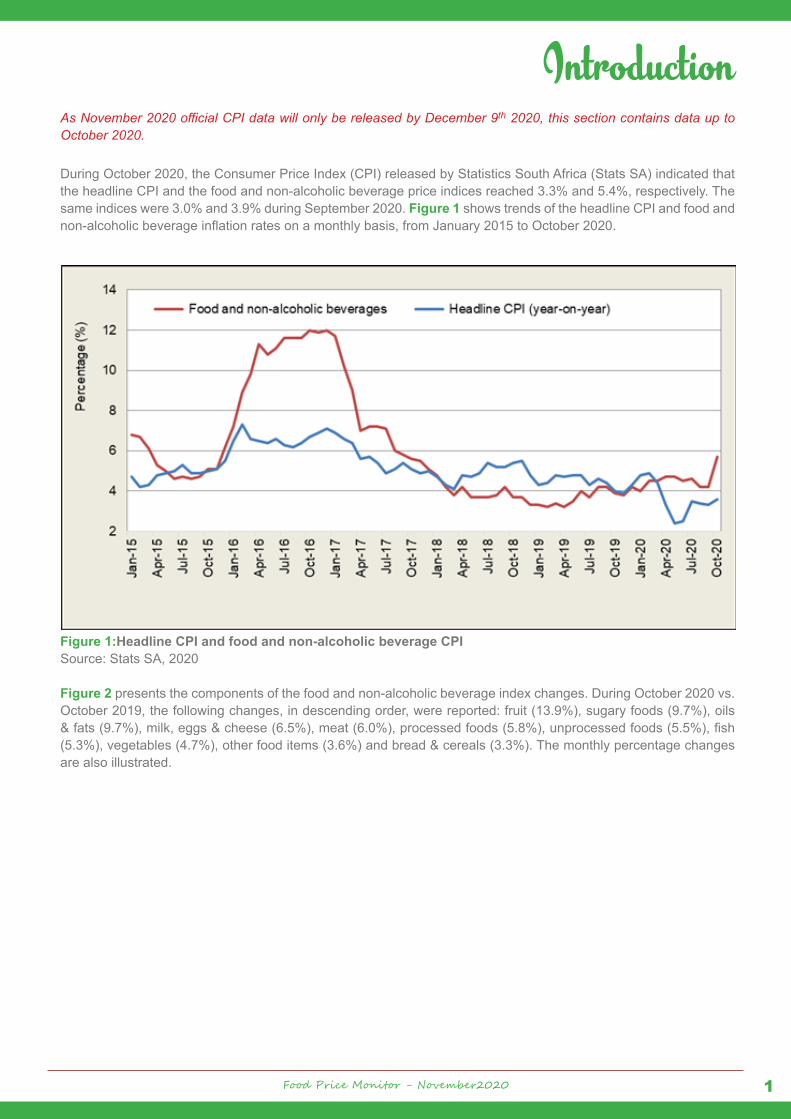
During October 2020, the Consumer Price Index (CPI) released by Statistics South Africa (Stats SA) indicated that the headline CPI and the food and non-alcoholic beverage price indices reached 3.3% and 5.4%, respectively. The same indices were 3.0% and 3.9% during September 2020. Figure 1 shows trends of the headline CPI and food and non-alcoholic beverage inflation rates on a monthly basis, from January 2015 to October 2020.
Figure 1:Headline CPI and food and non-alcoholic beverage CPISource: Stats SA, 2020
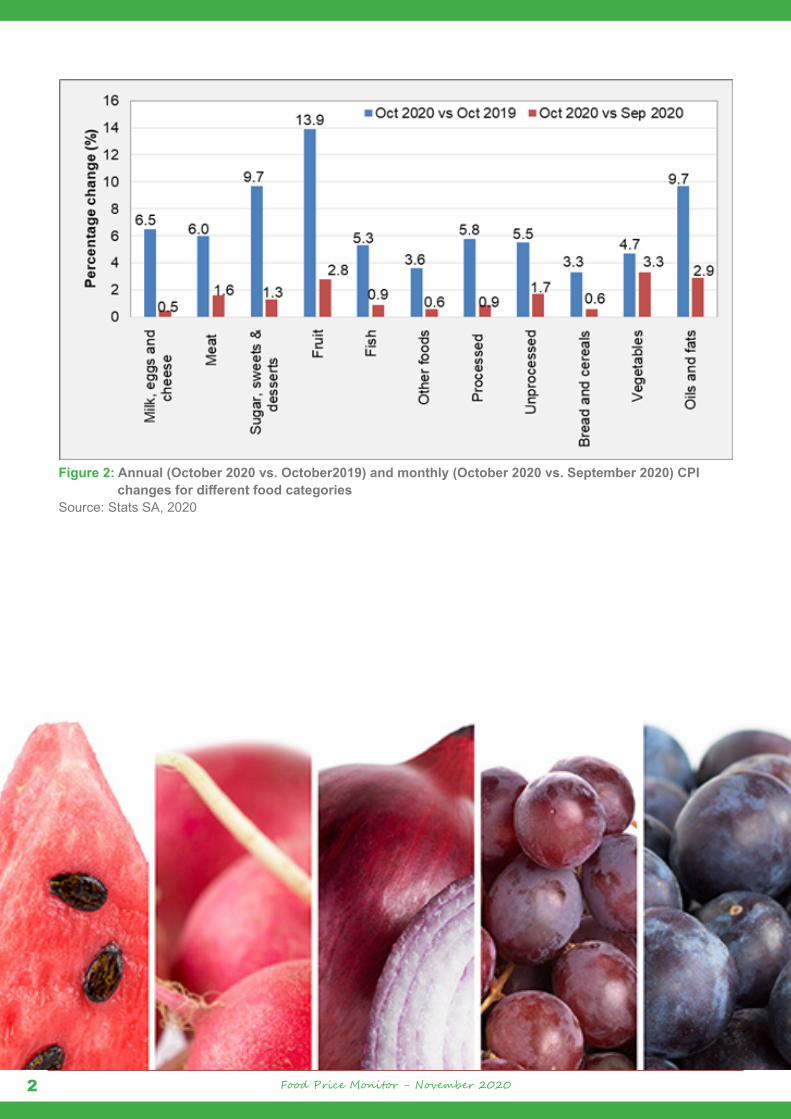
Figure 2 presents the components of the food and non-alcoholic beverage index changes. During October 2020 vs. October 2019, the following changes, in descending order, were reported: fruit (13.9%), sugary foods (9.7%), oils & fats (9.7%), milk, eggs & cheese (6.5%), meat (6.0%), processed foods (5.8%), unprocessed foods (5.5%), fish (5.3%), vegetables (4.7%), other food items (3.6%) and bread & cereals (3.3%). The monthly percentage changes are also illustrated.
Food Price Monitor - November 20202
Figure 2: Annual (October 2020 vs. October2019) and monthly (October 2020 vs. September 2020) CPI changesfordifferentfoodcategoriesSource: Stats SA, 2020

Food Price Monitor - November2020 3
Overall inflation and food inflation: South Africa and selected countriesTable 1 shows the annual year-on-year (y-o-y) overall inflation and food inflation rates for October 2020 for South Africa and other selected countries. South Africa’s overall inflation for October 2020 reached 3.3% with food inflation reaching 5.4%. The food categories with the largest annual contribution to South African food inflation include fruit, sugary foods and oils & fats categories. The Zambian overall inflation rate for October 2020 reached 16.0%, with food inflation reaching 14.6%. China’s overall inflation rate was 0.5%, with food inflation of 2.2% for October 2020. Considering inflation rates of the BRIC countries, China recorded the lowest overall inflation of 0.5%, with Brazil with the highest food inflation contributor at 13.9%.
Table 1:OverallinflationandfoodinflationduringAugust2020toOctober2020
August 2020 September 2020 October 2020
Country Overall inflation(%)
Foodinflation(%)
Overall inflation(%)
Food inflation(%)
Overall inflation(%)
Food inflation(%)
Botswana 1.0 4.2 1.8 4.2 2.2 4.3Brazil 2.4 8.8 3.1 11.8 3.9 13.9China 2.4 11.2 1.7 7.9 0.5 2.2India 6.7 9.1 7.3 10.7 7.6 11.1Namibia 2.4 6.8 2.4 6.6 2.3 7.1Russia 3.6 4.8 3.7 4.9 4.0 NASouth Africa 3.1 3.9 3.0 3.9 3.3 5.4Turkey 11.8 13.5 11.8 15.0 11.9 16.5United Kingdom 0.2 0.4 0.5 -0.1 0.7 0.6
United States 1.3 4.1 1.4 3.9 1.2 3.9Zambia 15.5 15.5 15.7 14.0 16.0 14.6
Sources: Central banks and statistics reporting institutions of these countries, 2020

Food Price Monitor - November 20204
Urban food price trends: October 2020 vs. October 2019
As a result of the Covid-19 global pandemic, rural prices could not be monitored during October 2020, therefore this section will rank urban price for October 2020 vs. October 2019.
Table 2 rank selected food items pertaining to urban areas according to their various inflation rates. The food products highlighted in Table 2 are those with annual urban inflation rates exceeding the South African Reserve Bank’s (SARB) inflation upper band of 6%:
Table 2: Food items in the urban areas ranked (October 2020 vs. October 2019)
Grain and grain products %
Meat, meat products, dairy, dairy products and
eggs% Fresh and processed
fruits and vegetables %
Margarine spread 500g -5.3% Polony per kg / 1kg -6.5% Cauliflower - fresh per kg / each -55.7%
Pasta 500g -2.6% Ham 500g -2.6% Apples - fresh per kg -32.8%
Super maize 5kg -2.0% Chicken portions frozen - non IQF average per kg -1.9% Pears - fresh per kg -2.3%
Super maize 1kg -1.9% Chicken portions frozen - non IQF per kg (real) -1.9% Onions - fresh per kg -0.8%
Brick margarine 1kg -1.5% Tuna - tinned 170g -0.3% Baked beans - tinned 410g 0.6%Brick margarine 500g 2.4% Low fat milk - fresh 1ℓ 0.8% Tomatoes - fresh per kg 10.1%Special maize 5kg 3.7% Low fat milk - fresh 2ℓ 2.7% Cabbage - fresh each 14.1%Super maize 2.5kg 4.9% Beef T-bone - fresh per kg 2.8% Cabbage - fresh per kg 14.1%Special maize 2.5kg 5.4% Powdered milk 900g 3.8% Potatoes - fresh per kg 14.7%Cold cereals 500g 6.9% Lamb - offal per kg 4.0% Beetroot - fresh per kg 18.4%Cake flour 2.5kg 8.0% Fish (excl. tuna) - tinned 400g 4.1% Beans - dried 500g 26.6%
Peanut butter 400g 8.1% Beef offal - fresh per kg 4.1% Bananas - fresh per kg 31.0%
Instant noodles 73g 8.6% Pork - ribs per kg 4.2% Oranges - fresh per kg 38.5%
Sunflower oil 750mℓ 9.9% Full cream milk - fresh 2ℓ 4.7% Sweet potatoes - fresh per kg 46.3%
Loaf of white bread 700g 10.1% Lamb - neck per kg 5.0% Pumpkin - fresh per kg 51.9%
Loaf of brown bread 700g 10.8% Pork chops - fresh per kg 5.6%
Spaghetti 500g 15.6% Beef brisket - fresh per kg 5.6%Macaroni 500g 23.7% Low fat milk - long life 1ℓ 6.0%Rice 2kg 61.0% Beef chuck - fresh per kg 6.3% Other %Rice 1kg 80.2% Beef mince - fresh per kg 6.5% Ceylon/black tea 250g -4.2%
Full cream milk - fresh 1ℓ 6.9% Ceylon/black tea 62.5g -2.8%
Chicken giblets per kg 7.0% Instant coffee 250g 3.9%Full cream milk - long life 1ℓ 7.2% White sugar 2.5kg 10.3%IQF chicken portions - 2kg 9.1%IQF chicken portions - 1kg 9.7%Beef sirloin - fresh per kg 10.6%Eggs 0.5 dozen 10.8%

Food Price Monitor - November2020 5
Grain and grain products %
Meat, meat products, dairy, dairy products and
eggs% Fresh and processed
fruits and vegetables %
Bacon 250g 11.2%Sausage 500g 14.6%Lamb - loin chop per kg 14.8%Beef rump steak - fresh per kg 15.3%
Corned beef 300g 17.7%Beef fillet - fresh per kg 18.1%Chicken portions - fresh per kg 19.5%
Lamb - rib chop per kg 20.2%Eggs 1.5 dozen 22.9%Cheddar cheese per kg 24.6%Lamb - stew per kg 24.8%Whole chicken - fresh per kg 29.5%Beef stew - per kg 46.2%Lamb - leg per kg 50.5%
Source: Stats SA, 2020Note: Food items highlighted in the table above experienced price increases above the SARB inflation target of 6%.
A closer look at annual food price trends: October 2020 vs. October 2019
During the period October 2020 vs. October 2019, the international price of wheat increased by 37%, while domestic wheat prices increased by 14.7%. Urban consumers paid 10.8% and 10.1% more for a loaf of brown and white bread (700g), respectively. Domestic yellow maize prices increased by 24.5%, while international yellow maize prices increased by 11.7%. Special and super maize meal prices (2.5kg) increased by 5.4% and 4.9%, respectively in urban areas. During the same period, the urban prices of sunflower oil (750mℓ) increased by 9.9%. Domestic prices of sunflower seed increased by 39.7% annually, while international sunflower seed prices increased by 31.7%.
During October 2020 vs. October 2019, average beef producer prices (R/kg) of classes B2/B3 and C2/C3 increased by 12.8% and 12.6%, respectively, while the price of class A2/A3 increased by 8.7% during the same period. Lamb/mutton producer prices (R/kg) of classes C2/C3, A2/A3 and B2/B3 increased by 39.3%, 30.1% and 27.9%, respectively. Producer prices of fresh and frozen chicken decreased by 10.3% and 1.5%, respectively while individually quick frozen (IQF) chicken portions (R/kg) increased by 0.6%. Porker and baconer producer prices (R/kg) increased by 15.8% and 9.3%, respectively, during the same period.

Food Price Monitor - November 20206
Comparison between urban: October 2020 vs. September2020Table 3 compares prices of selected food items in urban areas for October 2020 vs. September 2020. Food items showing the largest price differences between October 2020 vs. September 2020 urban areas: rice (2kg) at a difference of R3.58, Ceylon/black tea (62.5g) at a difference of R1.38, peanut butter (400g) at a difference of R1.26, super maize (2.5kg) at a difference of R0.64, margarine spread (500g) at a difference of R0.61, white sugar (2.5kg) at a difference of R0.53 and sunflower oil (750mℓ) at a difference of R0.27. This indicates that urban consumers paid R0.78 more on average, for these 11 food items during October 2020.
Table 3: Comparison between urban food prices (selected food items)
Product Urban Food PricesJune 2020
Urban Food Estimated PricesJuly 2020 (R/unit)
Pricedifference(R/unit)
Full cream milk – long life 1ℓ 15.71 15.68 -0.03Loaf of brown bread 700g 13.84 13.88 0.04Loaf of white bread 700g 15.03 15.10 0.07Special maize 2.5 kg 22.55 22.74 0.19Super maize 2.5 kg 24.88 25.52 0.64Margarine spread 500g 24.80 25.41 0.61Peanut butter 400g 31.68 32.94 1.26Rice 2kg 39.64 43.22 3.58Sunflower oil 750mℓ 23.84 24.11 0.27Ceylon/black tea 62.5g 14.62 15.99 1.38White sugar 2.5kg 43.62 44.15 0.53
Averagedifference(R/unit) R0.78
Source: Stats SA, 2020

Food Price Monitor - November2020 7
International food pricesThe Food and Agricultural Organization (FAO) of the United Nations (UN) publishes its Food Price Index (FPI) on a The Food and Agricultural Organization (FAO) of the United Nations (UN) publishes its Food Price Index (FPI) on a monthly basis. The FPI consists of five commodity group price indices, namely, the Meat Price Index, the Dairy Price Index, the Cereals Price Index, the Oils Price Index and the Sugar Price Index. These indices are weighted with the average export shares of each of the groups for 2014 to 2016. In total, 95 price quotations, considered by FAO commodity specialists as representing the international prices of the noted food commodities, are included in the overall index. Figure 3 shows the overall monthly real (deflated) FAO FPI from 2016 to 2020, with July 2020 reaching an index level of 101.9 points, up 3.1% from September 2020.
Figure 3: International monthly real FPISource: FAO, 2020*Note: Current year

Food Price Monitor - November 20208
Figure 4 shows the price indices in real terms for five food categories. The monthly (October 2020 vs. September 2020) growth percentages indicated increasing trends for four of the five Indices. The annual (October 2020 vs. October 2019) growth percentages indicated increasing trends of 27.1% for Oils Price Index and 17.1% for the Cereals Price Index, whilst the Meat Price Index reflected the largest annual decline percentage of 10.3%.
Figure 4: RealpriceindicesforfivefoodcategoriesSource: FAO, 2020
The FAO Food Price Index (FFPI)¹ in nominal terms, averaged 100.9 points in October 2020, up 3.0 points (3.1%) from September and 5.7 points (6.0%) higher than its value a year ago. The October value, the highest since January 2020, represented the fifth consecutive monthly increase. Much firmer prices of sugar, dairy, cereals and vegetable oils were behind the latest rise in the FFPI, while the meat sub-index fell slightly for the second consecutive month.
The FAO Cereal Price Index in nominal terms, averaged 111.6 points in October, up 7.5 points (7.2%) from September and as much as 15.8 points (16.5%) above its value in the corresponding month last year. The October rise marked the fourth month of consecutive increase. Wheat export prices rose further in October,
reflecting strong global demand amidst shrinking export availabilities, poor growing conditions in Argentina and continued dry weather adversely affecting winter wheat conditions in parts of Europe, northern America and the Black sea region. International maize prices also rallied to over six-year highs, largely underpinned by a fast pace in purchases by China and higher than earlier anticipated drawdown of stocks in the United States of America as well as sharp declines in export supplies in Brazil and Ukraine. Feed barley and sorghum prices also increased in October, supported by strong demand and spill-over from rising maize and wheat prices. By contrast, international rice prices fell to seven-month lows, as main-crop harvests got underway in Asia, intensifying efforts to attract buyers.
¹Unlike for other commodity groups, most prices utilized in the calculation of the FAO Meat Price Index are not available when the FAO Food Price Index is computed and published; therefore, the value of the Meat Price Index for the most recent months is derived from a mixture of projected and observed prices. This can, at times, require significant revisions in the final value of the FAO Meat Price Index which could in turn influence the value of the FAO Food Price Index.

Food Price Monitor - November2020 9
The FAO Vegetable Oil Price Index in nominal terms, averaged 106.4 points in October, up 1.8 points (1.8%) month-on-month and posting a nine-month high. The continued strength of the index largely reflects firmer palm and soy oil prices, while those of rapeseed oil declined moderately. International palm oil quotations rose for a fifth consecutive month, underpinned by below-potential production prospects in leading producing countries and robust global import demand. In the meantime, soy oil values were supported by continued supply tightness in South America. By contrast, after rising five months in succession, international rapeseed oil values decreased in October, amid increased uncertainty regarding demand in the EU following the recent deterioration of the Covid-19 situation across the region.
The FAO Dairy Price Index in nominal terms, averaged 104.4 points in October, up 2.2 points (2.2%) from September, marking the fifth consecutive monthly increase and lifting the index 3.6 points (3.5%) above its value in the corresponding month last year. In October, price quotations for all dairy products represented in the index rose, with cheese rising the most, followed by skim milk powder, whole milk powder and butter. Price increases in October reflected some degree of market tightening for near-term deliveries, underpinned by robust import demand from Asian and Middle Eastern markets amidst expectations for less export availabilities from Oceania later this year when production will be declining seasonally. In addition, increases in internal demand for future deliveries in Europe, where production is nearing its seasonal low, also contributed to spot market tightening and price strengthening.
The FAO Meat Price Index² in nominal terms, averaged 90.7 points in October, down slightly (0.5 points or 0.5%) from September, marking the ninth monthly decline since January, and standing 10.9 points (10.7%) lower than its value a year ago. Pig meat prices dropped, as a fall in the quotations of German products, reflecting continued influence of the import restrictions imposed by China on Germany, outweighed an increase in those from Brazil due to robust import demand. Meanwhile, bovine meat prices declined due to weak demand in the United States of America, coupled with rising shipments from South America, although supplies from Australia drifted lower due to rising demand for cattle for herd rebuilding. Poultry meat prices also fell slightly because of reduced orders from China and Saudi Arabia. By contrast, prices of ovine meat rose on steady internal demand and low export supplies, especially in Australia.
The FAO Sugar Price Index in nominal terms, averaged 85.0 points in October, up 6.0 points (7.6%) from September and 7.2 points (9.3%) from last year. This increase reflected mostly the prospects of a lower sugar output in both Brazil and India, the two largest sugar producing countries, due to below average rainfalls. Sugar prices were also supported by developments in Thailand, where sugar output is seen lower by almost 5 percent from last year as a result of protracted dry conditions. Additional upward pressure was provided by fund buying, as evidenced by the weekly Commitment of Traders (COT) report. Furthermore, sugar prices displayed high volatility, driven also by uncertainties in crude oil market and movements in the Brazilian Real against the United States Dollar.
²Unlike for other commodity groups, most prices utilized in the calculation of the FAO Meat Price Index are not available when the FAO Food Price Index is computed and published; therefore, the value of the Meat Price Index for the most recent months is derived from a mixture of projected and observed prices. This can, at times, require significant revisions in the final value of the FAO Meat Price Index which could in turn influence the value of the FAO Food Price Index.

Food Price Monitor - November 202010
Estimated impact of food inflation on consumersThe purpose of this section is to illustrate the impact of food inflation on consumers. The analysis presented in the first part of this section is based on the cost of a basic food basket³ (as originally compiled by the Food Price Monitoring Committee in 2003, which was revised in January 2017) and, based on monthly average food price data for the period October 2019 to October 2020.
In October 2020, the cost of this basic urban food basket was R955.71, increasing by 10.3% from October 2019 (year-on-year increase) and increasing by 0.4% from September 2020 (month-on-month change). The cost of this food basket expressed as a share of the average monthly income of the poorest 30% of the population increased from 58.2% in October 2019 to 64.2% in October 2020. The cost of the food basket expressed as a share of the average monthly income of the wealthiest 20% of the population increased from 3.1% in October 2019 to 3.4% in October 2020 (Figure 5).
Figure 5: The cost of a typical consumer food basket for the period January 2017 to October 2020, expressed innominaltermsandasshareoftheaverageincomeofthepoorest30%ofhouseholds(Expenditure Deciles[ED]1-3)andthewealthiest20%ofhouseholds(ED9-10)Sources: BFAP calculations, based on Stats SA monitored price data for urban areas, 2020
³Composition of food basket: Apples fresh (per kg), Baked beans tinned (410g), Bananas fresh (per kg), Beans dried (500g), Beef mince fresh (per kg), Beef offal fresh (per kg), Bread loaf brown (700g), Bread loaf white (700g), Cabbage fresh (per kg), Cheese cheddar (per kg), Chicken giblets (per kg), Chicken portions IQF (2kg), Coffee instant (250g), Eggs (1.5 dozen), Fish (excl. tuna) tinned (400g), Maize meal super (5kg), Margarine brick (500g), Milk full cream long life (1ℓ), Onions fresh (per kg), Oranges fresh (per kg), Peanut butter (400g), Polony (per kg), Potatoes fresh (per kg), Rice (2kg), Sugar white (2.5kg), Sunflower oil (750mℓ), Tea Ceylon/black (250g), Tomatoes fresh (per kg).

Food Price Monitor - November2020 11
To further explore the impact of inflation on consumers, Figure 6 presents an illustration of the average monthly nominal cost of specific food groups within the basic food basket, comparing October 2019 to October 2020. Food groups with more prominent inflation included bread & cereals, dairy & eggs, legumes, sugar and vegetables.
Figure 6: NominalcostgrowthofspecificfoodgroupswithintheNAMC’s28-itemfoodbasket,comparing October 2020 vs. October 2019 (y-o-y) and October 2020 vs. September 2020 (m-o-m)Sources: BFAP & NAMC calculations, Stats SA, 2020
The various food groups within this food basket are discussed in more detail in Table 4 below.

Food Price Monitor - November 202012
Table 4: Overviewofcontributionstoannualfoodpriceincreaseswithinthe28-itemNAMCfoodbasket,October2020 vs. October 2019
Food group
Overallinflationrate
Majorcontributorstoinfla-tion in this category
Minorcontributors to inflationinthis
category
Non-contributors to inflationinthis
categoryCommentsOct 2020
vs. Oct 2019
Jul 2020* vs. Jul 2019*
Animal protein +4.6% +4.5%
IQF chicken portions (+9.1%)Chicken giblets +7.0%) Beef mince (+6.5%)Beef offal (+4.1%)Tinned fish (+4.1%)
None Polony (-6.5%) None
Bread and cereals
+19.1% +22.0%Rice (+61.0%)Brown bread (+10.8%) White bread (+10.1%)
None Maize meal (-2.0%) None
Vegeta-bles +9.3% +13.2%
Potatoes (+14.7%)Cabbage (+14.1%)Tomatoes (+10.1%)
None Onions (-0.8%) None
Fruit +5.3% +2.6% Bananas (+31.0%)Oranges (+38.5%) None Apples
(-32.8%) None
Dairy +15.9% +12.3% Cheddar cheese (+24.6%)Milk (+7.2%) None None High inflation
on eggs and cheese.Eggs +22.9% +50.7% Eggs (+22.9%) None None
Fats and oils +6.1% +0.1% Sunflower oil (+9.9%)
Brick margarine (+2.4%)
None Inflation on sunflower oil
Bean products +12.6% +9.4% Dried beans (+26.6%)
Peanut butter (+8.1%)Baked beans (+0.6%) None
Inflation mainly on dried beans and peanut butter.
Coffee and tea -0.2% -8.1% None Instant coffee
(+3.9%)Ceylon/black tea (-4.2%)
Instant coffee (+3.9%)
Sugary foods +10.3% +6.3% White sugar (+10.3%) None None Inflation on
sugarSources: BFAP & NAMC calculations, Stats SA, 2020*Note: Previous Food Price Monitor analysis period prior to October 2020 vs. October 2019
Thus, when comparing October 2019 to October 2020 retail prices, higher price inflation (6% or more) were observed for the following products within the NAMC food basket (in order from highest to lowest inflation): Rice, oranges, bananas, dried beans, cheddar cheese, eggs, potatoes, cabbage, brown bread, white sugar, white bread, tomatoes, sunflower oil, IQF chicken portions, peanut butter, milk, chicken giblets and beef mince. The items with high inflation could have negative implication in terms of basic food security (staple food inflation in the case of rice and bread) as well as dietary diversity (e.g. inflation on fruit, vegetables, oil and meat). When comparing the inflation rates for October 2019 to October 2020, with July 2019 to July 2020 (i.e. the previous Food Price Monitor analysis period) the rate of inflation was higher for animal protein foods, fruit, dairy, fats & oils and sugar.

Food Price Monitor - November2020 13
⁴Steyn NP, Labadarios D. National Food Consumption Survey: Children aged 1–9 years, South Africa, 1999. Cape Town: The Department of Health Directorate Nutrition, 2000⁵Oldewage-Theron W, Dicks E, Napier C, et al. Situation analysis of an informal settlement in the Vaal Triangle. Development Southern Africa 2005; 22 (1): 13-26
The impact of inflation on very poor consumers is further explored below, based on the typical portion sizes of very poor consumers of the five most widely consumed food items in South Africa represented by maize porridge, brown bread, sugar, tea and full cream milk (National Food Consumption Survey - Steyn & Labadarios, 2000⁴; Oldewage-Theron et al, 2005⁵). Figure 7 illustrates the estimated portion costs for these foods, calculated from monthly food price data for October 2019 and October 2020. Similar to other Food Price Monitor analysis periods, the significant cost contribution of maize meal and bread to the typical basic daily food selection for poor consumers are emphasised by the results in Figure 7.
Furthermore, despite the relatively low actual food weight contribution of bread to this ‘food plate’, the bread component costs more than the maize porridge component (about 67% more in this case for October 2020). When comparing, the costs associated with the typical portion sizes of very poor consumers for the five most widely consumed food items in South Africa, based on October 2020 versus October 2019 prices the results in Figure 7 indicated inflation of about 5.5% (from R6.06 to R6.40 for the selection of typical portions), with tea, sugar and brown bread contributing to inflation. From September 2020 to October 2020 the costs associated with the typical portion sizes of very poor consumers for the five most widely consumed food items in South Africa decreased by 1.4%.
Figure 7:Averagenominalcostforthetypicalportionsofthefivefooditemsmostwidelyconsumedbyvery poor consumers in South Africa, October 2020 vs. October 2019Sources: BFAP calculations, Stats SA, 2020

Food Price Monitor - November 202014
OutlookAs we approach the festive season food prices are expected to be supported by stronger demand. This is however expected to various product categories. Nielsen (2020)⁶ notes that there are two types of consumers as we emerge from the Covid-19 lockdowns. The first is the insulated spender, whose income has not been affected by the lockdown and associated economic downturns. These consumers will focus on more expensive and exotic food products to compensate for the fact that vacation and entertainment options are restricted. On the other end of the spectrum, there are constrained spenders. These are spenders that would have normally increased expenditure during the festive season but due to the aftermath of Covid-19 and its associated lockdowns have to pull the belt tighter. In terms of how demand will affect food inflation going forward, the key question is therefore related to the size of these respective groups. It is expected that in the South African context, the constrained spenders will out way the insulated spenders which will result in overall dampened demand for food over the coming months, especially with regards to premium food products.
In terms of supply issues, prices on Oils and Fats will remain higher due to the shortage of the underlying commodities. Meat inflation also remain significant high due to the demand over the festive season.
The high increase in mutton and lamb can be attributed to a decrease in the supply which result in lower slaughter numbers. The production of poultry increases and imports are also lower, this can be attributed to an increased in tariffs and logistics constrains through Covid-19. Climatic conditions can favour vegetable production and ease the increase in price. Intentions to plant for maize in the coming season are up by 5.18%, which could dampen price growth in the coming season. Cost pressures on farm level have also manifested in milk with production tending lower in 2020Q3. This trend is expected to continue which will result in higher retail prices of milk and dairy products over the next 3 to 6 months.
Arguably the biggest wild-card associated with the inflation projections is the occurrence of a second wave of Covid-19 and how government will react to it. As seen from Wave 1, this can lead to severe supply chain disruptions in food processing and retailing, which could lead to intermittent price shocks in certain products.
⁶Nielsen 2020. Predicting the Covid-19 behavioural reset. Available on: https://www.nielsen.com/us/en/insights/report/2020/predicting-the-covid-19-be-havioral-reset/
Food Price Monitor - November2020 15
Compiled by:
Price trends: Outlook/BFAP:Corné Dempers Hester Vermeulen Dr. Marlene Labuschagne Design by Sylvester Moatshe
Enquiries: Dr. Christo Joubert: +27 12 341 1115 or [email protected]
© 2020. Published by the National Agricultural Marketing Council (NAMC).
Disclaimer:Information contained in this document results from research funded wholly or in part by the NAMC acting in good faith. Opinions, attitudes and points of view expressed herein do not necessarily reflect the official position or policies of the NAMC. The NAMC makes no claims, promises, or guarantees about the accuracy, completeness, or adequacy of the contents of this document and expressly disclaims liability for errors and omissions regarding the content thereof. No warranty of any kind, implied, expressed, or statutory, including but not limited to the warranties of non-infringement of third-party rights, title, merchantability, fitness for a particular purpose or freedom from computer virus is given with respect to the contents of this document in hardcopy, electronic format or electronic links thereto. Reference made to any specific product, process, and service by trade name, trade mark, manufacturer or another commercial commodity or entity are for informational purposes only and do not constitute or imply approval, endorsement or favouring by the NAMC.
BACKGROUND INFORMATIONAgriculture, Forestry and Fisheries (DAFF) established the Food Price Monitoring Committee (FPMC) at the NAMC to track and report food price trends in South Africa; to provide explanations of the observed trends and to then advise the Department on any possible action that could be taken should national and household food security be threatened. The FPMC was established after the high food price episode of 2000/01 season. The functions of the FPMC were continued by the NAMC after the FPMC completed its work in August 2004. The NAMC issues four quarterly Food Price Monitoring reports annually and, since 2005, also publishes an annual Food Cost Review report, which documents the margins between farm and retail prices of the major food products, amongst other topics. In 2015, the NAMC began releasing a quarterly Farm-to-Retail-Price-Spread (FTRPS) publication, which seeks to provide more insight into the factors driving commodity and food price margins. This publication, the Food Basket Price Monthly report, came as a result of discussions with industry to keep a more frequent watch on the movements of food prices.