Embed Size (px)
Citation preview

2019Annual reports . on the implementation of the EU budget
for the 2019 financial year and
. on the activities funded by the 8th, 9th, 10thand 11th European Development Funds (EDFs) for the 2019 financial year
EN
EN

EUROPEAN COURT OF AUDITORS 12, rue Alcide De Gasperi 1615 Luxembourg LUXEMBOURG
Tel. +352 4398-1Enquiries: eca.europa.eu/en/Pages/ContactForm.aspWebsite: eca.europa.euTwitter: @EUAuditors
More information on the European Union is available on the internet (http://europa.eu).
Luxembourg: Publications Office of the European Union, 2020
PDF ISBN 978-92-847-4893-8 ISSN 2600-156X doi:10.2865/968688 QJ-AL-20-001-EN-N

Pursuant to Article 287(1) and (4) of the TFEU, Article 258 of Regulation (EU, Euratom) 2018/1046 of the European Parliament and of the Council of 18 July 2018 on the financial rules applicable to the general budget of the Union, amending Regulations (EU) No 1296/2013, (EU)
No 1301/2013, (EU) No 1303/2013, (EU) No 1304/2013, (EU) No 1309/2013, (EU) No 1316/2013, (EU) No 223/2014, (EU) No 283/2014, and Decision No 541/2014/EU and
repealing Regulation (EU, Euratom) No 966/2012, and Article 43 of Council Regulation (EU) 2018/1877 of 26 November 2018 on the financial regulation applicable to the 11th European
Development Fund, and repealing Regulation (EU) 2015/323
the Court of Auditors of the European Union, at its meetings of 24 September and 20 July 2020, adopted its
ANNUAL REPORTS for the 2019 financial year
The reports, together with the institutions' replies to the Court's observations, have been sent to the authorities responsible for giving discharge and to the other institutions.
The Members of the Court of Auditors are:
Klaus-Heiner LEHNE (President), Ladislav BALKO, Lazaros S. LAZAROU, Pietro RUSSO, Baudilio TOMÉ MUGURUZA, Iliana IVANOVA, Alex BRENNINKMEIJER,
Nikolaos MILIONIS, Bettina JAKOBSEN, Samo JEREB, Jan GREGOR, Mihails KOZLOVS, Rimantas ŠADŽIUS, Leo BRINCAT, João FIGUEIREDO, Juhan PARTS, Ildikó GÁLL-PELCZ,
Eva LINDSTRÖM, Tony MURPHY, Hannu TAKKULA, Annemie TURTELBOOM, Viorel ŞTEFAN, Ivana MALETIĆ, Francois-Roger CAZALA, Joëlle ELVINGER,
Helga BERGER
3

Contents Page
Annual report on the implementation of the EU budget for the 2019 financial year 5
Institutions’ replies to the annual report on the implementation of the EU budget for the 2019 financial year 237
Annual report on the activities funded by the 8th, 9th, 10th and 11th European Development Funds for the 2019 financial year 285
European Commission’s replies to the annual report on the activities funded by the 8th, 9th, 10th and 11th European Development Funds for the 2019 financial year 320
4

Annual report on the implementation of the EU budget for the 2019
financial year
5

Contents Page
General introduction 7
Chapter 1 The statement of assurance and supporting information 9
Chapter 2 Budgetary and financial management 51
Chapter 3 Revenue 88
Chapter 4 Competitiveness for growth and jobs – MFF heading 1a 111
Chapter 5 Economic, social and territorial cohesion – MFF heading 1b 130
Chapter 6 Natural resources – MFF heading 2 165
Chapter 7 Security and citizenship – MFF heading 3 189
Chapter 8 Global Europe – MFF heading 4 204
Chapter 9 Administration – MFF heading 5 221
Institutions' replies 237
6

General Introduction 0.1. The European Court of Auditors (ECA) is an institution1 of the European Union(EU) and the external auditor of the EU’s finances2. In this capacity, we act as the independent guardian of the financial interests of all EU citizens, notably by helping to improve the EU’s financial management. More information on our work can be found in our annual activity reports, our special reports, our review documents and our opinions on new or updated EU laws or other decisions with financial management implications3.
0.2. This year, we have for the first time split our annual report for the 2019financial year into two separate parts. This part concerns the reliability of the EU consolidated accounts and the regularity of transactions. The other part covers the performance of spending programmes under the EU budget.
0.3. The EU’s general budget is approved annually by the Council of the EuropeanUnion and by the European Parliament. Our annual report combined as appropriate with our special reports, provides a basis for the discharge procedure, in which the Parliament, acting on a recommendation from the Council, decides whether the European Commission has satisfactorily met its budgetary responsibilities. On publication, we forward our annual report to national parliaments, the European Parliament and the Council.
0.4. The central element of our report is the statement of assurance on thereliability of the EU consolidated accounts and the legality and regularity of transactions. This statement is supplemented by specific assessments for each major area of EU activity.
1 The ECA was established as an institution by Article 13 of the Treaty on European Union, also known as the Maastricht Treaty (OJ C 191, 29.7.1992, p. 1). However, it was first established by the Treaty of Brussels in 1977, as the new Community body responsible for the external audit function (OJ L 359, 31.12.1977, p. 1).
2 Articles 285 to 287 of the Treaty on the Functioning of the European Union (TFEU) (OJ C 326, 26.10.2012, pp. 169-171).
3 Available on our website: www.eca.europa.eu.
7

0.5. This part of our report is structured as follows:
— chapter 1 contains the statement of assurance and a summary of the results of our audit on the reliability of accounts and the regularity of transactions;
— chapter 2 presents our analysis of budgetary and financial management;
— chapter 3 presents our findings on EU revenue;
— chapters 4 to 9 show, for the main headings of the current multiannual financial framework (MFF)4, the results of our testing of the regularity of transactions and our examination of the Commission’s annual activity reports, other elements of its internal control systems and other governance arrangements.
0.6. As there are no separate financial statements for individual MFF headings, theconclusions to each chapter do not constitute an audit opinion. Instead, the chapters describe significant issues specific to each MFF heading.
0.7. We aim to present our observations in a clear and concise way. We cannotalways avoid using terms specific to the EU, its policies and budget, or to accounting and auditing. On our website, we have published a glossary with explanations of most of these specific terms5. The terms defined in the glossary appear in italics when they first appear in each chapter.
0.8. The Commission’s replies to our observations (and, where appropriate, thereplies of other EU institutions and bodies) are presented with this report. It is our responsibility, as external auditor, to report our audit findings and draw the necessary conclusions so as to provide an independent and impartial assessment of the reliability of the EU accounts and the regularity of transactions.
4 We do not provide a specific assessment for spending under heading 6 (‘Compensations’) or for expenditure outside the MFF. Our analysis of heading 3 (‘Security and citizenship’) and heading 4 (‘Global Europe’), in chapters 7 and 8 respectively, does not include an estimated level of error.
5 https://www.eca.europa.eu/Lists/ECADocuments/GLOSSARY-AR_2019/GLOSSARY-AR_2019_EN.pdf
8

Chapter 1
The statement of assurance and supporting information
9
Contents
Paragraph
The ECA's Statement of Assurance provided to the European Parliament and the Council – independent auditor’s report I.-XXX.
Introduction 1.1.-1.6. The role of the European Court of Auditors 1.1.-1.4.
EU spending is a significant tool for achieving policy objectives 1.5.-1.6.
Audit findings for the 2019 financial year 1.7.-1.38. Reliability of the accounts 1.7.-1.10. The accounts were not affected by material misstatements 1.7.-1.9.
Key audit matters relating to the 2019 financial statements 1.10.
Regularity of transactions 1.11.-1.30. Our audit covers revenue and expenditure transactions underlying the accounts 1.12.-1.17.
Error continues to be present in specific types of spending 1.18.
The complexity of rules and the way EU funds are disbursed have an impact on the risk of error 1.19.-1.30.
The Commission’s regularity information 1.31.-1.38. The Commission’s estimate of error is at the lower end of our range 1.33.-1.34.
There are some issues with the components of the Commission’s estimates 1.35.-1.38.
We report suspected fraud to OLAF 1.39.-1.43.
Conclusions 1.44.-1.46. Audit results 1.45.-1.46.
Annexes Annex 1.1 – Audit approach and methodology
10

The ECA's Statement of Assurance provided to the European Parliament and the Council – independent auditor’s report
Opinion
I. We have audited:
(a) the consolidated accounts of the European Union, which comprise the consolidated financial statements1 and the budgetary implementation reports2 for the financial year ended 31 December 2019, approved by the Commission on 26 June 2020;
(b) the legality and regularity of the underlying transactions, as required by Article 287 of the Treaty on the Functioning of the European Union (TFEU).
Reliability of the accounts
Opinion on the reliability of the accounts
II. In our opinion, the consolidated accounts of the European Union (EU) for the year ended 31 December 2019 present fairly, in all material respects, the EU’s financial position as at 31 December 2019, the results of its operations, its cash flows and the changes in its net assets for the year then ended, in accordance with the Financial Regulation and with accounting rules based on internationally accepted accounting standards for the public sector.
1 The consolidated financial statements comprise the balance sheet, the statement of
financial performance, the cash flow statement, the statement of changes in net assets, and a summary of significant accounting policies and other explanatory notes (including segment reporting).
2 The budgetary implementation reports also comprise explanatory notes.
11

Legality and regularity of the transactions underlying the accounts
Revenue
Opinion on the legality and regularity of revenue
III. In our opinion, the revenue underlying the accounts for the year ended 31 December 2019 is legal and regular in all material respects.
Expenditure
Adverse opinion on the legality and regularity of expenditure
IV. In our opinion, owing to the significance of the matter described under ‘Basis for adverse opinion on the legality and regularity of expenditure’, the expenditure accepted in the accounts for the year ended 31 December 2019 is materially affected by error.
Basis for Opinion
V. We have conducted our audit in accordance with the IFAC International Standards on Auditing (ISAs) and Codes of Ethics and the INTOSAI International Standards of Supreme Audit Institutions (ISSAIs). Our responsibilities under these standards and codes are described in more detail in the ‘Auditor’s responsibilities’ section of our report. We have also met independence requirements and fulfilled our ethical obligations under the International Ethics Standards Board for Accountants Code of Ethics for Professional Accountants. We believe that the audit evidence we have obtained is sufficient and appropriate to provide a basis for our opinion.
Basis for adverse opinion on the legality and regularity of expenditure
VI. Our overall estimated level of error for expenditure accepted in the accounts for the year ended 31 December 2019 is 2,7%. A substantial proportion of this expenditure - more than half , is materially affected by error. This concerns mainly reimbursement-based expenditure, in which the estimated level of error is 4,9 %. Due largely to a rise in ‘Cohesion’ spending, such expenditure increased to 66,9 billion euros in 2019, representing 53,1 % of our audit population3. The effects of the errors we found are therefore both material and pervasive to the accepted expenditure of the year.
3 We provide further information in paragraphs 1.21 to 1.26 of our 2019 annual report.
12

Key audit matters
We assessed the liability for pension and other employee benefits
VII. The EU balance sheet includes a liability for pension and other employee benefits amounting to 97,7 billion euros at the end of 2019, representing almost 40 % of the total 2019 liabilities of 251,5 billion euros.
VIII. Most of this liability for pension and other employee benefits (83,8 billion euros) relates to the Pension Scheme of Officials and Other Servants of the European Union (PSEO). The liability recorded in the accounts reflects the amount which would have been included in a pension fund had one been set up to pay existing retirement pension obligations4. In addition to retirement pensions, it covers invalidity pensions and pensions paid to widows and orphans of EU staff. The benefits paid under the pension scheme are charged to the EU budget. Member States jointly guarantee the payment of the benefits, and officials contribute one third of the cost of financing the scheme. Eurostat calculates this liability on behalf of the Commission’s accounting officer, using the parameters assessed by the Commission’s actuarial advisors.
IX. The second largest part of the liability for pension and other employee benefits (11,8 billion euros) is the EU’s estimated liability towards the Joint Sickness Insurance Scheme (JSIS). This liability relates to EU staff members’ healthcare costs payable during post-activity periods (net of their contributions).
X. As part of our audit, we assessed, for the pension liability, the actuarial assumptions made and the resulting valuation. We based this evaluation on work done by external actuarial experts to produce a study on the PSEO. We checked the numerical data, the actuarial parameters and the calculation of the liability, as well as the presentation in the consolidated balance sheet and the notes to the consolidated financial statements.
XI. We conclude that the estimate of the overall liability for pension and other employee benefits stated in the consolidated balance sheet is fair. We will keep that estimate, including the reliability of the underlying data, under review.
We assessed significant year-end estimates presented in the accounts
XII. At the end of 2019, the estimated value of eligible expenses incurred by beneficiaries but not yet reported was 105,7 billion euros (end of 2018: 99,8 billion euros). These amounts were recorded as accrued expenses5.
13

XIII. At the end of 2019, the estimated amount unused by the financial instruments under shared management and aid schemes recognised in the accounts was 6,9 billion euros (end of 2018: 6,5 billion euros), shown in the balance sheet as ‘Other advances to Member States’.
XIV. In order to assess these year-end estimates, we examined the system the Commission had set up for the cut-off calculations and ensured its correctness and completeness in the directorates-general where most payments were made. During our audit work on the sample of invoices and pre-financing payments, we examined the relevant cut-off calculations in order to address the risk of accruals having been misstated. We sought additional clarification from the Commission’s accounting services on the general methodology for establishing these estimates.
XV. We conclude that the estimate of the overall amount of accrued charges and other advances to Member States stated in the consolidated balance sheet is fair.
We assessed the potential impact of post-balance-sheet events on the accounts
XVI. On 1 February 2020, the United Kingdom (UK) ceased to be an EU Member State. Following the conclusion of the agreement on the withdrawal of the United Kingdom of Great Britain and Northern Ireland from the European Union and the European Atomic Energy Community (the ‘Withdrawal Agreement’) between the two parties, the UK committed to honour all financial obligations under the current and previous MFFs arising from its EU membership.
XVII. We have not identified any events relating to the UK’s withdrawal that would require adjustments to the 2019 EU consolidated annual accounts in accordance with the international accounting standard on events after the reporting date6.
4 See International Public Sector Accounting Standard (IPSAS) 39 — Employee benefits. For
the PSEO, the defined benefit obligation reflects the present value of expected future payments that the EU will be required to make in order to settle the pension obligations resulting from employee service in the current and previous periods.
5 These comprise accrued charges of 66,9 billion euros on the liabilities side of the balance sheet and, on the assets side, 38,8 billion euros reducing the value of pre-financing.
6 See IPSAS 14 — Events after the Reporting Date.
14

XVIII. While the COVID-19 outbreak seriously affected Member States’ economies and public finances, it did not require any adjustment to the figures reported in the accounts7 (i.e. it is a ‘non-adjusting event’). However, the initiatives proposed by the Commission in response may, if implemented, affect the financial statements for subsequent reporting periods.
XIX. Based on the current situation, there is no financial impact to report in the 2019 EU consolidated annual accounts, and we conclude that the accounts as at 31 December 2019 correctly reflect the post-balance-sheet events.
Other matters
XX. Management is responsible for providing ‘other information’. This term encompasses the Financial Statement Discussion and Analysis, but not the consolidated accounts or our report on these. Our opinion on the consolidated accounts does not cover this other information, and we do not express any form of assurance conclusion on it. Our responsibility in connection with the audit of the consolidated accounts is to read the other information and consider whether it is materially inconsistent with the consolidated accounts or the knowledge we have obtained in the audit or otherwise appears to be materially misstated. If we conclude that the other information is materially misstated, we are required to report this accordingly. We have nothing to report in this regard.
Responsibilities of management
XXI. In accordance with Articles 310 to 325 of the TFEU and with the Financial Regulation, management is responsible for preparing and presenting the EU’s consolidated accounts on the basis of internationally accepted accounting standards for the public sector, and for the legality and regularity of the underlying transactions. This responsibility includes designing, implementing and maintaining internal control relevant to the preparation and presentation of financial statements that are free from material misstatement, whether due to fraud or error. Management is also responsible for ensuring that the activities, financial transactions and information reflected in the financial statements are in compliance with the authorities (laws, regulations, principles, rules and standards) which govern them. The Commission is ultimately responsible for the legality and regularity of the transactions underlying the EU’s accounts (Article 317 of the TFEU).
XXII. When preparing the consolidated accounts, management is responsible for assessing the EU’s ability to continue as a going concern, disclosing any relevant matters and using the going concern basis of accounting unless it either
15

intends to liquidate the entity or cease operations, or has no realistic alternative but to do so.
XXIII. The Commission is responsible for overseeing the EU’s financial reporting process.
XXIV. Under the Financial Regulation (Title XIII), the Commission’s accounting officer must present for audit the consolidated accounts of the EU first as provisional accounts by 31 March of the following year and as final accounts by 31 July. The provisional accounts should already give a true and fair view of the EU’s financial position. It is therefore imperative that all items of the provisional accounts are presented as final calculations, allowing us to perform our task in line with (Title XIII) of the Financial Regulation and by the given deadlines. Any changes between the provisional and final accounts would normally result from our observations only.
Auditor's responsibilities for the audit of the consolidated accounts and underlying transactions
XXV. Our objectives are to obtain reasonable assurance as to whether the EU’s consolidated accounts are free from material misstatement and the underlying transactions are legal and regular and on the basis of our audit, to provide the European Parliament and the Council with a statement of assurance as to the reliability of the accounts and the legality and regularity of the underlying transactions. Reasonable assurance is a high level of assurance, but it is not a guarantee that the audit has necessarily detected all instances of material misstatement or non-compliance that may exist. These can arise from fraud or error and are considered material if, individually or in the aggregate, they could reasonably be expected to influence any economic decisions taken on the basis of these consolidated accounts.
XXVI. For revenue, our examination of VAT and GNI-based own resources takes as its starting point the macroeconomic aggregates from which these are calculated, and assesses the Commission's systems for processing these up to the point at which the Member States’ contributions have been received and recorded in the consolidated accounts. For traditional own resources, we examine the customs authorities’ accounts and analyse the flow of duties up until the amounts have been received by the Commission and recorded in the accounts.
7 See IPSAS 14 — Events after the Reporting Date.
16

XXVII. For expenditure, we examine payment transactions once expenditure has been incurred, recorded and accepted. This examination covers all categories of payments at the point they are made, except advances. We examine advance payments once the recipient of funds has provided evidence of their proper use and the institution or body has accepted that evidence by clearing the advance payment, which might not happen until a subsequent year.
XXVIII. We exercise professional judgement and maintain professional scepticism throughout the audit. We also:
(a) Identify and assess the risks of material misstatement of the consolidated accounts and of material non-compliance of the underlying transactions with the requirements of EU law, whether due to fraud or error. We design and perform audit procedures responsive to those risks and obtain audit evidence that is sufficient and appropriate to provide a basis for our opinion. Instances of material misstatement or non-compliance resulting from fraud are more difficult to detect than those resulting from error, as fraud may involve collusion, forgery, intentional omissions, misrepresentations, or the override of internal control. Consequently, there is a greater risk of such instances not being detected.
(b) Obtain an understanding of internal control relevant to the audit in order to design appropriate audit procedures, but not for the purpose of expressing an opinion on the effectiveness of the internal control.
(c) Evaluate the appropriateness of the accounting policies used by management and the reasonableness of management’s accounting estimates and related disclosures.
(d) Conclude as to the appropriateness of management’s use of the going concern basis of accounting and, based on the audit evidence obtained, as to whether material uncertainty exists owing to events or conditions that may cast significant doubt on the entity’s ability to continue as a going concern. If we conclude that such material uncertainty exists, we are required to draw attention in our report to the related disclosures in the consolidated accounts or, if these disclosures are inadequate, to modify our opinion. Our conclusions are based on the audit evidence obtained up to the date of our report. However, future events or conditions may cause the entity to cease to continue as a going concern.
(e) Evaluate the overall presentation, structure and content of the consolidated accounts, including all disclosures, and assess whether the consolidated accounts fairly represent the underlying transactions and events.
(f) Obtain sufficient appropriate audit evidence regarding the financial information on the entities covered by the EU’s scope of consolidation to
17

express an opinion on the consolidated accounts and the underlying transactions. We are responsible for directing, supervising and carrying out the audit, and are solely responsible for our audit opinion.
XXIX. We communicate with management regarding, among other matters, the planned scope and timing of the audit and significant audit findings, including findings of any significant deficiencies in internal control.
XXX. Of the matters discussed with the Commission and other audited entities, we determine which were of most significance in the audit of the consolidated accounts and are therefore the key audit matters for the current period. We describe these matters in our report unless law or regulation precludes public disclosure or, as happens extremely rarely, we determine that a matter should not be communicated in our report because the adverse consequences of doing so would reasonably be expected to outweigh any public interest benefits.
24 September 2020
Klaus-Heiner LEHNE President
European Court of Auditors 12, rue Alcide De Gasperi – L-1615 Luxembourg
18
Introduction
The role of the European Court of Auditors
1.1. We are the European Union’s independent auditor. In accordance with the Treaty on the Functioning of the European Union (TFEU)8, we:
(a) give our opinion on the EU’s accounts;
(b) check whether the EU budget is used in accordance with applicable laws and regulations;
(c) report on whether EU spending is economic, efficient and effective9; and
(d) advise on proposed legislation with a financial impact.
1.2. Our work for the statement of assurance (explained in Annex 1.1) fulfils the first and second of these objectives. For the 2019 financial year, we have decided to present the performance aspects of the budget’s implementation (the economy, efficiency and effectiveness of spending) in a separate part of our annual report10. Taken together, our audit work also provides a key input into our opinions on proposed legislation.
1.3. This chapter of the annual report:
(a) sets out the background to our statement of assurance and gives an overview of our findings and conclusions on the reliability of accounts and the regularity of transactions;
(b) includes information on cases of suspected fraud we report to OLAF;
(c) summarises our audit approach (see Annex 1.1).
8 Articles 285 to 287 of the Treaty on the Functioning of the European Union (TFEU) (OJ
C 326, 26.10.2012, p. 47).
9 See glossary: Sound financial management.
10 See our Report on the performance of the EU budget – Status at the end of 2019.
19

1.4. The lockdown in response to the COVID-19 crisis happened before we had completed our audit work for this annual report and statement of assurance. It affected our ability to obtain the audit evidence required for some parts of our work. Where travel restrictions prevented us from conducting on-the-spot checks, we performed alternative audit procedures, such as desk reviews. This allowed us to obtain sufficient appropriate evidence to complete our audit work and prepare the statement of assurance and specific assessments for the 2019 annual report without any scope limitations.
EU spending is a significant tool for achieving policy objectives
1.5. EU spending is an important tool for achieving policy objectives, but not the only one. Other important tools include the use of legislation and the freedom for goods, services, capital and people to move throughout the EU. In 2019, EU spending amounted to 159,1 billion euros11, representing 2,1 % of EU Member States’ total general government spending and 1,0 % of their combined gross national income (see Box 1.1).
11 See 2019 consolidated annual accounts of the EU, budgetary implementation reports and
explanatory notes, 4.3 MFF: Implementation of payment appropriations.
20

Box 1.1
2019 EU spending as a share of gross national income (GNI) and general government expenditure
Source: Member States’ GNI: 2019 annual accounts of the European Commission – Annex A – Revenue; Member States general government expenditure: Eurostat — annual national accounts; EU spending: European Commission – 2019 consolidated annual accounts of the European Union.
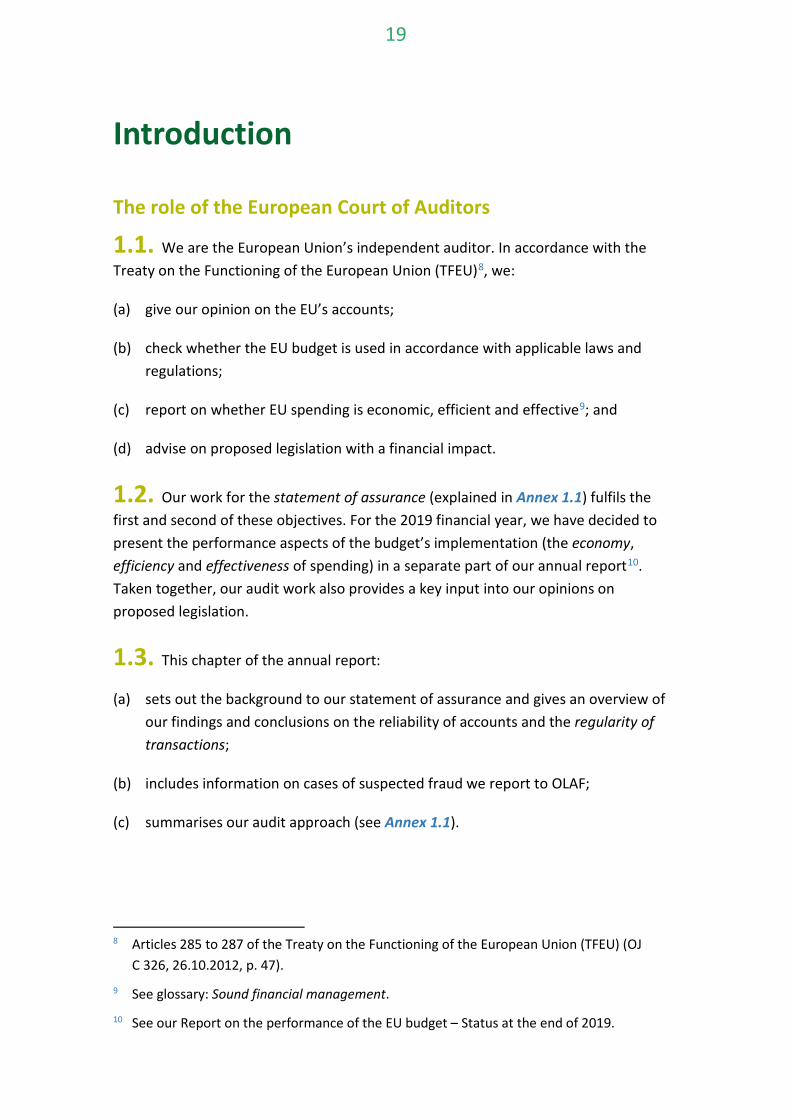
1.6. EU funds are disbursed to beneficiaries either through single payments/annual instalments or through a series of payments within multiannual spending schemes. Payments from the 2019 EU budget comprised 126,2 billion euros in single, interim or final payments, plus 32,9 billion euros in pre-financing. As Box 1.2 shows, the largest share of the EU budget went to ‘Natural resources’, followed by ‘Cohesion’ and ‘Competitiveness’.
100 %EU 28 gross national income 16 446 billion euros
46 %EU 28 general government expenditure 7 544 billion euros
1 %EU spending 159,1 billion euros
21
Box 1.2
2019 payments per Multiannual Financial Framework (MFF) heading
Source: ECA.
Competitiveness 21,7 (13,7 %)
Cohesion 53,8 (33,8 %)
Natural resources 59,5 (37,4 %)Security and citizenship
3,3 (2,0 %)
Global Europe 10,1 (6,4 %)
Administration 10,4 (6,5 %)
Special instruments 0,3 (0,2 %)
(billion euros)
159,1billion euros
Payments
MFF 1a Competitiveness for growth and jobs (‘Competitiveness’)MFF 1b Economic, social and territorial cohesion (‘Cohesion’) MFF 2 Natural resourcesMFF 3 Security and citizenship MFF 4 Global Europe MFF 5 Administration MFF 9 Special instruments
22

Audit findings for the 2019 financial year
Reliability of the accounts
The accounts were not affected by material misstatements
1.7. Our observations concern the European Union’s consolidated accounts12 (the ‘accounts’) for the 2019 financial year. We received them, together with the accounting officer’s letter of representation, on 26 June 2020, before the final date for presentation allowed under the Financial Regulation13. The accounts are accompanied by a ‘Financial Statement Discussion and Analysis’14. This analysis is not covered by our audit opinion. In accordance with auditing standards, however, we have assessed its consistency with the information in the accounts.
1.8. The accounts published by the Commission show that, at 31 December 2019, total liabilities amounted to 251,5 billion euros, compared with 178,9 billion euros of total assets15. The economic result for 2019 was 4,8 billion euros.
12 The consolidated accounts comprise:
(a) the consolidated financial statements covering the balance sheet (presenting the assets and liabilities at the end of the year), the statement of financial performance (recognising the income and expenses of the year), the cash-flow statement (disclosing how changes in the accounts affect cash and cash equivalents) and the statement of changes in net assets, as well as the notes to the financial statements;
(b) the budget implementation reports covering the revenue and expenditure for the year, as well as the related notes.
13 Regulation (EU, Euratom) No 2018/1046 of the European Parliament and of the Council of 18 July 2018 on the financial rules applicable to the general budget of the Union and repealing Council Regulation (EC, Euratom) No 966/2012 (OJ L 193, 30.07.2018, p. 1).
14 See Recommended Practice Guideline 2 (RPG 2) ‘Financial Statement Discussion and Analysis’ of International Public Sector Accounting Standards Board (IPSASB).
15 The difference of 72,5 billion euros represented the (negative) net assets comprising reserves and that part of the expenses already incurred by the EU up to 31 December that must be funded by future budgets.
23

1.9. Our audit found that the accounts were not affected by material misstatements. Additionally, we present our observations on the financial and budgetary management of EU funds in Chapter 2.
Key audit matters relating to the 2019 financial statements
1.10. Key audit matters are those matters that, in our professional judgement, were of most significance in our audit of the financial statements of the current period. These matters were addressed in the context of our audit of the financial statements as a whole and in forming our opinion thereon, but we do not provide a separate opinion on these matters. In accordance with International Standard of Supreme Audit Institutions (ISSAI) 270116, we report on key audit matters in our statement of assurance.
Regularity of transactions
1.11. We examine EU revenue and expenditure to assess whether it is in compliance with the applicable laws and regulations. We present our audit results for revenue in chapter 3 and for expenditure in chapters 4 to 9.
Our audit covers revenue and expenditure transactions underlying the accounts
1.12. For revenue, we obtained assurance for our audit opinion by assessing the selected key systems, complemented by transaction testing. The sample of transactions examined was designed to be representative of all sources of revenue, which comprises three categories of own resources and revenue from other sources. (see paragraphs 3.2-3.3).
1.13. For expenditure, we designed and tested a representative sample of transactions to contribute to our statement of assurance and estimate the proportion of irregular transactions in the overall audit population, in high-risk and low-risk expenditure and in each MFF heading where we provide a specific assessment (chapters 4, 5, 6 and 9).
16 ISSAI 2701 Communicating Key Audit Matters in the Independent Auditor’s Report.
24
1.14. For expenditure, the underlying transactions comprise transfers of funds from the EU budget to final recipients of EU spending. We examine expenditure at the point when final recipients of EU funds have undertaken activities or incurred costs, and when the Commission has accepted the expenditure (‘accepted expenditure’). In practice, this means that our population of transactions covers interim and final payments. We did not examine pre-financing payments unless they had been cleared in 2019.
1.15. Changes to the 2014-2020 legislation for ‘Cohesion’ have had an impact on what the Commission considers ‘accepted expenditure’ in this area. Since 2017 our audit population for this MFF heading has consisted, for the 2014-2020 period, of expenditure included in the accounts accepted annually by the Commission (see paragraph (15) of Annex 1.1 and paragraphs 5.8-5.9) and, for the 2007-2013 period, of final payments (including pre-financing already cleared). This means we tested transactions for which Member States should have implemented all relevant actions to correct errors that they themselves had identified.
1.16. Our audit population for 2019 totalled 126,1 billion euros. Box 1.3 shows this sum broken down into single, interim (where accepted by the Commission) and final payments; clearings of pre-financing; and annual decisions to accept the accounts.
25

Box 1.3
Comparison of our audit population (126,1 billion euros) and EU spending (159,1 billion euros) by MFF heading in 2019
(*) For ’Cohesion’, the 52,0 billion euros pre-financing amount includes interim payments for the 2014-2020 programming periods totalling 41,6 billion euros. In line with our approach for this area, these payments are not part of our audit population for the 2019 annual report.
Source: ECA.
1.17. Box 1.4 shows that ‘Natural resources’ makes up the largest share of our overall population (47,2 %), followed by ‘Cohesion’ (22,5 %) and ‘Competitiveness’ (13,2 %).
0,3 payments
10,4 audit population10,4 payments
8,2 audit population10,1 payments
3,0 audit population3,3 payments
59,4 audit population
59,5 payments
28,4 audit population53,8 payments ⁽*⁾
16,7 audit population21,7 payments
0 10 20 30 40 50 60
(billion euros)
Single, interim, and final payments Pre-financing payments (including advances to FEIs, to EFSI, to agencies, to Guarantee for External Actions)
Clearing of pre-financing (including trust fund disbursements for MFF 4 and 2017 and 2018 payments for OPs closed in 2019 for MFF 1b)
Annual decision to accept the accounts (2014-2020 programming period)
Competitiveness
Cohesion
Natural resources
Security and citizenship
Global Europe
Administration
Special instruments
26

Box 1.4
Overview of our 2019 audit population of 126,1 billion euros by MFF heading
Source: ECA.
Error continues to be present in specific types of spending
1.18. For the regularity of EU revenue and expenditure, our key findings were:
(a) The overall audit evidence indicates that revenue was free from material error. The revenue-related systems we examined were, overall, effective. The key internal traditional own resources (TOR) controls that we assessed at the Commission (see paragraphs 3.10 and 3.18) and in certain Member States (see paragraphs 3.8 and 3.9) were partially effective (see paragraph 3.24). We also found important weaknesses in Member States’ controls to reduce the ‘customs gap’ (i.e. the evaded amounts not captured in Member States’ TOR accounting systems) that require EU action.
Competitiveness 16,7 (13,2 %) Cohesion
28,4 (22,5 %)
Natural resources
59,4 (47,2 %)
Security and citizenship 3,0 (2,4 %)
Global Europe 8,2 (6,5 %)
Administration 10,4 (8,2 %)
(billion euros)
126,1billion euros
Audit population
27

(b) For expenditure, our audit evidence indicates that the overall level of error was material at 2,7 %17 (see Box 1.5). ‘Cohesion’ was the biggest contributor to this rate with (36,3 %), followed by ‘Natural resources’ (32,2 %), ‘Competitiveness’ (19,1 %) and ‘Global Europe’ (10,3 %). Material error continues to be present in high-risk expenditure, which is often subject to -complex rules and mainly reimbursement-based (see paragraphs 1.21-1.22 ). Such expenditure represented 53,1 % of our audit population (see Box 1.5).
Box 1.5
Estimated level of error (2017 to 2019)
Source: ECA.
An error is an amount of money that should not have been paid out from the EU budget. Errors occur when money is not used in accordance with the relevant EU legislation and hence not as the Council and European Parliament intended when adopting that legislation, or when it is not used in accordance with specific national rules.
17 We have 95 % confidence that the estimated level of error in the population lies between
1,8 % and 3,6 % (the lower and upper level error limits respectively).
0 %
2 %
4 %
6 %
8 %
10 %
2017 2018 2019
Materiality 2,0 %
2,7 %2,4 % 2,6 %
95 % confidence
interval
Upper error limit
Estimated level of error
Lower error limit
3,4 %
1,4 %
3,4 %
1,8 %
3,6 %
1,8 %
28

The complexity of rules and the way EU funds are disbursed have an impact on the risk of error
1.19. Following our risk analysis, which is based on past audit results and assessment of management and control systems, we divided our audit population of underlying transactions into high-risk and low-risk expenditure and we estimated the level of error in both. Our 2019 audit results and findings from previous years reaffirm our assessment and risk classification, reflecting that the way funds are disbursed has an impact on the risk of error.
— The risk of error is lower for expenditure subject to simplified/less complex rules. This type of expenditure encompasses mainly those entitlement-based payments18, for which beneficiaries must meet certain, but not overly complex conditions.
— The risk of error is high for expenditure subject to complex rules. This is mainly the case for reimbursement-based payments, where beneficiaries have to submit claims for eligible costs they have incurred. To this end, as well as demonstrating that they are engaged in an activity eligible for support, they must provide evidence of the reimbursable costs they have incurred. In doing so, they must often follow complex rules regarding what can be claimed (eligibility) and how costs can be properly incurred (public procurement or state aid rules).
1.20. In 2019, we continued to find that low-risk expenditure was free from material error, but that high-risk expenditure was still affected by material error (see Box 1.6). However, the proportion of the expenditure affected by material error has increased compared to the previous three years.
18 Entitlement-based expenditure includes administrative expenditure.
29

Box 1.6
Breakdown of 2019 audit population into low-risk and high-risk expenditure
Source: ECA.
More than half of our audit population is affected by material error
1.21. High-risk expenditure represents 53,1 % of our audit population and has increased compared to last year, when it represented around 50 % of our audit population. The higher proportion of high-risk expenditure this year is largely due to a 4,8 billion euros increase in our ‘Cohesion’ audit population. Box 1.7 shows that ‘Cohesion’ makes up the largest share of our high-risk population (28,4 billion euros), followed by ‘Natural resources’ (18,1 billion euros) and ‘Competitiveness’ (10,7 billion euros).
1.22. We estimate the level of error in this type of expenditure at 4,9 % (2018: 4,5 %), which exceeds the materiality threshold of 2,0 % (see Box 1.6). This figure results from our testing of high-risk expenditure under all relevant MFF headings.
59,2 (46,9 %)
66,9 (53,1 %)
0 20 40 60(billion euros)
Low-risk expenditure
High-risk expenditure
Free from material error
Estimated level of error: 4,9 %
Materiality level 2,0 %
Materiality level 2,0 %
30

Box 1.7
Breakdown of high-risk expenditure by MFF heading
Source: ECA.
1.23. ‘Cohesion’ (chapter 5): expenditure in this area is mainly implemented through the European Regional Development Fund, the Cohesion Fund and the European Social Fund. It is predominated by reimbursements, which we consider to be high-risk. The main types of error that we found and quantified were ineligible projects and infringements of internal market rules (in particular non-compliance with public procurement rules).
1.24. ‘Natural resources’ (chapter 6): for spending areas we had identified as higher-risk (rural development, market measures, fisheries, the environment and climate action), representing around 30 % of payments under this heading, we once again found a material level of error. Expenditure in these areas mainly takes the form of reimbursement and is subject to often-complex eligibility conditions. Ineligible beneficiaries, activities or declared costs are the most common errors found in this area.
1.25. ‘Competitiveness’ (chapter 4): as in previous years, research expenditure remains high-risk and is the main source of error. Errors in research spending include different categories of ineligible costs (in particular direct personnel costs and other direct costs, indirect costs and subcontracting costs).
Competitiveness: 10,7 Cohesion: 28,4 Natural resources: 18,1
Security and citizenship: 2,3
Global Europe: 7,4
Total: 66,9 (53,1 %)
0 10 20 30 40 50 60 70
High risk
(billion euros)
31

1.26. ‘Global Europe’ (chapter 8): expenditure takes the form of aid using a wide range of delivery methods such as works, supply and service contracts, grants, contribution and delegation agreements and budget support. It is mostly reimbursement-based and covers external actions funded by the EU general budget. All types of expenditure under this heading are considered high-risk, except for budget support payments, which represent around 10 % of this spending. Most errors found in this area concern public procurement, grant award procedures, absence of supporting documents and ineligible costs.
Eligibility errors are still the biggest contributor to the estimated level of error for high-risk expenditure
1.27. As in recent years, we focused more closely on error types found in high-risk expenditure, as this is where material error persists. Box 1.8 shows the contribution, of each error type to the 2019 estimated level of error for high-risk expenditure, alongside the estimates for 2018 and 2017.
32
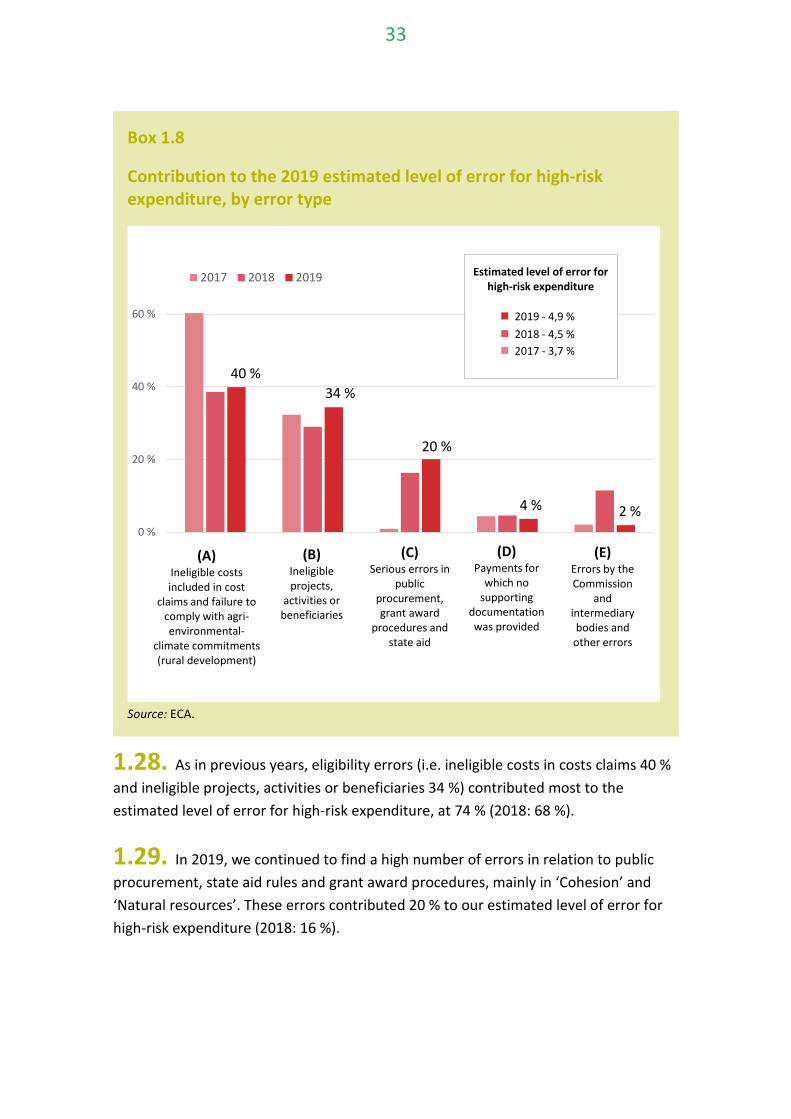
Box 1.8
Contribution to the 2019 estimated level of error for high-risk expenditure, by error type
Source: ECA.
1.28. As in previous years, eligibility errors (i.e. ineligible costs in costs claims 40 % and ineligible projects, activities or beneficiaries 34 %) contributed most to the estimated level of error for high-risk expenditure, at 74 % (2018: 68 %).
1.29. In 2019, we continued to find a high number of errors in relation to public procurement, state aid rules and grant award procedures, mainly in ‘Cohesion’ and ‘Natural resources’. These errors contributed 20 % to our estimated level of error for high-risk expenditure (2018: 16 %).
40 %34 %
20 %
4 % 2 %0 %
20 %
40 %
60 %
2017 2018 2019
(A)Ineligible costs included in cost
claims and failure to comply with agri-environmental-
climate commitments (rural development)
(B)Ineligible projects,
activities or beneficiaries
(C)Serious errors in
public procurement, grant award
procedures and state aid
(D)Payments for
which no supporting
documentation was provided
(E)Errors by the Commission
and intermediary bodies and
other errors
Estimated level of error for high-risk expenditure
2019 - 4,9 % 2018 - 4,5 % 2017 - 3,7 %
33

We did not find a material level of error in low-risk expenditure
1.30. For low-risk expenditure, which represented 46,9 % of our audit population, we conclude, based on our audit work, that the estimated level of error is below our materiality threshold of 2,0 %, as was the case in 2018. Low-risk expenditure mainly comprises entitlement-based payments and administrative expenditure (see Box 1.9 ). Entitlement-based payments include student and research fellowships (‘Competitiveness’ – chapter 4), direct aid for farmers (‘Natural resources’ – chapter 6) and budget support for non-EU countries (‘Global Europe’ – chapter 8). Administrative expenditure mainly comprises the salaries and pensions of EU civil servants (Administration – chapter 9).
Box 1.9
Breakdown of low-risk expenditure by MFF heading
Source: ECA.
Competitiveness: 6,0 Natural resources: 41,3
Security and citizenship: 0,7
Global Europe: 0,8
Administration: 10,4
Total: 59,2 (46,9 %)
0 10 20 30 40 50 60 70
Low risk
(billion euros)
34

The Commission’s regularity information
1.31. Under Article 317 of the TFEU, the Commission is ultimately responsible for implementing the EU budget and manages EU spending together with Member States19. The Commission accounts for its actions in three reports, which are included in the ‘Integrated Financial Reporting Package’20:
(a) Consolidated accounts of the European Union;
(b) Annual Management and Performance Report for the EU budget (AMPR);
(c) Report on the follow-up to the discharge of the previous financial year.
1.32. Under our 2018-2020 strategy, we set out to assess options for using the legality and regularity information provided by auditees.This means that in future, we intend to provide assurance on the Commission’s (management) statements where possible. This builds on our experience of applying a similar approach since 1994 when auditing the reliability of the accounts. For auditing the regularity of transactions underlying the accounts, we have continued working with the Commission to establish the conditions necessary to progress towards this approach. However, we have encountered difficulties, such as in relation to the availability of timely and reliable information, which are currently hindering our progress. We have reported on these constraints in greater detail in chapter 4 (‘Competiveness’), chapter 5 (‘Cohesion’) and chapter 8 (‘Global Europe’).
19 Article 317 of the TFEU:
‘The Commission shall implement the budget in cooperation with the Member States, in accordance with the provisions of the regulations made pursuant to Article 322, on its own responsibility and within the limits of the appropriations, having regard to the principles of sound financial management. Member States shall cooperate with the Commission to ensure that the appropriations are used in accordance with the principles of sound financial management.’
20 https://ec.europa.eu/info/publications/annual-management-and-performance-report-2019_en
35
The Commission’s estimate of error is at the lower end of our range
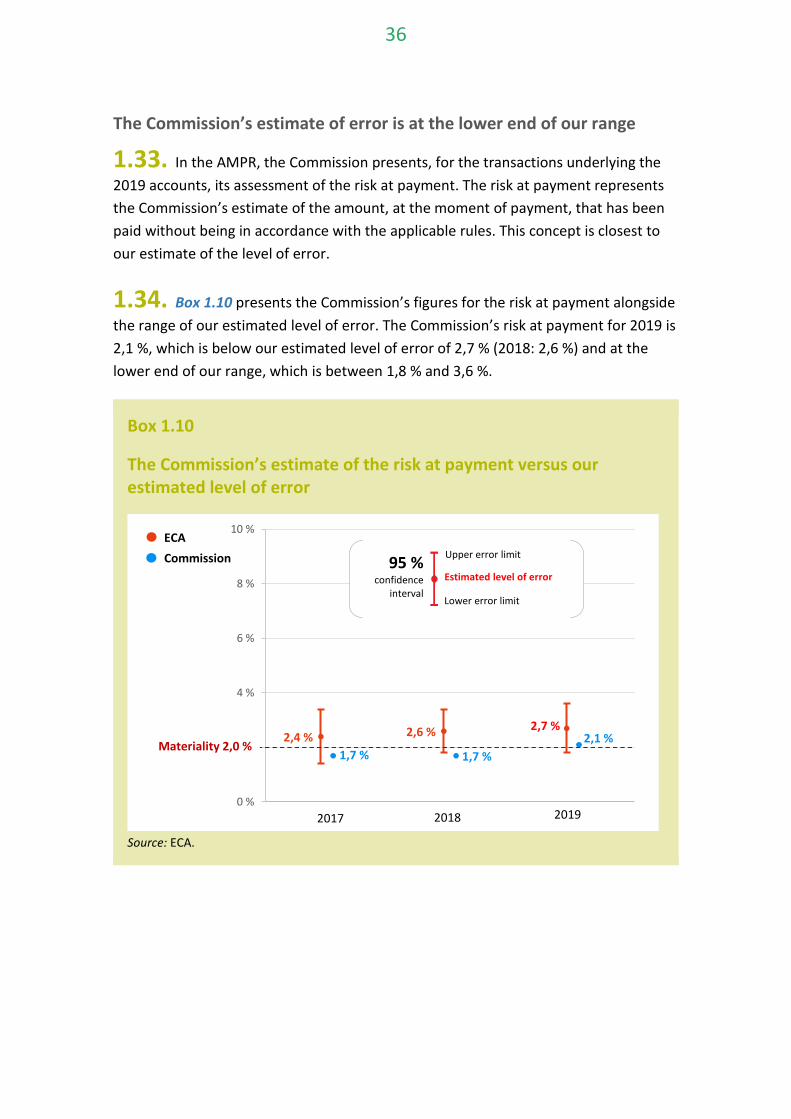
1.33. In the AMPR, the Commission presents, for the transactions underlying the 2019 accounts, its assessment of the risk at payment. The risk at payment represents the Commission’s estimate of the amount, at the moment of payment, that has been paid without being in accordance with the applicable rules. This concept is closest to our estimate of the level of error.
1.34. Box 1.10 presents the Commission’s figures for the risk at payment alongside the range of our estimated level of error. The Commission’s risk at payment for 2019 is 2,1 %, which is below our estimated level of error of 2,7 % (2018: 2,6 %) and at the lower end of our range, which is between 1,8 % and 3,6 %.
Box 1.10
The Commission’s estimate of the risk at payment versus our estimated level of error
Source: ECA.
0 %
2 %
4 %
6 %
8 %
10 %
2,7 %2,1 %
1,7 %1,7 %
CommissionECA
2,4 % 2,6 %
95 % confidence
interval
Upper error limit
Estimated level of error
Lower error limit
2017 2018 2019
Materiality 2,0 %
36

There are some issues with the components of the Commission’s estimates
1.35. The Commission uses the declarations of assurance made by its directors-general in their annual activity reports (AARs) as the basis for its overall assessment of the risk at payment for the different policy areas. However, the Commission’s particular role, as reflected in its methodology, and weaknesses in ex-post checks, which are a critical part of the control system, affect the Commission’s estimates. These are the two main reasons why these rates may differ from our estimated levels of error. Box 1.11 illustrates the Commission’s basis for establishing the risk at payment for the main spending areas, with corresponding issues21.
Box 1.11
The Commission’s estimation of the risk at payment: basis and issues
Policy area Basis for the risk at payment Issues
Competitiveness The Commission’s Common Audit Service (CAS) draws a representative sample of cost statements every 18 months on average. For 2019, the sample covered expenditure from January 2014 to February 2018. Around 20 % of ex-post audits are carried out by the CAS, and 80 % on its behalf by private audit firms.
Ex-post audits do not mainly cover payments or clearings made in the Statement of Assurance year under review and were not always found to be reliable(*).
Natural Resources(**)
Member States’ paying agencies control statistics with adjustments to assess the risk at payment.
The Member State control reflected in the control statistics do not capture all errors and adjustments by the Commission are necessary(***). Commission adjustments are generally based on flat rates.
21 We have reported on these weaknesses in greater detail in chapter 4 (‘Competiveness’),
chapter 5 (‘Cohesion’), chapter 7 (‘Natural Resources’) and chapter 8 (‘Global Europe’).
37
There are some limitations in the reliability of the results of the certification bodies’ work.
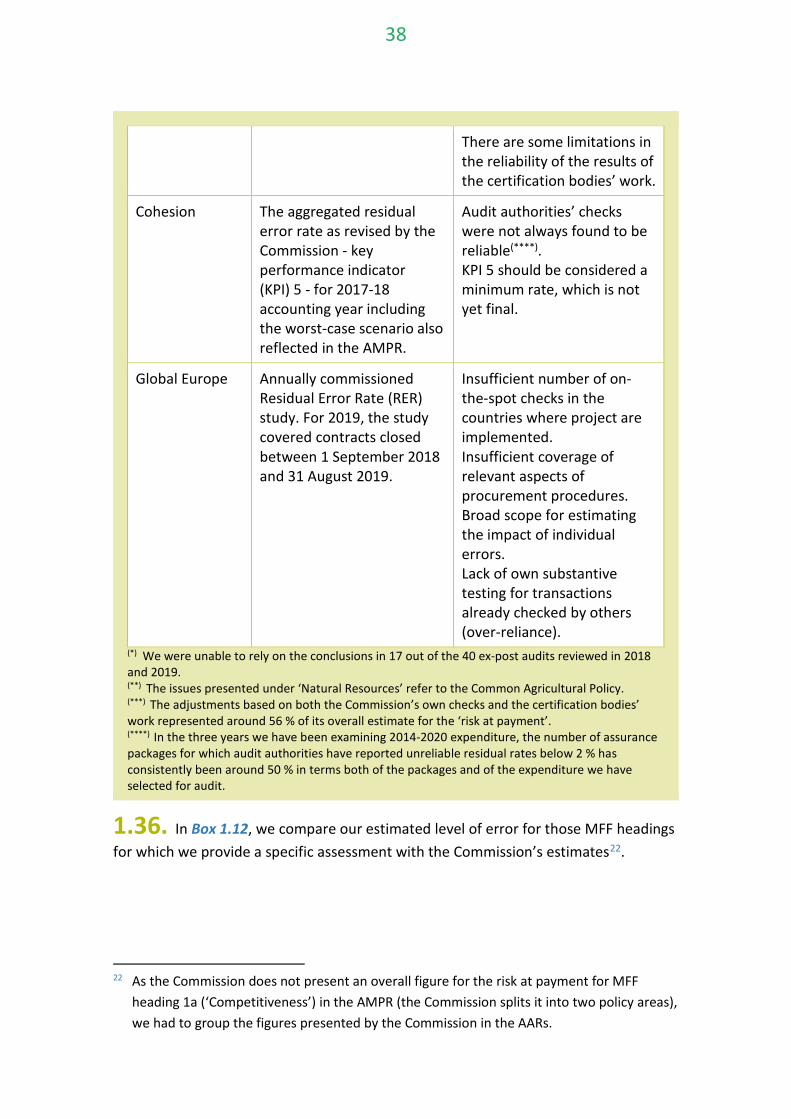
Cohesion The aggregated residual error rate as revised by the Commission - key performance indicator (KPI) 5 - for 2017-18 accounting year including the worst-case scenario also reflected in the AMPR.
Audit authorities’ checks were not always found to be reliable(****). KPI 5 should be considered a minimum rate, which is not yet final.
Global Europe Annually commissioned Residual Error Rate (RER) study. For 2019, the study covered contracts closed between 1 September 2018 and 31 August 2019.
Insufficient number of on-the-spot checks in the countries where project are implemented. Insufficient coverage of relevant aspects of procurement procedures. Broad scope for estimating the impact of individual errors. Lack of own substantive testing for transactions already checked by others (over-reliance).
(*) We were unable to rely on the conclusions in 17 out of the 40 ex-post audits reviewed in 2018 and 2019. (**) The issues presented under ‘Natural Resources’ refer to the Common Agricultural Policy. (***) The adjustments based on both the Commission’s own checks and the certification bodies’ work represented around 56 % of its overall estimate for the ‘risk at payment’. (****) In the three years we have been examining 2014-2020 expenditure, the number of assurance packages for which audit authorities have reported unreliable residual rates below 2 % has consistently been around 50 % in terms both of the packages and of the expenditure we have selected for audit.
1.36. In Box 1.12, we compare our estimated level of error for those MFF headings for which we provide a specific assessment with the Commission’s estimates22.
22 As the Commission does not present an overall figure for the risk at payment for MFF
heading 1a (‘Competitiveness’) in the AMPR (the Commission splits it into two policy areas), we had to group the figures presented by the Commission in the AARs.
38

Box 1.12
Our estimate of 2019 level of error versus the Commission’s estimate of the risk at payment for MFF headings(*)(**)
(*) Based also on other evidence produced by the control system, we find the level of error for ‘Natural resources’ to be close to the materiality threshold. (**) For ‘Administration’, neither we nor the Commission found a material level of error. (***) Commission DGs and services: ECFIN, GROW, MOVE, ENER, RTD, CNECT, JRC, FISMA, TAXUD, EAC, EASME, EACEA, INEA, ERCEA, REA . Some DGs were allocated to more than one MFF heading (EACEA, ECHO and INEA). (****) EMPL, REGIO, REFORM (ex-SRSS), INEA. (*****) DGs AGRI, CLIMA, ENV and MARE.
Source: ECA.
4,0 %4,4 %
1,9 %1,7 %
3,1 %
1,9 %
0 %
2 %
4 %
6 %
8 %
Materiality 2 %
95 % confidence
interval
Upper error limit
Estimated level of error
Lower error limit
Estimated level of error (%) - ECAEstimated risk at payment (%) - COM
Competitiveness(***)
Cohesion(****)
Natural resources(*****)
39

1.37. The comparison shows that the Commission figures are below our estimates for two policy areas, which reflects the weaknesses outlined in Box 1.11 . We found that:
— for ‘Competitiveness’, the estimate of the risk at payment for this MFF heading of 1,7 %, which we calculated based on the information in the AMPR, is below materiality and at the lower end of our range for the estimated level of error (see paragraphs 4.35 and 4.38).
— for ‘Cohesion’, the Commission’s estimate for this MFF heading23 is 3,1 %, which confirms that the level of error in this policy area is material. The Commission’s estimate is below our estimated level of error, but within the lower half of our error range (see paragraphs 5.59 and 5.66).
1.38. For ‘Natural resources’, the Commission’s estimate of the risk at payment (1,9 %), is consistent with our estimate (see paragraphs 6.32 and 6.42).
23 See Table B in Annex 3 to the 2019 Annual Management and Performance Report for the
EU Budget, p. 236.
40
We report suspected fraud to OLAF 1.39. We consider fraud to be any intentional act or omission relating to the use or presentation of false, incorrect or incomplete statements or documents, the non-disclosure of required information and the improper use of EU funds24. Fraud has the effect of harming or potentially harming the EU budget. According to audit standards, the primary responsibility for preventing and detecting fraud rests with both management and those charged with the governance of an entity. We take account of the risk of fraud before launching audit procedures (see paragraphs (28)-(30) in Annex 1.1).
1.40. We cooperate closely with the European Anti-Fraud Office (OLAF) in fighting fraud against the EU budget. We forward to OLAF any suspicion of fraud, corruption or other illegal activity affecting the EU’s financial interests that we identify in the course of our audit work (including our work on performance) or on the basis of information provided to us directly by third parties. OLAF then follows up on these cases, decides whether to launch an investigation and cooperates as necessary with Member State authorities.
1.41. In 2019:
(a) we assessed the regularity of 747 transactions for our audit work on the annual report and produced 36 special reports;
(b) we reported to OLAF 9 instances of suspected fraud found during our audits (in 2018: also 9), from which OLAF has opened 5 investigations. In 4 cases, OLAF decided not to open an investigation.
24 Article 1(a) of the Annex to the Council Act of 26 July 1995 drawing up the Convention on
the protection of the European Communities’ financial interests (the ‘PIF Convention’).
41

1.42. The suspected fraud cases arising from our work in 2019 that we referred to OLAF most frequently concerned suspicions of artificial creation of the necessary conditions for EU financing, declaration of costs not meeting the eligibility criteria, or procurement irregularities. Some of the suspected fraud cases we reported to OLAF involved several irregularities.
1.43. Based on information arising from our audit work between 2011 and 2019, OLAF recommended the recovery of a total of 317,7 million euros relating to 29 cases25.
25 The information is provided by OLAF and is not examined by us.
42

Conclusions 1.44. The key function of this chapter is to support the audit opinion presented in the statement of assurance.
Audit results
1.45. We conclude that the accounts were not affected by material misstatements.
1.46. As for the regularity of transactions, we conclude that revenue was free from material error. For expenditure, our audit results show that the estimated level of error increased compared to last year and is at 2,7 % (2018: 2,6 %). High-risk (mainly reimbursement-based) expenditure, which is often subject to complex rules, was affected by a material level of error. This year, the proportion of this expenditure-type increased to 53,1 %, representing a substantial part of our audit population. Unlike the previous three years, the error is therefore pervasive, which is the basis for an ‘adverse opinion’.
43

Annexes
Annex 1.1 – Audit approach and methodology (1) This annex outlines our audit approach and methodology, which conform to the
international standards on auditing and ensure that our audit opinions are supported by sufficient and appropriate audit evidence. This annex also refers to the main differences between our audit approach and the way the Commission estimates and reports on the level of irregularities26, while exercising its duties as manager of the EU budget. To this end, we clarify how we:
— extrapolate the errors found (paragraph (6));
— structure our chapters around MFF headings (paragraph (8));
— apply EU and national rules (paragraph (9)) and
— quantify procurement errors (paragraph (19)).
(2) Our audit approach is set out in the Financial and Compliance Audit Manual, which is available on our website27. We use an assurance model to plan our work. In our planning, we consider the risk of errors occurring (inherent risk) and the risk of errors not being prevented or detected and corrected (control risk).
PART 1 – Audit approach and methodology for the reliability of accounts
(3) We examine the EU’s consolidated accounts to determine their reliability. These consist of:
(a) the consolidated financial statements; and
(b) the budgetary implementation reports.
(4) The consolidated accounts should properly present, in all material respects:
(a) the financial position of the European Union at year end;
(b) the results of its operations and cash flows; and
26 See pp. 51-53 of the Commission’s 2019 AMPR.
27 https://www.eca.europa.eu/en/Pages/AuditMethodology.aspx
44

(c) the changes in net assets for the year ended.
(5) In our audit, we:
(a) evaluate the accounting control environment
(b) check the functioning of key accounting procedures and the year-end closure process;
(c) analyse the main accounting data for consistency and reasonableness;
(d) analyse and reconcile accounts and/or balances;
(e) perform substantive tests of commitments, payments and specific balance sheet items, based on representative samples;
(f) use the work of other auditors where possible, in accordance with international standards on auditing, particularly when auditing borrowing and lending activities managed by the Commission for which external audit certificates are available.
PART 2 – Audit approach and methodology for the regularity of transactions
(6) Our current approach for assessing whether the transactions underlying the accounts comply with EU rules and regulations is to rely mainly on direct testing of compliance for a large, random, representative sample of transactions. According to accepted statistical practices, extrapolation of the results of a statistical sample provides the best estimate for the error rate. We divide our sample into high-risk and low-risk expenditure and different strata for the MFF headings on which we report. This procedure allows us to extrapolate the errors we detect to the areas concerned.
(7) However, we consider whether we can make efficient use of the checks on regularity already performed by others. If we want to use the results of these checks in our audit work, in line with audit standards, we assess the independence and competence of the other party and the scope and adequacy of its work.
How we test transactions
(8) We organise our audit work and report its results around the various MFF headings in line with the budget structure decided by the legislator. Under each MFF heading, where we provide a specific assessment (chapters 4, 5, 6 and 9), we test a representative sample of transactions in order to estimate the share of irregular transactions in the overall population.
45

(9) For each selected transaction, we determine whether or not the claim or payment was made for the purpose approved in the budget and specified in legislation. Our assessment takes due account of the interpretation of EU and national law provided by national judicial courts or national independent and authoritative bodies and the European Court of Justice. We examine how the amount of the claim or payment was calculated (for larger claims: based on a selection representative of all items in the transaction). This involves tracing the transaction from the budgetary accounts to the final recipient (e.g. a farmer, or the organiser of a training course or development aid project), testing compliance at each level.
(10) When testing revenue transactions, our examination of value added tax and GNI-based own resources takes as a starting point the macroeconomic aggregates based on which these are calculated. We examine the Commission’s controls on these Member State contributions up to the point they were received and recorded in the consolidated accounts. For traditional own resources, we examine the customs authorities’ accounts and the flow of duties — again up to the point they were received and recorded by the Commission.
(11) On the expenditure side, we examine payments once expenditure has been incurred, recorded and accepted. This applies to all categories of payments (including those made to purchase assets). We do not examine advances at the point they were made, but rather once:
(a) the final recipient of EU funds (e.g. a farmer, a research institute, a company providing publicly procured works or services) has provided evidence of their use; and
(b) the Commission (or other institution or body managing EU funds) has accepted the final use of the funds by clearing the advance.
(12) Our audit sample is designed to provide an estimate of the level of error for the expenditure as a whole rather than for individual transactions (e.g. a particular project). We use monetary unit sampling to select claims or payments and, at a lower level, individual items within a transaction (e.g. project invoices, parcels in a claim by a farmer). The error rates reported for these items should not be seen as a conclusion on their respective transactions, but rather contribute directly to the overall level of error for EU expenditure as a whole.
46

(13) We do not examine transactions in every Member State, beneficiary state and region in any given year. While we may name certain Member States, beneficiary states and/or regions, this does not mean that the examples do not occur elsewhere. The illustrative examples presented in this report do not form a basis for conclusions to be drawn on the specific Member States, beneficiary states and/or regions concerned.
(14) Our approach is not designed to gather data on the frequency of error in the whole population. Therefore, figures presented on the number of errors detected in an MFF heading, in expenditure managed by a DG or in spending in a particular Member State are not an indication of the frequency of error in EU-funded transactions or in individual Member States.
(15) Since 2017, we have amended our audit approach for ‘Economic, social and territorial cohesion’ to take account of changes in the design of the control systems for the 2014-2020 programming period. Our objective is, in addition to contributing to the 2019 statement of assurance, to review the work of audit authorities and conclude on the reliability of the Commission’s key regularity indicator for this area – the residual error rate.
(16) For EAGF direct payments in ‘Natural resources’, we are making progress in enhancing our use of new technologies; for rural development, we started reviewing/re-performing the work of certification bodies in 2019.
How we evaluate and present the results of transaction testing
(17) An error may concern all or part of the amount involved in an individual transaction. We consider whether errors are quantifiable or non-quantifiable, i.e. whether or not it is possible to measure how much of the amount examined was affected by the error. Errors detected and corrected prior to and independently of our checks are excluded from the calculation and frequency of error, since their detection and correction demonstrate that the control systems have worked effectively.
(18) Our criteria for the quantification of public procurement errors are described in the document ‘Non-compliance with the rules on public procurement – types of irregularities and basis for quantification’28.
28 Quantification of public procurement errors (pdf)
https://www.eca.europa.eu/en/Pages/AuditMethodology.aspx.
47

(19) Our quantification may differ from that used by the Commission or Member States when deciding how to respond to the misapplication of the public procurement rules. We quantify only serious breaches of procurement rules. We quantify as 100 % procurement errors only those infringements that have prevented the best bid from winning the tender, rendering expenditure under this contract ineligible. We do not use flat rates for the different types of infringement of procurement rules as the Commission does29. We base our quantification of public procurement errors on the amounts of ineligible expenditure in examined transactions.
Estimated level of error
(20) For most MFF headings and for the overall EU budget, we present an ‘estimated level of error’ (ELE), which takes account of quantifiable errors only and is expressed as a percentage. Examples of errors are quantifiable breaches of applicable regulations, rules or contract or grant conditions. We also estimate the lower error limit (LEL) and the upper error limit (UEL).
(21) We use the level of 2,0 % as materiality threshold for our opinion. We also take account of the nature, amount and context of errors and other information available.
(22) We no longer base our statement of assurance solely on our overall estimate of error. Since 2016, we have continued to identify low-risk areas of the EU budget, where we expect to find a non-material level of error in accepted expenditure, and high-risk areas, where we assume there will be a material level of error. For this purpose, we consider, in addition to inherent and control risks, our assessment of management and control systems together with past audit results. For example, we treat some entitlement-based rural development expenditure as high-risk based on our past audit experience. This split enables us to determine as efficiently as possible whether material errors found are pervasive.
29 Commission’s 2019 guidelines on financial corrections in case of public procurement
irregularities in the annex to the Commission decision of 14.5.2019 laying down the guidelines for determining financial corrections to be made to expenditure financed by the Union for non-compliance with the applicable rules on public procurement, C(2019) 3452.
48

How we examine systems and report the results
(23) The Commission, other EU institutions and bodies, Member State authorities, beneficiary countries and regions establish systems for managing the risks to the budget and overseeing/ensuring the regularity of transactions. It is helpful to examine these systems in order to identify areas for improvement.
(24) Each MFF heading, including revenue, involves many individual systems. We present the results of our systems work together with recommendations for improvement.
How we arrive at our opinions in the statement of assurance
(25) We plan our work to obtain sufficient, relevant and reliable audit evidence for our opinion on the regularity of transactions underlying the EU’s consolidated accounts. This work is reported on in chapters 3 to 9. Our opinion is set out in the statement of assurance. Our work allows us to arrive at an informed opinion as to whether errors in the population exceed or fall within the materiality limits.
(26) Where we find a material level of error and determine its impact on the audit opinion, we must determine whether or not the errors, or the absence of audit evidence, are ‘pervasive’. In doing so, we apply the guidance contained in ISSAI 170530 (extending this guidance to apply to issues of legality and regularity, in accordance with our mandate). Where errors are material and pervasive, we present an adverse opinion.
(27) An error or an absence of audit evidence are deemed ’pervasive’ if, in the auditor’s judgment, they are not confined to specific elements, accounts or items of the financial statements (i.e. they are spread throughout the accounts or transactions tested), or, if they are so confined, they represent or could represent a substantial proportion of the financial statements, or relate to disclosures which are fundamental to users’ understanding of the financial statements.
PART 3 – Audit procedures in relation to fraud
(28) We identify and assess the risks of material misstatement of the consolidated accounts and of material non-compliance of the underlying transactions with the requirements of EU law, whether due to fraud or error.
30 ISSAI 1705 – Modifications to the Opinion in the Independent Auditor’s Report.
49

(29) We design and perform audit procedures responsive to those risks and obtain audit evidence that is sufficient and appropriate to provide a basis for our opinion. Instances of material misstatement or non-compliance resulting from fraud are more difficult to detect than those resulting from error, as fraud may involve collusion, forgery, intentional omissions, misrepresentations, or the override of internal control. Consequently, there is a greater risk of such instances not being detected.
(30) If we have reason to suspect that fraudulent activity has taken place, we report this to OLAF, the EU’s anti-fraud office. OLAF is responsible for carrying out any resulting investigations. We report several cases per year to OLAF.
PART 4 — Link between the audit opinions on the reliability of accounts and on the regularity of transactions
(31) We have issued:
(a) an audit opinion on the consolidated accounts of the EU for the financial year ended; and
(b) audit opinions on the regularity of the revenue and expenditure underlying those accounts.
(32) Our work and our opinions follow the IFAC’s International Standards on Auditing and Codes of Ethics and INTOSAI’s International Standards of Supreme Audit Institutions.
(33) Where auditors issue audit opinions on both the reliability of accounts and the regularity of transactions underlying those accounts, these standards state that a modified opinion on the regularity of transactions does not, in itself, lead to a modified opinion on the reliability of accounts.
50

Chapter 2
Budgetary and financial management
51

Contents
Paragraph
Introduction 2.1.
Budgetary management in 2019 2.2.-2.9. The available budget has been almost fully implemented 2.2.-2.6.
Outstanding commitments continue to increase 2.7.-2.9.
Risks and challenges for the EU budget 2.10.-2.13. Changes in the EU budget due to the COVID-19 pandemic 2.10.-2.11.
The United Kingdom has withdrawn from the EU 2.12.-2.13.
Financial management issues 2.14.-2.45. The absorption of ESIF has accelerated, but it is still slower than under the previous MFF 2.14.-2.17.
Financial instruments under shared management also face absorption problems 2.18.-2.21.
The EU budget is exposed to financial risks 2.22.-2.34. The EU budget covers different types of financial operations 2.22.-2.26.
The EU has various means available to mitigate the exposure of the budget 2.27.-2.33.
Future EU budget exposure needs reassessment 2.34.
The EU budget and the EIB Group are closely interlinked 2.35.-2.45. The EIB Group contributes to the EU’s objectives 2.35.-2.36.
A significant part of EIB operations is backed by the EU budget 2.37.-2.40.
The EIB Group will continue to play an important role 2.41.-2.43.
Our audit mandate covers only a part of the EIB’s operations 2.44.-2.45.
52

Conclusions and recommendations 2.46.-2.53. Conclusions 2.46.-2.51.
Recommendations 2.52.-2.53.
Annexes Annex 2.1 – Absorption by Member State at the end of 2019 and compared to 2012
Annex 2.2 Financial instruments managed by the EIB Group under EU mandate at the end of 2019 (million euros)
53

Introduction 2.1. This chapter presents our review of the main budgetary and financial issues which arose in 2019. It also identifies the risks and challenges that the EU budget may face in future years. The chapter is based on a review of the budgetary figures for 2019, the documents published by the Commission and other stakeholders, and our own work performed for the annual report, special reports, reviews and opinions.
54
Budgetary management in 2019
The available budget has been almost fully implemented
2.2. The Multiannual Financial Framework (MFF) Regulation1 sets maximum amounts for each of the seven years of the MFF (’MFF ceilings’). The ceilings apply to new EU financial obligations (commitment appropriations) and to payments that can be made from the EU budget (payment appropriations). The 2019 MFF ceilings were 164,1 billion euros for commitment appropriations and 166,7 billion euros for payment appropriations2.
2.3. For 2019, the budgetary authority approved 166,2 billion euros of commitment appropriations and 148,5 billion euros of payment appropriations (see Box 2.1). The final budget was very close to the initial adopted budget. The initial budget included 165,8 billion euros of commitment appropriations and 148,2 billion euros of payment appropriations. Only three amending budgets were adopted in 2019, adding 0,4 billion euros to commitment appropriations and 0,3 billion euros to payment appropriations.
2.4. Commitment appropriations were almost fully used up. 165,2 billion euros (99,4 %) was committed (see Box 2.1). These appropriations and their use were slightly higher than the MFF ceiling, because of special instruments that are allowed to exceed the ceiling3.
2.5. The use of available payment appropriations was slightly lower (98,5 %) than that of commitment appropriations. In 2019, 146,2 billion euros was paid (see Box 2.1)4, 19 billion euros (11,5 %) less than the amount which was committed.
1 Council Regulation (EU, Euratom) No 1311/2013 of 2 December 2013 laying down the
multiannual financial framework for the years 2014-2020 – OJ L 347, 20.12.2013, p. 884.
2 COM(2018) 282 final – Communication from the Commission to the Council and the European Parliament – Technical adjustment of the financial framework for 2019 in line with movements in GNI (ESA 2010) (Article 6 of Council Regulation No 1311/2013 laying down the multiannual financial framework for the years 2014-2020).
3 See Article 3(2) of the MFF Regulation.
4 Total payments in 2019 were 159,1 billion euros, made up of payments from the 2019 final budget of 146,2 billion euros, carry-overs of 1,7 billion euros, and assigned revenue of 11,2 billion euros. We exclude carry-overs and assigned revenue from this analysis because
55

2.6. This increases outstanding commitments and future payment needs, as we noted in our annual report last year5.
Box 2.1
Budget implementation in 2019
they are not part of the adopted budget and follow different rules. For further information, see part A4 of the ‘Report on budgetary and financial management of the European Commission for the financial year 2019’.
5 Annual report concerning the financial year 2018, paragraphs 2.12-2.21.
Final PA budget148,5
Final CA budget166,2
used 146.2
used 165,2
MFF ceiling; 164,1 MFF ceiling; 166,7
0
50
100
150billion euros
Commitment appropriations (CA)
Payment appropriations (PA)
56
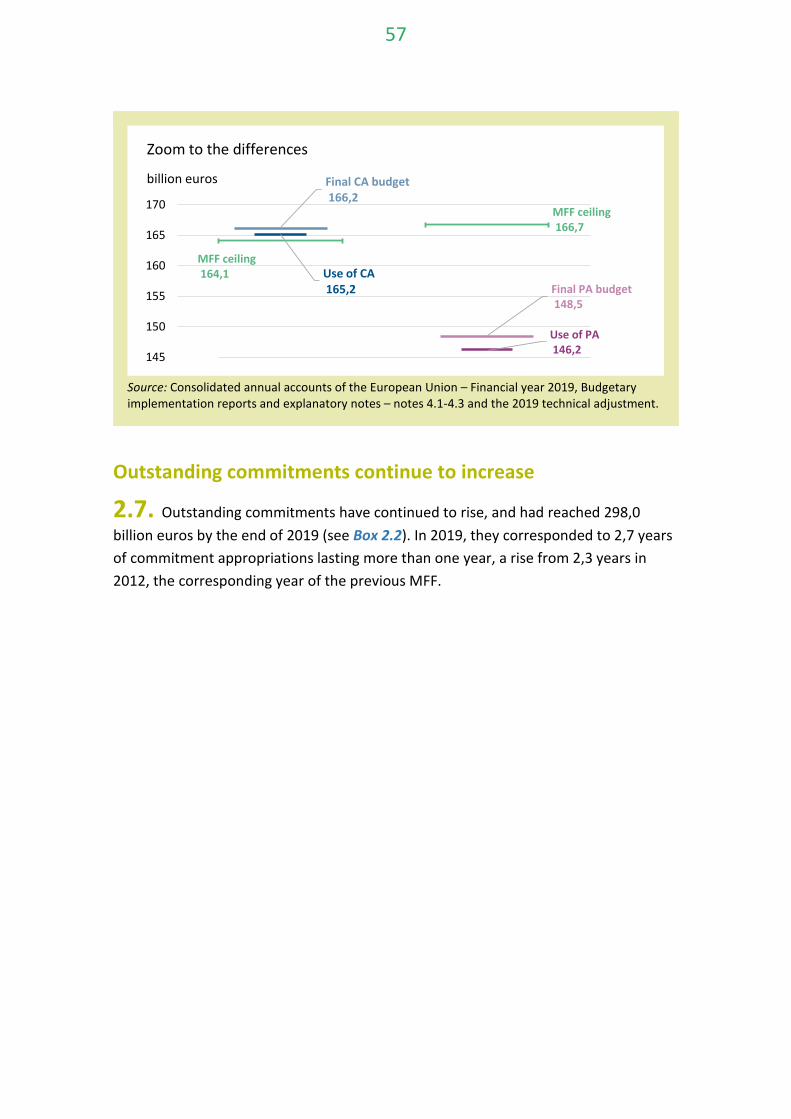
Source: Consolidated annual accounts of the European Union – Financial year 2019, Budgetary implementation reports and explanatory notes – notes 4.1-4.3 and the 2019 technical adjustment.
Outstanding commitments continue to increase
2.7. Outstanding commitments have continued to rise, and had reached 298,0 billion euros by the end of 2019 (see Box 2.2). In 2019, they corresponded to 2,7 years of commitment appropriations lasting more than one year, a rise from 2,3 years in 2012, the corresponding year of the previous MFF.
Use of PA146,2
Final PA budget148,5
MFF ceiling164,1
MFF ceiling166,7
Final CA budget166,2
Use of CA165,2
145
150
155
160
165
170
billion euros
Zoom to the differences
57

Box 2.2
Commitments, payments and outstanding commitments
Source: 2007-2019 consolidated annual accounts of the EU.
298
159
179
100
150
200
250
300
2007 2009 2011 2013 2015 2017 2019
billion euros
Outstanding Commitments at year end
Commitments
Payments
58

2.8. In our rapid case review ‘Outstanding commitments – a closer look’6, we identified the main reasons for the continuing rise in outstanding commitments. While part of the increase reflects the overall increase in the size of the EU budget over time, mainly due to an increase in the number of Member States and annual adjustments7, there are two further reasons for the historically high level of outstanding commitments: the annual gap between commitments and payments, and the generally slow implementation of the European structural and investment funds (ESIF). We have drawn attention to these issues in previous annual reports8. Due to these delays in implementation, commitments that were originally projected to be paid in the current MFF will need to be paid in the next MFF.
2.9. We analysed the development of outstanding commitments up to the end of 2019. Various factors linked to the COVID-19 crisis will have an impact on the amount of outstanding commitments from 2020 onwards. Some of these factors, such as implementation delays because of the COVID-19 restrictions, will increase this amount. Others will decrease it: for example, increases in the scope of eligibility rules to cover COVID-19 related expenditure9. Their overall impact cannot yet be assessed.
6 Published in April 2019.
7 Article 6 of Council Regulation (EU, Euratom) No 1311/2013 laying down the multiannual financial framework for the years 2014-2020 provides for an annual technical adjustment of 2 %.
8 See paragraphs 2.44 and 2.48 of our 2018 annual report, paragraph 2.48 of our 2017 annual report, and paragraphs 2.36-2.39 and 2.48 of our 2016 annual report.
9 Regulation (EU) 2020/460 of the European Parliament and of the Council of 30 March 2020 amending Regulations (EU) No 1301/2013, (EU) No 1303/2013 and (EU) No 508/2014 as regards specific measures to mobilise investments in the healthcare systems of Member States and in other sectors of their economies in response to the COVID-19 outbreak (Coronavirus Response Investment Initiative) and Regulation (EU) 2020/558 of the European Parliament and of the Council of 23 April 2020 amending Regulations (EU) No 1301/2013 and (EU) No 1303/2013 as regards specific measures to provide exceptional flexibility for the use of the European Structural and Investments Funds in response to the COVID-19 outbreak.
59

Risks and challenges for the EU budget
Changes in the EU budget due to the COVID-19 pandemic
2.10. The European Parliament and the Council have adopted substantial changes to the 2020 EU budget and other legislative amendments to respond to the COVID-19 pandemic. They have also passed measures10 providing additional liquidity and exceptional flexibility for COVID-19 related expenditure under the ESIF. We commented on some of these in a separate Opinion11. The Commission estimates that a significant impact of one of these measures is frontloading an additional 14,6 billion euros of payments to Member States in 2020 and 2021, of which 8,5 billion euros will be made available in 2020. Considering the amount of ESIF funds available in 2020 that can be committed and paid for COVID-19 related expenditure, there is a risk that payment appropriations may not be enough to cover all needs. We note that the Commission intends to ‘carefully monitor the impact of the proposed modification on payment appropriations in 2020 taking into account both the implementation of the budget and Member States’ revised forecasts’12.
2.11. On 27 May 2020, the Commission submitted major amendments to its proposal for the 2021-2027 MFF to address the effects of the COVID-19 pandemic. These amendments include a new European Recovery Instrument (‘Next Generation EU’) which would make available another 750 billion euros over four years (2021-2024) and an adjusted 2021-2027 MFF, reduced to a new proposed total amount of 1 100 billion euros. If, by the end of 2020, the Council does not adopt the 2021-2027 MFF or the European Parliament does not grant consent, transitional provisions will become necessary to avoid a discontinuation of many EU spending programmes. On 13 May 2020, the European Parliament adopted a resolution asking the Commission to submit a proposal for an MFF contingency plan to guarantee the continuity of funding in the event that an agreement on the 2021-2027 MFF cannot be reached on time. In view of the COVID-19 crisis, the Parliament asked the Commission to include in the
10 See footnote 9.
11 ECA Opinion No 3/2020 (2020/C 159/01).
12 Explanatory Memorandum, accompanying the Commission’s proposal COM(2020) 138 final (procedure 2020/0054 (COD)) for a Regulation of the European Parliament and of the Council amending Regulation (EU) No 1303/2013 and Regulation (EU) No 1301/2013 as regards specific measures to provide exceptional flexibility for the use of the European Structural and Investments Funds in response to the COVID-19 outbreak.
60

contingency plan proposals for targeted reinforcements and revisions of rules to address the crisis and support the EU’s economic recovery.
The United Kingdom has withdrawn from the EU
2.12. On 31 January 2020, the United Kingdom officially withdrew from the EU and entered a ’transition period’. This period is due to end on 31 December 2020. The future relationship after the end of transition period depends on any agreement that the UK and the EU may reach in 2020.
2.13. During 2020, the UK will continue to contribute to the EU budget, and benefit from it, according to the same rules as if it had remained a Member State. The UK’s post-2020 contribution for obligations it entered into as a Member State will be established based on the provisions of the withdrawal agreement13, as a ratio between the amount of own resources provided by the UK in the period from 2014 to 2020 and the amount of own resources provided by all Member States (including the UK) in the same period.
13 Agreement on the withdrawal of the United Kingdom of Great Britain and Northern Ireland
from the European Union and the European Atomic Energy Community, OJ L 29, 31.01.2020, p. 7.
61

Financial management issues
The absorption of ESIF has accelerated, but it is still slower than under the previous MFF
2.14. In 2019, the speed of absorption of ESIF was almost exactly the same as in 2018. As the chart in Box 2.3 shows, by the end of 2019 out of the total ESIF allocations for the current MFF (465 billion euros) only 40 % had been paid out to the Member States, compared with 46 % by the end of 2012, the corresponding year of the previous MFF. During 2019, 12 % of total allocations were paid, similar to the proportion of the allocations paid in 2012, the corresponding year of the previous MFF (13 %). The chart also shows that only nine Member States had higher absorption rates under the current MFF than under the previous one.
62

Box 2.3
Absorption of ESI funds by Member State and MFF
Source: ECA, based on information from the Commission.
63

2.15. Box 2.4 shows the level of absorption for each ESI Fund in relative and absolute terms. There are considerable differences in absorption rates between the Funds. For example, the absorption rate of the European Agricultural Fund for Rural Development (EAFRD) (allocation of 100 billion euros) has reached 50 %, which was higher than for the other ESI Funds, whereas the absorption rate of European Maritime and Fisheries Fund (EMFF) (allocation of 5,7 billion euros) has reached 29 %. The overall absorption rate in 2019 was faster than in any other year of the current MFF. Nevertheless, the overall absorption rate across all ESI Funds was slower in 2019 than in 2012, the corresponding year of the previous MFF.
2.16. We have analysed the underlying reasons for the slow rate of absorption in previous reports14. The main reasons are the delayed start of spending programmes and the additional time allowed for declaring costs (the ‘n+3’ rule)15. The amount of outstanding commitments related to the ESIF at the end of 2019 was 211 billion euros (of which 208 billion euros relate to the current MFF).
14 Annual report concerning the financial year 2017, paragraphs 2.13-2.19 (2018/C 357/01,
04.10.2018) and Review 05/2019: Outstanding commitments in the EU budget – A closer look, April 2019.
15 In the 2014-2020 MFF Member States have three years to use the funds committed and declare costs to the Commission for reimbursement (the ‘n+3’ rule). After that time, a system of ’automatic decommitments’ is meant to clear any unused funds.
64

Box 2.4
Absorption of ESI funds by Fund
Note: The Youth Employment Initiative is included under ESF.
Source: ECA, based on information from the Commission.
0 %
10 %
20 %
30 %
40 %
50 %
CF EAFRD EMFF ERDF ESF
to 2019from 2014
24,7
50,4
1,6
69,4
36,1
0
20
40
60
CF EAFRD EMFF ERDF ESF
to 2019from 2014Cumulative payments by Fund
billion euros
Cumulative absorption by Fund (%)
65

2.17. Last year, we noted16 that in 2017 and 2018, substantial amounts of unused annual pre-financing had been returned to the EU budget17. This was due mainly to delays in implementation. In 2019, again, Member States returned annual pre-financing worth 7,7 billion euros to the EU budget as assigned revenue. Of that amount, 5,0 billion euros was used to make payments on claims from Member States over and above the approved budget for the year. This facility will not be available in 2020 because the unused annual pre-financing will not be recovered and can be used for COVID-19-related expenditure18.
Financial instruments under shared management also face absorption problems
2.18. Financial instruments under shared management (FISMs) are a delivery tool for providing financial support from the EU budget. Under this scheme, programmes using ESIF funding can set up standalone Funds or sub-Funds of a holding Fund. These Funds provide support to final recipients. This support may take the form of loans, guarantees and equity investments. If properly implemented, FISMs can provide specific benefits compared to grants. In particular, they can be used to leverage public and private funds: in other words, to mobilise additional private and public funds to complement the initial public funding. Also, their capital endowment revolves: the same funds can be reused across several cycles19.
16 Annual report concerning the financial year 2018, paragraphs 2.9-2.11 (OJ C 340/02,
08.10.2019).
17 There is no annual pre-financing for the EAFRD.
18 Regulation (EU) 2020/460 of the European Parliament and of the Council of 30 March 2020 amending Regulations (EU) No 1301/2013, (EU) No 1303/2013 and (EU) No 508/2014 as regards specific measures to mobilise investments in the healthcare systems of Member States and in other sectors of their economies in response to the COVID-19 outbreak (Coronavirus Response Investment Initiative).
19 Special report No 19/2016 – ‘Implementing the EU budget through financial instruments — lessons to be learnt from the 2007-2013 programme period’, summary and paragraph 7 (OJ: JOC 2016 250 R 0002, 09.07.2016).
66

2.19. Of the 16,9 billion euros committed from the ESIF to FISMs under the 2014-2020 MFF, 7,0 billion euros had been paid to the FISMs by the start of 2019. Of this amount, 2,8 billion euros had reached its final recipient. Therefore, by the start of 2019, after the current MFF had been in place for five years, only around 17 % of the total ESI funding committed through FISMs had reached its final recipient (see Box 2.5).
Box 2.5
Commitments and payments for FISMs
Note: Information for 2015 concerns the years 2014 and 2015 cumulatively.
Source: ECA, based on Commission reports ‘Financial instruments under the European Structural and Investment Funds Summaries of the data on the progress made in financing and implementing the financial instruments for the programming period 2014-2020 in accordance with Article 46 of Regulation (EU) No 1303/2013 of the European Parliament and of the Council’, 2015 – 2018.
67

2.20. As it was during the 2007-2013 MFF, the Commission is required during the 2014-2020 MFF to draw up a report on the FISMs each year. According to the relevant Regulation20, the annual report for 2018 was due by December 2019. The Commission published the report21 in January 2020. As we noted in our 2017 annual report22, we consider that the gap between the end of the reporting period and the corresponding report remains long, which reduces the relevance of the information it contains.
2.21. In the CPR proposal23 for the 2021-2027 MFF, the provision requiring the Commission to report annually on individual financial instruments has been dropped. Furthermore, the managing authorities are required to provide data to the Commission on financial instruments only at priority level. We consider that the reasons for which separate reports were required in the 2007-2013 MFF are still relevant: ‘to enhance the transparency of the implementation process and ensure appropriate monitoring, of the implementation of financial instruments’24. This also implies the need to reduce the time gap between the publication of the Commission’s annual report on individual financial instruments and the period that it covers25.
20 See Article 46 of Regulation (EU) No 1303/2013 of the European Parliament and of the
Council of 17 December 2013 (OJ L 347, 20.12.2013).
21 Financial instruments under the European Structural and Investment Funds: Summaries of the data on the progress made in financing and implementing the financial instruments for the programming period 2014-2020 in accordance with Article 46 of Regulation (EU) No 1303/2013 of the European Parliament and of the Council, situation as at 31 December 2018.
22 Annual report concerning the 2017 financial year, paragraph 2.35 (OJ C357/02, 04.10.2018).
23 Proposal for a Regulation of the European Parliament and of the Council laying down common provisions on the European Regional Development Fund, the European Social Fund Plus, the Cohesion Fund, and the European Maritime and Fisheries Fund and financial rules for those and for the Asylum and Migration Fund, the Internal Security Fund and the Border Management and Visa Instrument, COM(2018) 375 final.
24 Regulation (EU) No 1310/2011 of the European Parliament and of the Council (OJ L 337, 20.12.2011).
25 ECA Opinion No 6/2018 (2019/C 17/01).
68

The EU budget is exposed to financial risks
The EU budget covers different types of financial operations
2.22. At the end of 2019, the main financial risks to which the EU budget is exposed were associated with the following types of operations: financial operations in form of loans covered directly by the EU budget and financial operations covered by an EU guarantee fund26.
2.23. Financial operations covered directly by the EU budget include:
o Loans under the European Financial Stabilisation Mechanism (EFSM) granting support to any eurozone Member State in the event of severe economic or financial disturbance;
o Balance-of-Payments (BOP) loans to non-eurozone Member States experiencing balance-of-payments difficulties; and
o Euratom loans to Member States27.
2.24. Financial operations covered by a guarantee fund include:
o Macro Financial Assistance (MFA) loans to non-EU countries provisioned in the Guarantee Fund for External Actions (GFEA);
o Euratom loans to non-EU countries covered by guarantees received from third parties and additionally provisioned in the GFEA;
26 In addition to these financial operations, the EU budget uses also financial instruments.
Under Article 210 of the Financial Regulation, the financial liability of the EU and the total payments from the EU budget linked to a financial instrument may not exceed ‘the amount of the relevant budgetary commitment made for it’, thus excluding contingent liabilities for the EU budget.
27 In order to finance lending operations, the Commission is empowered to borrow funds on behalf of the EU. The borrowing and lending activities related to EFSM and BOP loans are conducted back to back, outstanding borrowings matching outstanding loans.
69

o the Operations in Member States covered by the European Fund for Strategic Investments (EFSI) guarantee (managed by the EIB Group28);
o Operations in non-Member States covered by the External Lending Mandate (ELM) guarantee (managed by the EIB);
o The European Fund for Sustainable Development (EFSD) operations covered by the EFSD guarantee (an initiative aimed at supporting sustainable investment outside EU.
2.25. The Commission reports annually on guarantees including on the total risk and the annual risk borne by the EU budget. ‘Total risk’ is the total amount outstanding (capital and interest) in respect of the covered operations. At 31 December 2019, this amount was 72,7 billion euros29. ‘Annual risk’ is the maximum amount of annual payments due (capital and interest) which the EU would have to pay in a financial year if all payments of guaranteed loans were in default; at 31 December 2019, this amounted to 4,5 billion euros30.
2.26. The amount of total risk reported by the Commission does not include EFSI-related operations. At 31 December 2019, the exposure of the EU budget to possible future payments in relation to the EFSI guarantee amounted to 22 billion euros of signed operations, of which 17,7 billion euros had been disbursed. Adding this disbursed amount to the Commission’s total risk would significantly increase the total risk to 90,5 billion euros (31 December 2018: 90,3 billion euros)31 (see Box 2.6).
28 The EIB Group consists of the European Investment Bank (EIB) and the European
Investment Fund (EIF).
29 While the Commission does not include an amount for the ‘total risk’, we estimated it based on the amounts disclosed in COM (2019) 484 – Report from the Commission to the European Parliament and the Council on guarantees covered by the general budget. Situation at 31 December 2018.
30 Estimation based on COM (2019) 484 – Report from the Commission to the European Parliament and the Council on guarantees covered by the general budget. Situation at 31 December 2018, and on the 2019 consolidated accounts of the EU.
31 This includes an amount of 0,3 billion euros (31 December 2018: 0,2 billion euros) related to EFSI and ELM, disclosed as provisions or financial liabilities in the annual accounts of the EU.
70

Box 2.6
Distribution of the total risk borne by the EU budget at 31 December 2019
Source: ECA, based on the 2019 consolidated accounts of the EU and the Commission report on guarantees covered by the general budget, 2018.
The EU has various means available to mitigate the exposure of the budget
2.27. The EU has a number of means in place to ensure that it will be able to fulfilits legal obligations in relation to loans and guarantees. These include the guarantee funds, the cash available in the Commission’s treasury, the ability to prioritise the payment of legal obligations, and the ability to request additional resources from Member States.
EFSM loans52,4 %
EIB loans –Member States1,0 %
BOP loans0,2 %
Euratom loans –Member States0,1 %
EIB loans –non-member
countries (ELM)21,3 %
EFSI guarantee19,6 %
MFA loans5,3 %
Euratom loans –non-member
countries0,1 %
EFSD guarantee0 %
(million euros)
Covered by a guarantee fund: 41 81746,3 %
Covered directly by the EUbudget: 48 649
53,7 %
71

Guarantee funds
2.28. The guarantee funds represent a liquidity cushion for the payment of guarantee calls due to potential defaults. If amounts required to settle the calls exceed the amounts available in the guarantee funds, they have to be covered by the EU budget. The EU budgetary guarantees are legal commitments made by the EU to support a programme by taking on a financial obligation in the budget32. There are currently three budgetary guarantees: the EFSI guarantee, which is backed by the EFSI guarantee fund; the ELM guarantee, which is backed by the GFEA; and the EFSD guarantee, which is backed by the EFSD guarantee fund (see Table 2.1).
2.29. The EFSI guarantee fund covers operations under the EFSI guarantee. The provisioning rate (a percentage of funds to be set aside in the guarantee fund to cover future calls on the guarantee) is currently 35 % (it was lowered from 50 % in 2015)33. In 2019, there were no calls paid from the guarantee fund.
2.30. The GFEA covers liabilities arising from the default of beneficiaries of loans made to non-EU countries by the EIB (ELM loans) or by the Commission (MFA loans and Euratom loans to non-EU countries). The provisioning rate for the GFEA is set at 9 % of total outstanding liabilities. During 2019, the fund paid out 55 million euros to cover calls on the ELM guarantee.
2.31. The EFSD guarantee fund covers operations under the EFSD budgetary guarantee, which is designed to mobilise private investment in partner countries in Africa and in the EU neighbourhood34. The target provisioning rate is set at 50 % of the total obligations. By 31 December 2019, one EFSD guarantee agreement was effective, for a total cover limit of 50 million euros.
32 See Article 2(9) of the Financial Regulation.
33 Regulation (EU) No 2017/2396 of 13 December 2017 amending Regulations (EU) No 1316/2013 and (EU) 2015/1017 as regards the extension of the duration of the European Fund for Strategic Investments as well as the introduction of technical enhancements for that Fund and the European Investment Advisory Hub (OJ L 345, 27.12.2017, pp. 34–52).
34 Regulation (EU) No 2017/1601 establishing the European Fund for Sustainable Development (EFSD), the EFSD Guarantee and the EFSD Guarantee Fund.
72
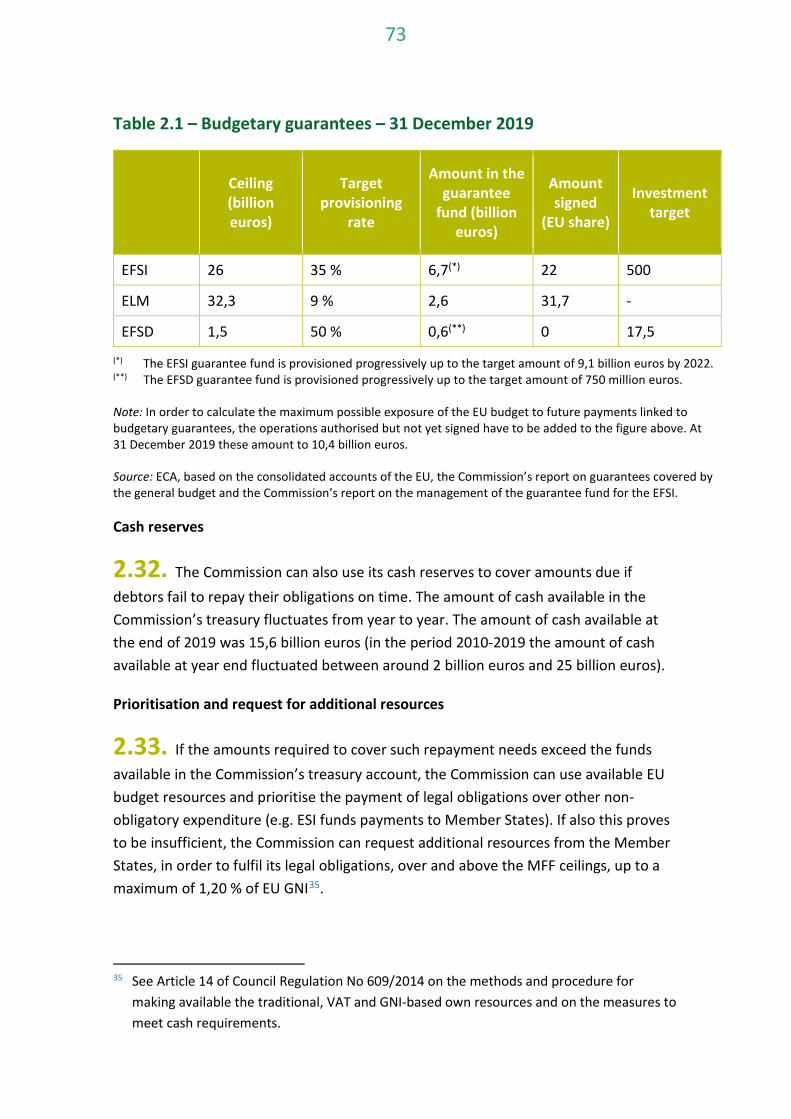
Table 2.1 – Budgetary guarantees – 31 December 2019
Ceiling (billion euros)
Target provisioning
rate
Amount in the guarantee
fund (billion euros)
Amount signed
(EU share)
Investment target
EFSI 26 35 % 6,7(*) 22 500
ELM 32,3 9 % 2,6 31,7 -
EFSD 1,5 50 % 0,6(**) 0 17,5
(*) The EFSI guarantee fund is provisioned progressively up to the target amount of 9,1 billion euros by 2022. (**) The EFSD guarantee fund is provisioned progressively up to the target amount of 750 million euros.
Note: In order to calculate the maximum possible exposure of the EU budget to future payments linked to budgetary guarantees, the operations authorised but not yet signed have to be added to the figure above. At 31 December 2019 these amount to 10,4 billion euros.
Source: ECA, based on the consolidated accounts of the EU, the Commission’s report on guarantees covered by the general budget and the Commission’s report on the management of the guarantee fund for the EFSI.
Cash reserves
2.32. The Commission can also use its cash reserves to cover amounts due ifdebtors fail to repay their obligations on time. The amount of cash available in the Commission’s treasury fluctuates from year to year. The amount of cash available at the end of 2019 was 15,6 billion euros (in the period 2010-2019 the amount of cash available at year end fluctuated between around 2 billion euros and 25 billion euros).
Prioritisation and request for additional resources
2.33. If the amounts required to cover such repayment needs exceed the fundsavailable in the Commission’s treasury account, the Commission can use available EU budget resources and prioritise the payment of legal obligations over other non-obligatory expenditure (e.g. ESI funds payments to Member States). If also this proves to be insufficient, the Commission can request additional resources from the Member States, in order to fulfil its legal obligations, over and above the MFF ceilings, up to a maximum of 1,20 % of EU GNI35.
35 See Article 14 of Council Regulation No 609/2014 on the methods and procedure for making available the traditional, VAT and GNI-based own resources and on the measures to meet cash requirements.
73
Future EU budget exposure needs reassessment
2.34. Article 210(3) of the Financial Regulation states that the contingent liabilities arising from budgetary guarantees or financial assistance borne by the budget can be considered sustainable, as long as their forecast multiannual evolution is compatible with the limits set by the Regulation laying down the MFF and the ceiling on annual payment appropriations. Based on this, the means available to address the exposure of the EU budget at 31 December 2019 may be considered sustainable (see paragraphs 2.22-2.33). However, the COVID-19 crisis may lead to the increased use of existing and newly agreed instruments to mitigate the expected economic downturn. It also introduces the risk that the repayment capabilities of the current final beneficiaries of the loans and budgetary guarantees may be adversely affected. This will impact the amounts and mechanisms available to mitigate future exposure, including the provisioning rates.
The EU budget and the EIB Group are closely interlinked
The EIB Group contributes to the EU’s objectives
2.35. The EIB Group contributes to the EU’s objectives using a combination of operations financed or backed by funds from the EU budget, and the EIB Group’s own resources. During the last MFFs, in line with the increased use of financial instruments, the role of the EIB Group in supporting EU policies has increased significantly.
2.36. The EIB Group’s objectives are very much aligned with those of the EU. Since 2011, the EIB has set itself the objective that 30 % of its signed projects each year should contribute to economic and social cohesion and convergence. A significant part of the EIB Group’s operations is also dedicated to climate action and environmental sustainability. More recently, the EIB has announced that its target proportion of climate-related projects will be doubled from 25 % currently to 50 % by 202536.
36 See the EIB Group’s 2020 operational plan.
74

A significant part of EIB operations is backed by the EU budget
2.37. The EIB Group contributes towards implementing the EU’s objectives using a variety of instruments (see Box 2.7).
Box 2.7
Cooperation between the EU budget and the EIB Group
Source: ECA, based on the Commission’s 2018 annual report on the EU’s financial architecture.
2.38. While parts of the EIB Group’s financial activities are undertaken using only the EIB Group’s own resources and at its own risk, a significant part is implemented using funds made available by third parties, including the Commission, through ‘mandates’. Mandates are partnerships entered into by the EIB Group with a third party for the purpose of achieving common objectives. They are based on financial support pledged by the third party.
75

2.39. The EIB’s use of this system of mandates has increased and diversified rapidly over the last 15 years. The EIF also implements funds using EU mandates. As the amount of EIB mandates is higher, our analysis focuses mainly on the EIB. By the end of 2019, about one-third of the EIB’s lending activity and over three-quarters of its advisory activity was being conducted under mandates, with around 50 mandates in force. Most of these mandates take the form of agreements with the Commission.
Box 2.8
Evolution of EIB mandate activity from 2003 to 2019
Source: ECA, based on the EIB’s ‘Evaluation of EIB’s mandate activity’ report, December 2019.
76

2.40. Box 2.9 shows the EIB’s annual lending activity split between mandate andnon-mandate financing.
Box 2.9
EIB’s mandate financing activity vs. other non-mandate financing per year
Note: The chart shows actual figures for 2017, 2018 and 2019, and forecast figures for 2020.
Source: ECA based on EIB data.
49,8
35,743,1 41,9
13,8
12,4
11,9 13,2
3,9
4,9
5,3 6,7
1,5
1,0
1,6 1,2
0
20
40
60
2017 2018 2019 2020
EIB operations based on fund source
Other risk sharingmandates
Outside EU mandates
EFSI
Non-mandate financing
billion euros
77

The EIB Group will continue to play an important role
2.41. The EIB’s largest mandates are those backed by the EFSI guarantee (with a ceiling of 26 billion euros) and the ELM guarantee (ceiling of 32,3billion euros). In our special report on the EFSI37 we concluded that the EFSI had helped the EIB to provide more higher-risk finance for investments and attracted additional public and private investment. However, we also found that some EFSI support has replaced other EIB and EU financing, that some EFSI financing had gone to projects that could have used other sources of public or private finance, that estimates of additional investment attracted by EFSI had sometimes been overstated, and that most investments had gone to a few larger EU-15 Member States with well-established national promotional banks. In the Commission’s 2019 evaluation of the ELM38, the Commission noted a number of shortcomings. These included weaknesses in the EIB’s information-sharing, and difficulties in assessing the actual results and impacts of EU intervention. According to the same evaluation report, the Commission has also begun an overall review of the Article 19 procedure39 with a view to improving the oversight of the alignment of EIB operations with EU policy priorities, including operations outside the EU.
37 Special report No 3/2019 ‘European Fund for Strategic Investments: Action needed to make
EFSI a full success’.
38 Evaluation of Decision No 466/2014/EU of the European Parliament and of the Council of 16 April 2014 granting an EU guarantee to the European Investment Bank against losses under financing operations supporting investment projects outside the Union – SWD(2019) 334 final, 13.9.2019.
39 In accordance with Article 19 of the EIB’s Statute, the Commission’s opinion must be sought for all EIB operations financed from own resources before being presented to the EIB Board of Directors for approval. The role of the Commission is to provide an opinion on the conformity of the proposed investments with relevant EU legislation and policies. Aspects such as project profitability and financial risk are outside the scope of the Article 19 procedure and remain the EIB's sole responsibility.
78

2.42. Over the next 10 years, the Commission has committed to mobilising at least 1 trillion euros of investments to support a sustainable, equitable and green transition40. The InvestEU Programme41 will be the main instrument of this plan. The EIB Group will contribute to this investment target under the InvestEU Programme, including the dedicated Just Transition scheme, and under the public-sector loan facility of the Just Transition Mechanism42. The EIB Group's contribution to the Commission’s European Green Deal Investment Plan is expected to amount to around to 250 billion euros of mobilised investments under EU mandates43.
2.43. The EIB Group will also contribute to the EU’s response to the COVID-19 pandemic. Following a recommendation by the Eurogroup on 9 April 202044, the EIB Group is creating a pan-European guarantee fund of up to 25 billion euros, with a focus on small and medium-sized enterprises (SMEs) throughout the EU. The EIB Group has previously announced a set of measures intended to mobilise up to 40 billion euros for funding short-term financing needs of impacted SMEs, which includes supporting up to 8 billion euros of financing delivered via the EIF and backed by an EU guarantee of 1 billion euros redirected under the EFSI to incentivise financial intermediaries to provide liquidity to SMEs and midcaps, and 5 billion euros available for investments in the healthcare sector. Supported by the EU’s funding, including EU guarantees, the EIB has also announced that it will provide up to 5,2 billion euros in the coming months to partners outside the EU.
40 COM(2020) 21 Communication from the Commission on Sustainable Europe Investment
Plan and European Green Deal Investment Plan.
41 COM(2018) 439 Commission’s proposal for a ‘Regulation of the European Parliament and of the Council establishing the InvestEU Programme’.
42 COM(2020) 22 Proposal for a Regulation of the European Parliament and of the Council establishing the Just Transition Fund.
43 The budgetary aspects of the InvestEU Programme and the Just Transition Mechanism are still subject to the overall agreement on the next MFF.
44 See Eurogroup summing-up letter, 17 April 2020.
79
Our audit mandate covers only a part of the EIB’s operations
2.44. At present, a large part of the EIB’s operations – the operations which are not financed or backed by the EU budget – falls outside our audit mandate. Taking into account the significant contribution that these operations make towards achieving EU objectives, as well as the increasing use of the EIB for implementing the EU budget, we consider that it would be beneficial for them to be subject to an independent external examination of their regularity and performance. The ECA carries out its audits related to the EIB’s operations based on the tripartite agreement between the Commission, the ECA and the EIB. This applies to loan operations under the mandate conferred by the European Union on the Bank and the operations managed by the Bank which are entered into, and guaranteed by, the general budget of the European Union45. This current agreement will expire in 2020, and a new one is under negotiation.
2.45. In 2020, the European Parliament repeated its call ‘for the ECA to be empowered to audit all EIB operations, including evaluating the cost-effectiveness of its investment efforts and the additionality of its projects, and for these audits to be made public’. It also called on the ECA ‘to draw up recommendations on the results of the EIB’s external lending activities’46.
45 Tripartite Agreement between the European Commission, the European Court of Auditors,
and the European Investment Bank, 2016.
46 European Parliament resolution of 10 July 2020 on the ‘Financial activities of the European Investment Bank – annual report 2019’ (2019/2126(INI)) and Report on discharge in respect of the implementation of the general budget of the European Union for the financial year 2018, Section III – Commission and executive agencies (2019/2055(DEC)).
80

Conclusions and recommendations
Conclusions
2.46. In 2019, commitment and payment appropriations available in the final budget have been used almost fully. Payments were noticeably below the MFF ceilings in the last four years, which will lead to higher payment needs in future (see paragraphs 2.2-2.6).
2.47. At the end of 2019, outstanding commitments reached an all-time high. We have identified two main reasons for this increase: commitment appropriations systematically exceeding payment appropriations, and payment needs being postponed to the next MFF (see paragraphs 2.7-2.9).
2.48. Although the speed of the implementation of the ESIF has accelerated, overall absorption remains lower than in the corresponding year of the previous MFF. The revised rules for implementing the ESI Funds, triggered by the COVID-19 crisis, should further increase the implementation speed. These changes risk creating a pressure on the payment appropriations available from 2020 onwards (see paragraphs 2.14-2.17).
2.49. Only 17 % of committed funds in FISMs had reached their final recipient by the fifth year of the current MFF. The relevance of the Commission’s reporting on FISMs is reduced because its annual report on FISMs is published too late. In the 2021-2027 MFF, the Commission will no longer produce an annual report at the level of the individual FISMs (see paragraphs 2.18-2.21).
2.50. At the end of 2019, the EU had various instruments at its disposal to address the exposure of the EU budget to financial risks stemming from loans and budgetary guarantees. However, the impact of the COVID-19 crisis will require a reassessment of the amounts and mechanisms available to mitigate future exposure, including a revision of the provisioning rates. Therefore, it is important to have a complete picture of the ‘total risk’ to which the EU budget is exposed, including the risk generated by the budgetary guarantees such as EFSI (see paragraphs 2.22-2.34).
81

2.51. The EIB Group is an important partner in implementing the EU budget and achieving the EU’s objectives, and its role will continue to be significant in the next MFF. Large parts of its operations are undertaken using mandates, most of which take the form of agreements with the Commission. According to our audit mandate, we can only examine EIB operations which are financed or guaranteed by the EU budget. Our special reports have identified issues and proposed improvements related to the performance of such operations. Therefore, we consider that it would be beneficial for the part of the EIB operations not backed by the EU budget to be subject to an independent external examination of their regularity and performance (see paragraphs 2.35-2.45).
Recommendations
2.52. We recommend that the Commission should take the following action.
Recommendation 2.1
Closely follow payment needs and take action, within its institutional remit, with a view to ensuring the availability of payment appropriations taking into account the risk of insufficient payment appropriations and the extraordinary needs arising from the COVID-19 pandemic.
Timeframe: from 2020
Recommendation 2.2
Continue producing an annual report on the FISMs, including at the level of individual financial instruments, in the next MFF.
Timeframe: annually, from the 2021 report
Recommendation 2.3
Present a complete picture of the exposure of the EU budget in the annual ‘Report on guarantees covered by the general budget’, including the risk generated by the EFSI guarantee as well as by all future financial operations concerned.
Timeframe: annually, from 2021
82

Recommendation 2.4
Re-assess, in the context of the COVID-19 crisis, whether the existing mechanisms to mitigate the exposure of the EU budget to risk are sufficient and appropriate and review the target provisioning rates of the guarantee funds covering the guarantees granted from the EU budget.
Timeframe: from 2020
2.53. We recommend that the European Parliament and the Council should take the following action:
Recommendation 2.5
Call on the EIB to enable the Court to audit the regularity as well as the performance aspects of its financing activity, which do not fall under a specific EU mandate.
Timeframe: from 2021
83

Annexes
Annex 2.1 – Absorption by Member State at the end of 2019 and compared to 2012
Total payments
paid in 2014 to 2019 million euros
Absorption rate at the end of 2019
Absorption rate at the end of 2012
Belgium 1 120 39,7 % 49,1 %
Bulgaria 3 648 36,6 % 36,2 %
Czechia 9 651 40,4 % 37,9 %
Denmark 622 40,1 % 45,3 %
Germany 11 518 41,1 % 54,1 %
Estonia 2 164 48,8 % 61,3 %
Ireland 2 050 60,6 % 60,3 %
Greece 9 266 42,8 % 49,2 %
Spain 13 291 32,8 % 51,7 %
France 12 566 44,8 % 43,3 %
Croatia 3 231 30,0 %
Italy 13 885 30,7 % 30,7 %
Cyprus 443 48,1 % 44,3 %
Latvia 2 509 44,2 % 52,2 %
Lithuania 3 481 40,9 % 62,9 %
Luxembourg 82 57,0 % 51,8 %
Hungary 10 737 42,8 % 44,2 %
Malta 288 34,6 % 37,2 %
Netherlands 742 38,0 % 45,6 %
Austria 2 790 56,5 % 52,2 %
Poland 36 200 41,8 % 52,3 %
Portugal 12 231 47,0 % 59,2 %
Romania 11 163 35,6 % 22,4 %
84
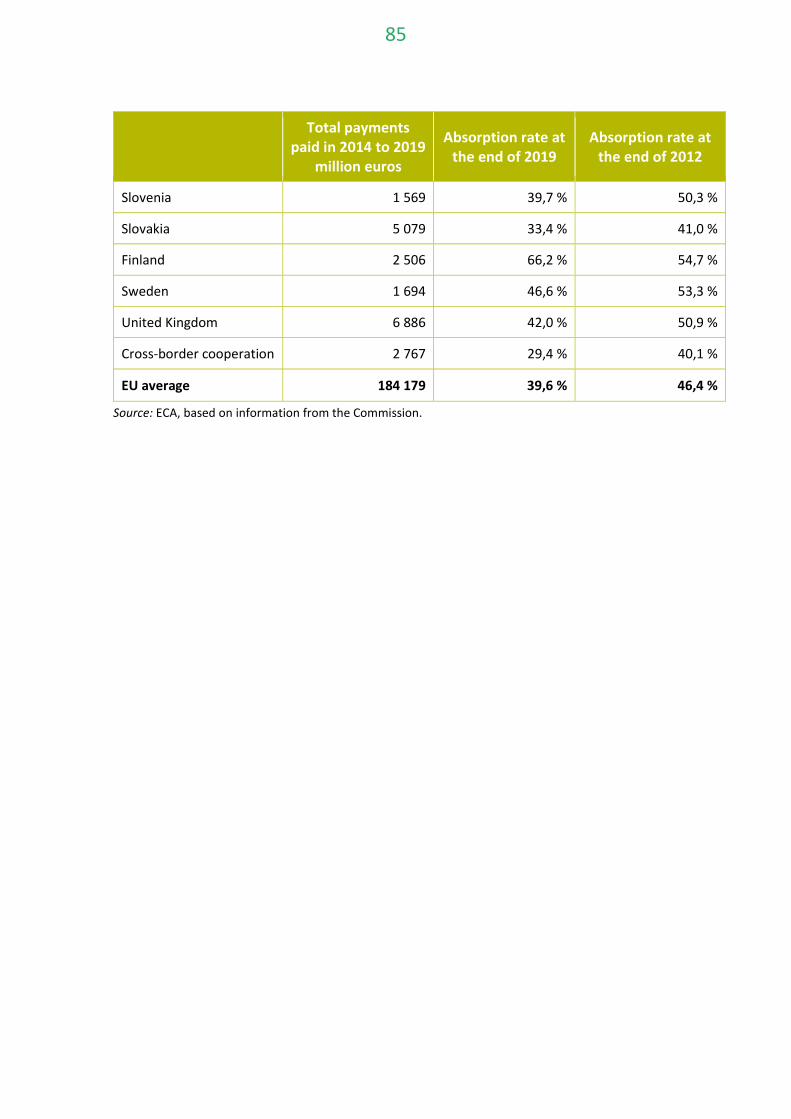
Total payments
paid in 2014 to 2019 million euros
Absorption rate at the end of 2019
Absorption rate at the end of 2012
Slovenia 1 569 39,7 % 50,3 %
Slovakia 5 079 33,4 % 41,0 %
Finland 2 506 66,2 % 54,7 %
Sweden 1 694 46,6 % 53,3 %
United Kingdom 6 886 42,0 % 50,9 %
Cross-border cooperation 2 767 29,4 % 40,1 %
EU average 184 179 39,6 % 46,4 %
Source: ECA, based on information from the Commission.
85

Annex 2.2 Financial instruments managed by the EIB Group under EU mandate at the end of 2019 (million euros)
Financial instrument Managed by Financial envelope available
Total payments from EU budget until end 2019
Connecting Europe Facility (CEF) –Debt Instruments EIB 2 536(*) 697
Private Finance for Energy Efficiency Instruments Facility (PF4EE)
EIB 105 48
Natural Capital Financing Facility (NCFF) EIB 60 13
InnovFin Debt – Horizon 2020 Loan Services for R&I Facility EIB 1 686 1 275
Risk-Sharing Finance Facility (RSFF) EIB 961 961
Pilot guarantee facility for Research and Innovation-driven SMEs and small midcaps – RSI
EIF 270 270
EaSI Microfinance and Social Enterprise (EaSI) EIF 110 84
EaSI Capacity Building investments EIF 26 23
European Progress Micro-Finance Guarantee Facility (EPMF – G)
EIF 25 24
European Progress Micro-Finance Fund (EPMF – FCP-FIS) EIF 80 80
Employment and Social Innovation Sub – Fund (EaSI FIS)
EIF 67 25
Student Loan Guarantee Facility (Erasmus+) – SLGF EIF 50 22
Loan Guarantee Facility under COSME (COSME-LGF) EIF 1 161 563
Equity Facility for Growth under COSME (COSME-EFG) EIF 394 94
InnovFin SMEG – SME and Small Midcaps R&I Loans Service under Horizon 2020
EIF 1 389 1 101
86

Financial instrument Managed by Financial envelope available
Total payments from EU budget until end 2019
InnovFin Equity – Equity Facility for Research and Innovation under Horizon 2020
EIF 785 534
SME Initiative (COSME and Horizon 2020 contribution) EIF 32 21
Cultural and Creative Sectors Guarantee Facility – CCS GF EIF 122 42
SME Guarantee Facility under CIP (SMEG 07) EIF 532 451
High-Growth and Innovative SME Equity Facility under CIP (GIF)
EIF 561 538
Guarantee Facility under the Western Balkans EDIF I EIF 22 22
Guarantee Facility under the Western Balkans EDIF II EIF 48 19
Enterprise Expansion Fund – ENEF under Western Balkans EIF 11 11
Enterprise Innovation Fund – ENIF under Western Balkans EIF 21 21
Green for Growth Fund (GGF) EIF 59 20
European Fund for Southeast Europe (EFSE) under Western Balkans
EIF 88 0
Global Energy Efficiency and Renewable Energy Fund (GEEREF)
EIF 81 80
Support to the Facility for FEMIP EIB 224 224
Total 11 506 7 263
(*) This amount represents the ceiling of the contribution from the EU budget to CEF financial instruments. At 31 December 2019, the EU contribution committed to this financial instrument is 755 million euros.
Source: ECA, based on Commission’s Draft general budget for the financial year 2020 – Working document Part X.
87

Chapter 3
Revenue
88

Contents
Paragraph
Introduction 3.1.-3.5. Brief description 3.2.-3.3.
Audit scope and approach 3.4.-3.5.
Regularity of transactions 3.6.
Examination of elements of internal control systems 3.7.-3.21. Persistent weaknesses exist in Member States’ collection of TOR 3.8.-3.10.
Important weaknesses in Member States’ controls to reduce the customs gap that require EU action 3.11.-3.15.
Resolving VAT reservations and TOR open points takes a lot of time 3.16.-3.18.
GNI multiannual verifications completed, but the impact of globalisation still not fully assessed 3.19.-3.21.
Annual activity reports 3.22.-3.23.
Conclusion and recommendations 3.24.-3.26. Conclusion 3.24.
Recommendations 3.25.-3.26.
Annexes Annex 3.1 — Results of transaction testing
Annex 3.2 — Main customs risks and types of customs controls
Annex 3.3 — Number of outstanding GNI reservations, VAT reservations and TOR open points by Member State at 31/12/2019
Annex 3.4 — Follow-up of previous recommendations related to revenue
89

Introduction 3.1. This chapter presents our findings related to revenue, which comprises both own resources and other revenue. Box 3.1 gives a breakdown of revenue in 2019.
Box 3.1
Revenue – 2019 breakdown(*)
Total revenue 2019(**): 163,9 billion euros (*) In line with the harmonised definition of underlying transactions (for details see Annex 1.1, paragraph 9). (**) This amount represents the EU’s actual budget revenue. The amount of 160,3 billion euros in the statement of financial performance is calculated using accrual-based accounting.
Source: 2019 consolidated accounts of the European Union.
Gross national income-based own resource105,5 (64 %)
Traditional own resources21,4 (13 %)
Value added tax-based own resource17,8 (11 %)
Contributions and refunds connected with EU agreements and programmes12,6 (8 %)
Interest on late payments and fines2,6 (2 %)
Other revenue4,0 (2 %)
163,9 billion euros
(billion euros)
90

Brief description
3.2. Most revenue (88 %) comes from the three categories of own resources:
(a) the gross national income-based (GNI-based) own resource provides 64 % of EU revenue, balancing the EU budget after revenue from all other sources has been calculated. Each Member State contributes proportionally, according to its GNI1;
(b) traditional own resources (TOR) provide 13 % of EU revenue. They comprise customs duties on imports collected by the Member States. The EU budget receives 80 % of the total amount; Member States retain the remaining 20 % to cover collection costs;
(c) the value added tax-based (VAT-based) own resource provides 11 % of EU revenue. Contributions under this own resource are calculated using a uniform rate2 applied to Member States’ harmonised VAT assessment bases.
3.3. Revenue also includes amounts received from other sources. The most significant of these sources are contributions and refunds connected with EU agreements and programmes (8 % of EU revenue), such as revenue relating to the clearance of the EAGF and EAFRD, and the participation of non-EU countries in research programmes.
1 The initial contribution is calculated on the basis of forecast GNI. Differences between the
forecast and final GNI are adjusted in subsequent years and reflected in the distribution of own resources between Member States, rather than the total amount collected.
2 A reduced VAT call rate of 0,15 % applies to Germany, the Netherlands and Sweden, compared with 0,3 % for the other Member States.
91

Audit scope and approach
3.4. Applying the audit approach and methods set out in Annex 1.1, we obtained assurance for our audit opinion on revenue by assessing the key systems selected, complemented by transaction testing. Our objective was to contribute to the overall statement of assurance as described in Annex 1.1. We examined the following in respect of 2019:
(a) a sample of 55 Commission recovery orders3, designed to be representative of all sources of revenue;
(b) the Commission’s systems for:
(i) ensuring that the Member States’ GNI and VAT data constitute an appropriate basis for the calculation and collection of own-resource contributions4
(ii) managing TOR and ensuring that Member States have effective systems for collecting and reporting the correct amounts of TOR and making them available
(iii) managing fines and penalties
(iv) calculating the amounts resulting from correction mechanisms;
(c) the systems for TOR accounting in three Member States (Belgium, Germany and Poland)5;
(d) the reliability of the information on regularity contained in DG BUDG and Eurostat’s annual activity reports.
3 A recovery order is a document in which the Commission records amounts it is owed.
4 Our starting point was the agreed GNI data and the harmonised VAT base prepared by Member States. We did not directly test the statistics and data produced by the Commission and Member States.
5 These three Member States were selected on the basis of both the size of their TOR contribution and our risk assessment.
92

3.5. Customs duties are at risk of either not being declared or being declared incorrectly to the national customs authorities by importers. The “customs gap”6, i.e. the evaded amounts not captured in Member States’ TOR accounting systems, does not fall within the scope of our audit opinion on revenue. However, since the customs gap may affect the amounts of duties established by Member States, this year we assessed the EU action taken to reduce the gap and mitigate the risk that TOR are not complete by:
(a) examining the results of the Commission’s TOR inspections of all Member States’ customs control strategies for tackling the risk of undervalued imports, and
(b) examining whether there are still limitations in the Member States’ procedures for identifying and selecting the riskiest importers for post-release audits7, as reported in our 2013 and 2014 annual reports8. The riskiest importers are those for whom the combined likelihood of irregularity and level of impact of such irregularity is highest9.
6 The difference between the theoretical import duty level that should be collected for the
economy as a whole and actual import duty collected.
7 A post-release audit involves broad examination of an economic operator’s business, processes, systems and internal controls, and a detailed assessment carried out by means of specific testing.
8 See paragraphs 2.13-2.14 of our 2013 annual report, and paragraphs 4.18-4.20 of our 2014 annual report.
9 See Article 5(7) of the Union Customs Code (Regulation (EU) No 952/2013 of the European Parliament and of the Council of 9 October 2013, OJ L 269, 10.10.2013, p. 1, as amended).
93

Regularity of transactions 3.6. This section presents our observations on the regularity of transactions. We have based our conclusion on the regularity of the revenue transactions underlying the EU accounts on both our assessment of the Commission’s systems for calculating and collecting revenue10 and our examination of a sample of 55 recovery orders, none of which was affected by a quantifiable error. Annex 3.1 provides an overview of the results of transaction testing.
10 See paragraph 9 in Annex 1.1.
94

Examination of elements of internal control systems 3.7. The observations on the systems examined do not affect our overall unmodified opinion on the regularity of EU revenue (see chapter 1). However, they do highlight persistent weaknesses in individual categories of own resources, including EU action to reduce the customs gap and mitigate the risk that TOR are not complete.
Persistent weaknesses exist in Member States’ collection of TOR
3.8. We visited three Member States (Belgium, Germany and Poland) to examine how they draw up their statements of duties collected and not yet collected11, as well as their procedures for collecting TOR owed to the EU budget (see Figure 3.1).
11 Council Regulation (EU, EURATOM) No 609/2014 of 26 May 2014 on the methods and
procedures for making available the traditional, VAT and GNI-based own resources and on the measures to meet cash requirements (OJ L 168, 7.6.2014, p. 39), Article 6 (3) and 6 (4), and Commission Implementing Decision (EU, Euratom) 2018/194 of 8 February 2018 establishing models for statements of accounts for entitlements to own resources and a form for reports on irrecoverable amounts corresponding to the entitlements to own resources pursuant to Council Regulation (EU, Euratom) No 609/2014 (OJ L 36, 9.2.2018, p. 20).
95

Figure 3.1 – The process of drawing up the statements of duties (collected and not yet collected) and their entry in the EU accounts and budget
Source: European Court of Auditors based on EU current legislation and rules.
3.9. We did not identify any significant problems in the drawing-up of the monthly statements of customs duties collected in the three Member States visited. As in previous years12, we noted weaknesses in the management of established duties not yet collected by national authorities13. In the Member States visited, we found in particular delays in notifying customs debts (in Poland), late enforcement of the recovery of such debts (in Belgium, Germany and Poland), and insufficient
12 See our annual reports since 2012, for example, paragraph 4.10 of our 2018 annual report,
paragraph 4.15 of our 2017 annual report, paragraph 4.15 of our 2016 annual report, etc.
13 We did not detect a material impact on the amounts recoverable from Member States reported in the consolidated accounts of the European Union.
In the scope of the Statement of Assurance
Member StatesEstablish, book in the accounts and
collect customs dutiesReport to the Commission
Economic operatorsPresent import declarations to national customs authorities
Pay any duties requiredImport goods into the EU market
Monthly statementof duties collected
Quarterly statementof duties not yet collected
Member StatesPay 80 % of duties collected (TOR)
into the EU budget
Member StatesTake all necessary measures to ensure
debt recoveryManage duties not yet collected
EU accountsEntered in the accounts as
revenue to be received (receivables)
EU accounts and budgetEntered in the accounts as
revenue receivedContributed to the annual EU
budget
96

documentation to confirm the correctness of duties booked in the accounts (in Germany).
3.10. The Commission also continued to detect and report shortcomings in the Member States’ management of duties not yet collected, as reported in 15 of the 27 TOR inspection reports it issued in 2019. The findings in 10 of these 15 reports were classified as systematic in nature. Last year14 we recommended that the Commission improve risk assessment in the context of planning its inspections so as to ensure proper coverage of the highest-risk areas. Implementation of this recommendation is underway.
Important weaknesses in Member States’ controls to reduce the customs gap that require EU action
3.11. The Commission’s TOR inspections and our previous work relating to EU action taken to reduce the customs gap (see paragraph 3.5) highlighted two main weaknesses. One concerns the lack of EU-wide harmonisation of the performance of customs controls for mitigating the risk of undervalued imports throughout the Customs Union. The other relates to Member States not being able to identify the riskiest economic operators at EU level for post-release audits.
3.12. In our 2017 annual report15, we reported that the Commission had launched an infringement procedure16 against the United Kingdom for not having taken adequate measures to mitigate the risk of undervaluation of textiles and shoes imported from China. The Commission estimated the TOR losses at 2,1 billion euros17. As the United Kingdom refused to cover the estimated losses, the Commission referred the case to the Court of Justice in March 2019. The proceedings are underway (see paragraph 3.23).
14 See recommendation 4.1 in our 2018 annual report.
15 See paragraph 4.17 of our 2017 annual report.
16 This is the main enforcement action that the Commission can take when Member States do not apply EU law.
17 The estimated TOR losses claimed from the United Kingdom, together with the estimated late-payment interest (totalling 3,2 billion euros), are booked as receivables in the 2019 consolidated accounts of the European Union.
97

3.13. From 2018 the Commission carried out TOR inspections of the customs control strategy for tackling the risk of undervalued imports in all Member States. The results highlighted weaknesses in and differences between the various control strategies, and indicated that the protection of the EU budget was not adequately assured in certain Member States.
3.14. According to the Commission’s assessment, 24 of the 28 Member States had partially satisfactory or unsatisfactory control strategies for targeting the undervaluation risks. After seven follow-up inspections carried out in 2019, the situation had not improved significantly for most of the Member States inspected (see Table 3.1). This assessment will be reviewed taking account of the results of the follow-up inspections performed in 2020. The Commission has yet to quantify the potential TOR losses. In the three Member States we visited, action was being taken to address the Commission’s findings.
Table 3.1 – The Commission’s assessment of Member States’ control strategies for tackling the risk of undervalued imports
Source: DG BUDG TOR inspection reports.
3.15. We also found that action to identify and select the riskiest importers for post-release audits is limited across the Customs Union because there is still no EU-wide database covering all imports effected by economic operators. Despite the progress noted, the observations we have reported in previous years have not yet been fully addressed (see Box 3.2).
Initial assessmentAssessment after seven follow-up inspections
Number of Member States Number of Member StatesGenerally satisfactory 4 5Partly satisfactory 15 16Not satisfactory 9 7
28 28
Assessment
98

Box 3.2
Continuous gap in the customs control system across the EU
Within the Customs Union, economic operators may import goods into the EU market through one or more Member States, irrespective of where they are headquartered (see Annex 3.2).
In our 2013 and 2014 annual reports, we concluded that the riskiest importers may not be selected and certain importers may never be inspected in post-release audits. This was due mainly to the lack of an EU-wide database providing information on imports by economic operator at EU level. According to the Commission, this gap in the customs control system will disappear only when the new customs IT system “Surveillance III” is operational (January 2023).
Until then, the process at national level for identifying and selecting the riskiest importers for post-release audits cannot effectively capture operators importing goods into Member States other than the one in which they are headquartered. We confirmed this limitation in the three Member States visited. The Commission can play a key role in identifying such importers by collecting and analysing relevant import data at EU level, and sharing the results of its analysis with Member States.
As a result of this limitation, customs duties may be evaded. There are no recent data on the volume of imports not covered by Member States in their audit population. The latest available information emanates from the Commission’s survey covering 2015 data. It has estimated that 20 % of total imports into the EU (283,5 billion euros) may be omitted from the post-release audit population in Member States.
Resolving VAT reservations and TOR open points takes a lot of time
3.16. Figure 3.2 shows the process of the Commission’s verification of the VAT base calculation and of TOR, and provides an overview of the outstanding reservations and open points set for weaknesses detected (see Annex 3.3). We examined VAT reservations that had kept the VAT base calculation open for a period dating back 10 or more years18, and TOR points that had remained open for more than five years from the time of the Commission’s inspection. Of the total, 15 % of VAT reservations and 34 % of TOR open points were long-outstanding.
18 A VAT reservation is set only to cover years that will become time-barred (> N-4). The
calculation of the VAT base for the four most recent years is open for changes by default.
99

Figure 3.2 – The process of setting VAT reservations and TOR open points
Source: European Court of Auditors based on the Commission data.
3.17. We reviewed the management of long-outstanding VAT reservations set by the Commission (eight out of 15), and found that five of them related to infringement procedures against Member States on the grounds of possible non-compliance with the VAT Directive19. We noted that the procedures took a long time due to lengthy dialogue between the Commission and Member States. The financial impact of three of the eight cases examined, for which reservations had been set more than seven years previously, was not yet known, and in two cases, where reservations had been set over six years earlier, the impact was only partially known and not yet confirmed by the Commission.
19 Council Directive 2006/112/EC of 28 November 2006 on the common system of value
added tax (OJ L 347, 11.12.2006, p. 1).
Member StatesEstablish and collect customs duties (80 % of which are TOR)Calculate harmonised VAT base (VAT-based own resources)
CommissionUses the information and data provided by Member States to calculate the
contributions to the EU budgetPerforms inspections and verifications in Member States to validate the accuracy
of the information and data provided
CommissionWhere shortcomings are detected, sets VAT reservations or TOR open points
until the issues have been resolved:
2019
Own resourceReservations /
open pointsLong-outstanding
TOR 356 122 (34 %)VAT-based 95 15 (15 %)
100

3.18. The 54 long-outstanding TOR open points we reviewed out of 122 revealed that the Commission’s follow-up and closing of such points took excessive time (see Box 3.3). We reported on these problems in our 2018 annual report20. While the issue persists, we noted that the number of TOR open points had decreased. We also found that the Commission had not set up a follow-up system prioritising TOR open points according to significance (in terms of either financial impact, or systemic significance in the case of non-financial shortcomings). In addition, the internal procedures did not set deadlines for the follow-up of these points.
Box 3.3
Weaknesses in the follow-up of TOR shortcomings detected in Member States
In 2019, the Commission closed 15 of the 54 long-outstanding TOR open points we had selected. In seven of the 15 cases, it had assessed and closed the point between 10 months and over two years after the Member State had fully addressed the shortcoming. This distorts the overview of TOR open points not yet addressed.
In the majority of the sample cases that remain open, we observed that the Commission took between one and four years to follow them up, recorded the amounts due late in the EU accounting system, and deferred the notification of late-payment interest to Member States.
We noted that four Member States disagreed with the Commission’s position in the case of five of the TOR open points examined, but the Commission had still not decided whether to launch an infringement procedure. These include a case relating to Greece detected in 2011 during the follow-up of the TOR inspection report of 2002. The other cases relate to shortcomings detected in 2014 in Czechia, Greece and the Netherlands.
20 See paragraph 4.16 of our 2018 annual report.
101

GNI multiannual verifications completed, but the impact of globalisation still not fully assessed
3.19. Within the GNI multiannual verification cycle, the Commission examines whether the procedures Member States use to compile their national accounts comply with ESA 201021, and whether GNI data are comparable, reliable and exhaustive22. To allow GNI data to be adjusted and verified beyond the regulatory four-year deadline23, the Commission set a reservation for all the data of every Member State from 201024 onwards. We found that this verification process had been completed by the end of 2019.
3.20. The closure of the verification cycle gave rise to new, more specific reservations. In April 2020, the Commission set GNI reservations25 for selected compilation procedures in the Member States that called for improvement. One such reservation allows the GNI data of all Member States to be revised to incorporate a more accurate estimation of the research and development (R&D) assets of multinational companies, an estimation that is complicated by globalisation and the fact that such assets are easily shifted across borders. The Commission, together with Member States, will continue up until September 2022 to assess whether the R&D assets of multinational companies are properly valued in the Member States’ national
21 ESA 2010 (European system of national and regional accounts) is the EU’s internationally
compatible accounting framework. It is used to create a systematic and detailed description of an economy. See Regulation (EU) No 549/2013 of the European Parliament and of the Council of 21 May 2013 on the European system of national and regional accounts in the European Union (OJ L 174, 26.6.2013, p. 1).
22 See Article 5 of Council Regulation (EC, Euratom) No 1287/2003 of 15 July 2013 on the harmonisation of gross national income at market prices (GNI Regulation) (OJ L 181, 19.7.2003, p. 1). This was replaced by Regulation (EU) No 2019/516 of the European Parliament and of the Council of 19 March 2019 on the harmonisation of gross national income at market prices and repealing Council Directive 89/130/EEC, Euratom, and Council Regulation (EC, Euratom) No 1287/2003 (GNI Regulation), in particular Article 5(2) thereof (OJ L 91, 29.3.2019, p. 19).
23 The EU legislation on the calculation of own resources allows for the adjustment of GNI data for a given financial year up to the year n+4. This four-year rule may be extended in cases where the quality of data needs to be improved.
24 Except for Croatia, where the period over which data remain open starts from 2013.
25 Transaction-specific and transversal-specific reservations replacing the process-specific reservations. For general reservation, see paragraph 3.21.
102

accounts. Consequently, our previous recommendations on this issue have not yet been fully implemented (see Annex 3.4).
3.21. The Commission has not yet lifted the general reservation relating to France due to the unsatisfactory quality of the description in its GNI Inventory of the compilation procedures for GNI data from 2010 onwards. We reported on this last year26. We have noted that France provided its revised GNI Inventory in March 2020, thereby allowing the Commission to begin its verification of the French GNI. The impact of this verification on the calculation of the future contributions of France and the other Member States is not yet known.
26 See paragraph 4.18 of our 2018 annual report.
103
Annual activity reports 3.22. Overall, the information provided in the 2019 annual activity reports published by DG BUDG and Eurostat corroborated our findings and conclusions.
3.23. For the fourth year in a row, DG BUDG has maintained the reservation that the TOR amounts transferred to the EU budget are inaccurate owing to undervaluation of textiles and shoes imported from China. The reservation was first set in 2016, when TOR losses attributable to the United Kingdom were quantified (see paragraph 3.12), and then extended to other Member States in 2018, without quantification.
104
Conclusion and recommendations
Conclusion
3.24. The overall audit evidence indicates that the level of error in revenue was not material. The revenue-related systems we examined were, overall, effective. The key internal TOR controls we assessed at the Commission (see paragraphs 3.10 and 3.18) and in certain Member States (see paragraphs 3.8-3.9) were partially effective. We also found important weaknesses in Member States’ controls to reduce the customs gap that require EU action (see paragraphs 3.11-3.15).
Recommendations
3.25. Annex 3.4 shows the findings of our follow-up review of the two recommendations we made in our 2016 annual report. The Commission has implemented both of them in most respects.
3.26. Based on this review, and our findings and conclusions in respect of 2019, we recommend that the Commission:
Recommendation 3.1 – Customs duties (TOR) not captured
Provide Member States with regular support in selecting the riskiest importers for post-release audits (see paragraph 3.15) by:
(a) collecting and analysing relevant import data at EU level, and sharing the results of its analysis with Member States;
(b) once Surveillance III becomes operational, providing guidance on how to carry out data analysis within this new system.
Timeframe: (a) by the end of 2021, (b) June 2023
105

Recommendation 3.2 – TOR open points
Revise its procedures by:
(a) establishing a system for monitoring TOR open points based on quantitative and qualitative criteria that rank shortcomings detected in Member States in order of priority, and
(b) setting deadlines for Member States to address such shortcomings, and for follow-up actions, including the calculation of late-payment interest and the recovery of amounts to be made available to the EU budget (see paragraph 3.18).
Timeframe: by the end of 2021
106

Annexes
Annex 3.1 — Results of transaction testing
2019 2018
SIZE AND STRUCTURE OF THE SAMPLE
Total transactions: 55 55
ESTIMATED IMPACT OF QUANTIFIABLE ERRORS
Estimated level of error: Free from material
error
Free from material
error
107

Annex 3.2 — Main customs risks and types of customs controls
* Member States’ annual reports on traditional own resources, financial year 2018 (Article 6(1) of Regulation No 608/2014).
EU customs control system
At Commission levelAt Member State level
Economic operatorsPresent import declarations to any of 28 Member States’
national customs authorities
Main customs risks
Incorrect description or classification of
goods
Incorrect value
Incorrect origin
Post-release controls:- Common Risk Management Framework (CRMF)- Customs Audit Guide (non-binding)- OLAF reports, mutual assistance communications
Release controls:- Common Risk Management Framework (CRMF) - Customs Risk Management System (CRMS)
Release controls:- physical - documentary
Post-release controls:
- post-release audits- reassessment/ monitoring audit- import declaration revision- other post-release controls
Fraud and irregularities detected (2018)*
Method of detection Fraud (% of all cases)
Irregularities (% of all cases)
Release controls 25 % 14 %
Post-release controls 19 % 50 %
Anti-fraud services 46 % 4 %
Other 10 % 32 %
108

Annex 3.3 — Number of outstanding GNI reservations, VAT reservations and TOR open points by Member State at 31/12/2019
Source: European Court of Auditors based on the Commission data27.
27 The GNI-reservation figures represent only transaction-specific reservations (covering the
compilation of specific national accounts’ components in a Member State). There are also GNI process-specific reservations outstanding in all Member States, covering the data compilation from 2010 onwards (except for Croatia, where they cover the period from 2013 onwards), as well as seven transversal-specific reservations relating to the United Kingdom, and one general reservation for France.
3956
3620
2718
1717
138
1416
712
1010
42
6555
24
210
92
61
55
46
1152
105
31
28
2111
21
2
18
4
1
4
1
1
0 10 20 30 40 50 60 70
United KingdomNetherlands
BelgiumGreeceFrance
SpainDenmarkRomaniaGermany
IrelandIta ly
PortugalAustriaPoland
SlovakiaHungary
CroatiaLuxembourg
Fin landCzechiaSweden
CyprusBulgaria
MaltaLatvia
SloveniaEstonia
Li thuania
TOR open points VAT reservations GNI reservations
TOR open points VAT reservations GNI reservations TOTAL 31/12/2019 356 95 29TOTAL 31/12/2018 402 96 9
109

Annex 3.4 — Follow-up of previous recommendations related to revenue
Year ECA recommendation
ECA's analysis of the progress made
Fully implemented
Being implemented Not
implemented Not
applicable Insufficient
evidence In most respects
In some respects
2016
The Commission should: Recommendation 1: analyse, in cooperation with Member States, all the potential implications of multinational activities on the estimation of GNI, and provide guidance to them on how to deal with these activities when compiling national accounts.
X
Recommendation 2: confirm, during the ongoing GNI verification cycle, that R&D assets have been correctly captured in Member States’ national accounts, paying particular attention to the valuation of R&D assets and to residency criteria in cases where multinational activities have been relocated.
X
Notes on our analysis of the progress made:
Recommendation 1: The Commission took appropriate action to analyse all the potential implications of multinational enterprise activities on the estimation of GNI by means of a number of task forces, working groups and a pilot exercise. However, the Commission still needs to issue relevant guidelines to assist Member States in carrying out the work connected with the transversal reservation on globalisation.
Recommendation 2: The Commission set the transversal reservation on globalisation with an implementation deadline of September 2022 to confirm that Member States record research and development (R&D) assets in their national accounts correctly. The transversal-specific reservation will keep Member States' GNI data open for revision until the Commission is able to confirm that Member States have made the necessary adjustments in their national accounts to reflect the impact of the activities of multinational enterprises.
110

Chapter 4
Competitiveness for growth and jobs – MFF heading 1a
111

Contents
Paragraph
Introduction 4.1.-4.5. Brief description 4.2.-4.4.
Audit scope and approach 4.5.
Regularity of transactions 4.6.-4.21. Personnel costs continue to constitute the principal source of error, notably in research expenditure 4.11.-4.15.
Private entities, in particular SMEs, are more prone to error 4.16.
Ineligibility of all costs declared by the beneficiary in the audited period 4.17.-4.19.
Frequent errors in other direct costs 4.20.
High frequency of errors in exchange rates 4.21.
Review of the regularity information provided by auditees 4.22.-4.30.
Annual activity reports and other governance arrangements 4.31.-4.35.
Conclusion and recommendations 4.36.-4.40. Conclusion 4.36.-4.38.
Recommendations 4.39.-4.40.
Annexes Annex 4.1 — Results of transaction testing for Competitiveness for growth and jobs
Annex 4.2 — Follow-up of previous recommendations regarding 'COMPETITIVENESS FOR GROWTH AND JOBS'
112
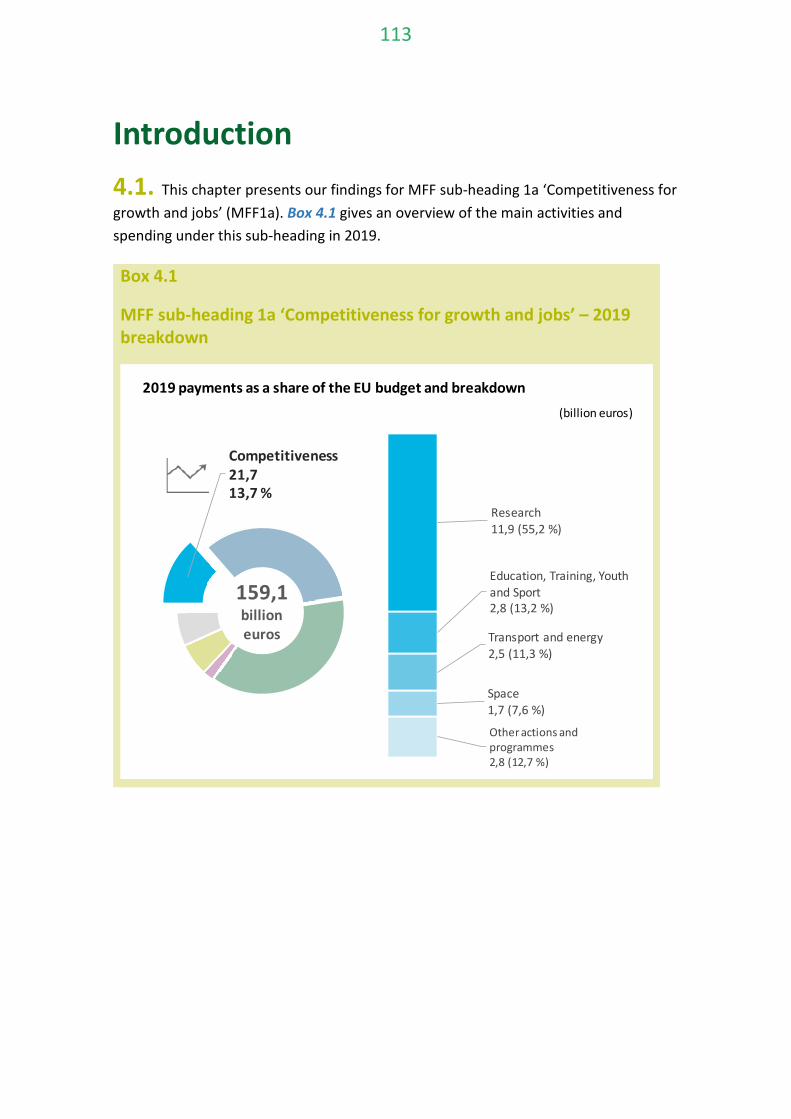
Introduction 4.1. This chapter presents our findings for MFF sub-heading 1a ‘Competitiveness for growth and jobs’ (MFF1a). Box 4.1 gives an overview of the main activities and spending under this sub-heading in 2019.
Box 4.1
MFF sub-heading 1a ‘Competitiveness for growth and jobs’ – 2019 breakdown
Other actions and programmes 2,8 (12,7 %)
Space 1,7 (7,6 %)
Transport and energy 2,5 (11,3 %)
Education, Training, Youth and Sport 2,8 (13,2 %)
Research 11,9 (55,2 %)
Competitiveness 21,7 13,7 %
2019 payments as a share of the EU budget and breakdown(billion euros)
159,1 billion euros
113
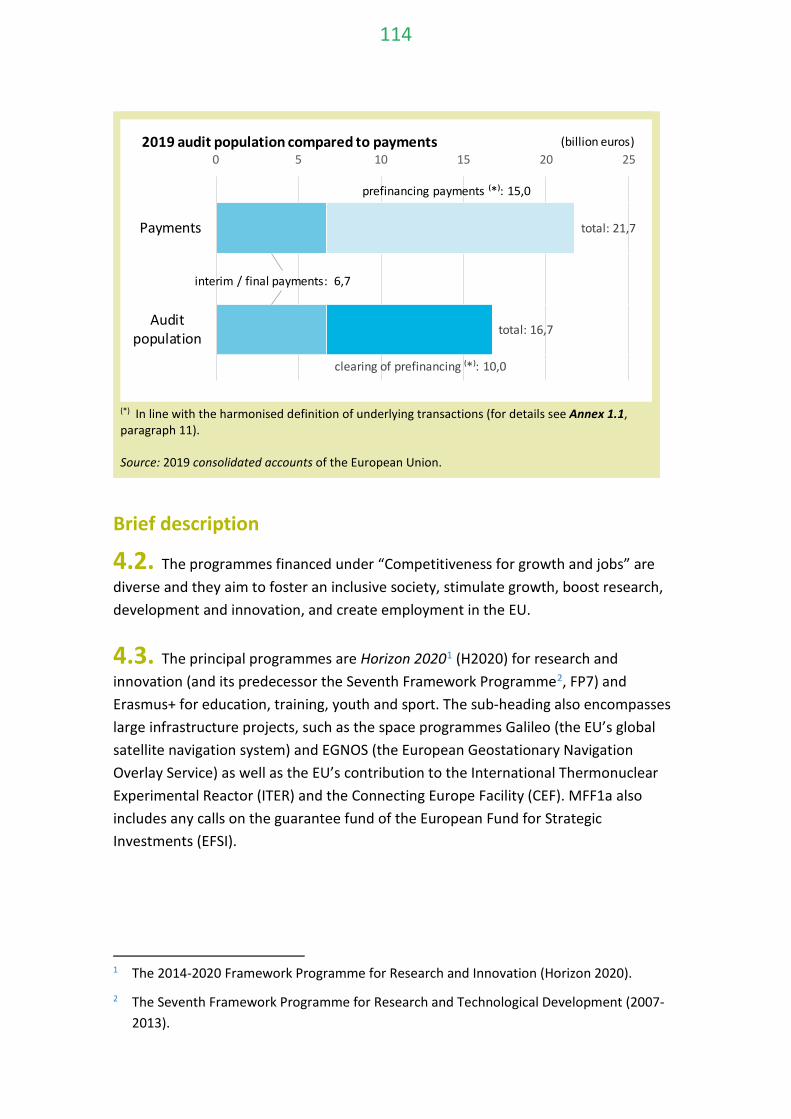
(*) In line with the harmonised definition of underlying transactions (for details see Annex 1.1, paragraph 11).
Source: 2019 consolidated accounts of the European Union.
Brief description
4.2. The programmes financed under “Competitiveness for growth and jobs” are diverse and they aim to foster an inclusive society, stimulate growth, boost research, development and innovation, and create employment in the EU.
4.3. The principal programmes are Horizon 20201 (H2020) for research and innovation (and its predecessor the Seventh Framework Programme2, FP7) and Erasmus+ for education, training, youth and sport. The sub-heading also encompasses large infrastructure projects, such as the space programmes Galileo (the EU’s global satellite navigation system) and EGNOS (the European Geostationary Navigation Overlay Service) as well as the EU’s contribution to the International Thermonuclear Experimental Reactor (ITER) and the Connecting Europe Facility (CEF). MFF1a also includes any calls on the guarantee fund of the European Fund for Strategic Investments (EFSI).
1 The 2014-2020 Framework Programme for Research and Innovation (Horizon 2020).
2 The Seventh Framework Programme for Research and Technological Development (2007-2013).
interim / final …interim / final payments: 6,7
prefinancing payments ⁽*⁾: 15,0
clearing of prefinancing ⁽*⁾: 10,0
total: 16,7
total: 21,7
0 5 10 15 20 25
Auditpopulation
Payments
(billion euros)2019 audit population compared to payments
114

4.4. Most spending on these programmes is directly managed by the Commission, including through Executive Agencies, and takes the form of grants to public or private beneficiaries participating in projects. The Commission provides advances to beneficiaries upon signature of a grant agreement or financing decision and reimburses the EU-funded costs they report, net of the advances. In the case of Erasmus+, expenditure is mostly managed by national agencies on behalf of the Commission (around 80 % of grants).
Audit scope and approach
4.5. Applying the audit approach and methods set out in Annex 1.1, we examined the following for this MFF sub-heading in respect of 2019:
(a) a sample of 130 transactions, in line with paragraph 9 of Annex 1.1. The sample was designed to be representative of the full range of spending under this MFF sub-heading3. The sample consisted of 80 transactions in the area of research and innovation (70 for Horizon 2020 and 10 for FP7) and 50 under other programmes and activities, notably Erasmus+, CEF and space programmes. The beneficiaries audited were located in 19 Member States and four non-EU countries. Our objective was to provide a specific assessment for this MFF sub-heading and to contribute to the overall statement of assurance as described in Annex 1.1.
(b) selected systems, which concerned the reliability of the Commission’s ex post audit work on the regularity of transactions under H2020. We performed this work in view of our strategy of applying an attestation approach in the future. For this purpose we selected six audits carried out by the Commission’s Common Audit Service (CAS) and 14 that the Commission had contracted out to two private external auditors. Although we did not include the results of this work in our transaction testing of 2019 spending, we used this exercise to establish whether we could rely on the results of these audits.
(c) the regularity information given in the annual activity reports (AARs) of DG RTD, DG EAC and DG GROW, and its inclusion in the Commission’s Annual Management and Performance Report (AMPR).
3 This sample was divided into two main strata on the basis of our assessment of the risk to
legality and regularity. The first stratum included high risk areas (notably FP7 and H2020) where audit coverage was intensified.
115

Regularity of transactions 4.6. Annex 4.1 provides an overview of the results of transaction testing. Of the 130transactions examined, 51 (39 %) contained errors. Based on the 28 errors we have quantified, we estimate the level of error to be 4,0 %4. Box 4.2 gives a breakdown of our estimated level of error for 2019, distinguishing between research and other transactions.
Box 4.2
Breakdown of the estimated level of error by error type
Source: European Court of Auditors.
4 We base our calculation of error on a representative sample. The figure quoted is the best estimate. We have 95 % confidence that the estimated level of error in the population lies between 1,5 % and 6,4 % (the lower and upper error limits respectively).
3 %
15 %
60 %
2 %
2 %
1 %
16 %
1 %
0 % 10 % 20 % 30 % 40 % 50 % 60 %
Modification/incorrect application of theselection/award criteria
Ineligible indirect and subcontracting costs
Ineligible other direct costs (VAT, travel,equipment)
Unlawful/discriminatory selection/award criteria
Ineligible direct personnel costs
Research Other
78 %
22 %
116

4.7. FP7 and H2020 spending remains higher-risk and the main source of errors that we detect. We found quantifiable errors relating to ineligible costs in 24 of the 80 research and innovation transactions in the sample (three out of 10 under FP7 and 21 out of 70 under H2020. This represents 78 % of our estimated level of error for this sub-heading in 2019.
4.8. We have previously reported on the improvements in the programme design and the Commission’s control strategy in respect of H20205. Simplification has made life easier for beneficiaries and contributed to reducing the risk of error, for example by fixing a general flat rate for indirect costs. Our results however show that research spending is still affected by material error. The Commission itself estimates that the H2020 error rate remains above the 2 % materiality threshold (see paragraph 4.32).
4.9. In the case of other programmes and activities we detected quantifiable errors in four of the 50 transactions in the sample. The errors concerned projects under the Erasmus+ and CEF programmes and consisted of:
(a) beneficiaries using the incorrect unit cost rate and declaring ineligible costs (Erasmus+);
(b) two cases of irregularities in procurement procedures (CEF), and
(c) ineligible subcontracting (CEF).
5 For example in paragraph 5.13 of the 2018 annual report and in special report 28/2018:
“The majority of simplification measures brought into Horizon 2020 have made life easier for beneficiaries, but opportunities to improve still exist”.
117

4.10. The performance of the Commission’s control procedures is mixed. It had applied corrective measures that directly affected eight of the transactions in our sample. These measures were relevant to our calculations, as they reduced our estimated level of error for this chapter by 0,65 percentage points. In eight cases of quantifiable error made by final beneficiaries, the control procedures put in place by the Commission6 failed to prevent, or to detect and correct, the error before accepting the expenditure. Had the Commission made proper use of all the information at its disposal, the estimated level of error for this chapter would have been 1,1 percentage points lower7.
Personnel costs continue to constitute the principal source of error, notably in research expenditure
4.11. The rules for declaring personnel costs under H2020 are complex despite efforts at simplification, and their calculation remains a major source of error in the cost claims. As we reported in the 2018 annual report8 and our special report 28/2018, the methodology for calculating personnel costs has become more complex under H2020 in some respects and this has increased the risk of error. Of the 24 transactions affected by quantifiable errors in our sample of research transactions, 23 involved incorrect application of the methodology for calculating personnel costs. In almost all of these 23 cases, the hourly (or monthly) rate had been calculated incorrectly.
4.12. In the 2018 annual report9 we reported that the rule requiring the use of the annual hourly rate from the most recent closed financial year when declaring costs relating to the subsequent (non-closed) year of reporting can lead to errors. We found that this was again evident in 2019.
4.13. An example of these two types of errors, occurring in the same audited project, can be found in Box 4.3.
6 Certificates on financial statements or ex post audits. We continue to find weaknesses in
both these control procedures. Five of these eight cases concerned undetected errors in H2020 personnel costs.
7 In four of these cases the Commission was not aware of the error as the independent auditors did not detect them.
8 Paragraph 5.16.
9 Paragraph 5.17.
118

Box 4.3
Example of an error in the calculation of the hourly rate and an example of the non-use of the most recent closed financial year
Error in the calculation of the hourly rate
In a H2020 project in Germany, in order to calculate the hourly rate the beneficiary used the annual gross salary, multiplied by a statistical percentage covering average social security contributions. This average percentage is communicated by the national statistical office. The hourly rate is thus not based on costs actually incurred, which is a requirement.
Non-use of the most recent closed financial year
In the same project, the beneficiary used an hourly rate not based on the most recent closed financial year (2018) but on 2019, in order to calculate the personnel costs of a staff member.
Together with other personnel costs errors, the gross error was 13 400 euros in this case
4.14. Another (albeit less frequent) error was the failure to respect the “double-ceiling” rule. This rule stipulates that the total number of hours worked that are declared in respect of EU and Euratom grants for any person for the year may not exceed the number of annual productive hours used to calculate the hourly rate. Moreover the total amount of personnel costs declared (for reimbursement as actual costs) for any person for the year may not exceed the total personnel costs recorded in the beneficiary’s accounts for the person concerned for that same year. Box 4.4 describes one such example.
Box 4.4
Example of a failure to respect the double-ceiling rule
In an H2020 project in the Netherlands the beneficiary claimed personnel costs for 1 742 hours worked by a member of staff on the project. This is more than the standard number of annual productive hours used to calculate the hourly rate (1 650 hours) and therefore does not comply with the double-ceiling rule and the 92 surplus hours are therefore ineligible.
119

4.15. We continue to find weaknesses in time recording. Although we did not quantify the error in such cases, the poor quality of the systems increases the risk that the underlying records of hours worked on the funded projects are unreliable.
Private entities, in particular SMEs, are more prone to error
4.16. One of the strategies for boosting European research is to increase private-sector participation, especially by start-up companies and SMEs. More than half the quantifiable errors found (17 out of 28) involved funding for private beneficiaries, even though the transactions in question accounted for just 42 (32 %) of the 130 transactions in the sample. SMEs made up 12 % of the sample but accounted for 21 % of the quantifiable errors. These results indicate that SMEs are more error-prone than other beneficiaries, as is also confirmed by the Commission’s audits and in our previous annual reports.
Ineligibility of all costs declared by the beneficiary in the audited period
4.17. This year we detected errors in four H2020 projects where we call into question the eligibility of all costs declared by the beneficiary in respect of the audited period.
4.18. In two cases the beneficiary was the 100 %-owned subsidiary of another company, which paid and accounted for salaries as well as all other costs. All personnel involved in the project were employed by either the parent company or another subsidiary. Contrary to the Horizon 2020 rules which provide that costs have to be incurred by the beneficiary and recorded in the beneficiary’s accounting system, this was not the case and we consider all costs declared by the beneficiary in respect of the audited period to be ineligible. In both cases the beneficiaries were insufficiently familiar with the H2020 rules.
120

4.19. For another case a grant was awarded to a research institute which was not entitled to award doctoral degrees. This was a basic eligibility condition that had been explicitly stipulated to potential beneficiaries of that specific call for proposals. In the fourth case a grant was paid in respect of a researcher who was employed part-time. Part-time work is only allowed for personal or family reasons, for a limited period of time and requires the approval of the responsible EU Agency. None of these conditions were met in this case.
Frequent errors in other direct costs
4.20. As in previous years, we detected errors in other direct costs relating to research expenditure. Such errors included, notably, the reimbursement of travel costs either unrelated to the audited EU project or not actually incurred.
High frequency of errors in exchange rates
4.21. 22 of the research projects we audited had been conducted in currencies other than the euro. We found that the exchange rate applied in ten of these projects was not the one stipulated in the rules. The financial effect of such errors is not in itself material, but their frequency demonstrates a lack of awareness of the rules.
121

Review of the regularity information provided by auditees 4.22. The Commission uses the results of its ex post audit work as a basis for calculating the amount at risk at payment. Around 20 % of ex post audits of the entire H2020 family are carried out by DG RTD’s Common Audit Service (CAS), and 80 % on its behalf by private audit firms10 selected under a tendering procedure. The CAS draws its representative sample of approved cost statements for ex post audit at intervals of around 18 months.
4.23. For the 2018 annual report we reviewed a random sample of 20 ex post audit files from the Commission’s representative sample of H2020 payments. We performed this work as part of our Strategy 2018-2020 in order to assess the feasibility of the attestation engagement approach in MFF sub-heading 1a. Our review led us to conclude that we could not rely on the audit conclusions in 10 of the 20 audit files11.
4.24. For 2019 we again reviewed a random sample of 20 ex post audit files which had been closed between 1 May 2018 and 1 September 2019. These covered Commission payments made in the period from January 2014 to February 2018. Thus the scope of these latest available ex post audits did not include any payments of 2019.
4.25. As part of our assessment we reviewed the audit working papers and supporting documentation at the premises of both the CAS and the private audit firms. Based on this review, we identified 10 audits where we had to perform additional audit procedures, mainly because of the need to obtain additional supporting documentation and/or due to discrepancies in the working papers that prevented us from confirming the audit conclusions. We carried out these additional audit procedures by means of either desk review (additional documents requested from the beneficiaries in five cases) or an audit visit to the beneficiary’s premises (five cases).
10 Using the same CAS audit methodology.
11 Paragraph 5.33.
122

4.26. We found weaknesses in the documentation of audit work done, sampling consistency and reporting, as well as in the quality of the audit procedures in some of the files reviewed. For example, we found ineligible amounts that the auditors had not detected because of insufficient testing in their audit, mainly in respect of personnel costs. We also noted erroneous interpretation of the double-ceiling rule and errors in the underlying calculation of personnel costs that had not been detected.
4.27. Although in some cases the financial impact was not material, we were unable to rely on the audit conclusions in seven of the 20 audit files in the sample. Thus, cumulatively with our work last year (paragraph 4.23 above), we are unable to rely on the conclusions in 17 out of the 40 audits reviewed.
4.28. In the 2018 annual report we reported an issue relating to the Commission’s methodology for calculating the error rate for H2020, which resulted in its systematic understatement12. The ex post audits aim for maximum coverage of accepted costs, but rarely cover all costs. The error rate was calculated as a share of all accepted costs, rather than the amount actually audited. This means that the denominator in the error calculation was higher, so the error rate was understated.
4.29. The Commission has taken steps to address this issue. Following its analysis of the 40 ex post audits we reviewed as part of our assessment, it recalculated the error rates. As a result the representative error rate reported for H2020 was corrected with an increase of 0,34 percentage points.
4.30. We welcome this prompt remedial action and the Commission’s intention to address the matter further. However, this correction does not take into account the issues described in paragraphs 4.23 and 4.26-4.27 above and the error rate is still understated. Moreover, it is not possible to determine the level of significance of its impact, as some of the errors cannot be fully quantified.
12 Paragraph 5.34.
123

Annual activity reports and other governance arrangements 4.31. The AARs we examined13 gave a fair assessment of the respective DGs’ financial management in relation to the regularity of underlying transactions.
4.32. DG RTD’s AAR includes a reservation for payments in reimbursement of cost claims under FP714 because the cumulative residual error rate is above 2 %15. DG GROW expressed no such reservation16, because it no longer makes a material volume of FP7 payments. In the case of H2020, based on its own audits the Commission reported an expected representative error rate of 3,3 %17 and a residual error rate of 2,15 %. These audits only covered payments made over the period 2014-2018.
4.33. In the 2018 annual report we reported that the rate of implementation for corrections of systemic FP7 errors was just 57,6 %18. This rate had increased to 72 % by the end of 2019, exceeding their own target of 70 %. This is a good achievement. The AAR also states that the resources required to deal with the remaining 1 904 cases “should not be underestimated”.
13 See paragraph 4.5 (c).
14 The reservation means that the Director General’s declaration of assurance is qualified as the effectiveness of the control systems in FP7 does not reach the expected level.
15 3,52 %.
16 Based on a de minimis threshold for reservations.
17 Taking into account the results of draft audit reports.
18 Paragraph 5.29.
124

4.34. At the end of 2019 DG RTD had 13 open IAS recommendations, the implementation of three of which was overdue. This is an improvement compared to the previous year when there had been 26 open recommendations including nine overdue. Three of the open recommendations and one of the overdue had been classified as ‘very important’. The overdue ‘very important’ recommendation, for which a new target implementation date of 30 June 2020 had been fixed, concerned the monitoring of beneficiaries’ compliance with contractual obligations, and reporting requirements on the dissemination and exploitation of project results.
4.35. We reviewed the information in the Commission’s 2019 AMPR regarding the estimated risk at payment in the policy areas under MFF1a. The Commission does not calculate a single rate for the sub-heading but two – one for Research, Industry, Space, Energy and Transport (2,0 %), and another for Other Internal Policies (1,0 %). Based on the Commission’s figures, we calculated that the rate for MFF1a as a whole would be 1,7 %. This percentage is below materiality and at the lower end of our range of estimated the level of error. However, in our view, despite the measures already applied by the Commission this rate is still understated, owing to the issues outlined in paragraphs 4.23 and 4.26-4.27 above.
125

Conclusion and recommendations
Conclusion
4.36. The overall audit evidence we obtained and have presented in this chapter indicates that the level of error in spending on ‘Competitiveness for growth and jobs’ as a whole was material. For this MFF sub-heading, our testing of transactions produced an estimated overall level of error of 4,0 % (see Annex 4.1). This is close to the rates we found in 2015, 2016 and 2017. Our results indicate that the level of error was persistently high for research and innovation expenditure which was the main source of error, and much lower for the rest of the sub-heading.
4.37. Despite the simplifications introduced for H2020, the rules for declaring personnel costs mean that the error rate is still above materiality.
4.38. The estimated risk at payment presented in the AMPR (1,7 %, as recalculated by us) is at the lower end of our range of estimated level of error and is below materiality.
Recommendations
4.39. Annex 4.2 shows the findings of our follow-up review of the three recommendations we made in our 2016 annual report. The Commission had implemented two recommendations in full, while one had been implemented in most respects.
4.40. Based on this review and our findings and conclusions for 2019, we recommend that the Commission:
Recommendation 4.1
Conduct more targeted checks on SMEs’ cost claims and enhance its information campaign regarding H2020 funding rules, with particular focus on these important beneficiaries.
Timeframe: mid-2021
126

Recommendation 4.2
Carry out a campaign to remind all H2020 beneficiaries of the rules for the calculation and declaration of personnel costs, paying specific attention to the types of error described in paragraphs 4.11-4.15 of this chapter.
Timeframe: 2021
Recommendation 4.3
Further simplify the rules on personnel costs under the next Research Framework Programme (Horizon Europe).
Timeframe: end of 2020
Recommendation 4.4
For H2020:
— address the observations that arose following our review of the ex post audits with regard to documentation, sampling consistency and the quality of audit procedures, and
— for the third round of contracted out audits, take appropriate measures to ensure that the auditors are fully aware of the H2020 rules, and verify the quality of their work.
Timeframe: mid 2021
127

Annexes
Annex 4.1 — Results of transaction testing for Competitiveness for growth and jobs 2019 2018
SIZE AND STRUCTURE OF THE SAMPLE
Total transactions: 130 130
ESTIMATED IMPACT OF QUANTIFIABLE ERRORS
Estimated level of error 4,0 % 2,0 %
Upper Error Limit (UEL) 6,4 %
Lower Error Limit (LEL) 1,5 %
128
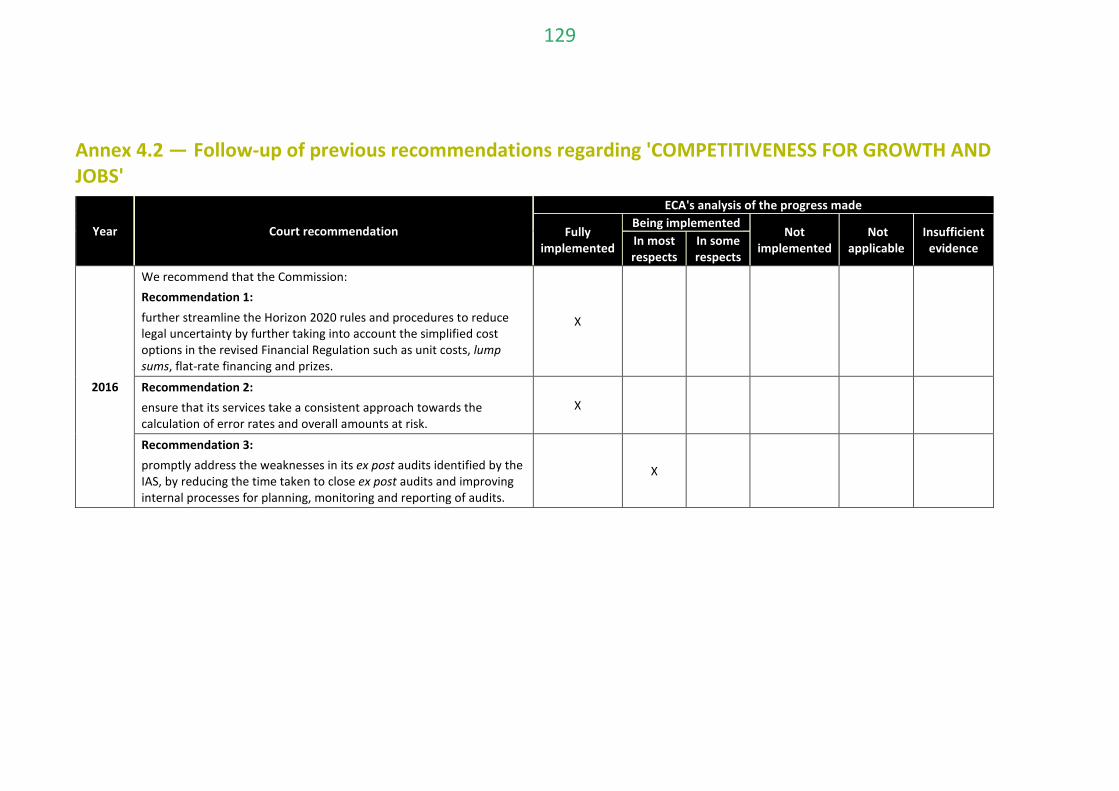
Annex 4.2 — Follow-up of previous recommendations regarding 'COMPETITIVENESS FOR GROWTH AND JOBS'
Year Court recommendation
ECA's analysis of the progress made
Fully implemented
Being implemented Not
implemented Not
applicable Insufficient
evidence In most respects
In some respects
2016
We recommend that the Commission: Recommendation 1: further streamline the Horizon 2020 rules and procedures to reduce legal uncertainty by further taking into account the simplified cost options in the revised Financial Regulation such as unit costs, lump sums, flat-rate financing and prizes.
X
Recommendation 2: ensure that its services take a consistent approach towards the calculation of error rates and overall amounts at risk.
X
Recommendation 3: promptly address the weaknesses in its ex post audits identified by the IAS, by reducing the time taken to close ex post audits and improving internal processes for planning, monitoring and reporting of audits.
X
129

Chapter 5
Economic, social and territorial cohesion – MFF heading 1b
130

Contents
Paragraph
Introduction 5.1.-5.12. Brief description 5.2.-5.5. Policy objectives and spending instruments 5.2.
Implementation and control and assurance framework 5.3.-5.5.
Audit scope and approach 5.6.-5.12.
Regularity of transactions 5.13.-5.62. Results of our testing of transactions and review/re-performance of audit work 5.14.-5.35. Ineligible projects 5.18.-5.20.
Infringements of internal market rules 5.21.-5.27.
Ineligible expenditure 5.28.-5.29.
Absence of essential supporting documents 5.30.
Non-compliance with rules governing the use of financial instruments 5.31.-5.35.
Our assessment of the work of audit authorities 5.36.-5.47.
The Commission’s assurance work and reporting of residual error rate in its annual activity reports 5.48.-5.62.
Conclusion and recommendations 5.63.-5.69. Conclusion 5.63.-5.67.
Recommendations 5.68.-5.69.
Annexes Annex 5.1 — Results of transaction testing
Annex 5.2 — Information on EU action in Member States
Annex 5.3 — Follow-up of previous recommendations for ‘Economic, social and territorial cohesion’
131

Introduction 5.1. This chapter presents our findings for MFF sub-heading 1b ‘Economic, social and territorial cohesion’. Box 5.1 gives an overview of the main activities and spending under this sub-heading in 2019. For further details of the 2019 audit population, see paragraph 5.9.
Box 5.1
MFF sub-heading 1b ‘Economic, social and territorial cohesion’ – 2019 breakdown
Others 1,5 (2,8 %)
European Social Fund 13,9 (25,9 %)
Cohesion Fund 8,8 (16,4 %)
European Regional Development Fund and other regional operations 29,6 (54,9 %)
Cohesion53,833,8 %
2019 payments as a share of the EU budget and breakdown by fund
(billion euros)
159,1billion euros
132

(*) The figure of 52,0 billion euros consists of annual advances and interim payments for the 2014-2020 programming period that were not included in the accounts underlying the assurance packages which the Commission accepted in 2019. In line with the harmonised definition of underlying transactions (for details see Annex .1.1, paragraph 11), these payments are considered pre-financing and thus are not part of our audit population for the 2019 annual report. They will be included in our audit population in the year the Commission accepts the corresponding accounts (e.g. in the 2020 statement of assurance for payments belonging to the 2018/2019 accounting year).
Source: 2019 consolidated accounts of the European Union.
Brief description
Policy objectives and spending instruments
5.2. Spending under this sub-heading focuses on reducing development disparitiesbetween the different Member States and regions of the EU and strengthening all regions’ competitiveness1. These objectives are implemented:
(a) through the following funds/instruments under shared management:
— the European Regional Development Fund (ERDF), which aims to redress the main regional imbalances through financial support for the creation of infrastructure and productive job-creating investment, mainly by businesses;
1 See Articles 174 to 178 of the Treaty on the Functioning of the European Union (OJ C 326, 26.10.2012, p. 47).
final payments: 1 8final payments: 1,8
2014-2020 payments relating to expenditure not yet accepted by the Commission ⁽*⁾: 52,0
clearing of prefinancing and 2017 and 2018 payments for 2007-2013 OPs closed in 2019: 1,7
2014-2020 expenditure accepted in 2019: 24,9
total: 28,4
total: 53,8
0 10 20 30 40 50 60
Auditpopulation
Payments
2019 audit population compared to payments(billion euros)
133

— the Cohesion Fund (CF), which, in the interest of promoting sustainable development, finances environment and transport projects in Member States with a per capita GNI of less than 90 % of the EU average;
— the European Social Fund (ESF), which aims to encourage a high level of employment and the creation of more and better jobs, including measures through the Youth Employment Initiative (YEI) targeting regions with a high youth unemployment rate2;
— other smaller schemes, such as the Fund for European Aid to the Most Deprived (FEAD);
(b) through a contribution to the Connecting Europe Facility (CEF), which is directly managed by the Commission and finances projects belonging to the trans-European networks3.
Implementation and control and assurance framework
5.3. Under this MFF sub-heading, Member States generally submit multiannual operational programmes (OPs) at the beginning of each programming period for the entire duration of an MFF. After the Commission has given approval, responsibility for implementing an OP is shared between the Commission (DG Regional and Urban Policy (DG REGIO) and DG Employment, Social Affairs and Inclusion (DG EMPL)) and the Member State. Beneficiaries receive reimbursement through authorities in the Member State, and the EU budget co-finances the eligible costs of operations approved in line with the terms of the OP. Managing authorities carry out verifications to prevent ineligible expenditure from being certified to the Commission.
2 The ERDF, CF and ESF are three of the five European Structural and Investment Funds,
which together are the subject of Regulation (EU) No 1303/2013 of the European Parliament and of the Council (the Common Provisions Regulation). The other two ESI funds are covered by chapter 6 of this report.
3 Regulation (EU) No 1316/2013 of the European Parliament and of the Council of 11 December 2013 establishing the Connecting Europe Facility, amending Regulation (EU) No 913/2010 and repealing Regulations (EC) No 680/2008 and (EC) No 67/2010 (OJ L 348, 20.12.2013, p. 129).
134

5.4. The control and assurance framework in place for the 2014-2020 programming period4 aims to ensure that the residual error rate5 in the OPs’ annual account remains below the 2 % materiality threshold set in the applicable regulation6. To ensure that no material level of irregularities remains in the accounts to be certified to the Commission after managing authorities’ verifications, the control and assurance framework provides for the following three elements:
— The work performed by audit authorities on expenditure included in the annual accounts. This work results in an annual control report which Member States submit to the Commission as part of their 'assurance packages'7. The report contains the residual error rate for the OP (or group of OPs) and an audit opinion on the regularity of declared expenditure and the effective functioning of management and control systems.
— The annual acceptance of the accounts. For this purpose, the Commission carries out mainly administrative checks of completeness and accuracy of the accounts so that it can accept them and release the amount of 10 % retained earlier as a guarantee8.
— Commission desk reviews of each assurance package and selected compliance audits in Member States. The Commission makes these checks to conclude on and validate the residual error rates reported by audit authorities; it publishes these, together with a weighted average to serve as a key performance indicator, in its annual activity reports (AARs) for the following year.
4 We gave full details of the control and assurance framework for the ESI funds, including a
timeline, in our 2017 (paragraphs 6.5-6.15) and 2018 annual reports (Figure 6.1).
5 In its AARs the Commission refers to a ‘residual risk rate’ (RRR) when dealing with closure for the 2007-2013 programming period and to a ‘residual total error rate’ (RTER) when dealing with the 2014-2020 programming period. In this chapter, we refer to both as ‘residual error rate(s)’.
6 Article 28(11) of Commission Delegated Regulation No 480/2014 of 3 March 2014 supplementing the Common Provisions Regulation (OJ L 138, 13.5.2014, p. 5).
7 Assurance packages are composed of a management declaration, an annual summary, the certified annual accounts, an annual control report and an audit opinion.
8 Article 130 of the Common Provisions Regulation limits the reimbursement of interim payments to 90 %. The remaining 10 % is released after the acceptance of the accounts.
135

5.5. The process leading up to the closure of OPs from the 2007-2013 programming period is largely comparable to that described in paragraph 5.4.
Audit scope and approach
5.6. Our objective was to contribute to the overall statement of assurance as described in Annex 1.1. By taking account of the characteristics of the control and assurance framework for this spending area, we also aimed to assess the extent to which the audit authorities’ and Commission’s work can be relied upon. We did this with a view to possibly making increased use of their work in the future and, in that context, identifying where further improvements are needed.
5.7. Applying the audit approach and methods set out in Annex 1.1, we examined the following for this MFF sub-heading:
(a) a sample of 236 transactions, designed to be statistically representative of the full range of spending under MFF sub-heading 1b. The sample consisted of 223 transactions for which expenditure had been certified in assurance and closure packages (including 220 which had been previously checked by an audit authority9), as well as eight financial instruments and five CEF projects directly managed by the Commission;
(b) the work done by audit authorities to validate the information contained in the 24 assurance/closure packages concerned by the 220 transactions they had previously checked;
(c) the Commission’s work to review and validate the residual error rates reported in assurance packages for 2014-2020, and its audit work on regularity aspects of those packages;
(d) the regularity information given in the annual activity reports of DG REGIO and DG EMPL, and its inclusion in the Commission’s Annual Management and Performance Report (AMPR).
9 See paragraph 5.41.
136

5.8. Our audit population (28,4 billion euros) consisted of expenditure from the 2014-2020 period that was included in accepted assurance packages for the 2017/2018 accounting year, 2007-2013 expenditure in the closure packages for OPs which the Commission closed in 2019, and allocations from the Cohesion Fund to the CEF.
5.9. In 2019, the Commission accepted accounts with expenditure for 351 out of 420 approved OPs (24,3 billion euros). These accounts came from assurance packages submitted by all 28 Member States for the 2014-2020 programming period. The Member States reported disbursements to final recipients through financial instruments, in the 2017/2018 accounting year, under 60 of those OPs (0,6 billion euros). In addition, the Commission closed or partially closed10 54 OPs (settling 2,2 billion euros) from the 2007-2013 programming period. The contribution to the CEF came to around one billion euros.
5.10. We took our sample of 223 transactions with expenditure certified in assurance and closure packages in two stages. We first selected 24 packages (20 from the 2014-2020 programming period and four from 2007-2013) covering 40 of the 394 OPs for which there was a Commission settlement from the EU budget in 2019. From those 24 packages we then selected transactions which the audit authorities had previously checked.
5.11. Part of our sample consisted of eight financial instruments from the 2014-2020 period. For this, we selected instruments from which payments had been made to final recipients in the 2017/2018 accounting year. Where the audit authority did not audit amounts disbursed to final recipients, we selected these disbursements directly.
5.12. Annex 5.2 contains a breakdown of our sample of transactions and the number of quantifiable errors we found by Member State.
10 If issues having a material impact remain open, the Commission settles only the
uncontested amount. The balance is settled and the OP closed once all outstanding issues have been resolved.
137

Regularity of transactions 5.13. This part of the chapter consists of three sub-sections. The first concerns our testing of this year’s sample of 236 transactions with a view to providing insight on the main sources of errors. The second sub-section concerns our assessment of audit authorities’ work, and the third relates to the Commission’s work. The findings in all sub-sections provide a basis for us to conclude on the regularity information contained in the two responsible DGs’ AARs and the Commission’s AMPR.
Results of our testing of transactions and review/re-performance of audit work
5.14. Annex 5.1 provides an overview of the results of our transaction testing. In the 236 transactions we examined, we identified and quantified 29 errors which had not been detected by audit authorities. Taking account of the 64 errors previously found by audit authorities and corrections applied by programme authorities (worth a total of 334 million euros for both programming periods taken together), we estimate the level of error to be 4,4 %11.
5.15. Audit authorities had reported 64 quantifiable errors in the assurance/closure packages for the 236 transactions we sampled. These errors concerned ineligible costs (39), public procurement (24) and missing supporting documentation (one error)12. The Member States had applied financial corrections, extrapolating them as necessary, with a view to bringing the residual error rates to or below the materiality threshold of 2 %.
5.16. Box 5.2 shows how the errors we found break down by category (before taking account of financial corrections). Ineligible projects and infringements of internal market rules (in particular non-compliance with public procurement rules) contributed most to our estimated level of error. Paragraphs 5.18 to 5.35 provide more information on these errors.
11 We base our calculation of error on a representative sample. The figure quoted is the best
estimate. We have 95 % confidence that the estimated level of error in the population lies between 2,1% and 6,7 % (the lower and upper error limits respectively).
12 A single transaction may be affected by more than one type of error.
138

Box 5.2
Breakdown of the errors we found
Source: ECA.
5.17. The number and impact of the errors detected demonstrate that there is ahigh inherent risk of error in this area and that managing authorities’ checks are still often ineffective for preventing or detecting irregularities in the expenditure declared by beneficiaries.
Ineligible projects
5.18. We identified five ERDF projects, from the 2014-2020 programming period,for which aid was granted to beneficiaries or operations that did not meet the eligibility conditions set out in the applicable regulation and OPs. These cases account for 17 % of all the quantifiable errors we detected, or approximately 2,2 percentage points of the estimated level of error.
15 % 9 %
55 %
12 %
4 %
2 %
3 %
0 % 10 % 20 % 30 % 40 % 50 % 60 %
Other
Ineligible disbursements fromfinancial instruments
Absence of essential supportingdocuments
Ineligible expenditure
Infringements of internal marketrules
Ineligible projects
Serious non-compliance with public procurement rules
Infringements of state aid rules
139

5.19. Under Article 65(6) of the Common Provisions Regulation (CPR), managing authorities cannot provide EU funding for operations that were physically completed or fully implemented on the date of the application for funding13. This rule exists because there was a tendency during the 2007-2013 programming period to submit projects retroactively, which is not the best use of EU money. We consider that three of the five ineligible projects were not compliant with this rule.
5.20. The operations we examined were originally financed from national resources, and had been physically completed before their approval for EU funding. Programme authorities interpreted the rule as meaning that, until an operation has been financially or administratively closed, it is not physically completed. However, physical completion refers to the completion of works or activities necessary to the project’s output, which generally takes place before final payment and administrative closure. Box 5.3 gives an example of and ineligible project.
Box 5.3
Example of ineligible project
In Portugal, a local authority requested EU co-funding for the costs of building an urban footpath. It had awarded the contract in 2015, setting a period of four months for completion, but applied for the grant in 2017, stating that most of the works had been completed. However, based on the information provided, we concluded that, among other irregularities, the project was already physically completed at the time of the application.
We found two other cases of non-compliance with Article 65(6) of the CPR in Italy.
13 The CPR does not explain what ‘physically completed or fully implemented’ means. The
Commission provided clarification to Member States, explaining that physical completion relates to projects that have a physical object. Full implementation is used as an alternative to physical completion. It relates to operations that do not have a physical object, or not exclusively, but also include other elements or parts that also need to be carried out in order for the operation to be considered as implemented.
140
Infringements of internal market rules
5.21. This year we found 23 infringements of internal market rules, three of which we quantified. Most infringements related to public procurement.
Despite many corrections, public procurement remains a significant source of errors
5.22. Public procurement procedures are a key instrument for spending public money economically and efficiently and for establishing the internal market. We examined 165 procedures for works, services and supplies. The vast majority of these procedures were for projects co-financed through ERDF/CF OPs.
5.23. Audit authorities had detected 24 cases of non-compliance with public procurement rules in the transactions we examined, and had imposed flat-rate corrections ranging from 5 % to 100 %, as provided for in the relevant Commission decisions14.
5.24. In 19 procurement procedures, we identified instances of non-compliance with EU and/or national public procurement rules which the audit authorities had not detected (see Box 5.4). Most of the errors we detected related to contracts with a value above the thresholds given in the EU’s procurement directives15, which usually means following more comprehensive procedures. Two were serious infringements that resulted in a different outcome to the tender, and we reported these as quantifiable errors. They accounted for 7 % of all the quantifiable errors we found, or approximately 0,6 percentage points of the estimated level of error. Other errors relating to tendering included non-compliance with publication and transparency requirements and discriminatory technical specifications. We did not quantify these.
14 Commission Decision C(2013) 9527 final of 19.12.2013 on the setting out and approval of
the guidelines for determining financial corrections to be made by the Commission to expenditure financed by the Union under shared management, for non-compliance with the rules on public procurement; Commission Decision C(2019) 3452 final of 14.5.2019 laying down the guidelines for determining financial corrections to be made to expenditure financed by the Union for non-compliance with the applicable rules on public procurement.
15 Directive 2014/24/EU of the European Parliament and of the Council of 26 February 2014 on public procurement (OJ L 94, 28.3.2014).
141

Box 5.4
Incorrect application of selection criteria
A Romanian beneficiary organised an open international public procurement procedure for a landfill rehabilitation project. A selection criterion required professional experience to be demonstrated by a minimum volume of similar projects. Our analysis showed that the successful bidder’s volume of similar work experience was insufficient. The contracting authority should have excluded the successful bid, and therefore the expenditure declared for this contract is ineligible.
We found one other public procurement error in Romania.
One project was ineligible because of state aid infringements
5.25. State aid, unless below a ‘de minimis’ ceiling, is in principle incompatible with the internal market since it may distort trade between Member States. There are, however, exceptions to this rule, in particular if the project is covered by the General Block Exemption Regulation (GBER)16. Member States must notify other cases of state aid so the Commission can form a view on their compatibility.
5.26. This year we identified three ERDF and one ESF projects that infringed the EU's state aid rules. We consider that one of the ERDF projects should have obtained no public funding from the EU and/or the Member State. We did not quantify the other three errors, where, although the Member State had not (correctly) assessed the existence of state aid, these cases had no impact on the level of public funding.
5.27. For one transaction in Portugal we found the same systemic state aid weakness (no incentive effect) that we identified and reported last year. During 2019, the Commission asked the Portuguese authorities to identify all affected operations for the 2017/2018 and 2018/2019 accounting years, and to make the necessary corrections to exclude the irregular expenditure from the accounts. The Portuguese authorities corrected 48 million euros from the 2018/2019 and 65 million euros from 2017/2018 accounting year (the year to which the operation we examined belongs).
16 Commission Regulation (EU) No 651/2014 of 17 June 2014 declaring certain categories of
aid compatible with the internal market in application of Articles 107 and 108 of the Treaty (OJ L 187, 26.6.2014, pp. 1-78).
142

Ineligible expenditure
5.28. When Member State authorities declare expenditure to the Commission, they certify that it was incurred in compliance with the applicable EU and national rules. We found ineligible expenditure in 15 of the transactions we examined, and these cases accounted for 52 % of the number of quantifiable errors we found, or approximately 0,6 percentage points of the estimated level of error.
5.29. The main causes of ineligible expenditure were project participants or cost items that did not meet the eligibility rules. Box 5.5 gives an example of this. We also found a few cases of errors related to simplified cost options.
Box 5.5
Example of participants not complying with eligibility rules
One YEI operation in Spain subsidised employment contracts for research work at a university. The university issued a call for applications for the research posts. To be eligible for recruitment, candidates had to comply with the YEI requirements (not currently in employment, education or training) and be registered in the national youth guarantee system. We identified several participants (eight out of thirty candidates checked) who, at the time of the application, were either employed by another university or in postgraduate study at the recruiting university, which made them ineligible for YEI support.
We also found errors relating to ineligible participants in one operation in Greece and one in Poland.
Absence of essential supporting documents
5.30. Beneficiaries and Member State programme authorities must maintain systems and procedures that ensure an adequate audit trail. This includes the need to keep documentary records. The most common error affecting ESF expenditure and reported by audit authorities is the absence of essential supporting documents. We found that supporting information or documentation was missing in five operations we examined (three ERDF and two ESF). In four cases, where the Member State programme authorities or beneficiaries could not provide documents demonstrating compliance with the eligibility conditions, we were compelled to quantify these errors. The result accounted for approximately 14 % of the transactions we quantified, and 0,2 percentage points of the estimated level of error.
143

Non-compliance with rules governing the use of financial instruments
5.31. Up to the end of the 2017/2018 accounting year, the Member States reported 4,1 billion euros in EU contributions to financial instruments, out of which they declared around 1 billion euros between 1 July 2017 and 30 June 2018. As of 30 June 2018, disbursements to or for the benefit of final recipients during the 2014-2020 programming period totalled 1,2 billion euros, including 0,6 billion euros disbursed in the 2017/2018 accounting year.
5.32. Our audit covered eight financial instruments from the 2014-2020 programming period. We examined 69 loans, eight equity investments and two cost items relating to management fees charged by financial intermediaries.
5.33. Our examination covered two SME Initiative programmes – in Spain and Romania. We found ineligible disbursements to final recipients in four of the ten investments we examined in the Spanish programme. In particular, financial intermediaries had approved loans for three investments without confirming the recipients’ SME status. The activity used to justify the loan for another investment had been fully implemented and paid before the loan was signed.
5.34. We also examined the Spanish SME Initiative for our 2017 annual report, when we similarly reported a high level of ineligible expenditure and concluded that there was a serious risk of irregularities17. For that reason, this year we also examined 13 loans under the Spanish programme that had a principal value of at least two million euros. We found that nine of these loans should not have been guaranteed through the instrument, as there was insufficient proof of SME status. The situation was different in the Romanian SME Initiative programme, where the principal value of loans was generally small and we did not identify any ineligible investments.
5.35. In our 2017 report we pointed to the need for significant improvements in the audit arrangements for financial instruments managed by the EIB Group. The European Investment Fund (EIF) has taken measures to address this issue by making improvements to its monitoring and control systems. The EIF excluded more than 4 000 ineligible investments (approximately 7 % of the total volume of the portfolio) from the Spanish programme. Starting from the 2018/2019 accounting year, the EIF
17 See paragraphs 6.36-6.39 of our 2017 annual report.
144

has also voluntarily extended the use of “reasonable assurance” reports18. However, it is still too early to assess the impact and full effectiveness of these measures, as they did not apply to the 2017/2018 accounting period which was the subject of our audit.
Our assessment of the work of audit authorities
5.36. The work of audit authorities is a critical part of the framework for assurance and control of Cohesion spending. Our review of their work is part of a process which may mean that we make more use of the Commission’s assurance model in the future. This year we assessed the work of 18 out of 116 audit authorities.
5.37. In all of the assurance and closure packages we examined, the audit authorities had reported a residual error rate equal to or below 2 %. Errors which the audit authorities have failed to detect add to those rates.
5.38. The additional errors we detected in our sample of transactions previously checked by audit authorities, and the results of the Commission’s review and audit work, indicate that the residual error rates that audit authorities reported are not always reliable. Our work gave us sufficient evidence to conclude that the residual error rate was above 2 % in nine of the 20 assurance packages (45 %) we examined for the 2014-2020 period. These nine packages accounted for 55 % of the expenditure concerned. In its AARs, taking account of its own audit work and the preliminary results of our audits, the Commission adjusted the residual error rate for eight of the nine assurance packages in our sample to above 2 %.
5.39. In the three years we have been examining 2014-2020 expenditure, the number of assurance packages for which audit authorities have reported unreliable residual rates below 2 % has consistently been around 50 % in terms both of the packages and of the expenditure we have selected for audit (see Box 5.6).
18 In line with IFAC’s International Standard on Assurance Engagements (ISAE) 3000,
“Assurance Engagements Other than Audits or Reviews of Historical Financial Information” (International Federation of Accountants).
145

Box 5.6
Three-year trend for assurance packages where our audit results and those of the Commission brought the residual rates above 2 %
Source: ECA.
5.40. Since last year, audit authorities have reported errors using a common typology agreed with the Commission19. Box 5.7 shows how the types of error most frequently reported by audit authorities compare with the additional errors which we and the Commission most frequently detected. The results show that the most common types of irregularities continue to relate to ineligible expenditure and public procurement. The most common error affecting ESF expenditure is the absence of essential supporting documentation. Despite the many irregularities which audit authorities have already reported for the projects we examine, many errors still go undetected or uncorrected by all internal control instances at an earlier stage.
19 See page 27 of DG REGIO’s 2019 AAR and page 41 of DG EMPL’s 2019 AAR.
44 %
55 % 55 %50 %
53 %
45 %
59 %62 %
45 %
0 %
10 %
20 %
30 %
40 %
50 %
60 %
70 %
2017 2018 2019Value of assurance packages with residual error rate over 2 %, expressed as a share of packagesexamined
Number of assurance packages with residual error rate over 2 %, expressed as a share ofpackages examined
Value of assurance packages in our sample, expressed as a share of the total value
146
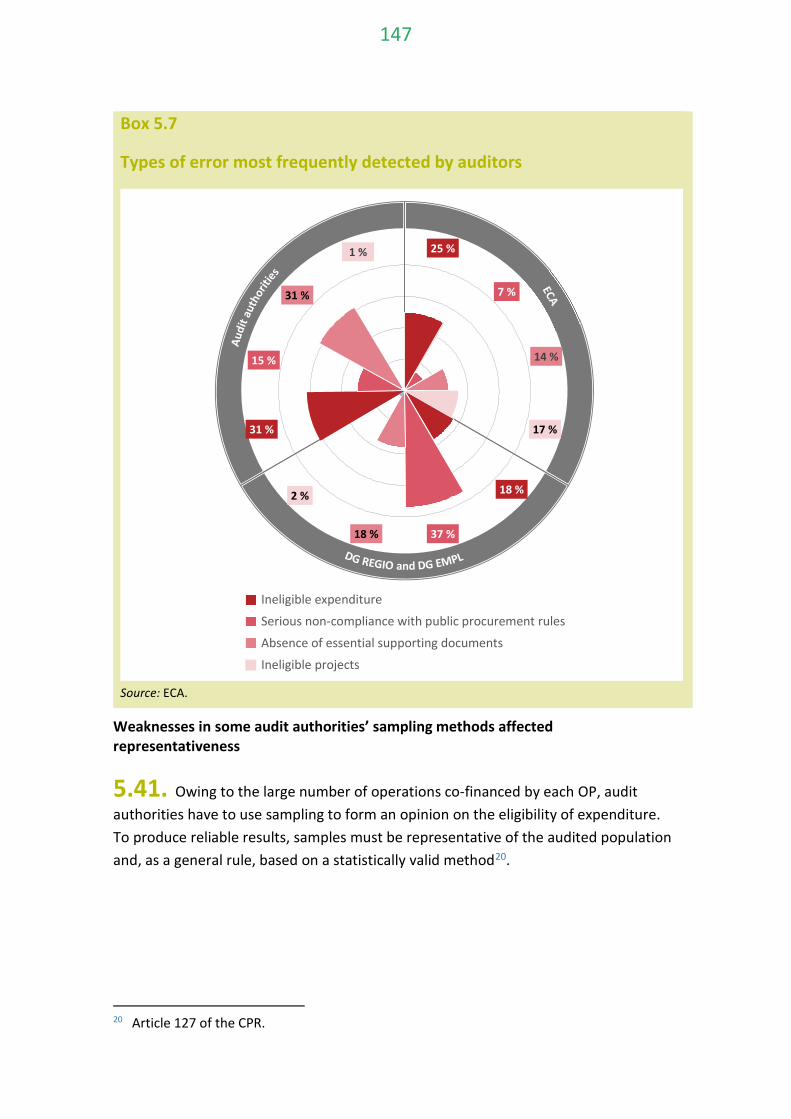
Box 5.7
Types of error most frequently detected by auditors
Source: ECA.
Weaknesses in some audit authorities’ sampling methods affected representativeness
5.41. Owing to the large number of operations co-financed by each OP, audit authorities have to use sampling to form an opinion on the eligibility of expenditure. To produce reliable results, samples must be representative of the audited population and, as a general rule, based on a statistically valid method20.
20 Article 127 of the CPR.
25 %
7 %
14 %
17 %
18 %
37 %18 %
2 %
31 %
15 %
31 %
1 %
Ineligible expenditure
Serious non-compliance with public procurement rules
Absence of essential supporting documents
Ineligible projects
147

5.42. We found weaknesses, such as the under-representation of certain operations, the incorrect use of sampling parameters and the lack of a sampling audit trail, in five of the 24 packages (including four for 2014-2020) we examined. To some extent, two of these weaknesses affected the representativeness of the samples. Consequently, we had to take an additional sample of three transactions to ensure proper coverage of the audited population.
Shortcomings remain in the way audit authorities perform and document their work
5.43. The International Standards on Auditing require auditors to document their checks, including clear references to all documents that are most relevant to the audited expenditure21. This enables them to be accountable for their work and helps internal or external reviewers to conclude on the extent and sufficiency of the checks. Insufficient or inadequate questions or replies in checklists increase the risk of not detecting ineligible expenditure.
5.44. For 120 of the sampled transactions (55 %), we were able to conclude on the basis of our review of audit authorities’ work. We identified shortcomings with the scope, quality and/or documentation of that work in 100 transactions (45 %), which required us to re-perform the corresponding audit procedures. The shortcomings related to 17 of the 24 assurance/closure packages we examined. For 25 transactions (15 % of the total), the shortcomings required us to visit beneficiaries on the spot. In 23 of the 100 transactions (in 11 assurance packages) where we re-performed an audit, we found quantifiable errors that had not been previously identified by the audit authority. These shortcomings show the importance of properly documenting audit files and carrying out quality reviews.
5.45. We re-performed slightly more transactions than last year, when the ratio was less than one third of all audit procedures. However, this year we were able to clarify more issues without visiting the beneficiary’s premises. In this context, we welcome the Commission’s and audit authorities’ joint initiative to improve the documentation of audit authorities’ work (see Box 5.8).
21 ISA 230 Audit Documentation.
148

Box 5.8
Coordinated efforts to improve audit documentation
Taking account of our 2017 and 2018 audit results showing shortcomings in audit authorities’ checklists and the documentation of their audit files, the audit authorities and the Commission formed a working group to draw up a good practice note for auditors. Its objective was to establish a common understanding on how auditors should document their audit work and which supporting documents they should keep in audit files, even where there are no findings. In December 2019, the working group put out a ‘Reflection paper on audit documentation’. This is not an exhaustive manual, and its use is not mandatory, but it does represent a first step in improving the way audit authorities perform and document their work.
One audit authority’s incorrect treatment of corrections had an impact on two reported residual error rates
5.46. The correct calculation and the reliability of residual error rates depend, inter alia, on the way detected errors and the related financial corrections are then handled.
5.47. In two of the 20 assurance packages we examined, the audit authority had incorrectly calculated the residual error rate. It had deducted individual corrections applied by the managing authority but unrelated to the audit authority’s audit work. Due to this excessive reduction in the amount at risk, the audit authority incorrectly reported residual error rates below 2 %. The Commission identified one of these two cases in its review of the assurance packages.
The Commission’s assurance work and reporting of residual error rate in its annual activity reports
5.48. AARs are the Commission DGs’ main tool for reporting whether they have reasonable assurance that Member States' control procedures ensure the legality and regularity of expenditure.
149

Risk-based compliance audits have highlighted irregularities not detected by audit authorities
5.49. The reliability of the legality information reported in the AARs largely depends on the quality of audit authorities’ work. The Commission performs compliance audits in which it reviews and assesses that work. The objective is to seek reasonable assurance that no serious weaknesses in management and control systems remain undetected, unreported and therefore uncorrected once the accounts have been submitted to the Commission.
5.50. The Commission mainly selects OPs for its compliance audits on the basis of an annual risk assessment. Programmes with a high risk score and thus a high potential for material error are given priority.
5.51. In 2019, the Commission carried out 26 compliance audits (14 by DG REGIO and 12 by DG EMPL) in 11 Member States. In its draft reports on all these compliance audits, the Commission concluded that the residual error rates reported in the audit authorities’ annual control reports for the 2017/2018 accounting year were underestimated; the Commission therefore increased those rates. In 15 cases, this raised the residual rate above the 2 % materiality threshold.
5.52. Thirteen of the compliance audits (five by DG REGIO and eight by DG EMPL) were final by May 2020. For half of these audits, therefore, the residual rates were not yet final.
5.53. We are currently analysing in an ongoing audit the relevance, reliability and consistency of the annual level of error for Cohesion expenditure which the Commission calculates as a result of its audits.
The Commission uses confirmed residual rates when reporting on regularity
5.54. The Commission calculates a weighted average error rate based on the reported individual residual error rates, the results of its own regularity work and other available information. It reports that rate as a key performance indicator (KPI) on regularity. In the 2019 AARs, the KPI is based on the individual rates reported for the 2017/2018 accounting year. DG REGIO excludes the impact of advances paid to financial instruments.
150

5.55. As required by the Financial Regulation, the two directors-general each gave a declaration of assurance for “relevant” expenditure incurred during 2019, which had not yet gone through the full control cycle. In the last two years, the DGs estimated the amount at risk for this expenditure using the confirmed residual error rate for the previous accounting year or the latest residual error rate reported by the audit authorities for the current accounting year, whichever was higher. In the 2019 AARs, both DGs changed their methodology and applied the KPI for the 2017/2018 accounting year to the “relevant” expenditure incurred in 2019.
5.56. DG REGIO reported a KPI above, and DG EMPL a KPI below, the 2 % materiality level. Since the audit results for several OPs were still being discussed (see paragraph 5.52), both DGs also reported a “maximum rate”22. This rate also aims to take account of possible further errors in expenditure on operations that were not included in the Commission’s audits, as well as any further information which may become available after adoption of the AARs. We consider this rate to be more suitable, because it takes account of the potential impact of ongoing audit work.
5.57. In Box 5.9 we provide an overview of the KPIs reported by the Commission in the 2019 AARs.
Box 5.9
Overview of information on KPIs in AARs
Source: ECA, based on DG REGIO and DG EMPL 2019 AARS
22 Our 2018 annual report used the term “worst-case scenario” for this rate.
3,8 % maximum rate
2,7 % confirmedresidual rate
DG REGIO
2,4 % maximum rate
1,7 % confirmedresidual rate
DG EMPL
3,3 % maximum rate
2,3 % confirmedresidual rate
TOTAL Cohesion
151

5.58. In our 2018 annual report we concluded that, for various reasons23, the overall residual error rate shown as a KPI should be considered a minimum rate. Furthermore, the DGs state in their 2019 AARs that additional work may be done in subsequent years to assess the reliability of residual error rates.
5.59. The Commission used the two DGs' estimated amounts at risk and the KPIs to provide information for this MFF sub-heading in the 2019 AMPR. It reported an overall risk at payment of between 2,2 % and of 3,1 %24. The rates reported in both the AARs and the AMPR are below our estimated level of error.
Reservations might not necessarily cover all material risks
5.60. The DGs are required to state reservations25 in their AARs in respect of OPs for which management and control weaknesses mean a material risk to the EU budget. To this end, they should take into account all information available at the time of their assessment. The main criteria for stating a reservation are26
— material issues with the completeness, accuracy and veracity of the accounts;
— weaknesses in key aspects of management and control systems that trigger a 10 % flat rate correction;
— a total error rate reported by the audit authority above 10 % and/or a residual error rate above 2 % for the annual accounts submitted in the reference year for the AAR (for 2019 these were the accounts underlying the 2018/2019 accounting year). The Commission may adjust these rates during a preliminary consistency review.
The Commission also considers qualitative shortcomings with a significant impact on its reputation.
23 Paragraphs 6.62 and 6.63 of the 2018 annual report.
24 P. 58 of the 2019 AMPR.
25 By means of their reservations, directors-general limit the assurance they declare in respect of the use of the budget under their responsibility (see Article 74(9) of the Financial Regulation).
26 See Annex IV to the DG REGIO and DG EMPL AARs.
152

5.61. In practice, most of the reservations stated in the 2019 AARs were mainly based on the error rates for the 2018/2019 accounts, which had not yet been accepted. Both DGs reported that the 2018/2019 error rates would not be confirmed before at least the 2020 AARs.
5.62. There are OPs for which the confirmed residual error rates from the 2017/2018 accounting year reveal material risk or serious systemic management and control weaknesses. The two DGs stated in their 2019 AARs that no reservations are made where the confirmed residual error rate for the previous accounting year was above 2 %, because additional financial corrections would be applied in the future27. Thus, the Commission’s reservations are mostly based on provisional rates and might not necessarily cover all material risks. An ongoing audit covers this matter among other things (see paragraph 5.53).
27 2019 REGIO AAR annexes page 21, footnote 8; 2019 EMPL AAR annexes page 32,
footnote 16.
153

Conclusion and recommendations
Conclusion
5.63. The overall audit evidence we obtained and have presented in this chapter indicates that the level of error in spending on ‘Economic, social and territorial cohesion’ was material. For this MFF sub-heading, our testing of transactions produced an estimated overall level of error of 4,4 % (see Annex 5.1).
5.64. The weaknesses found in the work of several audit authorities covered by our sample (see paragraphs 5.36-5.47) currently limit the reliance that can be placed on that work. The recalculated rate was above the 2 % materiality threshold in nine out of 20 assurance packages for the 2014-2020 period. The Commission adjusted the residual error rates for eight assurance packages to a figure above 2 %. In doing this, it also took account of our audit work. This confirms what we reported in previous years, as show in Box 5.6.
5.65. Because of this and issues we identified regarding the residual error rates reported by the Commission in its AARs for the 2017/2018 accounting year (see paragraphs 5.58 and 5.59), we consider that the rates aggregated in the AMPR are underestimated, and we cannot currently rely on them.
5.66. The regularity information figures presented in the AMPR for the 2017/2018 accounting year confirm a material level of error in the Cohesion policy area. However, these rates fall in the lower half of our error range. Furthermore, the Commission’s maximum rate is below our estimated level of error (see paragraph 5.59).
5.67. The new control and assurance framework was designed to ensure that annual residual error rates are below 2 %. However, our audit showed that further improvements are necessary in the way the framework is applied, both by managing authorities and audit authorities and by the Commission.
Recommendations
5.68. Annex 5.3 shows the findings of our follow-up review of the three recommendations we made in our 2016 annual report and the seven recommendations in the 2017 and 2018 annual reports which required immediate action or were targeted for implementation in 2019. The Commission had
154

implemented one recommendation in full, while seven had been implemented in most respects, one in some respects and one had not been acted upon at all. We consider that recommendations 4(ii) and 6 from our 2017 annual report are still valid.
5.69. Based on this review and our findings and conclusions for 2019, we recommend that the Commission:
Recommendation 5.1 – Project eligibility conditions
Clarify what is meant by ‘physically completed’ and/or ‘fully implemented’ operations. This would help Member States to verify that operations comply with Article 65(6) of the CPR and avoid the non-detection of ineligible operations. It should be made clear that this condition relates only to works or activities necessary to achieve the operation’s output, and not to financial and administrative aspects.
Timeframe: immediate
Recommendation 5.2 – Action to increase the reliability of the residual rates reported by audit authorities
Analyse the main sources of undetected errors and develop the necessary measures together with audit authorities to improve the reliability of reported residual rates.
Timeframe: June 2021
155

Annexes
Annex 5.1 — Results of transaction testing 2019 2018
SIZE AND STRUCTURE OF THE SAMPLE
Total transactions: 236 220
ESTIMATED IMPACT OF QUANTIFIABLE ERRORS
Estimated level of error 4,4 % 5,0 %
Upper Error Limit (UEL) 6,7 %
Lower Error Limit (LEL) 2,1 %
156
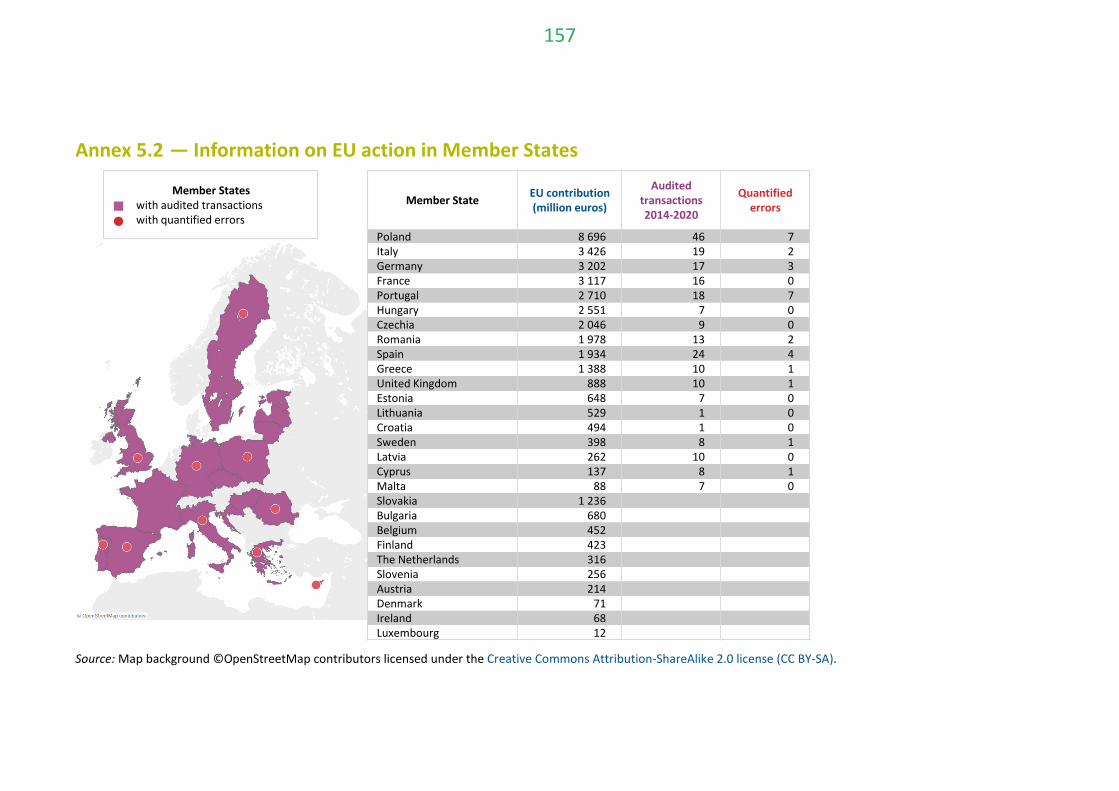
Annex 5.2 — Information on EU action in Member States
Source: Map background ©OpenStreetMap contributors licensed under the Creative Commons Attribution-ShareAlike 2.0 license (CC BY-SA).
Member State EU contribution (million euros)
Audited transactions 2014-2020
Quantified errors
Poland 8 696 46 7Italy 3 426 19 2Germany 3 202 17 3France 3 117 16 0Portugal 2 710 18 7Hungary 2 551 7 0Czechia 2 046 9 0Romania 1 978 13 2Spain 1 934 24 4Greece 1 388 10 1United Kingdom 888 10 1Estonia 648 7 0Lithuania 529 1 0Croatia 494 1 0Sweden 398 8 1Latvia 262 10 0Cyprus 137 8 1Malta 88 7 0Slovakia 1 236Bulgaria 680Belgium 452Finland 423The Netherlands 316Slovenia 256Austria 214Denmark 71Ireland 68Luxembourg 12
Member States with audited transactionswith quantified errors
157

Annex 5.3 — Follow-up of previous recommendations for ‘Economic, social and territorial cohesion’
Year ECA recommendation
ECA's analysis of the progress made
Fully implemented
Being implemented Not
implemented Not
applicable Insufficient
evidence In most respects
In some respects
2016
We recommend that the Commission: Recommendation 1: pay particular attention, when closing the 2007-2013 programmes, to areas in which there is a higher risk of ineligible expenditure or of the disclosure of inaccurate information that may lead to an over-reimbursement. In particular, the Commission should focus on:
(a) ensuring that eligible amounts reported for financial instruments at closure are not artificially increased because of over-reporting of the amounts used at the level of final recipients. The risk is highest for guarantee funds, where an artificially low multiplier would mean an unjustified increase in eligible costs;
X
(b) verifying that state aid advances were covered by real expenditure at project level, which is the only eligible expenditure. The Commission should ensure that the managing authorities have carried out sufficient verifications to allow for an appropriate audit trail for the clearance of advances and the deduction of unjustified amounts;
X
(c) making sure that expenditure for all major projects is supported by a Commission decision approving the project, failing which the expenditure declared becomes ineligible. A particular risk arises where larger projects are split into smaller sections which are below the major project threshold.
X
158

Year ECA recommendation
ECA's analysis of the progress made
Fully implemented
Being implemented Not implemented
Not applicable
Insufficient evidence In most
respects In some respects
Recommendation 2: address, for the 2014-2020 period, issues that may affect the reliable calculation of the residual rate, by introducing robust checks and guidance in relation to:
(a) the audit population of financial instruments and state aid advances. The population should take proper account, for financial instruments, of the amounts used at the level of final recipients and, for state aid, of the actual expenditure at project level as reported in the accounts;
X28
(b) the audit coverage for financial instruments managed by the EIB. The Commission should make sure that the audit arrangements are adequate at the level of both financial intermediaries and final recipients. Final approval for the amendments to the existing legal basis which the Commission has proposed for the Omnibus regulation, as well as the obligation to audit at the level of the Member State, would be instrumental in this regard;
X29
28 As it disclosed in its 2019 AAR, DG REGIO did not remove state aid advances from the residual error rate calculation “given this inherent legal complexity
for dealing with such advances in the error rate calculation and the limited impact estimated in previous years”. DG EMPL’s 2019 AAR also makes reference only to the removal of financial instrument advances from the residual error rate calculation.
29 The Omnibus Regulation introduced a requirement for audit authorities to perform system audits and audits of operations on financial instruments at the level of financial intermediaries, including financial instruments managed by the EIB Group but excluding SME Initiative programmes set up before 2 August 2018. Therefore, adequate audit arrangements have not yet been put in place for those programmes.
159

Year ECA recommendation
ECA's analysis of the progress made
Fully implemented
Being implemented Not implemented
Not applicable
Insufficient evidence In most
respects In some respects
(c) the exclusion of the amounts under ongoing assessment referred to in Article 137(2) of Regulation (EU) No 1303/2013 from the calculation of the residual rate as reported by the Member States, since including them has the effect of understating the residual rate and reduces the transparency and reliability of this key indicator.
X
Recommendation 3: when reconsidering the design and delivery mechanism for the ESI funds post-2020, strengthen the programme focus on performance and simplify the mechanism for payments by encouraging, as appropriate, the introduction of further measures linking the level of payments to performance instead of simply reimbursing costs.
X30
30 Despite considerable effort by the Commission regarding simplification and performance orientation, the 2021-2027 CPR proposal does not include
measures linking payments to performance. Additionally, as we highlighted in our opinion 6/2018 on the Commission's proposal of 29 May 2018 for the CPR (COM(2018)375 final), the proposal dispensed with many elements that were designed to support the better targeting of funds on results, such as the ex-ante evaluation of programmes, the performance reserve and common appraisal standards for major projects.
160

Year ECA recommendation
ECA's analysis of the progress made
Fully implemented
Being implemented Not implemented
Not applicable
Insufficient evidence In most
respects In some respects
2017
We recommend that the Commission: Recommendation 1: ensure that the audit arrangements for financial instruments managed by the EIF are adequate at the level of financial intermediaries. When the EIB/EIF uses agreed-upon procedures with external auditors, the Commission should define the minimum conditions of such contracts with a view to the need to provide assurance, in particular the obligation for sufficient audit work at the level of the Member State.
X31
Recommendation 2: propose legislative changes for the post-2020 financial framework which would exclude reimbursement of VAT public bodies from EU funds.
X32
Recommendation 3: address the weaknesses we have identified in its verification of the audit authorities’ work in the context of the Commission’s regularity audits.
X33
31 The Omnibus Regulation introduced a requirement for audit authorities to perform system audits and audits of operations on financial instruments at
the level of financial intermediaries, including financial instruments managed by the EIB Group but excluding SME Initiative programmes set up before 2 August 2018. Therefore, adequate audit arrangements have not yet been put in place for those programmes.
32 The Commission issued an alternative proposal to make VAT eligible for projects below a total cost of 5 million euro. This does not address the problem, as we discussed in our rapid case review on VAT published on 29.11.2018.
33 See paragraphs 6.58-6.64 of the 2018 annual report. The Commission has provided no new elements in this regard.
161
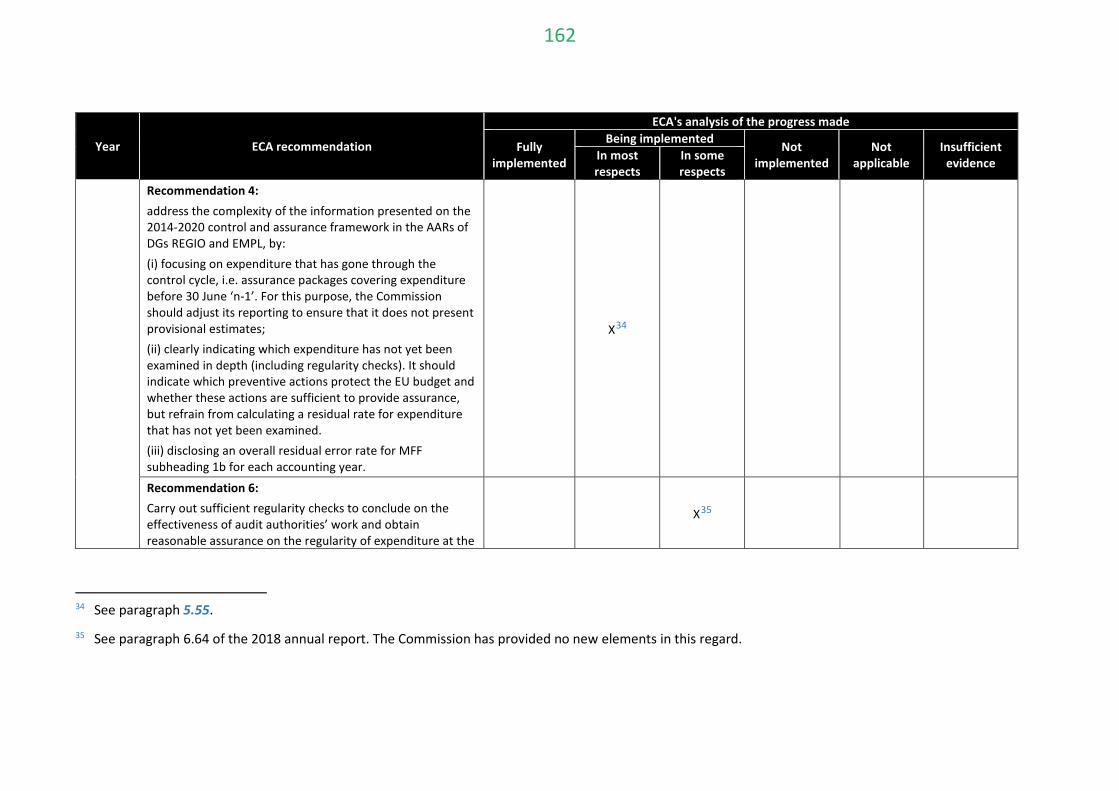
Year ECA recommendation
ECA's analysis of the progress made
Fully implemented
Being implemented Not implemented
Not applicable
Insufficient evidence In most
respects In some respects
Recommendation 4: address the complexity of the information presented on the 2014-2020 control and assurance framework in the AARs of DGs REGIO and EMPL, by: (i) focusing on expenditure that has gone through the control cycle, i.e. assurance packages covering expenditure before 30 June ‘n-1’. For this purpose, the Commission should adjust its reporting to ensure that it does not present provisional estimates; (ii) clearly indicating which expenditure has not yet been examined in depth (including regularity checks). It should indicate which preventive actions protect the EU budget and whether these actions are sufficient to provide assurance, but refrain from calculating a residual rate for expenditure that has not yet been examined. (iii) disclosing an overall residual error rate for MFF subheading 1b for each accounting year.
X34
Recommendation 6: Carry out sufficient regularity checks to conclude on the effectiveness of audit authorities’ work and obtain reasonable assurance on the regularity of expenditure at the
X35
34 See paragraph 5.55.
35 See paragraph 6.64 of the 2018 annual report. The Commission has provided no new elements in this regard.
162
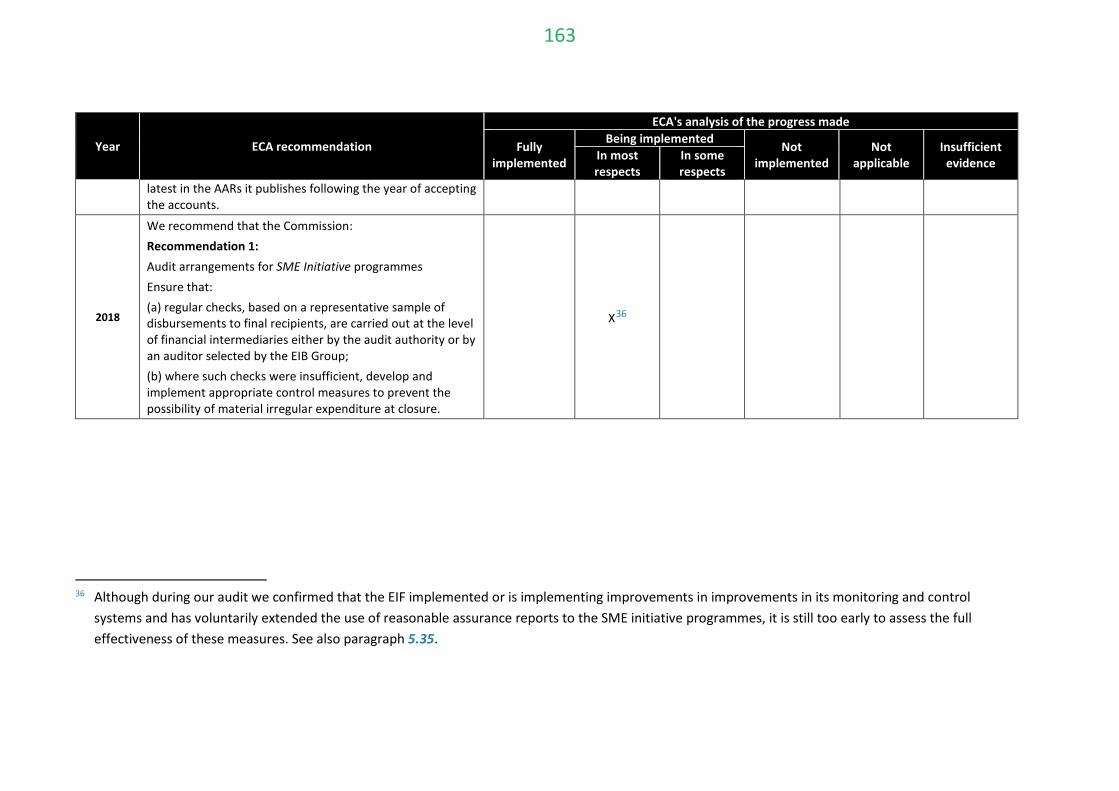
Year ECA recommendation
ECA's analysis of the progress made
Fully implemented
Being implemented Not implemented
Not applicable
Insufficient evidence In most
respects In some respects
latest in the AARs it publishes following the year of accepting the accounts.
2018
We recommend that the Commission: Recommendation 1: Audit arrangements for SME Initiative programmes Ensure that: (a) regular checks, based on a representative sample of disbursements to final recipients, are carried out at the level of financial intermediaries either by the audit authority or by an auditor selected by the EIB Group; (b) where such checks were insufficient, develop and implement appropriate control measures to prevent the possibility of material irregular expenditure at closure.
X36
36 Although during our audit we confirmed that the EIF implemented or is implementing improvements in improvements in its monitoring and control
systems and has voluntarily extended the use of reasonable assurance reports to the SME initiative programmes, it is still too early to assess the full effectiveness of these measures. See also paragraph 5.35.
163

Year ECA recommendation
ECA's analysis of the progress made
Fully implemented
Being implemented Not implemented
Not applicable
Insufficient evidence In most
respects In some respects
Recommendation 2: Irregular withholding of payments Take the necessary steps to ensure that the checklists used by managing and audit authorities include verifications of compliance with Article 132 of the Common Provisions Regulation, which states that beneficiaries must receive the total amount of eligible expenditure due no later than 90 days from the date of submission of the related payment claim. Where relevant, make appropriate recommendations to programme authorities and encourage them to follow correct practice in the future.
X37
37 Although we acknowledge the measures taken by the Commission in this regard, we cannot consider the recommendation to have been fully
implemented, since our audits for 2019 revealed delays in the transfer of funds to beneficiaries.
164

Chapter 6
Natural resources – MFF heading 2
165

Contents
Paragraph
Introduction 6.1.-6.7. Brief description 6.2.-6.6.
Audit scope and approach 6.7.
Regularity of transactions 6.8.-6.27. Direct payments: an effective control system limits the risk of error 6.11.-6.17. Direct payments as a whole were free from material error 6.13.
The integrated Administration and Control System limits the risk of error in direct payments 6.14.-6.17.
Other spending areas: complex eligibility conditions increase the risk of error 6.18.-6.27. Rural development 6.19.-6.25.
Market measures 6.26.
Fisheries, the environment and climate action 6.27.
Annual activity reports and other governance arrangements 6.28.-6.41. DG AGRI’s reporting on the regularity of CAP spending 6.28.-6.32.
The Commission’s AMPR 6.33.
CAP anti-fraud policies and procedures 6.34.-6.41.
Conclusion and recommendations 6.42.-6.43. Conclusion 6.42.
Recommendations 6.43.
Annexes Annex 6.1 — Results of transaction testing
Annex 6.2 — Information on EU action in Member States
Annex 6.3 — Follow-up of previous recommendations
166
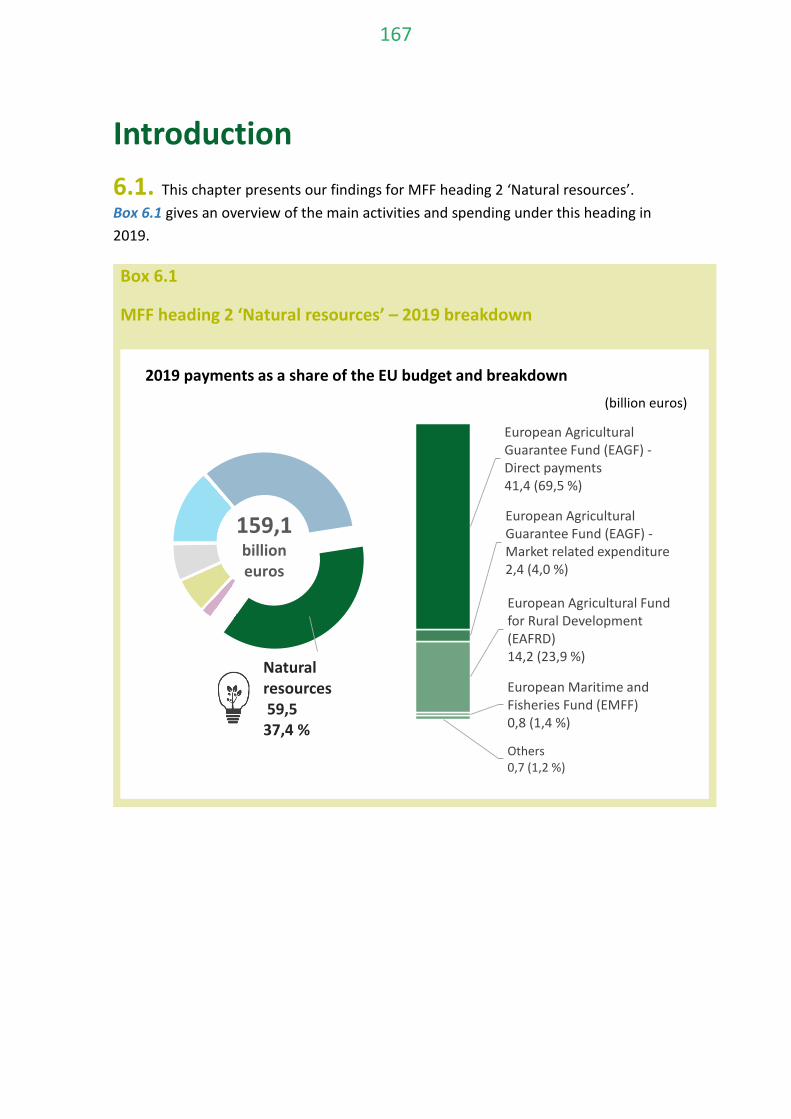
Introduction 6.1. This chapter presents our findings for MFF heading 2 ‘Natural resources’. Box 6.1 gives an overview of the main activities and spending under this heading in 2019.
Box 6.1
MFF heading 2 ‘Natural resources’ – 2019 breakdown
Others 0,7 (1,2 %)
European Maritime and Fisheries Fund (EMFF) 0,8 (1,4 %)
European Agricultural Fund for Rural Development (EAFRD) 14,2 (23,9 %)
European Agricultural Guarantee Fund (EAGF) -Market related expenditure 2,4 (4,0 %)
European Agricultural Guarantee Fund (EAGF) -Direct payments 41,4 (69,5 %)
Natural resources59,537,4 %
2019 payments as a share of the EU budget and breakdown(billion euros)
159,1billion euros
167

(*) In line with the harmonised definition of underlying transactions (for details see Annex 1.1, paragraph 11).
Source: 2019 consolidated accounts of the European Union.
Brief description
6.2. The common agricultural policy (CAP) accounts for 98 % of spending on ‘Natural resources’. EU legislation sets three general objectives for the CAP1:
(a) viable food production, with a focus on agricultural income, agricultural productivity and price stability;
(b) the sustainable management of natural resources and climate action, with a focus on greenhouse gas emissions, biodiversity, soil, and water;
(c) balanced territorial development.
1 Article 110(2) of Regulation (EU) No 1306/2013 of the European Parliament and of the
Council.
interim / final payments: 59,0 interim / final payments: 59,0
prefinancing payments⁽*⁾: 0,5
clearing of prefinancing⁽*⁾: 0,4
total: 59,4
total: 59,5
0 10 20 30 40 50 60
Auditpopulation
Payments
2019 audit population compared to payments(billion euros)
168

6.3. The Commission, in particular the Directorate-General for Agriculture and Rural Development (DG AGRI), has ultimate responsibility for the CAP. Paying agencies in the Member States make and check payments to beneficiaries. Since 2015, EU law requires independent certification bodies in the Member States to supplement their work on the accuracy of accounts with an annual opinion on the legality and regularity of the paying agencies’ spending.
6.4. CAP spending falls into three broad categories:
o direct payments to farmers, fully funded by the EU budget;
o agricultural market measures, also fully funded by the EU budget, with the exception of certain measures co-financed by the Member States, such as promotion measures and the school fruit, vegetable and milk scheme;
o Member States’ national and regional rural development programmes, co-financed by the EU budget and the Member States.
6.5. This MFF heading also covers EU spending on the common fisheries policy, and part of EU spending on the environment and climate action.
6.6. Annex 6.2 presents an overview of 2019 payments for each Member State for 'Natural resources' spending under shared management.
169

Audit scope and approach
6.7. Applying the audit approach and methods set out in Annex 1.1, we examined:
(a) A sample of 251 transactions2, in line with paragraph 9 of Annex 1.1. The sample was designed to be representative of the full range of spending under this MFF heading. It consisted of transactions from 20 Member States3. The sample included 30 rural development transactions for which we re-performed checks already carried out by 6 certification bodies4. Our objective was to contribute to the overall statement of assurance as described in Annex 1.1.
(b) The regularity information given in the annual activity reports of DG AGRI and of the Directorate-General Maritime Affairs and Fisheries (DG MARE), and its inclusion in the Commission’s Annual Management and Performance Report (AMPR).
(c) Selected systems, which concerned:
(i) DG AGRI’s procedures for calculating its estimated error rates for CAP spending;
(ii) the Commission’s anti-fraud policies and procedures in relation to CAP spending.
2 The sample consisted of 136 payments under rural development programmes, 95 direct
payments, 14 market measures and 6 payments for fisheries, the environment and climate action.
3 Belgium, Bulgaria, Czechia, Denmark, Germany, Ireland, Greece, Spain, France, Croatia, Italy, Lithuania, Hungary, Austria, Poland, Portugal, Romania, Slovakia, Sweden and the United Kingdom. The sample also included four transactions under direct management.
4 Bulgaria, Germany (Sachsen-Anhalt), Austria, Poland, Romania and Slovakia.
170

Regularity of transactions 6.8. Annex 6.1 provides an overview of the results of transaction testing. Of the 251 transactions examined, 207 (82 %) were error-free while 44 (18 %) contained errors. Based on the 36 errors5 we have quantified and other evidence produced by the control system (see section on “Annual activity reports and other governance arrangements”), we find the level of error for ‘Natural resources’ to be close to the materiality threshold. We present hereafter the results of our audit for the low-risk area of direct payments (see paragraphs 6.11-6.17) and for the high-risk area consisting of rural development, market measures, fisheries, the environment and climate action (see paragraphs 6.18-6.27).
6.9. Box 6.2 gives a breakdown of the types of errors we found in 2019.
Box 6.2
Natural resources: types of errors
Source: ECA.
5 We also found 8 cases of non-compliance, which had no financial impact.
2 %
5 %
10 %
13 %
70 %
0 % 20 % 40 % 60 %
Administrative errors
Non-respect of agri-environment-climate commitments
Errors in public procurement and grant award procedures
Provision of inaccurate information on areas or animals
Ineligible beneficiary/activity/project/expenditure
Contribution to the estimated level of error for ‘Natural resources’
171

6.10. The Commission (for direct expenditure) and the Member State authorities had applied corrective measures that directly affected 51 of the transactions we sampled. These measures were relevant to our calculations, as they reduced our estimated level of error for this chapter by 0,2 percentage points.
Direct payments: an effective control system limits the risk of error
6.11. Our work supports the conclusion that direct payments as a whole were free from material error. These account for 70 % of spending under the MFF heading ‘Natural resources’. Direct payments to farmers are entitlement-based: beneficiaries receive payment if they meet certain conditions. Such payments carry a lower risk of error provided the attached conditions are not overly complex (see paragraph 1.19).
6.12. Four main EAGF schemes account for 90 % of all direct payments:
(a) two schemes providing decoupled income support based on the area of agricultural land declared and paid irrespective of whether the land is used for production: the ‘basic payment scheme’ (17,1 billion euros in 2019) and the ‘single area payment scheme’ (4,3 billion euros in 2019);
(b) a payment intended to support agricultural practices beneficial for the climate and the environment, commonly known as the ‘greening’ payment (11,8 billion euros in 2019);
(c) coupled support, linked to specific types of agricultural produce (e.g. beef and veal, milk or protein crops) (4 billion euros in 2019).
172
Direct payments as a whole were free from material error
6.13. We tested 95 direct payments, covering all the main schemes. We found that 81 transactions were unaffected by error. The quantified errors we found were generally minor infringements, caused by farmers overstating the eligible area of agricultural land in their aid claims. Eight out of the nine errors we quantified were below 5 % of the amount examined. In five cases, we detected compliance issues without financial impact.
The integrated Administration and Control System limits the risk of error in direct payments
6.14. The main management tool for direct payments is the Integrated Administration and Control System (IACS)6 (see Box 6.3), which incorporates the Land Parcel Identification System (LPIS). IACS interlinks databases of holdings, aid claims, agricultural areas and animal registries, which the paying agencies use to perform administrative cross-checks on all aid applications. LPIS is a geographical information system containing multiple-source spatial data sets, which together form a record of agricultural areas in the Member States.
6 https://ec.europa.eu/agriculture/direct-support/iacs_en
173
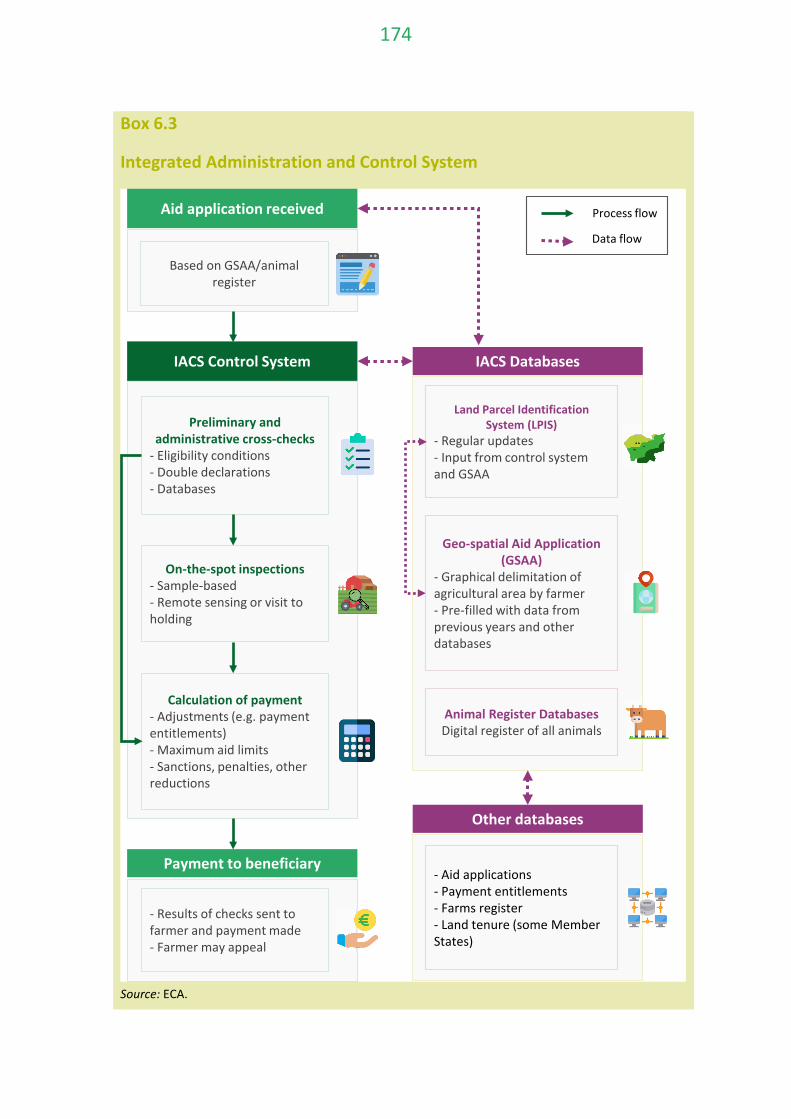
Box 6.3
Integrated Administration and Control System
Source: ECA.
Aid application received
Land Parcel Identification System (LPIS)
- Regular updates- Input from control system and GSAA
Geo-spatial Aid Application (GSAA)
- Graphical delimitation of agricultural area by farmer- Pre-filled with data from previous years and other databases
Animal Register DatabasesDigital register of all animals
IACS Databases
- Aid applications- Payment entitlements- Farms register- Land tenure (some Member States)
Other databases
Based on GSAA/animal register
Preliminary and administrative cross-checks
- Eligibility conditions- Double declarations- Databases
On-the-spot inspections- Sample-based- Remote sensing or visit to holding
IACS Control System
Calculation of payment- Adjustments (e.g. payment entitlements)- Maximum aid limits - Sanctions, penalties, other reductions
Payment to beneficiary
- Results of checks sent to farmer and payment made- Farmer may appeal
Process flow
Data flow
174

6.15. Our work confirms our previous observations7 that IACS, and the LPIS in particular, operates as an effective management and control system to ensure that direct aid payments as a whole are not affected by material error.
6.16. Since 2018, Member State paying agencies may use ‘checks by monitoring’8. This approach uses automated processes based on the EU Copernicus programme’s Sentinel satellite data for checking compliance with CAP rules. For a given scheme, it enables paying agencies to monitor the whole population of aid recipients. The paying agencies can compare satellite data on crop types and agricultural activity with information provided by farmers in their aid applications. The new approach permits paying agencies to send warnings to farmers about certain requirements (for example, to mow a field by a certain date), encouraging compliance with the scheme rules9.
6.17. In May 2018, a first paying agency in Italy began to use checks by monitoring in one province concerning aid claims payable in 2019. In 2019, 15 paying agencies (in Belgium, Denmark, Spain, Italy and Malta) used checks by monitoring for some of their direct payment schemes. They will cover around 4,7 % of 2020 spending on direct aid payments. Checks by monitoring have the potential to reduce administrative burden and improve cost-effectiveness10.
7 Paragraphs 7.16 to 7.18 of our 2018 annual report, paragraph 7.16 of our 2017 annual
report and paragraph 7.13 of our 2016 annual report.
8 Commission Implementing Regulation (EU) 2018/746 of 18 May 2018 amending Implementing Regulation (EU) 809/2014 as regards modification of single applications and payment claims and checks.
9 See our special report No 04/2020 ‘Using new imaging technologies to monitor the Common Agricultural Policy: steady progress overall, but slower for climate and environment monitoring’, paragraphs 11 to 12 and 16.
10 See our special report No 04/2020, paragraphs 17 and 18.
175

Other spending areas: complex eligibility conditions increase the risk of error
6.18. We tested 136 transactions under rural development programmes, 14 transactions related to market measures, 4 transactions under the LIFE programme and 2 transactions under the EMFF. Most spending in these areas (including reimbursement of costs) is subject to complex eligibility conditions, increasing the risk of error (see paragraph 1.19).
Rural development
6.19. The Commission has approved 118 national and regional rural development programmes in the Member States for 2014-202011. These programmes include 20 measures and 67 sub-measures, falling into two broad categories of spending:
(a) aid to investment projects intended to support social and economic development in rural areas;
(b) payments to farmers based on agricultural area or number of animals on the holding, and on environmental and climate-related criteria.
6.20. Our transaction testing covered 15 measures, with distinct implementation rules and eligibility conditions, under 27 programmes in 19 Member States.
6.21. Of the 136 rural development transactions we tested, 114 were unaffected by error. In 5 cases we found errors with an impact exceeding 20 % and 15 transactions contained errors below 20 % of the amount examined. For 2 payments, we detected compliance issues without financial impact. We have detected decreasing numbers of errors in rural development over the past three years.
11 Regulation (EU) No 1305/2013 of the European Parliament and of the Council of
17 December 2013 on support for rural development by the European Agricultural Fund for Rural Development (EAFRD) and repealing Council Regulation (EC) No 1698/2005.
176

6.22. We examined 68 payments to investment projects, such as modernisation of farms, support for basic services and village renewal in rural areas, investments in forest management, and support for community-led local development. We quantified 9 errors, including 2 cases where the beneficiary and/or the project had not met the eligibility conditions (see Box 6.4).
Box 6.4
Example of an ineligible project in rural development
In Hungary, the national authorities approved an investment project under a measure for the development of livestock holdings and the use of renewable energy technologies. The approved investment consisted of the construction of a storage facility for animal fodder. However, we found that the beneficiary, whose primary activity is arable farming on a holding of more than 1 000 hectares, used the aid to build a storage facility for cereals. Under national rules, support for the construction of storage facilities for crops, was only available for smaller farms.
6.23. We examined 68 payments based on the area or animal numbers declared by farmers, and on requirements to comply with environmental and climate-related criteria. These include compensation payments to farmers in areas with natural constraints, and payments for meeting agri-environment-climate commitments or for organic farming.
6.24. Paying agencies use IACS to check the area-based element of farmers’ aid claims under these measures. Similarly to direct payments, errors in these transactions most frequently concern minor overstatements of the eligible area. We found eight transactions affected by small errors below 5 % of the amount examined, and one case of error between 5 % and 20 %.
6.25. In two other cases, we found that the beneficiaries breached environmental and climate-related eligibility conditions, leading to errors exceeding 20 % of the amount examined in both cases (see example in Box 6.5).
177

Box 6.5
Example of beneficiaries not meeting agri-environment-climate commitments
We found two cases of non-compliance with agri-environment-climate commitments in Belgium. In one case, the EU paid aid to a farmer to maintain grassland of high ecological value, in order to provide a habitat for endangered species, such as ground-nesting birds. The farmer was required to set aside a refuge area for wildlife and not mow the grass before a certain date. However, in the year we examined the farmer mowed two of the nine parcels covered by the project before the specified date and removed most of the refuge area on the two parcels. The national authorities had orthophotos, which showed the breach of the rules, but did not use them when checking the payment.
Market measures
6.26. Agricultural market measures form a number of diverse schemes, subject to a variety of eligibility conditions. We tested 14 transactions and found 5 cases where paying agencies had reimbursed ineligible costs, including 3 cases of non-compliance with the eligibility rules leading to errors exceeding 20 % of the amount examined.
Fisheries, the environment and climate action
6.27. The selection criteria and eligibility requirements for projects in fisheries, the environment and climate action also vary. These policy areas account for a small proportion of ‘Natural resources’ spending. Among the six transactions we examined, we found ineligible elements in the costs reimbursed for two projects.
178
Annual activity reports and other governance arrangements
DG AGRI’s reporting on the regularity of CAP spending
6.28. Each paying agency director provides DG AGRI with an annual management declaration on the effectiveness of their agency’s control systems, together with a report on their administrative and on-the-spot checks (‘control statistics’). Since 2015, in order to provide additional assurance, certification bodies have been required to give an annual opinion for each paying agency on the legality and regularity of the expenditure for which Member States have requested reimbursement.
6.29. DG AGRI considers that the certification bodies achieved a significant improvement in their work in 2019, enabling the DG to rely more on the results of the certification bodies’ work in drawing conclusions on the regularity of CAP spending. However, DG AGRI also recognises some limitations in the reliability of the results of the certification bodies’ work, due to weaknesses it identified in some certification bodies’ checks and sampling methodologies. The 2015 expansion of certification bodies’ role to provide an opinion on the regularity of expenditure was a positive development. In our re-performance of the transactions already checked by certification bodies (see paragraph 6.7) we identified some areas in which there is scope for further improvement, similar in type to those identified by the Commission.
6.30. DG AGRI uses the paying agencies’ control statistics, making adjustments based on the results of the certification bodies’ audits, and of its own checks of paying agencies’ systems and spending, to calculate a figure for ‘risk at payment’ for direct payments, rural development and market measures. Subsequently, DG AGRI deducts its estimate of future financial corrections and recoveries from these figures to estimate a ‘final amount at risk’12.
6.31. The control statistics reported by paying agencies indicate a level of error equivalent to 0,8 % of CAP spending as a whole. DG AGRI further increased its reliance on the certification bodies’ work in 2019. The adjustments it applied based on both its own checks and the certification bodies’ work represented around 56 % of its overall estimate for the ‘risk at payment’. Adjustments based on the Commission’s own work
12 See page 77 of DG AGRI’s annual activity report.
179

generally consisted of flat-rate amounts, intended to reflect the significance and extent of weaknesses identified in the Member States’ management and control systems, and used as an initial estimate for possible financial corrections.
6.32. DG AGRI estimated the risk at payment to be around 1,9 % for CAP spending as a whole in 2019. DG AGRI estimated a risk at payment of around 1,6 % for direct payments, 2,7 % for rural development and 2,8 % for market measures.
The Commission’s AMPR
6.33. The estimates of risk at payment presented in the Commission’s AMPR reflect the quantification presented in the individual annual activity reports of DG AGRI and DG MARE.
CAP anti-fraud policies and procedures
6.34. Fraud is an act or omission committed with an intention to mislead resulting in undue payments13. Our methodology14 is designed to verify if the audited transactions are free from material irregularity, whether due to fraud or unintentional error. In our testing of transactions each year, we regularly identify cases of suspected fraud in CAP spending.
6.35. We find relatively few cases of suspected fraud in direct payments and rural development area-based payments not subject to agri-environment-climate commitments. In these areas, we find that farmers generally submit correct claims or make small errors (see paragraphs 6.13 and 6.24).
6.36. The risk that fraud has a material impact is greater for market-support payments, rural-development investments and other payments, which are generally subject to reimbursement-based co-financing. In these areas, we have regularly found and quantified cases of irregular spending related to the presentation of false, incorrect or incomplete declarations, to potential conflicts of interest, and to suspected creation of artificial conditions.
13 For the concept of fraud see article 3 (2) of Directive (EU) 2017/1371.
14 Our methodology in relation to fraud is designed in line with ISSAI 1240 and is further described in paragraphs 28 to 30 of Annex 1.1.
180

6.37. As the CAP is under shared management, both the Commission and the Member States are responsible for addressing fraud issues. Box 6.6 shows the arrangements in place for tackling CAP fraud.
Box 6.6
Commission and Members States anti-fraud arrangements
Source: ECA.
181

6.38. OLAF is responsible for investigating fraud, in cooperation with national investigative bodies. DG AGRI takes a range of measures to mitigate fraud risks in CAP spending, including the provision of training and guidance for Member State managing and control bodies, raising awareness among its own staff of fraud indicators, supporting the development of IACS and checks by monitoring, and encouraging Member States’ use of Arachne through a pilot project launched in February 2019. Based on a comprehensive database and a set of risk indicators, Arachne is an IT tool that can help paying agencies to identify projects, beneficiaries and contractors at risk of fraud, conflict of interest and irregularities, for further assessment.
6.39. We published a special report on anti-fraud measures in EU spending at the beginning of 201915. We identified several issues affecting:
o the Commission’s insight into the scale, nature and causes of fraud;
o its strategic approach to managing the risk of fraud;
o attention given to fraud prevention;
o and the recovery rate for unduly paid funds.
6.40. In the course of this year’s statement of assurance audit we found that:
o DG AGRI last updated its fraud risk analysis in 2016;
o neither OLAF nor DG AGRI assessed Member States’ measures to prevent and fight fraud in CAP spending;
o despite the encouragement given by DG AGRI (see paragraph 6.38), most paying agencies made little use of the Arachne tool to identify potential risks. As of March 2020, twelve paying agencies in nine Member States were participating in the pilot project “Arachne for AGRI”.
15 Special report 1/2019: ‘Fighting fraud in EU spending: action needed.’
182

6.41. In our recent Opinion on the Commission’s proposed transitional regulation for the CAP16, we noted the increasing attention being focused on payments to non-genuine farmers acquiring agricultural land to receive CAP payments. We stated that the Commission and the legislators could use the transitional period to assess whether the requirements for the definitions of ‘genuine farmer’, ‘eligible hectare’ and minimum ‘agricultural activity’ in the post-2020 CAP proposals need to be revised to address this risk, including by clarifying the meaning of ‘land at the farmer’s disposal’, without disproportionately increasing the administrative burden for farmers.
16 Opinion 1/2020 concerning the Commission’s proposal for a regulation on transitional
provisions relating to the common agricultural policy in the year 2021, paragraph 22.
183

Conclusion and recommendations
Conclusion
6.42. The overall audit evidence we obtained and have presented in this chapter (see paragraph 6.8) indicates that the level of error was not material for the low risk area of direct payments, representing 70 % of payments on ‘Natural resources’, and that it was material for the spending areas we had identified as higher risk (rural development, market measures, fisheries, the environment and climate action), representing 30 % of payments under this heading.
Recommendations
6.43. Annex 6.3 shows the findings of our follow-up review of the two recommendations we made in our 2016 annual report and those three recommendations in our 2017 annual report, which required immediate action or were targeted for implementation within 2019. The Commission had implemented four recommendations in full, while one had been implemented in most respects.
6.44. Based on this review and our findings and conclusions for 2019, we make the following recommendation.
Recommendation 6.1
The Commission should update its analysis of CAP fraud risks more frequently, perform an analysis of Member States’ fraud prevention measures, and disseminate best practices in the use of the Arachne tool to further encourage its use by paying agencies.
Timeframe: 2021
184

Annexes
Annex 6.1 — Results of transaction testing
2019 2018
SIZE AND STRUCTURE OF THE SAMPLE
Total transactions: 251 251
ESTIMATED IMPACT OF QUANTIFIABLE ERRORS
Estimated level of error 1,9 % 2,4 %
Upper Error Limit (UEL) 2,9 % Lower Error Limit (LEL) 0,8 %
185

Annex 6.2 — Information on EU action in Member States Overview of 2019 payments for each Member State for 'Natural resources' spending under shared management
Amounts in million euros
Source: ECA based on Commission data.
Sources: Map background ©OpenStreetMap contributors licensed under the Creative Commons Attribution-ShareAlike2.0 license (CC BY-SA).
Member States with audited transactions
Member StateTotal
‘Natural resources’
Direct payments
Rural development
Market Measures
Fisheries
France 9 747 6 935 2 224 520 68Spain 7 017 5 101 1 166 588 162Germany 6 214 4 794 1 274 116 30Italy 5 772 3 634 1 449 631 58Poland 4 563 3 387 1 092 28 56United Kingdom 4 053 3 186 774 40 53Romania 2 870 1 847 967 42 14Greece 2 559 1 982 484 57 36Hungary 1 819 1 265 511 37 6Ireland 1 546 1 200 324 -3 25Portugal 1 360 671 523 103 63Czechia 1 268 854 394 16 4Austria 1 255 691 538 24 2Bulgaria 1 221 785 406 20 10Denmark 975 822 101 11 41Sweden 943 688 226 13 16Finland 890 523 351 5 11Netherlands 811 680 90 24 17Slovakia 665 445 209 11 0Lithuania 658 469 181 0 8Belgium 632 488 79 61 4Croatia 619 279 300 9 31Latvia 475 253 206 1 15Estonia 277 133 125 1 18Slovenia 264 135 120 7 2Cyprus 80 49 21 6 4Luxembourg 48 33 14 1 0Malta 31 5 19 1 6
186

Annex 6.3 — Follow-up of previous recommendations
Year ECA recommendation
ECA's analysis of the progress made
Fully implemented
Being implemented Not
implemented Not
applicable Insufficient
evidence In most respects
In some respects
2016
We recommend that the Commission: Recommendation 1: review the approach taken by paying agencies to classify and update land categories in their LPISs and to perform the required cross-checks, in order to reduce the risk of error in the greening payment (see paragraphs 7.17 and 7.18, as well as Box 7.5).
X
Recommendation 2: provide guidance and disseminate best practices (e.g. the use of new IT technology) among national authorities to ensure that their checks identify links between applicants and other stakeholders involved in the supported projects (see paragraph 7.26).
X
187

Year ECA recommendation
ECA's analysis of the progress made
Fully implemented
Being implemented Not
implemented Not
applicable Insufficient
evidence In most respects
In some respects
2017
We recommend that the Commission: Recommendation 1: assess the effectiveness of the Member States’ actions to address the causes of errors for payments for market measures and rural development, and issue further guidance where necessary (see paragraphs 7.18 to 7.24 and Annex 7.4).
X
Recommendation 2: carry out a closer examination of the quality of the certification bodies’ transaction testing (see paragraph 7.32).
X
Recommendation 3: check the implementation of the remedial action taken by Member State authorities where the Commission found it could place no or limited reliance on a certification body’s work (see paragraph 7.34).
X
188

Chapter 7
Security and citizenship – MFF heading 3
189

Contents
Paragraph
Introduction 7.1.-7.6. Brief description 7.2.-7.5.
Audit scope and approach 7.6.
Regularity of transactions 7.7.-7.8.
Examination of elements of internal control systems 7.9.-7.13. Review of audit authorities’ work in relation to their annual control reports and audits of expenditure 7.9.-7.11.
Review of the Commission’s assessments of annual control reports 7.12.-7.13.
Annual activity reports and other governance arrangements 7.14.-7.15.
Conclusion and recommendations 7.16.-7.17. Recommendations 7.17.
190

Introduction 7.1. This chapter presents our findings for MFF heading 3 ‘Security and citizenship’. Box 7.1 gives an overview of the main activities and spending under this heading in 2019.
Box 7.1
MFF heading 3 ‘Security and citizenship’ – 2019 breakdown
Others⁽*⁾ 0,3 (10,7 %)
Creative Europe 0,2 (7,3 %)
Food and Feed 0,2 (7,6 %)
Decentralised agencies 1,0 (29,1 %)
Migration and security 1,6 (45,3 %)
Security and citizenship
3,3 2,0 %
2019 payments as a share of the EU budget and breakdown(billion euros)
159,1billion euros
191

(*) Data includes expenditure on consumers, justice, rights, equality and citizenship. (**) Pre-financing includes shared management payments for the 2014-2020 programming period that were not included in the accounts underlying the assurance packages that the Commission accepted in 2019. (***) Clearings of pre-financing are in line with the harmonised definition of underlying transactions (for details see Annex 1.1, paragraph 11).
Source: 2019 consolidated accounts of the European Union.
interim / …interim / final payments: 0,6
annual decisions to accept the national AMIF/ISF accounts: 0,8
pre-financing payments ⁽**⁾: 2,7
clearing of pre-financing ⁽***⁾: 1,6
total: 3,0
total: 3,3
0 1 2 3
Auditpopulation
Payments
(billion euros)2019 audit population compared to payments
192

Brief description
7.2. This heading covers a range of policies whose common objective is to strengthen the concept of European citizenship by creating an area of freedom, justice and security without internal borders.
7.3. As shown in Box 7.1, the most significant area of expenditure is migration and security. Thus, most spending comes from just two funds – the Asylum, Migration and Integration Fund1 (AMIF) and the Internal Security Fund (ISF)2. The management of most AMIF and ISF funding is shared between the Member States (or associated countries) and the Commission’s DG for Migration and Home Affairs (DG HOME). The objective of AMIF is to contribute to the effective management of migration flows and bring about a common EU approach to asylum and immigration. The overall aim of the ISF is to ensure security in the EU while facilitating legitimate travel and respecting fundamental freedoms and human rights. It has two instruments3: ISF Borders and Visa and ISF Police. The first provides support for integrated border management and the development of the common visa policy, while the second focuses on cooperation among law enforcement agencies and on improving capacity to manage security-related risks and crises.
7.4. Five years into the seven-year programming period, Member States have stepped up the implementation of their national programmes. Significant amounts remain undisbursed, and it remains important to avoid increasing the pressure on national authorities as programmes head towards closure. Box 7.2 summarises expenditure that Member States have reported to the Commission for reimbursement since the beginning of the programming period.
1 See Regulation (EU) No 516/2014 of the European Parliament and of the Council
establishing the Asylum, Migration and Integration Fund.
2 The two funds replaced the SOLID programme that ran during the previous programming period.
3 See Regulation (EU) No 515/2014 of the European Parliament and of the Council establishing, as part of the Internal Security Fund, the instrument for financial support for external borders and visa, and Regulation (EU) No 513/2014 of the European Parliament and of the Council establishing, as part of the Internal Security Fund, the instrument for financial support for police cooperation, preventing and combating crime, and crisis management.
193

Box 7.2
Expenditure on AMIF and ISF national programmes has upped the pace, but the available budget also continues to rise
(*) AMIF/ISF expenditure at Member State level is declared to and approved by the Commission the year after it is incurred. Thus, the Commission's accounts for 2019 include Member State expenditure from 2018.
Source: ECA.
7.5. Another significant share of the budget heading consists of funding for 14 decentralised agencies4 that are active in the implementation of key EU priorities in the areas of migration and security, judicial cooperation and health. Next come the ‘Food and Feed’ programme, which aims to ensure human, animal and plant health at all stages of the food chain, and ‘Creative Europe’, the EU framework programme of support for culture and the audio-visual sector. Lastly, the budget covers a number of programmes whose common objective is to strengthen security and citizenship in the EU by focusing on justice, consumers or rights, equality and citizenship.
4 Health: ECDC, EFSA, EMA, ECHA. Home affairs: Frontex, EASO, Europol, CEPOL, eu-LISA,
EMCDDA. Justice: Eurojust, FRA, EIGE, EPPO. Specific annual reports with our opinion on the legality and regularity of each of these agencies’ operations can be found on the ECA website.
102460
1 0551 540
529
1 510
1 957
2 037
63 248548
896475
733
952
1 263
0
400
800
1 200
1 600
2 000
2 400
2 800
3 200
3 600
2014-2015 2014-2016 2014-2017 2014-2018(*)
Cumulative expenditure AMIF Cumulative expenditure ISF Available budget(million euros)
194

Audit scope and approach
7.6. Applying the audit approach and methods set out in Annex 1.1, we examined the following for this MFF heading in 2019:
(a) a sample of 19 transactions, which was designed to contribute to our overall statement of assurance rather than be representative of spending under this MFF heading. Therefore, we have not estimated the error rate for this MFF heading. The sample consisted of eight transactions under shared management with Member States5, eight under direct management and one under indirect management by the Commission, as well as two that involved the clearing of advances to agencies.
(b) selected systems, which concerned:
(i) whether the annual control reports of eight audit authorities6 in relation to the 2018 annual accounts for AMIF and the ISF were compliant with the legislation7;
(ii) for the same audit authorities, whether their work in connection with audits of expenditure and their procedures for providing reliable audit opinions were adequate and in line with the rules;
(iii) whether DG HOME’s compliance assessments of the annual control reports of all AMIF and ISF audit authorities were appropriate and covered all the relevant legal concerns.
(c) the regularity information given in the annual activity reports of DG HOME and the DG for Justice and Consumers (DG JUST) and its inclusion in the Commission’s Annual Management and Performance Report (AMPR).
5 In Germany, Greece, Italy, Cyprus, Lithuania, Poland, Slovenia and the United Kingdom.
6 The same Member States from which we sampled 8 transactions.
7 Commission Delegated Regulation (EU) 2018/1291 of 16 May 2018 amending Delegated Regulation (EU) No 042/2014 supplementing Regulation (EU) No 514/2014 of the European Parliament and of the Council with regard to the designation and management and control responsibilities of Responsible Authorities and with regard to status and obligations of Audit Authorities.
195

Regularity of transactions 7.7. Of the 19 transactions we examined, seven (37 %) were affected by errors. We identified three quantifiable errors which had a financial impact on the amounts charged to the EU budget. An example is presented in Box 7.3 below.
Box 7.3
Salary costs overstated
An AMIF-funded project that we audited in Cyprus was being implemented by an international organisation. It consisted in the provision of information, individual guidance and support to migrants wishing to return to their country of origin. We checked the payslips, timesheets, payments and accounting entries corresponding to five persons directly employed on the project. The organisation had claimed a top-up of 6 % of total gross salary costs to cover end-of-contract benefits for which the employees did not in fact qualify. Hence, this amount was not a cost specific to the project and, it did not meet the definition of direct eligible expenditure. The total project costs were therefore overstated.
7.8. We also found four cases of non-compliance with legal provisions, but without a financial impact on the EU budget. As in previous years, these related to the selection of projects and procurement rules. Failure to honour such rules can undermine the sound financial management of EU spending and potentially affect the eligibility of the costs claimed.
196

Examination of elements of internal control systems
Review of audit authorities’ work in relation to their annual control reports and audits of expenditure
7.9. We audited the work done by eight authorities responsible for auditing their respective Member States’ AMIF/ISF annual accounts8 and providing the Commission with an annual control report. Our purpose was to confirm that these audit authorities had:
(a) covered all types of payments made by the bodies responsible for implementing the funds,
(b) used an appropriate sampling method,
(c) sampled enough transactions to draw conclusions about the total population,
(d) correctly calculated9 the error rate, and
(e) put in place adequate procedures for providing reliable audit opinions and reports10.
7.10. All the audit authorities have developed and implemented detailed procedures of sufficient quality to report as required by the rules. We identified certain shortcomings, whose impact on the accounts was not material enough to detract from the audit authorities’ conclusions. We present our findings in Box 7.4 below.
8 Germany, Greece, Italy, Cyprus, Lithuania, Poland and the United Kingdom for AMIF;
Slovenia for the ISF.
9 As required by Commission Delegated Regulation (EU) 2018/1291.
10 In line with key requirement 14 of management and control systems – see the Annex to Commission Implementing Regulation (EU) 2017/646.
197
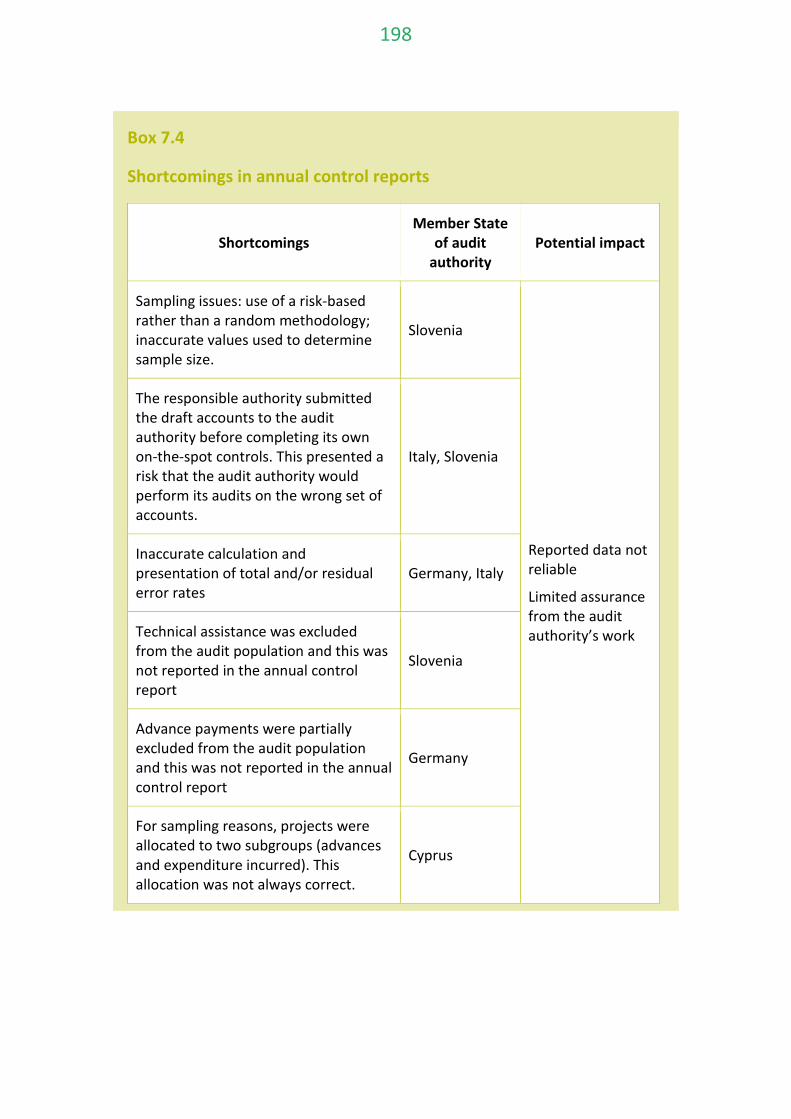
Box 7.4
Shortcomings in annual control reports
Shortcomings Member State
of audit authority
Potential impact
Sampling issues: use of a risk-based rather than a random methodology; inaccurate values used to determine sample size.
Slovenia
Reported data not reliable
Limited assurance from the audit authority’s work
The responsible authority submitted the draft accounts to the audit authority before completing its own on-the-spot controls. This presented a risk that the audit authority would perform its audits on the wrong set of accounts.
Italy, Slovenia
Inaccurate calculation and presentation of total and/or residual error rates
Germany, Italy
Technical assistance was excluded from the audit population and this was not reported in the annual control report
Slovenia
Advance payments were partially excluded from the audit population and this was not reported in the annual control report
Germany
For sampling reasons, projects were allocated to two subgroups (advances and expenditure incurred). This allocation was not always correct.
Cyprus
198
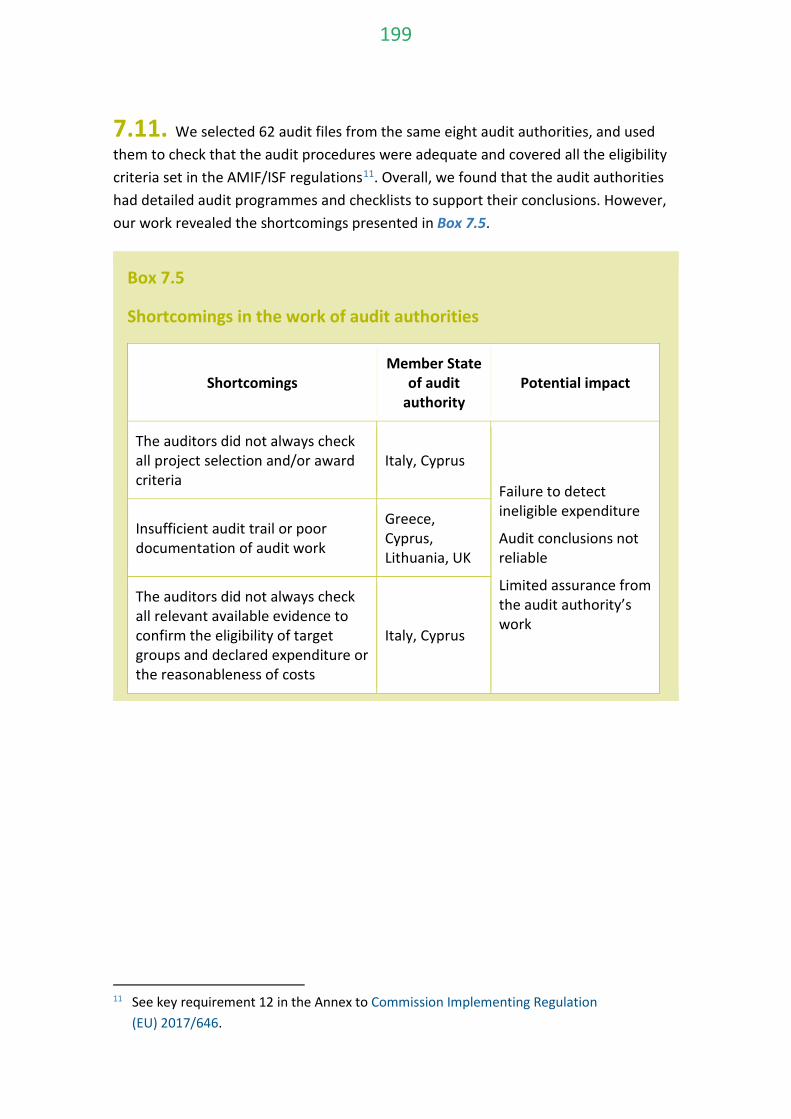
7.11. We selected 62 audit files from the same eight audit authorities, and used them to check that the audit procedures were adequate and covered all the eligibility criteria set in the AMIF/ISF regulations11. Overall, we found that the audit authorities had detailed audit programmes and checklists to support their conclusions. However, our work revealed the shortcomings presented in Box 7.5.
Box 7.5
Shortcomings in the work of audit authorities
Shortcomings Member State
of audit authority
Potential impact
The auditors did not always check all project selection and/or award criteria
Italy, Cyprus
Failure to detect ineligible expenditure
Audit conclusions not reliable
Limited assurance from the audit authority’s work
Insufficient audit trail or poor documentation of audit work
Greece, Cyprus, Lithuania, UK
The auditors did not always check all relevant available evidence to confirm the eligibility of target groups and declared expenditure or the reasonableness of costs
Italy, Cyprus
11 See key requirement 12 in the Annex to Commission Implementing Regulation
(EU) 2017/646.
199

Review of the Commission’s assessments of annual control reports
7.12. We reviewed DG HOME’s compliance assessments of audit authorities’ annual control reports, examining how it used these reports for clearance of the 2018 AMIF/ISF national accounts. To this end, we selected 12 reports12 and reviewed the corresponding DG HOME checks. We found that individual assessments were well structured and punctilious, and that they covered all the relevant legal aspects. DG HOME used the information in control reports appropriately for its clearance decisions.
7.13. However, our audit revealed two shortcomings, shown in Box 7.6, that could limit the reliance that the Commission can place on annual control reports.
Box 7.6
Shortcomings arising from the Commission’s assessments of annual control reports
Shortcomings Potential impact
The responsible authorities do not all use the same definition of ‘interim payment’13
Value and completeness of the reported data may be compromised
The Commission did not issue the audit authorities with guidance on how to calculate the minimum audit coverage of 10 %14 if they apply sub-sampling. In certain cases, the Commission found the work of the audit authorities to be insufficient.
Reliability of audit conclusions uncertain
12 From Bulgaria, Czechia, France, Netherlands, Austria, Portugal and Slovakia for AMIF;
Estonia, Spain, Iceland, Malta and Finland for the ISF.
13 The template for requests for payment of the annual balance of the AMIF/ISF funds defines interim payments as reimbursements for expenditure incurred by the beneficiary of an ongoing project. Some Member States also consider that advances can be interim payments, and we found that others had made several interim payments without first clearing advances.
14 Article 14(4) of Commission Delegated Regulation (EU) 2018/1291.
200

Annual activity reports and other governance arrangements 7.14. We reviewed the annual activity reports of DG HOME and DG JUST and found no information that might contradict our findings. However, our limited sample for 2019 (19 transactions) is not sufficient for us to compare our audit results with the information reported by the two DGs on the regularity of spending.
7.15. We reviewed the estimates produced by DG HOME and DG JUST for the risks at payment and at closure. We found that they were calculated in accordance with internal methodology and correctly reported in the AMPR.
201
Conclusion and recommendations 7.16. The audit scope for MFF heading 3 ‘Security and citizenship’ (see paragraph 7.6) was designed to contribute to our overall statement of assurance, rather than to be representative of spending under this heading. Therefore, we have not estimated the error rate for this MFF heading. Our examination of transactions and systems nevertheless highlighted three areas where there is scope for improvement (see paragraphs 7.10-7.13).
Recommendations
7.17. Based on our findings for 2019, we recommend that the Commission:
Recommendation 7.1 – Audit coverage
Issue guidance to the Member States’ audit authorities for AMIF and the ISF on how to calculate audit coverage if they apply sub-sampling. Advice should be given for ensuring that sampling is sufficient and appropriate to provide a reasonable basis for the auditor to draw conclusions about the entire audit population.
Timeframe: during 2021
202
Recommendation 7.2 – Sampling
Reiterate to the Member States’ audit authorities for AMIF and the ISF that they must follow the Commission’s instructions on sampling and calculating the error rate. Specifically, sampling should be random, each sampling unit in the population should have a chance of selection and, where applicable, all errors should be extrapolated to the relevant population.
Timeframe: during 2021
Recommendation 7.3 – Audit trail
Issue guidance to the Member States’ audit authorities for AMIF and the ISF to document the nature, timing and extent of their audit procedures, their results, and the audit evidence collected, in a sufficient and appropriate way.
Timeframe: during 2021
203
Chapter 8
Global Europe – MFF heading 4
204

Contents
Paragraph
Introduction 8.1.-8.5. Brief description 8.2.-8.4.
Audit scope and approach 8.5.
Regularity of transactions 8.6.-8.10.
Annual activity reports and other governance arrangements 8.11.-8.22. DG NEAR’s 2019 RER study 8.11.-8.18.
DG NEAR’s annual activity report 8.19.-8.21.
DG DEVCO’s annual activity report and RER study 8.22.
Conclusions and recommendations 8.23.-8.25. Conclusions 8.23.
Recommendations 8.24.-8.25.
Annexes Annex 8.1 — DG NEAR and DG DEVCO payments by delegation
Annex 8.2 — Follow-up of previous recommendations
205

Introduction 8.1. This chapter presents our findings for MFF heading 4 ‘Global Europe’. Box 8.1 gives an overview of the main activities and spending under this heading in 2019.
Box 8.1
MFF heading 4 ‘Global Europe’ – 2019 breakdown
(*) In line with the harmonised definition of underlying transactions (for details see Annex 1.1, paragraph 11).
Source: 2019 consolidated accounts of the European Union.
Other actions and programmes 1,7 (17,3 %)
Humanitarian aid 2,1 (20,4 %)
Instrument for Pre-accession assistance (IPA) 1,6 (15,7 %)
European Neighbourhood Instrument (ENI) 2,1 (20,6 %)
Development Cooperation Instrument (DCI) 2,6 (26,0 %)
Global Europe10,1
6,3 %
2019 payments as a share of the EU budget and breakdown(billion euros)
159,1 billion euros
interim / final payments: 2,8
prefinancing payments ⁽*⁾: 7,3
clearing of prefinancing ⁽*⁾: 5,2
trust fund disbursements: 0,2
total: 8,2
total: 10,1
0 2 4 6 8 10
Auditpopulation
Payments
2019 audit population compared to payments(billion euros)
206

Brief description
8.2. ‘Global Europe’ covers expenditure on all external action (foreign policy) funded by the EU general budget. These policies aim to:
— promote EU values abroad, such as democracy, rule of law and respect for human rights and fundamental freedoms;
— address major global challenges, such as climate change and biodiversity loss;
— increase the impact of EU development cooperation, with the aim of helping to eradicate poverty and promote prosperity;
— foster stability and security in candidate and neighbourhood countries;
— enhance European solidarity after natural or man-made disasters;
— improve crisis prevention and conflict resolution, preserve peace, strengthen international security and promote international cooperation;
— promote EU and mutual interests abroad by supporting the external dimension of EU policies.
8.3. The main directorates-general and services involved in implementing the external action budget are the Directorate-General for International Cooperation and Development (DG DEVCO), the Directorate-General for Neighbourhood Policy and Enlargement Negotiations (DG NEAR), the Directorate-General for Civil Protection and Humanitarian Aid Operations (DG ECHO), the Directorate-General for Regional and Urban Policy (DG REGIO) and the Service for Foreign Policy Instruments (FPI).
8.4. In 2019, payments for ‘Global Europe’ amounted to 10,1 billion euros1 and were disbursed using several instruments (see Box 8.1) and delivery methods such as work/supply/service contracts, grants, special loans, loan guarantees and financial assistance, budget support and other targeted forms of budgetary aid in more than 150 countries (see Annex 8.1).
1 Final implementation of payments, including assigned revenue.
207

Audit scope and approach
8.5. Applying the audit approach and methods set out in Annex 1.1, we examined the following for this MFF heading in 2019:
(a) a sample of 68 transactions, plus seven transactions which we took from the residual error rate (RER) studies2 and adjusted3 to compensate for their methodological limitations. The sample of transactions was designed to contribute to our overall statement of assurance rather than be representative of spending under MFF heading 4 ‘Global Europe’. Therefore, we have not estimated the error rate for this MFF heading. We sampled 22 DG NEAR, 25 DG DEVCO, 10 DG ECHO and 11 other transactions. For the part of our population covered by DG NEAR’s and DG DEVCO’s 2019 RER studies (10 %), we included 7 further transactions in our sample.
(b) the regularity information given in the annual activity reports of DG NEAR and DG DEVCO4 and its inclusion in the Commission’s Annual Management and Performance Report (AMPR).
2 DG NEAR and DG DEVCO contract RER studies annually to estimate the level of error
remaining after the completion of all management checks to prevent, detect and correct errors across their entire area of responsibility. An RER study does not constitute an assurance engagement or an audit; it is based on the RER methodology and the respective manuals of the DGs concerned.
3 Our reviews of RER studies have shown that, compared with our audit work, the methodology underlying DG DEVCO’s RER study includes far fewer on-the-spot checks. In addition, both DG DEVCO’s and DG NEAR’s RER studies allow less scope to examine procurement procedures. Therefore, as we did last year, we adjusted the results of the RER study to reflect the degree of non-compliance with public procurement rules. We based this adjustment on our 2014-2019 SoA findings for the ‘Global Europe’ and our testing of transactions selected from previous years’ RER studies (see paragraph 8.18).
4 The work on DG DEVCO’s AAR is presented in detail in our annual report on the 8th, 9th, 10th and 11th European Development Funds.
208

Regularity of transactions 8.6. Of the 68 transactions examined, 22 (32,4 %) were affected by errors. We identified 11 quantifiable errors which had a financial impact on the amounts charged to the EU budget. We also found 11 cases of non-compliance with legal and financial provisions. As the sample was not intended to be representative of spending under this heading, we have not estimated the overall error rate. In examining these transactions, we identified examples of effective internal control systems, such as the one described in Box 8.2. Our findings on ineligible expenditure are presented in Box 8.3 and Box 8.4.
Box 8.2
Effective checks by the Commission on payment claims under indirect management
DG NEAR
The EU funded an action worth 4,5 million euros to support SME competitiveness under the Deep and Comprehensive Free Trade Area (DCFTA) Adaptation programme in Georgia. The Commission signed a delegation agreement with a development bank and implemented the action under indirect management. It processed a payment claim from the bank requesting clearance of reported costs already incurred. We audited the Commission’s clearance in relation to this payment claim.
The Commission had analysed the financial report and found that the beneficiary had included pre-financing together with costs already incurred. Because pre-financing cannot be considered an incurred cost, it should not be included in the amount claimed. After in-depth analysis, the Commission had deducted more than 80 000 euros from the amount claimed.
209

Box 8.3
No time-recording system
FPI
We audited expenditure declared by a non-profit organisation under a grant contract signed with the Commission. The action was aimed at preventing violent extremism on Tunisia’s southern borders. The total estimated cost of the action was 1,2 million euros, funded entirely by the EU budget.
The supporting documents we examined showed that there was no time-recording system to justify the allocation of costs between different projects and substantiate the actual time worked on the project audited. This lack of audit trail meant that, out of a total audited amount of 970 000 euros, we were unable to verify the accuracy of 12 800 euros worth of expenditure, and this latter amount was therefore irregular. The absence of a time-recording system was also in breach of the contract terms and the beneficiary’s internal policies.
In 2019, we also detected time-recording issues in another three transactions managed by DG NEAR, DG CLIMA and DG ECHO.
Box 8.4
Ineligible VAT payments claimed for project
DG DEVCO
We audited expenditure declared by an international development bank under a delegation agreement signed with the Commission for an action aimed at supporting the infrastructure investment programme for South Africa. The total estimated budget for the project was more than 99 million euros, funded entirely by the EU.
The supporting documents audited showed that the total audited expenditure of 3,6 million euros included ineligible VAT of more than 300 000 euros.
In 2019, we detected VAT issues in another transaction managed by DG ECHO.
210

8.7. There are two spending areas where transactions are less prone to error due to payment conditions. These areas are (i) budget support and (ii) projects implemented by international organisations and subject to the ‘notional approach’. In 2019, we audited two budget support transactions and 25 projects managed by international organisations, including eight notional approach transactions (see paragraph 8.10). We did not detect any errors in these areas.
8.8. Budget support is a contribution to a state’s general budget or its budget for a specific policy or objective. Budget support payments financed by the EU general budget in 2019 amounted to 824 million euros. We examined whether the Commission had complied with the conditions governing budget support payments to partner countries and had verified that the general eligibility conditions (such as satisfactory improvement in public-sector financial management) had been met.
8.9. However, because the legal provisions leave broad scope for interpretation, the Commission has considerable flexibility in deciding whether these general conditions have been met. Our regularity audit cannot cover what happens beyond the moment the Commission pays aid to the recipient country, since these funds then merge with that country’s own budget resources5.
8.10. Under the ‘notional approach’, when contributions from the Commission to multi-donor projects are pooled with those from other donors and not earmarked for specific, identifiable, items of expenditure, the Commission assumes compliance with the EU eligibility rules provided that the total pooled amount includes sufficient eligible expenditure to cover the EU’s contribution. We took this approach into account in our substantive testing. In 2019, payments to international organisations from the EU general budget amounted to 3,2 billion euros. We cannot state the proportion of this sum to which the ‘notional approach’ applied, since the Commission does not monitor it separately.
5 A number of our special reports consider the efficiency and effectiveness of budget support,
the latest ones being special report 09/2019: ’EU support to Morocco - Limited results so far’ and special report 25/2019: ’Data quality in budget support: weaknesses in some indicators and in the verification of the payment for variable tranches’, (http://eca.europa.eu).
211

Annual activity reports and other governance arrangements
DG NEAR’s 2019 RER study
8.11. In 2019, DG NEAR had its fifth RER study carried out by an external contractor on its behalf to estimate the level of error remaining after the completion of all management checks to prevent, detect and correct errors across its entire area of responsibility. The study is an important element on which the Director-General bases his declaration of assurance and which feeds into the regularity information on ‘External Action’ disclosed in the AMPR.
8.12. The study reviews a representative sample of 365 transactions made under contracts closed between September 2018 and August 2019 (see Box 8.5).
Box 8.5
Source: ECA.
1 2 3 4 5 6 7 8 9 10 11 12 1 2 3 4 5 6 7 8 9 10 11 12 1 2 3 4 5 6 7 8 9 10 11 12
2006 - 2017 2018 2019 2020
2006 - 2017
In its 2019 AAR, the Commission provides assurance on 2018 expenditure based on the residual error rate study
For the 2019 AAR, DG DEVCO's and DG NEAR's residual error rate studies are based on
contracts closed between 1 September 2018 and 31 August 2019.
DG NEAR 2019 AAR
Input into
ECA 2019 annual report
Contracts closed between 1 September 2018 and 31
August 2019 relate to payments made between
2005 and 2018.
In its 2019 AR, the ECA reviews a sample of 68 interim/final payments and clearings of pre-financing from 2019. The sample is not representative, so we do not present an error rate in this chapter.
212
8.13. DG NEAR presented the results of the 2019 RER study in its AAR. The estimated overall RER for the DG was 0,53 %, i.e. below the 2 % materiality threshold set by the Commission. The previous two years’ RERs had been 0,67 % in 2017 and 0,72 % in 2018.
8.14. The RER study does not constitute an assurance engagement or an audit; it is based on the RER methodology and manual provided by DG NEAR. We have identified limitations that may contribute to the underestimation of the residual error rate. More specifically, the RER work does not sufficiently cover certain aspects of procurement procedures, such as the reasons for rejecting unsuccessful candidates or the winning tenderer’s compliance with all selection and award criteria; nor does it check the call for proposals procedures or direct award justifications.
8.15. Our analysis of the RER study found that, in order to take into account our recommendation6 to increase the weighting of direct management grants in the sample population, the Commission had introduced an additional error rate for such projects (the ‘grant rate’). This provided an additional basis for the Director-General to maintain the reservation previously made due to the high risk in direct management grants. Generally, for the RER sample, the contractor applies a materiality level of 2 % and a 95 % confidence level7. For the grant rate, however, the RER methodology provided a lower confidence level of 80 %, which led to a less precise estimate of the actual error rate for this part of the population. This approach does not reflect the high risk in this area. Even if a 95 % confidence level were applied for grants, the total sample of transactions would still be smaller than last year’s.
6 See recommendation 2 in chapter 9 of our 2017 annual report.
7 Probability that the level of error in the population lies within a certain interval (the ‘confidence interval’).
213

8.16. DG NEAR’s RER estimation method gives the contractor broad scope for interpretation in estimating individual errors. For example, in cases where no documents are provided for a transaction, it is left to the contractor’s discretion to estimate the error rate and determine the validity of the reasons given for their absence. This approach does not ensure consistent treatment of the same or similar findings. The RER contractor did not make any such estimates this year.
8.17. Lastly, we noted a decrease in the number of transactions for which no substantive testing had been performed due to the RER study’s full reliance on previous control work. The number of full-reliance transactions in 2019 was 63 (17,2 %), compared to 118 (23,6 %) in 2018 and 57 (12,2 %) in 2017. However, we saw an increase in partial-reliance transactions (33,3 % in 2019 compared to 25,3 % in 2018). In both years, full-reliance and partial-reliance transactions together accounted for approximately 50 % of the total sample. The purpose of the RER study is to measure ‘errors that have evaded all prevention, detection and correction controls’. By relying fully or partially on the results of previous controls for half of the sampled transactions, the RER does not fully measure these errors. Over-reliance on the work of others could affect the achievement of the main objective of the RER study by impacting the residual error rate.
8.18. In our 2017 and 2018 annual reports, we reported on limitations in DG NEAR’s RER study methodology. As a result, for our 2018 and 2019 statements of assurance, we performed additional checks in areas where we had found such limitations. For 2019, we randomly selected six transactions from previous RER studies – an average of two transactions per EU delegation visited. Three of them were affected by errors.
214

DG NEAR’s annual activity report
8.19. For the 2019 financial year, we reviewed DG NEAR’s 2019 annual activity report and found no information that might contradict our findings.
8.20. DG NEAR estimated the total amount at risk at the time of payment for expenditure accepted in 2019 (2,8 billion euros) to be 23,9 million euros (0,84 % of the 2019 accepted expenditure). Of this total amount at risk, it estimated that 8,8 million euros (36,8 %) would be corrected by its checks in subsequent years8. This led the Director-General to declare that the DG’s financial exposure was below the materiality threshold of 2 %. Considering that we do not have a representative sample to estimate an error rate for the MFF heading ‘Global Europe’, we are unable to review this statement against the results of our audit work.
8.21. DG NEAR did not refer to the limitations of the RER study in its AAR. It nevertheless made efforts to adopt a prudent approach when analysing recovery orders. In its calculation of corrective capacity, it included only amounts recovered due to irregularities and errors detected ex post, thereby avoiding overstatement, in line with our previous recommendations.
DG DEVCO’s annual activity report and RER study
8.22. Our review of DG DEVCO´s 2019 annual activity report and RER study is presented in detail in our annual report on the 8th, 9th, 10th and 11th European Development Funds.
8 The amount at risk at closure represents the difference between the amount at risk at
payment and the estimated corrections (15,1 million euros in 2019).
215
Conclusions and recommendations
Conclusions
8.23. The sample of transactions was designed to contribute to our overall statement of assurance rather than be representative of spending under MFF heading 4 ‘Global Europe’. Therefore, we have not estimated the error rate for this MFF heading (see paragraph 8.5). Our examination of transactions and systems nevertheless highlighted three areas where there is scope for improvement.
Recommendations
8.24. Annex 8.2 shows the findings of our follow-up review of the four recommendations we made in our 2016 annual report, which either required immediate action or were due to be implemented by 2019. The Commission had implemented three of them in full and one partially9.
8.25. Based on this review and our findings and conclusions for 2019, we recommend that the Commission:
Recommendation 8.1
Disclose the limitations of the RER study in DG NEAR’s 2020 AAR and future AARs.
Timeframe: by the time the next AAR is published in Q1 2021
9 DG NEAR’s 2019 AAR did not disclose the scope of the RER study.
216
Recommendation 8.2
Increase the confidence level DG NEAR uses in its methodology for calculating the grant rate to the same level applied to the rest of RER population, to reflect more accurately the higher risk in the area of direct management grants.
Timeframe: by the end of 2021
Recommendation 8.3
Strengthen DG NEAR’s, DG DEVCO’s, DG ECHO’s, DG CLIMA’s and FPI’s checks by identifying and preventing recurrent errors (e.g. lack of time-recording systems and charging ineligible VAT to EU-funded projects).
Timeframe: by the end of 2021
217

Annexes Annex 8.1 — DG NEAR and DG DEVCO payments by delegation
* This designation shall not be construed as recognition of a State of Palestine and is without prejudice to the individuals positions of the Member States on this issue.
Sources: Map background ©OpenStreetMap contributors licensed under the Creative Commons Attribution-ShareAlike 2.0 licence (CC BY-SA) and European Court of Auditors, based on the 2019 consolidated annual accounts of the European Union.
Top 7 DG NEAR(million euros)
1. Palestine*2. Morocco3. Turkey4. Tunisia5. Moldova6. Jordan7. Serbia
145135
99 86656358
218

Sources: Map background ©OpenStreetMap contributors licensed under the Creative Commons Attribution-ShareAlike 2.0 licence (CC BY-SA) and European Court of Auditors, based on the 2019 consolidated annual accounts of the European Union.
Top 5 DG DEVCO(million euros)
1. Afghanistan2. Niger3. Burkina Faso4. Mali 5. Ethiopia
1259484 8365
219
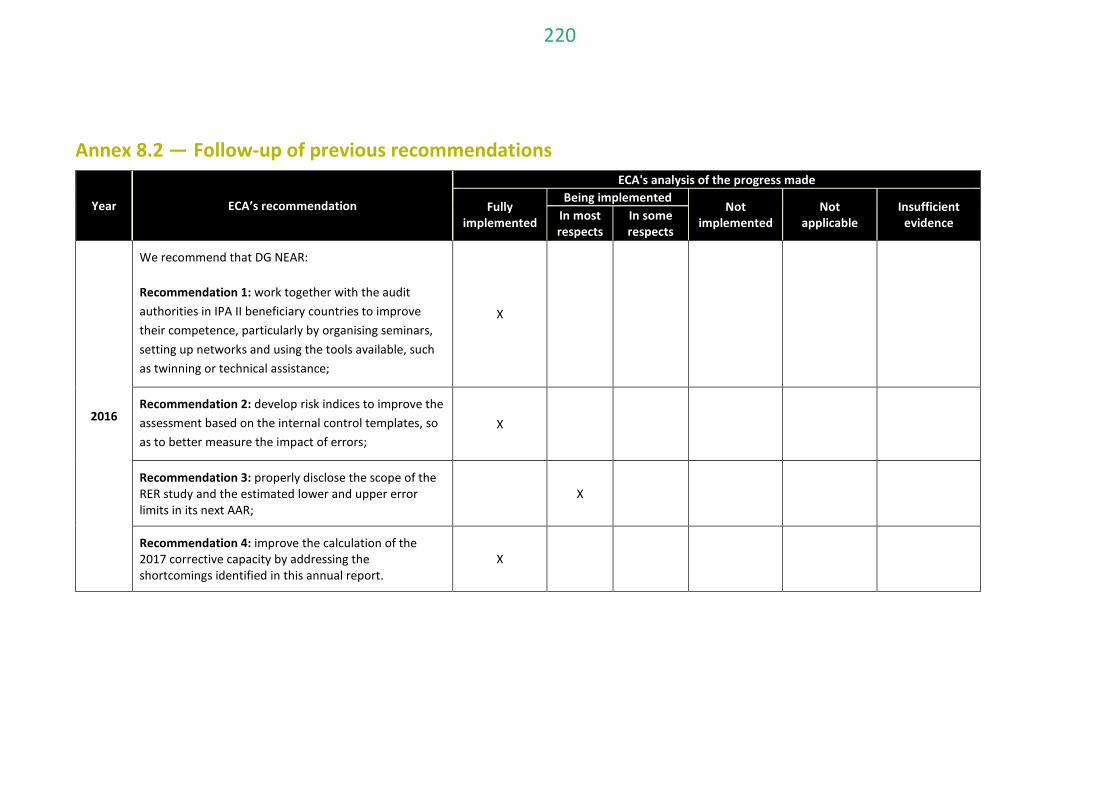
Annex 8.2 — Follow-up of previous recommendations
Year ECA’s recommendation
ECA's analysis of the progress made
Fully implemented
Being implemented Not
implemented Not
applicable Insufficient
evidence In most respects
In some respects
2016
We recommend that DG NEAR:
Recommendation 1: work together with the audit authorities in IPA II beneficiary countries to improve their competence, particularly by organising seminars, setting up networks and using the tools available, such as twinning or technical assistance;
X
Recommendation 2: develop risk indices to improve the assessment based on the internal control templates, so as to better measure the impact of errors;
X
Recommendation 3: properly disclose the scope of the RER study and the estimated lower and upper error limits in its next AAR;
X
Recommendation 4: improve the calculation of the 2017 corrective capacity by addressing the shortcomings identified in this annual report.
X
220

Chapter 9
Administration – MFF heading 5
221

Contents
Paragraph
Introduction 9.1.-9.5. Brief description 9.3.
Audit scope and approach 9.4.-9.5.
Regularity of transactions 9.6.-9.12. Observations on the sample of transactions 9.7.-9.9. European Parliament 9.8.
European Commission 9.9.
Observations on supervisory and control systems 9.10.-9.12. European Economic and Social Committee 9.11.-9.12.
Annual activity reports 9.13.
Observations on institutions and bodies 9.14.-9.19. Increase in the number of contract staff and the related budget appropriations from 2012 to 2018 9.14.-9.19.
Conclusion and recommendations 9.20.-9.22. Conclusion 9.20.
Recommendations 9.21.-9.22.
Annexes Annex 9.1 – Results of transaction testing for ‘Administration’
Annex 9.2 – Follow-up of previous recommendations
222
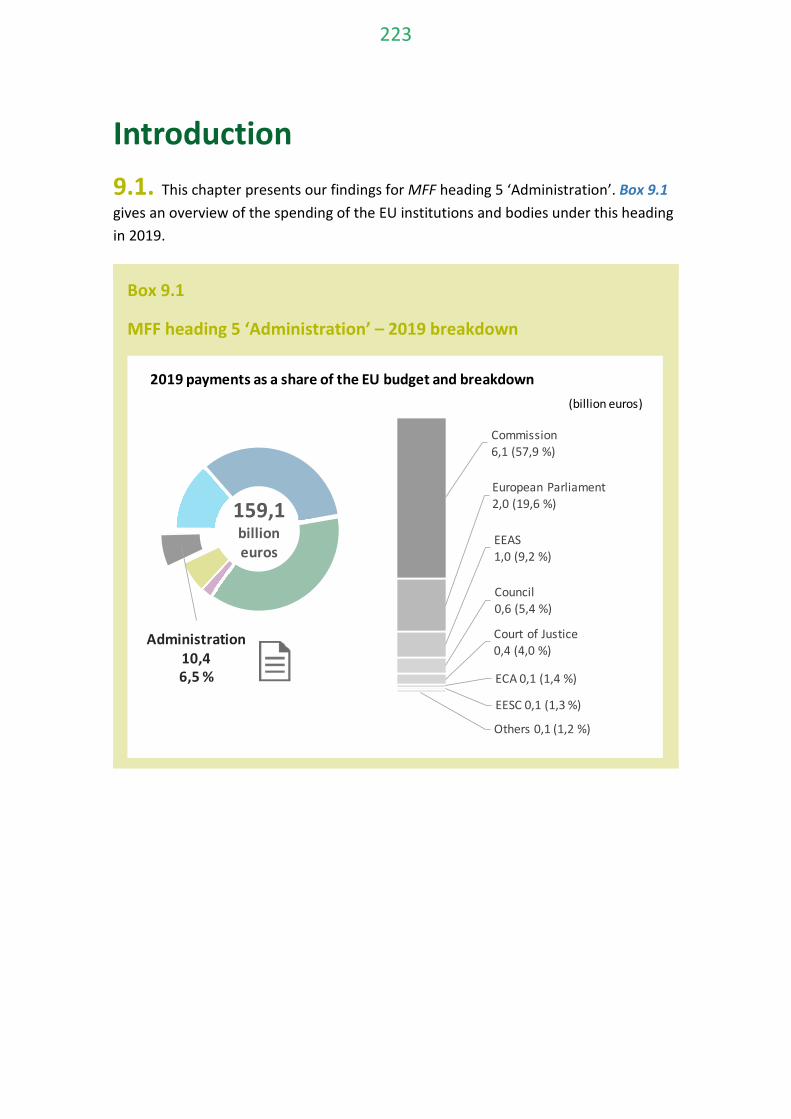
Introduction 9.1. This chapter presents our findings for MFF heading 5 ‘Administration’. Box 9.1 gives an overview of the spending of the EU institutions and bodies under this heading in 2019.
Box 9.1
MFF heading 5 ‘Administration’ – 2019 breakdown
Others 0,1 (1,2 %)
EESC 0,1 (1,3 %)
ECA 0,1 (1,4 %)
Court of Justice 0,4 (4,0 %)
Council 0,6 (5,4 %)
EEAS 1,0 (9,2 %)
European Parliament 2,0 (19,6 %)
Commission 6,1 (57,9 %)
Administration 10,4 6,5 %
2019 payments as a share of the EU budget and breakdown(billion euros)
159,1billion euros
223

(*) Pre-financing includes payments in line with the harmonised definition of underlying transactions (for details see Annex 1.1, paragraph 11).
Source: 2019 consolidated accounts of the European Union.
9.2. We report separately on the EU agencies and other bodies1 and on the European Schools2. Our mandate does not cover the financial audit of the European Central Bank.
Brief description
9.3. Administrative expenditure comprises expenditure on human resources, which accounts for about 60 % of the total, and on buildings, equipment, energy, communications and information technology. Our work over many years indicates that this spending is low-risk.
1 Our specific annual reports on agencies and other bodies are published in the Official
Journal.
2 We issue a report on the annual accounts to the Board of Governors of the European Schools, with copies to the European Parliament, the Council and the Commission.
interim / final …interim / final payments: 10,3
prefinancing payments ⁽*⁾: 0,1
clearing of prefinancing ⁽*⁾: 0,1
total: 10,4
total: 10,4
0 2 4 6 8 10
Auditpopulation
Payments
2019 audit population compared to payments(billion euros)
224

Audit scope and approach
9.4. Applying the audit approach and methods set out in Annex 1.1 we examined the following for this MFF heading:
(a) a sample of 45 transactions, which was designed to be representative of the full range of spending under this MFF heading. Transactions were sampled from each EU institution and body. Our objective was to contribute to the overall statement of assurance, as described in Annex 1.1;
(b) the supervisory and control systems of the European Economic and Social Committee, the European Committee of the Regions and the European Data Protection Supervisor (EDPS)3;
(c) the regularity information in the annual activity reports of all the institutions and bodies, including those of the Commission’s directorates-general (DGs) and offices primarily responsible for administrative expenditure4, and that information’s general consistency with our own results;
(d) the increase in the number of contract staff, and the related payments, from 2012 to 2018 at all institutions and bodies (including the executive agencies, but excluding the Ombudsman, the EDPS, decentralised agencies, Joint Undertakings and the European Institute of Innovation and Technology).
9.5. Our own spending is audited by an external firm5. The results of its audit of our financial statements for the year ending 31 December 2019 are covered by paragraph 9.7.
3 Our audit included an examination of the following specific elements of each system:
internal control standards, risk management, ex-ante and ex-post controls, register of exceptions, management supervision, internal audit reports and anti-fraud measures.
4 DG Human Resources and Security (HR), Office for the Administration and Payment of Individual Entitlements (PMO), Offices for Infrastructure and Logistics in Brussels (OIB) and Luxembourg (OIL), and DG Informatics (DIGIT).
5 PricewaterhouseCoopers, Société à responsabilité limitée, Réviseur d'Entreprises.
225

Regularity of transactions 9.6. Annex 9.1 provides an overview of the results of transaction testing. Of the 45 transactions examined, 3 (6,7 %) contained quantifiable errors. The errors we have quantified led to an estimated level of error below the materiality threshold.
Observations on the sample of transactions
9.7. The issues discussed in paragraphs 9.8 and 9.9 concern the European Parliament and the Commission. We did not identify any specific issues concerning the Council, the Court of Justice, the Court of Auditors, the European Economic and Social Committee, the European Committee of the Regions, the European Ombudsman, the EDPS or the European External Action Service (EEAS).
European Parliament
9.8. We detected errors in one payment to a European political party. These concerned non-compliance with the expenditure eligibility rules: no procurement procedure, no written contractual documents and no supporting evidence for costs actually incurred. We have previously reported similar shortcomings in transactions relating to political groups and to a European political party6.
European Commission
9.9. We found fewer errors relating to staff costs and the PMO’s management of family allowances than in previous years7. The PMO has already corrected the errors we found this year.
6 See paragraph 9.11 of the 2014 annual report, paragraph 9.11 of the 2015 annual report,
paragraph 10.15 of the 2016 annual report.
7 See paragraph 10.8 of the 2018 annual report.
226
Observations on supervisory and control systems
9.10. Other than the points raised in paragraphs 9.11 and 9.12, which mainly concern policies for dealing with sensitive functions, we did not identify any specific issues with the supervisory and control systems of the European Economic and Social Committee, the European Committee of the Regions or the EDPS.
European Economic and Social Committee
9.11. The European Economic and Social Committee (EESC) has not yet developed a sensitive functions policy in line with its internal control standards. It has issued no definition of sensitive posts or functions, nor has it performed a risk analysis with a view to adopting mitigating controls and, ultimately, an internal mobility policy. All this would be needed given the body’s size and the nature of its work.
9.12. We also found that the EESC has not carried out a comprehensive risk assessment since 2014. Only one directorate has identified the risks to the achievement of its objectives, but without yet proposing mitigating controls that would reduce those risks to an acceptable level.
227

Annual activity reports 9.13. The annual activity reports we reviewed did not identify material levels of error.
228
Observations on institutions and bodies
Increase in the number of contract staff and the related budget appropriations from 2012 to 2018
9.14. The adoption in 2014 of the revised Staff Regulations was accompanied by a commitment by the institutions and bodies gradually to reduce the number of posts (officials and temporary staff) in their establishment plans8 by 5 % before 2018 compared with the situation in 2012. We examined this in our annual report for 2016 and published a rapid case review on the subject in late 20179. Our audit work for 2019 included an additional analysis of the use of contract staff from 2012 to 2018 (see Box 9.2).
8 The establishment plan sets out the number of posts available to an institution, body or
agency for permanent and temporary staff.
9 See paragraphs 10.9 to 10.13 of our 2016 annual report and ECA review 02/2017: Rapid case review on the implementation of the 5 % reduction of staff posts (www.eca.europa.eu).
229

Box 9.2
The Staff Regulations and contract staff
Under Articles 3a and 3b of the Conditions of Employment of Other Servants of the EU (CEOS), contract staff are recruited on contracts that can be converted into a contract of indefinite duration or fixed-term contracts from a minimum of 3 months to a maximum of 6 years, respectively. They are often paid from the budget for external staff and are not assigned to posts in the establishment plan.
Contract staff are employed in four function groups (FG I to FG IV). Article 80 of the CEOS establishes a link between each function group (FG) and the duties they may perform:
o FG I for manual and administrative support service tasks;
o FG II for clerical and secretarial tasks, office management and other equivalent tasks;
o FG III for executive tasks, drafting, accountancy and other equivalent technical tasks;
o FG IV for administrative, advisory, linguistic and equivalent technical tasks.
9.15. We found that the institutions and bodies10 had reduced their establishment plans by 1 409 posts (3 %) and at the same time gradually increased the employment of contract staff. Over the period, the proportion of contract staff in total workforce11 forecasts rose from 17 % to 22 %12.
9.16. The increase in the headcount of contract staff at year-end (see Box 9.3) differs significantly from one institution, body or executive agency to another. While this is partly due to differences in the size of the entities, it also reflects the impact on staffing levels of new tasks stemming from rapidly evolving priorities, such as:
10 This section does not cover staff numbers at the European Ombudsman or the EDPS.
11 Workforce is defined here as permanent and temporary officials and contract staff. It does not include other contractual relationships, such as local employees, interim staff, seconded national experts, trainees, etc.
12 In 2018, the proportion was 21 % for the Commission, 21 % for the European Parliament, 24 % for the EEAS and 77 % for the executive agencies. It was much lower for other institutions and bodies.
230

— additional work performed by the Joint Research Centre (JRC) on behalf of other Commission departments and third parties and the replacement of grant holders previously employed under national law13 by a large number of scientific and technical support officers recruited in FG IV;
— the implementation of new programmes14 delegated by the Commission to the executive agencies which was neutral in budgetary terms and in terms of Commission staff transferred;
— the internalisation of support services at the European Parliament (security staff and drivers employed in FG I);
— the new responsibilities placed on the EEAS, notably in the areas of the common security and defence policy and the action plan against Disinformation. The EEAS also strengthened the physical and IT security in EU Delegations.
9.17. The increase in contract staff was also a response to special or urgent situations, such as the migration crisis. Finally, for some institutions, there was an increase in FG I contract staff as a result of the conversion of permanent and temporary posts for clerical/secretarial assistants into contract staff.
13 During 2012-2018, the year-end headcount of FG IV contract staff at the JRC increased from
38 to 845.
14 These included the new Framework Programme for Research and Innovation (Horizon 2020) and a number of programmes relating to transport, energy and ICT (under the Connecting Europe Facility); competitiveness and SMEs (COSME); education, culture and citizenship (Creative Europe, Erasmus +, Europe for Citizens); health and consumers (Better training for safer food, Health for Growth and Consumer programmes); and environment and climate actions (LIFE). See SEC(2013) 493 final of 18.9.2013 “Communication to the Commission on the delegation of the management of the 2014-2020 programmes to executive agencies”.
231

Box 9.3
Increase in the number of contract staff employed by EU institutions, bodies and executive agencies at year-end, 2012-2018
Source: ECA, based on data supplied by the EU institutions, bodies and executive agencies.
9.18. At the end of 2018, the institutions, bodies and executive agencies employed 11 962 contract staff, an increase of 37 % since 2012. Most were employed by the European Commission, mainly in FG IV, the best paid function group. Similarly, a majority of contract staff at the executive agencies were in FG III and FG IV (763 and 715 respectively). Box 9.4 shows the year-on-year change in the number of contract staff in each function group.
5 921
7 238
5 000
6 000
7 000
2012 2013 2014 2015 2016 2017 2018
1 202
1 879
843
1 866
322 444
421 535
0
500
1 000
1 500
2 000
2012 2013 2014 2015 2016 2017 2018
22 %
121 %
56 %
38 %
27 %
European Commission
Other EU institutions
EEAS
European Parliament
Executive Agencies
contract staff
contract staff
232

Box 9.4
Year-on-year increase in contract staff payroll and headcount by function group, 2012-2018
Source: ECA, based on data supplied by the EU institutions, bodies and executive agencies.
9.19. During the period under review, the salary bill for permanent and temporary staff employed by the institutions, bodies and executive agencies increased by 12 %, while total payments to contract staff rose by 59 %. The main drivers of both increases were the expansion of the total workforce, followed by the annual indexation of pay, staff promotions and increases in step within grades. For contract staff, the steeper rise also resulted from an increase in the proportion of FG III and FG IV staff among all contract staff. The total salary bill for permanent and temporary staff and contract staff increased by 15 %, from 4 116 million euro in 2012 to 4 724 million euro in 2018.
229
365
200
300
400
2012 2013 2014 2015 2016 2017 2018
1 346 FGI; 2 107
3 266 FGII; 2 904
1 801
FGIII; 2 661 2 296
FGIV; 4 290
1 000
2 000
3 000
4 000
2012 2013 2014 2015 2016 2017 2018
8 709
11 962
8 000
10 000
12 000
2012 2013 2014 2015 2016 2017 2018
million euros 59 %
87 %
48 %
Contract staff payroll up by 59 % …
contract staff
… mainly because of changes in the relative strength of the FGs…
… and an overall increase in the number of contract staff.
contract staff 37 %
- 11 %
57 %
233

Conclusion and recommendations
Conclusion
9.20. The overall audit evidence we obtained and have presented in this chapter indicates that the level of error in spending on ‘Administration’ was not material (see Annex 9.1).
Recommendations
9.21. Annex 9.2 shows the findings of our follow-up review of the recommendation we made to the European Parliament in our 2016 annual report about political groups. Given the errors we found for 2019 in a payment to a European political party (see paragraph 9.8), we consider that this recommendation is still valid.
9.22. Based on this review and our findings and conclusion for 2019, we recommend that:
Recommendation 9.1 – European Economic and Social Committee
The European Economic and Social Committee implement a policy for dealing with sensitive functions, drawing on a comprehensive risk assessment leading to the identification of mitigating controls which take into account the Committee’s size and the nature of its work (see paragraphs 9.11 and 9.12).
Timeframe: by the end of 2021.
234

Annexes
Annex 9.1 – Results of transaction testing for ‘Administration’
2019 2018
SIZE AND STRUCTURE OF THE SAMPLE
Total transactions: 45 45
ESTIMATED IMPACT OF QUANTIFIABLE ERRORS
Estimated level of error Free from material
error
Free from material
error
235

Annex 9.2 – Follow-up of previous recommendations
Year ECA recommendation
ECA's analysis of the progress made
Fully implemented
Being implemented Not
implemented Not
applicable Insufficient
evidence In most respects
In some respects
2016
We recommend that: Recommendation 1: the European Parliament review its framework for monitoring the implementation of budget appropriations allocated to political groups. It should also provide better guidance to political groups and monitor more effectively how they apply the rules for authorising and settling expenditure, and how they carry out procurement procedures (see paragraph 10.15).
X
236

Institutions’ replies to the annual report on the implementation of the EU budget for the 2019 financial year
237

Contents Page
Chapter 1 The statement of assurance and supporting information
European Commission’s replies 239
Chapter 2 Budgetary and financial management
Consolidated replies of the European Commission and the European Investment Bank 248
Chapter 3 Revenue
European Commission’s replies 255
Chapter 4 Competitiveness for growth and jobs
European Commission’s replies 259
Chapter 5 Economic, social and territorial cohesion
European Commission’s replies 266
Chapter 6 Natural resources
European Commission’s replies 275
Chapter 7 Security and citizenship
European Commission’s replies 279
Chapter 8 Global Europe
European Commission’s replies 280
Chapter 9 Administration
European Parliament's replies 283
Replies of the European Economic and Social Committee 284
238

EN EN
REPLIES OF THE COMMISSION TO THE EUROPEAN COURT OF AUDITORS’ 2019 ANNUAL REPORT
“CONTRIBUTION TO ANNUAL REPORT 2019 – CHAPTER 1 – THE STATEMENT OF ASSURANCE AND SUPPORTING INFORMATION”
INTRODUCTION
Common Commission reply to paragraphs 1.1. to 1.6:
2019 was the final year of the 2014-2019 legislature, thus the focus was on completing work on the priorities of the Juncker Commission and preparing the transition to a new Commission led by President von der Leyen.
The EU budget contributes to strengthening the European economy and making it more resilient.
The Commission attaches great importance to ensuring that the EU budget is spent responsibly and correctly, and to working with all parties involved to make sure that it delivers tangible results on the ground.
The Commission carefully monitors the implementation of the EU budget. If Member States, intermediaries or final beneficiaries are found to have spent EU money incorrectly, the Commission takes immediate steps to correct these errors, and recover the funds as necessary.
The Commission has carefully analysed the annual report of the ECA. This report, as was the case in the past, will contribute to further achieve the highest standards in financial management. The Commission endeavours to strike the right balance between a low level of errors, fast payments and reasonable costs of controls.
Thanks to the efforts of the ECA and of the Commission, the financial management of the EU budget has improved over time and the error levels have decreased to ranges getting closer to the 2% materiality threshold in the recent years, except in some specific policy areas. REGULARITY OF TRANSACTIONS
Error continues to be present in specific types of spending
1.18 a) Concerning the revenue side of the EU budget, the Commission agrees with the ECA that this area is free from material error.
Referring to Traditional Own Resources, the Commission is improving its risk assessment for the planning of the inspections and continues to strive to close long outstanding open points rapidly, depending also on Member States’ cooperation.
Moreover, the Commission has made important steps to help identifying the riskiest economic operators at EU level for post-release audits, with the flagging of transactions considered to pose financial risk under the Financial Risk Criteria and the update of the Customs Audit Guide. It works closely with Member States to find solutions to identify importers operating in Member States other than where they are headquartered. Further progress will be achieved once an EU-wide database covering all imports will be fully available (see Commission replies to paragraphs 3.11 to 3.15).
239

EN EN
b) As regards the expenditure side of the EU budget, the Commission’s own estimate of the risk at payment for the 2019 relevant expenditure is 2,1%. This is indeed just above the materiality threshold of 2%.
However, given the multi-annual nature of its expenditure and its control strategies, the Commission, as manager of the EU budget, may apply corrections until the closure of the funding programme. In order to take this into account, the Commission also estimates a risk at closure, which corresponds to the risk at payment less the estimated future corrections for the concerned segments of expenditure/programmes.
The risk at closure is estimated at 0,7% for the whole EU budget for 2019. This is well below the 2% materiality threshold, in line with both the levels reached in previous years since 2016 and with the objective of the Commission.
This shows that once the Commission and Member States will have been given time to exercise their corrective capacity and the Commission to use the supervisory tools at its disposal in line with its obligations under the different sectorial legal bases, the real risk at closure will ultimately be well below 2% even for each reporting year.
As regards high-risk expenditure, complex rules indeed contribute to a higher risk of error. The Commission is therefore continuously working to simplify rules to the extent possible and to increase the use of simpler delivery mechanisms such as simplified cost options. Reducing red tape for beneficiaries and reducing complexity was one of the guiding principles for the Commission’s proposals for the next Multiannual Financial Framework, which also took into account recommendations made by the ECA in previous years.
As manager of the EU budget, the Commission appropriately tailors its common methodology to the specificities of the risk, control and management environments of the different spending areas, in order to effectively fulfil its reporting obligations and protect the EU budget (see also the Commission reply to paragraph 1.34).
Thanks to its own detailed management assessment per programme (see 2019 Annual Management and Performance Report, p. 61-62), the Commission considers that the amounts at risk at payment below the materiality threshold of 2% account for 54% of the relevant expenditure and those above 2% for 46%.For expenditure that is considered high risk, the Commission, based on its risk assessment, makes a detailed identification of those programmes that it considers high risk and of those that it considers low risk (i.e. with an estimated level of error lower than the materiality threshold of 2%). This contributes to the Commission's conclusion that slightly less than half of the relevant expenditure is affected by material error. (See also the Commission replies to paragraphs 1.21-25, 29 and 44.).
The Commission finally notes with satisfaction that the policy area natural resources continues its downtrend with a further decrease to an estimated level of error of 1.9%, which is below the materiality threshold. This is consistent with the error rates published in the 2019 Annual Activity Reports of DG AGRI, DG MARE, DG ENV and DG CLIMA, as per the Commission’s reply to paragraph 6.8.
The complexity of rules and the way EU funds are disbursed have an impact on the risk of error
Common Commission reply to paragraphs 1.19 and 1.20:
240
EN EN
First indent - The Commission welcomes the fact that both the ECA and the Commission reach the same conclusion that the low-risk (mainly entitlement-based) expenditure continues to be free from material error.
Second indent - The Commission also considers that complex rules contribute to a higher risk of error. It is therefore continuously working to simplify rules to the extent possible and increase the use of simpler delivery mechanisms such as simplified cost options. Reducing red tape for beneficiaries and reducing complexity was one of the guiding principles for the Commission’s proposals for the next Multiannual Financial Framework, which also took into account recommendations made by the ECA in previous years. However, the Commission also aims at setting ambitious objectives to increase the performance of programmes. Complex conditions and eligibility rules are inherent to the concerned policies or apply where, in order to achieve ambitious policy objectives, targeting of aid is necessary or in order to respect basic principles of the Single Market (public procurement or State aid rules). Legality and regularity must therefore be balanced with the achievement of policy objectives while bearing in mind the delivery costs.
The Commission is giving support to all implementing authorities in Member States and other implementing partners through various actions, meetings and guidance notes and verifies that sufficient audits are carried out in addition to its own audits to better prevent and correct errors and more generally strengthen the Member States’ capacity to deal with the provisions of the current programming period.
In particular, for cohesion, actions focus on the need to favour the use of simplified cost options and promote enhanced transparency and administrative capacity on public procurement and State aid procedures, following the implementation and constant updates of the updated Public Procurement and State Aid Action Plans.
More than half of our audit population is affected by material error
Common Commission reply to paragraphs 1.21 and 1.22:
The Commission applies risk-differentiated control strategies, putting more efforts on high-risk programmes and expenditures.
Based on its own detailed management analysis per programme (see 2019 Annual Management and Performance Report, p. 61-62), the Commission considers that the amounts at risk at payment below the materiality threshold of 2% account for 54% of the total relevant expenditure and those above 2% for 46%. Therefore, the Commission considers that slightly less than half of the relevant expenditure is affected by material error.
This relates to: the European Regional Development Fund, and the Cohesion Fund (maximum 3,8%); the European Social Fund (maximum 2,4%); under Natural Resources: market measures and rural development (2,7%); Horizon 2020 research grants; other complex grants.
Due to the (risk-based) controls in place, for expenditure that is considered high-risk, the Commission makes a detailed identification of those programmes that it considers high risk and of those that it considers low risk (i.e. with an estimated level of error lower than the materiality threshold of 2%. The expenditure considered as low risk concerns for example some Horizon 2020 segments (Marie Skłodowska-Curie actions; European Research Council grants) and other expenditure classified under the 'Competitiveness' heading (the European Space Agency and Global Navigation Satellite Systems Agency; the Connecting Europe Facility; Erasmus+), plus a large part of the 'Global Europe' expenditure.
241

EN EN
1.23 Concerning Cohesion, the Commission notes that the level of error calculated by the ECA for Cohesion is lower than last year.
The Commission reports in the AMPR and in the AARs an error range for cohesion policy which is within the error range calculated by the ECA. The Commission believes its detailed assessment reflects a reasonable and fair estimate of the error rates for each programme and cumulatively for all programmes. The Commission further refers to the error ranges including maximum risks (worst-case scenarios) disclosed in the 2019 AMPR and AARs of DG REGIO and DG EMPL, resulting from a detailed analysis of the situation of each of the 420 programmes. For ERDF and CF, the error range is between 2,7 % and 3,8 % and for ESF between 1,7 % and 2,4 %. As is always the case, the Commission is following up all errors found by its services and by the ECA and requests additional financial corrections, where deemed necessary. It will also analyse with the concerned audit authorities the underlying reasons for these remaining issues and how they can be further settled. Finally, the Commission notes that it has the necessary tools in place to identify the programmes or parts of programmes at risk and to take additional corrective measures, including additional financial corrections as necessary, to ensure over time a residual error below 2% for all programmes in each accounting year.
Concerning the actions taken to reduce the errors, the Commission addressed updated guidance to Member States for the 2014-2020 programming period which, combined with the required use of simplified costs options, aim to improve further the quality of management verifications.
The Commission has elaborated a Public Procurement Action Plan, updated several times since 2014 and a common State Aid Action Plan. These actions aim at helping administrators and beneficiaries of EU funds improve their public procurement practices and reduce the risk of irregularities linked to the application of State aid rules, through training programmes and dissemination of relevant information to ESI Funds stakeholders.
1.24 Referring to natural resources, the Commission is satisfied with the ECA's finding (Chapter 6, paragraph 6.11) that EAGF direct payments, representing 70% of spending under natural resources, continues to be free of material error and the estimated level of error for all the chapter is below the materiality threshold. This conclusion is consistent with the Commission's own management assessment (cf. the error rate for direct payments as reported in DG AGRI’s 2019 Annual Activity Report and presented in the 2019 AMPR).
The Commission also considers that the higher-risk expenditure relates to market measures (2,8 % risk at payment) and rural development (2,7 % risk at payment).
However, based on its own detailed management assessment per programme (see 2019 Annual Management and Performance Report, p. 61-62), the Commission considers the Maritime and Fisheries Fund (EMFF) to be low risk, given that its risk at payment is below 2%.
1.25 Concerning Competitiveness, the Commission considers that the higher-risk expenditure under this chapter relates to parts of Horizon 2020 and shares the opinion about the main sources of errors.
However, based on its own detailed management assessment per programme (see 2019 Annual Management and Performance Report, p. 61-62), the Commission considers that some parts of "research" and/or "competitiveness" programmes (cf. Marie Skłodowska-Curie actions; European Research Council grants; the European Space Agency and Global Navigation Satellite Systems Agency; the Connecting Europe Facility; Erasmus+) are low risk given that their estimated risks at payment are below 2%.
242

EN EN
1.26 Referring to Global Europe, based on its own detailed management assessment per programme (see 2019 Annual Management and Performance Report, p. 61-62), the Commission considers that the lower-risk expenditure under this chapter is not limited to merely the budget support segment.
As transparently reported in the Annual Activity Reports of the External Relations DGs, most of the direct and indirect management segments have a low risk at payment (except ENI-IPA direct management grants, for which DG NEAR has issued a reservation and set up an action plan).
Eligibility errors are still the biggest contributor to the estimated level of error for high-risk expenditure
1.27 The Commission agrees that complex rules indeed contribute to a higher risk of error. It is therefore continuously working to simplify rules to the extent possible and increase the use of simpler delivery mechanisms such as simplified cost options. Reducing red tape for beneficiaries and reducing complexity was one of the guiding principles for the Commission’s proposals for the next Multiannual Financial Framework, which also took into account recommendations made by the ECA in previous years.
1.28 Common Commission reply to paragraphs 1.27 and 1.28:
As EU spending programmes are multiannual by design, the related control systems and management cycles also cover multiple years. This means that while errors may be detected in a given year, they are corrected in the current or in subsequent years after the payment was made – up until the moment of closure, at the end of the programmes’ life cycle. In 2019, the corrective measures confirmed amounted to EUR 1.5 billion (25% higher than in 2018). These relate mainly to errors affecting payments made in previous years.
In 2019, as regard cohesion, audit authorities reported for the second year irregularities they found in their audit of operations following a common error typology agreed with the Commission and shared between the Member States.
Most of the irregularities identified by audit authorities and the Commission concern the same main categories as identified by the ECA: ineligible expenditure, public procurement issues, deficient audit trail. This shows that audit authorities appropriately detect the different types of irregularities contributing to the error rate, but not entirely in all cases. This is inherent to complex projects and rules.
The Commission continues to analyse with the concerned audit authorities the underlying reasons for these remaining issues and how they can be further settled.
For the Common Agricultural Policy expenditure, the reasons and concerned Paying Agencies have been identified and Action Plans requested where considered necessary.
For H2020 programme, the Commission has taken actions such as simplification of the model grant agreement, clearer communication on eligibility rules and further extending lump sum financing.
We did not find a material level of error in low risk expenditure
1.30 Based on its own detailed management assessment per programme (see 2019 Annual Management and Performance Report, p. 61-62), the Commission considers that the (parts of) funding programmes that are to be considered as low risk, meaning that the associated risk at payment is below 2%, amount to EUR 80 billion or 54% of the relevant expenditure in 2019.
243

EN EN
This includes: agriculture – direct payments; the Maritime and Fisheries Fund; Marie Skłodowska-Curie actions; European Research Council grants; the European Space Agency and Global Navigation Satellite Systems Agency; the Connecting Europe Facility; Erasmus+; the Asylum, Migration and Integration Fund; budget support, subsidies, administrative expenditure, etc.
Concerning budget support, the Commission stresses that budget support for non-EU countries is entirely performance-based financing, in which disbursements are contingent on meeting all general eligibility criteria and specific performance indicators before the payment is made. Budget support contracts are suspended or stopped, when these conditions are no longer met. Therefore, it is strictly linked to results rather than being entitlement-based.
The Commission’s regularity information
1.32 The Commission reiterates its support to the ECA initiative to use more, in the context of the Statement of Assurance, legality and regularity information reported by the Commission through the integrated financial and accountability reporting, especially now that the conclusions of both institutions go further in the same direction. The Commission has since the beginning constructively accompanied the decision of the ECA and closely cooperated with it, in particular on implementing the pilot approach in Cohesion and suggesting ideas to overcome some of these difficulties. Based on the lessons learned and progress achieved, the Commission will continue to support the ECA in its approach of using the results of the audits performed by national authorities as a basis for the review of legality and regularity of cohesion expenditure.
As regards the ECA pilot project for Cohesion, for the majority of Cohesion policy programmes the Commission services obtain timely and reliable audit information for their assurance process. However, required verifications (audit cycle) can take longer than a year. Information on confirmed error rates (the majority of programmes) and on the handful of error rates that could not yet be confirmed is disclosed in full transparency in the AAR of the concerned DGs each year. In addition, national and EU audits can legally be pursued during at least three years after the year in which accounts were submitted. This is important for the Commission to be able to discharge its responsibilities in relation to implementation of the EU budget under multiannual programmes.
In addition, when contradictory processes make it impossible to have final audit results by the next AAR, the Commission services take a prudent approach for the reported average residual risk rate and audit opinion and consider a worst-case scenario for the Key Performance Indicator on legality and audit opinions in the AARs. For such programmes, further audit evidence is required to verify whether the worst-case scenario of the reported risk materialises. See also Commission replies provided under paragraph 5.52 and 5.58 in Chapter 5.
The Commission stands ready to continue the discussions in order to establish the conditions necessary to move forward with this process, while taking due account of the existing legal framework, the specificities of the different spending programmes and their multiannual nature.
Common Commission reply to paragraphs 1.33 and 1.34:
The Commission, as manager of the EU budget, has a specific role and designs its approach in controlling EU funds accordingly. This approach is different from that followed by the ECA in its auditor’s role. This may result in some differences between the estimation of the level of error by the two institutions.
The Commission's estimate of the risk at payment for the whole EU budget presented in the AMPR results from the aggregation of the risks at payment disclosed in the AARs.
244

EN EN
In addition to the risk at payment, the Commission also presents and estimates the risk at closure, which is an estimate of the errors that will remain at the end of the programmes’ life cycle, once all ex post controls and corrections have been made (those that will take place between the time of the reporting and the end of the programme’s life cycle).
Indeed, given the multi-annual nature of its expenditure and of its control strategies, the Commission, as manager of the EU budget, may apply corrections until the closure of the funding programme.
This shows that once the Commission and Member States will have been given the time to exercise their corrective capacity, and the Commission to use the supervisory tools at its disposal in line with its obligations under the different sectorial legal bases, the real risk at closure will ultimately be well below 2%, even for each reporting year.
1.34 The Commission’s estimate of the risk at payment for 2019 is 2,1%, which is in the range calculated by the ECA.
There are some issues with the components of the Commission’s estimates
Common Commission reply to paragraphs 1.35 and Box 1.11:
Box 1.11 – As regards CAP under Natural resources, the Commission confirms that it considers it necessary to apply adjustments to the results of the Member States’ controls in order to assess the risk at payment. These adjustments are based on the results of the Certification Bodies work (which the Commission considers has considerably improved) and the Commission’s own audits, thereby ensuring a reliable assessment of the estimated level of error. See also Commission reply to paragraphs 6.30 and 6.31.
The Commission notes with satisfaction that the risk at payment for CAP expenditure of 1.9 % is consistent with the ECA’s estimated level of error for Natural Resources.
As regards Cohesion, the Commission underlines that at the time the AARs are signed, any expenditure declared in the calendar year under reporting is covered by a 10 % retention on interim payments. The Commission had already updated its Key Performance Indicator on legality (KPI 5) in its 2018 AARs in line with recommendation 4 of the 2017 ECA Annual Report. The Commission thoroughly reviews error rates reported by audit authorities and increase them when found necessary, and taking into account further uncertainties for in a number of programmes calculates a risk range including a worst-case scenario (see Commission replies to paragraphs 1.23 and 1.32).
As regards Global Europe, as stated in Chapter 8 of this annual report (paragraph 8.16), no estimations featured in the 2019 DG NEAR RER Study and only 3 out of 357 transactions were subject to estimations in the 2019 DG DEVCO RER study. According to the RER manual, an estimation can only be made when the documentation is not provided for logistical or legal reason. In all other cases, a quantified error is raised.
The Commission notes that full reliance decreased in 2019 DG NEAR RER study, and considers that there has been no over reliance on other auditors’ control work. Full and partial reliance decisions are taken in justified cases. Checks are performed to decide whether to place full or partial reliance on previous work, and these checks are designed to identify errors not detected by prior control work. If the control work of other auditors is not relied upon when considered sound, this would subject the beneficiary to two audits/verifications of the same transaction.
245

EN EN
The RER methodology includes checks on public procurement covering inter alia the rejection of candidates, compliance with selection and award criteria for both first and second level procurement, as well as direct awards.
The Commission also refers to its detailed replies in chapter 8 and in the ECA’s annual EDF report.
1.36 According to the Financial Regulation (Article 247.1.(b)), the Commission's AMPR Section 2 has to be a summary of the Authorising Officers by Delegation's Annual Activity Reports.
1.37 First indent - The Commission’s estimate of the risk at payment for 2019 is 2,0% for 'Research, industry, space, energy and transport' and 1,0% for 'Other internal policies'. The risks at closure are respectively at 1,5% and 0,8% (see Annex 3 to the AMPR, table B, page 232).
Therefore, it is within the frame of the ECA estimated level of error.
Second indent - The Commission’s estimate of the risk at payment for 2019 is 3,1% for 'Cohesion'. The risk at closure is at 1,1% (see Annex 3 to the AMPR, table B, page 232).
Inside this overall 'Cohesion' heading, the Commission’s more detailed estimates of the risk at payment for 2019 is in the range of 2.7%-3.8% for the ERDF and in the range of 1.7%-2.4% for the ESF (see the 2019 AMPR, page 58, and the related AARs).
1.38 The Commission is satisfied that for Natural resources the two institutions reached the same result as regards the estimated level of error.
CONCLUSIONS
1.46 In conclusion, the Commission attaches great importance to the sound financial management of the EU budget. As manager of the EU budget, the Commission put in place multiannual control strategies designed to prevent, detect and correct errors.
The Commission continues to take actions to address complexities and ensure that errors are better prevented and detected over time for all programmes.
Concerning the revenue side of the EU budget, the Commission considers, in line with the ECA, that it is free from material error.
Concerning the expenditures, the Commission’s 2019 estimated levels of error are in the ECA’s range. The Commission’s estimate of the overall risk at payment in 2019, at 2,1%, also shows a slight increase compared to 2018. Nevertheless, the overall risk at closure is estimated at 0,7%, well below the 2% materiality threshold, and in line with both previous years’ level and the objective of the Commission. This takes into account the estimated future corrections which the Commission and the Member States have the capacity to implement using legal tools at their disposal for the segment of expenditure / programmes concerned, and the Commission respecting all due contradictory procedures with the concerned Member States. In 2019, the corrective measures confirmed amounted to EUR 1.5 billion (25% higher than in 2018). These relate mainly to errors affecting payments made in previous years.
Based on its own detailed management assessment (see 2019 Annual Management and Performance Report, p. 61-62), the Commission considers that the relevant expenditure for which the risk at payment is low, i.e. below 2%, represents 54% of the total relevant expenditure and those for
246

EN EN
which the risk at payment is above 2% account for 46%. Therefore, the Commission considers that slightly less than half of the relevant expenditure is affected by material error (see also Commission’s reply to paragraph 1.21).
As a result of the efforts of the ECA, the Commission, and its implementing partners, the financial management of the EU budget has improved over time and the error levels have decreased to ranges getting closer to the 2% materiality threshold in the recent years, except in some specific policy areas. The Commission considers that all evidence available points to this trend: in 2019, the ECA’s estimated level of error (2,7%) has marginally increased compared to last year (2,6% in 2018). Nonetheless, it is lower than in 2016 (3,1%), where the qualified opinion on legality and regularity of expenditure was given for the first time, and well below 2015 (3,8%). The Commission also notes that the estimated level of error has decreased compared to 2018 for the two main spending areas (natural resources and cohesion) and that, for administrative expenditure and natural resources (representing 55,4% of the audit population), the estimated level of error is below materiality1.
Moreover, and taking into account the Commission’s qualitative assessment of the effective functioning of the control systems, in particular the multi-annual corrective capacity which leads to an amount at risk at closure (0,7%) being far below the materiality threshold of 2%, the Commission considers the errors are not widespread and not permeating to the whole of the EU Budget. This is transparently disclosed in the Directors-Generals’ Annual Activity Reports (AARs) and in the Annual Management and Performance Report (AMPR).
1 For natural resources, the estimated level of error is 1.9%
247

EN EN
FINAL REPLIES OF THE COMMISSION TO THE EUROPEAN COURT OF AUDITORS’ 2019 ANNUAL REPORT
“CONTRIBUTION TO ANNUAL REPORT 2019 – CHAPTER 2 – BUDGETARY AND FINANCIAL MANAGEMENT”
BUDGETARY MANAGEMENT IN 2019
Outstanding commitments continue to increase
Common Commission reply to paragraphs 2.7 and 2.8:
In 2018 an important acceleration took place in the implementation of Cohesion policy programmes of the ESI Funds. The project selection rate for ERDF and Cohesion Fund at end 2018, which the Commission considers to be one of the pre-conditions and indications of future absorption, got ahead of the same reference period in 2007-2013. This positive trend has been confirmed at end-December 2019, with the selection rate reaching 92.3% (i.e. about 4.5 percentage points higher compared to 2007-2013 at the same reference period). As for the European Social Funds (ESF), the situation is constantly improving, with the selection rate reaching 85% at end-December 2019 (only about 3.5 percentage points lower compared to 2007-2013 at the same reference period). Furthermore, it should be noted that the average project selection rate of the Youth Employment Initiative (YEI) was close to 100% at the end of 2019.
As also pointed out by the ECA in paragraph 2.8 of its Annual Report 2018, the European Agricultural Fund for Rural Development (EAFRD) implementation rates were considerably higher than for other ESI Funds (see also paragraph 2.15 of this ECA report). The Commission points out that the implementation delays described in this paragraph of the report do not relate to the European Agricultural Fund for Rural Development (EAFRD).
In 2018 and in 2019 the voted budget was fully implemented for all Funds, as well as the majority of assigned revenue.
Efforts continue to speed up implementation on the ground. The Commission is closely monitoring programmes considered to be at risk of delays to help prevent under-absorption and potential de-commitment, as well as the take- up of the Coronavirus Response Investment Initiative (CRII) and of the Coronavirus Response Investment Initiative Plus (CRII Plus) measures. A close dialogue is in place with the concerned Member States (MS) to improve the situation. The Commission services provide substantial support to MS including technical assistance and advisory services.
The overall impact of factors linked to the COVID-19 crisis is yet to unravel and will be fully discernible in 2021.
See also Commission reply to paragraph 2.16.
2.9 Based on the Commission’s proposals for the financial framework 2021-2027, the payments in the first years of the new programming period will reach a level above the proposed commitment ceilings. Without prejudice to the final outcome of the negotiations on the Multiannual Financial Framework (MFF) and the finalisation of the related legislative procedures, this should allow reversing the trend of growing outstanding commitments (RAL) from 2021 and by the end of 2025 the RAL should decrease by 5%. \\Source: COM(2020)298: Long-term forecast of future inflows and outflows of the EU budget (2021-2025)\\
RISKS AND CHALLENGES FOR THE EU BUDGET
248

EN EN
Changes in the EU budget due to the COVID-19 pandemic
2.11 The Commission points out that the revised overall amount for the MFF presented on 27 May 2020 (i.e. 1 100 billion euros) is actually higher than the compromise tabled by the President of the European Council in February 2020 (EUR 1 094 billion), which constituted the latest reference point in negotiations before the recovery package.
The Commission also points out that in the case of the absence of an adopted MFF Regulation for the period 2021-2027, transitional provisions of spending programmes’ basic acts would be necessary to avoid a discontinuation of most EU spending programmes.
The United Kingdom has withdrawn from the EU
2.13 The Commission underlines that the UK’s contribution for post 2020 will be established following the provisions of the Agreement on the withdrawal of the United Kingdom of Great Britain and Northern Ireland from the European Union and the European Atomic Energy Community. The UK remains liable for all financial obligations and liabilities resulting from the entire period of its EU membership.
During the transition period, which will end on 31 December 2020, the UK continues to contribute to the EU budget and to benefit from it according to the same rules as if it had remained a Member State.
FINANCIAL MANAGEMENT ISSUES
The absorption of ESIF has accelerated, but it is still slower than under the previous MFF
2.14 After a delayed start, the implementation of Cohesion policy programmes is progressing well. The Commission refers to its common replies to paragraphs 2.7 and 2.8.
Absorption rates are also impacted by the decision of the legislator to move to the general n+3 rule on decommitments for the 2014-2020 period. The overall impact of factors linked to the COVID-19 crisis is yet to be seen.
2.15 The Commission considers that conclusions from comparisons made with the previous MFF should be drawn with caution as certain relevant differences between the Common Provision Regulation (CPR) for the 2007-2013 and 2014-2020 programming periods (such as the n+3 rule and the annual acceptance of accounts process) entail that the payment rate for the latter is liable to be slower.
The Commission underlines that, while lower, the absorption rate of EMFF is not far from those of the ERDF and ESF, with which it shares common management and control system requirements.
The Commission stresses furthermore that the high absorption rate in 2019 shows that part of the delay at the start of the programmes is being recovered.
2.16 The introduction by the co-legislators of the n+ 3 automatic decommitment rule (instead of n+ 2) disincentivised faster budgetary implementation. The introduction of a risk of net financial corrections if serious deficiencies remain undetected or uncorrected, while proved important tools to protect the financial interests of the Union, had similar effects. In the specific context of the European Maritime and Fisheries Fund (EMFF), certain measures (e.g. fisheries control, scientific data collection) needed to be shifted from direct to shared management from the previous programming period which required significant adjustments from the side of the national public administrations.
249

EN EN
In order to promote sound financial management and timely implementation in the programming period 2021-2027, the Commission proposal for Common Provisions Regulation (COM(2018)375) includes an N+2 automatic decommitment rule instead of the current N+3 automatic decommitment rule. This is without prejudice to the final outcome of MFF negotiations and the finalisation of the related legislative procedures.
The Commission is confident that, in case the recovery of the delay – evidenced by the high absorption rate in 2019 - continues at its current pace, the level of the outstanding commitments will be lower than foreseen.
The Commission finally underlines that the slow rate of absorption described in this paragraph of the report does not relate to the European Agricultural Fund for Rural Development (EAFRD).
2.17 In order to avoid the recurring issue of the large amount of assigned revenues resulting from the return of amounts of unused annual pre-financing to the EU budget as described in the common reply to paragraphs 2.16 and 2.17, the Commission has proposed a reduction in the annual prefinancing rate for the years 2021 to 2023 of the current programming period (COM(2018)0614), and included a lower rate in the CPR proposal for the 2021-2027 MFF. This is without prejudice to the final outcome of MFF negotiations and the finalisation of the related legislative procedures.
The Commission is aware of the fact that this large reduction in the assigned revenues available at the end of 2019 places stress on the payment appropriations. The Commission will conduct a thorough analysis of the payment appropriations needed until the end of the year during the global transfer exercise and will make the proposal to the budgetary authority if reinforcements are needed.
Financial instruments under shared management also face absorption problems
2.21 The CPR proposal for 2021-2027 includes provisions which significantly reduce the time gap between the end of the period which it covers and the availability of data on financial instruments. This is achieved through integrating key data on financial instruments into the financial data submitted by programme authorities several times a year, which are provided at the level of priorities.
Data on individual financial instruments would still be available on request, as in the case of operations using other forms of financing.
In the next programming period 2021-2027, reporting for FISMs under EAFRD is regulated by Article 121 of the Strategic Plan Regulation (SPR) of the Common Agricultural Policy (CAP), requiring an annual report for the agricultural financial year (16 October to 15 October) to be submitted by 15 February, thus resulting in a 2- month earlier reporting than during 2014-2020. The information listed in Article 121(6) CAP SPR is to be reported on the level of the type of intervention (the equivalent of priority under CPR).
The EU budget is exposed to financial risks
The EU budget covers different types of financial operations
2.26 The Commission underlines that the upcoming 2019 report on “guarantees covered by the EU budget” (old FR Art 149) has a full section on EFSI, which will provide aggregated information as at 31.12.2019. As from 2021, the Commission will present to the budgetary authorities an annual report on the budgetary guarantees (Article 41(5) FR), including an assessment of all the contingent liabilities borne by the budget arising from budgetary guarantees or financial assistance in line with the provisions of the new Financial Regulation.
Guarantee funds
250

EN EN
2.28 The Commission considers it unlikely that the amounts available in the guarantee funds would not be sufficient.
Future EU budget exposure needs reassessment
2.34 The Commission, in collaboration with the implementing partners, monitors closely the possible impact of the COVID-19 crisis on the Union’s risk exposure stemming from budgetary guarantees. For the moment, the Commission does not see the need to revise the target provisioning rates for the respective programmes, which have already from the outset been prudently set. The target provisioning rate for the new guarantee instruments proposed by the Commission in the context of Next Generation EU have been calculated on an equally prudent basis.
THE EU BUDGET AND THE EIB GROUP ARE CLOSELY INTERLINKED
A significant part of EIB operations is backed by the EU budget
2.41 The issues raised by the ECA were already addressed in the Replies of the Commission to the Special Report 3/2019 on EFSI, which are reproduced below: “The Commission and the EIB consider that, as a result of the introduction of the EFSI, the majority of the other financial instruments were in fact significantly reinforced, instead of being replaced. The ЕIB Group considers that the financing provided under EFSI is not fully comparable with other sources of financing as it typically offers different terms and conditions and therefore cannot be seen as replacing them. The investment mobilised, as per the methodology, reflects the best estimate of the expected investment in the real economy with actual amounts revised at project completion. Hence, by definition, the ex-ante investment mobilised is an estimate at approval, not an over or understatement. Geographic concentration cannot be calculated solely based on the volume of signed financing operations in each Member State. When looking at geographic concentration, the size of economies and population of individual Member States has to be taken into account. The Commission recognises the importance of the geographical diversification of EFSI. In this respect, the Commission and the ЕIB have been implementing several measures to increase the geographical balance.”
Our audit mandate covers only a part of the EIB’s operations
Common Commission reply to paragraphs 2.44 and 2.45:
The EIB’s special status is embedded in the Treaties, namely, in Articles 308 and 309 of the Treaty on the Functioning of the European Union (TFEU) and Protocol No 5 on the Statute of the EIB. The nature of the EIB, the nature of its shareholders (Member States), the non-profit making basis of its operations and its strategy driven by public policy objectives, inter alia, are important features that distinguish the EIB from commercial banks.
The Commission is working together with the ECA and the EIB on a renewed tripartite agreement. In accordance with the third subparagraph of Article 287(3) TFEU, the Agreement covers both the financing operations under the mandates conferred by the European Union on EIB and the operations financed by EIB and guaranteed by the general budget of the European Union. This Agreement does
251

EN EN
not modify or supersede any Union law, in particular the provisions of Articles 285 and 287(3) of the Treaty on the Functioning of the European Union (TFEU), which is the legal basis of this agreement and which confers the ECA the mandate to audit the Union expenditure and revenue managed by EIB.
2.45 The Commission notes that this observation concerns a proposal for an ECA mandate to audit EIB projects which are not linked to – or not financed by - the EU budget and, therefore, does not relate to the Commission.
CONCLUSIONS AND RECOMMENDATIONS
Conclusions
2.47 Based on the Commission’s proposals for the financial framework in 2021-2027, the payments in the first years of the new programming period will reach a level above the proposed commitment ceilings. Without prejudice to the final outcome of MFF negotiations and the finalisation of the related legislative procedures, this should allow reversing the trend of growing outstanding commitments (RAL) from 2021 and by the end of 2025 the RAL should decrease by 5%.
//Source: COM(2020)298: Long-term forecast of future inflows and outflows of the EU budget (2021-2025)//
2.48 The slower absorption rate of payment appropriations in comparison with the previous MFF is mainly related to the changes introduced in the regulations in the 2014-2020 programming period, namely the high level of annual prefinancing and the longer time to consume committed appropriations due to the new rule for automatic decommitments (n+3).
The Commission stresses that the high absorption rate in 2019 shows that part of the delay at the start of the programmes is being steadily recovered.
See Commission replies to paragraphs 2.14 to 2.17.
Concerning the EAFRD, the Commission carefully monitors the progress of the Member States’ implementation of the rural development programmes for the 2020 budget.
At present, it is expected that the payment appropriations available will suffice to reimburse Member States’ expenditure declarations in full. This is without prejudice to the final outcome of MFF negotiations and to the outcome of the respective annual budgetary procedures.
2.50 Information at a global level about the maximum exposure for the EU budget in relation to budgetary guarantees at each year-end is included in the annual accounts of the EU.
The Commission stresses that the provisioning rates for EFSI/SSI and InvestEU included in its proposals tabled in May 2020 already took the Covid-19 pandemic into account and the legislation proposed contains adequate provisions to review the provisioning rate during the implementation, if necessary.
As of 2021, the Commission will present to the budgetary authorities an annual report on the budgetary guarantees, including an assessment of the contingent liabilities borne by the budget arising from budgetary guarantees or financial assistance, as well as information on the effective provisioning rate of the CPF, in line with the provisions of the Financial Regulation.
252
EN EN
2.51 The Commission recalls that the new tripartite agreement between the Commission, the ECA and the EIB is under revision. The Commission refers to its common reply to paragraphs 2.44 and 2.45.
Recommendations
Recommendation 2.1
The Commission accepts the recommendation.
The Commission constantly monitors the payment needs and submits proposals of amending budgets and budget authority transfers accordingly and accepts to continue to do so in the future.
However, as for taking action with a view to ensuring the availability of sufficient payment appropriations, the Commission recalls that the adoption of the budget lies ultimately within the remit of the budgetary authority, which involves the granting of sufficient level of payment appropriations, including those arising from extraordinary needs linked to the COVID-19 pandemic. In this context, the Commission will continue to cooperate closely with the European Parliament and Council.
Recommendation 2.2
The Commission partially accepts this recommendation.
The Commission is committed to monitor implementation of the FISMs as it has been done so far. This would include a report to be prepared annually, not at the level of individual financial instruments, but at the level of priorities, and in the case of EAFRD on the level of type of interventions, covering the scope of information which is submitted to the Commission in line with the future regulatory framework.
Data on individual financial instruments would still be available as part of the audit trail, as in the case of operations using other forms of financing.
The Commission also underlines in this context that the future sectorial rules (i.e. the CPR for 2021-2027) will not require programme authorities to submit data at the level of individual financial instruments; as such, the Commission has no legislative mandate to impose such additional requirement.
Recommendation 2.3
The Commission accepts the recommendation.
The Commission will present to the budgetary authorities an annual report on the budgetary guarantees, including an assessment of the contingent liabilities borne by the budget arising from budgetary guarantees or financial assistance in line with the provisions of the Financial Regulation.
Recommendation 2.4
The Commission accepts the recommendation and considers it already implemented.
The Commission has endeavoured to give effect to this recommendation when it tabled proposals for Recovery Plan and MFF. The Commission will continue to monitor the situation.
To ensure that the Union is a position to cover all of its financial obligations even in cases of sudden and sharp economic downturn, such as the effect of the COVID-19 pandemic on the European
253

EN EN
economy, on 27 May 2020 the Commission has already proposed to increase the Own Resources ceiling to 1.40% of the EU27 GNI.
For the established budgetary guarantees, the Commission assesses the adequacy of the provisioning levels relative to the levels established in the basic legislative acts on an ongoing basis. In this spirit the Commission, in collaboration with the implementing partners, has been monitoring closely the possible impact of the COVID-19 crisis on the Union’s risk exposure stemming from budgetary guarantees. The target provisioning rate for the guarantee instruments proposed by the Commission in the context of Next Generation EU (see paragraph 2.11) have been calculated on an accordingly prudent basis.
Recommendation 2.5
The Commission notes that this recommendation relates to a proposal for an ECA mandate toaudit EIB projects which are not linked to – or not financed by – the EU budget and, therefore, that it is not addressed to the Commission.
254

EN EN
FINAL REPLIES OF THE COMMISSION TO THE EUROPEAN COURT OF AUDITORS’ 2019 ANNUAL REPORT
“CONTRIBUTION TO ANNUAL REPORT 2019 – CHAPTER 3 – REVENUE”
EXAMINATION OF ELEMENTS OF INTERNAL CONTROL SYSTEMS
3.9 The Commission continuously follows up any shortcomings identified for B accounts and Member States are held financially responsible for any Traditional Own Resource (TOR) losses due to their administrative errors.
The Commission will follow up on the problems identified by the ECA’s audits in Belgium, Germany and Poland in its usual follow-up to the ECA’s findings and these Member States will be required to take appropriate measures to address and resolve the shortcomings identified.
3.10 The Commission recalls that in an account of this type there is by nature a high risk of shortcomings and complexity involved. That is why each TOR inspection carried out by the Commission includes an examination of the B account. The Commission will continue this approach. In addition, the 2020 TOR inspection programme focusses in particular on TOR accounting to respond to the ECA’s recommendation made last year.
3.11 The Financial Risk Criteria (FRC) Decision sets up criteria (including for the risk of undervaluation and identification of risky operators) to electronically flag transactions considered to pose financial risk and which require further scrutiny or control action. The FRC are applied both before and after the release of goods including in post-release controls. The level of implementation by Member States has not yet been assessed by the Commission.
Moreover, the Commission has updated the Customs Audit Guide to provide guidance on how to tackle the situations in which economic operators carry out import operations in Member States different from the Member State where their headquarter is established. It also stresses the importance of sharing risk information on risky operators.
As recognised by the ECA, Member States are strengthening their control strategy in line with the shortcomings identified by the Commission in its TOR inspections carried out in 2018 and 2019. This will result in a better harmonised pan-European control strategy on tackling undervaluation.
The Commission will continue to monitor the situation by checking samples of imports and controls as well as by conducting statistical analyses.
3.13 See Commission reply to paragraph 3.11.
3.14 See Commission reply to paragraph 3.11.
Within the follow-up process of its inspection reports the Commission started quantifying TOR losses at EU level and at the level of the Member States.
The Commission continues its follow-up inspections on the customs value control strategy in 2020. Based on analysis of statistical data estimated TOR losses are declining and the Commission therefore considers that Member States have improved the effectiveness of their control measures in
255

EN EN
this regard by taking action to address the Commission’s findings, as witnessed by the ECA in the three Member States it audited.
3.15 The Commission would like to underline that actions have been taken since the 2013 and 2014 reports by the ECA. Besides the update of the Customs Audit Guide, which already addresses some of the shortcomings identified by the ECA, the Commission has worked with the Member States to find solutions to identify importers operating in Member States different from where their headquarter is established taking into consideration the current available information and legal provisions. This work is still under development in a project group financed by Customs 2020. Further progress can however only be achieved once an EU-wide database covering all imports will be fully available.
Box 3.2 - Continuous gap in the customs control system across the EU
The Surveillance III database at the level of the EU is ready on the Commission side to receive the data flows but only a few Member States have made the transition to the new national import systems. Therefore, no EU-wide datasets on imports by economic operators are available to Surveillance III for the time being. The deadline of January 2023 has been set following a request by Member States.
The Commission would like to underline that, within the Customs Risk Management Framework (CRMF), the Implementing Decision on FRC sets up legally binding provisions to address financial risks, both at release and after release of the goods, including post release controls. No economic operator is excluded a priori from the application of such criteria, and this irrespective of the Member State in which the headquarters is established.
The Commission recognises however that having a pan-European overview of the activities of the economic operators is a valid support for risk analysis since, when irregularities or risks are identified, this would make it easier to trace back the cross-border activities of the economic operators.
3.17 Reservations are a protective measure to mitigate the risk that an incorrect VAT Own Resources statement is time-barred.
The majority of long outstanding reservations are linked to infringement processes, that may have a potential financial impact. In such a case, reservations are mirroring the developments of the infringement procedures which are influenced by several factors such as the complexity of the infringement case and possible referral to the Court of Justice.
The Commission works in close partnership with Member States, actively identifying ways to solve issues and taking action, whenever possible in compliance with the Commission procedures and applicable legislation, in order to close long-outstanding reservations.
Information related to the financial impact lies with the Member State. Once Member States submit the calculations linked to the reservations, the financial impact can also be calculated.
3.18 The Commission points out that in 2019, 40 out of 162 TOR open points outstanding for 5 years or more were closed (about 25% in one single year), which it considers a satisfactory progress considering the complexity of these disputed cases. The Commission will continue to strive to close such cases rapidly, but this depends also on Member States’ cooperation.
The Commission considers that its database contains sufficient information for monitoring the timeliness and completeness of follow-up, except the financial impact, which is separately kept in the accounting system SUIVI.
256

EN EN
This could be integrated in its follow-up database, but the Commission notes that the correct amounts at stake cannot always be immediately determined pending additional information from Member States. In addition, it will update internal instructions to formalize prioritization of longstanding points with the highest potential financial impact.
Thus, timeliness, procedures and databases for the follow-up of TOR open points will be revised, along the lines of the ECA’s concerns.
Box 3.3 Weaknesses in the follow-up of TOR shortcomings detected in Member States
The Commission acknowledges the delays observed by the ECA. However, these delays have not resulted in TOR losses.
Increased efforts are being undertaken to follow-up open points, prioritising longstanding files with potential financial consequences. The Commission services’ own initiative of inviting Member States with the highest number of open points to Brussels to accelerate where possible the closure of the open points will be continued. Also, the 2020 TOR inspection programme leaves room for ad-hoc inspections and management meetings in countries with the highest number of longstanding open files. The Commission set itself a quantitative target to reduce further the longstanding open points by 20% by the end of 2020. Moreover, it will initiate infringement procedures in case of continued disagreement with Member States on longstanding open points with financial impact.
3.19 The 2016-2019 GNI verification cycle was completed in a much more formalised way than earlier. The Commission is confident that this increased formalisation strengthens the overall quality of GNI estimates and consequently a fairer collection of own resources among Member States.
3.20 During the 2016-2019 GNI verification cycle, the Commission verified that R&D assets had, in principle, been correctly captured in national accounts i.e. they were capitalised and valued in accordance with the applicable rules. The Commission has in particular taken a number of actions to assess the recording of R&D in a globalised context, through the comparisons made across countries, a dedicated GNI Multi National Enterprises (MNE) Pilot exercise, while the cases where MNE activities have been relocated were dealt with in the Early Warning System.
Therefore, the Commission is of the opinion that it has to a large extent implemented the ECA’s (2016) Recommendation 2 in Annex 3.4.
3.21 The Commission considered that the quality of the revised French GNI Inventory is appropriate and its review is underway. The Commission recalls that the general reservation relating to France was placed precisely to protect, where needed, the EU as well as Member States financial interests.
ANNUAL ACTIVITY REPORTS
3.23 See Commission’s reply to paragraph 3.14.
Within the follow-up process of its inspection reports the Commission started quantifying TOR losses at EU level and at the level of the Member States.
CONCLUSION AND RECOMMENDATIONS
3.24 The Commission will improve its risk assessment for the planning of the inspections and continue to strive to close long outstanding open points rapidly, depending also on Member States’ cooperation.
257

EN EN
The Commission has made important steps to help identifying the riskiest economic operators at EU level for post-release audits, with the flagging of transactions considered to pose financial risk under the FRC and the update of the Customs Audit Guide. It works closely with Member States to identify importers operating in Member States other than where they are headquartered. Further progress will be achieved once an EU-wide database covering all imports will be fully available (see replies to 3.11 – 3.15).
3.25 See Commission replies to paragraph 3.20.
Recommendation 3.1– Customs duties (TOR) not captured
The Commission accepts recommendation 3.1
a) The Commission will use the available data on import to analyse abnormal patterns. This information could support the Member States in identifying specific situations which they could further analyse from a risk management perspective, to possibly find out the operators behind those transactions.
This would serve as support given the fact that Member States remain responsible, within the scope of their competence, for the proper implementation of the customs legislation.
This will be done in line with the General Data Protection Regulation (GDPR) constraints and the legal framework in place.
b) The Commission will exploit further the information contained in Surveillance for several purposes, also in order to support Member States’ data analysis. This will be done in line with the GDPR constraints and the legal framework in place.
Recommendation 3.1 – TOR open points
The Commission accepts recommendation 3.2
a) The Commission will reconsider its monitoring system on open points along the lines recommended by the ECA.
b) Timeliness, procedures and databases for the follow-up of TOR open points will be revised along the lines recommended by the ECA.
258

EN EN
REPLIES OF THE COMMISSION TO THE EUROPEAN COURT OF AUDITORS’ 2019 ANNUAL REPORT
“CONTRIBUTION TO ANNUAL REPORT 2019 – CHAPTER 4 – COMPETITIVENESS FOR GROWTH AND JOBS”
REGULARITY OF TRANSACTIONS
4.6 The error rate reported by ECA in 2019 (4.0%) is consistent with the error rates reported in past reports (with the exception of the 2018 Annual Report).
The ECA’s estimated error rate is calculated on an annual basis and it does not take into account any corrections and regularisations, which will be carried out by the Commission. See, for example, the Commission’ reply to paragraph 4.18.
The Commission estimates the residual error rate for research expenditure (Horizon 2020) by implementing a multiannual control strategy. The reported residual error rate (2.15 % at the end of 2019) accounts for recoveries, corrections and the effects of all Commission controls and audits over the whole implementation period of the programme.
It should be noted that the Commission’s objective for Horizon 2020 is to maintain the representative error rate within the range of 2-5%, with a residual error rate as close as possible (but not necessarily below) to 2%.
4.7 Research expenditure reimbursement is based on claims submitted for costs incurred by the beneficiaries. These claims are often subject to complex rules and can lead to errors as may be observed in the cases referred to by the ECA.
Therefore, reducing the error rate depends on a continuous simplification effort. To this end, in the last stages of its implementation of Horizon 2020, the Commission is making wider use of simplified cost options such as lump sum funding strengthening its communication with beneficiaries and constantly improving its control mechanisms. Horizon Europe will take these a step further, building on the experience acquired in Horizon 2020.
4.8 The Commission welcomes the ECA’s acknowledgement of its efforts to simplify the administrative and financial requirements of Horizon 2020. The simplifications introduced in Horizon 2020, along with the ever-increasing experience acquired by the major beneficiaries, help decrease the number and level of errors. However, despite systematic, widespread and targeted communication campaigns, there remain certain types of beneficiaries such as small and medium-sized enterprises and newcomers that are more error prone than others.
4.9 b) The Commission notes that, in one of the cases mentioned by the ECA, the contract was not rendered void by the decision of the national court that determined its illegality. The contract therefore continued to bind the contracting parties. The Commission cannot, on this basis, consider these costs as ineligible.
4.10 The Commission has put in place a sound system of ex-ante controls, which includes detailed automated checklists, written guidance and continuous training. The improvement of this system, which without imposing additional administrative burdens on beneficiaries, allows them to focus on
259

EN EN
the achievement of their research and innovation objectives whilst ensuring that payments to researchers are made promptly, is a constant challenge.
The internal control of the Commission relies also on the independent auditors’ certifying cost claims. The observation cited in this paragraph by ECA is well-known to the Commission and has been addressed in previous reports. In this respect, the Commission has organised a series of meetings targeting beneficiaries and independent certifying auditors to raise awareness of the most common errors that stem from the audits carried out on beneficiaries. In addition to a didactic template for Horizon 2020 audit certificates, the Commission provides feedback to certifying auditors on their identified errors.
It is important to point out that although independent auditors do not identify every single error in the cost claims, they play an important role in reducing the overall error rate.
Personnel costs continue to constitute the principal source of error, notably in research expenditure
4.11 Horizon 2020 is a step forward in the simplification of the rules for the reimbursement of the costs incurred by the beneficiaries in comparison to previous Framework Programmes.
In 2019, the Commission reinforced the communication campaign by proposing to Member States and Associated Countries communication events with an ‘à la carte’ agenda, including information and clarifications on personnel costs (including the aforementioned ‘hourly rate’). Moreover, in October 2019, the Commission issued a notification to all Horizon 2020 beneficiaries titled “How to avoid errors when claiming costs in H2020 grants”.
For the next Multi-Annual Financial Framework, which includes the Horizon Europe Programme, a single and simpler corporate formula will be introduced for all directly managed programmes of the Union. This formula aims at reducing the financial risks for beneficiaries while simplifying administration and auditing across programmes. A major simplification provided by the new corporate Model Grant Agreement (MGA), from which the Horizon Europe MGA will be derived, foresees one very simple method for charging personnel costs based on the daily rate calculation (annual personnel costs for the person divided by 215). The concept of productive hours and the various prescriptive methods, that proved to be prone to errors when determining and reporting eligible personnel costs, will be discontinued.
4.12 The Commission considers the single “annual hourly” rate based on the last closed financial year as one of the major simplifications introduced in Horizon 2020. However, it seems that despite carefully drafted conditions and clear instructions, errors did occur by beneficiaries in applying this method. As already noted above (see paragraph 4.11), under Horizon Europe the personnel costs will be calculated on the basis of a daily rate formula. This calculation will be performed by calendar year and no longer by taking into account the last closed financial year, as in Horizon 2020.
4.13 The Commission continues its communication campaigns in order to explain the Horizon 2020 funding rules to beneficiaries.
Box 4.3 - Example of an error in the calculation of the hourly rate and an example of the non-use of the most recent closed financial year
The Commission will follow up the case referred to by ECA in Box 4.3 and will act accordingly.
260

EN EN
4.14 The “double ceiling” rule is a prerequisite for correctly calculating and declaring personnel costs. It ensures that a beneficiary does not charge more than its actual costs. The rule is clearly stated in art. 6.2A of the Horizon 2020 Model Grant Agreement. Regrettably, a few cases of errors in the application of this rule have occurred in the past and may do so in the future despite the Commission’s best efforts to communicate clearly and systematically all underlying rules and conditions related to the declaration of personal costs.
Under Horizon Europe there will be one simple ceiling to be complied with by beneficiaries, notably a ceiling of days where beneficiaries must ensure that the total number of days worked that they declare in EU grants for a person for a calendar year is not higher than the number of days used for the calculation of the daily rate (i.e. 215). This will logically ensure that the personnel costs declared do not exceed the total personnel costs recorded in the beneficiary’s account for a given person for that calendar year.
Box 4.4 - Example of a failure to respect the double-ceiling rule
The Commission will follow up the case referred to in Box 4.4 by ECA and will act accordingly.
4.15 Deficiencies in time recording may still occur, but very often without (material) financial impact (e.g. signature missing on the time sheet). In such instances, the Commission issues a recommendation to the beneficiary and applies corrections if needed.
Private entities, in particular SMEs, are more prone to error
4.16 SME participation and the attraction of new beneficiaries are important for the successful implementation of the Research and Innovation policy. These types of beneficiaries, however, either have reduced administrative capacity or are less familiar with the rules of participation and are therefore more prone to errors
At the end of 2019, SMEs’ participation in Horizon 2020 signed grant agreements reached 24.7%, exceeding the 20% target set for 2020.
One measure introduced in order to facilitate SMEs’ participation and reduce errors is the use of lump-sum payments in phase one of the SME instrument.
Ineligibility of all costs declared by the beneficiary in the audited period
4.18 As a general rule, the Commission follows up all errors found, be it individual or systemic, with a view to avoiding damage to the EU budget. Following the ECA’s audit, it has subsequently regularised (costs have become eligible) one of these two errors in 2020 and is in the process of regularising the other error.
The beneficiaries’ corporate status described by the ECA reflects the underlying links of many companies that are participating in H2020.
The costs of the internal arrangements of the beneficiary and associated entities may be charged to the project provided that they are reflected in Annex 1, or approved by the Commission at the reporting period (in cases of in-kind contribution).
As the ECA states, the beneficiaries were not familiarised with the rules applicable to their corporate links.
261
EN EN
4.19 The Commission agrees with the ECA’s findings.
In the first case reported by the ECA, the aim of the grant was ensured by a partner organisation of the beneficiary, which was entitled to award doctoral degrees.
In the second case, a fellow was also fully supported in a doctoral training. The fellow worked at the beneficiary’s premises and alongside this, on his PhD study in order to obtain a doctoral degree. There was no other professional activity which did not relate to a doctoral training. The work and the study are considered complementary in achieving the goals of the project as the sole purpose of the project is to support doctoral training.
Frequent errors in other direct costs
4.20 The Commission acknowledges the observation of the ECA and stresses that it continues its communication campaigns to explain funding rules to beneficiaries.
High frequency of errors in exchange rates
4.21 The Commission notes the ECA’s observation that the financial effect of mistakes in exchange rate conversions is not material. However, the Commission is continuing its communication campaigns to explain funding rules to beneficiaries and regrets the occurrence of such errors despite clear instructions.
REVIEW OF THE REGULARITY INFORMATION PROVIDED BY AUDITEES
4.22 The Commission’s audit strategy covers the entire implementation of Horizon 2020. The main objective is to protect the EU financial interest by recovering the amounts unduly paid. The Commission reviews the internal control system in place at beneficiary level and issues recommendations when weaknesses are identified to ensure the prevention and detection of errors at beneficiary level.
4.23 The Commission refers to its reply to the 2018 report where it explained the difference in the scope of the audits between the ECA and the Commission.
4.25 The audit work of the Commission focusses mainly on the detection and correction of errors found in the beneficiaries’ declaration of costs, whilst aiming at maximising the audit coverage.
The audit reports of the Commission are based on the principle of “reporting by exception”: rather than providing a full description of each individual cost item, only audit findings (errors) need to be reported.
Consequently, in principle, audit files reflect and include only the material evidence (the audit working papers and its supporting documentation) of each error as a legal basis for further correction or recovery.
4.26 The Commission takes note of the findings of the ECA. With regard to outsourced audits, the Commission intends to continue and intensify its guidance provided to the contracted firms.
4.27 It should be noted that the audits performed by the Commission have wide coverage within a limited timeframe. The Commission notes that in 13 out of 20 audits, the ECA was able to rely on the Commission’s audit files, as compared to 10 out of 20 in year 2018.
262

EN EN
Some of the remaining seven cases have immaterial impact, as noted by the ECA.
4.29 The Commission has reported the error rate in the 2019 Annual Activity Report taking into account the observations reported by the ECA in its 2018 Annual report.
The Commission’s audits cover a significant amount of every individual audited payment in order to detect and correct errors incurred by the beneficiaries. In addition, in cases of systemic errors detected at beneficiary level, the Commission extrapolates the audit findings to non-audited EU projects.
The Commission considers that the increase by 0.34 % of the error rate initially calculated, covers the risk of possible understatement identified by the ECA in its 2018 Annual Report.
4.30 The Commission takes note that the ECA welcomes this prompt remedial action and the Commission’s intention to address the matter further.
The Commission considers that its control audit strategy enables the determination of a reasonable and fair estimate of the error rate for Horizon 2020.
ANNUAL ACTIVITY REPORTS AND OTHER GOVERNANCE ARRANGEMENTS
4.31 The Commission welcomes the ECA’s observation that the Annual Activity Reports examined provide a fair assessment of the respective DGs’ financial management in relation to the regularity of underlying transactions.
4.32 Reservations in the Annual Activity Reports are included according to instructions issued at Corporate level.
4.33 The Commission welcomes the ECA’s recognition of its efforts in implementing corrections of FP7 systemic errors and for exceeding the target of 70%. It underlines, once again, the significant level of resources required to deal with the remaining 1 904 cases.
The FP7 and Horizon 2020 audit strategies aim at detecting and correcting the amounts unduly paid to beneficiaries. In the case of systemic errors, the corrections are also extended to non-audited EU projects. In this respect, during the year 2019, the Commission has significantly increased the implementation of FP7 corrections.
4.34 The Commission welcomes the ECA’s acknowledgment of its efforts and the progress it has made in implementing Internal Audit Service´s (IAS) recommendations.
The Commission is implementing the recommendations of the IAS, generally within the deadline initially set in the audit report.
The recommendations related to the audit on Dissemination & Exploitation of H2020 results were implemented at the end of the year 2019, in most respects. The Commission closed this recommendation in June 2020.
To highlight an example of the progress made, at the end of June 2020, only 4 IAS’ recommendations were open, none of them being overdue.
The Commission continues to work on the full implementation of the IAS recommendations.
263

EN EN
4.35 The Commission notes the ECA’s observations that the risk at payment set out in the AMPR is within the range of the ECA’s estimated level of error.
The Commission considers that the risk of possible understatement of the error rate is covered and that the aggregated risk at payment and risk at closure disclosed in the AMPRs are reliable.
CONCLUSION AND RECOMMENDATIONS
4.36 The estimated error rate reported by the ECA, calculated on annual basis, is one indicator of the effectiveness of the implementation of EU expenditure. As previously mentioned, the error rate in 2019 reported by ECA (4.0%) is consistent with the error rates reported in past years (with the exception of year 2018).
At the same time, the Commission implements a multiannual ex-post audit control strategy for research expenditure. On this basis, its services estimate a residual error rate, which takes account of recoveries, corrections and the effects of all their controls and audits over the period of implementation of the programme.
Horizon 2020 is significantly simpler than previous Framework Programmes, a fact recognised by most recurring beneficiaries and the ECA.
4.38 The Commission notes the ECA’s observations that the risk at payment set out in the AMPR is within the range of the ECA’s estimated level of error. See Commission reply to paragraph 4.35.
Recommendation 4.1
The Commission accepts the recommendation.
The Commission will continue its communication campaign on funding rules, including those for SMEs and newcomers. Moreover, in its H2020 corporate sample, the CAS has drawn risk-based samples specifically targeting SMEs and/or newcomers.
The Commission’s existing risk-based ex-ante controls provide reasonable assurance on the operations.
Recommendation 4.2
The Commission accepts the recommendation.
The Commission will pay special attention to the rules of the calculation and declaration of personal costs in the communication campaign related to H2020.
Recommendation 4.3
The Commission accepts the recommendation.
The Commission proposal for the next Framework Programme aims to simplify further the rules on personnel costs. The Commission will present to the Budgetary Authority the new set of rules with the aim of getting its support in this respect.
Recommendation 4.4
The Commission accepts the recommendation.
264

EN EN
First indent - The Commission is committed to address the ECA’s observations with regard to documentation related to findings, sampling consistency and the quality of audit procedures.
Second indent - The Commission is in close contact with the External Audit Firms. Specific communication initiatives have been taken towards the audit firms. For the outsourced audits re-performed by the ECA, the Commission has communicated the observations to the audit firms.
265
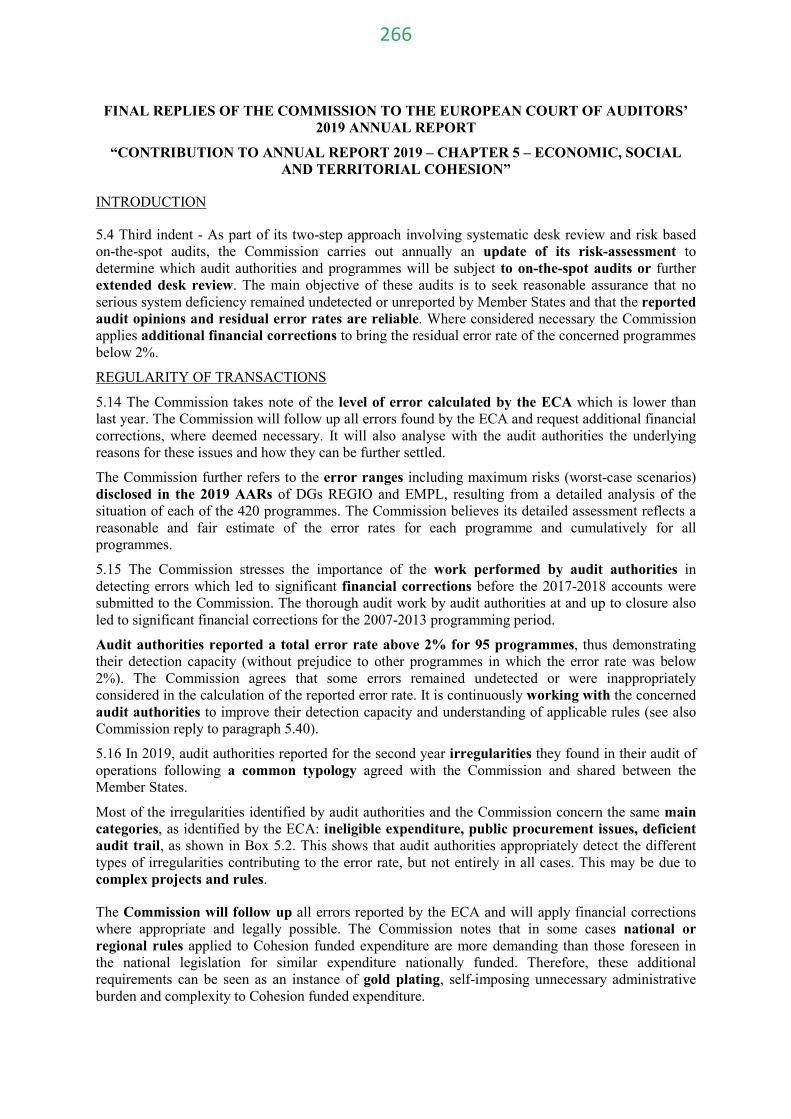
FINAL REPLIES OF THE COMMISSION TO THE EUROPEAN COURT OF AUDITORS’ 2019 ANNUAL REPORT
“CONTRIBUTION TO ANNUAL REPORT 2019 – CHAPTER 5 – ECONOMIC, SOCIAL AND TERRITORIAL COHESION”
INTRODUCTION
5.4 Third indent - As part of its two-step approach involving systematic desk review and risk based on-the-spot audits, the Commission carries out annually an update of its risk-assessment to determine which audit authorities and programmes will be subject to on-the-spot audits or further extended desk review. The main objective of these audits is to seek reasonable assurance that no serious system deficiency remained undetected or unreported by Member States and that the reported audit opinions and residual error rates are reliable. Where considered necessary the Commission applies additional financial corrections to bring the residual error rate of the concerned programmes below 2%.
REGULARITY OF TRANSACTIONS
5.14 The Commission takes note of the level of error calculated by the ECA which is lower than last year. The Commission will follow up all errors found by the ECA and request additional financial corrections, where deemed necessary. It will also analyse with the audit authorities the underlying reasons for these issues and how they can be further settled.
The Commission further refers to the error ranges including maximum risks (worst-case scenarios) disclosed in the 2019 AARs of DGs REGIO and EMPL, resulting from a detailed analysis of the situation of each of the 420 programmes. The Commission believes its detailed assessment reflects a reasonable and fair estimate of the error rates for each programme and cumulatively for all programmes.
5.15 The Commission stresses the importance of the work performed by audit authorities in detecting errors which led to significant financial corrections before the 2017-2018 accounts were submitted to the Commission. The thorough audit work by audit authorities at and up to closure also led to significant financial corrections for the 2007-2013 programming period.
Audit authorities reported a total error rate above 2% for 95 programmes, thus demonstrating their detection capacity (without prejudice to other programmes in which the error rate was below 2%). The Commission agrees that some errors remained undetected or were inappropriately considered in the calculation of the reported error rate. It is continuously working with the concerned audit authorities to improve their detection capacity and understanding of applicable rules (see also Commission reply to paragraph 5.40).
5.16 In 2019, audit authorities reported for the second year irregularities they found in their audit of operations following a common typology agreed with the Commission and shared between the Member States.
Most of the irregularities identified by audit authorities and the Commission concern the same main categories, as identified by the ECA: ineligible expenditure, public procurement issues, deficient audit trail, as shown in Box 5.2. This shows that audit authorities appropriately detect the different types of irregularities contributing to the error rate, but not entirely in all cases. This may be due to complex projects and rules.
The Commission will follow up all errors reported by the ECA and will apply financial corrections where appropriate and legally possible. The Commission notes that in some cases national or regional rules applied to Cohesion funded expenditure are more demanding than those foreseen in the national legislation for similar expenditure nationally funded. Therefore, these additional requirements can be seen as an instance of gold plating, self-imposing unnecessary administrative burden and complexity to Cohesion funded expenditure.
266

5.17 The Commission agrees that management verifications are the first line of defence against errors and should be more effective in preventing and detecting errors in the first instance.
The Commission addressed updated guidance to Member States for the 2014-2020 programming period which, combined with the required use of simplified costs options, aim to improve further the quality of management verifications. This depends however on staff available to deal with increasing amounts of declared expenditure, and to the required stability of experienced staff in the concerned administrations.
In addition, the typology of audit findings reported year on year to managing authorities by audit authorities should allow them to integrate the more frequent sources of errors in their risk assessments and to adapt their management verifications approaches and tools accordingly. To make management verifications more efficient and targeted in the 2021-2027 programming period, the Commission has proposed to the co-legislators that verifications become risk-based in order to better focus the administrative resources available to targeted sources of errors.
5.19 Common Commission reply to paragraphs 5.19 and 5.20:
The Commission agrees that operations which are physically completed or fully implemented, even if some financial transactions remain open, are not eligible in line with Article 65(6) CPR. It is up to the managing authority to assess the concepts of physical completion and full implementation for each operation on its own merit and based on its particular contractual obligations indicated in the grant decision. As long as the operation is not entirely completed, it may be selected for funding.
For the Italian projects, as referred to in Box 5.4, the Commission will continue to monitor the strict implementation by the authorities of the rules agreed for the partnership agreement to ensure an appropriate audit trail for operations already partially implemented before being selected.
5.22 Common Commission reply to paragraphs 5.22 to 5.24:
The Commission notes that audit authorities demonstrated a good detection capacity for errors linked to public procurement.
Despite this improved capacity, the important number of public procurement errors that went undetected at managing authorities and intermediate bodies' levels shows that continuous action is needed to ensure a better detection of these issues by first level management verifications.
Indeed public procurement is a complex area and contracting authorities may face challenges in applying these rules. In order to coordinate actions more effectively, the Commission has elaborated a Public Procurement Action Plan, updated several times since 2014. More than 40 actions were already initiated in the framework of this Action Plan. New actions and new initiatives aim at helping administrators and beneficiaries of EU funds improve their public procurement practices, ensuring compliance with EU Directives as well as defining a level playing field and encouraging the use of procurement as a strategic policy instrument.
The Commission also updated in 2019 its decision laying down guidelines for determining standardised financial correction on public procurement errors (Decision C (2019) 3452). These guidelines aim at achieving a homogeneous implementation practice and equal treatment among Member States.
The Commission will follow up these cases identified by ECA that remained undetected and apply financial corrections when deemed necessary, in line with its guidelines.
5.26 The Commission notes that over the past years errors related to State aid identified by Member States authorities and the Commission remain less frequent, as shown by the joint typology of errors agreed with audit authorities.
267

The Commission has developed a common State Aid Action Plan, taking a preventive and pro-active approach to reduce the risk of irregularities and error rates linked to the application of State aid rules through the identification and dissemination of good practices, a training programme and dissemination of relevant State aid information to ESI Funds stakeholders.
5.27 The Portuguese authorities modified the concerned national State aid law and committed to implement all required corrections as per the Commission request.
Ineligible expenditure
5.29 As regards the errors detected by the ECA, the Commission will do the necessary follow up and take any actions it deems necessary.
The Commission has actively worked since the introduction of the simplified cost options to progressively extend their use and considers that these efforts have already led to positive results. The Commission actively promoted the use of simplified cost options in the 2014-2020 programming period since such schemes are less error prone, as demonstrated by past experience. It will continue to do so for both ESF and ERDF in the post-2020 programming period in order to reduce the administrative burden on the beneficiaries and to further reduce the risk of error.
Absence of essential supporting documents
5.30 The Commission will do the necessary follow up and take any actions it deems necessary. Furthermore, the Commission refers to the explanations of the ECA in Box 5.8.
5.33 The Commission will follow up with the concerned programme authorities. Eligibility is ultimately assessed at closure, in line with the CPR. Therefore, the programme can still substitute ineligible loans and the Commission services will assess the eligibility of all declared loans at closure of the programme.
5.34 Common Commission reply to paragraphs 5.34 and 5.35:
The action plan shared with ECA in April 2018, as a remediation to the findings highlighted in their 2017 annual report regarding the case of SME Initiative in Spain, provided for a number of milestones aimed at ensuring compliance of the full SMEI Spain portfolio at the planned closure of the Operational Programme in 2023, including amongst others the following actions:
• review by EIF’s external auditor of a representative sample of transactions. • development and implementation of an additional classification concerning key eligibility risk
factors. • extended check of the SME Status upon inclusion of each new final recipient transaction. • desk-based monitoring activities and reviews as necessary to ensure the eligibility of the
portfolio on all financial intermediaries.
EIF has also notified financial intermediaries to perform a full review of their portfolios until closure of the Operational Programme, for which they will receive support from EIF.
5.36 Common Commission reply to paragraphs 5.36 to 5.39:
Under shared management the audit authorities in the Member States perform audits at first instance. The Commission consistently and extensively cooperates with the audit authorities to ensure a consistent control framework, to improve the quality of the assurance work when needed and to ensure the necessary detection and corrective capacities. The Commission continues to work with the concerned audit authorities to achieve further improvements of their controls, in particular to appropriately detect the type of errors found by the ECA or Commission re-performance audits. However, the Commission does not only assess reliability of audit authorities based on recalculated error rates, as these do not necessarily point to a systemic weakness in the work of the audit authorities (see also Commission reply to 5.51).
268

5.40 The common typology of errors agreed between the Commission services and audit authorities, and also used by OLAF under its IMS reporting system on irregularities, allows for a better analysis of the root-causes of errors between all actors. It responds to prior recommendations from ECA and the discharge authority. On this basis the Commission requires programme authorities to take action to tackle the most frequent errors and mitigate any risk for future expenditure, in a dialogue between programme authorities to improve, where necessary, the detection capacities of both management verifications and audits.
When additional identified irregularities point to a system weakness, remedial measures should entail improvement of methodological tools, recruitment of additional staff including experts, training activities on newly developed tools or on the correct interpretation of most frequent errors. This can include, for managing authorities and their intermediate bodies, to improve the quality of selection procedures or management verifications to filter out irregularities.
For audit authorities concerned, remedial actions refer mainly to improvements in their capacity to detect irregularities through improvements of the audit check lists and methodology they use, clarification of applicable law (in particular in relation to public procurement errors), recruitment of additional staff and continuous professional training.
5.41 Common Commission reply to paragraphs 5.41 to 5.42:
The Commission indicated in REGIO’s and EMPL’s AARs that for the 2017-2018 accounting year conditions for the use of statistical sampling was in place for operational programmes representing 88% of the expenditure declared.
The Commission has developed a thorough and comprehensive sampling guidance to further clarify the legal framework to achieve a harmonised, agreed and coordinated sampling implementation framework for audit authorities. The Commission underlines that sampling methods require the use of professional judgement at various stages of the process that may lead to different assessments between professional auditors, therefore without these systematically pointing to system weaknesses.
5.43 Common Commission reply to paragraphs 5.43 to 5.45:
The Commission welcomes the improvement noted by the ECA in terms of being able to clarify more issues without visits at the beneficiaries’ level. This contributes to making the audit less intrusive and burdensome for beneficiaries of the EU Funds, when prior control documentation is more readily available for EU audits.
As indicated in its reply to last year’s annual report of ECA (paragraphs 6.46 and 6.47), the Commission is continuously working with the audit authorities in order to strengthen their capacity to prevent and correct errors, to better document their audit work and therefore to contribute to the assurance process.
An illustration of this cooperation is the coordinated efforts the Commission has put in place with the audit authorities in 2019 and 2020, with the support and expertise of the ECA, to improve audit documentation and ensure proper quality review of audit findings (see box 5.8). A brochure containing the final version of the reflection paper on audit documentation is now being circulated to all audit authorities.
5.47 The Commission will continue to work with the concerned audit authority for the correct treatment and quantification of individual errors thus leading to a correct calculation of the error rate.
THE COMMISSION’S ASSURANCE WORK AND REPORTING OF RESIDUAL ERROR RATE IN ITS ANNUAL ACTIVITY REPORTS
Risk-based compliance audits have highlighted irregularities not detected by audit authorities
269

Common Commission reply to paragraphs 5.49 and 5.50:
The Directorates general conclude in their AARs on the three aspects linked to the effectiveness of management and control systems, acceptability of accounts and legality and regularity of underlying expenditure, after having assessed the submitted assurance packages.
The Commission takes into account all available information including from audit authorities, Commission and ECA audits, to update its risk-assessment on an annual basis and establish its audit plan.
The Commission also underlines that the preliminary audit results of the ECA on the 2017-2018 error rates form part of the general background against which the reliability of error rates reported for programmes are assessed, together with the results of the Commission desk and on the spot audit work. All such information is therefore reflected in the reported KPI5, as well as in the risk-assessment established jointly by both Directorates General.
5.51 The Commission considers that its audit results as reported in this paragraph indicate that its risk assessment on the work of audit authorities was relevant. The Commission validates its audit findings with audit authorities in a contradictory procedure and monitors its final results with a view to identify the root-causes of the additional errors it has identified, and to improve the detection capacity of the concerned audit authorities. This led it to issue preventive letters to some audit authorities ahead of the 2020 annual control reports, in some cases. In other cases, additional errors detected are more punctual and despite a possible important extrapolated impact on the error rate do not point to a systemic weakness at the level of the audit authority.
In addition to compliance audits to re-perform the work of audit authorities, the Commission also carried out 15 pre – and post- annual control report audits covering nine Member States. These audits also contribute to the review and assessment of the work of audit authorities since they allow to clarify questions on the ACR but also to detect errors in the quantification and projection of errors.
As a result of its desk and on the spot audit activities, the Commission reported in the respective AARs of REGIO and EMPL that, for a total of sixteen ERDF or ESF audit authorities or their control bodies, it considered that serious weaknesses needed to be corrected.
5.52 Due to resource constraints and other regulatory obligations, the Commission can only launch the vast majority of its annual risk-based audits as from September each year. In line with international standards and in compliance with CPR requirements, the delays required for the contradictory process make it impossible in the majority of cases to have final audit results by the next AAR. The Commission services therefore take a prudent approach for the Key Performance Indicator 5 (KPI5, i.e. the reported average residual risk) and their audit opinion in the AAR and consider the maximum potential impact of their preliminary findings when assessing the concerned programmes.
In addition a ‘maximum rate’ (worst -case scenario for the KPI) is also reported in the AAR (see paragraph 5.59). For such programmes, further audit evidence is required to verify whether the upper level of the reported risk materialises.
Furthermore, the CPR allows the Commission to carry out audits in the subsequent years of the AAR, under the period of at least three years after the submission of accounts to keep supporting documentation for the audit trail.
In all cases, additional financial corrections are required and applied when the final residual total error rate is found to be above 2% and information is disclosed in the subsequent AARs.
270

5.54 The Commission had already updated its KPI in its 2018 AARs in line with recommendation 4 of the 2017 ECA Annual Report. This KPI5 already includes a prudent, conservative approach in case of non-definitive audit results, using the maximum preliminary error rate at the time of the contradictory process. In addition a worst-case scenario is transparently disclosed in the AAR to cover additional possible risks not yet fully corroborated by audit evidence (see Commission reply to paragraph 5.52 above).
5.55 Common Commission reply to paragraphs 5.55 and 5.56:
Taking into account the ECA’s prior recommendations, the Commission now bases the KPI5 on regularity reported in the 2019 AARs for cohesion policy exclusively on the 2017-2018 confirmed residual total error rates (or for a limited number of cases, when the residual error cannot be confirmed yet, on the most conservative audit results available at the time of the AAR). In addition, the Commission introduced the concept of ‘maximum risk’.
The Commission underlines that the KPI was estimated using for all operational programmes a conservative approach using all audit evidence available at the date of finalising the AAR. The maximum rate (worst- case scenario) of the KPI is relevant only for those programmes for which possible further errors could remain in the parts of audited samples not subject to detailed re-performance activities, or for which further audit information (including from ECA audits) might become available after the adoption of the AAR.
Both Directors General transparently disclose all appropriate information by OP in their respective AARs (Annex 10 B), taking into account the timing of all Commission and ECA audits (running in parallel to the Commission's final assessment). The Commission considers such disclosure in the AARs to be a sound and diligent administrative practice.
5.58 The Commission has designed its assurance system to allow the Directors-General to provide assurance on each of the 420 individual OPs, as per their obligation as authorising officers by delegation. The Commission considers it has reasonable assurance on the legality and regularity of the underlying expenditure, except for programmes for which it reported the need for potential additional financial corrections in the AARs.
Moreover, an aggregated KPI is reported in the AARs as a weighted average of all confirmed error rates. The Commission also reported a maximum level of this KPI (worst-case scenario), taking into account all pending information still under validation. Finally, the CPR provides for the possibility to national and EU actors to carry out audits during at least three years after the year in which accounts were submitted. This is important for the Commission to be able to discharge its responsibilities in relation to implementation of the EU budget under multiannual programmes.
5.59 The Commission, in its supervisory role as a manager of the EU budget, has a specific role and designs its approach in controlling EU funds accordingly. This is reflected in the risk at payment reported by the Commission.
5.60 Common Commission reply to paragraphs 5.60 to 5.62:
The Commission underlines that both DGs have issued reservations in their respective 2019 AARs in relation to the relevant payments in the year, following the corporate instructions and materiality criteria defined in annex 4 of the respective AARs with a view of protecting the EU budget if risks are identified.
Such reservations take account of all information reviewed at the time of their assessment: the error rates reported in the latest ACR, as reviewed at the time of the assessment, previous year’s confirmed error rates that may point to system deficiencies not yet settled at the time of the assessment, and
271

latest available assessments of management and control system including improvements or, on the contrary, new weaknesses identified.
Independently of the year in which a weakness is detected (either by a Member State itself or by the Commission), reservations are maintained until the issue has been addressed.
In addition, with regard to previous accounting years, the Commission reports in the AARs in full transparency the financial corrections applied or launched/to be launched, in full respect of the applicable contradictory procedures (see respective REGIO and EMPL AARs, pp. 32 and 45).
CONCLUSION AND RECOMMENDATIONS
5.63 The Commission takes note of the level of error calculated by the ECA which is lower than last year.
The Commission will follow-up all errors found by the ECA and request additional financial corrections, where deemed necessary.
The Commission further refers to the error ranges including maximum risks (worst-case scenarios) disclosed in the 2019 AARs of DGs REGIO and EMPL, resulting from a detailed analysis of the situation of each of the 420 programmes (see Commission reply to paragraphs 5.65 to 5.67 below).
5.64 The Commission considers that, overall, reliance can be placed on the work of audit authorities, with the exception of a few instances as clearly spelt out in the AARs based on all audit information available.
The Commission will continue to closely work with the audit authorities to ensure that they continue to work in accordance with standards. It will also analyse with the audit authorities the underlying reasons for the issues detected by the ECA and Commission’s audits and how they can be further settled.
5.65 Common Commission reply to paragraphs 5.65 to 5.67:
The Commission highlights that the current approach followed by the ECA for its Statement of Assurance allows a better alignment of audit methodologies at all levels.
The Commission, in its supervisory role as a manager of the EU budget, has a specific role and designs its approach in controlling EU funds accordingly. This is reflected in the risk at payment reported by the Commission.
The Commission reports in the AARs the error rates for the ERDF, CF and ESF, which once aggregated, are within a range of 2,3 % to 3,3 % for cohesion policy (see Box 5.9.), which is within the error range calculated by the ECA. The AMPR aggregates the errors rates disclosed in the AARs.
The Commission believes its detailed assessment reflects a reasonable and fair estimate of the error rates for each programme and cumulatively for all programmes. This detailed assessment of each programme according to risk profiles and management and control systems, taking also account of the ECA’s work, allows the Commission to conclude on the specific part of the programme population that is most likely to be affected and to identify the specific areas where improvements are needed.
The objective of the current assurance model is indeed to have a residual error rate below 2% for each programme, rather than on average. For programmes where the error rate could not be confirmed because of ongoing audit work, the Commission uses the legal tools at its disposal to apply the necessary financial corrections when completed audits result in residual error rates above 2%. The Commission reports these in the subsequent AARs.
272

The Commission will continue to closely work with the managing and audit authorities of the programmes concerned, to follow up on agreed conclusions and to achieve over time a residual level of error below 2% for all programmes.
5.68 On the recommendations which are reported by the ECA as not been acted upon at all or implemented in some respects, the Commission refers to its reply to Annex 5.3.
Commission reply to Annex 5.3:
In relation to recommendation 2 of 2017, the Commission notes that it has proposed for 2021-2027 to make VAT eligible for projects below a total cost of 5 million euro. This is an alternative approach to the one recommended by ECA.
In relation to recommendation 6 of 2017, the Commission underlines that the regulatory framework gives the possibility to audit programmes at least three years after submission of the accounts, where needed. The Commission endeavours to conclude on the regularity of expenditure in the AAR following the year of submission of the accounts, and transparently reports for all concerned programmes in annex of the AARs, but this is not always possible.
Recommendation 5.1 – Project eligibility conditions
The Commission accepts this recommendation.
The CPR does not contain the definition of ‘physically completed or fully implemented operation’ referred to in Article 65(6). The Commission is of the opinion that given the varied nature of operations, compliance with the provisions of Article 65(6) must be assessed by programme authorities for each operation concerned on the basis of its own merits, taking into account its specificities its scope as defined in the contractual grant decisions and compliance with national law. In doing this, programme authorities must ensure compliance with Article 65(6) CPR.
The risk of selection of ‘physically completed’ and/or ‘fully implemented’ operations varies between Member States and programmes, and is in particular linked to one Member State where the border between national and EU schemes is deliberately kept thin to allow mobilising national investments rapidly whenever needed. The Commission has explained in a Q&A the difference between operations ‘physically completed’ and other operations that could be considered ‘fully implemented’, due in particular to absence of a physical object/investment. The Commission agrees to the need to provide further clarification to this Member State based on experience collected so far to avoid any risks. Moreover, the clarification provided to this Member State will be further made available to other Member States concerned.
Recommendation 5.2 – Action to increase the reliability of the residual rates reported by audit authorities
The Commission accepts the recommendation.
The Commission is already providing in the AARs (see p. 26 of the 2019 AAR for REGIO and see p. 41 of the 2019 AAR for EMPL) an overall analysis by comparing the main error types identified by the audit authorities and by the Commission auditors, and refers to the audit authorities which are considered not to provide reliable results and the underlying reasons for it.
Furthermore, a discussion on existing discrepancy of the Commission findings and the audit authority’s findings are a permanent point in the Annual Coordination Meetings since 2018. A more structured discussion with the concerned audit authorities will as from 2020 include a detailed analysis of the additional errors found by EU audits, with recorded actions by the audit authorities to address the non-detection of these errors.
273

A study on REGIO audit findings from the periods 2007-2013 and 2014-2020 is also planned for publication in autumn 2020. It will allow for a more general dialogue with programme authorities on the types of irregularities found in Commission audits not detected by programmes’ management verifications and audits.
274

EN EN
REPLIES OF THE COMMISSION TO THE EUROPEAN COURT OF AUDITORS' 2019 ANNUAL REPORT
"CHAPTER 6 - NATURAL RESOURCES"
REGULARITY OF TRANSACTIONS
6.8 The Commission notes with satisfaction that the ECA’s estimated level of error for ‘Natural resources’ is 1.9 %, thus below the materiality threshold of 2% (as presented in the Annex 6.1). This is consistent with the results presented in the 2019 Annual Activity Reports of DG AGRI, DG MARE, DG CLIMA and DG ENV for the policy areas covered by the chapter ‘Natural resources’. 6.11 The Commission is very satisfied with the ECA's finding that EAGF direct payments, representing 41.3 billion euro in financial year 2019, are free of material errors. The Commission notes that the ECA’s finding that the direct payments as a whole are free of material error is consistent with the error rate for direct payments presented in DG AGRI’s 2019 AAR (1.57 %).
Direct payments as a whole were free from material error
As regards the heading above point 6.13, the Commission welcomes ECA’s assessment that Direct payments are free from material error (see also reply to paragraph 6.11). 6.13 The Commission considers that minor errors are impossible to avoid at a reasonable cost and notes that the level of error estimated by the ECA for direct payments is below the materiality threshold of 2 %.
6.15 The Commission welcomes ECA’s positive assessment of the role of IACS and LPIS in preventing and reducing levels of error.
6.21 The Commission welcomes the positive development as regards Rural Development: the ECA is detecting a decreasing number of errors in rural development, which is in line with the DG AGRI findings reported in its AAR for the financial year 2019.
ANNUAL ACTIVITY REPORTS AND OTHER GOVERNANCE ARRANGEMENTS
DG AGRI’s reporting on the regularity of CAP spending
6.29 The Commission notes that a significant improvement in the work of the Certification Bodies was achieved as they delivered sound and substantial results from auditing the legality and regularity of the expenditure on all populations compared to previous years. The Commission welcomes the assessment of the ECA that the certification bodies’ role in providing an opinion on the regularity of expenditure was a positive development.
6.31 For the calculation of the adjusted error rates in the 2019 AAR, DG AGRI used as a starting point the control statistics for each Paying Agency (or measure for market measures,
275

EN EN
ABB 02). DG AGRI relied extensively on the results of the work of the Certification Bodies, as well as on its own audits to adjust the error rates reported by the Paying Agencies, where deficiencies were found in their management and control systems. It has to be noted that, in several cases where DG AGRI had a flat-rate adjustment, the Certification Bodies found similar issues. In those situations, the Certification Bodies’ findings are considered relevant but covered by the flat rate adjustment.
6.32 The Commission welcomes the fact that ECA conclusions are consistent with the low error rate reported in the DG AGRI’s AAR. The Commission also considers that the risk to the EU budget is adequately covered by the corrective capacity, which consists of net financial corrections and recoveries from beneficiaries. The corrective capacity reported in the 2019 Annual Activity Report of the Directorate General for Agriculture and Rural Development amounted to 1.77% of the relevant CAP expenditure. Therefore, the final amount at risk was estimated at 0.12% of the relevant CAP expenditure, much below materiality.
CAP anti-fraud policies and procedures
6.35 The Commission welcomes that almost all of the payments the ECA audits as regards direct payments and rural development area-based payments concern farmers submitting correct claims or making small errors.
6.36 The Commission notes the ECA assessment that the risk of fraud is greater for the areas which are generally subject to reimbursement-based co-financing and not in the area of Direct Payments and area-based rural development expenditure which represent the large majority of CAP expenditure.
6.37 The Commission notes that the relevant authorities implementing the CAP in the Member States are in the front line to prevent, detect and correct irregularities and fraud (Art. 58 (1) R1306/2013).
6.39 The Commission has taken the recommendations arising from the ECA special report 1/2019 into account in the Commission Anti-Fraud Strategy adopted in April 2019.
6.40 First indent: The Commission considers that the fraud risk analysis is an ongoing process based on OLAF investigation reports, the Commission’s own audit work and other information related to alleged fraud cases. Since 2016, no substantial changes in fraud patterns as regards the eligibility of expenditure of CAP funds have been observed.
The recently publicised alleged fraud cases have related to persons obtaining surfaces in an allegedly illegal way for which they then claim direct aid in an apparently regular and legal way under CAP regulations. Remedies against such actions would be a question of rule of law in the Member States concerned.
Second indent: According to the accreditation criteria in Annex I of Regulation (EU) No 907/2014, the CAP Paying Agencies (PAs) shall ensure that appropriate procedures are in
276
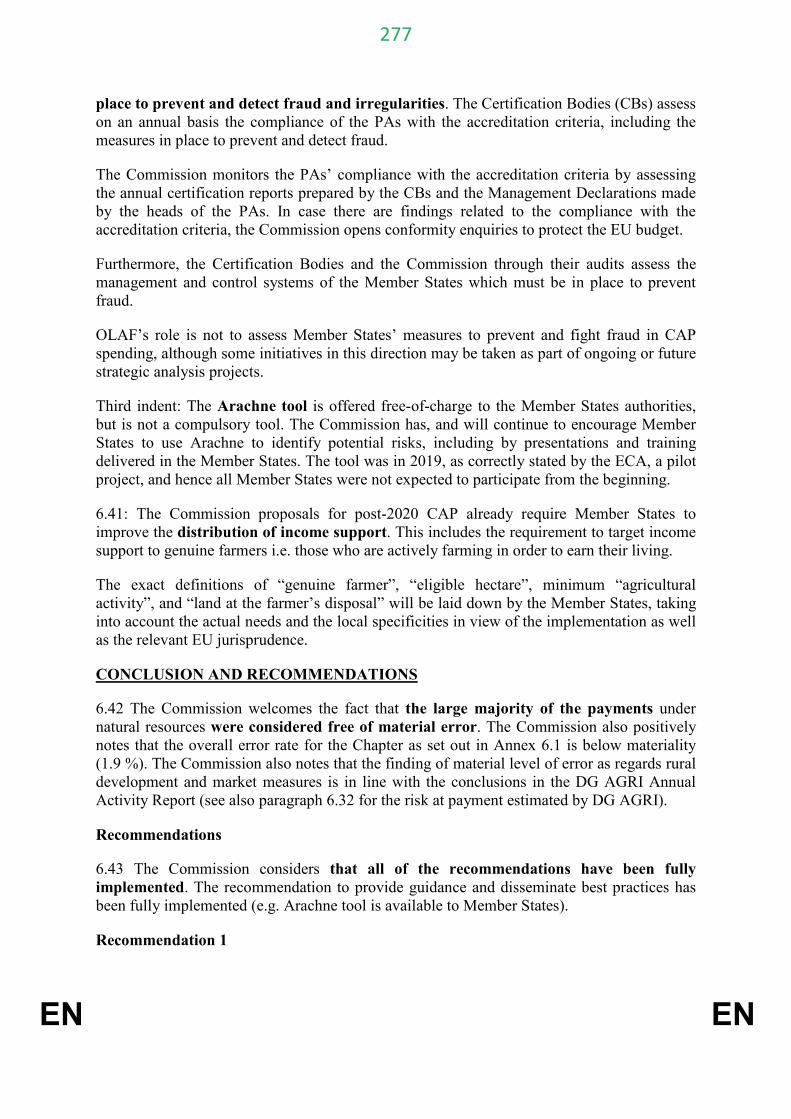
EN EN
place to prevent and detect fraud and irregularities. The Certification Bodies (CBs) assess on an annual basis the compliance of the PAs with the accreditation criteria, including the measures in place to prevent and detect fraud.
The Commission monitors the PAs’ compliance with the accreditation criteria by assessing the annual certification reports prepared by the CBs and the Management Declarations made by the heads of the PAs. In case there are findings related to the compliance with the accreditation criteria, the Commission opens conformity enquiries to protect the EU budget.
Furthermore, the Certification Bodies and the Commission through their audits assess the management and control systems of the Member States which must be in place to prevent fraud.
OLAF’s role is not to assess Member States’ measures to prevent and fight fraud in CAP spending, although some initiatives in this direction may be taken as part of ongoing or future strategic analysis projects.
Third indent: The Arachne tool is offered free-of-charge to the Member States authorities, but is not a compulsory tool. The Commission has, and will continue to encourage Member States to use Arachne to identify potential risks, including by presentations and training delivered in the Member States. The tool was in 2019, as correctly stated by the ECA, a pilot project, and hence all Member States were not expected to participate from the beginning.
6.41: The Commission proposals for post-2020 CAP already require Member States to improve the distribution of income support. This includes the requirement to target income support to genuine farmers i.e. those who are actively farming in order to earn their living.
The exact definitions of “genuine farmer”, “eligible hectare”, minimum “agricultural activity”, and “land at the farmer’s disposal” will be laid down by the Member States, taking into account the actual needs and the local specificities in view of the implementation as well as the relevant EU jurisprudence.
CONCLUSION AND RECOMMENDATIONS
6.42 The Commission welcomes the fact that the large majority of the payments under natural resources were considered free of material error. The Commission also positively notes that the overall error rate for the Chapter as set out in Annex 6.1 is below materiality (1.9 %). The Commission also notes that the finding of material level of error as regards rural development and market measures is in line with the conclusions in the DG AGRI Annual Activity Report (see also paragraph 6.32 for the risk at payment estimated by DG AGRI).
Recommendations
6.43 The Commission considers that all of the recommendations have been fully implemented. The recommendation to provide guidance and disseminate best practices has been fully implemented (e.g. Arachne tool is available to Member States).
Recommendation 1
277

EN EN
The Commission accepts the recommendation.
The Commission considers that the fraud risk analysis is an ongoing process based on OLAF investigation reports, the Commission’s own audit work and other information related to alleged fraud cases. Since 2016, no substantial changes in fraud patterns as regards the eligibility of expenditure of CAP funds have been observed.
The recently publicised alleged fraud cases have related to persons obtaining surfaces in an allegedly illegal way for which they then claim direct aid in an apparently regular and legal way under CAP regulations. Remedies against such actions would be a question of rule of law in the Member States concerned.
In relation to the performance of analysis of Member States’ fraud prevention measures, the Commission points to actions 37 to 42 of the Action Plan accompanying the Commission Anti-Fraud Strategy (COM(2019)196 final).
The Certification Bodies (CBs) assess on an annual basis the compliance of the Paying Agencies (PA) with the accreditation criteria, including the measures in place to prevent and detect fraud. The Commission monitors the PAs’ compliance with the accreditation criteria by assessing the annual certification reports prepared by the CBs and the Management Declarations made by the heads of the PAs. In case there are findings related to the compliance with the accreditation criteria, the Commission opens conformity enquiries to protect the EU budget.
The Commission is continuously encouraging Member States to use the Arachne tool to identify potential risks, including by presentations and training delivered in the Member States.
278

REPLIES OF THE COMMISSION TO THE EUROPEAN COURT OF AUDITORS’ 2019 ANNUAL REPORT
CHAPTER 7 “SECURITY AND CITIZENSHIP”
REGULARITY OF TRANSACTIONS
Box 7.3 - Salary costs overstated
The Commission will take the corresponding appropriate measures.
EXAMINATION OF ELEMENTS OF INTERNAL CONTROL SYSTEMS
7.10. The Commission understanding of point 7.10 is that the text relates to the shortcomings detected by the ECA. The Commission had also identified most of the issues reported by the ECA in Box 7.4 during its assessment of the 2018 Annual Control Reports and brought these issues to the attention of the concerned national authorities in order to avoid similar issues in future years.
Please see also the reply to box 7.4.
Box 7.1 - Shortcomings in annual control reports
On inaccurate calculation and presentation of total and/or residual error rates, the Commission points out that the inaccuracies were rather minor this year, which was the first year that the Audit Authorities were required to submit this information. As the residual error rates in Germany and Italy were well below the materiality level, the identified errors did not impact and/or compromise the adequacy of the Audit Authorities’ opinion on the accounts.
The Commission informed the concerned Audit Authorities so that they could take appropriate action to avoid similar issues in future exercises. 7.11 The Commission notes that the impact reported by the ECA in Box 7.5 is potential and the shortcomings relate only to certain checks carried out in some projects, which did not put in question the conclusion/opinion of the Audit Authorities as stated by the ECA in paragraph 7.10. CONCLUSION AND RECOMMENDATIONS
Recommendation 7.1 – Audit coverage
The Commission accepts recommendation 7.1 and will provide guidance to the Audit Authorities on sub-sampling including the calculation of the audit coverage when sub-sampling is applied.
Recommendation 7.2 – Sampling
The Commission accepts recommendation 7.2 and will continue to provide, as in the past years, sampling guidance and feedback to the national Audit Authorities.
Recommendation 7.3 – Audit trail
The Commission accepts recommendation 7.3 and will continue to provide guidance to Audit Authorities in particular on documentation of audit work.
279
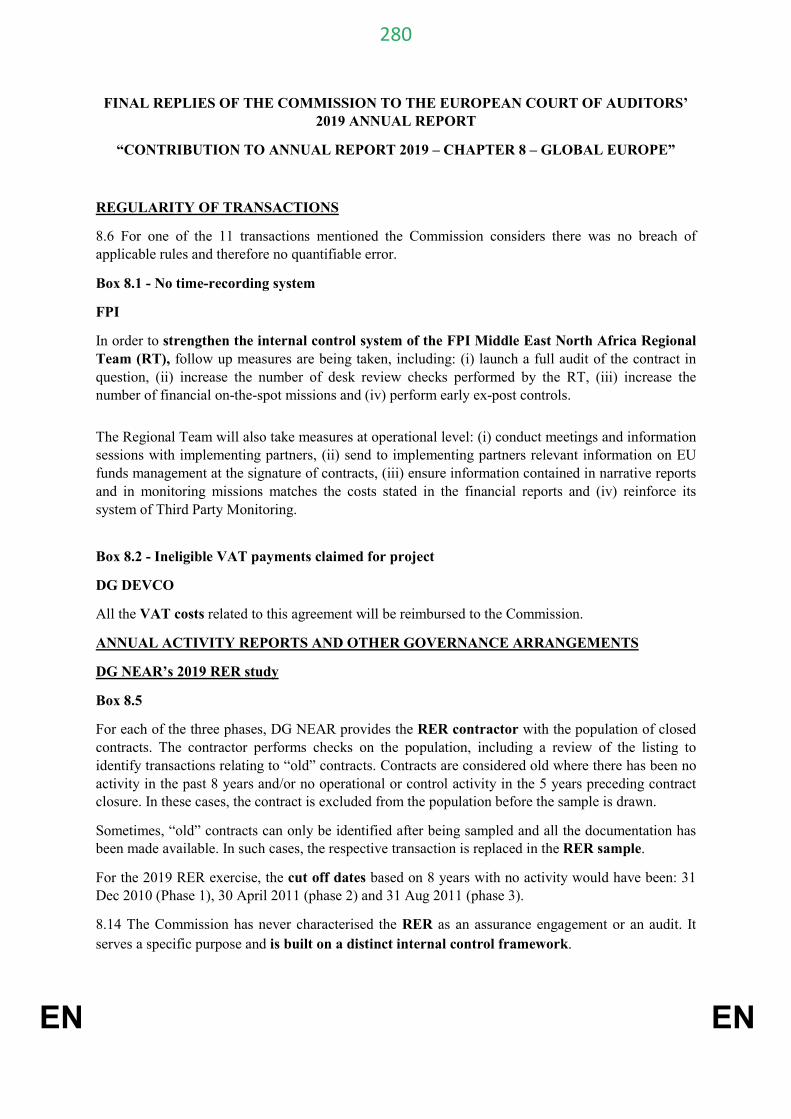
EN EN
FINAL REPLIES OF THE COMMISSION TO THE EUROPEAN COURT OF AUDITORS’ 2019 ANNUAL REPORT
“CONTRIBUTION TO ANNUAL REPORT 2019 – CHAPTER 8 – GLOBAL EUROPE”
REGULARITY OF TRANSACTIONS
8.6 For one of the 11 transactions mentioned the Commission considers there was no breach of applicable rules and therefore no quantifiable error.
Box 8.1 - No time-recording system
FPI
In order to strengthen the internal control system of the FPI Middle East North Africa Regional Team (RT), follow up measures are being taken, including: (i) launch a full audit of the contract in question, (ii) increase the number of desk review checks performed by the RT, (iii) increase the number of financial on-the-spot missions and (iv) perform early ex-post controls. The Regional Team will also take measures at operational level: (i) conduct meetings and information sessions with implementing partners, (ii) send to implementing partners relevant information on EU funds management at the signature of contracts, (iii) ensure information contained in narrative reports and in monitoring missions matches the costs stated in the financial reports and (iv) reinforce its system of Third Party Monitoring.
Box 8.2 - Ineligible VAT payments claimed for project
DG DEVCO
All the VAT costs related to this agreement will be reimbursed to the Commission.
ANNUAL ACTIVITY REPORTS AND OTHER GOVERNANCE ARRANGEMENTS
DG NEAR’s 2019 RER study
Box 8.5
For each of the three phases, DG NEAR provides the RER contractor with the population of closed contracts. The contractor performs checks on the population, including a review of the listing to identify transactions relating to “old” contracts. Contracts are considered old where there has been no activity in the past 8 years and/or no operational or control activity in the 5 years preceding contract closure. In these cases, the contract is excluded from the population before the sample is drawn.
Sometimes, “old” contracts can only be identified after being sampled and all the documentation has been made available. In such cases, the respective transaction is replaced in the RER sample.
For the 2019 RER exercise, the cut off dates based on 8 years with no activity would have been: 31 Dec 2010 (Phase 1), 30 April 2011 (phase 2) and 31 Aug 2011 (phase 3).
8.14 The Commission has never characterised the RER as an assurance engagement or an audit. It serves a specific purpose and is built on a distinct internal control framework.
280

EN EN
The RER study is an important element for the Director-General’s assurance, but it is not the only source of assurance on the DG NEAR internal control framework in its entirety. It builds on a large number of checks on transactions, 365 transactions in total.
The Commission considers that the reported residual error rate for 2019 was accurate.
The RER methodology includes checks on public procurement covering inter alia the rejection of candidates, compliance with selection and award criteria for both first and second level procurement, as well as direct awards.
In relation to calls for proposals, the EU Financial Regulation establishes the framework for the award of grants following such calls. The rules in place provide considerable scope for contracting authorities and authorising officers to manage the process flexibly.
Experience has demonstrated that errors on calls for proposals are not generally quantifiable.
Based on the RER methodology, if such non quantifiable errors were reported, they would add no value to the overall purpose of the study, which is to measure the Residual Error Rate.
8.15 The number of grant transactions included in the global rate has already been increased in response to a recommendation issued by the Court in its annual report for 2017.
The purpose of the additional grant sample is to provide the Commission with corroborative information complementing the grant-related information provided by the main sample. This provides a basis for the management to decide whether a reservation is required in respect of grants. The additional sample of 96 sampling intervals (representing 1/3 of the entire population of the RER study) fulfils that requirement. A higher confidence level would necessitate a much larger sample (+88 transactions for a confidence level of 95%). This would not make a substantial contribution to the core objective pursued by having an additional grant sample. The current approach responds to the key priorities, namely building assurance and cost-efficiency of controls.
8.16 As stated by the Court, no estimations featured in the 2019 DG NEAR RER Study. In the 2018 study there were 2 estimations out of more than 400 transactions.
Estimations have been part of the RER methodology for nine years. The risk premium was introduced in 2017 in order to provide an objective basis for estimating errors, which does not allow for manipulation by the contractor or the Commission.
In the very few cases when an estimation is necessary, the contractor follows the RER manual. An estimation can only be made if the documentation is not provided for logistical or legal reason. In all other cases, a quantified error is raised.
In cases where there is a logistical or legal reason for estimation, the risk premium approach applies, with a risk premium of 5% for the transactions added to the prevailing error rate. In the absence of this risk premium the error would be treated as unquantifiable.
8.17 The Commission considers that there has been no overreliance on other auditors’ control work. Full and partial reliance decisions are taken in justified cases and redoing the previous control work completed under the applicable professional standards including, where relevant, international audit standards would be excessive and disproportionate to the control objective of the RER study.
The Commission notes that full reliance decreased in 2019.
281

EN EN
Adopting full reliance for an individual transaction means that no substantive testing on the transaction is required. Nevertheless, all other procedures remain applicable. In order to decide whether to place full or partial reliance on previous work, the contractor performs certain checks. These checks are designed to, and do identify errors that have not been detected by prior control work, on which full reliance is to be placed. The tests carried out in the case of partial reliance are more extensive and include substantive testing. Partial reliance and full reliance are not the same. The Commission considers that over reliance on the control work of other auditors should be avoided and that in the case of the 2019 RER study there has been no such over reliance. If the control work of other auditors is not relied upon when considered sound, this would subject the beneficiary to two audits/verifications of the same transaction. DG NEAR’s annual activity report 8.21 The sentence that was duly included in the AAR 2018 does not appear in the AAR 2019: “the RER study is not an audit which provides an audit opinion. However, the DG reaches its own conclusions from the auditor’s report of factual findings. The auditors use professional skills on the basis of specific agreed upon procedures and on the basis of IFAC International standards on related services (ISRS 4400)”. This sentence will be included in the future AARs.
CONCLUSIONS AND RECOMMENDATIONS
Recommendation 8.1
The Commission accepts this recommendation.
Recommendation 8.2
The Commission does not accept this recommendation.
The purpose of the additional grant sample is to provide the Commission with corroborative information complementing (and improving upon) the grants-related information provided by the main sample.
A higher confidence level would necessitate a much larger sample, with a corresponding increase in cost, without making a substantial contribution to the overriding purpose of having an additional grant sample. This approach also respects the principle of cost-efficiency of controls.
Recommendation 8.3
The Commission accepts the recommendation.
The Commission continuously reinforces checks and includes in its Annual Action Plans new actions to prevent recurrent errors relevant to its business.
282

EN EN
REPLIES OF THE EUROPEAN PARLIAMENT TO THE EUROPEAN COURT OF AUDITORS’ 2019 ANNUAL REPORT
CHAPTER 9: ADMINISTRATION - MFF HEADING 5
Annex 2
REGULARITY OF TRANSACTIONS
9.8. Parliament takes note of the observation, and has re-examined and addressed the
individual cases following the Court’s findings: it requalified expenditure as non-reimbursable
in one case; in one transaction Parliament decided not to reverse its position, whilst another
transaction has been further investigated and accepted by Parliament on the basis of
additional clarifications and evidence received from the European political party concerned.
Parliament however emphasizes that its administration is the authorizing service for the
payment of the grant towards the European political parties, but not responsible for their
substantive expenditure: the applicable rules provide for an indirect management method
based on the award of contributions to the European political parties. The beneficiaries of the
funds are themselves responsible for the legality and regularity of transactions. Parliament
provides guidance and performs ex post verifications on a sample basis. Part of the ex post
verification work is outsourced to a mandated external auditor.
CONCLUSIONS AND RECOMMENDATIONS
Recommendations
9.21. Parliament underlines that comprehensive guidance and training was provided to
political groups but that the recommendation has been reinserted due to comparable issues
within a European political party. In that respect, Parliament equally points out that additional
efforts were made and continue to be undertaken to provide European political parties with
comprehensive information and guidance on topics for which problems have been identified.
While political groups are part of an EU institution, European political parties are independent
organisations with a European status, but partially subject to national rules on non-profit
organisations. Therefore, targeted measures are adopted to improve the spending practice of
these organisations. A guide on funding awarded, including best practices on the
implementation of funding, is regularly updated and provided to the beneficiaries. Specific
issues such as procurement are also addressed in separate guidance notes and in meetings
organised with all beneficiaries.
283

EN EN
REPLIES OF THE EUROPEAN ECONOMIC AND SOCIAL COMMITTEE TO THE EUROPEAN COURT OF AUDITORS’ 2019 ANNUAL REPORT
CHAPTER 9: ADMINISTRATION - MFF HEADING 5
ANNEX
REGULARITY OF TRANSACTIONS
Reply to observations under points 9.11 and 9.12: "The European Economic and Social Committee agrees with the observations of the Court."
CONCLUSIONS AND RECOMMENDATIONS
Reply to recommendation for point 9.1: "The European Economic and Social Committee acknowledges the Court's recommendation. The 2019 exercise to assess compliance with the internal control standards highlighted the need to implement a policy for dealing with sensitive functions and to set up a risk management process. The steps envisaged are:
− defining sensitive functions; − qualifying risks based on the use of standardised indicators ("red flags"); − quantifying the risks based on the total number of red flags associated with a function; − mitigating the risks (including by defining the controls needed for this purpose).
The preparatory activities (i.e. setting up a methodology and the definition process) started in the first semester of 2020 and the new policy should be operational by 2021."
________________
284

Annual report on the activities funded by the 8th, 9th, 10th and 11th
European Development Funds for the 2019 financial year
285

Contents Page
General introduction 288
Chapter I Financial implementation of the 8th, 9th, 10th and 11th EDFs 291
Chapter II The ECA’s statement of assurance on the EDFs 294
Chapter III Performance 314
European Commission's replies 320
286

Contents
Paragraph
Introduction 01-05 Brief description of the European Development Funds 02-05
Chapter I – Financial implementation of the 8th, 9th, 10th and 11th EDFs 06-09
Chapter II – The ECA’s statement of assurance on the EDFs I.-41 The ECA’s statement of assurance on the 8th, 9th, 10th and 11th EDFs to the European Parliament and the Council – independent auditor’s report I.-XXI.
Information in support of the statement of assurance 10-41 Audit scope and approach 10-14
Reliability of accounts 15
Regularity of transactions 16-25
Annual activity report and other governance arrangements 26-41
Conclusion and recommendations 42-45 Conclusion 42-43
Recommendations 44-45
Chapter III – Performance 46-47
Annexes Annex I — Results of transaction testing for the EDF
Annex II — EDF payments in 2019 by main region
Annex III — Follow-up of previous recommendations for the European Development Funds
287

Introduction 01 This annual report presents our findings on the 8th, 9th, 10th and 11th European Development Funds (EDFs). Box 1 gives an overview of the activities and spending in this area in 2019.
Box 1
European Development Funds – 2019 financial overview
9th 10th 11thTOTAL 14 456 3 377Administration - 6 166Budget support - 2 668Projects 14 448 2 544
14 448
2 544
2
668
6
166
0
500
1 000
1 500
2 000
2 500
3 000
3 500
(million euros)EDF payments by budget line and type (million euros)
288

(*) In line with the harmonised definition of underlying transactions (for details see Annex 1.1 to the ECA’s 2019 annual report on the implementation of the budget, paragraph 11).
Source: 2019 consolidated accounts of the 8th, 9th, 10th and 11th EDFs.
Brief description of the European Development Funds
02 Launched in 1959, the EDFs are the main instrument by which the European Union (EU) provides development cooperation aid to the African, Caribbean and Pacific (ACP) countries and overseas countries and territories (OCTs). The partnership agreement signed in Cotonou on 23 June 2000 for a period of 20 years (‘the Cotonou Agreement’) is the current framework governing the EU’s relations with ACP countries and OCTs. Its primary objective is to reduce and ultimately eradicate poverty.
interim/final …interim/final payments 1 197
prefinancing payments ⁽*⁾ 2 050
trust fund contributions600
clearing of prefinancing ⁽*⁾ 2 000
trust fund disbursements 185
0 1 000 2 000 3 000 4 000
Auditpopulation
3 382
Payments3 847
(million euros)EDF Payments and audited population
289

03 The EDFs are particular in that:
(a) the Member States’ contributions are based on quotas, or ‘contribution keys’, which are set by the national governments at the Council of the European Union;
(b) they are managed by the Commission, outside the framework of the EU general budget, and the European Investment Bank (EIB);
(c) due to the intergovernmental nature of the EDFs, the European Parliament plays a more limited role in their functioning than it does for the development cooperation instruments financed by the EU general budget; notably, it is not involved in establishing and allocating EDF resources. However, the European Parliament is still the discharge authority, except for the Investment Facility, which is managed by the EIB and is therefore outside the scope of our audit1 2;
(d) the principle of annuality does not apply to the EDFs: EDF agreements are usually concluded for a commitment period of five to seven years, and payments can be made over a much longer time frame.
04 The EDFs are managed almost entirely by the Commission’s Directorate-General for International Cooperation and Development (DG DEVCO)3.
05 The expenditure covered in this report is delivered using a wide range of methods such as works, supply and service contracts; grants; budget support and programme estimates, implemented in 79 countries.
1 See Articles 43, 48-50 and 58 of Council Regulation (EU) 2015/323 of 2 March 2015 on the
financial regulation applicable to the 11th European Development Fund (OJ L 58, 3.3.2015, p. 17).
2 In 2012, a tripartite agreement between the EIB, the Commission and the ECA (Article 134 of Council Regulation (EC) No 215/2008 of 18 February 2008 on the Financial Regulation applicable to the 10th EDF (OJ L 78, 19.3.2008, p. 1)) set out the rules for the audit of these operations by the ECA. The Investment Facility is not covered by the ECA’s statement of assurance.
3 With the exception of the 1,14 % of the 2019 EDF expenditure managed by the Directorate-General for Humanitarian Aid and Civil Protection (DG ECHO).
290

Chapter I – Financial implementation of the 8th, 9th, 10th and 11th EDFs 06 The budget of the 8th EDF (1995-2000) was 12 840 million euros, that of the 9th EDF (2000-2007) 13 800 million euros, and that of the 10th EDF (2008-2013) 22 682 million euros.
07 The Internal Agreement establishing the 11th EDF4 (2015-2020) came into force on 1 March 2015. Between 2013 and 2015, funds were committed via a bridging facility to ensure continuity pending ratification of the 11th EDF. The 11th EDF holds 30 506 million euros, of which 29 089 million is allocated to the ACP countries, 364,5 million to the OCTs and 1 052,5 million euros to administrative costs.
08 Box 2 shows the use of EDF resources both in 2019 and cumulatively.
4 OJ L 210, 6.8.2013, p. 1.
291
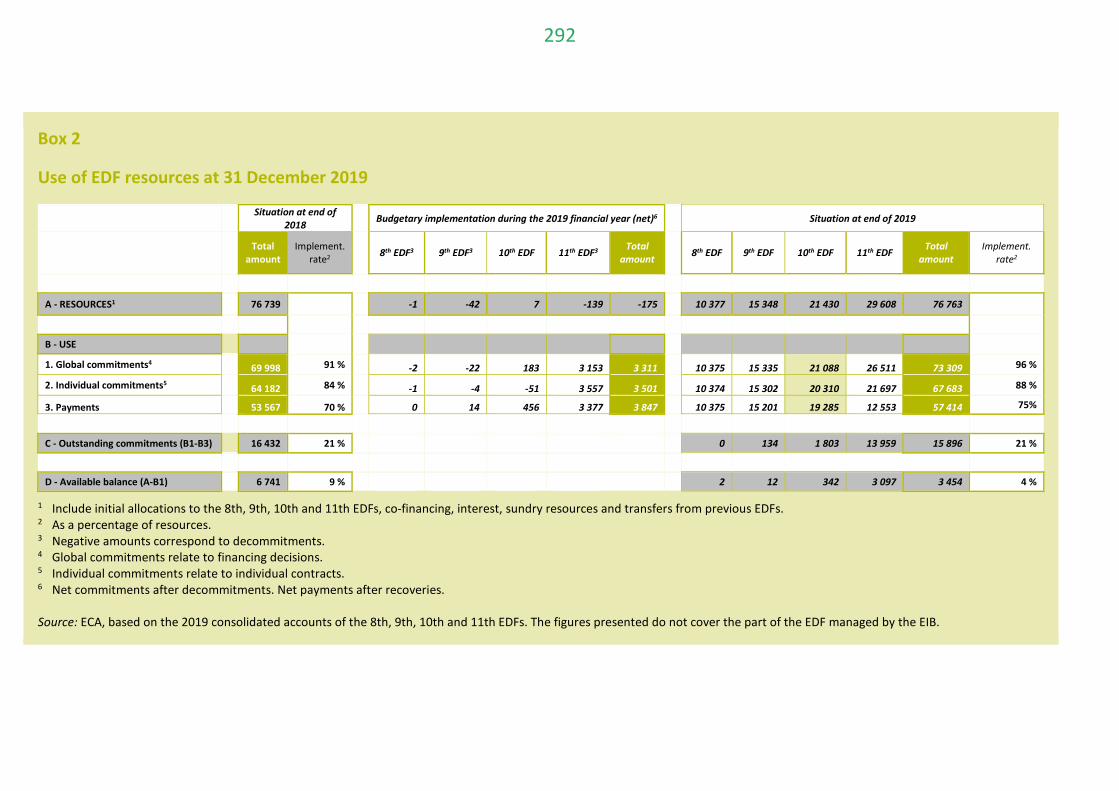
Box 2
Use of EDF resources at 31 December 2019
Situation at end of
2018 Budgetary implementation during the 2019 financial year (net)6 Situation at end of 2019
Total amount
Implement. rate2 8th EDF3 9th EDF3 10th EDF 11th EDF3 Total
amount 8th EDF 9th EDF 10th EDF 11th EDF Total amount
Implement. rate2
A - RESOURCES1 76 739 -1 -42 7 -139 -175 10 377 15 348 21 430 29 608 76 763
B - USE
1. Global commitments4 69 998 91 % -2 -22 183 3 153 3 311 10 375 15 335 21 088 26 511 73 309 96 %
2. Individual commitments5 64 182 84 % -1 -4 -51 3 557 3 501 10 374 15 302 20 310 21 697 67 683 88 %
3. Payments 53 567 70 % 0 14 456 3 377 3 847 10 375 15 201 19 285 12 553 57 414 75%
C - Outstanding commitments (B1-B3) 16 432 21 % 0 134 1 803 13 959 15 896 21 %
D - Available balance (A-B1) 6 741 9 % 2 12 342 3 097 3 454 4 %
1 Include initial allocations to the 8th, 9th, 10th and 11th EDFs, co-financing, interest, sundry resources and transfers from previous EDFs. 2 As a percentage of resources. 3 Negative amounts correspond to decommitments. 4 Global commitments relate to financing decisions. 5 Individual commitments relate to individual contracts. 6 Net commitments after decommitments. Net payments after recoveries.
Source: ECA, based on the 2019 consolidated accounts of the 8th, 9th, 10th and 11th EDFs. The figures presented do not cover the part of the EDF managed by the EIB.
292

09 Every year, DG DEVCO sets itself key performance indicators (KPIs) on sound financial management and the efficient use of resources. These indicators show that, in 2019, DG DEVCO reached its targets of reducing old pre-financing and unspent commitments by 25 % and expired contracts by 15 % (see Box 3). Both targets were set as an overall target for DG DEVCO’s entire area of responsibility and as a specific target for the EDFs.
Box 3
KPIs on reducing old pre-financing, unspent commitments and expired contracts
DG DEVCO exceeded its targets in 2019, reducing old pre-financing by 37 % for the EDF (40 % across its entire area of responsibility) and old unspent commitments by 36 % (35 % for its entire area of responsibility). For 2020, it decided to set a new target for these two KPIs, in line with its steadily improving performance.
DG DEVCO also met its overall KPI target of having no more than 15 % of expired contracts still open in the system, achieving just over 15 % for the EDF and 13 % across its entire area of responsibility. The KPI for the EDF has improved on 2018 (17 %) and 2017 (19 %) as a result of new procedures introduced in September 2017.
293

Chapter II – The ECA’s statement of assurance on the EDFs
The ECA’s statement of assurance on the 8th, 9th, 10th and 11th EDFs to the European Parliament and the Council – independent auditor’s report
Opinion
I. We have audited:
(a) the annual accounts of the 8th, 9th, 10th and 11th EDFs, which comprise the balance sheet, the statement of financial performance, the cash flow statement, the statement of changes in net assets and the report on financial implementation for the financial year ended 31 December 2019, approved by the Commission on 16 June 2020;
(b) the legality and regularity of the underlying transactions of which financial management falls to the Commission5.
Reliability of the accounts
Opinion on the reliability of the accounts
II. In our opinion, the annual accounts of the 8th, 9th, 10th and 11th EDFs for the year ended 31 December 2019 present fairly, in all material respects, their financial position as at 31 December 2019, the results of their operations, their cash flows and the changes in their net assets for the year then ended, in accordance with the EDF Financial Regulation and with accounting rules based on internationally accepted accounting standards for the public sector.
5 Pursuant to Articles 43, 48-50 and 58 of the Financial Regulation applicable to the 11th EDF, this statement of assurance does not extend to the EDF resources managed by the EIB.
294

Legality and regularity of the transactions underlying the accounts
Revenue
Opinion on the legality and regularity of revenue
III. In our opinion, the revenue underlying the accounts for the year ended 31 December 2019 is legal and regular in all material respects.
Expenditure
Adverse opinion on the legality and regularity of expenditure
IV. In our opinion, owing to the significance of the matter described under ‘Basis for adverse opinion on the legality and regularity of expenditure’, the expenditure accepted in the accounts for the year ended 31 December 2019 is materially affected by error.
Basis for Opinion
V. We have conducted our audit in accordance with the IFAC International Standards on Auditing (ISAs) and Codes of Ethics and the INTOSAI International Standards of Supreme Audit Institutions (ISSAIs). Our responsibilities under these standards and codes are described in more detail in the ‘Auditor’s responsibilities’ section of our report. We have also met independence requirements and fulfilled our ethical obligations under the International Ethics Standards Board for Accountants Code of Ethics for Professional Accountants. We believe that the audit evidence we have obtained is sufficient and appropriate to provide a basis for our opinion.
Basis for adverse opinion on the legality and regularity of expenditure
VI. The expenditure recorded in 2019 under the 8th, 9th, 10th and 11th EDFs is materially affected by error. Our estimated level of error for expenditure accepted in the accounts is 3,5 %.
Key audit matters
VII. Key audit matters are those matters that, in our professional judgement, were of most significance in our audit of the financial statements of the current period. These matters were addressed in the context of our audit of the financial statements as a whole, and in forming our opinion thereon, but we do not provide a separate opinion on these matters.
295
Accrued charges
VIII. We assessed the accrued charges presented in the accounts (see note 2.8) which are subject to a high degree of estimation. At year-end 2019, the Commission estimated that eligible expenses incurred but not yet reported by beneficiaries amounted to 5 074 million euros (year-end 2018: 5 133 million euros).
IX. We examined the calculation of these accrual estimates and reviewed a sample of 30 individual contracts to address the risk that the accrual was misstated. The work performed led us to conclude that the accrued charges recognised in the final accounts were appropriate.
Potential impact on the 2019 EDF accounts of the United Kingdom’s withdrawal from the European Union
X. On 29 March 2017, the United Kingdom (UK) formally notified the European Council of its intention to leave the EU. On 12 November 2019, the Commission published the withdrawal agreement that sets out the arrangement for the withdrawal of the UK from the European Union. It states that the UK will remain party to the EDF until the closure of the 11th EDF and all previous unclosed EDFs, and will assume the same obligations as the Member States under the internal agreement by which the 11th EDF was set up, as well as the obligations arising from previous EDFs until their closure.
XI. The withdrawal agreement also states that, where the amounts from projects under the 10th EDF or from previous EDFs have not been committed or have been decommitted on the date of entry into force of this agreement, the UK's share of those amounts will not be reused. The same applies to the UK’s share of funds not committed or decommitted under the 11th EDF after 31 December 2020.
XII. Based on this, there is no financial impact to report on the 2019 EDF accounts. We conclude that the EDF accounts as at 31 December 2019 correctly reflect the state of the withdrawal process at that date.
Responsibilities of management
XIII. In accordance with Articles 310 to 325 of the TFEU and with the 11th EDF Financial Regulation, management is responsible for preparing and presenting the EDF annual accounts on the basis of internationally accepted accounting standards for the public sector and for the legality and regularity of the underlying transactions. This responsibility includes designing, implementing and maintaining internal control relevant to the preparation and presentation of financial statements that are free from material misstatement, whether due to fraud or
296

error. The Commission is ultimately responsible for the legality and regularity of the transactions underlying the EDF accounts.
XIV. When preparing the EDF accounts, the Commission is responsible for assessing the EDFs’ ability to continue as a going concern, disclosing any relevant matters and using the going concern basis of accounting unless it either intends to liquidate the entity or to cease operations, or has no realistic alternative but to do so.
XV. The Commission is responsible for overseeing the EDFs’ financial reporting process.
Auditor's responsibilities for the audit of the EDF accounts and underlying transactions
XVI. Our objectives are to obtain reasonable assurance as to whether the EDF accounts are free from material misstatement and the underlying transactions are legal and regular, and to provide, on the basis of our audit, the European Parliament and the Council with a statement of assurance as to the reliability of the accounts and the legality and regularity of the underlying transactions. Reasonable assurance is a high level of assurance, but it is not a guarantee that the audit has necessarily detected all instances of a material misstatement or non-compliance that may exist. These can arise from fraud or error and are considered material if, individually or in the aggregate, they could reasonably be expected to influence any economic decisions taken on the basis of these EDF accounts.
XVII. As part of an audit in accordance with ISAs and ISSAIs, we exercise professional judgement and maintain professional scepticism throughout the audit. We also:
o Identify and assess the risks of material misstatement of the EDF accounts and of material non-compliance of the underlying transactions with the requirements of the EDF legal framework, whether due to fraud or error. We design and perform audit procedures responsive to those risks and obtain audit evidence that is sufficient and appropriate to provide a basis for our opinion. Instances of material misstatement or non-compliance resulting from fraud are more difficult to detect than those resulting from error, as fraud may involve collusion, forgery, intentional omissions, misrepresentations, or the override of internal control. Consequently, there is a greater risk of such instances not being detected.
o Obtain an understanding of internal control relevant to the audit in order to design appropriate audit procedures, but not for the purpose of expressing an opinion on the effectiveness of the internal control.
297

o Evaluate the appropriateness of the accounting policies used by management and the reasonableness of management’s accounting estimates and related disclosures.
o Conclude as to the appropriateness of management’s use of the going concern basis of accounting and, based on the audit evidence obtained, as to whether material uncertainty exists owing to events or conditions that may cast significant doubt on the EDFs’ ability to continue as a going concern. If we conclude that such material uncertainty exists, we are required to draw attention in our report to the related disclosures in the EDF accounts or, if these disclosures are inadequate, to modify our opinion. Our conclusions are based on the audit evidence obtained up to the date of our report. However, future events or conditions may cause the entity to cease to continue as a going concern.
o Evaluate the overall presentation, structure and content of the annual accounts, including all disclosures, and assess whether the annual accounts fairly represent the underlying transactions and events.
XVIII. We communicate with management regarding, among other matters, the planned scope and timing of the audit and significant audit findings, including findings of any significant deficiencies in internal control.
XIX. For revenue, we examine all contributions from Member States and a sample of other types of revenue transactions.
XX. For expenditure, we examine payment transactions once expenditure has been incurred, recorded and accepted. This examination covers all categories of payments (other than advances) at the point they are made. Advance payments are examined once the recipient of funds has provided evidence of their proper use and the institution or body has accepted that evidence by clearing the advance payment, which might not happen until a subsequent year.
XXI. Of the matters discussed with the Commission, we determine which were of most significance in the audit of the EDF accounts and are therefore the key audit matters for the current period. We describe these matters in our report unless law or regulation precludes public disclosure or, as happens extremely rarely, we determine that a matter should not be communicated in our report because the adverse consequences of doing so would reasonably be expected to outweigh any public interest benefits.
298

20 July 2020
Klaus-Heiner LEHNE President
European Court of Auditors
12, rue Alcide De Gasperi – L-1615 Luxembourg
Information in support of the statement of assurance
Audit scope and approach
10 Annex 1.1 to the ECA’s 2019 annual report on the implementation of the budget sets out our audit approach and methods, which also apply to the audit of the EDF.
11 Our observations on the reliability of the EDF accounts are based on the financial statements6 of the 8th, 9th, 10th and 11th EDFs, approved by the Commission7, together with the accounting officer’s letter of representation received on 26 June 2020. We tested amounts and disclosures, and assessed the accounting principles used, as well as any significant estimates made by the Commission and the overall presentation of the accounts.
6 See Article 39 of Regulation (EU) 2018/1877.
7 In compliance with the EDF Financial Regulation; see Article 38 of Regulation (EU) 2018/1877.
299

12 To audit the regularity of transactions, we examined a sample of 126 transactions representative of the full range of spending within the EDF. This comprised 17 transactions related to the Bêkou Trust Fund and the Emergency Trust Fund for Africa, 89 transactions authorised by 19 EU delegations8 and 20 payments approved by Commission headquarters9. Since part of our audited population was covered by DG DEVCO’s 2019 residual error rate (RER) study10, we included 14 further transactions in our sample, to which we applied, after adjustment, the results11 of this study. Hence, the total sample size was 140 transactions, in accordance with our assurance model. Where we detected errors in the transactions, we analysed the relevant systems to identify weaknesses.
8 Barbados, Botswana, Burkina Faso, Burundi, Chad, Côte d'Ivoire, Congo (Brazzaville), Congo
(Kinshasa), Dominican Republic, Ethiopia, Guinea, Haiti, , Mauritania, Mozambique, Nigeria, Rwanda, Sierra Leone, Tanzania and Togo.
9 DG DEVCO: 124 payments; ECHO: 2 payments for humanitarian aid.
10 DG DEVCO contracts an RER study annually to estimate the level of error which has evaded all management checks to prevent, detect and correct errors across its entire area of responsibility. The RER study does not constitute an assurance engagement or an audit; it is based on the RER methodology and manual provided by DG DEVCO.
11 Our reviews of RER studies have shown that, compared with our audit work, the underlying methodology involves far fewer on-the-spot checks and allows less scope for examining procurement procedures. Therefore, as we did last year, we adjusted the results of the RER study to reflect the degree of non-compliance with public procurement rules. We based this adjustment on our 2014-2018 SoA findings for the EDFs and our testing of transactions selected from previous years’ RER studies (see paragraph 25 and Box 6).
300

Picture 1 – Audit visit to inspect a bridge construction in Sierra Leone
Source: ECA.
13 We also examined the following for 2019:
(a) all Member State contributions and a sample of other types of revenue transactions, such as other countries’ co-financing contributions;
(b) certain systems used by DG DEVCO and the EU delegations, covering: (i) ex ante checks by Commission staff, external auditors (contracted by the Commission or the beneficiaries) or supervisors before payments were made, (ii) monitoring and supervision, notably the follow-up of external audits and the RER study mentioned above;
(c) the reliability of the regularity information in the annual activity report (AAR) of DG DEVCO, the consistency of the methodology for estimating amounts at risk, future corrections and recoveries, and their inclusion in the Commission’s Annual Management and Performance Report (AMPR);
(d) the follow-up of our previous recommendations.
301

14 As stated in paragraph 04, DG DEVCO implements most of the external aid instruments financed from both the EU general budget and the EDFs. Our observations on systems, the reliability of the AAR and the Director-General’s declaration for 2019 refer to DG DEVCO’s entire area of responsibility.
Reliability of accounts
15 Our audit found that the accounts were not affected by material misstatements.
Regularity of transactions Revenue
16 Revenue transactions did not contain a material level of error.
Expenditure
17 Annex I provides an overview of the results of transaction testing. Of the 126 transactions examined, 37 (29 %) contained errors. On the basis of the 28 errors we have quantified and the adjusted results of the 2019 RER study (see paragraph 12), we estimate the level of error to be 3,5 %12. Box 4 gives a breakdown of our estimated level of error for 2019 by error type.
12 We base our calculation of error on a representative sample. The figure quoted is the best
estimate. We have 95 % confidence that the estimated level of error in the population lies between 2,1 % and 4,9 % (the lower and upper error limits respectively).
302

Box 4
Breakdown of estimated level of error by error type
Source: ECA.
18 Box 5 presents examples of quantifiable errors, likewise by error type.
Box 5
Examples of quantifiable errors
(a) Expenditure not incurred: commitments presented as expenditure
The Commission concluded a delegation agreement with an international organisation (IO) concerning a regional private-sector development project in the Caribbean. The total contract value was 27,2 million euros, with an EU contribution of 23,9 million euros. While examining the expenditure breakdown accompanying the financial report, we noticed that the reported amounts did not correspond to the underlying accounting for all budget lines. The costs reported were 2,3 million euros higher than the costs actually incurred for the period. Most of this difference resulted from the beneficiary having presented amounts committed for future spending as expenditure already incurred, while the rest stemmed from various adjustments.
5,9 %
6,1 %
9,6 %
12,7 %
22,1 %
43,6 %
0 % 10 % 20 % 30 % 40 % 50 %
Absence of essential supporting documents
Expenditure outside the implementation period
RER adapted from DG DEVCO study
Ineligible expenditure
Serious failure to respect public procurementrules
Expenditure not incurred
303

(b) Expenditure not incurred: claimed expenditure calculated incorrectly
The Commission endorsed a works contract with a private company for the reinforcement and extension of an electricity network in Ivory Coast. The total contract value was 5,4 million euros, covered entirely by the EU contribution. Interim payments under the contract were based on actual measurements reported by the contractor and verified by the contract supervisor. We took our own actual measurements on the spot for one individual item: the digging of trenches, for a total reported amount of 28 361 euros. Our actual measurements showed that the amount declared for this item had been overstated by 14 780 euros (52 %). This was due to a clerical error in reporting. The supervisor noticed the error in September 2019, but it was not corrected at the time it was identified.
(c) Serious failure to respect public procurement rules: unjustified decision by the evaluation committee
The Commission concluded a grant agreement with a non-governmental organisation (NGO) to implement a sanitation project in the Democratic Republic of Congo. The total contract value was 12,2 million euros; the maximum EU contribution was set at 11,7 million euros. We examined payments for the construction of a local health centre, with a total contract value of 124 758 euros for the lot in question. The NGO issued a public tender and evaluated the bids received against technical and financial criteria. The winning bid was not the one with the highest score which satisfied all the selection criteria specified in the contract notice, but rather the one with the third highest score. Although the tools existed to adjust procurement procedures to the situation on the ground in the partner country, the NGO had opted for a normal procedure. The evaluation committee had applied an additional criterion not specified in the contract notice, of which the tenderers therefore could not have been aware.
(d) Other error type: abnormally high salary costs
The Commission concluded a grant agreement with a local authority to develop a conservation area in Tanzania. The total contract value was 2,3 million euros, with an EU contribution of 1,8 million euros. We examined local staff salaries charged to the project and noticed that they were significantly higher than they had been before EU funding had started. Only part of these ineligible costs had been detected by the Commission’s internal control systems and corrected before our audit.
304
19 As part of the 2019 statement of assurance exercise, we planned an audit visit to Burundi. Our auditors applied for visas from the Embassy of Burundi in Brussels six weeks before the planned departure (visas normally take three weeks to issue). Despite several attempts to contact the Embassy, we had not received the visas by the departure date. This had a negative impact on the planning and execution of our audit work. For example, we were unable to visit projects on the spot to assess the reality on the ground and had to limit our audit work entirely on a desk review. Countries benefiting from EU funding are subject to certain obligations, which include allowing documentary and on-the-spot checks. The Treaty on the Functioning of the European Union13 establishes the ECA’s right to audit projects in the countries where they are implemented, and contracts for individual projects provide further detail on this right. The Commission’s full support is indispensable in enabling us to conduct our audits.
20 As in previous years, the Commission and its implementing partners committed more errors in transactions relating to programme estimates, grants, contribution agreements with IOs and delegation agreements with EU Member States’ cooperation agencies than they did with other forms of support (such as those covering works, supply and service contracts). Of the 65 transactions of this type that we examined, 25 (38 %) contained quantifiable errors, which accounted for 71,7 % of the estimated level of error.
21 In nine cases of quantifiable error and six cases of non-quantifiable error, the Commission had sufficient information to prevent, or to detect and correct, the error before accepting the expenditure. Had the Commission made proper use of all the information at its disposal, the estimated level of error would have been 1,4 percentage points lower. We found four other transactions with errors which external auditors and supervisors should have detected. These cases contributed 0,4 percentage points to the estimated level of error.
13 Article 287 of the Treaty on the Functioning of the European Union: ‘The audit shall be
based on records and, if necessary, performed on the spot in the other institutions of the Union, on the premises of any body, office or agency which manages revenue or expenditure on behalf of the Union and in the Member States, including on the premises of any natural or legal person in receipt of payments from the budget’.
305

22 In addition, five transactions containing a quantifiable error14 were subjected to an audit or expenditure verification. The information provided in the audit/verification reports on the actual work done did not allow us to assess whether the errors could have been detected and corrected during these ex ante checks15.
23 DG DEVCO’s control system is based on ex ante checks16. As in previous years, the frequency of the errors found – including some contained in final claims which had been subjected to ex ante external audits and expenditure verifications – points to weaknesses in these checks.
24 In two areas, the transactions examined contained no errors. These were budget support (seven audited transactions), and transactions where the ‘notional approach’ had been applied in multi-donor projects implemented by IOs (13 audited transactions). Paragraphs 8.7-8.10 in Chapter 8 of the ECA’s 2019 annual report on the implementation of the budget give more details on the nature of these areas.
25 In our 2017 and 2018 annual reports, we reported on limitations in DG DEVCO’s RER study methodology (see also paragraphs 30-35). As a result, for our 2018 and 2019 statements of assurance, we performed additional checks in areas where we had found such limitations. The purpose of this additional work was to assess the impact of the limitations and to adjust the RER study results for 14 further transactions in our sample (see paragraph 12 and footnote 10). We randomly selected 28 transactions from previous RER studies – an average of two transactions per EU delegation visited. Box 6 presents an example of the results of this work.
14 Contributing 0,67 percentage points to the estimated level of error.
15 The reports do not cover 100 % of the reported expenditure; nor do they give sufficient detail to confirm whether the items where we identified errors had been part of their sample.
16 The overall control system consists of ex ante and ex post checks. Ex ante checks assess the eligibility of the expenditure prior to contracting and prior to accepting the expenditure, whereas ex post checks take place after expenditure has been accepted. For example, an external audit can be done either ex ante (before accepting a payment) or ex post (after a project has been completed). Both types can result in the recovery of funds paid to the beneficiary; in the case of ex ante checks, such recoveries concern pre-financing previously paid.
306

Box 6
Example of error identified in RER transactions
Inadequate checks on award procedures
As part of the 2017 RER study, the contractor performed checks on a grant contract implemented in Jamaica, reporting no error in the transaction. However, the contractor did not review the contract award procedure and therefore did not detect that essential documents related to the procedure (such as evaluation reports) were missing, having been destroyed.
Annual activity report and other governance arrangements
26 In every AAR between 2012 and 2018, DG DEVCO issued reservations on the regularity of underlying transactions. The 2019 AAR is the first where it has not issued any reservations. Nevertheless, DG DEVCO has adopted an action plan to address weaknesses in the implementation of its control system.
27 Last year, we reported on the satisfactory progress achieved on the 2017 action plan; out of 14 actions, nine had been completed, one partially implemented and four were ongoing.
28 In its 2018 action plan, DG DEVCO continued to address the high-risk areas previously identified, such as grants under direct management or funds under indirect management via IOs, and started implementing two new measures targeting simplified cost options and the results-based financing introduced by the new Financial Regulation. By April 2020, out of 13 actions, six had been completed, four partially implemented, two were ongoing, and one action had not been implemented but instead merged with another action.
29 In its 2019 action plan, DG DEVCO reduced the number of actions to nine. One new action was added, aimed at improving the methodology and manual used for DG DEVCO’s RER study. The other eight were carried over from previous years: two were recurring, and the remaining six were postponed and new target dates set. Some of these actions have evolved significantly over the years and become more complex. For example, the action to simplify contractual conditions for grants has grown to encompass the development of a new corporate template for grants, to be used across several directorates-general while also reflecting the specific needs of DG DEVCO. The
307

action also encompasses the introduction of an e-platform for managing grants in the new IT system currently being developed for external actions.
2019 RER study
30 In 2019, DG DEVCO had its eighth RER study carried out by an external contractor, to estimate the level of error remaining after the completion of all management checks to prevent, detect and correct errors across its entire area of responsibility. For the 2019 RER study, DG DEVCO increased the sample size from 240 to 480 transactions. This enabled it to present separate error rates for expenditure financed from the EU general budget and for spending financed by the EDF, in addition to the overall error rate for both combined. For the fourth year in a row, the study estimated the overall RER to be below the 2 % materiality threshold set by the Commission17.
31 The RER study does not constitute an assurance engagement or an audit; it is based on the RER methodology and manual provided by DG DEVCO. As in previous years, we have identified limitations that contributed to the underestimation of the residual error rate. The previous three years’ studies also had weaknesses and reported an RER below materiality.
32 Four major factors distort the RER. The first is limitations in checks on public procurement procedures, which may have a significant effect on the error rate. The RER study did not sufficiently cover certain aspects of the procurement procedures, such as the reasons for rejecting unsuccessful candidates or the winning tenderer’s compliance with all selection and award criteria; nor did it check the call for proposals procedures or direct award justifications.
33 The second factor is the very low number of on-the-spot checks in the country of project implementation. In the 2019 study, only 15 of the 35718 transactions tested were subject to such checks. This is not sufficient to detect errors that are not apparent in the documents, such as example (b) in Box 5.
17 2016: 1,7 %; 2017: 1,18 %, 2018: 0,85 % and 2019: 1,13 %.
18 Paragraph 30 refers to 480 transactions. However, some of the sampled transactions have a value higher than the sampling interval; therefore, the final sample size was 357.
308

34 The third factor is DG DEVCO’s RER estimation method. Firstly, it gives the contractor broad discretion in deciding whether there are sufficient logistical and legal reasons that prevent timely access to the documents for a transaction and therefore making an estimation of the error rate. Secondly, the Commission this year changed the way it estimates the error rate in such cases, adding a 5 % premium to the residual error rate for the EDF. However, it is not clear how the Commission arrived at the 5 % risk premium. Consequently, this method does not necessarily reflect the actual residual error for the transaction in question.
35 Lastly, the share of transactions for which the RER relies fully or partially on previous control work is 20 % for full reliance and 38 % for partial reliance. For these transactions, the contractor performs limited or no substantive testing, and instead relies on previous work done as part of DG DEVCO’s control framework. Overreliance on previous control work is contrary to the purpose of the RER study, which is to identify the errors that have evaded precisely these controls.
Review of the 2019 annual activity report
36 The Director-General’s declaration of assurance in the 2019 AAR does not include any reservations, as the two reservations remaining in 2018 have been lifted and no new ones have been issued. Before lifting these reservations in 2019, DG DEVCO had significantly reduced their scope (i.e. the share of expenditure covered by them) in 2017 and 201819. Box 7 shows the scope of reservations presented in the AARs each year from 2010 to 2019.
19 In its 2016 AAR, DG DEVCO issued reservations concerning grants (under both direct and
indirect management); indirect management via IOs and development agencies; and programme estimates in general and for the African Peace Facility in particular. By 2018, the reservations covered only grants under direct management (for funds managed by DG NEAR on behalf of DG DEVCO) and programmes managed by the African Union Commission involving a significant level of procurement.
309
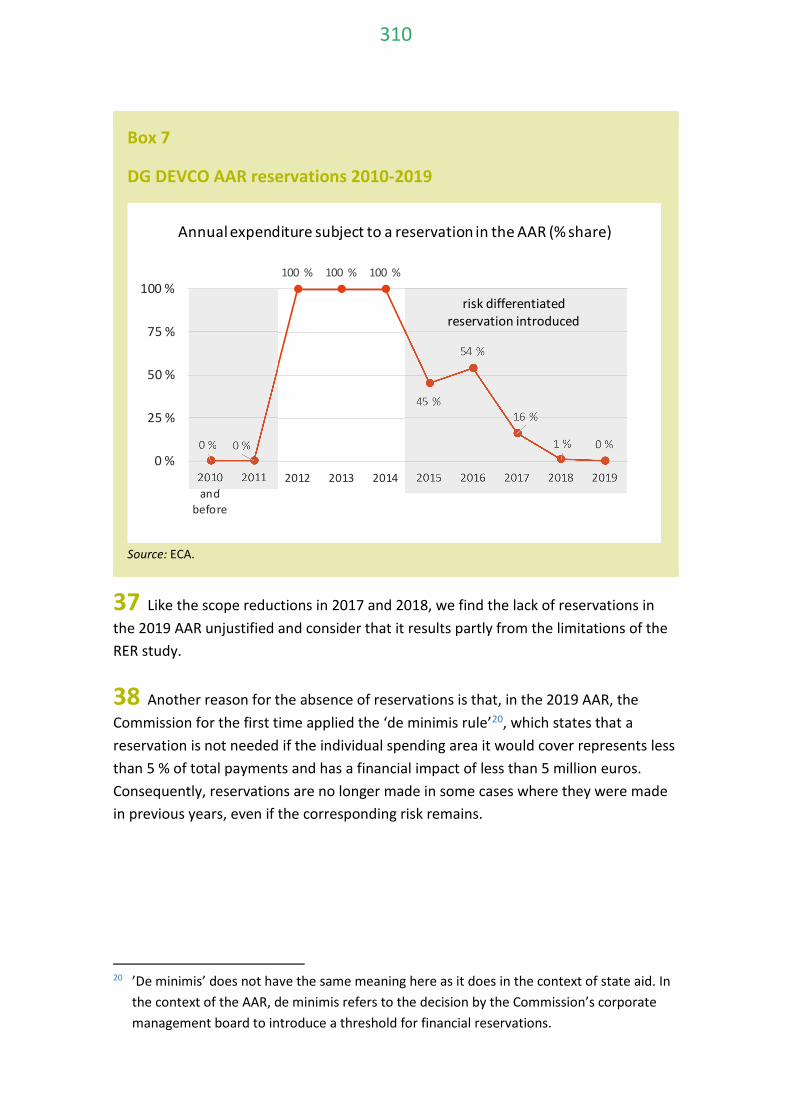
Box 7
DG DEVCO AAR reservations 2010-2019
Source: ECA.
37 Like the scope reductions in 2017 and 2018, we find the lack of reservations in the 2019 AAR unjustified and consider that it results partly from the limitations of the RER study.
38 Another reason for the absence of reservations is that, in the 2019 AAR, the Commission for the first time applied the ‘de minimis rule’20, which states that a reservation is not needed if the individual spending area it would cover represents less than 5 % of total payments and has a financial impact of less than 5 million euros. Consequently, reservations are no longer made in some cases where they were made in previous years, even if the corresponding risk remains.
20 ’De minimis’ does not have the same meaning here as it does in the context of state aid. In
the context of the AAR, de minimis refers to the decision by the Commission’s corporate management board to introduce a threshold for financial reservations.
0 % 0 %
100 % 100 % 100 %
45 %
54 %
16 %
1 % 0 %0 %
25 %
50 %
75 %
100 %
2010and
before
2011 2012 2013 2014 2015 2016 2017 2018 2019
Annual expenditure subject to a reservation in the AAR (% share)
risk differentiated reservation introduced
310
39 This is the case, for example, in the area of grants under indirect management. Grants, together with projects implemented by IOs and Member State agencies, account for most of the errors reported by the RER study, which is in line also with our observation that this is a higher-risk area (see paragraph 20). Moreover, DG DEVCO’s own risk assessment found the risk in grants under indirect management to be material. However, due to the introduction of the de minimis rule, DG DEVCO did not issue any reservations. This lack of reservations does not give a true and fair view of the risks in DG DEVCO’s overall area of responsibility.
40 Our observations on the RER study also affect the estimates of the amounts at risk, since these estimates are based on the study. DG DEVCO estimates the overall amount at risk at closure to be 56,4 million euros21 and the overall amount at risk at payment to be 69,9 million euros22 (1 % of 2019 expenditure). Of this amount, it estimates that 13,5 million euros (19 %) will be corrected by its checks in subsequent years23.
41 DG DEVCO is systematically working to improve the quality of its data for calculating corrective capacity. In 2019, it continued its training and awareness-raising activities on recoveries and accounting data quality. As in previous years, DG DEVCO performed targeted checks on recovery orders and subsequently issued several specific instructions to the EU delegations to correct the discrepancies identified. As far as the calculation of corrective capacity for 2019 is concerned, having tested 40 % of the total population, we identified one error in our sample, representing 0,25 % of the corrective capacity.
21 See DG DEVCO’s 2019 AAR, p. 40.
22 This is the best conservative estimation of the amount of relevant expenditure during the year but not compliant with the contractual and regulatory provisions applicable at the time payment was made.
23 See DG DEVCO’s 2019 AAR, p. 40.
311

Conclusion and recommendations
Conclusion
42 The overall audit evidence indicates that the EDFs’ accounts for the financial year ending 31 December 2019 present fairly, in all material respects, their financial position, the results of their operations, their cash flows and the changes in net assets for the year then ended, in accordance with the provisions of the Financial Regulation and the accounting rules adopted by the accounting officer.
43 The overall audit evidence indicates that, for the financial year ending 31 December 2019:
(a) the revenue of the EDFs was not affected by a material level of error;
(b) EDF payment transactions were affected by a material level of error (see paragraphs 17-24). We estimate the level of error to be 3,5 % based on our transaction testing, including the imported adjusted RER results (see Annex I).
Recommendations
44 Annex III shows the findings of our follow-up review of the five recommendations we made in our 2016 annual report24, of which DG DEVCO had implemented25 all five recommendations in full.
45 Based on this review and our findings and conclusions for 2019, we recommend that the Commission:
24 We chose our 2016 report for this year’s follow-up exercise as, typically, enough time
should have elapsed for the Commission to have implemented our recommendations.
25 The aim of this follow-up was to verify whether corrective measures had been introduced in response to our recommendations, and not to assess the effectiveness of their implementation.
312

Recommendation 1
Further improve the methodology and manual used for the RER study to address the issues we have identified in this report, in order to make the error rate reported in the study more reliable (see paragraphs 30-35).
Timeframe: by the end of 2021
Recommendation 2
Issue reservations for all areas found to have a high level of risk, regardless of their share of total expenditure and their financial impact (see paragraphs 38-39).
Timeframe: by the time the 2020 AAR is published
313

Chapter III – Performance 46 Our audit allowed us to not only examine the regularity of transactions but also to make observations on performance aspects of the selected transactions. We performed checks, based on a set of audit questions, on projects that were either completed or close to completion, and made individual observations on projects where relevant to our overall audit.
47 Our on-the-spot visits revealed cases where funding had been used effectively and contributed to the achievement of project objectives. By contrast, we also noted cases where the efficiency and effectiveness of the action had been compromised, as the procured goods, services or works were not being used as planned, or project sustainability had not been ensured. Box 8 presents examples.
Box 8
Examples of performance observations
(a) Project operating successfully
The Commission signed a delegation agreement to build a waste management centre in Togo. Work started in January 2018 and, by the time of our on-the-spot visit in September 2019, construction was progressing as planned. Our visit to the centre, and meetings with representatives of the organisation responsible for running it and with other stakeholders, confirmed that the centre was operational and fulfilling its intended function, particularly in terms of environmental impact. The project was therefore successfully helping to improve the living conditions of over half of the local population of one million people.
(b) Project sustainability not ensured
The Commission signed a contribution agreement with an IO for a project to support vocational education in Ivory Coast. Our audit found that the project’s sustainability had not been ensured. Since 2012, the operating budget provided to vocational schools by the government had decreased by 52 %, while the student population had increased by 130 % in that time. This public funding was insufficient for schools to maintain their buildings and equipment and buy consumable supplies.
314

(c) Beneficiaries’ internal practices inadequate
The Commission signed a delegation agreement with four IOs from the same family to implement a development project in Kenya. While auditing salary items, we noticed staff members who, according to their contracts, were working on multiple projects, but whose salaries were allocated entirely to the project being audited. There were no documents assigning these staff members to the project full-time, nor a time recording system to verify the actual time they had worked on each assignment. The IOs sent us an email confirming that these people had worked only on this project during the months covered by our audit, but could not provide any other evidence of their full-time allocation. The beneficiaries’ practices were therefore inadequate to ensure a proper audit trail.
315

Annexes
Annex I — Results of transaction testing for the EDF 2019 2018
SIZE AND STRUCTURE OF THE SAMPLE
Total transactions: 140 139
ESTIMATED IMPACT OF QUANTIFIABLE ERRORS
Estimated level of error 3,5 % 5,2 %
Upper Error Limit (UEL) 4,9 %
Lower Error Limit (LEL) 2,1 %
316

Annex II — EDF payments in 2019 by main region
Source: Map background © OpenStreetMap contributors licensed under the Creative Commons Attribution-ShareAlike 2.0 license (CC BY-SA).
European Development Fund Payments - Africa
Beneficiary CountriesTop 10 (million euros)
1. Nigeria 1192. Mali 1033. Burkina Faso 944. Ethiopia 915. Congo (Brazzaville) 916. Niger 917. Malawi 878. Tanzania 719. Uganda 64
10. Rwanda 60
317

Source: Map background © OpenStreetMap contributors licensed under the Creative Commons Attribution-ShareAlike 2.0 license (CC BY-SA).
Source: Map background © OpenStreetMap contributors licensed under the Creative Commons Attribution-ShareAlike 2.0 license (CC BY-SA).
European Development Fund Payments - Caribbean and Pacific
Beneficiary CountriesTop 5 (million euros)
1. Haiti 352. Dominican Republic 193. Jamaica 104. Dominica 95. Curaçao 7
Beneficiary CountriesTop 5 (million euros)
1. Papua New Guinea 142. New Caledonia 133. French Polynesia 114. Timor-Leste 75. Solomon Islands 4
318

Annex III — Follow-up of previous recommendations for the European Development Funds
Year ECA recommendation
ECA's analysis of the progress made
Fully implemented
Being implemented Not
implemented Not
applicable Insufficient
evidence In most respects
In some respects
2016
We recommend that the Commission: Recommendation 1: strengthen the monitoring of old open expired EDF contracts in order to further reduce their number.
x
Recommendation 2: complete the revision of the terms of reference for all its audits and expenditure verifications by the end of 2017.
x
Recommendation 3: extend the actions in its 2017 action plan to also cover grants and programme estimates under indirect management in the AAR reservation.
x
Recommendation 4: consider reducing the extent of the RER substantive testing of individual low-risk budget support transactions and reallocating the saved resources to increase the substantive testing of project-related transactions.
x
Recommendation 5: further improve the calculation of the 2017 corrective capacity by addressing the shortcomings identified in this annual report.
x
319

European Commission’s replies to the annual report on the activities funded
by the 8th, 9th, 10th and 11th European Development Funds for the
2019 financial year
320

EN EN
FINAL REPLIES OF THE COMMISSION TO THE EUROPEAN COURT OF AUDITORS' 2019 ANNUAL REPORT
"ANNUAL REPORT ON THE ACTIVITIES FUNDED BY THE 8th, 9th, 10th AND 11th EUROPEAN DEVELOPMENT FUNDS”
CHAPTER II – THE ECA’S STATEMENT OF ASSURANCE ON THE EDFS
REGULARITY OF TRANSACTIONS
Expenditure
17. The Commission notes that the biggest part of the errors relates to expenditure not incurred. As shown in the past, most of this expenditure might be incurred at a later stage and subject to thorough controls, meaning these errors are likely to be corrected then. Box 1 -Examples of quantifiable errors
c) While the Commission agrees that the award of the contract was not compliant with the contract notice, it considers that the tendering process was carried out based on the needs of the project, in view of economic and security considerations in an area in the Democratic Republic of Congo affected by armed conflicts and Ebola outbreaks. 19. The Commission clarifies that regarding the provision of access, for the ECA, to the Country and to the sites and premises at which EU-funded operations are carried out, Burundi is bound by obligations contained in the relevant Financing Agreements as well as in the Cotonou Agreement. The Commission’s Pay Master Office (PMO), which is the competent Commission service for the travel visas, has taken all required measures for a timely delivery of the visas. However, the Commission’s attempts were unsuccessful, mainly due to the very difficult political situation. Indeed, based on a Council Decision, consultations between the EU and Burundi under article 96 of the Cotonou Agreement have been closed.
ANNUAL ACTIVITY REPORT AND OTHER GOVERNANCE ARRANGEMENTS
2019 RER study
31. The RER study is one of several instruments in the assurance-building process. The limitations noted by the ECA are well-known to the Commission and are taken into account by the Commission when assessing the strength and weaknesses of its management system. All of these elements taken together ensure that the DG DEVCO Annual Activity Report presents the management information in a true and fair view.
32. As regards the RER study, the procurement testing schedules are well established and include specific tests relating to rejection of applicants, compliance with selection and award criteria and, where relevant, the direct award of contracts to contractors.
33. At the time of developing the RER methodology in 2010, the number of fieldwork visits (nine) was decided after a consideration of the cost/benefit advantages of a fully ‘on-site’ approach, as well as a fully remote approach. For the 2019 RER study, fieldwork visits encompassed the examination of more than one transaction for reasons of efficiency and economy and over 25 transactions were examined on site. This exceeded the number required in the methodology (9).
321

EN EN
34. The Commission would like to clarify that only 3 out of 357 transactions were subject to estimation.
In reaction to past comments on the wide margin of discretion of an auditor to ‘estimate’ a transaction, DEVCO introduced in its methodology for 2019 the risk premium approach as a means of providing an objective basis to estimate errors. The approach consists in a 5% premium added to the average error rate for EDF or Budget.
The RER instruction manual includes detailed and limited ways in which the contractor should act if there is a specific legal or logistical reason that documentation cannot be examined.
35. The RER methodology and manual include the examination and reliance on previous control work as an element of the study. Indeed there are practical advantages that flow from achieving a suitable balance between cost and benefit when designing and refining the RER methodology. The methodology explains the rationale behind the approach to reliance, which has cost/benefit considerations at its heart.
The RER contractor fully examined any response to these controls, such as the alterations to payments and recoveries for arithmetical and legal accuracy. It also examined the Commission’s procurement procedures.
There are several examples of full reliance transactions with RER errors reported.
Review of the 2019 annual activity report
36. The methodology to determine whether reservations due to error rates should be issued did not change between the AAR 2017 and the AAR 2019. The fact that less spending areas were subject to reservations in the AAR 2018 and the absence of reservations in the 2019 AAR do not represent scope reductions, but are the results of the rigorous application of this methodology.
37. The RER study is one of several instruments in the assurance-building process. The limitations noted by the ECA are well-known to the Commission and are taken into account by the Commission when assessing the strength and weaknesses of its management system. All of these elements taken together ensure that the DG DEVCO Annual Activity Report presents the management information in a true and fair view.
38. A de minimis rule for issuing reservations in the Directors-General Annual Activity Reports (AARs) has been introduced. Its purpose is to focus the number of reservations on the significant ones only, while maintaining the transparency in management reporting.
Reservations related to cases with a residual error rate above the 2% materiality threshold are deemed not substantial for segments that represent less than 5% of the department’s total payments and have a financial impact of less than EUR 5 million. Therefore, quantified reservations which do not exceed both thresholds are not needed. This applies especially but not exclusively to the legacy programmes.
Nevertheless, full transparency of the management reporting remains ensured (as the cases for which the rule has been applied are duly mentioned in the AAR), and even this significant reduction in the number of reservations from 2018 to 2019 only has a very limited financial impact. Indeed, as this mostly concerned legacy programmes, which are being phased out, the total financial impact of
322
EN EN
the 17 reservations lifted by applying this rule would have been EUR 15.2 million, or 1.4%, of the total financial impact of all 2019 reservations.
39. The absence of reservations for DG DEVCO is the result of a thorough review of all aspects of assurance, while implementing all guidelines and instructions of the Commission’s central Services.
The cases for which the de minimis rule has been applied are duly disclosed in the AAR, and they are being closely followed up, as any other weaknesses.
CONCLUSION AND RECOMMENDATIONS
Recommendation 1
The Commission accepts recommendation 1.
The Commission will look into possibilities of improving the methodology taking expected costs and benefits fully into account and without altering the nature of the RER study.
Recommendation 2
The Commission does not accept recommendation 2.
Since the 2019 financial year, a de minimis rule for issuing reservations in the Directors-General Annual Activity Reports (AARs) has been introduced. Its purpose is to focus the number of reservations on the significant ones only, while maintaining the transparency in management reporting.
Nevertheless, full transparency of the management reporting remains ensured (as the cases for which the rule has been applied are duly mentioned in the AAR). See also Commission reply to paragraph 38.
CHAPTER III – PERFORMANCE
Box 8 - Examples of performance observations
Project sustainability not ensured
This issue has been raised during the last two political dialogues.
323

COPYRIGHT
© European Union, 2020.
The reuse policy of the European Court of Auditors (ECA) is implemented by Decision of the European Court of Auditors No 6-2019 on the open data policy and the reuse of documents.
Unless otherwise indicated (e.g. in individual copyright notices), the ECA’s content owned by the EU is licensed under the Creative Commons Attribution 4.0 International (CC BY 4.0) licence. This means that reuse is allowed, provided appropriate credit is given and changes are indicated. The reuser must not distort the original meaning or message of the documents. The ECA shall not be liable for any consequences of reuse.
You are required to clear additional rights if a specific content depicts identifiable private individuals, e.g. pictures of the ECA’s staff, or includes third-party works. Where permission is obtained, such permission shall cancel the above-mentioned general permission and shall clearly indicate any restrictions on use.
To use or reproduce content that is not owned by the EU, you may need to seek permission directly from the copyright holders.
Chapter 5 – Annex 5.2, Chapter 8 – Annex 8.1, EDF – Annex II:
Map background © OpenStreetMap contributors licensed under the Creative Commons Attribution-ShareAlike 2.0 license (CC BY-SA).
Chapter 6 – Box 6.3:
Icons made by Pixel perfect from https://flaticon.com.
Software or documents covered by industrial property rights, such as patents, trade marks, registered designs, logos and names, are excluded from the ECA’s reuse policy and are not licensed to you.
The European Union’s family of institutional websites, within the europa.eu domain, provides links to third-party sites. Since the ECA does not control them, you are encouraged to review their privacy and copyright policies.
Use of European Court of Auditors’ logo
The European Court of Auditors’ logo must not be used without the European Court of Auditors’ prior consent.
324
ISBN 978-92-847-4893-8
QJ-A
L-20-001-EN-N
The European Court of Auditors audited the revenue and expenditure of the EU budget and provides its opinion on the extent to which the annual accounts are reliable and income and spending transactions comply with the applicable rules and regulations.