Embed Size (px)
Citation preview

2019 Annual Report


FELLOW SHAREHOLDERS:
In reflecting on the performance of our Company and the extraordinary challenges during the coronavirus(COVID-19) crisis, we are overcome with a strong sense of pride and gratitude. We feel pride in the vital role ourCompany plays in the global economy, in our continued successes in accomplishing our goals, and in how wehave gone about these achievements. Moreover, we are grateful for the consistent extraordinary efforts of theentire Silgan team to rise to, and overcome, any challenge. Together, we are Silgan Strong.
Our products help feed, hydrate and protect people all over the world, and do so in an environmentallysustainable manner. Our metal food cans protect product freshness from the peak of harvest, providing shelf-stable nutrition for extended periods and eliminating food waste in excess of 30% for products not similarlyprotected. As a result, more people can be fed while utilizing less resources and reducing the high carbonemissions of agriculture. When the food can is done doing this job, it is then recycled more than any otherpackage on the planet. Where we produce plastic packaging, it is generally for specific applications that webelieve cannot practically be done with other materials, and even then we are endeavoring to make these fullyrecyclable and to utilize recycled content. Silgan was one of the first manufacturers to use post-consumer resinsin personal care packaging and is fully committed to continuing this legacy. Finally, we have always worked toreduce our energy consumption and carbon emissions, and yet we continue to see and pursue new ways tofurther lighten our footprint. For these reasons, we are proud of the benefits of our advantaged packagingsolutions and our continued progress to further enhance and improve them.
We have also delivered for our shareholders, with an approximately 12% compounded increase in sharevalue through the end of 2019 as compared with our IPO price 23 years ago and an increase in revenues for 2019of more than 5% on a compounded basis from that first year as a public company. 2019 was no exception, withanother year of record revenues and adjusted earnings per share and continued strong free cash generation.Much of the value we have created for shareholders over time has been realized by deploying this cash towardstargeted acquisitions. Accordingly, we were pleased to announce earlier this year the acquisition of CobraPlastics and the agreement to acquire the dispensing business of Albea Group. We believe these acquisitions willbe excellent extensions to our growing dispensing systems operations and expect they will join in a long line ofsuccessful acquisitions integrated by the Company. We welcome the employees of both businesses and lookforward to our shared future successes.
From our inception, we have focused on meeting the unique needs of our customers and markets in order tosupport continued growth for our businesses. While the ultimate goal of this strategy is the long-termrelationships we enjoy with our customers, the best interim measurement of progress is the Net Promotor Scoresachieved in periodic customer satisfaction surveys. Each of our businesses has delivered steadily improvingscores since we began these detailed surveys, and most are now at levels that are independently rated as world-class. We will continue to invest capital, resources and time to enhance this customer centric approach andexpect our businesses will continue to be rewarded accordingly.
These achievements could only be accomplished through the dedicated efforts and focus of the entire13,000 Silgan team members worldwide. Each year we make this point, but it has never been so clearlyevidenced as during this recent coronavirus (COVID-19) crisis. Knowing the importance of our products to adesperate world, our employees have overcome their personal worries and continue to show up and diligentlydeliver their best every day. For this and their many accomplishments, we are humbled and blessed to be part oftheir team.
Anthony J. Allott Adam J. GreenleeChairman of the Board and CEO President and COO

OUR MISSION STATEMENT
The primary mission of our business is to compete and win in the markets served. We should be the best at whatwe do.
In support of that mission, we believe these principles are vital:
• We must respond to the needs of the marketplace with quality products and services, while seekingadvantage versus our competition.
• We will promote and reward excellence in the performance of our people because we believe this is theprimary way to achieve competitive advantage.
• Where we have or believe we can develop competitive advantage, we will seek growth. Where we don’t havecompetitive advantage, we will refocus, restructure or withdraw.
• Finally, as this mission is pursued, we will hold ourselves to the highest standards of ethical behavior in ourinternal and external relationships, engendering employee pride in the conduct as well as the achievementsof the organization.
TOTAL STOCKHOLDERS RETURN PERFORMANCE
The line graph below compares the performance of our Common Stock for the five year period endedDecember 31, 2019 with the performance of the Standard and Poor’s 500 Composite Stock Price Index, or theS&P 500 Index, and the Dow Jones US Containers & Packaging Index for the same period. The line graphassumes in each case an initial investment of $100.00 on December 31, 2014 and that all dividends werereinvested. The Dow Jones US Containers & Packaging Index has been weighted on the basis of marketcapitalization.
2014 2015 20172016 2018 2019
S&P 500 INDEXDOW JONES US CONTAINERS & PACKAGING INDEX
SILGAN HOLDINGS INC.
$0
$20
$40
$60
$80
$100
$120
$140
$160
$180
$200
Dec. 31,2014
Dec. 31,2015
Dec. 31,2016
Dec. 31,2017
Dec. 31,2018
Dec. 31,2019
Silgan Holdings Inc. . . . . . . . . . . . . . . . . . . . . . . . . . . . . . . . . . . . . . . . . . . . $100.00 $101.41 $ 97.92 $113.82 $ 92.83 $123.97S&P 500 Index . . . . . . . . . . . . . . . . . . . . . . . . . . . . . . . . . . . . . . . . . . . . . . . $100.00 $101.38 $113.51 $138.29 $132.23 $173.86Dow Jones US Containers & Packaging Index . . . . . . . . . . . . . . . . . . . . . $100.00 $ 95.69 $113.93 $135.60 $110.58 $142.19

UNITED STATESSECURITIES AND EXCHANGE COMMISSION
Washington, DC 20549
FORM 10-K (Mark One)
ANNUAL REPORT PURSUANT TO SECTION 13 OR 15(d) OF THE SECURITIES EXCHANGE ACT OF 1934
For the fiscal year ended December 31, 2019 or
TRANSITION REPORT PURSUANT TO SECTION 13 OR 15(d) OF THE SECURITIES EXCHANGE ACT OF1934
For the transition period from to Commission file number 000-22117
SILGAN HOLDINGS INC. (Exact name of Registrant as specified in its charter)
Delaware 06-1269834(State or other jurisdiction of
incorporation or organization) (I.R.S. Employer
Identification No.)
4 Landmark Square
Stamford, Connecticut 06901(Address of principal executive offices) (Zip Code)
Registrant’s telephone number, including area code (203) 975-7110 Securities registered pursuant to Section 12(b) of the Act:
Title of each class Trading Symbol(s) Name of each exchange on which registeredCommon Stock, par value $0.01 per share SLGN Nasdaq Global Select Market
Securities registered pursuant to Section 12(g) of the Act: NoneIndicate by check mark if the Registrant is a well-known seasoned issuer, as defined in Rule 405 of the Securities Act. Yes No Indicate by check mark if the Registrant is not required to file reports pursuant to Section 13 or 15(d) of the Act. Yes No Indicate by check mark whether the Registrant: (1) has filed all reports required to be filed by Section 13 or 15(d) of the Securities Exchange Act of 1934
during the preceding 12 months (or for such shorter period that the Registrant was required to file such reports), and (2) has been subject to such filing requirements for the past 90 days. Yes No
Indicate by check mark whether the Registrant has submitted electronically every Interactive Data File required to be submitted pursuant to Rule 405 of Regulation S-T during the preceding 12 months (or for such shorter period that the Registrant was required to submit such files). Yes No
Indicate by check mark whether the Registrant is a large accelerated filer, an accelerated filer, a non-accelerated filer, a smaller reporting company, or an emerging growth company. See the definitions of “large accelerated filer,” “accelerated filer,” “smaller reporting company,” and “emerging growth company” in Rule 12b-2 of the Exchange Act.
Large accelerated filer Accelerated filerNon-accelerated filer Smaller reporting company
Emerging growth company
If an emerging growth company, indicate by check mark if the Registrant has elected not to use the extended transition period for complying with any new or revised financial accounting standards provided pursuant to Section 13(a) of the Exchange Act.
Indicate by check mark whether the Registrant is a shell company (as defined in Rule 12b-2 of the Exchange Act). Yes No The aggregate market value of the Registrant’s Common Stock held by non-affiliates, computed by reference to the price at which the Registrant’s
Common Stock was last sold as of June 30, 2019, the last business day of the Registrant’s most recently completed second fiscal quarter, was approximately $2.38 billion. Common Stock of the Registrant held by executive officers and directors of the Registrant has been excluded from this computation in that such persons may be deemed to be affiliates. This determination of affiliate status is not a conclusive determination for other purposes.
As of February 1, 2020, the number of shares outstanding of the Registrant’s Common Stock, par value $0.01 per share, was 110,780,464.Documents Incorporated by Reference:
Portions of the Registrant’s Proxy Statement, to be filed with the Securities and Exchange Commission within 120 days after the end of the fiscal year covered by this Annual Report on Form 10-K, for its Annual Meeting of Stockholders to be held in 2020 are incorporated by reference in Part III of this Annual Report on Form 10-K.

-i-
TABLE OF CONTENTS
Page
PART I
Item 1. Business
Item 1A. Risk Factors
Item 1B. Unresolved Staff Comments
Item 2. Properties
Item 3. Legal Proceedings
Item 4. Mine Safety Disclosures
PART II
Item 5. Market for Registrant’s Common Equity, Related Stockholder Matters and Issuer Purchases of Equity Securities
Item 6. Selected Financial Data
Item 7. Management’s Discussion and Analysis of Financial Condition and Results of Operations
Item 7A. Quantitative and Qualitative Disclosures About Market Risk
Item 8. Financial Statements and Supplementary Data
Item 9. Changes in and Disagreements with Accountants on Accounting and Financial Disclosure
Item 9A. Controls and Procedures
Item 9B. Other Information
PART III
Item 10. Directors, Executive Officers and Corporate Governance
Item 11. Executive Compensation
Item 12. Security Ownership of Certain Beneficial Owners and Management and Related Stockholder Matters
Item 13. Certain Relationships and Related Transactions, and Director Independence
Item 14. Principal Accounting Fees and Services
PART IV
Item 15. Exhibits and Financial Statement Schedules
Item 16. Form 10-K Summary
1
1
15
25
25
25
25
26
26
27
29
43
45
45
45
46
47
47
47
47
47
47
48
48
52

1
PART I
ITEM 1. BUSINESS.
GENERAL
We are a leading manufacturer of rigid packaging for consumer goods products. We had consolidated net sales of approximately $4.5 billion in 2019. Our products are used for a wide variety of end markets and we operate 100 manufacturing plants in North America, Europe, Asia and South America. Our products include:
• steel and aluminum containers for human and pet food and general line products;
• metal and plastic closures and dispensing systems for food, beverage, health care, garden, personal care, home and beauty products; and
• custom designed plastic containers for personal care, food, health care, pharmaceutical, household and industrial chemical, pet food and care, agricultural, automotive and marine chemical products.
We are a leading manufacturer of metal containers in North America and Europe, and in North America we are the largest manufacturer of metal food containers with a unit volume market share in the United States in 2019 of slightly more than half of the market. Our leadership in these markets is driven by our high levels of quality, service and technological support, our low cost producer position, our strong long-term customer relationships and our proximity to customers through our widespread geographic presence. We have 43 metal container manufacturing facilities located in the United States, Europe and Asia, serving over 50 countries throughout the world. Additionally, we believe that we have the most comprehensive equipment capabilities in the industry. For 2019, our metal container business had net sales of $2.47 billion (approximately 55.1 percent of our consolidated net sales) and income from operations of $160.0 million (approximately 41.8 percent of our consolidated income from operations excluding corporate expense).
We are also a leading worldwide manufacturer of metal and plastic closures and dispensing systems for food, beverage, health care, garden, personal care, home and beauty products. Our leadership position in closures is a result of our ability to provide customers with high levels of quality, service and technological support. Our closures business provides customers with an extensive variety of proprietary metal and plastic closures and innovative dispensing system solutions that ensure closure quality and safety, as well as state-of-the-art capping/sealing equipment and detection systems to complement our closures product offering. We have 34 closure manufacturing facilities located in North America, Europe, Asia and South America, from which we serve over 100 countries throughout the world. In addition, we license our technology to five other manufacturers for various international markets we do not serve directly. For 2019, our closures business had net sales of $1.41 billion (approximately 31.3 percent of our consolidated net sales) and income from operations of $173.5 million (approximately 45.4 percent of our consolidated income from operations excluding corporate expense).
Additionally, we are a leading manufacturer of plastic containers in North America for a variety of markets, including the personal care, food, health care and household and industrial chemical markets. Our success in the plastic packaging market is largely due to our demonstrated ability to provide our customers with high levels of quality, service and technological support, along with our value-added design-focused products and our extensive geographic presence with 23 manufacturing facilities in the United States and Canada. We produce plastic containers from a full range of resin materials and offer a comprehensive array of molding and decorating capabilities. For 2019, our plastic container business had net sales of $611.1 million (approximately 13.6 percent of our consolidated net sales) and income from operations of $48.9 million (approximately 12.8 percent of our consolidated income from operations excluding corporate expense).
Our customer base includes some of the world’s best-known branded consumer products companies. Our philosophy has been to develop long-term customer relationships by acting in partnership with our customers by providing reliable quality, service and technological support and utilizing our low cost producer position. The strength of our customer relationships is evidenced by our large number of multi-year supply arrangements, our high retention of customers’ business and our continued recognition from customers, as demonstrated by the many quality and service awards we have received. We estimate that in 2020 approximately 90 percent of our projected metal container sales and a majority of our projected closures and plastic container sales will be under multi-year customer supply arrangements.
Our objective is to increase shareholder value by efficiently deploying capital and management resources to grow our business, reduce operating costs and build sustainable competitive positions, or franchises, and to complete acquisitions that generate attractive cash returns. We believe that we will accomplish this goal because of

2
our leading market positions and management expertise in acquiring, financing, integrating and efficiently operating consumer goods packaging businesses.
OUR HISTORY
We are a Delaware corporation. We were founded in 1987 by R. Philip Silver and D. Greg Horrigan, two of the members of our Board of Directors and our former Co-Chairmen of the Board. Since our inception, we have acquired thirty-six businesses. As a result of the benefits of acquisitions and organic growth, we have become a leading manufacturer of metal containers in North America and Europe, with net sales of $2.47 billion in 2019, and have increased our overall share of the metal food container market in the United States from approximately ten percent in 1987 to slightly more than half of the market in 2019. Through acquisitions, we have become a leading worldwide manufacturer of closures for food, beverage, health care, garden, personal care, home and beauty products, with net sales of $1.41 billion in 2019, a sevenfold increase since our acquisition of the White Cap closures operations in the United States in 2003. We have also grown our market position in the plastic container business since 1987, with net sales increasing sevenfold to $611.1 million in 2019. The following chart shows our acquisitions since our inception:
Acquired Business Year Products
Nestlé Food Company’s metal containermanufacturing division
1987 Metal food containers
Monsanto Company’s plastic containerbusiness
1987 Plastic containers
Fort Madison Can Company of The DialCorporation
1988 Metal food containers
Seaboard Carton Division of Nestlé FoodCompany
1988 Paperboard containers
Aim Packaging, Inc. 1989 Plastic containersFortune Plastics Inc. 1989 Plastic containersExpress Plastic Containers Limited 1989 Plastic containersAmoco Container Company 1989 Plastic containersDel Monte Corporation’s U.S. can
manufacturing operations1993 Metal food containers
Food Metal and Specialty business ofAmerican National Can Company
1995 Metal food containers andmetal closures
Finger Lakes Packaging Company, Inc., asubsidiary of Birds Eye Foods, Inc.
1996 Metal food containers
Alcoa Inc.’s North American aluminum roll-onclosures business
1997 Aluminum roll-on closures
Rexam PLC’s North American plasticcontainer business
1997 Plastic containers and closures
Winn Packaging Co. 1998 Plastic containers
Campbell Soup Company’s steel containermanufacturing business
1998 Metal food containers
Clearplass Containers, Inc. 1998 Plastic containers
RXI Holdings, Inc. 2000 Plastic containers and plastic closures,caps, sifters and fitments
Thatcher Tubes LLC 2003 Plastic tubes
Amcor White Cap, LLC 2003 Metal, composite and plastic vacuumclosures
Pacific Coast Producers’ can manufacturingoperations
2003 Metal food containers
Amcor White Cap (Europe, Asia and SouthAmerica)
2006 - 2008 Metal, composite and plastic vacuumclosures
Cousins-Currie Limited 2006 Plastic containers

3
Acquired Business Year Products
Grup Vemsa 1857, S.L.’s metal vacuumclosures operations in Spain and China
2008 Metal vacuum closures
IPEC Global, Inc. and its subsidiaries 2010 Plastic closuresVogel & Noot Holding AG’s metal container
operations2011 Metal containers
DGS S.A.’s twist-off metal closures operations 2011 Metal vacuum closuresNestlé Purina PetCare’s metal container
manufacturing operations2011 Metal containers
Önta Öner Teneke Ambalaj Sanayive Ticaret A.S.
2012 Metal containers and metal vacuumclosures
Rexam High Barrier Food Containers, Inc.,Rexam PLC’s plastic food containeroperations
2012 Plastic food containers
Amcor Packaging (Australia) Pty Ltd's metalvacuum closures operations in Australia
2013 Metal vacuum closures
Portola Packaging, Inc. and its subsidiaries 2013 Plastic closuresTecnocap S.p.A.'s and Tecnocap LLC's metal
vacuum closures operations in the U.S.2013 Metal vacuum closures
Van Can Company's metal containermanufacturing assets
2014 Metal containers
Injected Plastics Co.'s plastic closuresoperations
2015 Plastic closures
WestRock Company’s specialty closures anddispensing systems business
2017 Specialty closures and dispensing systems
Cobra Plastics, Inc. 2020 Plastic and specialty closures
On January 27, 2020, we made a binding offer, or the Offer, to Twist Beauty Packaging S.A.S., or Albéa, on behalf of itself and certain of its subsidiaries, or the Sellers, to purchase all the outstanding securities of certain subsidiaries of the Sellers engaged in the dispensing business and certain assets related to the Sellers’ dispensing business in China, or collectively the Albéa Dispensing Business, for an aggregate purchase price of $900 million in cash, subject to certain adjustments, including for working capital and other current assets and current liabilities and net indebtedness. In conjunction with the Offer, we obtained a commitment for $900 million of incremental delayed draw term loans, or the Committed Financing, under our senior secured credit facility. We expect to fund the purchase price for this proposed acquisition from a combination of borrowings under our senior secured credit facility, including the Committed Financing, and cash on hand.
The Albéa Dispensing Business is a leading global supplier of highly engineered pumps, sprayers and foam dispensing solutions to major branded consumer goods product companies in the beauty and personal care markets. It operates a global network of 10 plants across North America, Europe, South America and Asia. For the fiscal year ended 2018, the Albéa Dispensing Business generated sales of approximately $383 million. As a result of this proposed acquisition, we expect to realize certain operational cost synergies, estimated to be approximately $20 million on an annual basis, within 18 months of closing related to procurement savings, reductions in general and administrative expenses and manufacturing efficiencies.
In the Offer, we undertake to (1) execute a securities and assets purchase agreement, or the SPA, in the form attached to the Offer upon receipt of a notice to exercise the option contained in the Offer, or the Option, by Albéa and (2) consummate the acquisition subject to the terms and conditions set forth in the SPA. The Offer will remain open for acceptance by the Sellers until the earlier of the two following dates: (1) seven business days after the completion of certain consultation and notification processes with applicable works’ councils and trade unions and (2) July 27, 2020. As set forth in the Offer, we have an exclusivity period extending from January 27, 2020 to the earlier of (1) the execution of the SPA or (2) October 27, 2020. Our and the Sellers’ obligations to complete the acquisition are subject to certain conditions, including antitrust clearances under the laws of various jurisdictions.
The form of SPA attached to the Offer provides that either we or the Sellers have the right to terminate the SPA in the event that the applicable antitrust clearances have not been obtained by October 27, 2020, or the Outside Date; provided, however, that we and the Sellers have the right to unilaterally postpone the Outside Date by up to

4
three months after the Outside Date, or the Postponed Outside Date, in the event that applicable antitrust clearances have not yet been obtained by the Outside Date. The form of SPA further provides that if the applicable antitrust clearances have not been obtained by the Outside Date or the Postponed Outside Date, as the case may be, then we are required to pay a break fee of $25 million to the Sellers. In addition, if the parties have not yet entered into the SPA, the Sellers may terminate the Offer if (1) the applicable antitrust clearances required under the SPA are no longer capable of being obtained on or before the Outside Date or the Postponed Outside Date, as the case may be, or (2) we do not execute the SPA even though the Option has been exercised by the Sellers. In the case of either of the foregoing, then we are required to pay a termination fee of $25 million to the Sellers. Alternatively, if the Sellers have not executed the SPA after the consultation and notification processes with applicable works’ councils and trade unions have been completed, then the Sellers are required to pay $25 million to us for estimated costs and expenses and time incurred in connection with the Offer and the proposed acquisition.
On February 4, 2020, we acquired Cobra Plastics, Inc., or Cobra Plastics, a manufacturer of injection molded plastic closures for a wide variety of consumer products, with a particular focus on the aerosol overcap market. Cobra Plastics had sales of approximately $30 million for the year ended December 31, 2018 and currently operates from two manufacturing facilities located in close proximity to one another in Macedonia, Ohio.
OUR STRATEGY
We intend to enhance our position as a leading manufacturer of consumer goods packaging products by continuing to aggressively pursue a strategy designed to achieve future growth and increase shareholder value by focusing on the following key elements:
SUPPLY “BEST VALUE” PACKAGING PRODUCTS WITH HIGH LEVELS OF QUALITY, SERVICE AND TECHNOLOGICAL SUPPORT
Since our inception, we have been, and intend to continue to be, devoted to consistently supplying our products with the combination of quality, price and service that our customers consider to be “best value.” In our metal container business, we focus on providing high quality and high levels of service and utilizing our low cost producer position. We have made and are continuing to make significant capital investments to offer our customers value-added features such as our family of Quick Top® easy-open ends for our metal food containers, shaped metal food containers and alternative color offerings for metal food containers. In addition, we have made and continue to make investments to enhance the competitive advantages of metal packaging for food, including a new manufacturing facility in the United States completed in 2016 to better optimize the logistical footprint of our metal containers business. Additionally, in 2018 we commercialized a smaller, near-site manufacturing facility in the United States to support growth of certain customers. In our closures business, we emphasize high levels of quality, service and technological support. We believe our closures business is the premier innovative closures and dispensing systems solutions provider to the food, beverage, health care, garden, personal care, home and beauty industries. We offer customers an extensive variety of metal and plastic closures for food and beverage products, as well as proprietary equipment solutions such as cap feeders, cappers and detection systems, to ensure high quality package safety. We also manufacture throughout the world a wide range of highly engineered dispensing systems for health care, garden, personal care, home, beauty and food products. In our plastic container business, we provide high levels of quality and service and focus on value-added, custom designed plastic containers to meet changing product and packaging demands of our customers. We believe that we are one of the few plastic packaging businesses that can custom design, manufacture and decorate a wide variety of plastic containers, providing the customer with the ability to satisfy more of its plastic packaging needs through one supplier. We will continue to supply customized products that can be delivered quickly to our customers with superior levels of design, development and technological support. We have made strategic investments to enhance the competitive position of our plastic container business, including the construction of two new plastic container manufacturing facilities in the United States that were completed in 2016, one of which is a near-site facility to a major customer and the other of which is to meet the growing needs of our customers and allow us to further reduce costs of our plastic container business. Additionally, in 2018 we commercialized a new thermoformed plastic container manufacturing facility in the United States in support of continued growth.
MAINTAIN LOW COST PRODUCER POSITION
We will continue pursuing opportunities to strengthen our low cost position in our business by:
• maintaining a flat, efficient organizational structure, resulting in low selling, general and administrative expenses as a percentage of consolidated net sales;
• achieving and maintaining economies of scale;

5
• prudently investing in new technologies to increase manufacturing and production efficiency;
• rationalizing our existing plant structure; and
• serving our customers from our strategically located plants.
Through our metal container facilities, we believe that we provide the most comprehensive manufacturing capabilities in the industry. Through our closures business, we manufacture an extensive variety of metal and plastic closures and highly engineered dispensing systems for the food, beverage, health care, garden, personal care, home and beauty industries throughout the world utilizing state-of-the-art technology and equipment, and we also provide our customers for our closures with state-of-the-art capping/sealing equipment and detection systems. Through our plastic container facilities, we have the capacity to manufacture customized products across the entire spectrum of resin materials, decorating techniques and molding processes required by our customers. We intend to leverage our manufacturing, design and engineering capabilities to continue to create cost-effective manufacturing systems that will drive our improvements in product quality, operating efficiency and customer support.
In 2016, we completed optimization plans in each of our businesses that reduced manufacturing and logistical costs and provided productivity improvements and manufacturing efficiencies, thereby resulting in a lower cost manufacturing network for our businesses and strengthening the competitive position of each of our businesses in their respective markets. In conjunction with these optimization plans, we completed the construction of a new metal food container manufacturing facility and two new plastic container manufacturing facilities in the United States, the relocation of various equipment lines to facilities where we can better serve our customers and the rationalization of several existing manufacturing facilities. The three new manufacturing facilities are strategically located to meet the unique needs of our customers.
In 2018, we commercialized a new metal container manufacturing facility and a new thermoformed plastic container manufacturing facility, in each case to support continued growth in key markets. In 2019, we initiated a multi-year footprint optimization plan in our metal container business in the U.S. to reduce capacity and continue to drive cost reductions, which includes the likely shutdown of six metal container manufacturing facilities over a three year period. As part of this plan, we shut down two metal container manufacturing facilities in the fourth quarter of 2019.
MAINTAIN AN OPTIMAL CAPITAL STRUCTURE TO SUPPORT GROWTH AND INCREASE SHAREHOLDER VALUE
Our financial strategy is to use reasonable leverage to support our growth and increase shareholder returns. Our stable and predictable cash flow, generated largely as a result of our long-term customer relationships and generally recession resistant business, supports our financial strategy. We intend to continue using reasonable leverage, supported by our stable cash flows, to make value enhancing acquisitions. In determining reasonable leverage, we evaluate our cost of capital and manage our level of debt to maintain an optimal cost of capital based on current market conditions. If acquisition opportunities are not identified over a longer period of time, we may use our cash flow to repay debt, repurchase shares of our common stock or increase dividends to our stockholders or for other permitted purposes. In February 2017, we issued $300 million of our 4¾% Senior Notes due 2025, or the 4¾% Notes, and €650 million of our 3¼% Senior Notes due 2025, or the 3¼% Notes. We used the net proceeds from the 4¾% Notes to prepay a portion of our outstanding U.S. dollar term loans and repay a portion of our outstanding revolving loans under our then existing senior secured credit facility, or our 2014 Credit Facility. We used the net proceeds from the 3¼% Notes to prepay all outstanding Euro term loans and repay all remaining outstanding revolving loans under our 2014 Credit Facility, to repay certain foreign bank revolving and term loans of certain of our non-U.S. subsidiaries and to redeem $220 million of our outstanding 5% Senior Notes due 2020, or the 5% Notes. In March 2017, we completed an amendment and restatement of our 2014 Credit Facility and entered into an amended and restated senior secured credit facility, which extended the maturity dates of our senior secured credit facility, provides additional borrowing capacity for us and provides us with greater flexibility with regard to our strategic initiatives. In May 2018, we entered into an amendment to our amended and restated senior secured credit facility, as so amended, our Credit Agreement, which further extended maturity dates, lowered the margin on borrowings thereunder and provides additional flexibility with regard to strategic initiatives. Our Credit Agreement provides us with revolving loans, consisting of a multicurrency revolving loan facility of approximately $1.19 billion and a Canadian revolving loan facility of Cdn $15.0 million. Additionally, our Credit Agreement provided us with term loans, consisting of (i) U.S. $800 million of term loans designated U.S. A term loans and (ii) Cdn $45.5 million of term loans designated Canadian A term loans. In April 2017, we funded the purchase price for the specialty closures and dispensing systems operations of WestRock Company, now operating under the name Silgan Dispensing Systems, or SDS, with the $800 million of U.S. A term loans and revolving loan borrowings under our Credit Agreement. In April 2018, we redeemed all of our remaining outstanding 5% Notes ($280.0 million

6
aggregate principal amount) with revolving loan borrowings under our Credit Agreement and cash on hand. In August 2019, we redeemed all $300 million aggregate principal amount of our outstanding 5½% Senior Notes due 2022, or the 5½% Notes, with revolving loan borrowings under our Credit Agreement and cash on hand. In November 2019, we issued $400 million aggregate principal amount of our 4 % Senior Notes due 2028, or the 4 %
Notes, and used the net proceeds therefrom to repay outstanding revolving loans under our Credit Agreement, including revolving loans used to redeem the 5½% Notes. You should also read Notes 3, 9 and 19 to our Consolidated Financial Statements for the year ended December 31, 2019 included elsewhere in this Annual Report.
EXPAND THROUGH ACQUISITIONS AND INTERNAL GROWTH
We intend to continue to increase our market share in our current business lines and related business lines through acquisitions and internal growth. We use a disciplined approach to make acquisitions and investments that generate attractive cash returns. As a result, we expect to continue to expand and diversify our customer base, geographic presence and product lines. This strategy has enabled us to increase our net sales and income from operations over the last ten years.
We are a leading manufacturer of metal containers in North America and Europe, primarily as a result of our acquisitions but also as a result of growth with existing customers. During the past 30 years, the metal food container market in North America has experienced significant consolidation primarily due to the desire by food processors to reduce costs and focus resources on their core operations rather than self-manufacture their metal food containers. Our acquisitions of the metal food container manufacturing operations of Nestlé Food Company, or Nestlé, The Dial Corporation, or Dial, Del Monte Corporation, or Del Monte, Birds Eye Foods, Inc., or Birds Eye, Campbell Soup Company, or Campbell, Pacific Coast Producers, or Pacific Coast, and Nestlé Purina PetCare's steel container self-manufacturing assets, or Purina Steel Can, reflect this trend. We estimate that approximately nine percent of the market for metal food containers in the United States is still served by self-manufacturers.
While we have expanded our metal container business and increased our market share of metal containers primarily through acquisitions and growth with existing customers, we have also made over the last several years, and are continuing to make, significant capital investments in our metal container business to enhance our business and offer our customers value-added features, such as our family of Quick Top® easy-open ends for metal food containers, shaped metal food containers and alternative color offerings for metal food containers. In 2019, approximately 70 percent of our metal food containers sold had an easy-open end. In addition, we have made and continue to make investments to enhance the competitive advantages of metal packaging for food. In 2016, we completed the construction of a new metal food container manufacturing facility in Burlington, Iowa to better optimize the logistical footprint of our metal container operations in North America, allowing us to further reduce costs of our metal container business. Additionally, in 2018 we commercialized a smaller, near-site manufacturing facility in Breinigsville, Pennsylvania to support growth of certain customers.
With our acquisitions of our closures operations in North America, Europe, Asia and South America, we established ourselves as a leading worldwide manufacturer of metal and plastic closures and dispensing systems for food, beverage, health care, garden, personal care, home and beauty products. In 2017, we broadened our closures portfolio to include dispensing systems with our acquisition of SDS. Since 2003, following our acquisition of the White Cap closures operations in the United States, net sales of our closures business have increased sevenfold to $1.41 billion in 2019 as a result of acquisitions and internal growth. We may pursue further consolidation opportunities in the closures markets in which we operate, including in dispensing systems, or in adjacent closures markets, such as our proposed acquisition of the Albéa Dispensing Business and our acquisition of Cobra Plastics. Additionally, we expect to continue to generate internal growth in our closures business, particularly in plastic closures and dispensing systems. In making investments to pursue internal growth, we use a disciplined approach to generate attractive cash returns.
We have grown our market position for our plastic container business since 1987, with net sales increasing sevenfold to $611.1 million in 2019. We achieved this improvement primarily through strategic acquisitions as well as through internal growth. In 2016, we completed construction of two new plastic container manufacturing facilities, including a near-site facility to a major customer and another facility to meet the growing needs of our customers and allow us to further reduce costs of our plastic container business. These new facilities are located in North East, Pennsylvania and Hazelwood, Missouri. Additionally, in 2018 we commercialized a new thermoformed plastic container manufacturing facility in Fort Smith, Arkansas in support of continued growth. The plastic containers segment of the consumer goods packaging industry continues to be highly fragmented, and we intend to pursue further consolidation opportunities in this market. We also expect to continue to generate internal growth in our

7
plastic container business. As with acquisitions, we use a disciplined approach to pursue internal growth to generate attractive cash returns. Through a combination of these efforts, we intend to continue to expand our customer base in the markets that we serve, such as the personal care, food, health care, pharmaceutical, household and industrial chemical, pet food and care, agricultural, automotive and marine chemical markets.
ENHANCE PROFITABILITY THROUGH PRODUCTIVITY IMPROVEMENTS AND COST REDUCTIONS
We intend to continue to enhance profitability through investment of capital for productivity improvements, manufacturing efficiencies, manufacturing cost reductions, and the optimization of our manufacturing facilities footprints. The additional sales and production capacity provided through acquisitions and investments have enabled us to rationalize plant operations and decrease overhead costs through plant closings and downsizings. From 2015, we have closed six metal container manufacturing facilities, two closures manufacturing facilities and three plastic container manufacturing facilities in connection with our continuing efforts to streamline our plant operations, reduce operating costs and better match supply with geographic demand.
We expect that most future acquisitions will continue to enable us to realize manufacturing efficiencies as a result of optimizing production scheduling and other benefits from economies of scale and the elimination of redundant selling and administrative functions. In addition to the benefits realized through the integration of acquired businesses, we have improved and expect to continue to improve the operating performance of our plant facilities by investing capital for productivity improvements, manufacturing efficiencies and manufacturing cost reductions. While we have made some of these investments in certain of our plants, more opportunities still exist throughout our system. We will continue to use a disciplined approach to identify these opportunities to generate attractive cash returns.
In 2016, we completed optimization plans in each of our businesses that reduced manufacturing and logistical costs and provided productivity improvements and manufacturing efficiencies, thereby resulting in a lower cost manufacturing network for our businesses and strengthening the competitive position of each of our businesses in their respective markets. In conjunction with these optimization plans, we completed the construction of a new metal food container manufacturing facility and two new plastic container manufacturing facilities, the relocation of various equipment lines to facilities where we can better serve our customers and the rationalization of several existing manufacturing facilities. The three new manufacturing facilities are strategically located to meet the unique needs of our customers.
In 2018, we commercialized a new metal container manufacturing facility and a new thermoformed plastic container manufacturing facility, in each case to support continued growth in key markets. In 2019, we initiated a multi-year footprint optimization plan in our metal container business in the U.S. to reduce capacity and continue to drive cost reductions, which includes the likely shutdown of six metal container manufacturing facilities over a three year period. As part of this plan, we shut down two metal container manufacturing facilities in the fourth quarter of 2019.
BUSINESS SEGMENTS
We are a holding company that conducts our business through various operating subsidiaries. We operate three businesses, our metal container business, our closures business and our plastic container business.
METAL CONTAINERS—55.1 PERCENT OF OUR CONSOLIDATED NET SALES IN 2019
We are a leading manufacturer of metal containers in North America and Europe, and in North America we are the largest manufacturer of metal food containers with a unit volume market share in the United States in 2019 of slightly more than half of the market. Our metal container business is engaged in the manufacture and sale of steel and aluminum containers that are used primarily by processors and packagers for food products, such as pet food, vegetables, soup, proteins (e.g., meat, chicken and seafood), tomato based products, adult nutritional drinks, fruit and other miscellaneous food products, as well as general line metal containers primarily for chemicals. We have 43 metal container manufacturing facilities located in the United States, Europe and Asia, serving over 50 countries throughout the world. For 2019, our metal container business had net sales of $2.47 billion (approximately 55.1 percent of our consolidated net sales) and income from operations of $160.0 million (approximately 41.8 percent of our consolidated income from operations excluding corporate expense). We estimate that approximately 90 percent of our projected metal container sales in 2020 will be pursuant to multi-year customer supply arrangements.
Although metal containers face competition from plastic, paper, glass and composite containers, we believe metal containers are superior to plastic, paper and composite containers in applications where the contents are prepared at high temperatures, or packaged in larger consumer or institutional quantities, or where the long-term

8
storage of the product is desirable while maintaining the product’s quality. We also believe that metal containers are generally more desirable than glass containers because metal containers are more durable and less costly to transport. In addition, metal containers are one of the most recycled packages in the world and are infinitely recyclable. While the market for metal food containers in the United States has experienced little or no growth over the last ten years, we have increased our market share of metal food containers in the United States primarily through acquisitions and growth with existing customers, and have enhanced our business by focusing on providing customers with high quality, high levels of service and value-added features such as our family of Quick Top® easy-open ends, shaped metal food containers and alternative color offerings for metal food containers. In addition, we have made and continue to make investments to enhance the competitive advantages of metal packaging for food. In 2016, we completed the construction of a new metal food container manufacturing facility in the United States to better optimize the logistical footprint of our metal container business in North America, allowing us to further reduce costs of our metal container business. Additionally, in 2018 we commercialized a smaller, near-site manufacturing facility in the United States to support growth of certain customers.
CLOSURES—31.3 PERCENT OF OUR CONSOLIDATED NET SALES IN 2019
We are a leading worldwide manufacturer of metal and plastic closures and dispensing systems for food, beverage, health care, garden, personal care, home and beauty products. Our closures business provides customers with an extensive variety of proprietary metal and plastic closures and innovative dispensing system solutions that ensure closure quality and safety, as well as state-of-the-art capping/sealing equipment and detection systems to complement our closures product offering. We have 34 closure manufacturing facilities located in North America, Europe, Asia and South America, from which we serve over 100 countries throughout the world. In addition, we license our technology to five other manufacturers for various markets we do not serve directly. For 2019, our closures business had net sales of $1.41 billion (approximately 31.3 percent of our consolidated net sales) and income from operations of $173.5 million (approximately 45.4 percent of our consolidated income from operations excluding corporate expense). Since 2003, following our acquisition of the White Cap closures operations in the United States, we have grown our closures business through acquisitions and internal growth, with net sales increasing sevenfold.
We manufacture metal and plastic closures for food and beverage products, such as ready-to-drink teas, sports drinks, dairy products, tomato sauce, salsa, pickles, baby food, juice drinks, ketchup, preserves, soup, cooking sauces, gravies, fruits, vegetables and infant formula products. With our acquisition in 2017 of SDS, we broadened our closures portfolio to manufacture dispensing systems for health care, garden, personal care, home, beauty and food products, such as health care nasal spray and topical applications, lawn and garden products, hard surface cleaning products, professional cleaning products, air and fabric care products, perfume and fragrance products, skin care products, lotions, cosmetics, soaps, hair care products and other bath and body products and condiments. We provide customers of our closures business with custom formulations of sealing/lining materials, designed either to minimize removal torques and enhance openability of our closures or to maintain sealability of our closures, in each case to meet the unique needs of our customers while also meeting applicable regulatory requirements. We offer our customers an extensive range of decorating options for our closures for product differentiation. We also provide customers with sealing/capping equipment and detection systems to complement our closures product offering. As a result of our extensive range of closures, our geographic presence and our focus on providing high levels of quality, service and technological support, we believe that we are uniquely positioned to serve food, beverage, health care, garden, personal care, home and beauty product companies for their closure needs.
PLASTIC CONTAINERS—13.6 PERCENT OF OUR CONSOLIDATED NET SALES IN 2019
We produce plastic containers from a full range of resin materials and offer a comprehensive array of molding and decorating capabilities. We are one of the leading manufacturers of custom designed high density polyethylene, or HDPE, and polyethylene terephthalate, or PET, containers in North America for the markets that we serve. We are also a leading manufacturer in North America of plastic thermoformed barrier and non-barrier bowls and trays for shelf-stable food products. We operate 23 plastic container manufacturing facilities in the United States and Canada. For 2019, our plastic container business had net sales of $611.1 million (approximately 13.6 percent of our consolidated net sales) and income from operations of $48.9 million (approximately 12.8 percent of our consolidated income from operations excluding corporate expense). Since 1987, we have improved our market position for our plastic container business, with net sales increasing sevenfold.
We manufacture custom designed and stock plastic containers for personal care and health care products, including containers for mouthwash, shampoos, conditioners, hand creams, lotions, liquid soap, respiratory and

9
gastrointestinal products, cosmetics and toiletries; food and beverage products, including peanut butter, salad dressings, condiments, dairy products and liquor; household and industrial chemical products, including containers for lawn, garden and agricultural products, scouring cleaners and cleaning agents; and pharmaceutical products, including containers for tablets and antacids. In addition, we manufacture plastic thermoformed barrier and non-barrier bowls and trays for food products, such as soups and other ready-to-eat meals and pet food, as well as thermoformed plastic tubs for food, household and personal care products, including soft fabric wipes. We also manufacture plastic closures, caps, sifters and fitments for food and household products, including salad dressings, condiments, peanut butter, spices, liquid margarine, powdered drink mixes and arts and crafts supplies.
Our leading position in the plastic container market is largely driven by our rapid response to our customers’ design, development and technology support needs and our value-added, diverse product line. This product line is the result of our ability to produce plastic containers from a full range of resin materials using a broad array of manufacturing, molding and decorating capabilities. We also strive to remain current with and, to some extent, anticipate innovations in resin composition and applications and changes in the technology for the manufacturing of plastic containers. We benefit from our large scale and nationwide presence, as significant consolidation is occurring in many of our customers’ markets. Through these capabilities, we are well-positioned to serve our customers, who demand customized solutions as they continue to seek innovative means to differentiate their products in the marketplace using packaging. In 2016, we completed the construction of two new plastic container manufacturing facilities in the United States, including a near-site facility to a major customer and another facility to meet the growing needs of our customers and allow us to further reduce costs of our plastic container business. Additionally, in 2018 we commercialized a new thermoformed plastic container manufacturing facility in the United States in support of continued growth.
MANUFACTURING AND PRODUCTION
As is the practice in the industry, most of our customers provide us with periodic estimates of products and quantities pursuant to which commitments are given. These estimates enable us to effectively manage production and control working capital requirements. We schedule our production to meet customers’ requirements. Because the production time for our products is short, the backlog of customer orders in relation to our sales is not material.
As of February 4, 2020, we operated a total of 100 manufacturing facilities in 19 different countries throughout the world that serve the needs of our customers.
METAL CONTAINER BUSINESS
The manufacturing operations of our metal container business include cutting, coating, lithographing, fabricating, assembling and packaging finished cans. We use three basic processes to produce cans. The traditional three-piece method requires three pieces of flat metal to form a cylindrical body with a weldedside seam, a bottom and a top. High integrity of the side seam is assured by the use of sophisticated electronic weld monitors and coatings that are thermally cured by induction and convection processes. The other two methods of producing cans start by forming a shallow cup that is then formed into the desired height using either the draw and iron process or the draw and redraw process. Using the draw and redraw process, we manufacture steel and aluminum two-piece cans, the height of which generally does not exceed the diameter. For cans the height of which is greater than the diameter, we manufacture steel two-piece cans by using a drawing and ironing process. We manufacture can bodies and ends from thin, high-strength aluminum alloys and steels by utilizing proprietary tool and die designs and selected can making equipment. We also manufacture our Quick Top® easy-open ends from both steel and aluminum alloys in a sophisticated precision progressive die process. We regularly review our Quick Top® easy-open end designs for improvements for optimum consumer preference through consumer studies and feedback.
CLOSURES BUSINESS
The manufacturing operations for metal closures include cutting, coating, lithographing, fabricating and lining. We manufacture twist-off, lug style and press-on, twist-off steel closures and aluminum roll-on closures for glass, metal and plastic containers, ranging in size from 18 to 110 millimeters in diameter. We employ state-of-the-art multi-die presses to manufacture metal closures, offering a low-cost, high quality means of production. We also provide customers of our closures business with custom formulations of sealing/lining materials, designed to minimize torque removal and enhance the openability of our closures while meeting applicable regulatory requirements.

10
We utilize two basic processes to produce plastic closures and dispensing systems. In the compression molded process, pellets of plastic resin are heated, extruded and then compressed to form a plastic closure shell. The plastic closure shell can include a molded linerless seal or a custom formulated, compression molded sealing system. The plastic closure shell can then be slit and printed depending on its end use. In the injection molded process, pellets of plastic resin are heated and injected into a mold, forming either a plastic closure shell or other dispensing systems component, such as a trigger, decorative shroud, actuator, valve or overcap. The plastic closure shell can include a molded linerless seal or a custom formulated sealing system. The plastic closure shell can then be slit and printed depending on its end use. In the case of a dispensing system, the dispensing system components are assembled into the dispensing system and can be printed depending on the end use of the dispensing system.
PLASTIC CONTAINER BUSINESS
We utilize two basic processes to produce plastic containers. In the extrusion blowmolding process, pellets of plastic resin are heated and extruded into a tube of plastic. A two-piece metal mold is then closed around the plastic tube and high pressure air is blown into it causing a bottle to form in the mold’s shape. In the injection and injection stretch blowmolding processes, pellets of plastic resin are heated and injected into a mold, forming a plastic preform. The plastic preform is then blown into a bottle-shaped metal mold, creating a plastic bottle.
Our plastic thermoformed bowls, trays and tubs are manufactured by melting pellets of plastic resin into an extruded plastic sheet. The plastic sheet is then formed in a mold to make the plastic bowl, tray or tub.
We have state-of-the-art decorating equipment, including several of the largest sophisticated decorating facilities in the United States. Our decorating methods for plastic containers are in-mold labeling, which applies a plastic film label to the bottle during the blowing process, and post-mold decoration. Post-mold decoration includes:
• silk screen decoration which enables the applications of images in multiple colors to the bottle;
• pressure sensitive decoration which uses a plastic film or paper label with an adhesive;
• heat transfer decoration which uses a plastic coated label applied by heat; and
• shrink sleeve labeling.
RAW MATERIALS
Based upon our existing arrangements with suppliers and our current and anticipated requirements, we believe that we have made adequate provisions for acquiring our raw materials for the foreseeable future. As a result of significant consolidation of suppliers, we are, however, dependent upon a limited number of suppliers for our steel, aluminum, coatings and compound raw materials. Increases in the prices of raw materials have generally been passed along to our customers in accordance with our multi-year customer supply arrangements and through general price increases.
METAL CONTAINER BUSINESS
We use tinplated and chromium plated steel, aluminum, copper wire, organic coatings, lining compound and inks in the manufacture and decoration of our metal container products. Our material requirements are supplied through agreements and purchase orders with suppliers with whom we have long-term relationships. If our suppliers fail to deliver under their arrangements, we would be forced to purchase raw materials on the open market, and no assurances can be given that we would be able to purchase such raw materials or, if we are so able, that we would be able to purchase such raw materials at comparable prices or terms. Although there has been significant consolidation of suppliers, we believe that we have made adequate provisions to purchase sufficient quantities of these raw materials to meet our customers' requirements for the foreseeable future.
Our metal container supply agreements with our customers provide for the pass through of changes in our metal costs. For our metal container customers without long-term agreements, we have also generally increased prices to pass through increases in our metal costs.
CLOSURES BUSINESS
We use tinplated and chromium plated steel, aluminum, organic coatings, low-metallic inks and pulpboard, plastic and organic lining materials in the manufacture of metal closures. We use resins in pellet form, such as homopolymer polypropylene, copolymer polypropylene and HDPE, thermoplastic elastomer lining materials,

11
processing additives and colorants in the manufacture of plastic closures and dispensing systems. Although no assurances can be given, we believe we have made adequate provisions to purchase sufficient quantities of these raw materials to meet our customers' requirements for the foreseeable future, despite the significant consolidation of suppliers.
Our closures supply agreements with our customers generally provide for the pass through of changes in our metal and resin costs, subject in many cases with respect to resin to a lag in the timing of such pass through. For our closures customers without long-term agreements, our closures business has also generally passed through changes in our metal and resin costs.
PLASTIC CONTAINER BUSINESS
The raw materials we use in our plastic container business are primarily resins in pellet form such as virgin HDPE, virgin PET, recycled HDPE, recycled PET, polypropylene and, to a lesser extent, polystyrene, low density polyethylene, polyethylene terephthalate glycol, polyvinyl chloride, polycarbonate and medium density polyethylene. Our resin requirements are acquired through multi-year arrangements for specific quantities of resins with several major suppliers of resins. The price that we pay for resin raw materials is not fixed and is subject to market pricing, which has fluctuated significantly in the past few years. Our plastic container supply agreements with our customers provide for the pass through of changes in our resin costs, subject in many cases to a lag in the timing of such pass through. For our plastic container customers without long-term agreements, our plastic container business has also generally passed through changes in our resin costs.
We believe that we have made adequate provisions to purchase sufficient quantities of resins to meet our customers' requirements for the foreseeable future, absent unforeseen events such as significant hurricanes.
SALES AND MARKETING
Our philosophy has been to develop long-term customer relationships by acting in partnership with our customers, providing reliable quality and service. We market our products primarily by a direct sales force, including manufacturer's representatives, and for our plastic container business, in part, through a network of distributors. Because of the high cost of transporting empty containers, our metal container business generally sells to customers within a 300 mile radius of its manufacturing plants.
Approximately 12 percent, 11 percent and 11 percent of our consolidated net sales were to Nestlé in 2019, 2018 and 2017, respectively. No other customer accounted for more than 10 percent of our total consolidated net sales during those years.
You should also read “Risk Factors—We face competition from many companies and we may lose sales or experience lower margins on sales as a result of such competition” included elsewhere in this Annual Report.
METAL CONTAINER BUSINESS
We are a leading manufacturer of metal containers in North America and Europe, and in North America we are the largest manufacturer of metal food containers with a unit volume market share in the United States in 2019 of slightly more than half of the market. We have 43 metal container manufacturing facilities located in the United States, Europe and Asia, serving over 50 countries throughout the world. Our largest customers for these products include Bonduelle Group, Campbell, Conagra Brands, Inc., Crider Foods, Inc., Del Monte, General Mills, Inc., Hill's Pet Nutrition, Inc., Hormel Foods Corporation, The Kraft Heinz Company, Mars, Incorporated, Nestlé, Pacific Coast and Stanislaus Food Products Company.
We have entered into multi-year supply arrangements with most of our customers for our metal container business. We estimate that approximately 90 percent of our projected metal container sales in 2020 will be pursuant to multi-year customer supply arrangements. Historically, we have been successful in continuing these multi-year customer supply arrangements. In Europe, our metal container business has had long-term relationships with many of its customers, although, as is common practice, many supply arrangements are negotiated on a year-by-year basis.
Since our inception in 1987, we have supplied Nestlé with substantially all of its U.S. metal food container requirements. Our net sales of metal food containers to Nestlé in 2019 were $500.4 million. We also supply Nestlé with closures in North America and Europe and plastic containers in North America. In 2018, we entered into long-term supply agreements with Nestlé that run through 2025 for the supply of all of Nestlé’s North American metal

12
food container requirements for pet food and other food products and to support growth initiatives of Nestlé. These long-term supply agreements replaced previous supply agreements with Nestlé. Each of these long-term supply agreements provide for certain prices and specify that those prices will be increased or decreased based upon price change formulas.
Our metal container business’ sales and income from operations are dependent, in part, upon the vegetable and fruit harvests in the midwest and western regions of the United States and, to a lesser extent, in a variety of national growing regions in Europe. The size and quality of these harvests varies from year to year, depending in large part upon the weather conditions in those regions. Because of the seasonality of the harvests, we have historically experienced higher unit sales volume in the third quarter of our fiscal year and generated a disproportionate amount of our annual income from operations during that quarter. You should also read “Risk Factors—The seasonality of the fruit and vegetable packing industry causes us to incur short-term debt” included elsewhere in this Annual Report.
CLOSURES BUSINESS
We are a leading worldwide manufacturer of metal and plastic closures and dispensing systems for food, beverage, health care, garden, personal care, home and beauty products. We have 34 closure manufacturing facilities located in North America, Europe, Asia and South America, from which we serve over 100 countries throughout the world.
Our largest customers of our closures business include Campbell, The Coca-Cola Company, Colgate-Palmolive Company, Dean Foods Company, Hipp GmbH & Co Vertrieb KG, The Kraft Heinz Company, Mizkan Holdings Co., Ltd., Molson Coors Brewing Company, Mt. Olive Pickle Company, Inc., Nestlé, PepsiCo Inc., The Procter & Gamble Company, Puig S.L., S. C. Johnson & Son, Inc., The Scotts Company LLC, Spectrum Brands Holdings, Inc. and its affiliated entities, including United Industries Corporation, and Unilever, N.V. We have multi-year supply arrangements with many of our customers in the United States. Outside of the United States, the closures business has had long-term relationships with most of its customers. While we have multi-year supply arrangements with some of our closures customers outside of the United States, as is common practice, many supply arrangements with customers outside of the United States are negotiated on a year-by-year basis.
In addition, we license our technology to five other manufacturers who supply products in India, Israel, South Korea, Malaysia, Maldives, South Africa, Sri Lanka, Taiwan and Thailand.
PLASTIC CONTAINER BUSINESS
We are one of the leading manufacturers of custom designed and stock plastic containers sold in North America for a variety of markets, including the personal care, food, health care and household and industrial chemical markets. We are also a leading manufacturer in North America of plastic thermoformed barrier and non-barrier bowls and trays for shelf-stable food products and pet food products. We market our plastic containers in most areas of North America through a direct sales force and a large network of distributors. We also market certain stock plastic containers through an on-line shopping catalog.
Our largest customers for our plastic container business include Berlin Packaging LLC, Campbell, Conagra Brands, Inc., General Mills, Inc., Henkel AG & Co. KGaA, Johnson & Johnson, The Kraft Heinz Company, Mars, Incorporated, McCormick & Company, Inc., Nice-Pak Products, Inc., Perrigo Company plc, The Procter & Gamble Company, The Scotts Company LLC, TreeHouse Foods Inc., TricorBraun, Inc. and Vi-Jon Laboratories, Inc.
We have arrangements to sell some of our plastic containers to distributors, who in turn resell those products primarily to regional customers. Plastic containers sold to distributors are generally manufactured by using generic and custom molds with decoration added to meet the end users’ requirements. The distributors’ warehouses and their sales personnel enable us to market and inventory a wide range of such products to a variety of customers.
We have multi-year supply arrangements with the majority of our customers for our plastic container business. In addition, many of our supply arrangements with our customers are for custom plastic containers made from proprietary molds.
COMPETITION
The packaging industry is highly competitive. We compete in this industry with manufacturers of similar and other types of packaging, as well as fillers, food processors and packers who manufacture containers for their own

13
use and for sale to others. We attempt to compete effectively through the quality of our products, competitive pricing and our ability to meet customer requirements for delivery, performance and technical assistance.
METAL CONTAINER BUSINESS
Of the commercial metal container manufacturers, Ball Metalpack, LLC, Crown Holdings, Inc. and Trivium Packaging (a business combination that includes Ardagh Group's Food & Specialty Metal Packaging operations) are our most significant competitors. Our competitors also include other regional suppliers. As an alternative to purchasing containers from commercial can manufacturers, customers have the ability to invest in equipment to self-manufacture their containers.
Because of the high cost of transporting empty containers, our metal container business generally sells to customers within a 300 mile radius of its manufacturing plants. Strategically located existing plants give us an advantage over competitors from other areas, but we could be potentially disadvantaged by the relocation of a major customer.
Although metal containers face competition from plastic, paper, glass and composite containers, we believe that metal containers are superior to plastic, composite and paper containers in applications, where the contents are prepared at high temperatures or packaged in larger consumer or institutional quantities or where long-term storage of the product is desirable while maintaining the product’s quality. We also believe that metal containers are more desirable generally than glass containers because metal containers are more durable and less costly to transport. In addition, metal containers are one of the most recycled packages in the world and are infinitely recyclable.
CLOSURES BUSINESS
Our closures business competes primarily with AptarGroup, Inc., Bericap Holding GmbH, Berry Global Group, Inc., Closures Systems International, Inc., Crown Holdings, Inc., Global Closure Systems, Groupe Massilly, Guala Dispensing Mexico, S.A. de C.V. and Tecnocap S.p.A. With our ability to manufacture an extensive range of metal and plastic closures and dispensing systems that ensure closure quality and safety, as well as state-of-the-art capping/sealing equipment and detection systems to complement our closures product offering, and our geographic presence, we believe we are uniquely positioned to serve food, beverage, health care, garden, personal care, home and beauty product companies for their closure needs.
PLASTIC CONTAINER BUSINESS
Our plastic container business competes with a number of large national producers of plastic containers for personal care, food, health care, pharmaceutical, household and industrial chemical, pet food and care, agricultural, automotive and marine chemical products. These competitors include Alpha Packaging, Inc., Alpla-Werke Alwin Lehner GmbH & Co. KG, Amcor Limited, Berry Global Group, Inc., Cebal Americas, Consolidated Container Company LLC, Graham Packaging Company (part of Rank Group Limited) and Plastipak Holdings, Inc. In addition to our rapid response to our customers’ design, development and technology support needs and our value-added, diverse product line, we strive to remain current with and, to some extent, anticipate innovations in resin composition and applications and changes in the technology for the manufacturing of plastic containers and closures.
EMPLOYEES
As of December 31, 2019, we employed approximately 3,200 salaried and 9,900 hourly employees on a full-time basis. Approximately 36 percent of our hourly plant employees in the United States and Canada as of that date were represented by a variety of unions, and most of our hourly employees in Europe, Asia, South America and Central America were represented by a variety of unions or other labor organizations. In addition, as of December 31, 2019, Campbell provided us with approximately 120 hourly employees on a full-time basis at one of the facilities that we lease from Campbell.
Our labor contracts expire at various times between 2020 and 2024. As of December 31, 2019, contracts covering approximately 15 percent of our hourly employees in the United States and Canada will expire during 2020. We expect no significant changes in our relations with these unions.

14
ENVIRONMENTAL AND OTHER REGULATIONS
We are subject to federal, foreign, state and local environmental laws and regulations. In general, these laws and regulations limit the discharge of pollutants into the environment and establish standards for the treatment, storage, and disposal of solid and hazardous waste. We believe that we are either in compliance in all material respects with all presently applicable environmental laws and regulations or are operating in accordance with appropriate variances, schedules under compliance orders or similar arrangements.
In addition to costs associated with regulatory compliance, we may be held liable for alleged environmental damage associated with the past disposal of hazardous substances. Those that generate hazardous substances that are disposed of at sites at which environmental problems are alleged to exist, as well as the owners of those sites and other classes of persons, are subject to claims for clean up and natural resource damages under the Comprehensive Environmental Response, Compensation, and Liability Act of 1980, or CERCLA, regardless of fault or the legality of the original disposal. CERCLA and many similar state and foreign statutes may hold a responsible party liable for the entire cleanup cost at a particular site even though that party may not have caused the entire problem. Other state statutes may impose proportionate rather than joint and several liability. The federal Environmental Protection Agency or a state or foreign agency may also issue orders requiring responsible parties to undertake removal or remedial actions at sites.
We are also subject to the Occupational Safety and Health Act and other federal, foreign, state and local laws regulating noise exposure levels and other safety and health concerns in the production areas of our plants.
While management does not believe that any of the regulatory matters described above, individually or in the aggregate, will have a material effect on our capital expenditures, earnings, financial position or competitive position, we cannot assure you that a material environmental or other regulatory claim will not arise in the future.
RESEARCH AND PRODUCT DEVELOPMENT
Our research, product development and product engineering efforts relating to our metal container business are conducted at our research facilities in Oconomowoc, Wisconsin. Our research, product development and product engineering efforts relating to our closures business are conducted at our research facilities in Downers Grove, Illinois, Grandview, Missouri, Hannover, Germany and Waalwijk, Netherlands. Our research, product development and product engineering efforts with respect to our plastic container business are performed by our manufacturing and engineering personnel located at our plastic container manufacturing facilities. In addition to research, product development and product engineering, these sites also provide technical support to our customers. The amounts we have spent on research and development during the last three fiscal years are not material.
We rely on a combination of patents, trade secrets, unpatented know-how, technological innovation, trademarks and other intellectual property rights, nondisclosure agreements and other protective measures to protect our intellectual property. We do not believe that any individual item of our intellectual property portfolio is material to our business. We employ various methods, including confidentiality agreements and nondisclosure agreements, with third parties, employees and consultants to protect our trade secrets and know-how. However, others could obtain knowledge of our trade secrets and know-how through independent development or other means.
AVAILABLE INFORMATION
We file annual reports on Form 10-K, quarterly reports on Form 10-Q and current reports on Form 8-K, proxy statements and other information with the Securities and Exchange Commission, or the SEC. The SEC maintains a website that contains annual, quarterly and current reports, proxy statements and other information that issuers (including the Company) file electronically with the SEC. The Internet address of the SEC’s website is http://www.sec.gov.
We maintain a website, the Internet address of which is http://www.silganholdings.com. Information contained on our website is not part of this Annual Report. We make available free of charge on or through our website our annual reports on Form 10-K, quarterly reports on Form 10-Q and current reports on Form 8-K (and any amendments to those reports) and Forms 3, 4 and 5 filed on behalf of our directors and executive officers as soon as reasonably practicable after such documents are electronically filed with, or furnished to, the SEC.

15
ITEM 1A. RISK FACTORS.
The following are certain risk factors that could materially and adversely affect our business, financial condition or results of operations. Additional risks and uncertainties not currently known to us or that we currently view as immaterial may also materially and adversely affect our business, financial condition or results of operations.
OUR INDEBTEDNESS COULD ADVERSELY AFFECT OUR CASH FLOW.
At December 31, 2019, we had $2,258.9 million of total consolidated indebtedness. We incurred much of this indebtedness as a result of financing acquisitions and refinancing our previously outstanding debt. In addition, at December 31, 2019, after taking into account outstanding letters of credit of $15.4 million, we had up to $1.17 billion and Cdn $15.0 million of revolving loans that we may borrow under our Credit Agreement. We also have available to us under our Credit Agreement an uncommitted multicurrency incremental loan facility in an amount of up to an additional $1.25 billion (which amount may be increased as provided under our Credit Agreement), and we may incur additional indebtedness as permitted by our Credit Agreement and our other instruments governing our indebtedness. In conjunction with the Offer to purchase the Albéa Dispensing Business, we obtained the Committed Financing, and we expect to fund the purchase price for the proposed acquisition of the Albéa Dispensing Business from a combination of borrowings under our Credit Agreement, including the Committed Financing, and cash on hand. Additionally, on February 26, 2020 we issued (i) an additional $200 million aggregate principal amount of the 4 % Notes and (ii) €500 million aggregate principal amount of the 2¼% Notes due 2028, or the 2¼% Notes, in a private placement in reliance on Rule 144A and Regulation S under the Securities Act of 1933, as amended. We used the net proceeds from such issuances to prepay most of our outstanding U.S. A term loans under our Credit Agreement.
A significant portion of our cash flow must be used to service our indebtedness and is therefore not available to be used in our business. In 2019, we repaid $41.1 million in mandatory principal and paid $108.8 million in interest on our indebtedness. Our ability to generate cash flow is subject to general economic, financial, competitive, legislative, regulatory and other factors that may be beyond our control. In addition, a significant portion of our indebtedness bears interest at floating rates, and therefore a substantial increase in interest rates could adversely impact our results of operations. Based on the average outstanding amount of our variable rate indebtedness in 2019, a one percentage point change in the interest rates for our variable rate indebtedness would have impacted our 2019 interest expense by an aggregate amount of approximately $13.1 million, after taking into account the average outstanding notional amount of our interest rate swap agreements during 2019.
Our indebtedness could have important consequences. For example, it could:
• increase our vulnerability to general adverse economic and industry conditions;
• require us to dedicate a significant portion of our cash flow from operations to payments on our indebtedness, thereby reducing the availability of our cash flow to fund working capital, acquisitions and capital expenditures, and for other general corporate purposes;
• limit our flexibility in planning for, or reacting to, changes in our business and the industry in which we operate;
• restrict us from making strategic acquisitions or exploiting business opportunities; and
• limit, along with the financial and other restrictive covenants in our indebtedness, among other things, our ability to borrow additional funds.
DESPITE OUR CURRENT LEVELS OF INDEBTEDNESS, WE MAY INCUR ADDITIONAL DEBT IN THE FUTURE, WHICH COULD INCREASE THE RISKS ASSOCIATED WITH OUR LEVERAGE.
We are continually evaluating and pursuing acquisition opportunities in the consumer goods packaging market and may incur additional indebtedness, including indebtedness under our Credit Agreement, to finance any such acquisitions and to fund any resulting increased operating needs, including for the pending proposed acquisition of the Albéa Dispensing Business. In 2017, for example, we funded the purchase price for our acquisition of SDS through term loan and revolving loan borrowings under our Credit Agreement in the aggregate amount of $1,023.8 million. If new debt is added to our current debt levels, the related risks we now face could increase. We will have to effect any new financing in compliance with the agreements governing our then existing indebtedness. The indentures governing the 4¾% Notes and the 3¼% Notes, the 4 % Notes and the 2¼% Notes do not prohibit us from incurring additional indebtedness.

16
THE TERMS OF OUR DEBT INSTRUMENTS RESTRICT THE MANNER IN WHICH WE CONDUCT OUR BUSINESS AND MAY LIMIT OUR ABILITY TO IMPLEMENT ELEMENTS OF OUR GROWTH STRATEGY.
Our Credit Agreement contains numerous covenants, including financial and operating covenants, some of which are quite restrictive. These covenants affect, and in many respects limit, among other things, our ability to:
• incur additional indebtedness;
• create liens;
• consolidate, merge or sell assets;
• make certain advances, investments and loans;
• enter into certain transactions with affiliates; and
• engage in any business other than the packaging business and certain related businesses.
The indentures governing the 4¾% Notes and the 3¼% Notes, the 4 % Notes and the 2¼% Notes contain certain covenants that also restrict our ability to create liens, issue guarantees, engage in sale and leaseback transactions and consolidate, merge or sell assets. These covenants could restrict us in the pursuit of our growth strategy.
WE FACE COMPETITION FROM MANY COMPANIES AND WE MAY LOSE SALES OR EXPERIENCE LOWER MARGINS ON SALES AS A RESULT OF SUCH COMPETITION.
The manufacture and sale of metal and plastic containers and closures is highly competitive. We compete with other manufacturers of metal and plastic containers and closures and manufacturers of alternative packaging products, as well as packaged goods companies who manufacture containers and closures for their own use and for sale to others. We compete primarily on the basis of price, quality and service. To the extent that any of our competitors is able to offer better prices, quality and/or services, we could lose customers and our sales and margins may decline.
In 2019, approximately 90 percent of our metal container sales and a majority of our closures and plastic container sales were pursuant to multi-year supply arrangements. Although no assurances can be given, we have been successful historically in continuing these multi-year customer supply arrangements. Additionally, in general, many of these arrangements provide that during the term the customer may receive competitive proposals for all or up to a portion of the products we furnish to the customer. We have the right to retain the business subject to the terms and conditions of the competitive proposal. If we match a competitive proposal, it may result in reduced sales prices for the products that are the subject of the proposal. If we choose not to match a competitive proposal, we may lose the sales that were the subject of the proposal.
The loss of any major customer, a significant reduction in the purchasing levels of any major customer or a significant adverse change in the terms of our supply agreement with any major customer could adversely affect our results of operations.
DEMAND FOR OUR PRODUCTS COULD BE AFFECTED BY CHANGES IN LAWS AND REGULATIONS APPLICABLE TO FOOD AND BEVERAGES AND CHANGES IN CONSUMER PREFERENCES.
We manufacture and sell metal and plastic rigid packaging for consumer goods products. Many of our products are used to package food and beverages, and therefore they come into direct contact with these products. Accordingly, such products must comply with various laws and regulations for food and beverages applicable to our customers. Changes in such laws and regulations could negatively impact our customers’ demand for our products as they comply with such changes and/or require us to make changes to our products. Such changes to our products could include modifications relating to the inclusion of bisphenol A in the coatings and compounds that we use, possibly resulting in the incurrence by us of additional costs. Additionally, because our products are used to package consumer goods, we are subject to a variety of risks that could influence consumer behavior and negatively impact demand for our products, including changes in consumer preferences driven by various health-related and environmental concerns and perceptions.

17
OUR FINANCIAL RESULTS COULD BE ADVERSELY AFFECTED IF WE ARE NOT ABLE TO OBTAIN SUFFICIENT QUANTITIES OF RAW MATERIALS OR MAINTAIN OUR ABILITY TO PASS RAW MATERIAL PRICE INCREASES THROUGH TO OUR CUSTOMERS.
We purchase steel, aluminum, plastic resins and other raw materials from various suppliers. Sufficient quantities of these raw materials may not be available in the future, whether due to reductions in capacity because of, among other things, significant consolidation of suppliers, increased demand in excess of available supply, unforeseen events such as significant hurricanes, government imposed quotas or other reasons. In addition, such materials are subject to price fluctuations due to a number of factors, including increases in demand for the same raw materials, the availability of other substitute materials, tariffs and general economic conditions that are beyond our control.
Over the last few years, there has been significant consolidation of suppliers of steel worldwide. In addition, tariffs, quotas and court cases have negatively impacted the ability and desire of steel suppliers to competitively supply steel outside of their countries. More recently, the United States began imposing new tariffs on steel supply into the United States from certain foreign countries starting in June 2018, which has increased the cost of steel imported into the United States as well as ultimately steel manufactured in the United States. Additionally, exemptions from tariffs granted by the United States have been inconsistent and unpredictable. In Europe, recently enacted quotas on foreign steel supply has negatively impacted the ability of foreign steel suppliers to supply steel into Europe. Additional tariffs and/or quotas or other limitations on steel supply could further negatively impact the ability and desire of steel suppliers to competitively supply steel outside of their countries. Our metal container and metal closures supply agreements with our customers provide for the pass through of changes in our metal costs. For our customers without long-term agreements, we also generally increase prices to pass through increases in our metal costs. However, the impact of tariffs and quotas creates volatility in the applicable markets and therefore creates challenges for us and our customers in passing through costs related to such tariffs and quotas.
Our resin requirements are primarily acquired through multi-year arrangements for specific quantities of resins with several major suppliers of resins. The prices that we pay for resins are not fixed and are subject to market pricing, which has fluctuated significantly in the past few years. Our plastic container, plastic closures and dispensing systems supply agreements with our customers generally provide for the pass through of changes in resin costs, subject in many cases to a lag in the timing of such pass through. For customers without long-term agreements, we also generally pass through changes in resin costs.
Although no assurances can be given, we expect to be able to purchase sufficient quantities of raw materials to timely meet all of our customers’ requirements in 2020. Additionally, although no assurances can be given, we generally have been able to pass raw material cost increases through to our customers. The loss of our ability to pass those cost increases through to our customers or the inability of our suppliers to meet our raw material requirements, however, could have a materially adverse impact on our business, financial condition or results of operations.
GLOBAL ECONOMIC CONDITIONS, DISRUPTIONS IN CREDIT MARKETS AND IN MARKETS GENERALLY AND THE INSTABILITY OF THE EURO COULD ADVERSELY AFFECT OUR BUSINESS, FINANCIAL CONDITION OR RESULTS OF OPERATIONS.
In the past, the global financial markets have experienced substantial disruption, including, among other things, volatility in securities prices, diminished liquidity and credit availability, rating downgrades of certain investments and declining valuations of others. Additionally, the global economy experienced a recession, and economic uncertainty has generally continued in European markets and in China. If such economic conditions, disruption of global financial markets and tightening of credit in the financial markets were to occur again, then, among other risks we face, our business, financial condition, results of operations and ability to obtain additional financing in the future, including on terms satisfactory to us, could be adversely affected.
Economic conditions and disruptions in the credit markets could also harm the liquidity or financial position of our customers or suppliers, which could in turn cause such parties to fail to meet their contractual or other obligations to us or reduce our customers’ purchases from us, any of which could negatively affect our business, financial condition or results of operations. Additionally, under such circumstances, the creditworthiness of the counterparties to our interest rate and commodity pricing transactions could deteriorate, thereby increasing the risk that such counterparties fail to meet their contractual obligations to us.
Global markets are also susceptible to disruptions and resulting negative impacts from other occurrences and events, such as pandemics and contagious diseases like the recent outbreak of coronavirus, which could negatively affect global markets and the global economy. Such occurrences and events could cause or require us, our suppliers or our customers to temporarily suspend operations in affected regions, otherwise disrupt or affect our,

18
our suppliers’ or our customers’ operations or businesses, disrupt supply chains, commerce and travel, or cause an economic downturn or otherwise negatively impact consumer behavior and demand. Any such occurrences, events or disruptions could have a material adverse impact on our business, financial condition or results of operations.
There has been concern regarding the overall stability of the Euro and the future of the Euro as a single currency given the diverse economic and political circumstances in individual Eurozone countries. Potential developments and market perceptions related to the Euro could adversely affect the value of our Euro-denominated assets, reduce the amount of our translated amounts of U.S. dollar revenue and income, negatively impact our indebtedness in any such Eurozone country (including our ability to refinance such indebtedness) and otherwise negatively affect our business, financial condition or results of operations. For example, in June 2016, the United Kingdom voted to leave the European Union (commonly referred to as Brexit) and in January of 2020 the United Kingdom left the European Union. The implementation and effects of Brexit have been marked by political unpredictability and lack of clarity around the future economic relationship between the United Kingdom and the European Union. Although our revenue and income related to the United Kingdom is less than one percent of our overall revenue and income, Brexit could potentially disrupt and create uncertainty surrounding our business related to the United Kingdom, including our relationships with existing and future customers, suppliers and employees both during any applicable transition period and after. We cannot predict the short-term or long-term economic, financial, trade and legal implications that the ultimate withdrawal of the United Kingdom from the European Union would have and how such withdrawal would affect our business globally and in the region. In addition, Brexit may lead other European Union member countries to consider referendums regarding their European Union membership.
A SUBSTANTIALLY LOWER THAN NORMAL CROP YIELD MAY REDUCE DEMAND FOR OUR METAL CONTAINERS AND CLOSURES FOR FOOD PRODUCTS.
Our metal container business’ sales and income from operations are dependent, in part, upon the vegetable and fruit harvests in the midwest and western regions of the United States and, to a lesser extent, in a variety of national growing regions in Europe. Our closures business is also dependent, in part, upon the vegetable and fruit harvests. The size and quality of these harvests varies from year to year, depending in large part upon the weather conditions in applicable regions, and our results of operations could be impacted accordingly. Our sales, income from operations and net income could be materially adversely affected in a year in which crop yields are substantially lower than normal. For example, the results of our metal container business in 2019 were negatively impacted by poor harvests in Europe.
THE SEASONALITY OF THE FRUIT AND VEGETABLE PACKING INDUSTRY CAUSES US TO INCUR SHORT-TERM DEBT.
We sell metal containers and closures used to package fruits and vegetables, which is a seasonal process. As a result, we have historically generated a disproportionate amount of our annual income from operations in our third quarter. Additionally, as is common in the packaging industry, we must access working capital to build inventory ahead of the fruit and vegetable packing process. We also provide extended payment terms to some of our customers due to the seasonality of the fruit and vegetable packing process and, accordingly, carry accounts receivable for some customers beyond the end of the packing season. Due to our seasonal requirements, we may incur short-term indebtedness to finance our working capital requirements.
THE COST OF PRODUCING OUR PRODUCTS MAY BE ADVERSELY AFFECTED BY VARIOUS FACTORS.
The cost of producing our products is affected by many factors, some of which can be volatile and some of which may be challenging. For example, the cost of producing our products is sensitive to our energy costs, such as natural gas and electricity. We have, from time to time, entered into contracts to hedge a portion of our natural gas costs. Energy prices, in particular oil and natural gas prices, have been volatile in recent years, with a corresponding effect on our production costs.
Many countries, including most recently the United States, have imposed tariffs on imported products from certain other countries, including products and components supplied cross border within a company. Although we engage in limited cross border supply within our businesses, tariffs or quotas imposed on any cross border supplies within our businesses would increase the cost of our products and could adversely impact our results of operations. Additionally, local suppliers tend to increase prices for their products due to the protection offered by tariffs. Any such increases would increase the cost of our products and could adversely impact our results of operations.

19
WE MAY NOT BE ABLE TO PURSUE OUR GROWTH STRATEGY BY ACQUISITION.
Historically, we have grown predominantly through acquisitions. Our future growth will depend in large part on additional acquisitions of consumer goods packaging businesses. We may not be able to locate or acquire other suitable acquisition candidates consistent with our strategy, and we may not be able to fund future acquisitions because of limitations under our indebtedness or otherwise, including due to the limited availability of funds if the financial markets are impaired.
FUTURE ACQUISITIONS MAY CREATE RISKS AND UNCERTAINTIES THAT COULD ADVERSELY AFFECT OUR OPERATING RESULTS AND DIVERT OUR MANAGEMENT’S ATTENTION.
In pursuing our strategy of growth through acquisitions, including for the pending proposed acquisition of Albéa's dispensing business we will face risks commonly encountered with an acquisition strategy. These risks include:
• failing to identify material problems and liabilities in our due diligence review of acquisition targets;
• failing to obtain sufficient indemnification rights to fully offset possible liabilities associated with acquired businesses;
• failing to assimilate the operations and personnel of the acquired businesses;
• difficulties in identifying or retaining employees for the acquired businesses;
• disrupting our ongoing business;
• diluting our limited management resources;
• operating in new geographic regions; and
• impairing relationships with employees and customers of the acquired business as a result of changes in ownership and management.
Through our experience integrating our acquisitions, we have learned that, depending upon the size of the acquisition, it can take us up to two to three years to completely integrate an acquired business into our operations and systems and realize the full benefit of the integration. During the early part of this integration period, the operating results of an acquired business may decrease from results attained prior to the acquisition due to costs, delays or other challenges that arise when integrating the acquired business. In addition, we may not be able to achieve potential synergies or maintain the levels of revenue, earnings or operating efficiency that each business had achieved or might achieve separately. Moreover, indebtedness incurred to fund acquisitions could adversely affect our liquidity and financial stability.
THE PROPOSED ACQUISITION OF THE ALBÉA DISPENSING BUSINESS IS SUBJECT TO THE SELLERS' EXERCISE OF THE OPTION CONTAINED IN THE OFFER AND CERTAIN CONDITIONS, INCLUDING ANTITRUST CLEARANCES, AS WELL AS OTHER UNCERTAINTIES, AND THERE CAN BE NO ASSURANCES AS TO WHETHER AND WHEN IT MAY BE COMPLETED. A DELAY OR FAILURE TO CONSUMMATE THE PROPOSED ACQUISITION COULD NEGATIVELY IMPACT OUR FUTURE RESULTS OF OPERATIONS AND FINANCIAL CONDITION.
On January 27, 2020, we made the Offer to Albéa, on behalf of itself and the Sellers, to purchase the Albéa Dispensing Business. We and the Sellers have not yet entered into a definitive purchase agreement for the proposed acquisition of the Albéa Dispensing Business, pending certain consultation and notification processes with applicable works’ councils and trade unions and the Sellers’ exercise of the option contained in the Offer. Accordingly, we cannot assure you that the Sellers will exercise the option contained in the Offer and the parties will enter into the SPA.
In addition, the consummation of the proposed acquisition of the Albéa Dispensing Business is subject to the satisfaction of certain conditions, including the receipt of applicable antitrust clearances, which clearances, if not obtained by a certain date, would require us to pay a break fee of $25 million to the Sellers. We cannot predict with certainty whether or when any of the required conditions for the proposed acquisition of the Albéa Dispensing Business will be satisfied, whether the satisfaction of any such conditions will result in a materially adverse impact on us or to the Albéa Dispensing Business or if this proposed acquisition will be consummated at all. If this proposed acquisition is not completed, if there is a significant delay in completing it or if the satisfaction of any such conditions results in a materially adverse impact, such failure, delay or impact could adversely affect our future results of operations and financial condition.

20
WE MAY BE UNABLE TO ACHIEVE, OR MAY BE DELAYED IN ACHIEVING, ADEQUATE RETURNS FROM OUR EFFORTS TO OPTIMIZE OUR OPERATIONS, WHICH COULD ADVERSELY AFFECT OUR RESULTS OF OPERATIONS AND FINANCIAL CONDITION.
We continually strive to improve our operating performance and further enhance our franchise positions in our businesses through the investment of capital for productivity improvements, manufacturing efficiencies, manufacturing cost reductions and the rationalization of our manufacturing facilities footprints. For example, in 2019 we initiated a multi-year footprint optimization plan in our metal container business in the U.S. to reduce capacity and continue to drive cost reductions, which includes the likely shutdown of six manufacturing facilities over a three year period. Our operations include complex manufacturing systems as well as intricate scheduling and numerous geographic and logistical complexities associated with our facilities and our customers’ facilities. Accordingly, our efforts to achieve productivity improvements, manufacturing efficiencies and manufacturing cost reductions and to rationalize our manufacturing facilities footprints are subject to a number of risks and uncertainties that could impact our ability to achieve adequate returns from our efforts as planned. These risks and uncertainties include, among others, completing any such efforts on time and as planned and retaining customers impacted thereby.
IF WE ARE UNABLE TO RETAIN KEY MANAGEMENT, WE MAY BE ADVERSELY AFFECTED.
We believe that our future success depends, in large part, on our experienced management team. Losing the services of key members of our current management team could make it difficult for us to manage our business and meet our objectives.
PROLONGED WORK STOPPAGES AT OUR FACILITIES WITH UNIONIZED LABOR COULD JEOPARDIZE OUR FINANCIAL CONDITION.
As of December 31, 2019, we employed approximately 9,900 hourly employees on a full-time basis. Approximately 36 percent of our hourly plant employees in the United States and Canada as of that date were represented by a variety of unions, and most of our hourly employees in Europe, Asia, South America and Central America were represented by a variety of unions or other labor organizations. Our labor contracts expire at various times between 2020 and 2024. We cannot assure you that, upon expiration of existing collective bargaining agreements, new agreements will be reached without union action or that any such new agreements will be on terms no less favorable to us than current agreements. Disputes with the unions representing our employees could result in strikes or other labor protests that could disrupt our operations and divert the attention of management from operating our business. A strike or work stoppage could make it difficult for us to find a sufficient number of people with the necessary skills to replace those employees. Prolonged work stoppages at our facilities could have a material adverse effect on our business, financial condition or results of operations.
WE ARE SUBJECT TO COSTS AND LIABILITIES RELATED TO ENVIRONMENTAL AND HEALTH AND SAFETY LAWS AND REGULATIONS AND RISKS RELATED TO LEGAL PROCEEDINGS.
We continually review our compliance with environmental and other laws, such as the Occupational Safety and Health Act and other laws regulating noise exposure levels and other safety and health concerns in the production areas of our plants in the United States and environmental protection, health and safety laws and regulations abroad. We may incur liabilities for noncompliance, or substantial expenditures to achieve compliance, with environmental and other laws or changes thereto in the future or as a result of the application of additional laws and regulations to our business, including those limiting greenhouse gas emissions, those requiring compliance with the European Commission’s registration, evaluation and authorization of chemicals (REACH) procedures, and those imposing changes that would have the effect of increasing the cost of producing or would otherwise adversely affect the demand for plastic products. In addition, stricter regulations, or stricter interpretations of existing laws or regulations, may impose new liabilities on us, and we may become obligated in the future to incur costs associated with the investigation and/or remediation of contamination at our facilities or other locations. Additionally, many of our products come into contact with the food and beverages that they package, and therefore we may be subject to risks and liabilities related to health and safety matters in connection with our products. Changes in or additional health and safety laws and regulations in connection with our products may also impose new requirements and costs on us. Such requirements, liabilities and costs could have a material adverse effect on our capital expenditures, results of operations, financial condition or competitive position.
We are involved in various legal proceedings, contract disputes and claims arising in the ordinary course of our business. Additionally, a competition authority in Germany commenced an antitrust investigation in 2015 involving the industry association for metal packaging in Germany and its members, including our metal container and closures subsidiaries in Germany. At the end of April 2018, the European Commission commenced an antitrust

21
investigation involving the metal packaging industry in Europe including our metal container and closures subsidiaries, which should effectively close out the investigation in Germany. Although we are not able to predict the outcome of such proceedings, investigations, disputes and claims, any payments in respect thereof, including pursuant to any settlements, will reduce our available cash flows and could adversely impact our results of operations.
OUR INTERNATIONAL OPERATIONS ARE SUBJECT TO VARIOUS RISKS THAT MAY ADVERSELY AFFECT OUR FINANCIAL RESULTS.
Our international operations generated approximately $1,071.1 million, or approximately 24 percent, of our consolidated net sales in 2019. As of February 4, 2020, we have a total of 41 manufacturing facilities in a total of 18 countries outside of the United States, including Canada, Mexico and countries located in Europe, Asia and South America, serving customers in approximately 100 countries worldwide. Our business strategy may include continued expansion of international activities, including with the pending proposed acquisition of the Albéa Dispensing Business. Accordingly, the risks associated with operating in foreign countries, including Canada, Mexico and countries located in Europe, Asia and South America, may have a negative impact on our liquidity and net income. For example, the current economic uncertainty in Europe and China and the geopolitical disruptions in Russia and the Middle East and related adverse economic conditions and the current trade uncertainty throughout the world may have an adverse effect on our results of operations and financial condition.
Risks associated with operating in foreign countries include, but are not limited to:
• political, social and economic instability;
• inconsistent product regulation or policy changes by foreign agencies or governments;
• war, civil disturbance or acts of terrorism;
• trade disputes:
• compliance with and changes in applicable foreign laws;
• loss or non-renewal of treaties or similar agreements with foreign tax authorities;
• difficulties in enforcement of contractual obligations and intellectual property rights;
• high social benefits for labor;
• national and regional labor strikes;
• imposition of limitations on conversions of foreign currencies into U.S. dollars or payment of dividends and other payments by non-U.S. subsidiaries;
• foreign exchange rate risks;
• difficulties in expatriating cash generated or held by non-U.S. subsidiaries;
• uncertainties arising from local business practices and cultural considerations;
• changes in tax laws, or the interpretation thereof, affecting foreign tax credits or tax deductions relating to our non-U.S. earnings or operations;
• hyperinflation, currency devaluation or defaults in certain foreign countries;
• duties, taxes or government royalties, including the imposition or increase of withholding and other taxes on remittances and other payments by non-U.S. subsidiaries;
• customs, import/export and other trade compliance regulations or policies;
• non-tariff barriers and higher duty rates;
• difficulty in collecting international accounts receivable and potentially longer payment cycles;
• application of the Foreign Corrupt Practices Act and similar laws;
• increased costs in maintaining international manufacturing and marketing efforts; and
• taking of property by nationalization or expropriation without fair compensation.

22
WE ARE SUBJECT TO THE EFFECTS OF FLUCTUATIONS IN FOREIGN CURRENCY EXCHANGE RATES.
Our reporting currency is the U.S. dollar. As a result of our international operations, a portion of our consolidated net sales, and some of our costs, assets and liabilities, are denominated in currencies other than the U.S. dollar. As a result, we must translate local currency financial results into U.S. dollars based on average exchange rates prevailing during a reporting period for the preparation of our consolidated financial statements. Consequently, changes in exchange rates may unpredictably and adversely affect our consolidated operating results. For example, during times of a strengthening U.S. dollar, our reported international revenue and earnings will be reduced because the local currency will translate into fewer U.S. dollars. Conversely, a weakening U.S. dollar will effectively increase the dollar-equivalent of our expenses denominated in foreign currencies. Although we may use currency exchange rate protection agreements from time to time to reduce our exposure to currency exchange rate fluctuations in some cases, these hedges may not eliminate or reduce the effect of currency fluctuations.
IF THE INVESTMENTS IN OUR PENSION BENEFIT PLANS DO NOT PERFORM AS EXPECTED, WE MAY HAVE TO CONTRIBUTE ADDITIONAL AMOUNTS TO THESE PLANS, WHICH WOULD OTHERWISE BE AVAILABLE TO COVER OPERATING AND OTHER EXPENSES.
We maintain noncontributory, defined benefit pension plans covering a substantial number of our employees, which we fund based on certain actuarial assumptions. The plans’ assets consist primarily of common stocks and fixed income securities. If the investments of the plans do not perform at expected levels, then we may have to contribute additional funds to ensure that the plans will be able to pay out benefits as scheduled. Such an increase in funding would result in a decrease in our available cash flow. In addition, any such investment performance significantly below our expected levels could adversely impact our results of operations. For example, the significant market declines in investment values at the end of 2018 as compared to our assumed rate of return for the plans for the year had a non-cash unfavorable impact of approximately $20 million on our results of operations in 2019.
WE PARTICIPATE IN MULTIEMPLOYER PENSION PLANS UNDER WHICH, IN THE EVENT OF CERTAIN CIRCUMSTANCES, WE COULD INCUR ADDITIONAL LIABILITIES WHICH MAY BE MATERIAL AND MAY NEGATIVELY AFFECT OUR FINANCIAL RESULTS.
In 2019, we participated in four multiemployer pension plans which provide defined benefits to certain of our union employees. We withdrew from participating in the Central States, Southeast and Southwest Areas Pension Plan, or the Central States Pension Plan, at the end of 2019, and accordingly we now participate in three multiemployer pension plans. We expect to incur cash expenditures for the withdrawal liability related to such withdrawal from the Central States Pension Plan of approximately $3.1 million annually for the next twenty years, beginning in 2020. Because of the nature of multiemployer pension plans, there are risks associated with participating in such plans that differ from single-employer pension plans. Amounts contributed by an employer to a multiemployer pension plan are not segregated into a separate account and are not restricted to provide benefits only to employees of that contributing employer. In the event that another participating employer to a multiemployer pension plan in which we participate no longer contributes to such plan, the unfunded obligations of such plan may be borne by the remaining participating employers, including us. In such event, our required contributions to such plan could increase, which could negatively affect our financial condition and results of operations. In the event that we withdraw from participation in a multiemployer pension plan in which we participate or otherwise cease to make contributions to such a plan or in the event of the termination of such a plan, we potentially could be required under applicable law to make withdrawal liability payments to such plan in respect of the unfunded vested benefits of such plan, which unfunded vested benefits could be significant. Such withdrawal liability payments could be material and could negatively affect our financial condition and results of operations. As further discussed in Note 12 to our Consolidated Financial Statements for the year ended December 31, 2019 included elsewhere in this Annual Report, two of the multiemployer pension plans in which we still participate have a funded status of less than 65 percent. For further information with respect to our withdrawal from the Central States Pension Plan, please see Notes 4 and 12 to our Consolidated Financial Statements for the year ended December 31, 2019 included elsewhere in this Annual Report.
IF WE WERE REQUIRED TO WRITE-DOWN ALL OR PART OF OUR GOODWILL OR TRADE NAMES, OUR NET INCOME AND NET WORTH COULD BE MATERIALLY ADVERSELY AFFECTED.
As a result of our acquisitions, we have $1.1 billion of goodwill and $32.1 million of indefinite-lived trade names recorded on our consolidated balance sheet at December 31, 2019. We are required to periodically determine if our goodwill and trade names have become impaired, in which case we would write-down the impaired portion. If we were required to write-down all or part of our goodwill or trade names, our net income and net worth could be materially adversely affected.

23
INCREASED INFORMATION TECHNOLOGY SECURITY THREATS AND MORE SOPHISTICATED AND TARGETED COMPUTER CRIME COULD POSE A RISK TO OUR SYSTEMS, NETWORKS, PRODUCTS, SOLUTIONS AND SERVICES.
In order to conduct our business, we rely on information technology systems, networks and services, some of which are managed, hosted and provided by third-party service providers. Although we have not experienced any material breaches or material losses related to cyberattacks to date, increased global security threats and more sophisticated and targeted computer crime pose a risk to the security of our systems and networks and those of our third-party service providers and the confidentiality, availability and integrity of our data. Depending on their nature and scope, such threats could potentially lead to the compromise of confidential information, including, but not limited to, confidential information relating to our employees, improper use of our systems and networks, manipulation and destruction of data, defective products, production downtimes and operational disruptions, which in turn could adversely affect our reputation, competitiveness and results of operations. A cyberattack or other disruption may also result in a financial loss, including potential fines for failure to safeguard data.
We have taken steps and incurred costs to further strengthen the security of our computer systems and continue to assess, maintain and enhance the ongoing effectiveness of our information security systems. While we attempt to mitigate these risks by employing a number of measures, including development and implementation of cybersecurity policies and procedures, employee training, comprehensive monitoring of our networks and systems and maintenance of backup and protective systems, our systems, networks, products, solutions and services remain potentially vulnerable to advanced persistent threats. The techniques used by criminals to obtain unauthorized access to sensitive data change frequently and often are not recognizable until launched against a target. Accordingly, we may be unable to anticipate these techniques or implement adequate preventative measures. It is therefore possible that in the future we may suffer a criminal attack where unauthorized parties gain access to personal information in our possession, and we may not be able to identify any such incident in a timely manner.
In addition, the interpretation and application of data protection laws, including federal, state and international laws, relating to the collection, use, retention, disclosure, security and transfer of personally identifiable data in the United States (including but not limited to the California Consumer Privacy Act), Europe (including but not limited to the European Union's General Data Protection Regulation) and elsewhere, are uncertain and evolving.
As a result of potential cyberattack threats and existing and new data protection requirements, we have incurred and expect to continue to incur ongoing operating costs as part of our efforts to protect and safeguard our sensitive data and personal information. These efforts also may divert management and employee attention from other business and growth initiatives. A breach in information privacy could result in legal or reputational risks and could have a materially adverse impact on our business, financial condition and results of operations.
OUR PRINCIPAL STOCKHOLDERS HAVE SUBSTANTIAL INFLUENCE OVER US AND THEIR EXERCISE OF THAT INFLUENCE COULD BE ADVERSE TO YOUR INTERESTS.
As of December 31, 2019, Messrs. Silver and Horrigan beneficially owned an aggregate of 31,250,552 shares of our common stock, or approximately 28 percent of our outstanding common stock, which excludes certain shares of our common stock owned by affiliates and related family transferees of Messrs. Silver and Horrigan that are not deemed to be beneficially owned by Messrs. Silver or Horrigan. Accordingly, if they act together, they will be able to exercise substantial influence over all matters submitted to the stockholders for a vote, including the election of directors. In addition, we and Messrs. Silver and Horrigan have entered into an amended and restated principal stockholders agreement, or the Stockholders Agreement, that provides for certain director nomination rights. Under the Stockholders Agreement, the Group (as defined in the Stockholders Agreement and generally including Messrs. Silver and Horrigan and their affiliates and related family transferees and estates) has the right to nominate for election all of our directors until the Group holds less than one-half of the number of shares of our common stock held by it in the aggregate on February 14, 1997. At least one of the Group’s nominees must be either Mr. Silver or Mr. Horrigan during the three-year period covering the staggered terms of our three classes of directors. On February 14, 1997, the Group held 57,224,720 shares of our common stock in the aggregate (as adjusted for our two-for-one stock splits in 2005, 2010 and 2017). Additionally, the Group has the right to nominate for election either Mr. Silver or Mr. Horrigan as a member of our Board of Directors when the Group no longer holds at least one-half of the number of shares of our common stock held by it in the aggregate on February 14, 1997 but beneficially owns at least 5 percent of our common stock. The Stockholders Agreement continues until the death or disability of both of Messrs. Silver and Horrigan. The provisions of the Stockholders Agreement could have the effect of delaying, deferring or preventing a change of control of Silgan Holdings Inc. and preventing our stockholders from receiving a premium for their shares of our common stock in any proposed acquisition of Silgan Holdings Inc.

24
ANTI-TAKEOVER PROVISIONS IN OUR AMENDED AND RESTATED CERTIFICATE OF INCORPORATION AND OUR AMENDED AND RESTATED BY-LAWS COULD HAVE THE EFFECT OF DISCOURAGING, DELAYING OR PREVENTING A MERGER OR ACQUISITION. ANY OF THESE EFFECTS COULD ADVERSELY AFFECT THE MARKET PRICE OF OUR COMMON STOCK.
Provisions of our amended and restated certificate of incorporation and our amended and restated by-laws may have the effect of delaying or preventing transactions involving a change of control of Silgan Holdings Inc., including transactions in which stockholders might otherwise receive a substantial premium for their shares over then current market prices, and may limit the ability of stockholders to approve transactions that they may deem to be in their best interests.
In particular, our amended and restated certificate of incorporation provides that:
• the Board of Directors is authorized to issue one or more classes of preferred stock having such designations, rights and preferences as may be determined by the Board;
• the Board of Directors is divided into three classes, and each year approximately one-third of the directors are elected for a term of three years;
• the Board of Directors is fixed at seven members, subject to the ability of the Board of Directors to increase the size of the Board of Directors to up to nine members for a period of time; and
• action taken by the holders of common stock must be taken at a meeting and may not be taken by consent in writing.
Additionally, our amended and restated by-laws provide that a special meeting of the stockholders may only be called by our Chairman of the Board on his own initiative or at the request of a majority of the Board of Directors, and may not be called by the holders of common stock.
UPON THE OCCURRENCE OF CERTAIN CHANGE OF CONTROL EVENTS, WE MAY NOT BE ABLE TO SATISFY ALL OF OUR OBLIGATIONS UNDER OUR CREDIT AGREEMENT AND INDENTURES.
Under our Credit Agreement, the occurrence of a change of control (as defined in our Credit Agreement) constitutes an event of default, permitting, among other things, the acceleration of amounts owed thereunder. Additionally, upon the occurrence of a change of control repurchase event as defined in the indentures governing the 4¾% Notes and the 3¼% Notes, the 4 % Notes and the 2¼% Notes, we must make an offer to repurchase the 4¾% Notes, the 3¼% Notes, the 4 % Notes and the 2¼% Notes at a purchase price equal to 101% of the principal amount thereof, plus accrued interest to the date of purchase. We may not have sufficient funds or be able to obtain sufficient financing to meet such obligations under our Credit Agreement and such indentures. In addition, even if we were able to finance such obligations, such financing may be on terms that are unfavorable to us or less favorable to us than the terms of our existing indebtedness.
IF WE FAIL TO CONTINUE TO MAINTAIN EFFECTIVE INTERNAL CONTROL OVER FINANCIAL REPORTING TO A REASONABLE ASSURANCE LEVEL, WE MAY NOT BE ABLE TO ACCURATELY REPORT OUR FINANCIAL RESULTS AND MAY BE REQUIRED TO RESTATE PREVIOUSLY PUBLISHED FINANCIAL INFORMATION, WHICH COULD HAVE A MATERIAL ADVERSE EFFECT ON OUR OPERATIONS, INVESTOR CONFIDENCE IN OUR BUSINESS AND THE TRADING PRICES OF OUR SECURITIES.
Effective internal controls are necessary to provide reliable financial reports and to assist in the effective prevention of fraud. Our management is responsible for establishing and maintaining adequate internal control over financial reporting. Our internal control over financial reporting is designed to provide reasonable assurance regarding the reliability of financial reporting and the preparation of financial statements in accordance with generally accepted accounting principles. Because of inherent limitations, internal control over financial reporting may not prevent or detect misstatements. We also need to adapt our internal control over financial reporting as our business grows and changes. As we grow our business and acquire other businesses, our internal controls could become increasingly complex, requiring more time and resources. As further discussed in Item 9A, “Controls and Procedures,” included elsewhere in this Annual Report, management concluded that we maintained effective internal control over financial reporting as of December 31, 2019. There is no assurance that, in the future, material weaknesses will not be identified that would cause management to change its conclusion as to the effectiveness of our internal controls. If we fail to maintain the adequacy of our internal controls, as such standards are modified, supplemented or amended from time to time, we could be subject to regulatory scrutiny, civil or criminal penalties or litigation. In addition, failure to maintain adequate internal controls could result in financial statements that do not accurately reflect our financial condition, and we may be required to restate previously published financial information, which could have a material adverse effect on our operations, investor confidence in our business and the trading prices of our securities.

25
ITEM 1B. UNRESOLVED STAFF COMMENTS.
None.
ITEM 2. PROPERTIES.
We own and lease properties for use in the ordinary course of business. Our properties consist primarily of 43 manufacturing facilities for the metal container business, 34 manufacturing facilities for the closures business and 23 manufacturing facilities for the plastic container business. We own 55 of these facilities and lease 45. The leases expire at various times through 2040. Some of these leases contain renewal options as well as various purchase options.
We lease our principal executive offices and the administrative headquarters and principal places of business for our metal container business, our closures business and our plastic container business.
ITEM 3. LEGAL PROCEEDINGS.
We are a party to routine legal proceedings, contract disputes and claims arising in the ordinary course of our business. We are not a party to, and none of our properties are subject to, any pending legal proceedings which could have a material adverse effect on our business or financial condition.
A competition authority in Germany commenced an antitrust investigation in 2015 involving the industry association for metal packaging in Germany and its members, including our metal container and closures subsidiaries in Germany. At the end of April 2018, the European Commission commenced an antitrust investigation involving the metal packaging industry in Europe including our metal container and closures subsidiaries, which should effectively close out the investigation in Germany. Given the continued early stage of the investigation, we cannot reasonably assess what actions may result from these investigations or estimate what costs we may incur as a result thereof.
ITEM 4. MINE SAFETY DISCLOSURES.
Not applicable.

26
PART II ITEM 5. MARKET FOR REGISTRANT’S COMMON EQUITY, RELATED STOCKHOLDER MATTERS AND ISSUER PURCHASES
OF EQUITY SECURITIES.
Our common stock is quoted on the Nasdaq Global Select Market System under the symbol SLGN. As of January 31, 2020, we had 40 holders of record of our common stock.
On May 3, 2017, our Board of Directors declared a two-for-one stock split of our issued common stock, which was effected in the form of a stock dividend. Our stockholders of record at the close of business on May 15, 2017 were issued one additional share of our common stock for each share of our common stock owned by them on that date. Such additional shares were issued on May 26, 2017.
We began paying quarterly cash dividends on our common stock in 2004, and have increased the amount of the quarterly cash dividend payable on our common stock each year since then. The payment of future dividends is at the discretion of our Board of Directors and will be dependent upon our consolidated results of operations and financial condition, federal tax policies and other factors deemed relevant by our Board of Directors.
ISSUER PURCHASES OF EQUITY SECURITIES
On October 17, 2016, our Board of Directors authorized the repurchase by us of up to an aggregate of $300.0 million of our common stock by various means from time to time through and including December 31, 2021, of which we repurchased approximately $187.5 million of our common stock. We did not repurchase any of our equity securities in the fourth quarter of 2019. Accordingly, at December 31, 2019, we had approximately $112.5 million remaining for the repurchase of our common stock under this authorization.

27
ITEM 6. SELECTED FINANCIAL DATA.
In the table that follows, we provide you with selected financial data of Silgan Holdings Inc. We have derived this data from our consolidated financial statements for the five years ended December 31, 2019. Our consolidated financial statements for the five years ended December 31, 2019 have been audited by Ernst & Young LLP, our independent registered public accounting firm.
You should read this selected financial data along with the consolidated financial statements and accompanying notes included elsewhere in this Annual Report, as well as the section of this Annual Report titled “Management’s Discussion and Analysis of Financial Condition and Results of Operations.”
Selected Financial Data
Year Ended December 31, 2019 2018(a) 2017(a) 2016 2015 (Dollars in millions, except per share data)
Operating Data:Net sales $ 4,489.9 $ 4,448.9 $ 4,089.9 $ 3,612.9 $ 3,764.0Cost of goods sold (b) 3,776.2 3,759.1 3,455.4 3,101.1 3,233.6Gross profit 713.7 689.8 634.5 511.8 530.4Selling, general and administrative
expenses (b) (c) 315.7 308.4 305.1 219.9 226.4Rationalization charges 56.3 6.3 5.8 19.1 14.4Other pension and post retirement
income (b) (17.8) (37.0) (33.4) (26.9) (30.2)Income before interest and
income taxes 359.5 412.1 357.0 299.7 319.8Interest and other debt expense
before loss on early extinguishment of debt 105.7 116.3 110.2 67.8 66.9
Loss on early extinguishment of debt 1.7 2.5 7.1 — —Interest and other debt expense 107.4 118.8 117.3 67.8 66.9Income before income taxes 252.1 293.3 239.7 231.9 252.9Provision (benefit) for income taxes (d) 58.3 69.3 (30.0) 78.5 80.5Net income $ 193.8 $ 224.0 $ 269.7 $ 153.4 $ 172.4Per Share Data: (e)Basic net income per share $ 1.75 $ 2.03 $ 2.44 $ 1.28 $ 1.41Diluted net income per share $ 1.74 $ 2.01 $ 2.42 $ 1.27 $ 1.41Dividends per share $ 0.44 $ 0.40 $ 0.36 $ 0.34 $ 0.32Selected Segment Data:Net sales:
Metal containers $ 2,473.2 $ 2,378.0 $ 2,278.1 $ 2,271.9 $ 2,365.3Closures 1,405.6 1,456.8 1,246.7 797.1 805.0Plastic containers 611.1 614.1 565.1 543.9 593.7
Segment income:Metal containers (f) 160.0 198.8 230.2 214.7 236.4Closures (g) 173.5 189.9 142.0 99.8 91.8Plastic containers (h) 48.9 42.6 27.8 5.2 7.8

28
Selected Financial Data
Year Ended December 31, 2019 2018(a) 2017(a) 2016 2015 (Dollars in millions, except per share data)
Other Data:Capital expenditures $ 230.9 $ 191.0 $ 174.4 $ 191.9 $ 237.3Depreciation and amortization (i) 206.5 191.7 174.1 143.1 142.2Net cash provided by operatingactivities (j) 507.3 506.5 389.8 394.6 335.7Net cash used in investing activities (230.1) (189.9) (1,197.7) (180.3) (237.1)Net cash (used in) provided byfinancing activities (145.5) (293.6) 836.8 (289.5) (221.3)Balance Sheet Data (at end of period):Cash and cash equivalents $ 203.8 $ 72.8 $ 53.5 $ 24.7 $ 99.9Goodwill 1,142.2 1,148.3 1,171.5 604.7 612.8Total assets (k) 4,931.1 4,579.3 4,645.4 3,149.4 3,192.7Total debt 2,244.4 2,304.6 2,547.3 1,561.6 1,513.5Stockholders’ equity 1,023.3 881.3 766.1 469.4 639.2
Notes to Selected Financial Data (a) In April 2017, we acquired SDS, the specialty closures and dispensing systems operations of WestRock
Company. (b) In 2018, we retrospectively adopted new accounting guidance regarding certain classifications related to
other components of net periodic benefit costs. As a result, cost of goods sold was increased by $26.6 million, $21.7 million and $23.7 million in 2017, 2016 and 2015, respectively; selling, general and administrative expenses were increased by $6.8 million, $5.2 million and $6.5 million in 2017, 2016 and 2015, respectively; and we reported other pension and postretirement income of $33.4 million, $26.9 million and $30.2 million in 2017, 2016 and 2015, respectively.
(c) Selling, general and administrative expenses include costs attributed to announced acquisitions of $1.8 million, $24.7 million and $1.4 million in 2019, 2017 and 2016, respectively.
(d) The effective tax rate for 2017 was favorably impacted by the benefit from effective tax rate adjustments totaling $110.9 million primarily related to the revaluation of net deferred tax liabilities to reflect lower future cash tax obligations as a result of the reduction in the U.S. corporate income tax rate under the legislation commonly referred to as the Tax Cuts and Jobs Act enacted in December 2017.
(e) Per share amounts have been retroactively adjusted for the two-for-one stock split of our common stock that occurred on May 26, 2017.
(f) Segment income of the metal container business includes rationalization charges of $49.4 million, $5.3 million, $3.3 million and $12.1 million in 2019, 2018, 2017 and 2016, respectively. Segment income of the metal container business also includes a $3.0 million charge related to the resolution of a past non-commercial legal dispute in 2017.
(g) Segment income of the closures business includes rationalization charges of $6.5 million, $0.2 million, $1.0 million, $0.6 million and $1.7 million in 2019, 2018, 2017, 2016 and 2015, respectively.
(h) Segment income of the plastic container business includes rationalization charges of $0.4 million, $0.8 million, $1.5 million, $6.4 million and $12.7 million in 2019, 2018, 2017, 2016 and 2015, respectively.
(i) Depreciation and amortization excludes amortization of debt discount and issuance costs. (j) In 2016, we retrospectively adopted new accounting guidance regarding certain classifications on the
statement of cash flows related to excess tax benefits and shares repurchased from employees for tax withholding purposes. As a result, net cash provided by operating activities was increased by $0.3 million in 2015 and net cash (used in) provided by financing activities was decreased by $0.3 million in 2015.
(k) In 2019, we adopted new accounting guidance requiring us to recognize assets and liabilities on the balance sheet for the rights and obligations created by long-term leases. As a result, total assets and total liabilities increased by $186.8 million and $195.2 million in 2019, respectively.

29
ITEM 7. MANAGEMENT’S DISCUSSION AND ANALYSIS OF FINANCIAL CONDITION AND RESULTS OF OPERATIONS.
The following discussion and analysis is intended to assist you in understanding our consolidated financial condition and results of operations for the three-year period ended December 31, 2019. Our consolidated financial statements and the accompanying notes included elsewhere in this Annual Report contain detailed information that you should refer to in conjunction with the following discussion and analysis.
GENERAL
We are a leading manufacturer of rigid packaging for consumer goods products. We currently produce steel and aluminum containers for human and pet food and general line products; metal and plastic closures and dispensing systems for food, beverage, health care, garden, personal care, home and beauty products; and custom designed plastic containers for personal care, food, health care, pharmaceutical, household and industrial chemical, pet food and care, agricultural, automotive and marine chemical products. We are a leading manufacturer of metal containers in North America and Europe, the largest manufacturer of metal food containers in North America with a unit volume market share in the United States for the year ended December 31, 2019 of slightly more than half of the market, a leading worldwide manufacturer of metal and plastic closures and dispensing systems for food, beverage, health care, garden, personal care, home and beauty products, and a leading manufacturer of plastic containers in North America for a variety of markets, including the personal care, food, health care and household and industrial chemical markets.
Our objective is to increase shareholder value by efficiently deploying capital and management resources to grow our business, reduce operating costs, build sustainable competitive positions, or franchises, and to complete acquisitions that generate attractive cash returns. We have grown our net sales and income from operations largely through acquisitions but also through internal growth, and we continue to evaluate acquisition opportunities in the consumer goods packaging market.
SALES GROWTH
We have increased net sales and market share in our metal container, closures and plastic container businesses through both acquisitions and internal growth. As a result, we have expanded and diversified our customer base, geographic presence and product lines.
We are a leading manufacturer of metal containers in North America and Europe, primarily as a result of our acquisitions but also as a result of growth with existing customers. During the past 30 years, the metal food container market has experienced significant consolidation primarily due to the desire by food processors to reduce costs and focus resources on their core operations rather than self-manufacture their metal food containers. Our acquisitions of the metal food container manufacturing operations of Nestlé, Dial, Del Monte, Birds Eye, Campbell, Pacific Coast and Purina Steel Can reflect this trend. We estimate that approximately nine percent of the market for metal food containers in the United States is still served by self-manufacturers. In addition, the metal food container market in North America has been relatively flat during this period, despite losing market share as a result of more dining out, fresh produce and competing materials. However, we increased our share of the market for metal food containers in the United States primarily through acquisitions and growth with existing customers, and we have enhanced our business by focusing on providing customers with high levels of quality and service and value-added features such as our Quick Top® easy-open ends, shaped metal food containers and alternative color offerings for metal food containers. In 2019, approximately 70 percent of our metal food containers sold had an easy-open end. We anticipate that the market for metal food containers will be relatively flat in the future, but will continue to increase for certain markets such as pet food. We have further enhanced our metal container business through optimization measures, which included a new manufacturing facility in the United States that was completed in 2016. This new metal food container manufacturing facility allowed us to better optimize the logistical footprint of our metal container business in North America and to further reduce costs of our metal container business. Additionally, in 2018 we commercialized a smaller, near-site manufacturing facility in the United States to support growth of certain customers.
With our acquisitions of our closures operations in North America, Europe, Asia and South America, we established ourselves as a leading worldwide manufacturer of metal and plastic closures and dispensing systems for food, beverage, health care, garden, personal care, home and beauty products. In 2017, we broadened our closures portfolio to include dispensing systems with our acquisition of SDS. Since 2003, following our acquisition of the White Cap closures operations in the United States, net sales of our closures business have increased sevenfold to $1.41 billion in 2019 as a result of acquisitions and internal growth. We may pursue further consolidation opportunities in the closures markets in which we operate, including in dispensing systems, or in

30
adjacent closures markets, such as our proposed acquisition of the Albéa Dispensing Business. Additionally, we expect to continue to generate internal growth in our closures business, particularly in plastic closures and dispensing systems.
We have improved the market position of our plastic container business since 1987, with net sales increasing sevenfold to $611.1 million in 2019. We achieved this improved market position primarily through strategic acquisitions as well as through internal growth. In 2016, we completed the construction of two new plastic container manufacturing facilities in the United States, including a near-site facility to a major customer and another facility to meet the growing needs of our customers and allow us to further reduce costs of our plastic container business. Additionally, in 2018 we commercialized a new thermoformed plastic container manufacturing facility in the United States in support of continued growth. The plastic container market of the consumer goods packaging industry continues to be highly fragmented, with growth rates in excess of population expansion due to substitution of plastic for other materials. We have focused on the segment of this market where custom design and decoration allows customers to differentiate their products such as in personal care. We intend to pursue further acquisition opportunities in markets where we believe that we can successfully apply our acquisition and value-added operating expertise and strategy.
OPERATING PERFORMANCE
We operate in a competitive industry where it is necessary to realize cost reduction opportunities to offset continued competitive pricing pressure. We have improved the operating performance of our plant facilities through the investment of capital for productivity improvements, manufacturing efficiencies, manufacturing cost reductions and the optimization of our manufacturing facilities footprints. Our acquisitions and investments have enabled us to rationalize plant operations and decrease overhead costs through plant closings and downsizings and to realize manufacturing efficiencies as a result of optimizing production scheduling. From 2015, we have closed six metal container manufacturing facilities, two closures manufacturing facilities and three plastic container manufacturing facilities in connection with our continuing efforts to streamline our plant operations, reduce operating costs and better match supply with geographic demand. In 2019, we initiated a multi-year footprint optimization plan in our metal container business in the U.S. to reduce capacity and continue to drive cost reductions, which includes the likely shutdown of six metal container manufacturing facilities over a three year period. As part of this plan, we shut down two metal container manufacturing facilities in the fourth quarter of 2019.
We have also invested substantial capital in the past several years for new market opportunities and value-added products such as Quick Top® easy-open ends for metal food containers, shaped metal food containers and alternative color offerings for metal food containers. In addition, we have made and continue to make investments to enhance the competitive advantages of metal packaging for food. In 2016, we completed optimization plans in each of our businesses that reduced manufacturing and logistical costs and provided productivity improvements and manufacturing efficiencies, thereby resulting in a lower cost manufacturing network for our businesses and strengthening the competitive position of each of our businesses in their respective markets. In conjunction with these optimization plans, we completed the construction of a new metal food container manufacturing facility and two new plastic container manufacturing facilities, the relocation of various equipment lines to facilities where we can better serve our customers and the rationalization of several existing manufacturing facilities. The three new manufacturing facilities are strategically located to meet the unique needs of our customers. In addition to optimizing freight and logistical costs, these three new facilities allowed us to further reduce costs and rationalize our manufacturing footprint. Additionally, in 2018 we commercialized a new metal container manufacturing facility and a new thermoformed plastic container manufacturing facility, in each case to support continued growth in key markets.
Historically, we have been successful in renewing our multi-year supply arrangements with our customers. We estimate that in 2020 approximately 90 percent of our projected metal container sales and a majority of our projected closures and plastic containers sales will be under multi-year arrangements.
Many of our multi-year customer supply arrangements generally provide for the pass through of changes in raw material, labor and other manufacturing costs, thereby significantly reducing the exposure of our results of operations to the volatility of these costs. Our metal container and metal closure supply agreements with our customers provide for the pass through of changes in our metal costs. For our metal container and metal closure customers without long-term contracts, we have also generally changed prices to pass through changes in our metal costs. Our plastic closure, dispensing systems and plastic container supply agreements with our customers provide for the pass through of changes in our resin costs, subject in many cases to a lag in the timing of such pass

31
through. For our plastic closure, dispensing systems and plastic container customers without long-term contracts, we have also generally passed through changes in our resin costs.
Our metal container business’ sales and income from operations are dependent, in part, upon the vegetable and fruit harvests in the midwest and western regions of the United States and, to a lesser extent, in a variety of national growing regions in Europe. Our closures business is also dependent, in part, upon vegetable and fruit harvests. The size and quality of these harvests varies from year to year, depending in large part upon the weather conditions in applicable regions. Because of the seasonality of the harvests, we have historically experienced higher unit sales volume in the third quarter of our fiscal year and generated a disproportionate amount of our annual income from operations during that quarter. Additionally, as is common in the packaging industry, we provide extended payment terms to some of our customers in our metal container business due to the seasonality of the vegetable and fruit packing process.
USE OF CAPITAL
Historically, we have used leverage to support our growth and increase shareholder returns. Our stable and predictable cash flow, generated largely as a result of our long-term customer relationships and generally recession resistant business, supports our financial strategy. We intend to continue using reasonable leverage, supported by our stable cash flows, to make value enhancing acquisitions. In determining reasonable leverage, we evaluate our cost of capital and manage our level of debt to maintain an optimal cost of capital based on current market conditions. If acquisition opportunities are not identified over a longer period of time, we may use our cash flow to repay debt, repurchase shares of our common stock or increase dividends to our stockholders or for other permitted purposes. In February 2017, we issued $300 million of the 4¾% Notes and €650 million of the 3¼% Notes. We used the net proceeds from the 4¾% Notes to prepay a portion of our outstanding U.S. dollar term loans and repay a portion of our outstanding revolving loans under our 2014 Credit Facility. We used the net proceeds from the 3¼% Notes to prepay all outstanding Euro term loans and repay all remaining outstanding revolving loans under our 2014 Credit Facility, to repay certain foreign bank revolving and term loans of certain of our non-U.S. subsidiaries and to redeem $220 million of our outstanding 5% Notes. In March 2017, we refinanced our 2014 Credit Facility and entered into our Credit Agreement, which extended the maturity dates of our senior secured credit facility, provides additional borrowing capacity for us and provides us with greater flexibility with regard to our strategic initiatives. In May 2018, we entered into an amendment to our Credit Agreement which further extended maturity dates, lowered the margin on borrowings thereunder and provides additional flexibility with regard to our strategic initiatives. Our Credit Agreement provides us with revolving loans, consisting of a multicurrency revolving loan facility of approximately $1.19 billion and a Canadian revolving loan facility of Cdn $15.0 million. Additionally, our Credit Agreement provided us with term loans, consisting of (i) U.S. $800 million of term loans designated U.S. A term loans, which were used to fund a portion of the purchase price for SDS, and (ii) Cdn $45.5 million of term loans designated Canadian A term loans. In April 2017, we funded the purchase price for SDS with term and revolving loan borrowings under our Credit Agreement in the aggregate amount of $1,023.8 million. In April 2018, we redeemed all of our remaining outstanding 5% Notes ($280.0 million aggregate principal amount) with revolving loan borrowings under our Credit Agreement and cash on hand. In August 2019, we redeemed all $300 million aggregate principal amount of our outstanding 5½% Notes with revolving loan borrowings under our Credit Agreement and cash on hand. In November 2019, we issued $400 million aggregate principal amount of our 4 % Notes, and used the net proceeds therefrom to repay outstanding revolving loans under our Credit Agreement, including revolving loans used to redeem the 5½% Notes. You should also read Notes 3, 9 and 19 to our Consolidated Financial Statements for the year ended December 31, 2019 included elsewhere in this Annual Report.
To the extent we utilize debt for acquisitions or other permitted purposes in future periods, our interest expense may increase. Further, since the revolving loan and term loan borrowings under our Credit Agreement bear interest at floating rates, our interest expense is sensitive to changes in prevailing rates of interest and, accordingly, our interest expense may vary from period to period. After taking into account interest rate swap agreements that we entered into to mitigate the effect of interest rate fluctuations, at December 31, 2019, we had $692.6 million of indebtedness, or approximately 31 percent of our total outstanding indebtedness, which bore interest at floating rates. Over the course of the year, we also borrow revolving loans under our revolving loan facilities which bear interest at floating rates to fund our seasonal working capital needs. Accordingly, during 2019 our average outstanding variable rate debt, after taking into account the average outstanding notional amount of our interest rate swap agreements, was approximately 50 percent of our total outstanding indebtedness. You should also read Note 10 to our Consolidated Financial Statements for the year ended December 31, 2019 included elsewhere in this Annual Report for information regarding our interest rate swap agreements.

32
In light of our strategy to use leverage to support our growth and optimize shareholder returns, we have incurred and will continue to incur significant interest expense. For 2019, 2018 and 2017, our aggregate interest and other debt expense before loss on early extinguishment of debt as a percentage of our income before interest and income taxes was 29.4 percent, 28.2 percent and 30.9 percent, respectively.
RESULTS OF OPERATIONS
The following table sets forth certain income statement data expressed as a percentage of net sales for each of the periods presented. You should read this table in conjunction with our Consolidated Financial Statements for the year ended December 31, 2019 and the accompanying notes included elsewhere in this Annual Report.
Year Ended December 31, 2019 2018 2017Operating Data:Net sales:
Metal containers 55.1% 53.5% 55.7%Closures 31.3 32.7 30.5Plastic containers 13.6 13.8 13.8
Consolidated 100.0 100.0 100.0Cost of goods sold 84.1 84.5 84.5Gross profit 15.9 15.5 15.5Selling, general and administrative expenses 7.0 6.9 7.5Rationalization charges 1.3 0.1 0.1Other pension and postretirement income (0.4) (0.8) (0.8)Income before interest and income taxes 8.0 9.3 8.7Interest and other debt expense 2.4 2.7 2.8Income before income taxes 5.6 6.6 5.9Provision (benefit) for income taxes 1.3 1.6 (0.7)Net income 4.3% 5.0% 6.6%
Summary results for our business segments for the years ended December 31, 2019, 2018 and 2017 are provided below.
Year Ended December 31, 2019 2018 2017 (Dollars in millions)Net sales:
Metal containers $ 2,473.2 $ 2,378.0 $ 2,278.1Closures 1,405.6 1,456.8 1,246.7Plastic containers 611.1 614.1 565.1
Consolidated $ 4,489.9 $ 4,448.9 $ 4,089.9Segment income:
Metal containers(1) $ 160.0 $ 198.8 $ 230.2Closures(2) 173.5 189.9 142.0Plastic containers(3) 48.9 42.6 27.8Corporate(4) (22.9) (19.2) (43.0)
Consolidated $ 359.5 $ 412.1 $ 357.0______________________(1) Includes rationalization charges of $49.4 million, $5.3 million and $3.3 million in 2019, 2018 and 2017, respectively.(2) Includes rationalization charges of $6.5 million, $0.2 million and $1.0 million in 2019, 2018 and 2017, respectively. (3) Includes rationalization charges of $0.4 million, $0.8 million and $1.5 million in 2019, 2018 and 2017, respectively.(4) Includes costs attributed to announced acquisitions of $1.8 million and $24.7 million in 2019 and 2017, respectively.

33
YEAR ENDED DECEMBER 31, 2019 COMPARED WITH YEAR ENDED DECEMBER 31, 2018
Overview. Consolidated net sales were $4.49 billion in 2019, representing an 0.9 percent increase as compared to 2018 primarily as a result of the pass through of higher raw material and other manufacturing costs in the metal container business and higher volumes in the plastic container business, partially offset by the impact of unfavorable foreign currency translation, lower unit volumes and a less favorable mix of products sold in the metal container and closures businesses and the pass through of lower raw material costs in the plastic container and closures businesses. Income before interest and income taxes for 2019 decreased by $52.6 million, or 12.8 percent, as compared to 2018 primarily as a result of $50.0 million of higher rationalization charges incurred principally in connection with the announced footprint optimization plan for the metal container business and the resulting withdrawal from the Central States Pension Plan, lower pension income, lower unit volumes and a less favorable mix of products sold in the metal container and closures businesses, the impact of unfavorable foreign currency translation and costs attributed to announced acquisitions. These decreases were partially offset by production efficiencies, lower manufacturing costs, higher volumes in the plastic container business, the favorable impact from the lagged pass through to customers of lower resin costs in the closures business as compared to an unfavorable impact from higher resin costs in the prior year and the prior year unfavorable impact of costs associated with the start-up of a new manufacturing facility in the plastic container business. Rationalization charges were $56.3 million and $6.3 million for the years ended 2019 and 2018, respectively. Results for 2019 and 2018 also included other pension and post retirement income of $17.8 million and $37.0 million, respectively, and a loss on early extinguishment of debt of $1.7 million and $2.5 million, respectively. Net income in 2019 was $193.8 million as compared to $224.0 million in 2018.
Net Sales. The $41.0 million increase in consolidated net sales in 2019 as compared to 2018 was due to higher net sales in the metal container business, partially offset by a decrease in net sales in the closures and plastic container businesses.
Net sales for the metal container business increased $95.2 million, or 4.0 percent, in 2019 as compared to 2018. This increase was primarily a result of the pass through of higher raw material and other manufacturing costs, partially offset by lower unit volumes of approximately one percent, the impact of unfavorable foreign currency translation of approximately $16 million and a less favorable mix of products sold. The decrease in unit volumes was primarily due to the unfavorable impact in the current year period of the fourth quarter 2018 pre-buy of products by customers in anticipation of significant metal inflation in 2019 and lower volumes with fruit and vegetable pack customers, partially offset by continued growth in pet food volumes as well as higher volumes for soup.
Net sales for the closures business in 2019 decreased $51.2 million, or 3.5 percent, as compared to 2018. This decrease was primarily the result of the impact of unfavorable foreign currency translation of approximately $34 million, the pass through of net lower raw material costs, a less favorable mix of products sold and lower unit volumes of approximately one percent. The decrease in unit volumes was principally the result of weakness in food markets largely due to lower fruit and vegetable pack yields and the unfavorable impact in the current year period of the fourth quarter 2018 pre-buy of products by customers in anticipation of significant metal inflation in 2019, partially offset by higher dispensing systems unit volumes.
Net sales for the plastic container business in 2019 decreased $3.0 million, or 0.5 percent, as compared to 2018. This decrease was principally due to the pass through of lower raw material costs and the impact of unfavorable foreign currency translation of approximately $3 million, partially offset by higher volumes of approximately two percent.
Gross Profit. Gross profit margin increased 0.4 percentage points to 15.9 percent in 2019 as compared to 15.5 percent in 2018 for the reasons discussed below in "Income before Interest and Income Taxes."
Selling, General and Administrative Expenses. Selling, general and administrative expenses as a percentage of consolidated net sales increased 0.1 percentage points to 7.0 percent for 2019 as compared to 6.9 percent in 2018. Selling, general and administrative expenses increased $7.3 million in 2019 as compared to 2018 primarily due to inflation in compensation and other costs and $1.8 million of costs attributed to announced acquisitions.
Income before Interest and Income Taxes. Income before interest and income taxes for 2019 decreased by $52.6 million as compared to 2018, and margin decreased to 8.0 percent from 9.3 percent over the same periods. The decrease in segment income was primarily the result of higher rationalization charges, lower segment income in the closures business and costs in 2019 attributed to announced acquisitions, partially offset by higher segment

34
income in the plastic container business. Segment income in 2019 and 2018 included rationalization charges of $56.3 million and $6.3 million, respectively.
Segment income of the metal container business for 2019 decreased $38.8 million as compared to 2018, and segment income margin decreased to 6.5 percent from 8.4 percent over the same periods. The decrease in segment income and segment income margin was primarily attributable to $44.1 million of higher rationalization charges, lower pension income, lower unit volumes and a less favorable mix of products sold. These decreases were partially offset by production efficiencies in the U.S. due in part to the favorable impact from increased production levels during the current year. Rationalization charges in 2019 of $49.4 million were incurred primarily in connection with the previously announced footprint optimization plan and the resulting withdrawal from the Central States Pension Plan. Rationalization charges were $5.3 million in 2018.
Segment income of the closures business for 2019 decreased $16.4 million as compared to 2018, and segment income margin decreased to 12.3 percent from 13.0 percent over the same periods. The decrease in segment income was primarily due to an increase in rationalization charges of $6.3 million principally related to the previously announced shutdown of a metal closures manufacturing facility in Spain, lower pension income, the impact of unfavorable foreign currency translation, a less favorable mix of products sold and lower unit volumes, partially offset by lower manufacturing costs and the favorable impact from the lagged pass through to customers of lower resin costs in the current year as compared to an unfavorable impact from higher resin costs in the prior year.
Segment income of the plastic container business for 2019 increased $6.3 million as compared to 2018, and segment income margin increased to 8.0 percent from 6.9 percent over the same periods. The increase in segment income was primarily attributable to higher volumes, lower manufacturing costs, the prior year unfavorable impact of costs associated with the start-up of the new manufacturing facility in Fort Smith, Arkansas and a more favorable mix of products sold, partially offset by lower pension income.
Interest and Other Debt Expense. Interest and other debt expense before loss on early extinguishment of debt for 2019 was $105.7 million, a decrease of $10.6 million as compared to $116.3 million for 2018 due primarily to lower average outstanding borrowings as a result of the repayment of debt at the end of 2018, lower weighted average interest rates due in part to the redemption on August 1, 2019 of all outstanding 5½% Notes and the impact of favorable foreign currency translation. Loss on early extinguishment of debt of $1.7 million in 2019 was a result of the redemption of all outstanding 5½% Notes in August 2019. Loss on early extinguishment of debt of $2.5 million in 2018 was the result of the redemption of all remaining outstanding 5% Notes in April 2018 and the amendment to our Credit Agreement in May 2018.
Provision for Income Taxes. The effective tax rates for 2019 and 2018 were 23.1 percent and 23.6 percent.
YEAR ENDED DECEMBER 31, 2018 COMPARED WITH YEAR ENDED DECEMBER 31, 2017
Overview. Consolidated net sales were $4.45 billion in 2018, representing an 8.8 percent increase as compared to 2017 primarily as a result of the pass through of higher raw material and other manufacturing costs in each of our businesses, the inclusion of a full year of SDS, the impact from favorable foreign currency translation and higher volumes in the plastic container business, partially offset by lower unit volumes in the metal container business and legacy closures operations. Income before interest and income taxes for 2018 increased by $55.1 million, or 15.4 percent, as compared to 2017 primarily as a result of the inclusion in the prior year of acquisition related costs of $24.7 million related to SDS, the benefit from the inclusion of a full year of operations of SDS, the unfavorable impact in the prior year of the write-up of inventory of SDS for purchase accounting, lower manufacturing costs in each of our businesses, higher volumes in the plastic container business, the favorable impact from the contractual pass through to customers in the metal container business of indexed inflation on non-metal costs in the current year as compared to the unfavorable impact in the prior year from the contractual pass through of indexed deflation on non-metal costs, a charge of $3.0 million in the prior year related to the resolution of a past non-commercial legal dispute in the metal container business and foreign currency transaction losses in the prior year. These increases were partially offset by the unfavorable overhead absorption in the metal container business due to the reduction of finished goods inventory, lower volumes in the metal container business and the legacy closures operations, higher freight expense and costs associated with the start-up of two new manufacturing facilities. Rationalization charges were $6.3 million and $5.8 million for the years ended 2018 and 2017, respectively. Results for 2018 and 2017 also included a loss on early extinguishment of debt of $2.5 million and $7.1 million, respectively. Results for 2017 also included the benefit from effective tax rate adjustments totaling $110.9 million primarily related to the revaluation of net deferred tax liabilities to reflect lower future cash tax obligations as a result of the reduction in the U.S. corporate income tax rate under the Tax Cuts and Jobs Act

35
enacted in December 2017, or the 2017 Tax Act. Net income in 2018 was $224.0 million as compared to $269.7 million in 2017.
Net Sales. The $359.0 million increase in consolidated net sales in 2018 as compared to 2017 was due to higher net sales across all businesses.
Net sales for the metal container business increased $99.9 million, or 4.4 percent, in 2018 as compared to 2017. This increase was primarily a result of the pass through of higher raw material and other manufacturing costs and the impact of favorable foreign currency translation of approximately $12 million, partially offset by lower unit volumes of approximately four percent. The decrease in unit volumes was principally the result of a seasonal customer reducing inventory levels, a customer plant shutdown in the fruit market, the competitive loss of a smaller, lower margin customer and a less favorable fruit and vegetable pack in Europe, partially offset by higher pet food volumes and an incremental buy ahead by customers in 2018 as compared to 2017 in anticipation of significant steel inflation in 2019.
Net sales for the closures business in 2018 increased $210.1 million, or 16.9 percent, as compared to 2017. This increase was primarily the result of the inclusion of a full year of SDS, the pass through of higher raw material and other manufacturing costs and the impact of favorable foreign currency translation of approximately $18 million, partially offset by lower unit volumes of approximately two percent in the legacy closures operations primarily due to a less favorable fruit and vegetable pack in Europe as a result of weather conditions.
Net sales for the plastic container business in 2018 increased $49.0 million, or 8.7 percent, as compared to 2017. This increase was principally due to the pass through of higher raw material costs and higher volumes of approximately four percent.
Gross Profit. Gross profit margin remained constant at 15.5 percent in 2018 and 2017, for the reasons discussed below in "Income before Interest and Income Taxes."
Selling, General and Administrative Expenses. Selling, general and administrative expenses as a percentage of consolidated net sales decreased 0.6 percentage points to 6.9 percent for 2018 as compared to 7.5 percent in 2017. Selling, general and administrative expenses increased $3.2 million in 2018 as compared to 2017. The increase in selling, general and administrative expenses was primarily due to the inclusion of a full year of SDS, which generally incurs such expenses at a higher percentage of its net sales, and increases in certain other expenses, largely offset by the inclusion in the prior year of $24.7 million of costs attributed to the acquisition of SDS and a $3.0 million charge related to the resolution of a past non-commercial legal dispute.
Income before Interest and Income Taxes. Income before interest and income taxes for 2018 increased by $55.1 million as compared to 2017, and margin increased to 9.3 percent from 8.7 percent over the same periods. The increase in segment income was principally due to higher segment income in the closures and plastic container businesses as well as the inclusion in the prior year of acquisition related costs of $24.7 million, partially offset by a decrease in segment income in the metal container business. Segment income in 2018 and 2017 included rationalization charges of $6.3 million and $5.8 million, respectively.
Segment income of the metal container business for 2018 decreased $31.4 million as compared to 2017, and segment income margin decreased to 8.4 percent from 10.1 percent over the same periods. The decrease in segment income was primarily attributable to the unfavorable overhead absorption of approximately $18 million due to the reduction of finished goods inventory by approximately $65 million in 2018, lower unit volumes, higher freight expense and higher rationalization charges, partially offset by the favorable impact from the contractual pass through to customers of indexed inflation on non-metal costs in 2018 as compared to the unfavorable impact in the prior year from the contractual pass through of indexed deflation on non-metal costs, lower manufacturing costs and a $3.0 million charge in the prior year related to the resolution of a past non-commercial legal dispute. Rationalization charges were $5.3 million and $3.3 million in 2018 and 2017, respectively.
Segment income of the closures business for 2018 increased $47.9 million as compared to 2017, and segment income margin increased to 13.0 percent from 11.4 percent over the same periods. The increase in segment income was primarily due to the inclusion of a full year of the SDS operations, the unfavorable impact in the prior year of a charge of $11.9 million for the write-up of inventory of SDS for purchase accounting, lower manufacturing costs and foreign currency transaction losses in the prior year, partially offset by the volume impact from a less favorable fruit and vegetable pack in Europe.

36
Segment income of the plastic container business for 2018 increased $14.8 million as compared to 2017, and segment income margin increased to 6.9 percent from 4.9 percent over the same periods. The increase in segment income was primarily attributable to higher volumes and lower manufacturing costs, partially offset by costs associated with the start-up of the new manufacturing facility in Fort Smith, Arkansas.
Interest and Other Debt Expense. Interest and other debt expense before loss on early extinguishment of debt for 2018 was $116.3 million, an increase of $6.0 million as compared to $110.3 million for 2017 due primarily to higher weighted average outstanding borrowings largely as a result of borrowings for the acquisition of SDS and higher weighted average interest rates. Loss on early extinguishment of debt of $2.5 million in 2018 was the result of the redemption of all remaining outstanding 5% Notes in April 2018 and the amendment to our Credit Agreement in May 2018. Loss on early extinguishment of debt of $7.1 million in 2017 was a result of the prepayment of outstanding U.S. term loans and Euro term loans under our 2014 Credit Facility and the partial redemption of the 5% Notes in April 2017.
Provision for Income Taxes. The effective tax rate for 2018 was a provision of 23.6 percent as compared to a negative 12.5 percent for 2017. The effective tax rate for 2017 was favorably impacted by the benefit from effective tax rate adjustments totaling $110.9 million, primarily related to the revaluation of net deferred tax liabilities to reflect lower future cash tax obligations as a result of the reduction in the U.S. corporate income tax rate under the 2017 Tax Act. The effective tax rate in 2017, exclusive of these effective tax rate adjustments, would have been a provision of 33.8 percent.
CAPITAL RESOURCES AND LIQUIDITY
Our principal sources of liquidity have been net cash from operating activities and borrowings under our debt instruments, including our senior secured credit facility. Our liquidity requirements arise primarily from our obligations under the indebtedness incurred in connection with our acquisitions and the refinancing of that indebtedness, capital investment in new and existing equipment and the funding of our seasonal working capital needs.
On November 12, 2019, we issued $400 million aggregate principal amount of our 4 % Notes, and used the net proceeds therefrom to repay outstanding revolving loans under our Credit Agreement, including revolving loans used to redeem the 5½% Notes.
On August 1, 2019, we redeemed all $300 million aggregate principal amount of our outstanding 5½% Notes at a redemption price of 100 percent of their principal amount plus accrued and unpaid interest up to the redemption date. We funded this redemption with revolving loan borrowings under our Credit Agreement and cash on hand. As a result of this redemption, we recorded a pre-tax charge for the loss on early extinguishment of debt of $1.7 million in 2019 for the write-off of unamortized debt issuance costs.
On April 16, 2018, we redeemed all of our remaining outstanding 5% Notes ($280.0 million aggregate principal amount) at a redemption price of 100 percent of their principal amount plus accrued and unpaid interest up to the redemption date. We funded this redemption with revolving loan borrowings under our Credit Agreement and cash on hand. As a result of this redemption, we recorded a pre-tax charge for the loss on early extinguishment of debt of $1.4 million in 2018 for the write-off of unamortized debt issuance costs.
On March 24, 2017, we refinanced our 2014 Credit Facility and entered into our Credit Agreement, which extended the maturity dates of our senior secured credit facility, provides additional borrowing capacity for us and provides us with greater flexibility with regard to our strategic initiatives. On May 30, 2018, we amended our Credit Agreement to further extend maturity dates, lower the margin on borrowings thereunder and provide additional flexibility with regard to our strategic initiatives. Our Credit Agreement provides us with revolving loans, consisting of a multicurrency revolving loan facility of approximately $1.19 billion and a Canadian revolving loan facility of Cdn $15.0 million. Additionally, our Credit Agreement provided us with term loans, consisting of (i) U.S. $800 million of term loans designated U.S. A term loans, which were used to fund a portion of the purchase price for SDS and (ii) Cdn $45.5 million of term loans designated Canadian A term loans. On April 6, 2017, we funded the purchase price for SDS with term and revolving loan borrowings under our Credit Agreement totaling $1,023.8 million. As a result of entering into our Credit Agreement in 2017, we recorded a pre-tax charge for the loss on early extinguishment of debt of $0.6 million in 2017. As a result of the 2018 amendment to our Credit Agreement, we recorded a pre-tax charge for the loss on early extinguishment of debt of $1.1 million in 2018.
On February 13, 2017, we issued $300 million aggregate principal amount of the 4¾% Notes and €650 million aggregate principal amount of the 3¼% Notes. We used the net proceeds from the sale of the 4¾% Notes to

37
prepay $212.3 million of our outstanding U.S. term loans and repay a portion of our outstanding revolving loans under our 2014 Credit Facility. We used the net proceeds from the sale of the 3¼% Notes to prepay €187.0 million of Euro term loans under our 2014 Credit Facility, to repay the remaining outstanding revolving loans under our 2014 Credit Facility, to repay approximately €34.0 million of certain other foreign bank revolving and term loans of certain of our non U.S. subsidiaries and to redeem $220.0 million aggregate principal amount of the 5% Notes at a redemption price of 101.25 percent of their principal amount plus accrued and unpaid interest up to the redemption date. During the first quarter of 2017, we also prepaid $98.0 million of our outstanding U.S. term loans and Cdn $14.0 million of our outstanding Canadian term loans under our 2014 Credit Facility. As a result of the aggregate prepayments of our outstanding term loans under our 2014 Credit Facility and the partial redemption of the 5% Notes, we recorded a pre-tax charge for the loss on early extinguishment of debt of $6.5 million in 2017.
You should also read Notes 9 and 19 to our Consolidated Financial Statements for the year ended December 31, 2019 included elsewhere in this Annual Report with regard to our debt.
In 2019, we used cash provided by operating activities of $507.3 million and proceeds of $400.0 million from the issuance of the 4 % Notes to fund repayments of long-term debt of $359.4 million, net capital expenditures and other investing activities of $230.1 million, net repayments of revolving loans of $98.2 million, dividends paid on our common stock of $50.8 million, repurchases of our common stock of $27.6 million, decreases in outstanding checks of $4.7 million and debt issuance costs of $4.8 million and to increase cash and cash equivalents (including the negative effect of exchange rate changes of $0.7 million) by $131.0 million.
In 2018, we used cash provided by operating activities of $506.5 million and net borrowings of revolving loans of $52.3 million to fund repayments of long-term debt of $286.2 million, net capital expenditures and other investing activities of $189.9 million, dividends paid on our common stock of $44.5 million, repurchases of our common stock of $7.8 million, decreases in outstanding checks of $4.1 million and debt issuance costs of $3.3 million and to increase cash and cash equivalents (including the negative effect of exchange rate changes of $3.7 million) by $19.3 million.
In 2017, we used aggregate debt proceeds of $1,789.2 million primarily from the issuance of the 4¾% Notes and the 3¼% Notes and term loan borrowings under our Credit Agreement, cash provided by operating activities of $389.8 million and increases in outstanding checks of $8.8 million to fund the acquisition of SDS for $1,023.8 million, the repayment of long-term debt of $755.0 million, net capital expenditures and other investing activities of $173.8 million, the net repayment of revolving loans of $144.8 million, dividends paid on our common stock of $40.5 million, debt issuance costs of $17.0 million and repurchases of our common stock of $4.1 million and to increase cash and cash equivalents by $28.8 million.
At December 31, 2019, we had $2,258.9 million of total consolidated indebtedness and cash and cash equivalents on hand of $203.8 million. In addition, at December 31, 2019, we had outstanding letters of credit of $15.4 million and no outstanding revolving loan borrowings under our Credit Agreement.
Under our Credit Agreement, we have available to us $1.19 billion of revolving loans under a multicurrency revolving loan facility and Cdn $15.0 million under a Canadian revolving loan facility. Revolving loans under our Credit Agreement may be used for working capital and other general corporate purposes, including acquisitions, capital expenditures, dividends, stock repurchases and refinancing of other debt. Revolving loans may be borrowed, repaid and reborrowed under the revolving loan facilities from time to time until March 24, 2023. At December 31, 2019, after taking into account outstanding letters of credit of $15.4 million, borrowings available under the revolving loan facilities of our Credit Agreement were $1.17 billion and Cdn $15.0 million. Under our Credit Agreement, we also have available to us an uncommitted multicurrency incremental loan facility in an amount of up to an additional $1.25 billion (which amount may be increased as provided in our Credit Agreement), and we may incur additional indebtedness as permitted by our Credit Agreement and our other instruments governing our indebtedness. In conjunction with the Offer to purchase the Albéa Dispensing Business, we obtained the Committed Financing, and we expect to fund the purchase price for the proposed acquisition of the Albéa Dispensing Business from a combination of borrowings under our Credit Agreement, including the Committed Financing, and cash on hand. You should also read Notes 9 and 19 to our Consolidated Financial Statements for the year ended December 31, 2019 included elsewhere in this Annual Report.
On February 26, 2020, we issued (i) an additional $200 million aggregate principal amount of the 4 % Notes at 99.5 percent of their principal amount, plus accrued and unpaid interest from November 12, 2019, and (ii) €500 million aggregate principal amount of the 2¼% Notes at 100 percent of their principal amount. We used the net

38
proceeds from the sale of the additional 4 % Notes and the 2¼% Notes to prepay most of our outstanding U.S. A term loans under our Credit Agreement.
Because we sell metal containers and closures used in fruit and vegetable pack processing, we have seasonal sales. As is common in the packaging industry, we must utilize working capital to build inventory and then carry accounts receivable for some customers beyond the end of the packing season. Due to our seasonal requirements, which generally peak sometime in the summer or early fall, we may incur short-term indebtedness to finance our working capital requirements. Our peak seasonal working capital requirements have historically averaged approximately $350 million and were generally funded with revolving loans under our senior secured credit facility, other foreign bank loans and cash on hand. For 2019, we expect to fund our seasonal working capital requirements with cash on hand, revolving loans under our Credit Agreement and foreign bank loans. We may use the available portion of revolving loans under our Credit Agreement, after taking into account our seasonal needs and outstanding letters of credit, for other general corporate purposes, including acquisitions, capital expenditures, dividends, stock repurchases and refinancing and repayments of other debt.
We have entered into various supply chain financing arrangements with financial intermediaries pursuant to which (i) we sell receivables of certain customers without recourse to such financial intermediaries and pursuant to such arrangements accelerate payment in respect of such receivables sooner than provided in the applicable supply agreements with such customers and (ii) we have effectively extended our payment terms on certain of our payables. For 2019, as a result of such supply chain financing arrangements, we reduced our days sales outstanding by approximately nine days and extended our days purchases payable outstanding by approximately twenty-three days, effectively reducing our net working capital and our financing requirements for our working capital. If such supply chain financing arrangements ended, our net working capital would likely increase, and it would be necessary for us to finance such net working capital increase using cash on hand or revolving loans under our Credit Agreement or other indebtedness.
On December 22, 2017, the 2017 Tax Act was signed into law, making significant changes to the Internal Revenue Code. Changes include, but are not limited to, a federal corporate tax rate decrease from 35 percent to 21 percent for tax years beginning after December 31, 2017, the transition of U.S. international taxation from a worldwide to a territorial tax system and a one-time transition tax on the mandatory deemed repatriation of cumulative foreign earnings. As a result of the 2017 Tax Act, we revalued our net deferred tax liabilities at the lower corporate tax rate under the 2017 Tax Act and estimated, based on our understanding of the 2017 Tax Act, a significant reduction in our net deferred tax liabilities, effectively lowering our future cash tax obligations for deferred taxes. Accordingly, we recorded an income tax benefit of $110.9 million in the fourth quarter of 2017 primarily related to the revaluation of our net deferred tax liabilities to reflect lower future cash tax obligations as a result of the reduction in the federal corporate tax rate under the 2017 Tax Act.
On October 17, 2016, our Board of Directors authorized the repurchase by us of up to an aggregate of $300.0 million of our common stock by various means from time to time through and including December 31, 2021. Pursuant to this authorization, we repurchased an aggregate of 407,540 shares of our common stock in 2019 at an average price per share of $29.70, for a total purchase price of $12.1 million. In 2018 we repurchased a total of 188,300 shares of our common stock at an average price per share of $25.31, for a total purchase price of $4.8 million. In 2016, pursuant to this authorization and the remaining amount from a prior authorization, we repurchased a total of 294,930 shares of our common stock at an average price per share of $24.40, for a total purchase price of $7.2 million. Accordingly, at December 31, 2019, we had approximately $112.5 million remaining for the repurchase of our common stock under the October 17, 2016 Board of Directors authorization.
In addition to our operating cash needs and excluding any impact from acquisitions, (including the proposed acquisition of the Albéa Dispensing Business), we believe our cash requirements over the next few years will consist primarily of:
• capital expenditures of approximately $200 million in 2020, and thereafter annual capital expenditures of approximately $175 million to $200 million which may increase as a result of specific growth or specific cost savings projects;
• principal payments of bank term loans and revolving loans under our Credit Agreement and other outstanding debt agreements and obligations of $27.9 million in 2020, $3.3 million in 2021, $13.5 million in 2024, and $2,180.9 million thereafter, which amounts do not give effect to the issuance by us on February 26, 2020 of the additional 4 % Notes and the 2¼% Notes and the use of the net proceeds therefrom, except that the maturities of the U.S. A term loans under our Credit Agreement which were

39
prepaid with such net proceeds were extended for the purposes of this paragraph to 2028 to match the maturities of the additional 4 % Notes and the 2¼% Notes;
• cash payments for quarterly dividends on our common stock as approved by our Board of Directors;
• annual payments to satisfy employee withholding tax requirements resulting from certain restricted stock units becoming vested, which payments are dependent upon the price of our common stock at the time of vesting and the number of restricted stock units that vest, none of which is estimable at this time (payments in 2019 were not significant);
• our interest requirements, including interest on revolving loans (the principal amount of which will vary depending upon seasonal requirements) and term loans under our Credit Agreement, which bear fluctuating rates of interest, the 4¾% Notes, the 3¼% Notes, the 4 % Notes and the 2¼% Notes;
• payments of approximately $75 million to $95 million for federal, state and foreign tax liabilities in 2020, which may increase annually thereafter; and
• payments for pension benefit plan contributions, which are not expected to be significant based on the fact that our domestic pension plans were more than 100 percent funded at December 31, 2019.
We believe that cash generated from operations and funds from borrowings available under our Credit Agreement will be sufficient to meet our expected operating needs, planned capital expenditures, debt service requirements (both principal and interest), tax obligations, pension benefit plan contributions, share repurchases required under our Amended and Restated 2004 Stock Incentive Plan and common stock dividends for the foreseeable future. We continue to evaluate acquisition opportunities in the consumer goods packaging market and may incur additional indebtedness, including indebtedness under our Credit Agreement, to finance any such acquisition, including the proposed acquisition of the Albéa Dispensing Business.
Our Credit Agreement contains restrictive covenants that, among other things, limit our ability to incur debt, sell assets and engage in certain transactions. The indentures governing the 4¾% Notes and the 3¼% Notes, the 4 % Notes and the 2¼% Notes contain certain covenants that restrict our ability to create liens, engage in sale and leaseback transactions, issue guarantees and consolidate, merge or sell assets. We do not expect these limitations to have a material effect on our business or our results of operations. We are in compliance with all financial and operating covenants contained in our financing agreements and believe that we will continue to be in compliance during 2020 with all of these covenants.

40
CONTRACTUAL OBLIGATIONS
Our contractual cash obligations at December 31, 2019 are provided below and do not give effect to the issuance by us on February 26, 2020 of the additional 4 % Notes and the 2¼% Notes and the use of the net proceeds therefrom:
Payment due by period
TotalLess than
1 year1-3
years3-5
yearsMore than
5 years (Dollars in millions)
Long-term debt obligations(1) $ 2,225.6 $ 27.9 $ 3.3 $ 13.5 $ 2,180.9Interest on fixed rate debt(1) 331.3 54.6 109.0 108.9 58.8Interest on variable rate debt(1)(2) 209.3 28.8 54.9 47.4 78.2Operating lease obligations(3) 241.2 46.3 72.2 47.8 74.9Finance lease obligations(3) 38.9 3.3 6.1 29.5 —Purchase obligations(4) 34.0 34.0 — — —Other postretirement benefit obligations(5) 14.3 1.8 3.2 2.9 6.4Total(6) $ 3,094.6 $ 196.7 $ 248.7 $ 250.0 $ 2,399.2
______________________
(1) These amounts do not give effect to the issuance by us on February 26, 2020 of the additional 4 % Notes and the 2¼% Notes and the use of the net proceeds therefrom, except that the maturities of the U.S. A term loans under our Credit Agreement which were prepaid with such net proceeds were extended for purposes of the table above to match the maturities of the additional 4 % Notes and the 2¼% Notes. See "-Capital Resources and Liquidity."
(2) These amounts represent expected cash payments of interest on our variable rate long-term debt under our Credit Agreement, after taking into consideration our interest rate swap agreements, at prevailing interest rates and foreign currency exchange rates at December 31, 2019.
(3) Operating and finance lease obligations include imputed interest.(4) Purchase obligations represent commitments for capital expenditures of $34.0 million. Obligations that
are cancelable without penalty are excluded. (5) Other postretirement benefit obligations have been actuarially determined through the year 2029.(6) Based on current legislation and the current funded status of our domestic pension benefit plans, there
are no significant minimum required contributions to our pension benefit plans in 2020.
At December 31, 2019, we also had outstanding letters of credit of $15.4 million that were issued under our Credit Agreement.
You should also read Notes 9, 10, 11, 12 and 19 to our Consolidated Financial Statements for the year ended December 31, 2019 included elsewhere in this Annual Report.
OFF-BALANCE SHEET ARRANGEMENTS
We do not have any off-balance sheet arrangements.
EFFECT OF INFLATION AND INTEREST RATE FLUCTUATIONS
Historically, inflation has not had a material effect on us, other than to increase our cost of borrowing. In general, we have been able to increase the sales prices of our products to reflect any increases in the prices of raw materials (subject to contractual lag periods) and to significantly reduce the exposure of our results of operations to increases in other costs, such as labor and other manufacturing costs.
Because we have indebtedness which bears interest at floating rates, our financial results will be sensitive to changes in prevailing market rates of interest. As of December 31, 2019, we had $2,258.9 million of indebtedness outstanding, of which $792.6 million bore interest at floating rates. Historically, we have entered into interest rate swap agreements to mitigate the effect of interest rate fluctuations. During 2018, we entered into two U.S. dollar interest rate swap agreements, each for $50.0 million notional principal amount, that are effective in 2019 and mature in 2023. Depending upon future market conditions and our level of outstanding variable rate debt, we may

41
enter into additional interest rate swap or hedge agreements (with counterparties that, in our judgment, have sufficient creditworthiness) to hedge our exposure against interest rate volatility.
RATIONALIZATION CHARGES
In June 2019, we announced a footprint optimization plan for our metal container business, which included the closing of our metal container manufacturing facilities in Mt. Vernon, Missouri and Waupun, Wisconsin in the fourth quarter of 2019. These plant closings, in conjunction with the prior ratification of a new labor agreement at our Menomonee Falls, Wisconsin metal container manufacturing facility that provided for the withdrawal for that facility from the Central States, Southeast and Southwest Areas Pension Plan, or the Central States Pension Plan, will result in our complete withdrawal from the Central States Pension Plan. We estimate net rationalization charges for this plan of $3.7 million for the plant closings and $60.6 million for the withdrawal from the Central States Pension Plan. We recorded total rationalization charges for this plan of $46.2 million for the year ended December 31, 2019 largely to recognize the present value of the estimated withdrawal liability related to the Central States Pension Plan. Remaining expenses and cash expenditures for the plant closings are not expected to be significant. Remaining expenses for the accretion of interest for the withdrawal liability related to the Central States Pension Plan are expected to average approximately $1.1 million per year and be recognized annually for the next twenty years, and remaining cash expenditures for the withdrawal liability related to the Central States Pension Plan are expected to be approximately $3.1 million annually for the next twenty years, beginning in 2020. Although the annual payments for such withdrawal liability will be somewhat higher than our annual funding requirements to the Central States Pension Plan prior to our withdrawal, such increase will not be significant.
We continually evaluate cost reduction opportunities across each of our businesses, including rationalizations of our existing facilities through plant closings and downsizings. We use a disciplined approach to identify opportunities that generate attractive cash returns. Under our rationalization plans, we made cash payments of $8.7 million, $2.2 million and $3.6 million in 2019, 2018 and 2017, respectively. Exclusive of the footprint optimization plan for our metal container business and withdrawal from the Central States Pension Plan as discussed above, additional cash spending under our rationalization plans of approximately $4.1 million is expected through 2023. You should also read Note 4 to our Consolidated Financial Statements for the year ended December 31, 2019 included elsewhere in this Annual Report.
CRITICAL ACCOUNTING POLICIES
U.S. generally accepted accounting principles require estimates and assumptions that affect the reported amounts in our consolidated financial statements and the accompanying notes. Some of these estimates and assumptions require difficult, subjective and/or complex judgments. Critical accounting policies cover accounting matters that are inherently uncertain because the future resolution of such matters is unknown. We believe that our accounting policies for pension expense and obligations, rationalization charges, income taxes and acquisition reserves and testing goodwill and other intangible assets with indefinite lives for impairment reflect the more significant judgments and estimates in our consolidated financial statements. You should also read our Consolidated Financial Statements for the year ended December 31, 2019 and the accompanying notes included elsewhere in this Annual Report.
Our pension expense and obligations are developed from actuarial valuations. Two critical assumptions in determining pension expense and obligations are the discount rate and expected long-term return on plan assets. We evaluate these assumptions at least annually. Other assumptions reflect demographic factors such as retirement, mortality and turnover and are evaluated periodically and updated to reflect our actual experience. Actual results may differ from actuarial assumptions. The discount rate represents the market rate for non-callable high-quality fixed income investments and is used to calculate the present value of the expected future cash flows for benefit obligations under our pension benefit plans. A decrease in the discount rate increases the present value of benefit obligations and increases pension expense, while an increase in the discount rate decreases the present value of benefit obligations and decreases pension expense. A 25 basis point change in the discount rate would have a countervailing impact on our annual pension expense by approximately $2.4 million. For 2019, we decreased our domestic discount rate to 3.4 percent from 4.5 percent to reflect market interest rate conditions. We consider the current and expected asset allocations of our pension benefit plans, as well as historical and expected long-term rates of return on those types of plan assets, in determining the expected long-term rate of return on plan assets. A 25 basis point change in the expected long-term rate of return on plan assets would have a countervailing impact on our annual pension expense by approximately $2.2 million. Our expected long-term rate of return on plan assets will remain at 8.5 percent in 2020.

42
Historically, we have maintained a strategy of acquiring businesses and enhancing profitability through productivity and cost reduction opportunities. Acquisitions require us to estimate the fair value of the assets acquired and liabilities assumed in the transactions. These estimates of fair value are based on market participant perspectives when available and our business plans for the acquired entities, which include eliminating operating redundancies, facility closings and rationalizations and assumptions as to the ultimate resolution of liabilities assumed. We also continually evaluate the operating performance of our existing facilities and our business requirements and, when deemed appropriate, we exit or rationalize existing operating facilities. Establishing reserves for acquisition plans and facility rationalizations requires the use of estimates. Although we believe that these estimates accurately reflect the costs of these plans, actual costs incurred may differ from these estimates.
Goodwill and other intangible assets with indefinite lives are reviewed for impairment each year and more frequently if circumstances indicate a possible impairment. Our tests for goodwill impairment require us to make certain assumptions to determine the fair value of our reporting units. In 2019, we calculated the fair value of our reporting units using the market approach, which required us to estimate future expected earnings before interest, income taxes, depreciation and amortization, or EBITDA, and estimate EBITDA market multiples using publicly available information for each of our reporting units. Developing these assumptions requires the use of significant judgment and estimates. Actual results may differ from these forecasts. If an impairment were to be identified, it could result in additional expense recorded in our consolidated statements of income.
On December 22, 2017, the 2017 Tax Act was signed into law, making significant changes to the Internal Revenue Code. Changes include, but are not limited to, a federal corporate tax rate decrease from 35 percent to 21 percent for tax years beginning after December 31, 2017, the transition of U.S international taxation from a worldwide to a territorial tax system and a one-time transition tax on the mandatory deemed repatriation of cumulative foreign earnings. We estimated our provision for income taxes for 2017 in accordance with the 2017 Tax Act and guidance available at the time and recorded $110.9 million as an additional income tax benefit in the fourth quarter of 2017. This provisional amount was primarily related to the remeasurement of net deferred tax liabilities to reflect lower future cash tax obligations as a result of the reduction in the federal corporate tax rate under the 2017 Tax Act.
On December 22, 2017, Staff Accounting Bulletin No. 118, or SAB 118, was issued by the staff of the SEC to address the application of U.S. generally accepted accounting principles in situations when a registrant does not have the necessary information available, prepared or analyzed (including computations) in reasonable detail to complete the accounting for certain income tax effects of the 2017 Tax Act. In accordance with SAB 118, we had determined that the $110.9 million deferred tax benefit recorded in the fourth quarter of 2017 primarily in connection with the remeasurement of net deferred tax liabilities and the computation of no tax expense to be recorded in connection with the transition tax on the mandatory deemed repatriation of cumulative foreign earnings were provisional amounts and a reasonable estimate at December 31, 2017.
As of December 31, 2018, we completed our accounting for all of the enactment date income tax effects of the 2017 Tax Act. During 2018, we recognized insignificant adjustments to the provisional amounts recorded at December 31, 2017 and included these adjustments as a component of income tax expense. The final amount of the income tax benefit from the enactment of the 2017 Tax Act was $111.6 million, which related primarily to the remeasurement of deferred tax assets and liabilities. We did not incur any income tax expense due to the one-time transition tax on the mandatory deemed repatriation of cumulative foreign earnings.
NEW ACCOUNTING PRONOUNCEMENTS
In June 2016, the Financial Accounting Standards Board, or the FASB, issued an accounting standards update, or ASU, that amends the guidance on the accounting for credit losses on financial instruments. This new standard introduces an approach, based on expected losses, to estimate credit losses on certain types of financial instruments. The new approach to estimating credit losses (referred to as the current expected credit losses model) applies to most financial assets measured at amortized cost and certain other instruments, including trade and other receivables. This new standard is effective for the Company on January 1, 2020. We do not expect that this new standard will have a material impact on our financial position, results of operations or cash flows.
FORWARD-LOOKING STATEMENTS
The statements we have made in “Risk Factors” and “Management’s Discussion and Analysis of Results of Operations and Financial Condition” and elsewhere in this Annual Report which are not historical facts are “forward-looking statements” made pursuant to the safe harbor provisions of the Private Securities Litigation Reform Act of

43
1995 and the Securities Exchange Act of 1934, as amended, or the Exchange Act. These forward-looking statements are made based upon management’s expectations and beliefs concerning future events impacting us and therefore involve a number of uncertainties and risks. Therefore, the actual results of our operations or our financial condition could differ materially from those expressed or implied in these forward-looking statements.
The discussion in our “Risk Factors” and our “Management’s Discussion and Analysis of Results of Operations and Financial Condition” sections highlight some of the more important risks identified by our management, but should not be assumed to be the only factors that could affect future performance. Other factors that could cause the actual results of our operations or our financial condition to differ from those expressed or implied in these forward-looking statements include, but are not necessarily limited to, our ability to satisfy our obligations under our contracts; the impact of customer claims and disputes; compliance by our suppliers with the terms of our arrangements with them; changes in consumer preferences for different packaging products; changes in general economic conditions; the idling or loss of one or more of our significant manufacturing facilities; our ability to finance any increase in our net working capital in the event that our supply chain financing arrangements end; the adoption of, or changes in, new accounting standards or interpretations; changes in tax rates in any jurisdiction where we conduct business; and other factors described elsewhere in this Annual Report or in our other filings with the SEC.
Except to the extent required by the federal securities laws, we undertake no obligation to update or revise any forward-looking statements, whether as a result of new information, future events or otherwise. The foregoing review of factors pursuant to the Private Securities Litigation Reform Act of 1995 should not be construed as exhaustive or as any admission regarding the adequacy of our disclosures. Certain risk factors are detailed from time to time in our various public filings. You are advised, however, to consult any further disclosures we make on related subjects in our filings with the SEC.
You can identify forward-looking statements by the fact that they do not relate strictly to historic or current facts. Forward-looking statements use terms such as “anticipates,” “believes,” “continues,” “could,” “estimates,” “expects,” “intends,” “may,” “plans,” “potential,” “predicts,” “will,” “should,” “seeks,” “pro forma” or similar expressions in connection with any disclosure of future operating or financial performance. These statements are only predictions and involve known and unknown risks, uncertainties and other factors, including the risks described under “Risk Factors,” that may cause our actual results of operations, financial condition, levels of activity, performance or achievements to be materially different from any future results of operations, financial condition, levels of activity, performance or achievements expressed or implied by such forward-looking statements. You should not place undue reliance on these forward-looking statements.
ITEM 7A. QUANTITATIVE AND QUALITATIVE DISCLOSURES ABOUT MARKET RISK.
Market risks relating to our operations result primarily from changes in interest rates and, with respect to our international metal container and closures operations and our Canadian plastic container operations, from foreign currency exchange rates. In the normal course of business, we also have risk related to commodity price changes for items such as natural gas. We employ established policies and procedures to manage our exposure to these risks. Interest rate, foreign currency and commodity pricing transactions are used only to the extent considered necessary to meet our objectives. We do not utilize derivative financial instruments for trading or other speculative purposes.
INTEREST RATE RISK
Our interest rate risk management objective is to limit the impact of interest rate changes on our net income and cash flow. To achieve our objective, we regularly evaluate the amount of our variable rate debt as a percentage of our aggregate debt. During 2019, our average outstanding variable rate debt, after taking into account the average outstanding notional amount of our interest rate swap agreements, was 50 percent of our average outstanding total debt. At December 31, 2019, our outstanding variable rate debt, after taking into account interest rate swap agreements, was approximately 31 percent of our outstanding total debt. Over the course of the year, we also borrow revolving loans under our revolving loan facilities which bear interest at variable rates to fund our seasonal working capital needs. From time to time, we manage a portion of our exposure to interest rate fluctuations in our variable rate debt through interest rate swap agreements. During 2018, we entered into two U.S. dollar interest rate swap agreements, each for $50.0 million notional principal amount, that became effective in 2019 and mature in 2023. These agreements effectively convert interest rate exposure from variable rates to fixed rates of interest. We entered into these agreements with banks under our Credit Agreement, and our obligations under these agreements were guaranteed and secured on a pari passu basis with our obligations under our Credit Agreement. Depending upon future market conditions and our level of outstanding variable rate debt, we may enter

44
into additional interest rate swap or hedge agreements (with counterparties that, in our judgment, have sufficient creditworthiness) to hedge our exposure against interest rate volatility. You should also read Notes 9, 10 and 19 to our Consolidated Financial Statements for the year ended December 31, 2019 included elsewhere in this Annual Report.
Based on the average outstanding amount of our variable rate indebtedness in 2019, a one percentage point change in the interest rates for our variable rate indebtedness would have impacted our 2019 interest expense by an aggregate of approximately $13.1 million, after taking into account the average outstanding notional amount of our interest rate swap agreements during 2019.
FOREIGN CURRENCY EXCHANGE RATE RISK
Currently, we conduct a portion of our manufacturing and sales activity outside the United States, primarily in Europe. In an effort to minimize foreign currency exchange risk, we have financed our acquisitions of our European operations primarily with borrowings denominated in Euros. We also have operations in Canada, Mexico, Asia and South America that are not considered significant to our consolidated financial statements. Where available, we have borrowed funds in local currency or implemented certain internal hedging strategies to minimize our foreign currency risk related to foreign operations. In addition, we are exposed to gains and losses from limited transactions of our operations denominated in a currency other than the functional currency of such operations. We are also exposed to possible losses in the event of a currency devaluation in any of the foreign countries where we have operations. We generally do not utilize external derivative financial instruments to manage our foreign currency risk. You should also read Note 10 to our Consolidated Financial Statements for the year ended December 31, 2019 included elsewhere in this Annual Report.
COMMODITY PRICING RISK
We purchase raw materials for our products such as metal and resins. These raw materials are generally purchased pursuant to contracts or at market prices established with the vendor. In general, we do not engage in hedging activities for these raw materials due to our ability to pass on price changes to our customers.
We also purchase commodities, such as natural gas and electricity, and are subject to risks on the pricing of these commodities. In general, we purchase these commodities pursuant to contracts or at market prices. We manage a portion of our exposure to natural gas price fluctuations through natural gas swap agreements. These agreements effectively convert pricing exposure for natural gas from market pricing to a fixed price. The total fair value of our natural gas swap agreements in effect at December 31, 2019 and 2018 and during such years was not significant. You should also read Note 10 to our Consolidated Financial Statements for the year ended December 31, 2019 included elsewhere in this Annual Report.

45
ITEM 8. FINANCIAL STATEMENTS AND SUPPLEMENTARY DATA.
We refer you to Item 15, “Exhibits and Financial Statement Schedules,” below for a listing of financial statements and schedules included in this Annual Report, which are incorporated here in this Annual Report by this reference.
ITEM 9. CHANGES IN AND DISAGREEMENTS WITH ACCOUNTANTS ON ACCOUNTING AND FINANCIAL DISCLOSURE.
Not applicable.
ITEM 9A. CONTROLS AND PROCEDURES.
DISCLOSURE CONTROLS AND PROCEDURES
As required by Rule 13a-15(e) of the Exchange Act, we carried out an evaluation, under the supervision and with the participation of management, including our Chief Executive Officer and Chief Financial Officer, of the effectiveness of our disclosure controls and procedures. Based upon that evaluation, as of the end of the period covered by this Annual Report, our Chief Executive Officer and Chief Financial Officer concluded that the disclosure controls and procedures were effective to ensure that information required to be disclosed by us in the reports that we file or submit under the Exchange Act is recorded, processed, summarized and reported, within the time periods specified in the SEC’s rules and forms, and that our disclosure controls and procedures include, without limitation, controls and procedures designed to ensure that information required to be disclosed by us in the reports we file or submit under the Exchange Act is accumulated and communicated to our management, including the Principal Executive Officer and the Principal Financial Officer, or persons performing similar functions, as appropriate to allow timely decisions regarding required disclosure.
There were no changes in our internal controls over financial reporting during the period covered by this Annual Report that have materially affected, or are reasonably likely to materially affect, these internal controls.
MANAGEMENT’S REPORT ON INTERNAL CONTROL OVER FINANCIAL REPORTING
Our management is responsible for establishing and maintaining adequate internal control over financial reporting. Our internal control over financial reporting is designed to provide reasonable assurance regarding the reliability of financial reporting and the preparation of financial statements in accordance with generally accepted accounting principles. Because of inherent limitations, internal control over financial reporting may not prevent or detect misstatements.
Management assessed the effectiveness of our internal control over financial reporting as of December 31, 2019. In making this assessment, management used the criteria set forth by the Committee of Sponsoring Organizations of the Treadway Commission (COSO) in Internal Control—Integrated Framework (2013 Framework). Based on this assessment and those criteria, management believes that we maintained effective internal control over financial reporting as of December 31, 2019.
The effectiveness of our internal control over financial reporting as of December 31, 2019 has been audited by Ernst & Young LLP, our independent registered public accounting firm, and Ernst & Young LLP has issued an attestation report on our internal control over financial reporting which is provided below.
46
REPORT OF INDEPENDENT REGISTERED PUBLIC ACCOUNTING FIRM
TO THE BOARD OF DIRECTORS AND STOCKHOLDERS OF SILGAN HOLDINGS INC.OPINION ON INTERNAL CONTROL OVER FINANCIAL REPORTING
We have audited Silgan Holdings Inc.’s internal control over financial reporting as of December 31, 2019, based on criteria established in Internal Control—Integrated Framework issued by the Committee of Sponsoring Organizations of the Treadway Commission (2013 framework) (the COSO criteria). In our opinion, Silgan Holdings Inc. (the Company) maintained, in all material respects, effective internal control over financial reporting as of December 31, 2019, based on the COSO criteria.
We have also audited, in accordance with the standards of the Public Company Accounting Oversight Board (United States) (PCAOB), the 2019 consolidated financial statements of the Company and our report dated March 2, 2020 expressed an unqualified opinion thereon.
BASIS FOR OPINION
The Company's management is responsible for maintaining effective internal control over financial reporting and for its assessment of the effectiveness of internal control over financial reporting included in the accompanying Management's Report on Internal Control Over Financial Reporting. Our responsibility is to express an opinion on the Company's internal control over financial reporting based on our audit. We are a public accounting firm registered with the PCAOB and are required to be independent with respect to the Company in accordance with the U.S. federal securities laws and the applicable rules and regulations of the Securities and Exchange Commission and the PCAOB.
We conducted our audit in accordance with the standards of the PCAOB. Those standards require that we plan and perform the audit to obtain reasonable assurance about whether effective internal control over financial reporting was maintained in all material respects.
Our audit included obtaining an understanding of internal control over financial reporting, assessing the risk that a material weakness exists, testing and evaluating the design and operating effectiveness of internal control based on the assessed risk, and performing such other procedures as we considered necessary in the circumstances. We believe that our audit provides a reasonable basis for our opinion.
DEFINITION AND LIMITATIONS OF INTERNAL CONTROL OVER FINANCIAL REPORTING
A company’s internal control over financial reporting is a process designed to provide reasonable assurance regarding the reliability of financial reporting and the preparation of consolidated financial statements for external purposes in accordance with generally accepted accounting principles. A company’s internal control over financial reporting includes those policies and procedures that (1) pertain to the maintenance of records that, in reasonable detail, accurately and fairly reflect the transactions and dispositions of the assets of the company; (2) provide reasonable assurance that transactions are recorded as necessary to permit preparation of consolidated financial statements in accordance with generally accepted accounting principles, and that receipts and expenditures of the company are being made only in accordance with authorizations of management and directors of the company; and (3) provide reasonable assurance regarding prevention or timely detection of unauthorized acquisition, use, or disposition of the company’s assets that could have a material effect on the consolidated financial statements.
Because of its inherent limitations, internal control over financial reporting may not prevent or detect misstatements. Also, projections of any evaluation of effectiveness to future periods are subject to the risk that controls may become inadequate because of changes in conditions, or that the degree of compliance with the policies or procedures may deteriorate.
/s/ Ernst & Young LLPStamford, ConnecticutMarch 2, 2020
ITEM 9B. OTHER INFORMATION.
None.

47
PART III
ITEM 10. DIRECTORS, EXECUTIVE OFFICERS AND CORPORATE GOVERNANCE.
The information with respect to directors, executive officers and corporate governance required by this Item is incorporated here in this Annual Report by reference to our Proxy Statement, to be filed with the SEC within 120 days after the end of the fiscal year covered by this Annual Report, for our annual meeting of stockholders to be held in 2020.
ITEM 11. EXECUTIVE COMPENSATION.
The information with respect to executive compensation required by this Item is incorporated here in this Annual Report by reference to our Proxy Statement, to be filed with the SEC within 120 days after the end of the fiscal year covered by this Annual Report, for our annual meeting of stockholders to be held in 2020.
ITEM 12. SECURITY OWNERSHIP OF CERTAIN BENEFICIAL OWNERS AND MANAGEMENT AND RELATED STOCKHOLDER MATTERS.
The information with respect to security ownership of certain beneficial owners and management and related stockholder matters required by this Item is incorporated here in this Annual Report by reference to our Proxy Statement, to be filed with the SEC within 120 days after the end of the fiscal year covered by this Annual Report, for our annual meeting of stockholders to be held in 2020.
ITEM 13. CERTAIN RELATIONSHIPS AND RELATED TRANSACTIONS, AND DIRECTOR INDEPENDENCE.
The information with respect to certain relationships and related transactions, and director independence required by this Item is incorporated here in this Annual Report by reference to our Proxy Statement, to be filed with the SEC within 120 days after the end of the fiscal year covered by this Annual Report, for our annual meeting of stockholders to be held in 2020.
ITEM 14. PRINCIPAL ACCOUNTING FEES AND SERVICES.
The information with respect to principal accountant fees and services required by this Item is incorporated here in this Annual Report by reference to our Proxy Statement, to be filed with the SEC within 120 days after the end of the fiscal year covered by this Annual Report, for our annual meeting of stockholders to be held in 2020.

48
PART IV
ITEM 15. EXHIBITS AND FINANCIAL STATEMENT SCHEDULES.
FINANCIAL STATEMENTS:
Report of Independent Registered Public Accounting Firm
Consolidated Balance Sheets at December 31, 2019 and 2018
Consolidated Statements of Income for the years ended December 31, 2019, 2018 and 2017
Consolidated Statements of Comprehensive Income for the years ended December 31, 2019,2018 and 2017
Consolidated Statements of Stockholders’ Equity for the years ended December 31, 2019,2018 and 2017
Consolidated Statements of Cash Flows for the years ended December 31, 2019, 2018 and 2017
Notes to Consolidated Financial Statements
SCHEDULE:
II. Valuation and Qualifying Accounts for the years ended December 31, 2019, 2018 and 2017
All other financial statement schedules not listed have been omitted because they are not applicable or not required, or because the required information is included in the consolidated financial statements or notes thereto.
F-1
F-3
F-4
F-5
F-6
F-7
F-8
F-41

49
EXHIBITS:
ExhibitNumber Description
2.1 Offer, dated January 27, 2020 by and between Silgan Holdings Inc., on behalf of itself and certain subsidiaries listed therein, and Twist Beauty Packaging, S.A.S., on behalf of itself and certain subsidiaries listed therein. (incorporated by reference to Exhibit 2.1 filed with our Current Report on Form 8-K, dated January 27, 2020, Commission File No. 000-22117)
3.1
Amended and Restated Certificate of Incorporation of Silgan Holdings Inc. (incorporated by reference to Exhibit 3.1 filed with our Current Report on Form 8-K, dated June 13, 2006, Commission File No. 000-22117).
3.2
Amendment to the Amended and Restated Certificate of Incorporation of Silgan Holdings Inc. to amend the stockholder voting standard (incorporated by reference to Exhibit 3.1 filed with our Current Report on Form 8-K, dated June 11, 2010, Commission File No. 000-22117).
3.3
Amendment to the Amended and Restated Certificate of Incorporation of Silgan Holdings Inc. to increase the number of authorized shares of our common stock (incorporated by reference to Exhibit 3.2 filed with our Current Report on Form 8-K, dated June 11, 2010, Commission File No. 000-22117).
3.4 Amendment to the Amended and Restated Certificate of Incorporation of Silgan Holdings Inc. to permit an increase in the size of the Board of Directors for a period of time, to increase the number of authorized shares of our common stock and to make an immaterial administrative change (incorporated by reference to Exhibit 3.1 filed with our Current Report on Form 8-K, dated June 15, 2018, Commission File No. 000-22117).
3.5
Amended and Restated By-laws of Silgan Holdings Inc. (incorporated by reference to Exhibit 3.2 filed with our Current Report on Form 8-K, dated June 13, 2006, Commission File No. 000-22117).
3.6
First Amendment to Amended and Restated By-laws of Silgan Holdings Inc. (incorporated by reference to Exhibit 3.3 filed with our Annual Report on Form 10-K for the year ended December 31, 2007, Commission File No. 000-22117).
4.1 Indenture, dated as of February 13, 2017, with respect to the 4¾% Senior Notes due 2025 and the 3¼% Senior Notes due 2025, by and among Silgan Holdings Inc., U.S. Bank National Association, as trustee, Elavon Financial Services DAC, UK Branch, as paying agent in respect of the 3¼% Senior Notes due 2025, and Elavon Financial Services DAC, as registrar and transfer agent in respect of the 3¼% Senior Notes due 2025 (incorporated by reference to Exhibit 4.1 filed with our Current Report on Form 8-K, dated February 17, 2017, Commission File No. 000-22117).
4.2 Form of Silgan Holdings Inc. 4¾% Senior Note due 2025 (incorporated by reference to Exhibit 4.2 filed with our Current Report on Form 8-K, dated February 17, 2017, Commission File No. 000-22117).
4.3 Form of Silgan Holdings Inc. 3¼% Senior Note due 2025 (incorporated by reference to Exhibit 4.3 filed with our Current Report on Form 8-K, dated February 17, 2017, Commission File No. 000-22117).
4.4and among Silgan Holdings Inc. and U.S. Bank National Association, as trustee (incorporated byreference to Exhibit 4.1 filed with our Current Report on Form 8-K, dated November 12, 2019,Commission File No. 000-22117).
4.54.2 filed with our Current Report on Form 8-K, dated November 12, 2019, Commission File No.000-22117).

50
ExhibitNumber Description
4.6 Registration Rights Agreement, dated November 12, 2019, among Silgan Holdings Inc., BofA Securities, Inc., Wells Fargo Securities, LLC, Mizuho Securities USA LLC, HSBC Securities (USA) Inc., J.P. Morgan Securities LLC, SMBC Nikko Securities America, Inc., Rabo Securities USA, Inc., TD Securities (USA) LLC, Capital One Securities, Inc., BMO Capital Markets Corp., CIBC World Markets Corp., UniCredit Capital Markets LLC, PNC Capital Markets LLC, MUFG Securities Americas Inc. and Scotia Capital (USA) Inc. (incorporated by reference to Exhibit 4.3 filed with our Current Report on Form 8-K, dated November 12, 2019, Commission File No. 000-22117)
4.7due 2028, by and among Silgan Holdings Inc. and U.S. Bank National Association, as trustee(incorporated by reference to Exhibit 4.3 filed with our Current Report on Form 8-K, datedFebruary 26, 2020, Commission File No. 000-22117).
4.8 Indenture, dated as of February 26, 2020, with respect to the 2¼% Senior Notes due 2028, by and among Silgan Holdings Inc., U.S. Bank National Association, as trustee, Elavon Financial Services DAC, UK Branch, as paying agent in respect of the 2¼% Senior Notes due 2028, and Elavon Financial Services DAC, as registrar and transfer agent in respect of the 2¼% Senior Notes due 2028 (incorporated by reference to Exhibit 4.4 filed with our Current Report on Form 8-K, dated February 26, 2020, Commission File No. 000-22117).
4.9 Form of Silgan Holdings Inc. 2¼% Senior Note due 2028 (incorporated by reference to Exhibit 4.5 filed with our Current Report on Form 8-K, dated February 26, 2020, Commission File No. 000-22117).
4.10 Registration Rights Agreement, dated February 26, 2020, among Silgan Holdings Inc., BofA Securities, Inc., as representative of the Dollar Initial Purchasers, and Merrill Lynch International, Wells Fargo Securities International Limited, Mizuho International plc, J.P. Morgan Securities plc, SMBC Nikko Capital Markets Limited, Goldman Sachs & Co. LLC, Coöperatieve Rabobank U.A., TD Securities (USA) LLC, BMO Capital Markets Corp., Capital One Securities, Inc., MUFG Securities EMEA plc, UniCredit Bank AG, CIBC World Markets Corp., PNC Capital Markets LLC, DZ Financial Markets LLC and Raiffeisen Bank International AG as Euro Initial Purchasers (incorporated by reference to Exhibit 4.6 filed with our Current Report on Form 8-K, dated February 26, 2020, Commission File No. 000-22117)
*4.11 Description of Securities
10.1
Amended and Restated Stockholders Agreement, dated as of November 6, 2001, among R. Philip Silver, D. Greg Horrigan and Silgan Holdings Inc. (incorporated by reference to Exhibit 10.1 filed with our Annual Report on Form 10-K for the year ended December 31, 2001, Commission File No. 000-22117).
10.2 Amended and Restated Credit Agreement, dated as of March 24, 2017, among Silgan Holdings Inc., Silgan Containers LLC, Silgan Plastics LLC, Silgan Containers Manufacturing Corporation, Silgan Plastics Canada Inc., Silgan Holdings B.V., Silgan International Holdings B.V., each other revolving borrower party thereto from time to time, each other incremental term loan borrower party thereto from time to time, various lenders party thereto from time to time, Wells Fargo Bank, National Association, as Administrative Agent, Bank of America, N.A., Goldman Sachs Bank USA, HSBC Bank USA, National Association, Mizuho Bank, Ltd. and Coöperatieve Rabobank U.A., New York Branch, as Co-Syndication Agents, The Bank of Nova Scotia, Sumitomo Mitsui Banking Corporation, The Bank of Tokyo-Mitsubishi UFJ, Ltd., TD Bank, N.A. and CoBank, ACB, as Co-Documentation Agents, and Wells Fargo Securities, LLC, Merrill Lynch, Pierce, Fenner & Smith Incorporated, Goldman Sachs Bank USA, HSBC Bank USA, National Association, Mizuho Bank, Ltd. and Coöperatieve Rabobank U.A., New York Branch, as Joint Lead Arrangers and Joint Bookrunners (incorporated by reference to Exhibit 10.1 filed with our Current Report on Form 8-K, dated March 30, 2017, Commission File No. 000-22117).
10.3 First Amendment to Amended and Restated Credit Agreement, dated as of May 30, 2018, among Silgan Holdings Inc., Silgan Containers LLC, Silgan Plastics LLC, Silgan Containers Manufacturing Corporation, Silgan Plastics Canada Inc., Silgan Holdings B.V., Silgan International Holdings B.V., the other Guarantors party thereto, the Lenders party thereto and Wells Fargo Bank, National Association, as Administrative Agent (incorporated by reference to Exhibit 10.1 filed with our Current Report on Form 8-K, dated June 5, 2018, Commission File No. 000-22117).
+10.4
Employment Agreement, dated April 12, 2004, between Silgan Holdings Inc. and Anthony J. Allott (incorporated by reference to Exhibit 10 filed with our Quarterly Report on Form 10-Q for the quarterly period ended March 31, 2004, Commission File No. 000-22117).

51
ExhibitNumber
Description
+10.5
Employment Agreement, dated June 30, 2004, between Silgan Holdings Inc. and Robert B. Lewis (incorporated by reference to Exhibit 10.12 filed with our Annual Report on Form 10-K for the year ended December 31, 2004, Commission File No. 000-22117).
+10.6
Employment Agreement, dated October 1, 2007, between Silgan Holdings Inc. and Adam J. Greenlee (incorporated by reference to Exhibit 10.1 filed with our Quarterly Report on Form 10-Q for the quarterly period ended March 31, 2009, Commission File No. 000-22117).
+10.7
Officer Agreement, dated October 1, 2007, between Silgan Holdings Inc. and Adam J. Greenlee (incorporated by reference to Exhibit 10.2 filed with our Quarterly Report on Form 10-Q for the quarterly period ended March 31, 2009, Commission File No. 000-22117).
+10.8
Silgan Holdings Inc. Senior Executive Performance Plan (incorporated by reference to Exhibit 10.19 filed with our Annual Report on Form 10-K for the year ended December 31, 2003, Commission File No. 000-22117).
+10.9 Amendment to Silgan Holdings Inc. Senior Executive Performance Plan (incorporated by reference to Exhibit 10.24 filed with our Annual Report on Form 10-K for the year ended December 31, 2006, Commission File No. 000-22117).
+10.10 Silgan Holdings Inc. Amended and Restated 2004 Stock Incentive Plan (incorporated by reference to Appendix A of our Definitive Proxy Statement on Schedule 14A, dated April 21, 2015, Commission File No. 000-22117).
+10.11 Amendment to the Silgan Holdings Inc. Amended and Restated 2004 Stock Incentive Plan (incorporated by reference to Exhibit 10.1 filed with our Quarterly Report on Form 10-Q for the quarterly period ended June 30, 2019, Commission File No. 000-22117).
+10.12 Form of Option Agreement (Employee) under the Silgan Holdings Inc. Amended and Restated 2004 Stock Incentive Plan (incorporated by reference to Exhibit 10.23 filed with our Annual Report on Form 10-K for the year ended December 31, 2004, Commission File No. 000-22117).
+10.13 Form of Restricted Stock Unit Agreement (Employee) under the Silgan Holdings Inc. Amended and Restated 2004 Stock Incentive Plan (incorporated by reference to Exhibit 10.28 filed with our Annual Report on Form 10-K for the year ended December 31, 2006, Commission File No. 000-22117).
+10.14 Form of Restricted Stock Unit Agreement (Director) under the Silgan Holdings Inc. Amended and Restated 2004 Stock Incentive Plan (incorporated by reference to Exhibit 10.22 filed with our Annual Report on Form 10-K for the year ended December 31, 2011, Commission File No. 000-22117).
+10.15 Silgan Containers Corporation Supplemental Executive Retirement Plan, as amended (incorporated by reference to Exhibit 10.4 filed with our Quarterly Report on Form 10-Q for the quarterly period ended March 31, 2009, Commission File No. 000-22117).
+10.16 First Amendment to Silgan Containers Corporation Supplemental Executive Retirement Plan (incorporated by reference to Exhibit 10.27 filed with our Annual Report on Form 10-K for the year ended December 31, 2010, Commission File No. 000-22117).
+10.17 Second Amendment to Silgan Containers Supplemental Executive Retirement Plan (incorporated by reference to Exhibit 10.28 filed with our Annual Report on Form 10-K for the year ended December 31, 2010, Commission File No. 000-22117).
+10.18 Third Amendment to Silgan Containers Supplemental Executive Retirement Plan (incorporated by reference to Exhibit 10.26 filed with our Annual Report on Form 10-K for the year ended December 31, 2011, Commission File No. 000-22117).

52
ExhibitNumber
Description
+10.19 Form of Indemnification Agreement for Directors and Executive Officers (incorporated by reference to Exhibit 10.1 to our Quarterly Report on Form 10-Q for the quarterly period ended September 30, 2012, Commission File No. 000-22117).
10.20 Purchase Agreement dated as of January 23, 2017 by and among Silgan Holdings LLC, Silgan White Cap Holdings Spain, S.L., Silgan Holdings B.V., WestRock MWV, LLC, solely for purposes of Sections 4.19 and 9.2 and Article 11, WestRock Company, and, solely for purposes of Sections 4.8, 4.19 and 9.1 and ARTICLE 11, Silgan Holdings Inc. (incorporated by reference to Exhibit 2.1 filed with our Current Report on Form 8-K, dated January 27, 2017, Commission File No. 000-22117).
10.21 Purchase Agreement dated November 4, 2019 among Silgan Holdings Inc. and BofA Securities, Inc., as the representative of the Initial Purchasers named therein (incorporated by reference to Exhibit 10,1 filed with our Current Report on Form 8-K, dated November 4, 2019, Commission File No. 000-22117)
10.22 Purchase Agreement dated February 19, 2020 among Silgan Holdings Inc. and BofA Securities, Inc. and Merrill Lynch International, on behalf of themselves and as representatives of the Initial Purchasers named therein (incorporated by reference to Exhibit 10.1 filed with our Current Report on Form 8-K, dated February 20, 2020, Commission File No. 000-22117)
14 Code of Ethics applicable to Silgan Holdings’ principal executive officer(s), principal financial officer, principal accounting officer or controller or persons performing similar functions (incorporated by reference to Exhibit 14 filed with our Annual Report on Form 10-K for the year ended December 31, 2003, Commission File No. 000-22117).
*21 Subsidiaries of the Registrant.
*23 Consent of Ernst & Young LLP.
*31.1 Certification by the Chief Executive Officer pursuant to Section 302 of the Sarbanes-Oxley Act.*31.2 Certification by the Chief Financial Officer pursuant to Section 302 of the Sarbanes-Oxley Act.
*32.1 Certification by the Chief Executive Officer pursuant to Section 906 of the Sarbanes-Oxley Act.
*32.2 Certification by the Chief Financial Officer pursuant to Section 906 of the Sarbanes-Oxley Act.
*101.INS Inline XBRL Instance Document - the instance document does not appear in the Interactive DataFile because its XBRL tags are embedded within the Inline XBRL document.
*101.SCH Inline XBRL Taxonomy Extension Schema Document.
*101.CAL Inline XBRL Taxonomy Extension Calculation Linkbase Document.
*101.DEF Inline XBRL Taxonomy Extension Definition Linkbase Document.
*101.LAB Inline XBRL Taxonomy Extension Label Linkbase Document.
*101.PRE Inline XBRL Taxonomy Extension Presentation Linkbase Document.
*104 Cover Page Interactive Data File (formatted as inline XBRL and contained in Exhibit 101).
___________________ *Filed herewith.+ Management contract or compensatory plan or arrangement.
ITEM 16. FORM 10-K SUMMARY.
None.

53
SIGNATURES
Pursuant to the requirements of Section 13 or 15(d) of the Securities Exchange Act of 1934, the Registrant has duly caused this report to be signed on its behalf by the undersigned, thereunto duly authorized.
SILGAN HOLDINGS INC.
Date: March 2, 2020 By: /s/ Anthony J. Allott Anthony J. Allott Chairman of the Board and
Chief Executive Officer

54
Pursuant to the requirements of the Securities Exchange Act of 1934, this report has been signed below by the following persons on behalf of the Registrant and in the capacities and on the dates indicated.
Signature Title Date
/s/ Anthony J. Allott Chairman of the Board and March 2, 2020(Anthony J. Allott) Chief Executive Officer
(Principal Executive Officer)
/s/ Leigh J. Abramson Director March 2, 2020(Leigh J. Abramson)
/s/ John W. Alden Director March 2, 2020(John W. Alden)
/s/ William T. Donovan Director March 2, 2020(William T. Donovan)
/s/ Kimberly A. Fields Director March 2, 2020(Kimberly A. Fields)
/s/ D. Greg Horrigan Director March 2, 2020(D. Greg Horrigan)
/s/ Joseph M. Jordan Director March 2, 2020(Joseph M. Jordan)
/s/ Brad A. Lich Director March 2, 2020(Brad A. Lich)
/s/ R. Philip Silver Director March 2, 2020(R. Philip Silver)
/s/ Robert B. Lewis Executive Vice President and March 2, 2020(Robert B. Lewis) Chief Financial Officer
(Principal Financial andAccounting Officer)

F-1
Report of Independent Registered Public Accounting Firm
To the Board of Directors and Stockholders of Silgan Holdings Inc.
Opinion on the Financial Statements
We have audited the accompanying consolidated balance sheets of Silgan Holdings Inc. (the Company) as of December 31, 2019 and 2018, the related consolidated statements of income, comprehensive income, stockholders’ equity and cash flows for each of the three years in the period ended December 31, 2019, and the related notes and financial statement schedule listed in the Index at Item 15 (collectively referred to as the "consolidated financial statements"). In our opinion, the consolidated financial statements present fairly, in all material respects, the financial position of the Company at December 31, 2019 and 2018, and the results of its operations and its cash flows for each of the three years in the period ended December 31, 2019, in conformity with U.S. generally accepted accounting principles.
We have also audited, in accordance with the standards of the Public Company Accounting Oversight Board (United States) (PCAOB), the Company's internal control over financial reporting as of December 31, 2019, based on criteria established in Internal Control-Integrated Framework issued by the Committee of Sponsoring Organizations of the Treadway Commission (2013 framework) and our report dated March 2, 2020 expressed an unqualified opinion thereon.
Basis for Opinion
These consolidated financial statements are the responsibility of the Company's management. Our responsibility is to express an opinion on the Company's consolidated financial statements based on our audits. We are a public accounting firm registered with the PCAOB and are required to be independent with respect to the Company in accordance with the U.S. federal securities laws and the applicable rules and regulations of the Securities and Exchange Commission and the PCAOB.
We conducted our audits in accordance with the standards of the PCAOB. Those standards require that we plan and perform the audit to obtain reasonable assurance about whether the consolidated financial statements are free of material misstatement, whether due to error or fraud. Our audits included performing procedures to assess the risks of material misstatement of the consolidated financial statements, whether due to error or fraud, and performing procedures that respond to those risks. Such procedures include examining, on a test basis, evidence regarding the amounts and disclosures in the consolidated financial statements. Our audits also included evaluating the accounting principles used and significant estimates made by management, as well as evaluating the overall presentation of the consolidated financial statements. We believe that our audits provide a reasonable basis for our opinion.
Critical Audit Matter
The critical audit matter communicated below is a matter arising from the current period audit of the consolidated financial statements that was communicated or required to be communicated to the audit committee and that: (1) relates to accounts or disclosures that are material to the consolidated financial statements and (2) involved our especially challenging, subjective or complex judgments. The communication of the critical audit matter does not alter in any way our opinion on the consolidated financial statements, taken as a whole, and we are not, by communicating the critical audit matter below, providing a separate opinion on the critical audit matter or on the account or disclosure to which it relates.

F-2
Valuation of Goodwill
Description ofthe Matter
At December 31, 2019, the Company’s goodwill was $1.1 billion. As discussed in Note 1 to theconsolidated financial statements, goodwill is tested for impairment each year and morefrequently if circumstances indicate a possible impairment.
Auditing management’s annual goodwill impairment test was complex and highly judgmental dueto the significant estimation required in determining the fair value of the reporting units. Inparticular, the determination of the fair value of the reporting units using the market approachrequires management to make significant assumptions related to forecasts of future earningsbefore interest, income taxes, depreciation and amortization (EBITDA) and the market multiplesthat are applied to the EBITDA forecast, which are affected by expectations of future market andeconomic conditions.
How WeAddressed theMatter in OurAudit
We obtained an understanding, evaluated the design and tested the operating effectiveness ofcontrols over the Company’s goodwill impairment review process, including controls overmanagement’s development and review of the significant assumptions described above.
To test the estimated fair value of the Company’s reporting units, we performed audit proceduresthat included, among others, assessing the methodologies and testing the significantassumptions described above and the completeness and accuracy of the underlying data usedby the Company in its analysis. For example, we compared the significant assumptions used bymanagement to current industry and economic trends and evaluated whether changes to theCompany's business model, customer base or product mix and other relevant factors wouldaffect the significant assumptions. We assessed the historical accuracy of management'sestimates and performed sensitivity analyses of the significant assumptions to evaluate thechanges in the fair value of the reporting units that would result from changes in theassumptions. In performing our testing, we utilized internal valuation specialists to assist us inevaluating the Company's valuation model and related significant assumptions. In addition, wetested the reconciliation of the fair value of the reporting units to the market capitalization of theCompany.
/s/ Ernst & Young LLP
We have served as the Company's auditor since 1987
Stamford, Connecticut
March 2, 2020

SILGAN HOLDINGS INC.
CONSOLIDATED BALANCE SHEETSDecember 31, 2019 and 2018
(Dollars in thousands, except share and per share data)
See notes to consolidated financial statements.
F-3
2019 2018
AssetsCurrent assets:
Cash and cash equivalents $ 203,824 $ 72,819Trade accounts receivable, less allowances
of $5,485 and $5,095, respectively 504,986 511,332Inventories 633,005 634,806Prepaid expenses and other current assets 64,993 71,177
Total current assets 1,406,808 1,290,134
Property, plant and equipment, net 1,570,331 1,517,510Goodwill 1,142,223 1,148,302Other intangible assets, net 354,615 383,448Other assets, net 457,082 239,900
$ 4,931,059 $ 4,579,294Liabilities and Stockholders’ Equity
Current liabilities:Revolving loans and current portion of long-term debt $ 29,813 $ 170,214Trade accounts payable 727,053 712,739Accrued payroll and related costs 66,866 68,773Accrued liabilities 194,797 127,342
Total current liabilities 1,018,529 1,079,068
Long-term debt 2,214,608 2,134,400Deferred income taxes 254,836 268,036Other liabilities 419,764 216,525
Commitments and contingenciesStockholders’ equity:
Common stock ($0.01 par value per share; 400,000,000 sharesauthorized, 175,112,496 shares issued and 110,780,464 and110,429,596 shares outstanding, respectively) 1,751 1,751Paid-in capital 289,422 276,062Retained earnings 2,141,302 1,997,785Accumulated other comprehensive loss (259,742) (268,808)Treasury stock at cost (64,332,032 and 64,682,900 shares, respectively) (1,149,411) (1,125,525)
Total stockholders’ equity 1,023,322 881,265$ 4,931,059 $ 4,579,294

SILGAN HOLDINGS INC.
CONSOLIDATED STATEMENTS OF INCOMEFor the years ended December 31, 2019, 2018 and 2017
(Dollars in thousands, except per share data)
See notes to consolidated financial statements.
F-4
2019 2018 2017Net sales $ 4,489,927 $ 4,448,875 $ 4,089,854Cost of goods sold (a) 3,776,183 3,759,112 3,455,306
Gross profit 713,744 689,763 634,548Selling, general and administrative expenses (a) 315,703 308,376 305,173Rationalization charges 56,351 6,253 5,826Other pension and postretirement income (a) (17,796) (36,966) (33,441)
Income before interest and income taxes 359,486 412,100 356,990Interest and other debt expense before loss on
early extinguishment of debt 105,674 116,306 110,257Loss on early extinguishment of debt 1,676 2,493 7,052
Interest and other debt expense 107,350 118,799 117,309Income before income taxes 252,136 293,301 239,681
Provision (benefit) for income taxes 58,322 69,307 (29,978)Net income $ 193,814 $ 223,994 $ 269,659
Basic net income per share $ 1.75 $ 2.03 $ 2.44Diluted net income per share $ 1.74 $ 2.01 $ 2.42
______________________
(a) Cost of goods sold, selling, general and administrative expenses and other pension and postretirement income include the impact of the Accounting Standards Update issued by the Financial Accounting Standards Board which amended the presentation of net periodic pension and postretirement benefit costs to report certain components, including interest cost, expected return on the plan assets, amortization of prior service cost or credits and actuarial gains and losses, separately. For 2017 these items have been reclassified from cost of goods sold and selling, general and administrative expenses to other pension and postretirement income.

SILGAN HOLDINGS INC.
CONSOLIDATED STATEMENTS OF COMPREHENSIVE INCOMEFor the years ended December 31, 2019, 2018 and 2017
(Dollars in thousands)
See notes to consolidated financial statements.
F-5
2019 2018 2017
Net income $ 193,814 $ 223,994 $ 269,659Other comprehensive income (loss), net of tax:
Changes in net prior service credit and net actuarial losses, net oftax (provision) benefit of $(2,540), $16,248 and $3,017, respectively 15,364 (49,644) (6,293)
Change in fair value of derivatives, net of tax benefit of $683, $283 and $355, respectively (2,174) (919) (613)
Foreign currency translation, net of tax (provision) benefit of $(1,559), $(3,914) and $17,131, respectively (4,124) (29,272) 63,874
Other comprehensive income (loss) 9,066 (79,835) 56,968Comprehensive income $ 202,880 $ 144,159 $ 326,627

SILGAN HOLDINGS INC.
CONSOLIDATED STATEMENTS OF STOCKHOLDERS’ EQUITYFor the years ended December 31, 2019, 2018 and 2017(Dollars and shares in thousands, except per share data)
See notes to consolidated financial statements.
F-6
2019 2018 2017
Common stock - shares outstandingBalance at beginning of period 110,430 110,385 55,051Net issuance of treasury stock for vested
restricted stock units 758 233 192Two-for-one stock split — — 55,142Repurchases of common stock (408) (188) —Balance at end of period 110,780 110,430 110,385
Common stock - par valueBalance at beginning of period $ 1,751 $ 1,751 $ 876Two-for-one stock split — — 875Balance at end of period 1,751 1,751 1,751
Paid-in capitalBalance at beginning of period 276,062 262,201 249,763Stock compensation expense 17,078 14,923 14,639Net issuance of treasury stock for vested
restricted stock units (3,718) (1,062) (1,326)Two-for-one stock split — — (875)Balance at end of period 289,422 276,062 262,201
Retained earningsBalance at beginning of period 1,997,785 1,809,845 1,558,594Net income 193,814 223,994 269,659Dividends declared on common stock (49,704) (45,115) (40,493)Adoption of accounting standards update
related to leases in 2019, revenuerecognition in 2018 and reclassification ofcertain tax effects in 2017 (593) 9,061 22,085
Balance at end of period 2,141,302 1,997,785 1,809,845Accumulated other comprehensive loss
Balance at beginning of period (268,808) (188,973) (223,856)Other comprehensive income (loss) 9,066 (79,835) 56,968Adoption of accounting standards update
related to reclassification of certain taxeffects — — (22,085)
Balance at end of period (259,742) (268,808) (188,973)Treasury stock
Balance at beginning of period (1,125,525) (1,118,759) (1,115,962)Net issuance of treasury stock for vested
restricted stock units (11,774) (1,995) (2,797)Repurchases of common stock (12,112) (4,771) —Balance at end of period (1,149,411) (1,125,525) (1,118,759)
Total stockholders' equity $ 1,023,322 $ 881,265 $ 766,065
Dividends declared on common stock per share $ 0.44 $ 0.40 $ 0.36

SILGAN HOLDINGS INC.CONSOLIDATED STATEMENTS OF CASH FLOWSFor the years ended December 31, 2019, 2018, and 2017
(Dollars in thousands)
See notes to consolidated financial statements.
F-7
2019 2018 2017
Cash flows provided by (used in) operating activities:Net income $ 193,814 $ 223,994 $ 269,659Adjustments to reconcile net income to net cash
provided by (used in) operating activities:Depreciation and amortization 206,483 191,737 174,062Amortization of debt issuance costs 3,463 3,774 4,259Rationalization charges 56,351 6,253 5,826Stock compensation expense 17,078 14,923 14,639Loss on early extinguishment of debt 1,676 2,493 7,052Deferred income tax (benefit) provision (20,859) 23,740 (114,969)Other changes that provided (used) cash, net of
effects from acquisition:Trade accounts receivable, net 3,800 516 (37,107)Inventories 53 20,366 (17,228)Trade accounts payable 16,453 61,095 84,102Accrued liabilities 13,950 3,564 4,321Other, net 15,093 (45,935) (4,851)
Net cash provided by operating activities 507,355 506,520 389,765Cash flows provided by (used in) investing activities:
Purchase of business, net of cash acquired — — (1,023,848)Capital expenditures (230,944) (190,973) (174,429)Other, net 854 1,051 600
Net cash used in investing activities (230,090) (189,922) (1,197,677)Cash flows provided by (used in) financing activities:
Borrowings under revolving loans 1,194,120 1,043,370 1,172,079Repayments under revolving loans (1,292,280) (991,006) (1,316,758)Changes in outstanding checks – principally vendors (4,664) (4,125) 8,851Proceeds from issuance of long-term debt 400,000 — 1,789,200Repayments of long-term debt (359,432) (286,200) (755,037)Debt issuance costs (4,825) (3,272) (16,964)Dividends paid on common stock (50,840) (44,549) (40,493)Repurchase of common stock (27,604) (7,828) (4,123)
Net cash (used in) provided by financing activities (145,525) (293,610) 836,755
Effect of exchange rate changes on cash and cash equivalents (735) (3,702) —
Cash and cash equivalents:Net increase 131,005 19,286 28,843Balance at beginning of year 72,819 53,533 24,690Balance at end of year $ 203,824 $ 72,819 $ 53,533
Interest paid, net $ 108,798 $ 118,377 $ 97,595Income taxes paid, net of refunds 40,650 47,172 70,239

SILGAN HOLDINGS INC.
NOTES TO CONSOLIDATED FINANCIAL STATEMENTSDecember 31, 2019, 2018 and 2017
F-8
NOTE 1. SUMMARY OF SIGNIFICANT ACCOUNTING POLICIES
Nature of Business. Silgan Holdings Inc., or Silgan, and its subsidiaries conduct business in three market segments: metal containers, closures and plastic containers. Our metal container business is engaged in the manufacture and sale of steel and aluminum containers for human and pet food and general line products. Our closures business manufactures and sells metal and plastic closures and dispensing systems for food, beverage, health care, garden, personal care, home and beauty products. Our plastic container business manufactures and sells custom designed plastic containers for personal care, food, health care, pharmaceutical, household and industrial chemical, pet food and care, agricultural, automotive and marine chemical products. Our metal container business has operating facilities in North America, Europe and Asia. Our closures business has operating facilities in North and South America, Europe and Asia. Our plastic container business is based in North America.
Basis of Presentation. The consolidated financial statements include the accounts of Silgan and our subsidiaries. Newly acquired subsidiaries have been included in the consolidated financial statements from their dates of acquisition. All significant intercompany transactions have been eliminated. The preparation of consolidated financial statements in conformity with U.S. generally accepted accounting principles, or GAAP, requires management to make estimates and assumptions that affect the amounts reported in the financial statements and accompanying notes. Actual results may differ from those estimates.
Generally, our subsidiaries that operate outside the United States use their local currency as the functional currency. The principal functional currency for our foreign operations is the Euro. Balance sheet accounts of our foreign subsidiaries are translated at exchange rates in effect at the balance sheet date, while revenue and expense accounts are translated at average rates prevailing during the year. Translation adjustments are reported as a component of accumulated other comprehensive loss. Gains or losses resulting from operating transactions denominated in foreign currencies that are not designated as a hedge are generally included in selling, general and administrative expenses in our Consolidated Statements of Income.
Stock Split. On May 3, 2017, our Board of Directors declared a two-for-one stock split of our issued common stock. The stock split was effected on May 26, 2017 in the form of a stock dividend. Stockholders of record at the close of business on May 15, 2017 were issued one additional share of common stock for each share of common stock owned on that date. Information pertaining to shares, per share amounts and stock-based compensation has been retroactively adjusted in the accompanying financial statements and related footnotes to reflect this stock split for the applicable periods presented prior to the stock split, except for the Consolidated Statements of Stockholders' Equity other than as noted therein. Stockholders’ equity reflects the stock split in 2017 by reclassifying from paid-in capital to common stock an amount equal to the par value of the additional shares issued as a result of the stock split.
Cash and Cash Equivalents. Cash equivalents represent short-term, highly liquid investments which are readily convertible to cash and have maturities of three months or less at the time of purchase. As a result of our cash management system, checks issued for payment may create negative book balances. Checks outstanding in excess of related book balances are included in trade accounts payable in our Consolidated Balance Sheets. Changes in outstanding checks are included in financing activities in our Consolidated Statements of Cash Flows to treat them as, in substance, cash advances.
Inventories. Inventories are valued at the lower of cost or market (net realizable value). Cost for domestic inventories for our metal container business and certain portions of our closures business is principally determined on the last-in, first-out basis, or LIFO. Cost for inventories for our plastic container business and certain portions of our closures business is principally determined on the first-in, first-out basis, or FIFO. Cost for foreign inventories for our metal container business and certain portions of our closures business is principally determined on the average cost method.
Property, Plant and Equipment, Net. Property, plant and equipment, net is stated at historical cost less accumulated depreciation. Major renewals and betterments that extend the life of an asset are capitalized and repairs and maintenance expenditures are charged to expense as incurred. Design and development costs for molds, dies and other tools that we do not own and that will be used to produce products that will be sold under

SILGAN HOLDINGS INC.
NOTES TO CONSOLIDATED FINANCIAL STATEMENTSDecember 31, 2019, 2018 and 2017
F-9
long-term supply arrangements are capitalized. Depreciation is computed using the straight-line method over the estimated useful lives of depreciable assets. The principal estimated useful lives are 35 years for buildings and range between 3 years to 20 years for machinery and equipment. Leasehold improvements are amortized over the shorter of the life of the related asset or the life of the lease.
Goodwill and Other Intangible Assets, Net. We review goodwill and other indefinite-lived intangible assets for impairment as of July 1 of each year and more frequently if circumstances indicate a possible impairment. We determined that goodwill and other indefinite-lived intangible assets were not impaired in our annual assessment performed during the third quarter. Definite-lived intangible assets are amortized over their estimated useful lives on a straight-line basis. Customer relationships have a weighted average life of approximately 20 years. Other definite-lived intangible assets consist primarily of a trade name and technology know-how and have a weighted average life of approximately 7 years.
Impairment of Long-Lived Assets. We assess long-lived assets, including intangible assets with definite lives, for impairment whenever events or changes in circumstances indicate the carrying amount of the assets may not be fully recoverable. An impairment exists if the estimate of future undiscounted cash flows generated by the assets is less than the carrying value of the assets. If impairment is determined to exist, any related impairment loss is then measured by comparing the fair value of the assets to their carrying amount.
Hedging Instruments. All derivative financial instruments are recorded in the Consolidated Balance Sheets at their fair values. Changes in fair values of derivatives are recorded in each period in earnings or other comprehensive loss, depending on whether a derivative is designated as part of a qualifying hedge transaction and, if it is, the type of hedge transaction.
We utilize certain derivative financial instruments to manage a portion of our interest rate and natural gas cost exposures. We do not engage in trading or other speculative uses of these financial instruments. For a financial instrument to qualify as a hedge, we must be exposed to interest rate or price risk, and the financial instrument must reduce the exposure and be designated as a hedge. Financial instruments qualifying for hedge accounting must maintain a high correlation between the hedging instrument and the item being hedged, both at inception and throughout the hedged period.
We utilize certain internal hedging strategies to minimize our foreign currency exchange rate risk. Net investment hedges that qualify for hedge accounting result in the recognition of foreign currency gains or losses, net of tax, in accumulated other comprehensive loss. We generally do not utilize external derivative financial instruments to manage our foreign currency exchange rate risk.
Income Taxes. We account for income taxes using the liability method. Deferred tax assets and liabilities are recognized for the future tax consequences attributable to differences between the financial statement carrying amounts of assets and liabilities and their respective tax bases and operating loss and tax credit carryforwards. The effect on deferred tax assets and liabilities of a change in tax rates is recognized in income in the period of enactment of such change. No provision is made for U.S. income taxes applicable to undistributed earnings of foreign subsidiaries that are indefinitely reinvested.
Revenue Recognition. Our revenues are primarily derived from the sale of rigid packaging products to customers. We recognize revenue at the amount we expect to be entitled to in exchange for promised goods for which we have transferred control to customers. If the consideration agreed to in a contract includes a variable amount, we estimate the amount of consideration we expect to be entitled to in exchange for transferring the promised goods to the customer. Generally, revenue is recognized at a point in time for standard promised goods at the time of shipment when title and risk of loss pass to the customer, and revenue is recognized over time in cases where we produce promised goods with no alternative use to us and for which we have an enforceable right of payment for production completed. The production cycle for customer contracts subject to over time recognition is generally completed in less than one month. Due to the short-term duration of our production cycle, we have elected the practical expedient permitting us to exclude disclosure regarding our performance obligations with respect to outstanding purchase orders. We have elected to treat shipping and handling costs after the control of goods have been transferred to the customer as a fulfillment cost. Sales and similar taxes that are imposed on our sales and collected from customers are excluded from revenues.
SILGAN HOLDINGS INC.
NOTES TO CONSOLIDATED FINANCIAL STATEMENTSDecember 31, 2019, 2018 and 2017
F-10
Stock-Based Compensation. We currently have one stock-based compensation plan in effect under which we have issued stock options and restricted stock units to our officers, other key employees and outside directors. A restricted stock unit represents the right to receive one share of our common stock at a future date. Unvested restricted stock units that have been issued do not have voting rights and may not be disposed of or transferred during the vesting period.
Recently Adopted Accounting Pronouncements. In May 2014, the Financial Accounting Standards Board, or FASB, issued an accounting standards update, or ASU, that amends the guidance for revenue recognition. This amendment contains principles that require an entity to recognize revenue to depict the transfer of promised goods and services to customers at an amount that an entity expects to be entitled to in exchange for those promised goods or services. We adopted this amendment on January 1, 2018, using the modified retrospective method for all contracts for which performance was not completed as of January 1, 2018. Results for the reporting period beginning January 1, 2018 are presented under the new guidance, while prior period amounts are not adjusted. The adoption of this amendment required us to accelerate the recognition of revenue prior to shipment to certain customers in cases where we produce promised goods with no alternative use to us and for which we have an enforceable right of payment for production completed. As a result of the adoption of this amendment, we increased retained earnings by $9.1 million as of January 1, 2018. The adoption of this amendment did not have a material impact on our financial position, results of operations or cash flows. See Note 2 for further information.
In March 2017, the FASB issued an ASU that amends the presentation of net periodic pension cost and net periodic postretirement benefit cost. This amendment requires an entity to disaggregate the service cost component from the other components of net periodic benefit cost, to report the service cost component in the same line item as other compensation costs and to report the other components of net periodic benefit cost (which include interest cost, expected return on plan assets, amortization of prior service cost or credit and actuarial gains and losses) separately. In addition, capitalization of net periodic benefit cost in assets is limited to the service cost component. We have adopted this amendment as of January 1, 2018. As a result of separately reporting the other components of net periodic benefit cost, we retrospectively increased cost of goods sold by $26.6 million, increased selling, general and administrative expenses by $6.8 million and reported other pension and postretirement income of $33.4 million in our Consolidated Statements of Income for the year ended December 31, 2017, based on amounts previously included in net periodic benefit costs for retirement benefits as disclosed in Note 12. The adoption of this amendment did not have a material impact on our financial position, results of operations or cash flows.
In February 2016, the FASB issued an ASU that amends existing guidance for certain leases by lessees. This amendment required us to recognize assets and liabilities on the balance sheet for the rights and obligations created by long-term leases and to disclose additional quantitative and qualitative information about leasing arrangements. We adopted this amendment on January 1, 2019, using the transition method which allowed us to recognize the effects of applying this amendment as a cumulative effect to retained earnings as of January 1, 2019. We elected certain practical expedients permitted under the transition guidance for this amendment, which did not require us to reassess whether other contracts contain leases and allowed us to carryforward our lease classifications determined under the previous guidance. In addition, we elected to retain our previously determined assumptions concerning options to extend or terminate our leases. As a result of the adoption of this amendment, we recognized additional long-term assets of $160.8 million, additional related lease liabilities of $161.4 million and reduced retained earnings by $0.6 million all on January 1, 2019. The adoption of this amendment did not have a material impact on our results of operations or cash flows. See Note 2 for further information.
Recently Issued Accounting Pronouncements. In June 2016, the FASB issued an ASU that amends the guidance on the accounting for credit losses on financial instruments. This new standard introduces an approach, based on expected losses, to estimate credit losses on certain types of financial instruments. The new approach to estimating credit losses (referred to as the current expected credit losses model) applies to most financial assets measured at amortized cost and certain other instruments, including trade and other receivables. This new standard is effective for the Company on January 1, 2020. We do not expect that this new standard will have a material impact on our financial position, results of operations or cash flows.

SILGAN HOLDINGS INC.
NOTES TO CONSOLIDATED FINANCIAL STATEMENTSDecember 31, 2019, 2018 and 2017
F-11
NOTE 2. REVENUE
The following tables present our revenues disaggregated by reportable business segment and geography as they best depict how the nature, amount, timing and uncertainty of revenue and cash flows are affected by economic factors.
Revenues by business segment were as follows:
2019 2018 2017 (Dollars in thousands)
Metal containers $ 2,473,214 $ 2,377,980 $ 2,278,054Closures 1,405,611 1,456,799 1,246,669Plastic containers 611,102 614,096 565,131
$ 4,489,927 $ 4,448,875 $ 4,089,854
Revenues by geography were as follows:
2019 2018 2017 (Dollars in thousands)
North America $ 3,593,961 $ 3,516,045 $ 3,268,126Europe and other 895,966 932,830 821,728
$ 4,489,927 $ 4,448,875 $ 4,089,854
Our contracts generally include standard commercial payment terms generally acceptable in each region. We do not provide financing with extended payment terms beyond generally standard commercial payment terms for the applicable industry. We have no significant obligations for refunds, warranties or similar obligations. Trade accounts receivable, net are shown separately on our Consolidated Balance Sheet. Contract assets are the result of the timing of revenue recognition, billings and cash collections. Our contract assets primarily consist of unbilled accounts receivable related to over time revenue recognition and were $71.1 million and $72.5 million as of December 31, 2019 and 2018, respectively. Unbilled receivables are included in trade accounts receivable, net on our Consolidated Balance Sheet.
NOTE 3. ACQUISITION
DISPENSING SYSTEMS ACQUISITION
On April 6, 2017, we acquired the specialty closures and dispensing systems operations of WestRock Company, now operating under the name Silgan Dispensing Systems, or SDS. SDS is a leading global supplier of highly engineered triggers, pumps, sprayers and dispensing closure solutions for health care, garden, personal care, home, beauty and food products.
We acquired SDS for a purchase price in cash of $1,023.8 million, net of cash acquired. We funded the purchase price for this acquisition through term and revolving loan borrowings under our amended and restated senior secured credit facility. We applied the acquisition method of accounting and recognized assets acquired and liabilities assumed at fair value as of the acquisition date. For this acquisition, we recognized goodwill of $511.0 million, a customer relationship intangible asset of $220.0 million and a technology know-how intangible asset of $25.0 million. SDS’s results of operations have been included in our closures segment since the acquisition date.
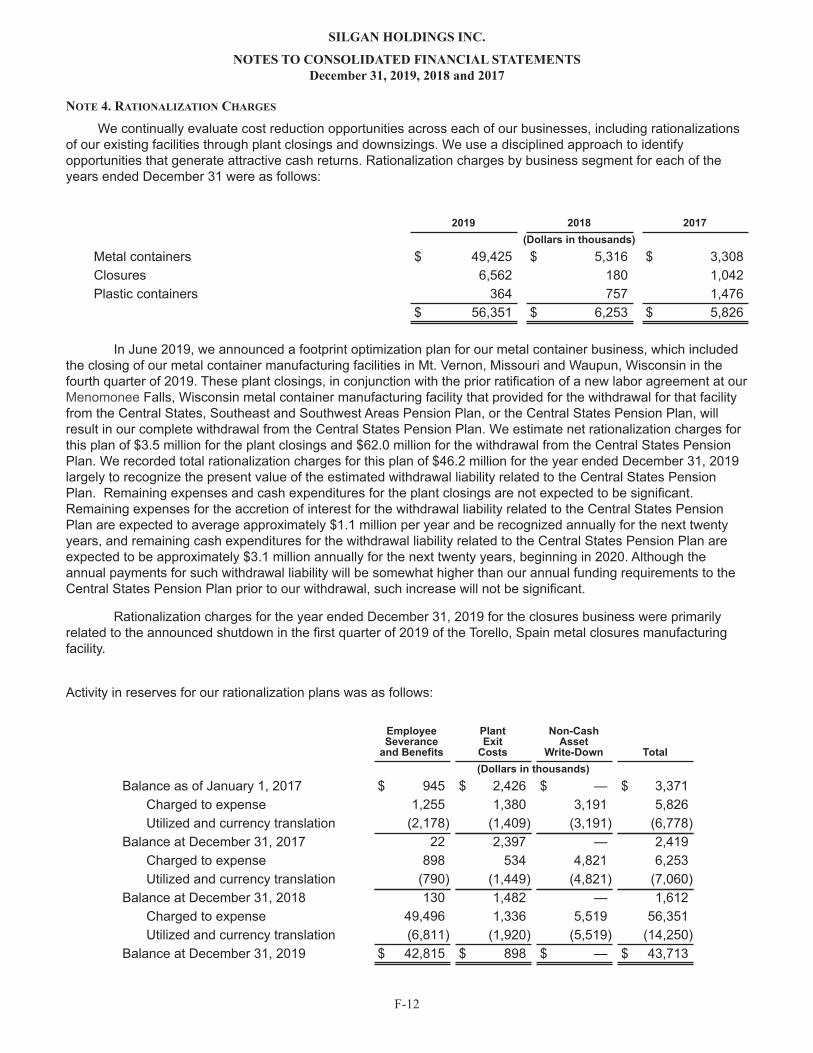
SILGAN HOLDINGS INC.
NOTES TO CONSOLIDATED FINANCIAL STATEMENTSDecember 31, 2019, 2018 and 2017
F-12
NOTE 4. RATIONALIZATION CHARGES
We continually evaluate cost reduction opportunities across each of our businesses, including rationalizations of our existing facilities through plant closings and downsizings. We use a disciplined approach to identify opportunities that generate attractive cash returns. Rationalization charges by business segment for each of the years ended December 31 were as follows:
2019 2018 2017 (Dollars in thousands)
Metal containers $ 49,425 $ 5,316 $ 3,308Closures 6,562 180 1,042Plastic containers 364 757 1,476
$ 56,351 $ 6,253 $ 5,826 In June 2019, we announced a footprint optimization plan for our metal container business, which included the closing of our metal container manufacturing facilities in Mt. Vernon, Missouri and Waupun, Wisconsin in the fourth quarter of 2019. These plant closings, in conjunction with the prior ratification of a new labor agreement at our Menomonee Falls, Wisconsin metal container manufacturing facility that provided for the withdrawal for that facility from the Central States, Southeast and Southwest Areas Pension Plan, or the Central States Pension Plan, will result in our complete withdrawal from the Central States Pension Plan. We estimate net rationalization charges for this plan of $3.5 million for the plant closings and $62.0 million for the withdrawal from the Central States Pension Plan. We recorded total rationalization charges for this plan of $46.2 million for the year ended December 31, 2019 largely to recognize the present value of the estimated withdrawal liability related to the Central States Pension Plan. Remaining expenses and cash expenditures for the plant closings are not expected to be significant. Remaining expenses for the accretion of interest for the withdrawal liability related to the Central States Pension Plan are expected to average approximately $1.1 million per year and be recognized annually for the next twenty years, and remaining cash expenditures for the withdrawal liability related to the Central States Pension Plan are expected to be approximately $3.1 million annually for the next twenty years, beginning in 2020. Although the annual payments for such withdrawal liability will be somewhat higher than our annual funding requirements to the Central States Pension Plan prior to our withdrawal, such increase will not be significant.
Rationalization charges for the year ended December 31, 2019 for the closures business were primarily related to the announced shutdown in the first quarter of 2019 of the Torello, Spain metal closures manufacturing facility.
Activity in reserves for our rationalization plans was as follows:
EmployeeSeverance
and Benefits
PlantExit
Costs
Non-CashAsset
Write-Down Total (Dollars in thousands)Balance as of January 1, 2017 $ 945 $ 2,426 $ — $ 3,371
Charged to expense 1,255 1,380 3,191 5,826Utilized and currency translation (2,178) (1,409) (3,191) (6,778)
Balance at December 31, 2017 22 2,397 — 2,419Charged to expense 898 534 4,821 6,253Utilized and currency translation (790) (1,449) (4,821) (7,060)
Balance at December 31, 2018 130 1,482 — 1,612Charged to expense 49,496 1,336 5,519 56,351Utilized and currency translation (6,811) (1,920) (5,519) (14,250)
Balance at December 31, 2019 $ 42,815 $ 898 $ — $ 43,713

SILGAN HOLDINGS INC.
NOTES TO CONSOLIDATED FINANCIAL STATEMENTSDecember 31, 2019, 2018 and 2017
F-13
Non-cash asset write-downs were the result of comparing the carrying value of certain production related equipment to their fair value using estimated future discounted cash flows, a Level 3 fair value measurement (see Note 10 for information regarding a Level 3 fair value measurement). Rationalization reserves as of December 31, 2019 and 2018 were recorded in our Consolidated Balance Sheets as accrued liabilities of $5.0 million and $0.6 million, respectively, and as other liabilities of $38.7 million and $1.0 million, respectively. Exclusive of the footprint optimization plan for our metal container business and the withdrawal from the Central States Pension Plan discussed above, remaining expenses for our rationalization plans of $2.2 million are expected primarily in 2020, and remaining cash expenditures for our rationalization plans of $4.1 million are expected through 2023.
NOTE 5. ACCUMULATED OTHER COMPREHENSIVE LOSS
Accumulated other comprehensive loss is reported in our Consolidated Statements of Stockholders’ Equity. Amounts included in accumulated other comprehensive loss, net of tax, were as follows:
Unrecognized NetDefined Benefit
Plan Costs
Change in FairValue of
Derivatives
ForeignCurrency
Translation Total(Dollars in thousands)
Balance at January 1, 2017 $ (83,105) $ 540 $ (141,291) $ (223,856)Other comprehensive income before reclassifications (8,486) (527) 63,874 54,861Amounts reclassified from accumulated other comprehensive loss 2,193 (86) — 2,107
Other comprehensive income (6,293) (613) 63,874 56,968Adoption of accounting standards update
related to reclassification of certain taxeffects (15,424) (16) (6,645) (22,085)
Balance at December 31, 2017 (104,822) (89) (84,062) (188,973)Other comprehensive loss before reclassifications (53,797) (766) (33,679) (88,242)Amounts reclassified from accumulated other comprehensive loss 4,153 (153) 4,407 8,407
Other comprehensive loss (49,644) (919) (29,272) (79,835)Balance at December 31, 2018 (154,466) (1,008) (113,334) (268,808)
Other comprehensive loss before reclassifications 4,895 (2,723) (4,124) (1,952)Amounts reclassified from accumulated other comprehensive loss 10,469 549 — 11,018
Other comprehensive loss 15,364 (2,174) (4,124) 9,066Balance at December 31, 2019 $ (139,102) $ (3,182) $ (117,458) $ (259,742)
The amounts reclassified to earnings from the unrecognized net defined benefit plan costs component of accumulated other comprehensive loss for the years ended December 31, 2019, 2018 and 2017 were net (losses) of $(13.7) million, $(5.7) million and $(3.4) million, respectively, excluding an income tax benefit of $3.2 million, $1.5 million and $1.2 million, respectively. These net losses included amortization of net actuarial (losses) of $(15.9) million, $(6.9) million and $(6.5) million for the years ended December 31, 2019, 2018 and 2017, respectively, and amortization of net prior service credit of $2.2 million, $1.2 million and $3.1 million for the years ended December 31, 2019, 2018 and 2017, respectively. Amortization of net actuarial losses and net prior service credit is a component of net periodic benefit credit. See Note 12 for further discussion.
The amounts reclassified to earnings from the change in fair value of derivatives component of accumulated other comprehensive loss for the years ended December 31, 2019, 2018 and 2017 were not significant. See Note 10 which includes a discussion of derivative instruments and hedging activities.

SILGAN HOLDINGS INC.
NOTES TO CONSOLIDATED FINANCIAL STATEMENTSDecember 31, 2019, 2018 and 2017
F-14
The foreign currency translation component of accumulated other comprehensive loss includes: (i) foreign currency gains (losses) related to translation of year-end financial statements of foreign subsidiaries utilizing a functional currency other than the U.S. Dollar; (ii) foreign currency (losses) related to intra-entity foreign currency transactions that are of a long-term investment nature; and (iii) foreign currency (losses) gains related to our net investment hedges, net of tax. Foreign currency (losses) gains related to translation of year-end financial statements of foreign subsidiaries utilizing a functional currency other than the U.S. Dollar for the years ended December 31, 2019, 2018 and 2017 were $(10.3) million, $(47.3) million and $94.7 million, respectively. Foreign currency gains (losses) related to intra-entity foreign currency transactions that are of a long-term investment nature for the years ended December 31, 2019, 2018 and 2017 were $1.1 million, $5.3 million and $(1.8) million, respectively. Foreign currency gains (losses) related to our net investment hedges for the years ended December 31, 2019, 2018 and 2017 were $6.8 million, $16.6 million and $(46.1) million, respectively, excluding an income tax (provision) benefit of $(1.6) million, $(3.9) million and $17.1 million, respectively. See Note 10 for further discussion.
As of December 31, 2017, we reclassified the stranded tax effects resulting from the decrease in the federal corporate tax rate and certain other tax effects (primarily the decreased federal benefit of state income taxes) as a result of the Tax Cuts and Jobs Act enacted in December 2017, or the 2017 Tax Act. As a result, we increased each of accumulated other comprehensive loss and retained earnings by $22.1 million in 2017.
NOTE 6. INVENTORIES
The components of inventories at December 31 were as follows:
2019 2018 (Dollars in thousands)Raw materials $ 286,953 $ 288,860Work-in-process 134,417 123,574Finished goods 355,337 335,180Other 12,793 13,075
789,500 760,689Adjustment to value inventory at cost on the LIFO method (156,495) (125,883)
$ 633,005 $ 634,806
Inventories include $152.6 million and $169.3 million recorded on the FIFO method at December 31, 2019 and 2018, respectively, and $112.9 million and $120.9 million recorded on the average cost method at December 31, 2019 and 2018, respectively.
NOTE 7. PROPERTY, PLANT AND EQUIPMENT, NET
Property, plant and equipment, net at December 31 was as follows:
2019 2018 (Dollars in thousands)Land $ 77,233 $ 73,084Buildings and improvements 493,035 467,067Machinery and equipment 3,009,591 2,912,841Construction in progress 167,635 159,758
3,747,494 3,612,750Accumulated depreciation (2,177,163) (2,095,240)
$ 1,570,331 $ 1,517,510 Depreciation expense in 2019, 2018 and 2017 was $179.3 million, $164.1 million and $150.5 million, respectively.

SILGAN HOLDINGS INC.
NOTES TO CONSOLIDATED FINANCIAL STATEMENTSDecember 31, 2019, 2018 and 2017
F-15
NOTE 8. GOODWILL AND OTHER INTANGIBLE ASSETS, NET
Changes in the carrying amount of goodwill were as follows:
MetalContainers Closures
PlasticContainers Total
(Dollars in thousands)Balance at December 31, 2017 $ 116,916 $ 826,933 $ 227,605 $ 1,171,454
Currency translation (2,454) (19,307) (1,391) (23,152)Balance at December 31, 2018 114,462 807,626 226,214 1,148,302
Currency translation (999) (5,850) 770 (6,079)Balance at December 31, 2019 $ 113,463 $ 801,776 $ 226,984 $ 1,142,223
The components of other intangible assets, net at December 31 were as follows:
2019 2018
Gross
AmountAccumulatedAmortization
GrossAmount
AccumulatedAmortization
(Dollars in thousands)Definite-lived intangibles:
Customer relationships $ 422,042 $ (116,575) $ 423,513 $ (94,889)Other 39,447 (22,439) 40,715 (18,031)
461,489 (139,014) 464,228 (112,920)Indefinite-lived intangibles:
Trade names 32,140 — 32,140 —$ 493,629 $ (139,014) $ 496,368 $ (112,920)
Amortization expense in 2019, 2018 and 2017 was $27.1 million, $27.6 million and $23.6 million, respectively. Amortization expense is expected to be $26.5 million, $25.0 million, $24.6 million, $24.5 million and $21.7 million for the years ended December 31, 2020 through 2024, respectively.

SILGAN HOLDINGS INC.
NOTES TO CONSOLIDATED FINANCIAL STATEMENTSDecember 31, 2019, 2018 and 2017
F-16
NOTE 9. LONG-TERM DEBT
Long-term debt at December 31 was as follows:
2019 2018 (Dollars in thousands)Bank debt:
Bank revolving loans $ — $ —U.S. term loans 760,000 800,000Canadian term loans 4,703 22,103Other foreign bank revolving and term loans 31,127 129,697
Total bank debt 795,830 951,8005½% Senior Notes — 300,0004¾% Senior Notes 300,000 300,0003¼% Senior Notes 729,755 744,380
400,000 —Finance leases 33,288 21,543Total debt - principal 2,258,873 2,317,723
Less unamortized debt issuance costs 14,452 13,109Total debt 2,244,421 2,304,614
Less current portion 29,813 170,214$ 2,214,608 $ 2,134,400
AGGREGATE ANNUAL MATURITIES
The aggregate annual maturities of our debt (non-U.S. dollar debt has been translated into U.S. dollars at exchange rates in effect at the balance sheet date), excluding finance leases, are as follows (dollars in thousands):
2020 $ 27,8772021 3,2502022 —2023 —2024 13,547Thereafter 2,180,911
$ 2,225,585
At December 31, 2019, the current portion of our long-term debt consisted of $27.9 million of other foreign bank revolving and term loans and $1.9 million of finance leases. As discussed in Note 19, on February 26, 2020, we issued an additional $200 million aggregate principal amount of our 4 % Senior Notes due 2028, or the 4 % Notes, at 99.5 percent of their principal amount, plus accrued and unpaid interest from November 12, 2019, and €500 million aggregate principal amount of our 2¼% Senior Notes due 2028, or the 2¼% Notes, at 100 percent of their principal amount, and used the net proceeds from such issuances to prepay most of our outstanding U.S. A term loans under the Credit Agreement. Accordingly, aggregate annual maturities of such prepaid U.S. A term loans under the Credit Agreement were extended to 2028 for purposes of the table above to match the maturities of the 4 % Notes and the 2¼% Notes. BANK CREDIT AGREEMENT On March 24, 2017, we completed an amendment and restatement of our previous senior secured credit facility, which extended the maturity dates of our senior secured credit facility, provides additional borrowing capacity for us and provides us with greater flexibility with regard to our strategic initiatives. On May 30, 2018, we

SILGAN HOLDINGS INC.
NOTES TO CONSOLIDATED FINANCIAL STATEMENTSDecember 31, 2019, 2018 and 2017
F-17
entered into an amendment to our amended and restated senior secured credit facility, as so amended, the Credit Agreement. This amendment further extended the maturity dates of the Credit Agreement, lowered the margin on borrowings thereunder and provides us with additional flexibility with regard to our strategic initiatives.
The Credit Agreement provides us with revolving loans, or the Revolving Loans, consisting of a multicurrency revolving loan facility of approximately $1.19 billion and a Canadian revolving loan facility of Cdn $15.0 million and provided us with Cdn $45.5 million of term loans designated Canadian A term loans. In addition, the Credit Agreement provided us with $800.0 million of term loans designated U.S. A term loans which were borrowed to fund a portion of the purchase price paid in connection with our acquisition of SDS. See Note 3 for further information.
The Revolving Loans generally may be borrowed, repaid and reborrowed from time to time until May 30, 2023. Proceeds from the Revolving Loans may be used for working capital and other general corporate purposes (including acquisitions, capital expenditures, dividends, stock repurchases and repayments of other debt).
During 2019, we repaid $40.0 million of U.S. A term loans and Cdn $24.0 million of Canadian A term loans under the Credit Agreement. The remaining U.S. A term loans and Canadian A term loans, collectively the Term Loans, mature on May 30, 2024, and require principal payments in annual installments as provided in the Credit Agreement. The Credit Agreement also contains certain mandatory repayment provisions, including requirements to prepay loans with proceeds in excess of certain amounts received from certain assets sales. Generally, mandatory repayments are applied pro rata to each of the Term Loans and applied first to the next two scheduled amortization payments which are due on December 31 of the year of such mandatory repayment and the next succeeding year (or, if no such payment is due on December 31 of such year, to the payment due on December 31 of the immediately succeeding year or of the next succeeding year in which a payment is to be made) and, to the extent in excess thereof, pro rata to the remaining installments of each of the Term Loans. Voluntary prepayments of Term Loans may be applied to any tranche of Term Loans at our discretion and are applied to the scheduled amortization payments in direct order of maturity. Amounts repaid under the Term Loans may not be reborrowed.
The Credit Agreement also provides us with an uncommitted multicurrency incremental loan facility for up to U.S. $1.25 billion (which amount may be increased as provided in the Credit Agreement), which may take the form of one or more incremental term loan facilities and/or increased commitments under the revolving loan facilities, subject to certain limitations. The uncommitted incremental loan facility provides, among other things, that any incremental loan borrowing shall:
• be denominated in a single currency, either in U.S. Dollars, Euros, Pounds Sterling or Canadian Dollars;• be in a minimum aggregate amount of at least U.S. $50 million;• have a maturity date no earlier than the maturity date for the Term Loans and a weighted average life to maturity
of no less than the weighted average life to maturity of the Term Loans; and• be used by us and certain of our foreign subsidiaries for working capital and other general corporate purposes,
including to finance acquisitions and refinance any indebtedness assumed as a part of such acquisitions, to refinance or repurchase debt as permitted and to pay outstanding Revolving Loans.
At December 31, 2019, we had borrowings outstanding under the Credit Agreement of $760.0 million of U.S. A term loans and Cdn $6.1 million of Canadian A term loans, totaling U.S. denominated $764.7 million (with non-U.S. denominated amounts translated at exchange rates in effect at such date), and no Revolving Loans outstanding. At December 31, 2018, we had borrowings outstanding under the Credit Agreement of $800.0 million of U.S. A term loans, and Cdn $30.1 million of Canadian A term loans, totaling U.S. denominated $822.1 million (with non-U.S. denominated term loans translated at exchange rates in effect at such date), and no Revolving Loans outstanding.
Under the Credit Agreement, the interest rate for U.S. term loans will be either the Eurodollar Rate or the base rate under the Credit Agreement plus a margin and the interest rate for Canadian term loans will be either the CDOR Rate or the Canadian prime rate under the Credit Agreement plus a margin. Outstanding Revolving Loans incur interest at the same rates as the U.S. term loans in the case of U.S. dollar denominated Revolving Loans and

SILGAN HOLDINGS INC.
NOTES TO CONSOLIDATED FINANCIAL STATEMENTSDecember 31, 2019, 2018 and 2017
F-18
as the Canadian term loans in the case of Canadian dollar denominated Revolving Loans. Euro and Pounds Sterling denominated Revolving Loans incur interest at the applicable Euro Rate plus the applicable margin.
At December 31, 2019, the margin for Term Loans and Revolving Loans maintained as Eurodollar Rate, CDOR Rate or Euro Rate loans was 1.25 percent and the margin for Term Loans and Revolving Loans maintained as base rate or Canadian prime rate loans was 0.25 percent. The interest rate margin on all loans will be reset quarterly based upon our Total Net Leverage Ratio as provided in the Credit Agreement. As of December 31, 2019, the interest rates on U.S. term loans and Canadian term loans were 3.05 percent and 3.33 percent, respectively.
The Credit Agreement provides for the payment of a commitment fee ranging from 0.20 percent to 0.30 percent per annum on the daily average unused portion of commitments available under the revolving loan facilities (0.25 percent at December 31, 2019). The commitment fee will be reset quarterly based upon our Total Net Leverage Ratio as provided in the Credit Agreement.
We may utilize up to a maximum of $125 million of our multicurrency revolving loan facility under the Credit Agreement for letters of credit as long as the aggregate amount of borrowings of Revolving Loans under the multicurrency revolving loan facility and letters of credit do not exceed the amount of the commitment under such multicurrency revolving loan facility. The Credit Agreement provides for payment to the applicable lenders of a letter of credit fee equal to the applicable margin in effect for Revolving Loans under the multicurrency revolving loan facility, calculated on the stated amount of such letter of credit, and to the issuers of letters of credit of a fronting fee of the greater of (x) $500 per annum and (y) 0.25 percent per annum calculated on the aggregate stated amount of such letters of credit, in each case for their stated duration.
For 2019, 2018 and 2017, the weighted average annual interest rate paid on term loans under our senior secured credit facilities was 3.6 percent, 3.6 percent and 3.1 percent, respectively; and the weighted average annual interest rate paid on revolving loans under our senior secured credit facilities was 3.5 percent, 3.5 percent and 3.0 percent, respectively. From time to time, we enter into interest rate swap agreements to convert interest rate exposure from variable rates to fixed rates of interest. For 2019, 2018 and 2017, any interest rate swap agreements in effect did not significantly impact our weighted average annual interest rate paid on term loans under our senior secured credit facilities. See Note 10 which includes a discussion of our interest rate swap agreements.
The indebtedness under the Credit Agreement is guaranteed by us and our U.S., Canadian and Dutch subsidiaries. The stock of our U.S., Canadian and Dutch subsidiaries has been pledged as security to the lenders under the Credit Agreement. The Credit Agreement contains certain financial and operating covenants which limit, subject to certain exceptions, among other things, our ability to incur additional indebtedness; create liens; consolidate, merge or sell assets; make certain advances, investments or loans; enter into certain transactions with affiliates; and engage in any business other than the packaging business and certain related businesses. In addition, we are required to meet specified financial covenants consisting of Interest Coverage and Total Net Leverage Ratios, each as defined in the Credit Agreement. We are currently in compliance with all covenants under the Credit Agreement.
Because we sell metal containers and closures used in the fruit and vegetable packing process, we have seasonal sales. As is common in the packaging industry, we must utilize working capital to build inventory and thencarry accounts receivable for some customers beyond the packing season. Due to our seasonal requirements, which generally peak sometime in the summer or early fall, we may incur short-term indebtedness to finance our working capital requirements
As a result of the 2018 amendment to the Credit Agreement, we recorded a pre-tax charge for the loss on early extinguishment of debt of $1.1 million in 2018. As a result of entering into the Credit Agreement in 2017, we recorded a pre-tax charge for the loss on early extinguishment of debt of $0.6 million in 2017.
4 % SENIOR NOTES
On November 12, 2019, we issued $400 million aggregate principal amount of the 4 % Notes at 100 percent of their principal amount. As discussed in Note 19, on February 26, 2020, we issued an additional

SILGAN HOLDINGS INC.
NOTES TO CONSOLIDATED FINANCIAL STATEMENTSDecember 31, 2019, 2018 and 2017
F-19
$200 million aggregate principal amount of the 4 % Notes at 99.5 percent of their principal amount, plus accrued and unpaid interest from November 12, 2019.
The 4 % Notes are general senior unsecured obligations of Silgan and rank equally in right of payment with our existing and future unsecured unsubordinated indebtedness, including our existing 4¾% Senior Notes due 2025 and 3¼% Senior Notes due 2025, and ahead of the Company’s existing and future subordinated debt. In addition, the 4 % Notes are effectively subordinated to all of Silgan's secured debt to the extent of the assets securing such debt and structurally subordinated to all obligations of subsidiaries of Silgan.
The 4 % Notes will mature on February 1, 2028. Interest on the 4 % Notes will be payable semiannually in cash on April 1 and October 1 of each year, beginning on April 1, 2020. The 4 % Notes were issued pursuant to an indenture by and between Silgan and U.S. Bank National Association, as trustee, which indenture contains covenants that are generally less restrictive than those in the Credit Agreement and substantially similar to those in the indenture for our 4¾% Senior Notes due 2025 and our 3¼% Senior Notes due 2025.
The 4 % Notes are redeemable, at our option, in whole or in part, at any time on or after October 1, 2022 initially at 102.063 percent of their principal amount, plus accrued and unpaid interest to the redemption date, declining ratably annually to 100 percent of their principal amount, plus accrued and unpaid interest to the redemption date, on or after October 1, 2024.
In addition, prior to October 1, 2022, we may redeem the 4 % Notes, in whole or in part, at a redemption price equal to 100 percent of their principal amount plus a make-whole premium as provided in the indenture for the 4 % Notes, together with accrued and unpaid interest to the redemption date. Additionally, before October 1, 2022, we may redeem up to 35 percent of the aggregate principal amount of outstanding 4 % Notes with the proceeds from sales of certain kinds of our capital stock at a redemption price equal to 104.125 percent of their principal amount, plus accrued and unpaid interest to the redemption date. Upon the occurrence of a change of control repurchase event as defined in the indenture for the 4 % Notes, Silgan is required to make an offer to repurchase the 4 % Notes at a purchase price equal to 101 percent of their principal amount, plus accrued and unpaid interest to the date of repurchase. In addition, in connection with any tender offer for, or any other offer to purchase, the 4% Notes (including a change of control offer), if holders of no less than 90 percent of the aggregate principal amount of the then outstanding 4 % Notes validly tender their 4 % Notes in such offer, Silgan, or a third party making such offer, is entitled to redeem all remaining 4 % Notes at the price offered to each holder (excluding any early tender, incentive or similar fee).
The net proceeds from the sale of the November 2019 issuance of the 4 % Notes were approximately $394.7 million after deducting the initial purchasers’ discount and offering expenses. We used the net proceeds from the sale of the 4 % Notes to repay outstanding revolving loans under the Credit Agreement, including revolving loans used to redeem our 5½% Senior Notes due 2022.
4¾ % SENIOR NOTES AND 3¼ % SENIOR NOTES
On February 13, 2017, we issued $300 million aggregate principal amount of our 4¾% Senior Notes due 2025, or the 4¾% Notes, and €650 million aggregate principal amount of our 3¼% Senior Notes due 2025, or the 3¼% Notes, at 100 percent of their principal amount.
The 4¾% Notes and the 3¼% Notes are general unsecured obligations of Silgan, ranking equal in right of payment with our existing and future unsecured unsubordinated indebtedness, including our 5½% Senior Notes due 2022, and ahead of our existing and future subordinated debt, if any. The 4¾% Notes and the 3¼% Notes are effectively subordinated to Silgan’s secured debt to the extent of the assets securing such debt and structurally subordinated to all obligations of subsidiaries of Silgan.
The 4¾% Notes and the 3¼% Notes will mature on March 15, 2025. Interest on the 4¾% Notes and the 3¼% Notes will be payable semi-annually in cash on March 15 and September 15 of each year. The 4¾% Notes and the 3¼% Notes were issued pursuant to an indenture by and among Silgan, U.S. Bank National Association, as trustee, Elavon Financial Services DAC, UK Branch, as paying agent in respect of the 3¼% Notes, and Elavon Financial Services DAC, as registrar and transfer agent in respect of the 3¼% Notes, which indenture contains

SILGAN HOLDINGS INC.
NOTES TO CONSOLIDATED FINANCIAL STATEMENTSDecember 31, 2019, 2018 and 2017
F-20
covenants that are generally less restrictive than those in the Credit Agreement and substantially similar to those in the indenture for the 4 % Notes.
The 4¾% Notes are redeemable, at our option, in whole or in part, at any time after March 15, 2020, initially at 102.375 percent of their principal amount plus accrued and unpaid interest thereon to the redemption date, declining ratably each year to 100 percent of their principal amount, plus accrued and unpaid interest to the redemption date, on or after March 15, 2022.
The 3¼% Notes are redeemable, at our option, in whole or in part, at any time after March 15, 2020, initially at 101.625 percent of their principal amount plus accrued and unpaid interest thereon to the redemption date, declining ratably each year to 100 percent of their principal amount, plus accrued and unpaid interest to the redemption date, on or after March 15, 2022.
In addition, prior to March 15, 2020, we may redeem up to 35 percent of the aggregate principal amount of each of the 4¾% Notes and the 3¼% Notes with the proceeds of certain equity offerings at a redemption price of 104.750 percent of their principal amount in the case of the 4¾% Notes and 103.250 percent of their principal amount in the case of the 3¼% Notes, plus, in each case, accrued and unpaid interest to the date of redemption. We may also redeem each of the 4¾% Notes and the 3¼% Notes, in whole or in part, prior to March 15, 2020 at a redemption price equal to 100 percent of their principal amount plus a make-whole premium as provided in the indenture for the 4¾% Notes and the 3¼% Notes, together with, in each case, accrued and unpaid interest to the date of redemption. Upon the occurrence of a change of control repurchase event as defined in the indenture for the 4¾% Notes and the 3¼% Notes, Silgan is required to make an offer to repurchase the 4¾% Notes and the 3¼% Notes at a repurchase price equal to 101 percent of their principal amount, plus, in each case, accrued and unpaid interest to the date of repurchase.
The net proceeds from the sale of the 4¾% Notes were approximately $296.5 million and the net proceeds from the sale of the 3¼% Notes were approximately €643.4 million, in each case after deducting the initial purchasers' discount and offering expenses. We used the net proceeds from the sale of the 4¾% Notes to prepay $212.3 million of our outstanding U.S. term loans and repay a portion of our outstanding revolving loans under our previous senior secured credit facility. We used a portion of the net proceeds from the sale of the 3¼% Notes to prepay the remaining balance of €187.0 million of Euro term loans under our previous senior secured credit facility, repay all remaining outstanding revolving loans under our previous senior secured credit facility, repay approximately €34.0 million of certain other foreign bank revolving and term loans of certain of our non U.S. subsidiaries and redeem $220.0 million aggregate principal amount of our 5% Senior Notes due 2020. In addition, we prepaid $98.0 million of our outstanding U.S. term loans and Cdn. $14.0 million of our outstanding Canadian term loans under our previous senior secured credit facility during the first quarter of 2017. As a result of the aggregate prepayments of our outstanding term loans under our previous senior secured credit facility and the partial redemption of our 5% Senior Notes due 2020, we recorded a pre-tax charge for the loss on early extinguishment of debt of $6.5 million in 2017.
5½ % SENIOR NOTES
On August 1, 2019, we redeemed all $300 million aggregate principal amount of our outstanding 5½% Senior Notes due 2022, or the 5½% Notes, at a redemption price of 100 percent of their principal amount, plus accrued and unpaid interest to the redemption date. We funded this redemption with revolving loan borrowings under the Credit Agreement and cash on hand. As a result of this redemption, we recorded a pre-tax charge for the loss on early extinguishment of debt of $1.7 million in 2019 for the write-off of unamortized debt issuance costs.
5% SENIOR NOTES
On April 3, 2017, we utilized a portion of the net proceeds from the sale of the 3¼% Notes to redeem $220.0 million aggregate principal amount of the $500 million aggregate principal amount of our 5% Senior Notes due 2020, or the 5% Notes, at a redemption price of 101.25 percent of their principal amount plus accrued and unpaid interest up to the redemption date. As a result of this partial redemption, we recorded a pre-tax charge for

SILGAN HOLDINGS INC.
NOTES TO CONSOLIDATED FINANCIAL STATEMENTSDecember 31, 2019, 2018 and 2017
F-21
the loss on early extinguishment of debt of $4.4 million in 2017 for the premium paid in connection with this partial redemption and for the write-off of unamortized debt issuance costs.
On April 16, 2018, we redeemed all remaining outstanding 5% Notes ($280.0 million aggregate principal amount) at a redemption price of 100 percent of their principal amount plus accrued and unpaid interest up to the redemption date. We funded this redemption with revolving loan borrowings under the Credit Agreement and cash on hand. As a result of this redemption, we recorded a pre-tax charge for the loss on early extinguishment of debt of $1.4 million in 2018 for the write-off of unamortized debt issuance costs.
NOTE 10. FINANCIAL INSTRUMENTS
The financial instruments recorded in our Consolidated Balance Sheets include cash and cash equivalents, trade accounts receivable, trade accounts payable, debt obligations and derivative instruments. Due to their short-term maturity, the carrying amounts of trade accounts receivable and trade accounts payable approximate their fair market values. The following table summarizes the carrying amounts and estimated fair values of our other significant financial instruments at December 31:
2019 2018
CarryingAmount
FairValue
CarryingAmount
FairValue
(Dollars in thousands)Assets:Cash and cash equivalents $ 203,824 $ 203,824 $ 72,819 $ 72,819
Liabilities:Bank debt $ 795,830 $ 795,830 $ 951,800 $ 951,8004¾% Notes 300,000 308,217 300,000 284,5173¼% Notes 729,755 748,349 744,380 746,591
400,000 401,848 — —
FAIR VALUE MEASUREMENTS
FINANCIAL INSTRUMENTS MEASURED AT FAIR VALUE
GAAP defines fair value as the price that would be received to sell an asset or paid to transfer a liability in an orderly transaction between market participants at the measurement date (exit price). GAAP classifies the inputs used to measure fair value into a hierarchy consisting of three levels. Level 1 inputs represent unadjusted quoted prices in active markets for identical assets or liabilities. Level 2 inputs represent unadjusted quoted prices in active markets for similar assets or liabilities, or unadjusted quoted prices for identical or similar assets or liabilities in markets that are not active, or inputs other than quoted prices that are observable for the asset or liability. Level 3 inputs represent unobservable inputs for the asset or liability. Financial assets and liabilities are classified in their entirety based on the lowest level of input that is significant to the fair value measurement.
The financial assets and liabilities that are measured on a recurring basis at December 31, 2019 and 2018 consist of our cash and cash equivalents and derivative instruments. We measured the fair value of cash and cash equivalents using Level 1 inputs. We measured the fair value of our derivative instruments using the income approach. The fair value of our derivative instruments reflects the estimated amounts that we would pay or receive based on the present value of the expected cash flows derived from market rates and prices. As such, these derivative instruments are classified within Level 2.

SILGAN HOLDINGS INC.
NOTES TO CONSOLIDATED FINANCIAL STATEMENTSDecember 31, 2019, 2018 and 2017
F-22
FINANCIAL INSTRUMENTS NOT MEASURED AT FAIR VALUE
Our bank debt, 4¾% Notes, 3¼% Notes and 4 % Notes were recorded at historical amounts in our Consolidated Balance Sheets, as we have not elected to measure them at fair value. We measured the fair value of our variable rate bank debt using the market approach based on Level 2 inputs. Fair values of the 4¾% Notes, 3¼% Notes and 4 % Notes were estimated based on the quoted market price, a Level 1 input.
DERIVATIVE INSTRUMENTS AND HEDGING ACTIVITIES
We utilize swap agreements to manage a portion of our interest rate and natural gas cost exposures. We do not utilize derivative financial instruments for trading or other speculative purposes.
Our interest rate and natural gas swap agreements are accounted for as cash flow hedges and changes in their fair values are recorded in accumulated other comprehensive loss, a component of stockholder's equity, and reclassified into earnings in future periods when earnings are affected by the variability of the hedged cash flows.
INTEREST RATE SWAP AGREEMENTS
We have entered into two U.S. dollar interest rate swap agreements, each for $50.0 million notional principal amount, to manage a portion of our exposure to interest rate fluctuations. These interest rate swap agreements effectively convert interest rate exposure from variable rates to fixed rates of interest. Under these agreements, we will pay a fixed rate of interest of 2.878 percent and receive floating rates of interest based on the three month LIBOR. These agreements were entered into in 2018, became effective on March 29, 2019 and mature on March 24, 2023. The difference between amounts to be paid or received on interest rate swap agreements is recorded in interest and other debt expense in our Consolidated Statements of Income, and such difference was not significant for the year ended December 31, 2019. These agreements are with financial institutions which are expected to fully perform under the terms thereof. The total fair value of our interest rate swap agreements at December 31, 2019 and 2018 was not significant.
NATURAL GAS SWAP AGREEMENTS
We have entered into natural gas swap agreements with a major financial institution to manage a portion of our exposure to fluctuations in natural gas prices. The difference between amounts to be paid or received on natural gas swap agreements is recorded in cost of goods sold in our Consolidated Statements of Income and was not significant for each of the years ended December 31, 2019, 2018 and 2017. These agreements are with financial institutions which are expected to fully perform under the terms thereof. The total fair value of our natural gas swap agreements in effect at December 31, 2019 and 2018 was not significant.
FOREIGN CURRENCY EXCHANGE RATE RISK
In an effort to minimize foreign currency exchange rate risk, we have financed acquisitions of foreign operations primarily with borrowings denominated in Euros and Canadian dollars. In addition, where available, we have borrowed funds in local currency or implemented certain internal hedging strategies to minimize our foreign currency exchange rate risk related to foreign operations, including net investment hedges related to the 3¼% Notes which are Euro denominated. Foreign currency gains (losses) related to our net investment hedges included in accumulated other comprehensive loss were $6.8 million, $16.6 million and $(46.1) million for the years ended December 31, 2019, 2018 and 2017, respectively.
CONCENTRATION OF CREDIT RISK
We derive a significant portion of our revenue from multi-year supply agreements with many of our customers. Aggregate revenues from our three largest customers (Nestlé Food Company, Campbell Soup Company and Del Monte Corporation) accounted for approximately 23.6 percent, 23.0 percent and 23.7 percent of our net sales in 2019, 2018 and 2017, respectively. The receivable balances from these customers collectively represented 5.6 percent and 5.5 percent of our trade accounts receivable at December 31, 2019 and 2018, respectively. As is common in the packaging industry, we provide extended payment terms to some of our customers due to the seasonality of the vegetable and fruit packing process. Exposure to losses is dependent on each customer’s financial position. We perform ongoing credit evaluations of our customers’ financial condition, and our receivables

SILGAN HOLDINGS INC.
NOTES TO CONSOLIDATED FINANCIAL STATEMENTSDecember 31, 2019, 2018 and 2017
F-23
are generally not collateralized. We maintain an allowance for doubtful accounts which we believe is adequate to cover potential credit losses based on customer credit evaluations, collection history and other information. Accounts receivable are considered past due based on the original due date and write-offs occur only after all reasonable collection efforts are exhausted.
NOTE 11. COMMITMENTS AND CONTINGENCIES
We have noncancelable operating leases for office and plant facilities, equipment and automobiles that expire at various dates through 2040. Certain operating leases have renewal options and rent escalation clauses as well as various purchase options.
Lease right-of-use assets represent the right to use an underlying asset pursuant to the lease for the lease term, and lease liabilities represent the obligation to make lease payments arising from the lease. Lease right-of-use assets and lease liabilities are recognized at the commencement of an arrangement where it is determined at inception that a lease exists. These assets and liabilities are initially recognized based on the present value of lease payments over the lease term calculated using our incremental borrowing rate generally applicable to the location of the lease right-of-use asset, unless an implicit rate is readily determinable. We combine lease and certain non-lease components in determining the lease payments subject to the initial present value calculation. Lease right-of-use assets include upfront lease payments and exclude lease incentives, where applicable. Lease terms include options to extend or terminate the lease when it is reasonably certain that those options will be exercised.
Lease expense for operating leases consists of both fixed and variable components. Expense related to fixed lease payments are recognized on a straight-line basis over the lease term. Variable lease payments are generally expensed as incurred, where applicable, and include certain index-based changes in rent, certain non-lease components, such as maintenance and other services provided by the lessor, and other charges included in the lease. Leases with an initial term of twelve months or less are not recorded on the balance sheet. The depreciable life of lease right-of-use assets is generally the expected lease term, unless there is a transfer of title or purchase option reasonably certain of exercise for such assets.
We recognized total lease expense of $71.0 million, $52.2 million and $52.0 million for the years ended December 31, 2019, 2018 and 2017, respectively, primarily related to operating lease costs paid to lessors from operating cash flows. Lease expense disclosed under previous lease accounting guidance for the years ended December 31, 2018 and 2017 excluded certain payments for variable lease costs and short-term lease costs. Right-of-use assets obtained in exchange for new operating lease liabilities, a non-cash item, were $52.0 million for the year ended December 31, 2019.
Operating lease right-of-use assets as of December 31, 2019 were recorded in our Consolidated Balance Sheets as other assets, net of $186.8 million. Operating lease liabilities of $195.2 million as of December 31, 2019 were recorded in our Consolidated Balance Sheets as accrued liabilities of $36.5 million and other liabilities of $158.7 million. At December 31, 2019, our operating leases had a weighted average discount rate of 5.6 percent and a weighted average remaining lease term of approximately 7 years.
To a lesser extent, we have certain leases that qualify as finance leases. Finance lease right-of-use assets as of December 31, 2019 were recorded in our Consolidated Balance Sheets as property, plant and equipment, net of $33.8 million. Finance lease liabilities of $33.3 million as of December 31, 2019 were recorded in our Consolidated Balance Sheets as revolving loans and current portion of long term-debt of $1.9 million and long-term debt of $31.4 million.

SILGAN HOLDINGS INC.
NOTES TO CONSOLIDATED FINANCIAL STATEMENTSDecember 31, 2019, 2018 and 2017
F-24
The aggregate annual maturities of lease liabilities are as follows (dollars in thousands):
Operating FinanceLeases Leases
2020 $ 46,291 $ 3,3422021 39,937 3,1552022 32,306 2,8972023 26,876 2,8562024 20,941 26,629Thereafter 74,854 —Total lease payments 241,205 38,879 Less imputed interest (45,975) (5,591)Total $ 195,230 $ 33,288
At December 31, 2019, we did not have any significant operating or finance leases that had not commenced.
At December 31, 2019, we had noncancelable commitments for capital expenditures in 2020 of $34.0 million.
A competition authority in Germany commenced an antitrust investigation in 2015 involving the industry association for metal packaging in Germany and its members, including our metal container and closures subsidiaries in Germany. At the end of April 2018, the European Commission commenced an antitrust investigation involving the metal packaging industry in Europe including our metal container and closures subsidiaries, which should effectively close out the investigation in Germany. Given the continued early stage of the investigation, we cannot reasonably assess what actions may result from these investigations or estimate what costs we may incur as a result thereof.
We are a party to other legal proceedings, contract disputes and claims arising in the ordinary course of our business. We are not a party to, and none of our properties are subject to, any pending legal proceedings which could have a material adverse effect on our business or financial condition.

SILGAN HOLDINGS INC.
NOTES TO CONSOLIDATED FINANCIAL STATEMENTSDecember 31, 2019, 2018 and 2017
F-25
NOTE 12. RETIREMENT BENEFITS
We sponsor a number of defined benefit and defined contribution pension plans which cover substantially all U.S. employees, other than union employees covered by multiemployer defined benefit pension plans under collective bargaining agreements. Pension benefits are provided based on either a career average, final pay or years of service formula. With respect to certain hourly employees, pension benefits are provided based on stated amounts for each year of service. Our U.S. salaried pension plans are closed to new employees.
We also sponsor other postretirement benefits plans, including unfunded defined benefit health care and life insurance plans, which provide postretirement benefits to certain employees. The plans are contributory, with retiree contributions adjusted annually, and contain cost sharing features including deductibles and coinsurance. Retiree health care benefits are paid as covered expenses are incurred.
The changes in benefit obligations and plan assets as well as the funded status of our retirement plans at December 31 were as follows:
Pension BenefitsOther
Postretirement Benefits 2019 2018 2019 2018 (Dollars in thousands)
Change in benefit obligationObligation at beginning of year $ 751,625 $ 808,149 $ 19,186 $ 20,939
Service cost 12,505 14,238 80 99Interest cost 28,316 25,316 759 640Actuarial losses (gains) 103,918 (53,044) 3,477 (2,031)Plan amendments 528 — — 1,210Benefits paid (39,508) (38,335) (1,888) (1,764)Participants’ contributions — — 104 93Foreign currency exchange rate changes (1,875) (4,699) — —
Obligation at end of year 855,509 751,625 21,718 19,186Change in plan assetsFair value of plan assets at beginning of year 732,502 825,806 — —
Actual return on plan assets 174,014 (57,082) — —Employer contributions 2,062 2,113 1,784 1,671Participants’ contributions — — 104 93Benefits paid (39,508) (38,335) (1,888) (1,764)
Fair value of plan assets at end of year 869,070 732,502 — —Funded status $ 13,561 $ (19,123) $ (21,718) $ (19,186)
Actuarial losses (gains) related to pension benefits were primarily the result of changes in discount rates used to calculate projected benefit obligations.

SILGAN HOLDINGS INC.
NOTES TO CONSOLIDATED FINANCIAL STATEMENTSDecember 31, 2019, 2018 and 2017
F-26
Pension BenefitsOther
Postretirement Benefits 2019 2018 2019 2018 (Dollars in thousands)
Amounts recognized in the consolidatedbalance sheetsNon-current assets $ 122,552 $ 76,443 $ — $ —Current liabilities (2,225) (2,174) (1,794) (1,924)Non-current liabilities (106,766) (93,392) (19,924) (17,262)
Net amount recognized $ 13,561 $ (19,123) $ (21,718) $ (19,186)Amounts recognized in accumulated other
comprehensive loss (income)Net actuarial loss (gain) $ 193,061 $ 218,867 $ (3,123) $ (7,087)Prior service cost (credit) 1,179 765 (6,405) (8,735)
Net amount recognized $ 194,240 $ 219,632 $ (9,528) $ (15,822)
The fair value of plan assets for our domestic pension plans was 116 percent and 112 percent of their projected benefit obligations at December 31, 2019 and 2018, respectively. Pension plans with projected benefit obligations in excess of plan assets at December 31, 2019 and 2018 consisted entirely of our international pension benefit plans which are not funded. The projected benefit obligation for our international pension benefit plans was $109.0 million and $95.6 million at December 31, 2019 and 2018, respectively.
The accumulated benefit obligation for all pension benefit plans at December 31, 2019 and 2018 was $828.0 million and $728.7 million, respectively. Pension plans with accumulated benefit obligations in excess of plan assets at December 31, 2019 and 2018 consisted entirely of our international pension benefit plans which are not funded. The accumulated benefit obligation for our international pension benefit plans was $103.9 million and $93.1 million at December 31, 2019 and 2018, respectively.
The benefits expected to be paid from our pension and other postretirement benefit plans, which reflect future years of service, are as follows (dollars in thousands):
PensionBenefits
OtherPostretirement
Benefits2020 $ 42,916 $ 1,7982021 42,716 1,6712022 43,807 1,5272023 44,882 1,4662024 45,793 1,4162025-2029 237,935 6,463
$ 458,049 $ 14,341

SILGAN HOLDINGS INC.
NOTES TO CONSOLIDATED FINANCIAL STATEMENTSDecember 31, 2019, 2018 and 2017
F-27
Our principal domestic pension and other postretirement benefit plans used the following weighted average actuarial assumptions to determine the benefit obligations at December 31:
2019 2018Discount rate 3.4% 4.5%Expected return on plan assets 8.5% 8.5%Rate of compensation increase 2.5% 2.6%Health care cost trend rate:
Assumed for next year 6.3% 6.4%Ultimate rate 4.3% 4.3%Year that the ultimate rate is reached 2035 2035
Our expected return on plan assets is determined by current and expected asset allocation of plan assets, estimates of future long-term returns on those types of plan assets and historical long-term investment performance.
Our international pension benefit plans used a discount rate of 1.5 percent and 2.2 percent as of December 31, 2019 and 2018, respectively, and a rate of compensation increase of 3.3 percent to determine the benefit obligation as of each of December 31, 2019 and 2018.
The components of the net periodic benefit credit for each of the years ended December 31 were as follows:
Pension Benefits Other Postretirement Benefits 2019 2018 2017 2019 2018 2017 (Dollars in thousands)
Service cost $ 12,505 $ 14,238 $ 13,372 $ 80 $ 99 $ 104Interest cost 28,316 25,316 25,501 759 640 692Expected return on plan assets (60,567) (68,575) (63,010) — — —Amortization of prior service cost
(credit) 115 173 313 (2,330) (1,392) (3,418)Amortization of actuarial losses
(gains) 16,399 7,378 7,077 (488) (506) (596)Net periodic benefit credit $ (3,232) $ (21,470) $ (16,747) $ (1,979) $ (1,159) $ (3,218)
Our principal domestic pension and other postretirement benefit plans used the following weighted average actuarial assumptions to determine net periodic benefit credit for the years ended December 31:
2019 2018 2017Discount rate 4.5% 3.8% 4.4%Expected return on plan assets 8.5% 8.5% 8.5%Rate of compensation increase 2.6% 2.6% 2.8%Health care cost trend rate 6.4% 6.2% 6.4%
Our international pension benefit plans used a discount rate of 2.2 percent, 2.1 percent and 1.9 percent for the years ended December 31, 2019, 2018 and 2017, respectively, and used a rate of compensation increase of 3.3 percent to determine net periodic benefit credit for each of the years ended December 31, 2019, 2018 and 2017.

SILGAN HOLDINGS INC.
NOTES TO CONSOLIDATED FINANCIAL STATEMENTSDecember 31, 2019, 2018 and 2017
F-28
MULTIEMPLOYER PENSION PLANS
In 2019, we participated in four multiemployer pension plans which provide defined benefits to certain of our union employees. The aggregate amount contributed to these plans and charged to pension cost in 2019, 2018 and 2017 was $4.8 million, $5.3 million and $6.4 million, respectively.
The risks of participating in multiemployer plans are different from the risks of single-employer plans in the following respects: (i) assets contributed to a multiemployer plan by one employer may be used to provide benefits to employees of other participating employers; (ii) if a participating employer ceases to contribute to the plan, the unfunded obligations of the plan may be borne by the remaining participating employers; and (iii) if we cease to have an obligation to contribute to the multiemployer plan in which we had been a contributing employer, we may be required to pay to the plan an amount (referred to as a withdrawal liability) based on the underfunded status of the plan and on our historical participation in the plan prior to the cessation of our obligation to contribute.
Based on the latest information available, in 2019 we participated in three multiemployer plans with a funded status less than 65 percent. Further information on these multiemployer plans for the years ended December 31, 2019, 2018 and 2017 is as follows:
Pension FundEIN/Pension Plan
Number
PensionProtectionAct Zone
StatusFIP / RPStatus
Pending /Implemented
Contributions SurchargeImposed2019 2018 2019 2018 2017
(Dollars in thousands)
Central States, Southeast & Southwest Areas Pension Fund (1) 36-6044243/001 Red (2) Red (2) Implemented $ 1,166 $ 1,797 $ 1,873 NoUnited Food & CommercialWorkers — Local 1 Pension Fund (3) 16-6144007/001 Red (2) Red Implemented 245 237 232 NoIAM National Pension Fund (4) 51-6031295/002 Red Green Implemented 2,667 2,587 2,722 YesAll Other 707 671 1,596Total Contributions $ 4,785 $ 5,292 $ 6,423
______________________(1) The applicable collective bargaining agreements related to this pension fund expired at various times in 2019. In 2019,
we withdrew completely from this pension fund. See Note 4 for further information.(2) Under the Multiemployer Pension Reform Act of 2014, the status of this pension fund was critical and declining, as
defined under such Act.(3) The collective bargaining agreement related to this pension fund expires on December 31, 2020. A single company that
was making over 80 percent of the contributions for this pension fund filed for Chapter 11 bankruptcy during 2018 and withdrew from this pension fund without paying its withdrawal liability. For 2018 and 2017, the fund actuary for this pension fund projected insolvency for this pension fund in 2025 and 2049, respectively.
(4) The applicable collective bargaining agreements related to this pension fund expire at various times through December 31, 2021. Although this pension fund was formally certified in the yellow zone in 2019, the trustees of this pension plan elected voluntarily to place this pension plan in the red zone to take advantage of certain provisions of the Pension Protection Act even though at the end of 2018 this pension plan had a funded status of 89 percent.
The “EIN/Pension Plan Number” column provides the Employer Identification Number and the three digit plan number assigned to a plan by the Internal Revenue Service. The most recent Pension Protection Act Zone Status available for 2019 and 2018 is for plan years that ended in each of those years. The zone status is based on information provided to us and other participating employers by each plan and is certified by the plan’s actuary. A plan in the “red” zone has been determined to be in “critical status,” based on criteria established under the Internal Revenue Code of 1986, as amended (the “Code”), and is generally less than 65 percent funded. The “FIP/RP Status Pending/Implemented” column indicates whether a rehabilitation plan, as required under the Code to be
adopted by plans in the “red” zone, is pending or has been implemented as of the end of the 2019 plan year. The “Surcharge Imposed” column indicates whether our contribution rate for 2019 included an amount in

SILGAN HOLDINGS INC.
NOTES TO CONSOLIDATED FINANCIAL STATEMENTSDecember 31, 2019, 2018 and 2017
F-29
Our contributions to each of these respective plans were less than five percent of total contributions made by all employers to each of these respective plans, as reported by these plans for the year ended December 31, 2018, the most recent plan year available. We do not expect our contributions to these plans for the year ended December 31, 2020 to be significantly different from our contributions for the year ended December 31, 2019.
DEFINED CONTRIBUTION PLANS
We also sponsor defined contribution plans covering certain employees. Our contributions to these plans are based upon employee contributions and operating profitability. Contributions charged to expense for these plans for the years ended December 31, 2019, 2018 and 2017 were $14.4 million, $12.0 million and $11.8 million, respectively.
PLAN ASSETS
INVESTMENT STRATEGY
Our investment strategy is based on an expectation that equity securities will outperform debt securities over the long term. Accordingly, the composition of our plan assets is broadly characterized as a 58 percent/42 percent allocation between equity and debt securities. The equity securities allocation utilizes indexed U.S. equity securities (which constitutes approximately 85 percent of equity securities), with a lesser allocation to indexed international equity securities. The debt securities allocation primarily utilizes indexed investment grade U.S. debt securities. We attempt to mitigate investment risk by regularly rebalancing between equity and debt securities as contributions and benefit payments are made.
The weighted average asset allocation for our pension plans at December 31, 2019 and 2018 and target allocation for 2019 was as follows:
TargetAllocation
Actual Allocation 2019 2018Equity securities—U.S. 49% 47% 47%Equity securities—International 9% 10% 10%Debt securities 42% 42% 42%Cash and cash equivalents — 1% 1%
100% 100% 100%
FAIR VALUE MEASUREMENTS
Our plan assets are primarily invested in commingled funds holding equity and debt securities, which are valued using the Net Asset Value, or NAV, provided by the administrator of the fund. The NAV is based on the value of the underlying assets owned by the fund, minus its liabilities, and then divided by the number of shares outstanding. Commingled funds are classified within Level 2 (as described in Note 10) of the fair value hierarchy because the NAV’s are not publicly available. Plan excess cash balances are invested in short term investment funds which include investments in cash, bank notes, corporate notes, government bills and various short-term debt instruments. These typically are commingled funds valued using one dollar for the NAV. These short term funds are also classified within Level 2 of the valuation hierarchy.
addition to the contribution rate specified in the applicable collective bargaining agreement, as imposed by a plan in "critical status” in accordance with the requirements of the Code.

SILGAN HOLDINGS INC.
NOTES TO CONSOLIDATED FINANCIAL STATEMENTSDecember 31, 2019, 2018 and 2017
F-30
The fair value of our plan assets by asset category consisted of the following at December 31:
2019 2018 (Dollars in thousands)Equity securities—U.S. $ 414,260 $ 350,728Equity securities—International 86,822 73,415Debt securities 362,020 304,128Cash and cash equivalents 5,968 4,231
$ 869,070 $ 732,502
CONCENTRATIONS OF CREDIT RISK
As of December 31, 2019, approximately 99 percent of our plan assets were under management by a single investment management company in six individual commingled equity and debt index funds. Of these six funds, four funds held assets individually in excess of ten percent of our total plan assets.
EXPECTED CONTRIBUTIONS
Based on current legislation, there are no significant minimum required contributions to our pension benefit plans in 2020. In addition, based on the current funded status of our domestic pension benefit plans we do not expect to make significant contributions to these plans in 2020. However, this estimate may change based on regulatory changes and actual plan asset returns.
NOTE 13. INCOME TAXES
Income before income taxes was taxed in the following jurisdictions in each of the years ended December 31:
2019 2018 2017 (Dollars in thousands)Domestic $ 194,822 $ 215,354 $ 187,521Foreign 57,314 77,947 52,160Total $ 252,136 $ 293,301 $ 239,681
The components of the provision (benefit) for income taxes were as follows:
2019 2018 2017 (Dollars in thousands)Current:
Federal $ 41,949 $ 17,846 $ 56,834State 13,924 3,336 7,507Foreign 23,308 24,385 20,650
Current income tax provision 79,181 45,567 84,991Deferred:
Federal (11,521) 25,887 (118,919)State (5,013) 3,382 4,413Foreign (4,325) (5,529) (463)
Deferred income tax (benefit) provision (20,859) 23,740 (114,969)$ 58,322 $ 69,307 $ (29,978)
On December 22, 2017, the 2017 Tax Act was signed into law, making significant changes to the Internal Revenue Code. Changes include, but are not limited to, a federal corporate tax rate decrease from 35 percent to 21 percent effective for tax years beginning after December 31, 2017 and a one-time transition tax on the mandatory deemed repatriation of cumulative foreign earnings as of December 31, 2017 as part of the move from a worldwide

SILGAN HOLDINGS INC.
NOTES TO CONSOLIDATED FINANCIAL STATEMENTSDecember 31, 2019, 2018 and 2017
F-31
to a territorial tax system. The 2017 Tax Act also provides for the acceleration of depreciation for certain assets placed into service after September 27, 2017 as well as prospective changes beginning in 2018, including the repeal of the domestic manufacturing deduction, acceleration of tax revenue recognition, capitalization of research and development expenditures, additional limitations on the deductibility of executive compensation and limitations on the deductibility of interest. We recognized the impact of the 2017 Tax Act in our year end income tax provision for 2017 and recorded $110.9 million as an additional income tax benefit in the fourth quarter of 2017. This income tax benefit primarily represented the provisional amount related to the remeasurement of net deferred tax liabilities based on the rates at which they are expected to be taxed in the future. The provisional estimate also reflected our computation that we will not incur the one-time transition tax on the mandatory deemed repatriation of cumulative foreign earnings.
We recognized the income tax effects of the 2017 Tax Act in our 2017 financial statements in accordance with the Staff Accounting Bulletin No. 118, or SAB 118, issued by the staff of the Securities and Exchange Commission, which provides guidance for the application of GAAP as it pertains to accounting for income taxes, in the reporting period in which the 2017 Tax Act was signed into law. In accordance with SAB 118, we had determined that the $110.9 million deferred tax benefit recorded in the fourth quarter of 2017 primarily in connection with the remeasurement of deferred tax assets and liabilities and the computation related to the one-time transition tax on the mandatory deemed repatriation of cumulative foreign earnings were provisional amounts and a reasonable estimate at December 31, 2017.
As of December 31, 2018, we completed our accounting for all of the enactment date income tax effects of the 2017 Tax Act. During 2018, we recognized insignificant adjustments to the provisional amounts recorded at December 31, 2017 and included these adjustments as a component of income tax expense. The final amount of the income tax benefit from the enactment of the 2017 Tax Act was $111.6 million, which related primarily to the remeasurement of deferred tax assets and liabilities. We did not incur any income tax expense due to the one-time transition tax on the mandatory deemed repatriation of cumulative foreign earnings. As of January 1, 2018, the 2017 Tax Act imposes a minimum tax on foreign earnings in excess of a return on tangible assets, commonly referred to as the tax on Global Intangible Low-Taxed Income. We have elected to account for this tax as a component of current income tax expense.
The provision (benefit) for income taxes varied from income taxes computed at the statutory U.S. federal income tax rate as a result of the following:
2019 2018 2017 (Dollars in thousands)Income taxes computed at the statutory U.S. federal income tax rate $ 52,949 $ 61,543 $ 83,884State income taxes, net of federal tax benefit 7,133 6,326 4,529Tax liabilities (no longer required) required (2,002) 1,908 1,254Valuation allowance 1,699 240 4,636Manufacturing exemption — — (5,143)Tax credit refunds, net (3,493) (3,415) (2,797)Foreign earnings taxed at other than 21%, 21%
and 35%, respectively 3,741 7,851 (3,840)Deferred tax rate changes 92 (1,947) (114,163)Other (1,797) (3,199) 1,662
$ 58,322 $ 69,307 $ (29,978)
Effective tax rate 23.1% 23.6% (12.5)%
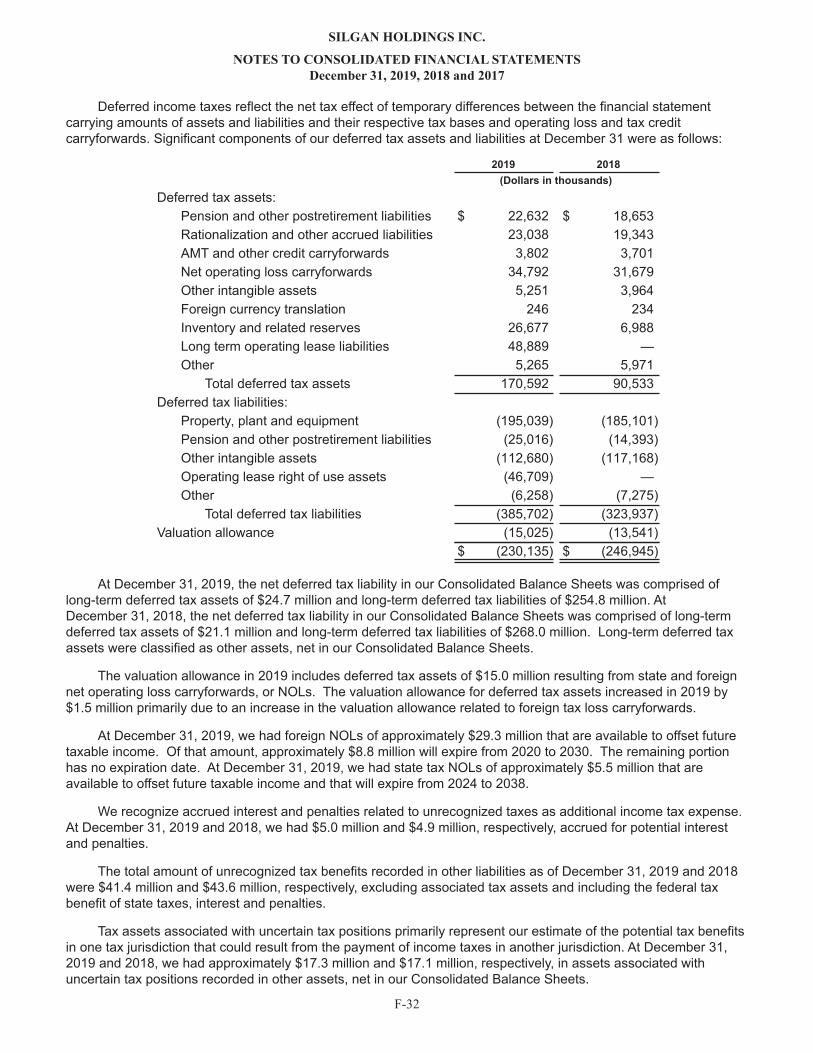
SILGAN HOLDINGS INC.
NOTES TO CONSOLIDATED FINANCIAL STATEMENTSDecember 31, 2019, 2018 and 2017
F-32
Deferred income taxes reflect the net tax effect of temporary differences between the financial statement carrying amounts of assets and liabilities and their respective tax bases and operating loss and tax credit carryforwards. Significant components of our deferred tax assets and liabilities at December 31 were as follows:
2019 2018 (Dollars in thousands)Deferred tax assets:
Pension and other postretirement liabilities $ 22,632 $ 18,653Rationalization and other accrued liabilities 23,038 19,343AMT and other credit carryforwards 3,802 3,701Net operating loss carryforwards 34,792 31,679Other intangible assets 5,251 3,964Foreign currency translation 246 234Inventory and related reserves 26,677 6,988Long term operating lease liabilities 48,889 —Other 5,265 5,971
Total deferred tax assets 170,592 90,533Deferred tax liabilities:
Property, plant and equipment (195,039) (185,101)Pension and other postretirement liabilities (25,016) (14,393)Other intangible assets (112,680) (117,168)Operating lease right of use assets (46,709) —Other (6,258) (7,275)
Total deferred tax liabilities (385,702) (323,937)Valuation allowance (15,025) (13,541)
$ (230,135) $ (246,945)
At December 31, 2019, the net deferred tax liability in our Consolidated Balance Sheets was comprised of long-term deferred tax assets of $24.7 million and long-term deferred tax liabilities of $254.8 million. At December 31, 2018, the net deferred tax liability in our Consolidated Balance Sheets was comprised of long-term deferred tax assets of $21.1 million and long-term deferred tax liabilities of $268.0 million. Long-term deferred tax assets were classified as other assets, net in our Consolidated Balance Sheets.
The valuation allowance in 2019 includes deferred tax assets of $15.0 million resulting from state and foreign net operating loss carryforwards, or NOLs. The valuation allowance for deferred tax assets increased in 2019 by $1.5 million primarily due to an increase in the valuation allowance related to foreign tax loss carryforwards.
At December 31, 2019, we had foreign NOLs of approximately $29.3 million that are available to offset future taxable income. Of that amount, approximately $8.8 million will expire from 2020 to 2030. The remaining portion has no expiration date. At December 31, 2019, we had state tax NOLs of approximately $5.5 million that are available to offset future taxable income and that will expire from 2024 to 2038.
We recognize accrued interest and penalties related to unrecognized taxes as additional income tax expense. At December 31, 2019 and 2018, we had $5.0 million and $4.9 million, respectively, accrued for potential interest and penalties.
The total amount of unrecognized tax benefits recorded in other liabilities as of December 31, 2019 and 2018 were $41.4 million and $43.6 million, respectively, excluding associated tax assets and including the federal tax benefit of state taxes, interest and penalties.
Tax assets associated with uncertain tax positions primarily represent our estimate of the potential tax benefits in one tax jurisdiction that could result from the payment of income taxes in another jurisdiction. At December 31, 2019 and 2018, we had approximately $17.3 million and $17.1 million, respectively, in assets associated with uncertain tax positions recorded in other assets, net in our Consolidated Balance Sheets.

SILGAN HOLDINGS INC.
NOTES TO CONSOLIDATED FINANCIAL STATEMENTSDecember 31, 2019, 2018 and 2017
F-33
A reconciliation of the beginning and ending amount of gross unrecognized tax benefits included as other liabilities in our Consolidated Balance Sheets was as follows:
2019 2018 (Dollars in thousands)Balance at January 1, $ 43,508 $ 45,146
Decrease based upon tax positions of current year (488) —Increase based upon tax positions of a prior year 604 1,022Decrease based upon settlements with taxing authorities (1,316) (1,253)Decrease based upon a lapse in the statute of limitations (4,025) (1,407)
Balance at December 31, $ 38,283 $ 43,508
The total amount of unrecognized tax benefits that would impact the effective tax rate, if recognized, at December 31, 2019 and 2018 were $25.5 million and $28.0 million, respectively.
Silgan and its subsidiaries file U.S. Federal income tax returns, as well as income tax returns in various states and foreign jurisdictions. The Internal Revenue Service, or IRS, has completed its review of the 2018 tax year with no change to our filed tax return. We have been accepted into the Compliance Assurance Program for the 2019 and 2020 tax years which provides for the review by the IRS of tax matters relating to our tax return prior to filing. We are subject to examination by state and local tax authorities generally for the period mandated by statute, with the exception of states where waivers of the statute of limitations have been executed. The earliest open period for a state audit is 2013. Our foreign subsidiaries are generally not subject to examination by tax authorities for periods before 2008, and we have contractual indemnities with third parties with respect to open periods that predate our ownership of certain foreign subsidiaries. Subsequent periods may be examined by the relevant tax authorities. In the next twelve months, it is reasonably possible that our reserve for unrecognized tax benefits will decrease by approximately $5.6 million primarily related to tax attributes acquired from and expenses related to certain acquisitions, as we anticipate the expiration of the applicable statute of limitations with respect to certain tax matters.
As a result of the 2017 Tax Act, we have changed our assertion of indefinite reinvestment of the earnings of certain of our foreign subsidiaries. In connection with this change, we are estimating that there is no deferred tax to record for any U.S. income tax and foreign taxes on previously unremitted earnings of such foreign subsidiaries. For our foreign subsidiaries where we expect to be indefinitely reinvested, we estimate that the unremitted earnings as of December 31, 2019 are approximately $102.2 million. The amount of unrecognized deferred tax liabilities on these indefinitely reinvested earnings is estimated to be approximately $3.2 million.
As of December 31, 2017, we reclassified the stranded tax effects resulting from the decrease in the federal corporate tax rate and certain other tax effects (primarily the decreased federal benefit of state income taxes) as a result of the 2017 Tax Act. As a result, we increased each of accumulated other comprehensive loss and retained earnings by $22.1 million in 2017. See Note 5 for further information.

SILGAN HOLDINGS INC.
NOTES TO CONSOLIDATED FINANCIAL STATEMENTSDecember 31, 2019, 2018 and 2017
F-34
NOTE 14. STOCK-BASED COMPENSATION
The Silgan Holdings Inc. Amended and Restated 2004 Stock Incentive Plan, or the Plan, provides for awards of stock options, stock appreciation rights, restricted stock, restricted stock units and performance awards to our officers, other key employees and outside directors.
Shares of our common stock issued under the Plan shall be authorized but unissued shares or treasury shares. The maximum aggregate number of shares of our common stock that may be issued in connection with stock options, stock appreciation rights, restricted stock, restricted stock units and performance awards under the Plan shall not exceed 19,200,000 shares. Each award of stock options or stock appreciation rights under the Plan will reduce the number of shares of our common stock available for future issuance under the Plan by the number of shares of our common stock subject to the award. Each award of restricted stock or restricted stock units under the Plan, in contrast, will reduce the number of shares of our common stock available for future issuance under the Plan by two shares for every one restricted share or restricted stock unit awarded. As of December 31, 2019, 4,378,990 shares were available to be awarded under the Plan.
We measure the cost of employee services received in exchange for an award of equity instruments based on the grant date fair value of the award. The cost is recognized over the period during which an employee is required to provide service in exchange for the award, usually the vesting period. Stock-based compensation expense for the years ended December 31, 2019, 2018 and 2017 recorded in selling, general and administrative expenses was $17.1 million, $14.9 million and $14.6 million, respectively.
RESTRICTED STOCK UNITS
Restricted stock units issued are generally accounted for as fixed grants and, accordingly, the fair value at the grant date is being amortized ratably over the respective vesting period. The maximum contractual vesting period for restricted stock units outstanding at December 31, 2019 is five years. Unvested restricted stock units may not be disposed of or transferred during the vesting period. Restricted stock units carry with them the right to receive, upon vesting, dividend equivalents.
The table below summarizes restricted stock unit activity for the year ended December 31, 2019:
RestrictedStock Units
WeightedAverage
Grant DateFair Value
Restricted stock units outstanding at December 31, 2018 2,202,224 $ 26.16Granted 1,086,004 28.51Released (1,301,777) 24.49Forfeited (11,876) 28.87
Restricted stock units outstanding at December 31, 2019 1,974,575 28.54
The weighted average grant date fair value of restricted stock units granted during 2018 and 2017 was $28.51 and $29.94, respectively. The fair value of restricted stock units released during the years ended December 31, 2019, 2018 and 2017 was $37.2 million, $9.7 million and $12.8 million, respectively.
As of December 31, 2019, there was approximately $38.8 million of total unrecognized compensation expense related to restricted stock units. This cost is expected to be recognized over a weighted average period of 2.8 years.

SILGAN HOLDINGS INC.
NOTES TO CONSOLIDATED FINANCIAL STATEMENTSDecember 31, 2019, 2018 and 2017
F-35
NOTE 15. CAPITAL STOCK
CAPITAL STOCK
At December 31, 2019, our authorized capital stock consists of 400,000,000 shares of common stock, par value $0.01 per share, and 10,000,000 shares of preferred stock, par value of $0.01 per share.
TREASURY STOCK
On October 17, 2016, our Board of Directors authorized the repurchase by us of up to an aggregate of $300.0 million of our common stock by various means from time to time through and including December 31, 2021. Pursuant to this authorization, we repurchased an aggregate of 407,540 shares of our common stock in 2019 at an average price per share of $29.70, for a total purchase price of $12.1 million. In 2018, we repurchased a total of 188,300 shares of our common stock at an average price per share of $25.31, for a total purchase price of $4.8 million. In 2016, pursuant to this authorization and the remaining amount from a prior authorization, we repurchased a total of 294,930 shares of our common stock at an average price per share of $24.40, for a total purchase price of $7.2 million. Accordingly, at December 31, 2019, we had approximately $112.5 million remaining for the repurchase of our common stock under the October 17, 2016 Board of Directors authorization.
In 2019, 2018 and 2017, we issued 1,301,777 treasury shares, 339,972 treasury shares and 421,108 treasury shares, respectively, at an average cost of $2.86 per share, $3.12 per share and $3.15 per share, for restricted stock units that vested during these years. In 2019, 2018 and 2017, we repurchased 543,369 shares, 107,420 shares and 138,080 shares of our common stock, respectively, at an average cost of $28.51 per share, $28.46 per share and $30.24 per share, respectively, in accordance with the Plan to satisfy employee withholding tax requirements resulting from certain restricted stock units becoming vested.
We account for treasury shares using the FIFO cost method. As of December 31, 2019, 64,332,032 shares of our common stock were held in treasury.
NOTE 16. EARNINGS PER SHARE
The components of the calculation of earnings per share were as follows:
2019 2018 2017 (Dollars and shares in thousands)Net income $ 193,814 $ 223,994 $ 269,659Weighted average number of shares used in:
Basic earnings per share 110,939 110,603 110,353Dilutive common stock equivalents:
Restricted stock units 569 1,029 1,010Diluted earnings per share 111,508 111,632 111,363

SILGAN HOLDINGS INC.
NOTES TO CONSOLIDATED FINANCIAL STATEMENTSDecember 31, 2019, 2018 and 2017
F-36
NOTE 17. BUSINESS SEGMENT INFORMATION
We are engaged in the packaging industry and report our results in three business segments, which are our reportable segments: metal containers, closures and plastic containers. The metal containers segment manufactures steel and aluminum containers for human and pet food and general line products. The closures segment manufactures an extensive range of metal and plastic closures and dispensing systems for food, beverage, health care, garden, personal care, home and beauty products. The plastic containers segment manufactures custom designed plastic containers for personal care, food, health care, pharmaceutical, household and industrial chemical, pet food and care, agricultural, automotive and marine chemical products. These segments are strategic business operations that are managed separately to maximize the production, technology and marketing of their packaging product. Our metal container business operates primarily in North America and Europe. Our closures business operates in North and South America, Europe and Asia. Our plastic container business operates primarily in North America. The accounting policies of the business segments are the same as those described in Note 1.
Information for each of the past three years for our business segments is as follows:
MetalContainers Closures
PlasticContainers Corporate Total
(Dollars in thousands)
2019Net sales $ 2,473,214 $ 1,405,611 $ 611,102 $ — $ 4,489,927Depreciation and amortization 86,114 83,133 37,077 159 206,483Rationalization charges 49,425 6,562 364 — 56,351Segment income (1) 159,980 173,485 48,915 (22,894) 359,486Segment assets 1,853,875 2,263,131 722,848 35,474 4,875,328Capital expenditures 102,832 95,153 32,928 31 230,9442018Net sales $ 2,377,980 $ 1,456,799 $ 614,096 $ — $ 4,448,875Depreciation and amortization 81,420 74,217 35,949 151 191,737Rationalization charges 5,316 180 757 — 6,253Segment income 198,826 189,906 42,562 (19,194) 412,100Segment assets 1,601,944 2,169,985 722,205 33,791 4,527,925Capital expenditures 84,490 62,183 44,242 58 190,9732017Net sales $ 2,278,054 $ 1,246,669 $ 565,131 $ — $ 4,089,854Depreciation and amortization 77,698 61,668 34,607 89 174,062Rationalization charges 3,308 1,042 1,476 — 5,826Segment income (1) 230,199 142,048 27,770 (43,027) 356,990Segment assets 1,670,426 2,182,529 704,432 34,081 4,591,468Capital expenditures 87,115 56,682 30,141 491 174,429
______________________ (1) Corporate includes costs attributed to announced acquisitions of $1.8 million and $24.7 million in 2019 and 2017,
respectively.

SILGAN HOLDINGS INC.
NOTES TO CONSOLIDATED FINANCIAL STATEMENTSDecember 31, 2019, 2018 and 2017
F-37
Total segment income is reconciled to income before income taxes as follows:
2019 2018 2017 (Dollars in thousands)Total segment income $ 359,486 $ 412,100 $ 356,990Interest and other debt expense 107,350 118,799 117,309
Income before income taxes $ 252,136 $ 293,301 $ 239,681
Total segment assets at December 31 are reconciled to total assets as follows:
2019 2018 (Dollars in thousands)Total segment assets $ 4,875,328 $ 4,527,925Other assets 55,731 51,369
Total assets $ 4,931,059 $ 4,579,294
Financial information relating to our operations by geographic area is as follows:
2019 2018 2017 (Dollars in thousands)Net sales:
United States $ 3,418,848 $ 3,333,668 $ 3,110,595Foreign:
Europe 818,032 858,255 747,043Other 253,047 256,952 232,216
Total net sales fromforeign operations 1,071,079 1,115,207 979,259Total net sales $ 4,489,927 $ 4,448,875 $ 4,089,854
Long-lived assets:United States $ 1,028,965 $ 989,426Foreign:
Europe 419,195 410,919Other 122,171 117,165
Total long-lived assets atforeign operations 541,366 528,084Total long-lived assets $ 1,570,331 $ 1,517,510
Net sales are attributed to the country from which the product was manufactured and shipped.
Sales of our metal containers segment to Nestlé Food Company accounted for 11.1 percent, 10.4 percent and 10.2 percent of our consolidated net sales in 2019, 2018 and 2017, respectively.
Sales and income from operations of our metal container business and part of our closures business are dependent, in part, upon the vegetable and fruit harvests in the United States and, to a lesser extent, in a variety of national growing regions in Europe. The size and quality of these harvests varies from year to year, depending in large part upon the weather conditions in applicable regions. Because of the seasonality of the harvests, we have historically experienced higher unit sales volume in the third quarter of our fiscal year and generated a disproportionate amount of our annual income from operations during that quarter (see Note 18).

SILGAN HOLDINGS INC.
NOTES TO CONSOLIDATED FINANCIAL STATEMENTSDecember 31, 2019, 2018 and 2017
F-38
NOTE 18. QUARTERLY RESULTS OF OPERATIONS (UNAUDITED)
The following table presents our quarterly results of operations for the years ended December 31, 2019 and 2018:
First Second Third Fourth (Dollars in thousands, except per share data)2019 (1)
Net sales $ 1,027,131 $ 1,093,163 $ 1,321,342 $ 1,048,291Gross profit 165,997 183,513 207,615 156,619Net income 46,742 30,955 81,274 34,843
Basic net income per share (3) $ 0.42 $ 0.28 $ 0.73 $ 0.31Diluted net income per share (3) 0.42 0.28 0.73 0.31
Dividends per share $ 0.11 $ 0.11 $ 0.11 $ 0.11
2018 (2) Net sales $ 1,012,280 $ 1,059,103 $ 1,306,999 $ 1,070,493Gross profit 160,034 173,250 204,107 152,372Net income 45,721 55,343 84,739 38,191
Basic net income per share (3) $ 0.41 $ 0.50 $ 0.77 $ 0.35Diluted net income per share (3) 0.41 0.50 0.76 0.34
Dividends per share $ 0.10 $ 0.10 $ 0.10 $ 0.10______________________
(1) The first, second, third and fourth quarters of 2019 include rationalization charges of $6.1 million, $39.3 million, $3.2 million and $7.8 million, respectively. The third quarter of 2019 includes a loss on early extinguishment of debt of $1.7 million. The fourth quarter of 2019 includes costs attributed to announced acquisitions of $1.8 million.
(2) The first, second, third and fourth quarters of 2018 include rationalization charges of $0.7 million, $0.5 million, $0.3 million and $4.8 million, respectively. The second quarter of 2018 includes a loss on early extinguishment of debt of $2.5 million.
(3) Net income per share data is computed independently for each of the periods presented. Accordingly, the sum of the quarterly earnings per share amounts may not equal the total for the year.

SILGAN HOLDINGS INC.
NOTES TO CONSOLIDATED FINANCIAL STATEMENTSDecember 31, 2019, 2018 and 2017
F-39
NOTE 19. SUBSEQUENT EVENTS
BINDING OFFER TO ACQUIRE ALBÉA'S DISPENSING BUSINESS
On January 27, 2020, we made a binding offer, or the Offer, to Twist Beauty Packaging S.A.S., or Albéa, on behalf of itself and certain of its subsidiaries, or the Sellers, to purchase all the outstanding securities of certain subsidiaries of the Sellers engaged in the dispensing business and certain assets related to the Sellers’ dispensing business in China, or collectively the Albéa Dispensing Business, for an aggregate purchase price of $900 million in cash, subject to certain adjustments, including for working capital and other current assets and current liabilities and net indebtedness. In conjunction with the Offer, we obtained a commitment for $900 million of incremental delayed draw term loans, or the Committed Financing, under the Credit Agreement. We expect to fund the purchase price for this proposed acquisition from a combination of borrowings under the Credit Agreement, including the Committed Financing, and cash on hand.
The Albéa Dispensing Business is a leading global supplier of highly engineered pumps, sprayers and foam dispensing solutions to major branded consumer goods product companies in the beauty and personal care markets. It operates a global network of 10 plants across North America, Europe, South America and Asia. For the fiscal year ended 2018, the Albéa Dispensing Business generated sales of approximately $383 million. As a result of this proposed acquisition, we expect to realize certain operational cost synergies, estimated to be approximately $20 million on an annual basis, within 18 months of closing related to procurement savings, reductions in general and administrative expenses and manufacturing efficiencies.
In the Offer, we undertake to (1) execute a securities and assets purchase agreement, or the SPA, in the form attached to the Offer upon receipt of a notice to exercise the option contained in the Offer, or the Option, by Albéa and (2) consummate the acquisition subject to the terms and conditions set forth in the SPA. The Offer will remain open for acceptance by the Sellers until the earlier of the two following dates: (1) seven business days after the completion of certain consultation and notification processes with applicable works’ councils and trade unions and (2) July 27, 2020. As set forth in the Offer, we have an exclusivity period extending from January 27, 2020 to the earlier of (1) the execution of the SPA or (2) October 27, 2020. Our and the Sellers’ obligations to complete the acquisition are subject to certain conditions, including antitrust clearances under the laws of various jurisdictions.
The form of SPA attached to the Offer provides that either we or the Sellers have the right to terminate the SPA in the event that the applicable antitrust clearances have not been obtained by October 27, 2020, or the Outside Date; provided, however, that we and the Sellers have the right to unilaterally postpone the Outside Date by up to three months after the Outside Date, or the Postponed Outside Date, in the event that applicable antitrust clearances have not yet been obtained by the Outside Date. The form of SPA further provides that if the applicable antitrust clearances have not been obtained by the Outside Date or the Postponed Outside Date, as the case may be, then we are required to pay a break fee of $25 million to the Sellers. In addition, if the parties have not yet entered into the SPA, the Sellers may terminate the Offer if (1) the applicable antitrust clearances required under the SPA are no longer capable of being obtained on or before the Outside Date or the Postponed Outside Date, as the case may be, or (2) we do not execute the SPA even though the Option has been exercised by the Sellers. In the case of either of the foregoing, then we are required to pay a termination fee of $25 million to the Sellers. Alternatively, if the Sellers have not executed the SPA after the consultation and notification processes with applicable works’ councils and trade unions have been completed, then the Sellers are required to pay $25 million to us for estimated costs and expenses and time incurred in connection with the Offer and the proposed acquisition.
ACQUISITION OF COBRA PLASTICS, INC.
On February 4, 2020, we acquired Cobra Plastics, Inc., or Cobra Plastics, a manufacturer of injection molded plastic closures for a wide variety of consumer products, with a particular focus on the aerosol overcap market. Cobra Plastics had sales of approximately $30 million for the year ended December 31, 2018 and currently operates from two manufacturing facilities located in close proximity to one another in Macedonia, Ohio.

SILGAN HOLDINGS INC.
NOTES TO CONSOLIDATED FINANCIAL STATEMENTSDecember 31, 2019, 2018 and 2017
F-40
SENIOR NOTES OFFERINGS
On February 26, 2020, we issued an additional $200 million aggregate principal amount of the 4 % Notes at 99.5 percent of their principal amount, plus accrued and unpaid interest from November 12, 2019, and €500 million aggregate principal amount of the 2¼% Notes at 100 percent of their principal amount, in a private placement in reliance on Rule 144A and Regulation S under the Securities Act of 1933, as amended. For a description of the 4 % Notes, see Note 9.
The 2¼% Notes are general unsecured obligations of Silgan, ranking equal in right of payment with our existing and future unsecured unsubordinated indebtedness, including the 4¾% Notes, the 3¼% Notes and the 4 % Notes, and ahead of our existing and future subordinated debt, if any. The 2¼% Notes are effectively subordinated to Silgan’s secured debt to the extent of the assets securing such debt and structurally subordinated to all obligations of subsidiaries of Silgan.
The 2¼% Notes will mature on June 1, 2028. Interest on the 2¼% Notes will be payable semi-annually in cash on January 15 and July 15 of each year, beginning on July 15, 2020. The 2¼% Notes were issued pursuant to an indenture by and among Silgan, U.S. Bank National Association, as trustee, Elavon Financial Services DAC, UK Branch, as paying agent, and Elavon Financial Services DAC, as registrar and transfer agent, which indenture contains covenants that are generally less restrictive than those in the Credit Agreement and substantially similar to the covenants in the indenture for the 4¾% Notes and the 3¼% Notes and the indenture for the 4 % Notes.
The 2¼% Notes are redeemable, at our option, in whole or in part, at any time after March 1, 2023, initially at 101.125 percent of their principal amount, plus accrued and unpaid interest to the redemption date, declining ratably to 100 percent of their principal amount, plus accrued and unpaid interest to the redemption date, on or after March 1, 2025.
In addition, prior to March 1, 2023, we may redeem up to 35 percent of the aggregate principal amount of the 2¼% Notes with the proceeds of certain equity offerings at a redemption price of 102.25 percent of their principal amount, plus accrued and unpaid interest to the date of redemption. We may also redeem the 2¼% Notes, in whole or in part, prior to March 1, 2023 at a redemption price equal to 100 percent of their principal amount plus a make-whole premium as provided in the indenture for the 2¼% Notes, together with accrued and unpaid interest to the date of redemption. We will be required to make an offer to repurchase the 2¼% Notes at a repurchase price equal to 101 percent of their principal amount, plus accrued and unpaid interest to the date of repurchase, upon the occurrence of a change of control repurchase event as provided in the indenture for the 2¼% Notes.
The net proceeds from the sale of the additional 4 % Notes were approximately $196.5 million and the net proceeds from the sale of the 2¼% Notes were approximately €494.0 million, in each case after deducting the initial purchasers' discount and estimated offering expenses and excluding pre-issuance interest deemed to have accrued on the additional 4 % Notes to the closing date for the additional 4 % Notes and paid by purchasers of the additional 4 % Notes. We used the net proceeds from the sale of the additional 4 % Notes and the 2¼% Notes to prepay most of our outstanding U.S. A term loans under the Credit Agreement.
Annual aggregate maturities of the prepaid U.S. A term loans of $751.2 million were extended to 2028 to match the maturities of the additional 4 % Notes and the 2¼% Notes because we refinanced these U.S. A term loans with the net proceeds from the issuances of the additional 4 % Notes and the 2¼% Notes. This amount included current maturities of U.S. A term loans of $80 million that are now classified as long-term debt in the Consolidated Balance Sheet at December 31, 2019.

F-41
SCHEDULE II — VALUATION AND QUALIFYING ACCOUNTS
SILGAN HOLDINGS INC.
For the years ended December 31, 2019, 2018 and 2017(Dollars in thousands)
AdditionsOther Changes
Increase (Decrease)
Description
Balance atbeginningof period
Charged tocosts andexpenses
Chargedto other
accounts
Cumulativetranslationadjustment Other (1)
Balanceat end
of period
For the year ended December 31, 2019:Allowance for doubtful accounts receivable $ 5,095 $ 1,609 $ — $ (56) $ (1,163) $ 5,485For the year ended December 31, 2018:Allowance for doubtful accounts receivable $ 5,339 $ 1,103 $ — $ (208) $ (1,139) $ 5,095For the year ended December 31, 2017:Allowance for doubtful accounts receivable $ 4,073 $ 1,216 $ — $ 570 $ (520) $ 5,339
______________________(1) Uncollectible accounts written off, net of recoveries.

The exhibits filed with Silgan Holdings Inc.’s Annual Report on Form 10-K for the year ended December 31,2019 are available on the Securities and Exchange Commission’s website at www.sec.gov. The Companyalso maintains a website at www.silganholdings.com on which it provides a link to access free of charge itsAnnual Report on Form 10-K for the year ended December 31, 2019 (including exhibits filed therewith).
H O L D I N G S I N C®
BOARD OF DIRECTORS
Anthony J. AllottChairman of the Board andChief Executive Officer
Leigh J. Abramson(1)(2)
Partner, Gryphon Investors
John W. Alden(1)(2)
Former Vice Chairman,United Parcel Service ofAmerica, Inc.
William T. Donovan(1)(2)
Private Equity Investor andFormer Chief Executive Officerof Total Logistics, Inc.
Kimberly A. Fields(1)(2)
Executive Vice President,Flat Rolled Products Group ofAllegheny TechnologiesIncorporated
D. Greg HorriganFormer Co-Chairman ofthe Board
Joseph M. Jordan(1)(2)
Retired Partner, KPMG LLP
Brad A. Lich(1)(2)
Executive Vice President andChief Commercial Officer,Eastman Chemical Company
R. Philip SilverFormer Co-Chairman ofthe Board
(1) Audit Committee(2) Compensation Committee
EXECUTIVE OFFICERS
Anthony J. AllottChairman of the Board andChief Executive Officer
Adam J. GreenleePresident andChief Operating Officer
Robert B. LewisExecutive Vice President andChief Financial Officer
B. Frederik PrinzenSenior Vice President,Corporate Development
Anthony P. AndreacchiVice President, Tax
Kimberly I. UlmerVice President, Finance and Treasurer
Thomas J. SnyderPresident – Silgan Containers
Frank W. Hogan, IIISenior Vice President, GeneralCounsel and Secretary
CORPORATE AND SHAREHOLDER INFORMATION
Stock Symbol Transfer Agent and Registrar
Our Common Stock is quoted on the Nasdaq GlobalSelect Market System and is traded under thesymbol “SLGN.”
SLGN
Computershare462 South 4th Street, Suite 1600Louisville, Kentucky 40202Tel. No.: (866) 220-0495Website: www.computershare.com/investor
Company Office Independent Registered Public Accounting Firm
Silgan Holdings Inc. Ernst & Young LLP4 Landmark Square, Suite 400Stamford, Connecticut 06901-2596
300 First Stamford PlaceStamford, Connecticut 06902
Main Tel. No.: (203) 975-7110Investor Relations Tel. No.: (203) 406-3160Website: www.silganholdings.com
is a registered trademark of the Company.

4 Landmark Square, Suite 400Stamford, Connecticut 06901-2596(203) 406-3160
www.silganholdings.com