Embed Size (px)
Citation preview

2019 Alabama Course of Study Mathematics
For information regarding the Alabama Course of Study Career and Technical Education and other curriculum materials contact the Instructional Services Division Alabama State Department of Education 3345 Gordon Persons Building 50 North Ripley Street Montgomery Alabama 36104 or by mail to PO Box 302101 Montgomery Alabama 36130-2101 or by telephone at (334) 694-4768
Alabama State Department of Education Eric G Mackey State Superintendent of Education
The Alabama State Board of Education and the Alabama State Department of Education do not discriminate on the basis of race color disability sex religion national origin or age in their programs activities or employment and provide equal access to the Boy Scouts and other designated youth groups The following person is responsible for handling inquiries regarding the non-discrimination policies Title IX Coordinator Alabama State Department of Education PO Box 302101 Montgomery AL 36130-2101 telephone (334) 694-4717
2019 Alabama Course of Study Mathematics iii
2019 Alabama Course of Study Mathematics
Eric G Mackey State Superintendent of Education
2019 Alabama Course of Study Mathematics iv
STATE SUPERINTENDENT OF EDUCATIONrsquoS MESSAGE
Dear Educator
Society and the workplace require that all Alabama students receive a solid foundation of knowledge skills and understanding in mathematics Alabama educators must focus on the teaching of mathematics in ways that enable students to expand professional opportunities understand and critique the world and experience the joy wonder and beauty of mathematics To address this goal the content of the 2019 Alabama Course of Study Mathematics sets high standards for all students and reflects changes designed to better meet the needs of students and teachers in the State of Alabama
The 2019 Alabama Course of Study Mathematics was developed by educators and business and community leaders to provide a foundation for building quality mathematics programs across the state Implementing the content of this document through appropriate instruction will enable all Alabama students to be mathematically well-prepared graduates
Eric G Mackey State Superintendent of Education
MEMBERS of the
ALABAMA STATE BOARD OF EDUCATION
Governor Kay Ivey
President of the State Board of Education
District
I Jackie Zeigler President Pro Tem II Tracie West
III Stephanie W Bell
IV Yvette Richardson EdD V Ella B Bell VI Cynthia Sanders McCarty PhD
VII Jeffery Newman Vice President VIII Wayne Reynolds EdD
State Superintendent Eric G Mackey
Secretary and Executive Officer
2019 Alabama Course of Study Mathematics v
2019 Alabama Course of Study Mathematics Table of Contents
PREFACE viii
ACKNOWLEDGEMENTS ix
GENERAL INTRODUCTION 1
CONCEPTUAL FRAMEWORK 2
POSITION STATEMENTS 5
STUDENT MATHEMATICAL PRACTICES 10
DIRECTIONS FOR INTERPRETING THE CONTENT STANDARDS FOR GRADES K-8 14
DIRECTIONS FOR INTERPRETING THE CONTENT STANDARDS FOR HIGH SCHOOL 15
GRADES K-8 MINIMUM REQUIRED CONTENT
GRADES K-2 OVERVIEW 17
KINDERGARTEN 18
GRADE 1 23
GRADE 2 30
GRADES 3-5 OVERVIEW 36
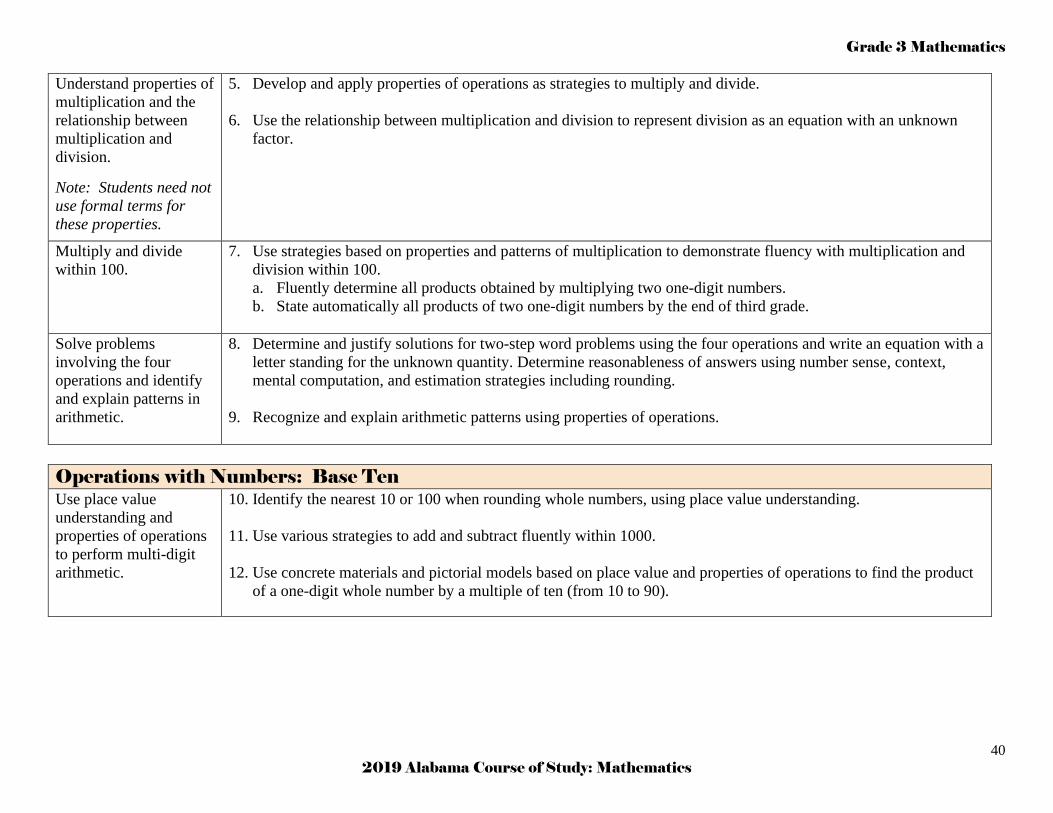
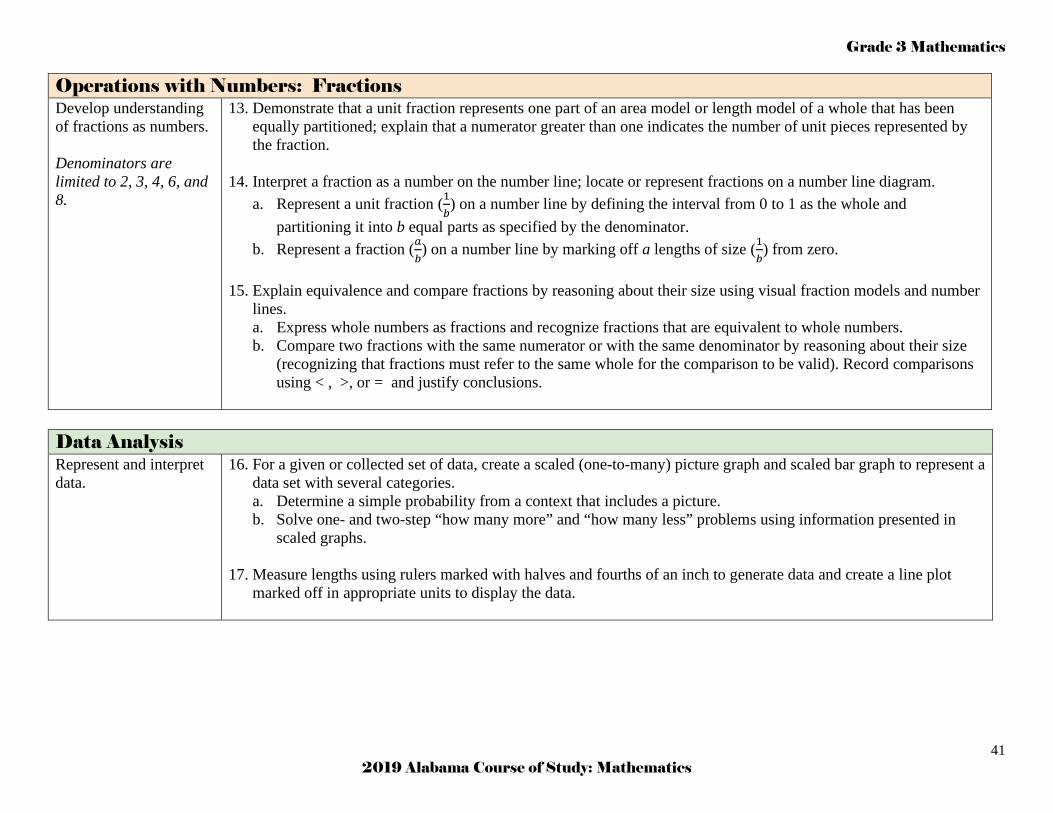
GRADE 3 37
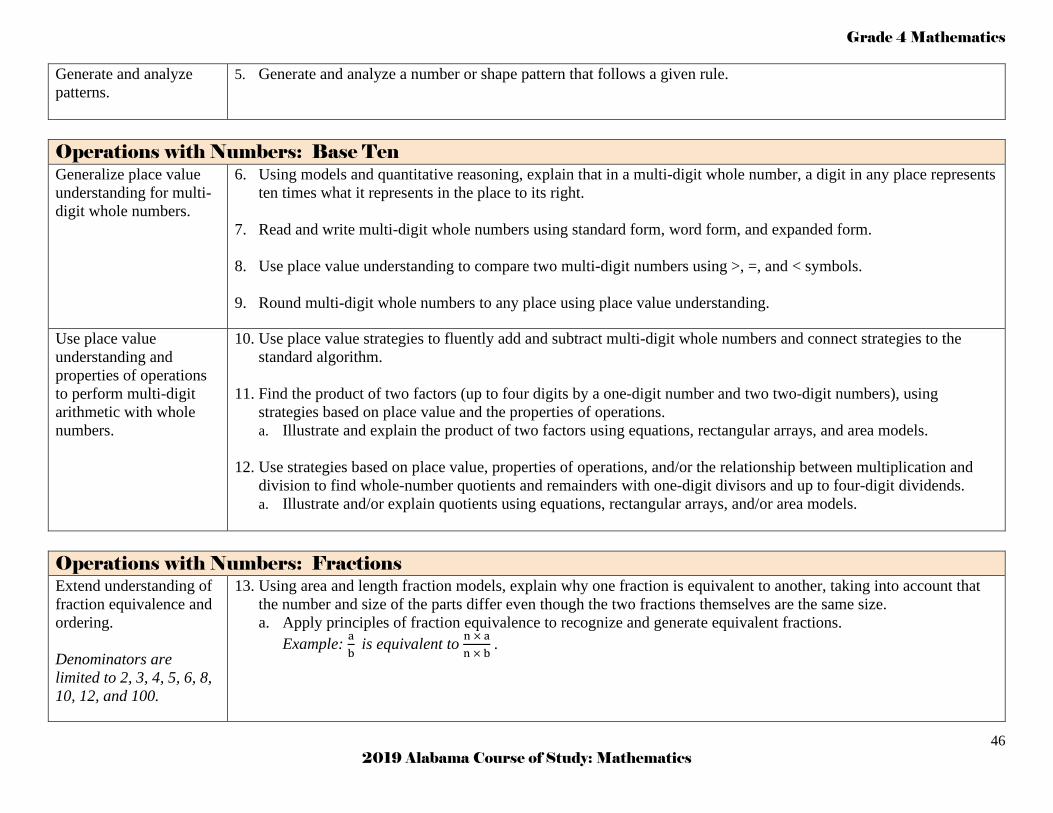
GRADE 4 43
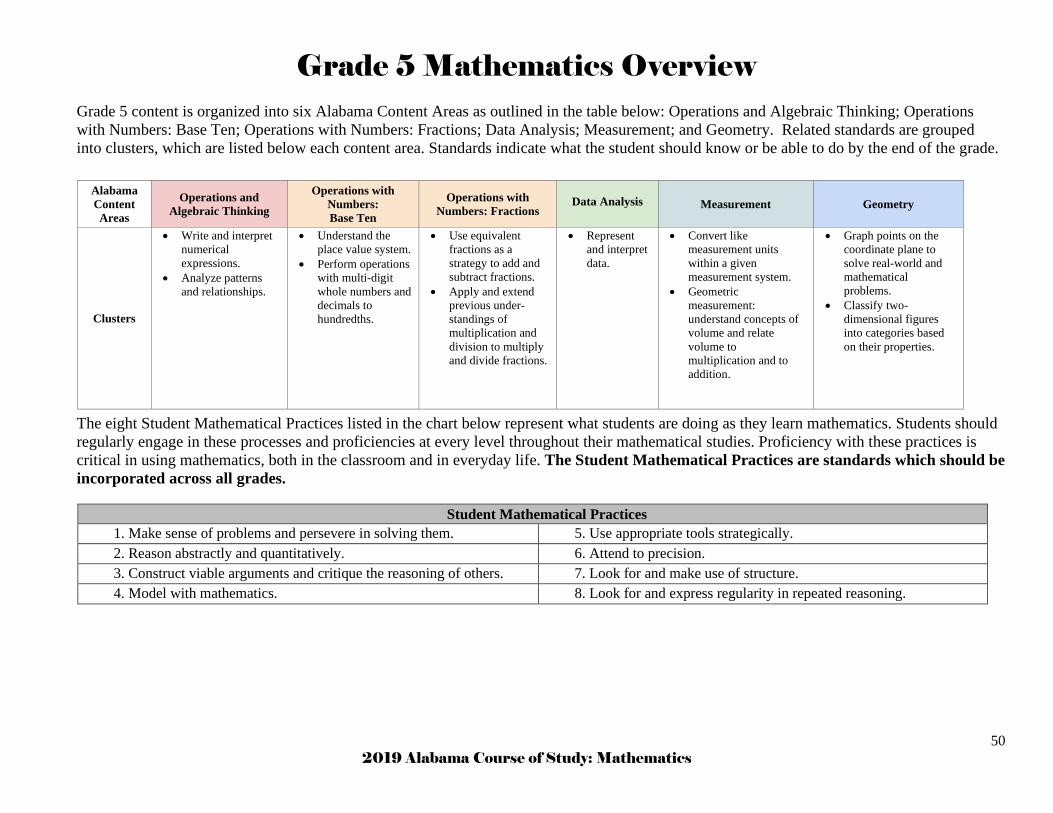
GRADE 5 50
GRADES 6-8 OVERVIEW 57
GRADE 6 60
GRADE 7 67
GRADE 8 74
GRADE 7 ACCELERATED AND GRADE 8 ACCELERATED OVERVIEW 81
GRADE 7 ACCELERATED 83
GRADE 8 ACCELERATED 92
2019 Alabama Course of Study Mathematics vi
GRADES 9-12 CONTENT
GRADES 9-12 OVERVIEW 104
PATHWAYS TO STUDENT SUCCESS 104
GEOMETRY WITH DATA ANALYSIS BEFORE ALGEBRA I WITH PROBABILITY 105
SUPPORT FOR STRUGGLING STUDENTS 105
SUPPORT FOR PARTICULARLY MOTIVATED AND INTERESTED STUDENTS 106
SPECIALIZED MATHEMATICS COURSES 106
EXTENDED COURSES 107
EXAMPLES OF PATHWAYS 108
ORGANIZATION OF STANDARDS 109
ESSENTIAL CONCEPTS 111
GEOMETRY WITH DATA ANALYSIS 117
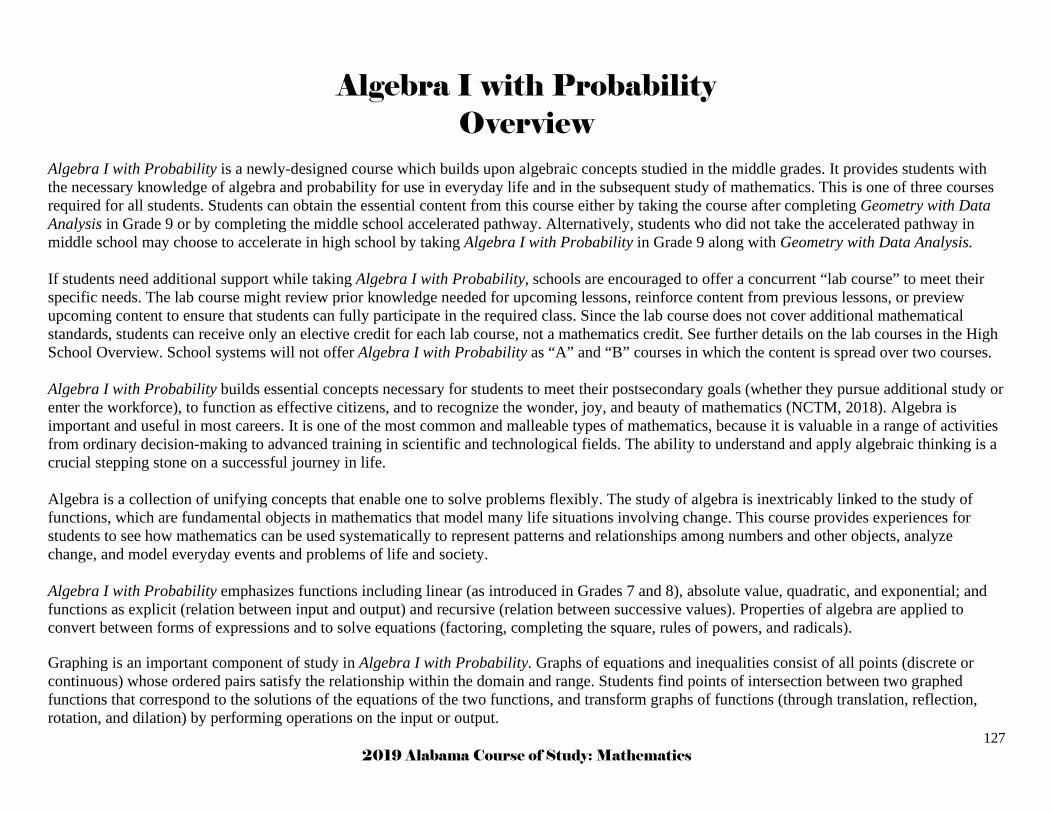
ALGEBRA I WITH PROBABILITY 127
ALGEBRA II WITH STATISTICS 138
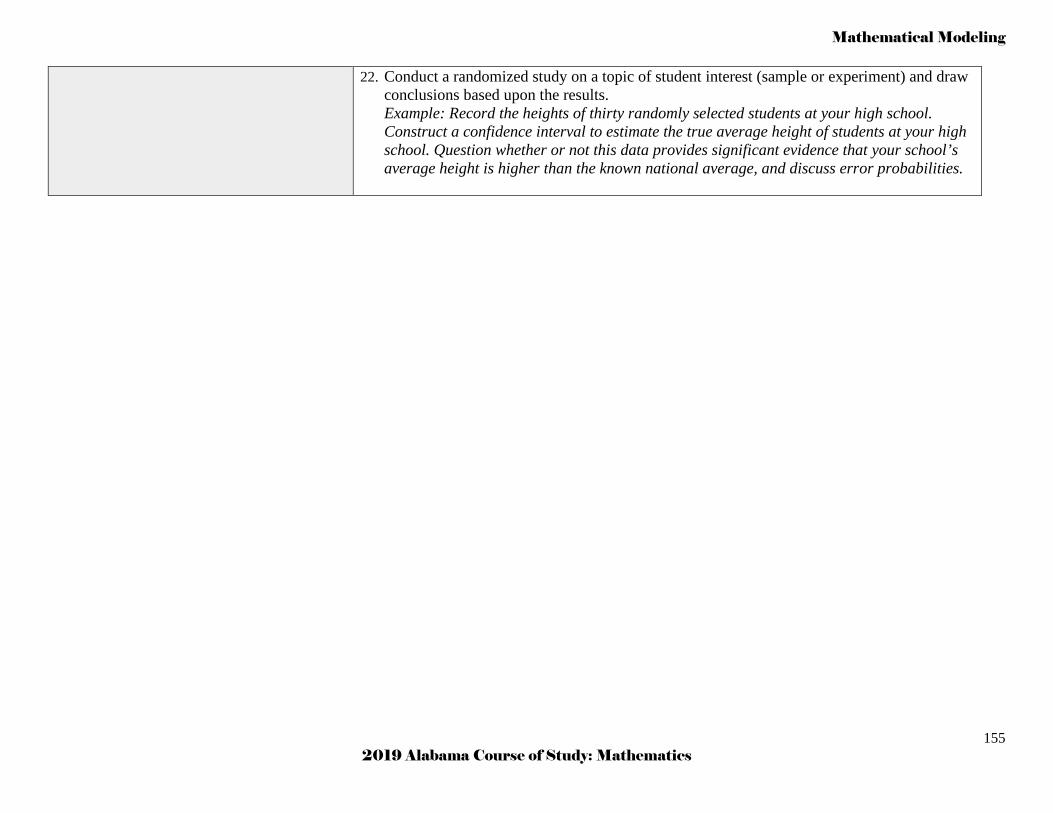
MATHEMATICAL MODELING 149
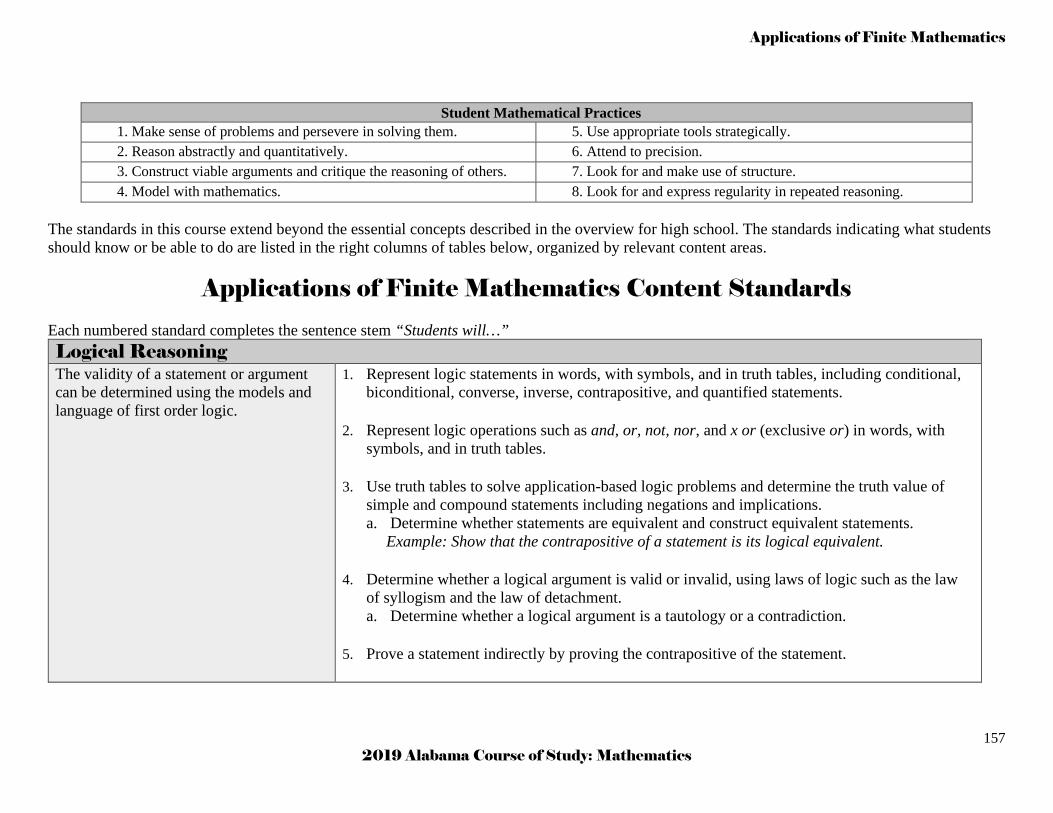
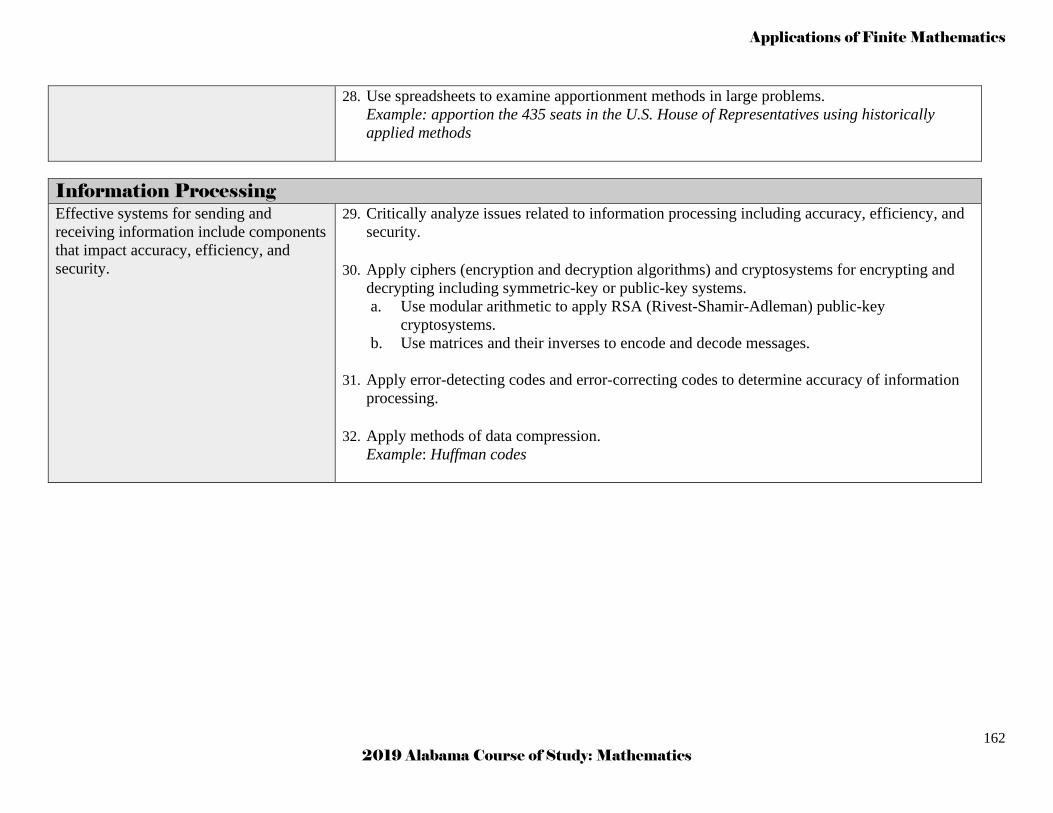
APPLICATIONS OF FINITE MATHEMATICS 156
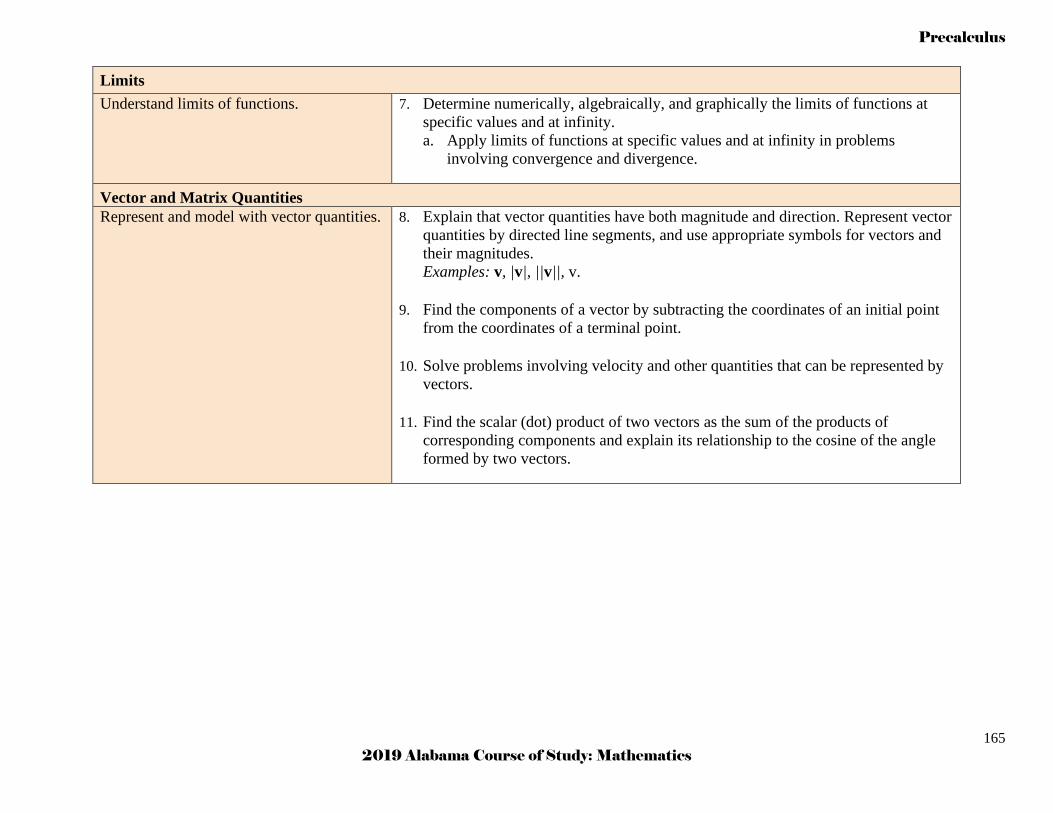
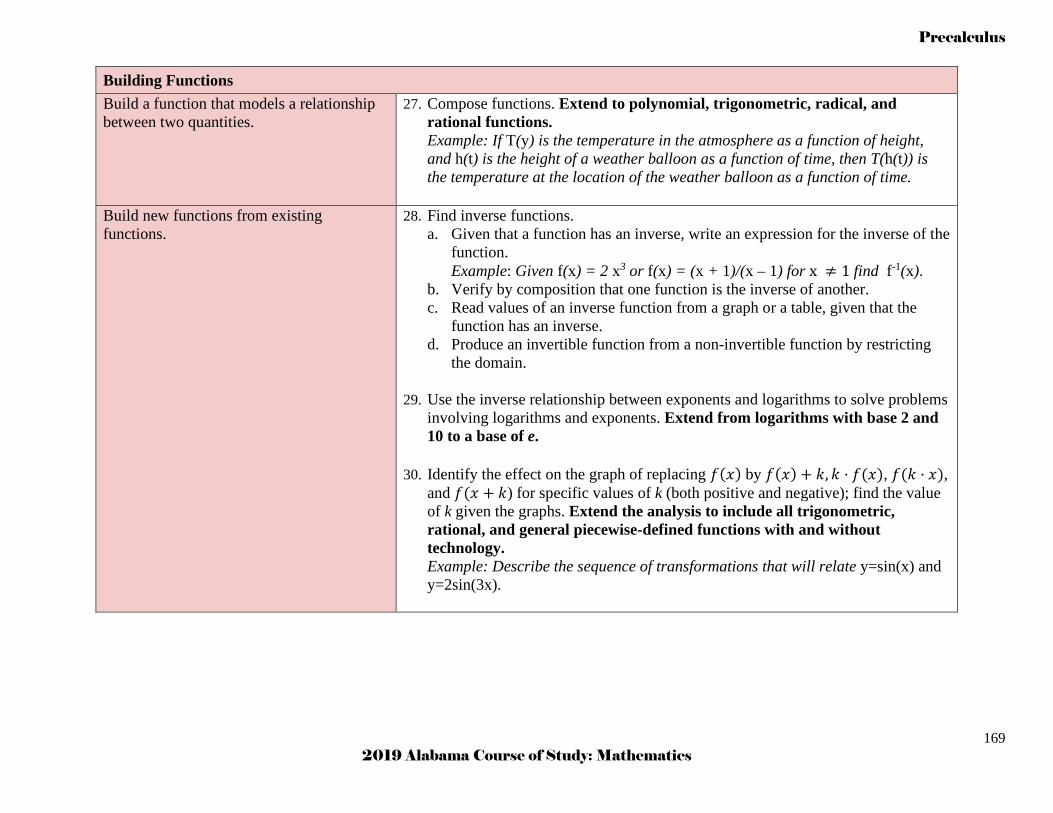
PRECALCULUS 163
APPENDIX A
MATHEMATICS TEACHING PRACTICES SUPPORTING EQUITABLE MATHEMATICS TEACHING 172
APPENDIX B
2019 ALABAMA COURSE OF STUDY PATHWAYS 175
CHART 1 PATHWAYS THROUGH K-12 MATHEMATICS 177
CHART 2 PATHWAYS THROUGH K-12 MATHEMATICS TO POSTSECONDARY 178
OPTIONS FOR MATHEMATICS CREDIT AFTER ALGEBRA II WITH STATISTICS 179
APPENDIX C
RESOURCES 180
APPENDIX D
RESOURCES FOR GRADES 6-8 183
2019 Alabama Course of Study Mathematics vii
APPENDIX E
POSSIBLE PATHWAYS FOR STUDENTS COMPLETING GRADE 8 MATHEMATICS 187
POSSIBLE PATHWAYS FOR STUDENTS COMPLETING GRADE 8 ACCELERATED MATHEMATICS 188
THE MATHEMATICAL MODELING CYCLE AND STATISTICAL PROBLEM-SOLVING CYCLE 189
APPENDIX F
ALABAMA HIGH SCHOOL GRADUATION REQUIREMENTS 192
APPENDIX G
GUIDELINES AND SUGGESTIONS FOR LOCAL TIME REQUIREMENTS AND HOMEWORK 194
BIBLIOGRAPHY 197
GLOSSARY 198
2019 Alabama Course of Study Mathematics viii
2019 Alabama Course of Study Mathematics
PREFACE
The 2019 Alabama Course of Study Mathematics provides the framework for the Grades K-12 mathematics program in Alabamarsquos public schools Content standards in this document are minimum and required (Code of Alabama 1975 sect16-35-4) They are fundamental and specific but not exhaustive In developing local curriculum school systems may include additional content standards to reflect local philosophies and add implementation guidelines resources and activities which are beyond the scope of this document The 2019 Alabama Mathematics Course of Study Committee and Task Force conducted exhaustive research during the development of this Course of Study analyzing mathematics standards and curricula from other states the 2016 Revised Alabama Course of Study Mathematics national reports and recommendations on K-12 mathematics education the latest NAEP Frameworks and numerous articles in professional journals and magazines Many members attended state regional and national conventions to update their knowledge of current trends and issues in mathematics education The Committee and Task Force also listened to and read statements from interested individuals and groups throughout the state and thoroughly discussed issues among themselves and with colleagues The Committee and Task Force reached consensus and developed what members believe to be the best Grades K-12 Mathematics Course of Study for students in Alabamarsquos public schools
2019 Alabama Course of Study Mathematics ix
2019 Alabama Course of Study Mathematics
ACKNOWLEDGMENTS
This document was developed by the 2019 Alabama Mathematics Course of Study Committee and Task Force composed of early childhood intermediate school middle school high school and college educators appointed by the Alabama State Board of Education and business and professional persons appointed by the Governor (Code of Alabama 1975 sect16-35-1) The Committee and Task Force began work in March of 2018 and submitted the document to the Alabama State Board of Education for adoption at the December 12 2019 meeting
2019 Alabama Mathematics Course of Study Committee and Task Force
Chair Matt Akin PhD Superintendent Gulf Shores City Schools
Rebecca Boykin Teacher Pizitz Middle School Vestavia Hills City Schools
Justin D Boyle EdD Assistant Professor The University of Alabama
Calvin Briggs EdD Executive Director The Southern Center for Broadening Participation in STEM
Suzanne Culbreth Instructor UABTeach University of Alabama at Birmingham
Derallus Davis Teacher McAdory High School Jefferson County Board of Education
Emilee E Daws Teacher Athens Middle School Athens City Board of Education
Beth Dotson Director of Huntington Learning Center Daphne
Amelia Hattaway Evans Teacher Pinson Elementary School Jefferson County Board of Education
Keri Flowers Mathematics Specialist AMSTI Troy University
Michelle J Foster PhD Associate Professor Alabama State University
Mike Foust PhD Senior Vice President ABT Inc Madison AL
2019 Alabama Course of Study Mathematics x
Christy Fox Teacher W S Neal Elementary School Escambia County Board of Education
Nancee Garcia PhD Teacher Auburn High School Auburn City Schools
Harry Gilder Jr Attorney Harry L Gilder Jr Attorney at Law LLC
Gayle Holladay Mathematics Instructional Coach Opelika City Schools
Sheila Clay Holt Director AMSTI University of Alabama in Huntsville
Adrienne King Teacher Discovery Middle School Madison City Schools
Kathryn Lanier PhD Director of STEM Education Outreach Southern Research
Lee Ann Latta Mathematics Content Director Grades 6 - 11 A+ College Ready
W Gary Martin EdD Professor Auburn University
Frankie E Mathis EdD Director of Secondary Education Saraland Board of Education
Lisa McDonough Mathematics Specialist AMSTI University of Alabama in Huntsville
Sue D Noah Teacher Athens Elementary School Athens City Board of Education
Vicky Ohlson PhD Director of Special Projects Alabama Community College System
Amanda Daniel Pendergrass PhD Associate Professor The University of West Alabama
Anne Penney EdD Retired Auburn City School Board
Andrew Poker Teacher Spain Park High School Hoover City Schools
Denise Porch Mathematics Specialist AMSTI University of Alabama in Huntsville
Leslie Richards EdS Secondary Mathematics Supervisor Jefferson County Schools
Dolores Sparks Retired Teacher Red Bay High School Franklin County Schools
Shannon Noel Tillison Teacher White Plains Elementary School Calhoun County Board of Education
Leigh Farrell Twigg Mathematics Specialist Calhoun County Board of Education
2019 Alabama Course of Study Mathematics xi
Appreciation is extended to Megan Burton PhD Auburn University Shelia Ingram PhD Birmingham-Southern College Kyoko Johns PhD Jacksonville State University Marilyn Strutchens PhD Auburn University and Jeremy Zelkowski PhD The University of Alabama who served as content reviewers of this document
State Department of Education personnel who managed the development process were Eric G Mackey PhD State Superintendent of Education Daniel Boyd PhD Deputy State Superintendent Elisabeth Davis EdD Assistant State Superintendent Office of Student Learning Sean J Stevens Program Coordinator Instructional Services Cathy Jones Executive Secretary State Courses of Study Committees Instructional Services Robin A Nelson Program Coordinator Instructional Services retired Michele Matin Executive Secretary State Courses of Study Committees Instructional Services retired
The State Department of Education process specialists who assisted the Task Force in developing the document were Karen Anderson PhD Education Administrator School Improvement Cindy Augustine Education Specialist Special Education Services retired Willietta Ellis Conner EdD Education Specialist Counseling and Guidance Diane Duncan EdS Education Administrator AMSTI Kathy G Padgett PhD Education Specialist Student Assessment Angie Pelton EdD Education Specialist Professional Learning Gay Finn Education Administrator Instructional Services K Elizabeth Hammonds Education Specialist AMSTI Phenicia Nunn Education Specialist AMSTI Kristie Taylor Education Specialist AMSTI Charles V Creel Graphic Arts Specialist Communication Section assisted in the development of the graphic design Catherine Wilbourne Eufaula City Schools (retired) edited and proofread the document
1 2019 Alabama Course of Study Mathematics
2019 Alabama Course of Study Mathematics GENERAL INTRODUCTION
The 2019 Alabama Course of Study Mathematics defines the knowledge and skills students should know and be able to do after each course and upon graduation from high school Mastery of the standards enables students to expand professional opportunities understand and critique the world and experience the joy wonder and beauty of mathematics (National Council of Teacher of Mathematics [NCTM] 2018) Courses within the 2019 Alabama Course of Study Mathematics are organized into Alabama Content Areas which are adapted from those present in the draft of the NAEP 2025 Mathematics Framework High school courses also incorporate recommendations for the Essential Concepts as identified by the National Council of Teachers of Mathematics (2018) and other documents All standards contained in this document are
aligned with college and work expectations
written in a clear understandable and consistent format
designed to include rigorous focused and critical content and application of knowledge through high-order skills
formulated upon strengths and lessons of current Alabama standards
informed by high-performing mathematics curricula in other countries to ensure all students are prepared to succeed in our global economy and society and
grounded on sound evidence-based research
What students can learn at any particular grade level depends upon prior learning Grade placements for specific topics have been made on the basis of state and international comparisons and on the collective experience and professional judgment of educators researchers and mathematicians Learning opportunities will continue to vary across schools and school systems and educators should make every effort to meet the needs of individual students based on the studentrsquos current understanding Mastery of the standards enables students to build a solid foundation of knowledge skills and understanding in mathematics To ensure student success effective implementation of the 2019 Alabama Course of Study Mathematics requires local education agencies to develop local curriculum guides utilizing the minimum required content of this document
2 2019 Alabama Course of Study Mathematics
2019 Alabama Course of Study Mathematics CONCEPTUAL FRAMEWORK
3 2019 Alabama Course of Study Mathematics
2019 Alabama Course of Study Mathematics
CONCEPTUAL FRAMEWORK
The conceptual framework graphic illustrates the purpose of the 2019 Alabama Course of Study Mathematics which is to ensure that all students receive the mathematics preparation they need to access further educational and professional opportunities to understand and critique the world around them and to experience the joy wonder and beauty of mathematics (NCTM 2018) This purpose is depicted by a cyclical pattern formed by position statements content student mathematical practices and mathematics teaching practices that contribute to the development of the mathematically-prepared graduate represented by the diploma and mortarboard in the center The cycle has no defined starting or ending point all of its components must be continuously incorporated into the teaching and learning of mathematics This integration is essential to the development of an excellent mathematics education program for public schools in Alabama represented by the shaded map of the state behind the cycle The four critical components of an excellent mathematics education program are Student Mathematical Practices Alabama Content Areas and 9-12 Essential Content Mathematics Teaching Practices and Position Statements The Student Mathematical Practices also referred to as the Standards for Mathematical Practice embody the processes and proficiencies in which students should regularly engage as they learn mathematics These practices include making sense of problems and persevering in solving them constructing arguments and critiquing reasoning of others modeling using appropriate tools attending to precision finding and using structure and finding and expressing regularity in repeated reasoning Proficiency with these practices is critical in using mathematics both within the classroom and in life Mathematical Practices are a fundamental component in the National Assessment of Educational Progress (NAEP) framework and are included as Alabama standards to be incorporated across all grades they are explained in further detail on pages 11-14 The vehicle for developing these practices is found in the next component of the cycle the content standards These standards specify what students should know and be able to do at the end of each grade or course The standards are organized in Alabama Content Areas which are based on the content areas in the 2025 NAEP mathematics framework They are designed to provide an effective trajectory of learning across the grades that ensures students are well-prepared for future success In Grades 9-12 the Alabama Content Standards are organized into subgroups of essential concepts described by the National Council of Teachers of Mathematics (NCTM) in its seminal publication Catalyzing Change in High School Mathematics Initiating Critical Conversations (2018) These essential concepts are designed to be achieved by all students within the first three years of high school mathematics and they form the foundation for additional coursework designed to meet studentsrsquo specific post-high school needs and interests The next component of the cycle consists of the eight Mathematics Teaching Practices (NCTM 2014) which should be consistent components of every mathematics lesson across grades K-12 They are
4 2019 Alabama Course of Study Mathematics
1 Establish mathematics goals to focus learning Effective teaching of mathematics establishes clear goals for the mathematics that students are learning situates goals within learning progressions and uses the goals to guide instructional decisions
2 Implement tasks that promote reasoning and problem solving Effective teaching of mathematics engages students in solving and discussing tasks that promote mathematical reasoning and problem-solving and allow multiple entry points and varied solution strategies
3 Use and connect mathematical representations Effective teaching of mathematics engages students in making connections among mathematical representations to deepen understanding of mathematics concepts and procedures and as tools for problem-solving
4 Facilitate meaningful mathematical discourse Effective teaching of mathematics facilitates discourse among students to build shared understanding of mathematical ideas by analyzing and comparing student approaches and arguments
5 Pose purposeful questions Effective teaching of mathematics uses purposeful questions to assess and advance studentsrsquo reasoning and sense-making about important mathematical ideas and relationships
6 Build procedural fluency from conceptual understanding Effective teaching of mathematics builds fluency with procedures on a foundation of conceptual understanding so that students over time become skillful in using procedures flexibly as they solve contextual and mathematical problems
7 Support productive struggle in learning mathematics Effective teaching of mathematics consistently provides students individually and collectively with opportunities and supports to engage in productive struggle as they grapple with mathematical ideas and relationships
8 Elicit and use evidence of student thinking Effective teaching of mathematics uses evidence of student thinking to assess progress toward mathematical understanding and to adjust instruction continually in ways that support and extend learning
Appendix A provides information that illustrates how these Mathematics Teaching Practices support equitable instruction in the mathematics classroom The final component of the cycle is the Position Statements which are explained in detail in the next section of this document The Position Statements set forth the foundational requirements for excellence in mathematics education They deal with access and equity teaching and learning curriculum tools and technology assessment and professionalism All stakeholders from parents and teachers to policy-makers and business leaders should examine and embrace these Position Statements to foster excellence in mathematics education in Alabama The graphic depicts a dynamic process of establishing and achieving an excellent mathematics program for the State of Alabama Placement of a diploma at the center is no accident because all efforts are focused on preparing Alabama students for their future Mathematics will be part of that future and students must be well equipped to meet the challenges of higher education and meaningful employment
5 2019 Alabama Course of Study Mathematics
POSITION STATEMENTS Today mathematics is at the heart of most innovations in the ldquoinformation economyrdquo which is increasingly driven by data Mathematics serves as the foundation for careers in science technology engineering and mathematics (STEM) and increasingly as the foundation for careers outside STEM Moreover mathematical literacy is needed more than ever to filter understand and act on the enormous amount of data and information that we encounter every day The digital age inundates us with numbers in the form of data rates quantities probabilities and averages and this fact of twenty-first-century life increases the importance of and need for todayrsquos students to be mathematically and statistically literate consumers if not producers of information (National Council of Teachers of Mathematics [NCTM] Catalyzing Change in High School Mathematics 2018 p 1)
Mathematics is critical for the future success of each and every student in Alabama enabling them to expand their professional opportunities understand and critique the world and experience the joy wonder and beauty of mathematics (NCTM 2018) To help students achieve this goal schools should implement the six position statements which outline foundational practices to ensure excellence in Alabama mathematics programs Specific pages in Principles to Action Ensuring Mathematical Success for All (NCTM 2014) that are related to each position statement are indicated in italics at the end of the statement All stakeholders from parents and teachers to policy-makers and business leaders should examine and embrace these principles to foster excellence in mathematics education in Alabama
Access and Equity in Mathematics Education
An excellent mathematics program in Alabama promotes access and equity which requires being responsive to studentsrsquo backgrounds experiences and knowledge when designing implementing and assessing the effectiveness of a mathematics program so that all students have equitable opportunity to advance their understanding each school year Access and equity in mathematics at the school and classroom levels is founded on beliefs and practices that empower each and every student to participate meaningfully in learning mathematics and to achieve outcomes in mathematics that are not predicted by or associated with student characteristics For all students mathematics is an intellectually challenging activity that transcends their racial ethnic linguistic gender and socioeconomic backgrounds Promoting curiosity and wonder through mathematical discourse is possible when schools and classrooms provide equitable access to challenging curriculum and set high expectations for all students School leaders teachers and community stakeholders need to collaborate on issues impacting access and equity for each and every student such as tracking beliefs about innate levels of mathematical ability and differentiated learning To gain more insight read and discuss ldquoAccess and Equityrdquo in Principles to Actions (pp 59-69)
6 2019 Alabama Course of Study Mathematics
Teaching and Learning Mathematics
An excellent mathematics program in Alabama requires teaching practices that enable students to understand that mathematics is more than finding answers mathematics requires reasoning and problem-solving in order to solve real-world and mathematical problems Teaching matters Teachers bear the responsibility of ensuring student attainment of content by all who enter their classrooms regardless of pre-existing skills and knowledge To increase student proficiency in mathematics the following mathematics teaching practices (NCTM 2014) should be integrated into daily instruction
Establish mathematics goals to focus learning Implement tasks that promote reasoning and problem-solving Use and connect mathematical representations Facilitate meaningful mathematical discourse Pose purposeful questions Build procedural fluency from conceptual understanding Support productive struggle in learning mathematics Elicit and use evidence of student thinking
These mathematics teaching practices are also an element of the Conceptual Framework See Appendix A
Student learning involves more than developing discrete mathematical skills mathematical proficiency has been defined by the National Research Council (2001) to include five strands conceptual understanding procedural fluency strategic competence adaptive reasoning and a productive disposition Note that procedural fluency involves not just finding answers quickly but ldquoskill in carrying out procedures flexibly accurately efficiently and appropriatelyrdquo (National Research Council 2001) School leaders teachers and community stakeholders need to collaborate on issues impacting teaching and learning mathematics such as mathematics learning goals opportunities students are afforded to discuss their thinking studentsrsquo understanding and encouragement to persevere as they reason problem-solve and develop conceptual understanding and teachersrsquo orchestration of and student participation in whole class discussions To gain more insight read and discuss the ldquoMathematics Teaching Practicesrdquo section in Principles to Actions (pp 7-57)
7 2019 Alabama Course of Study Mathematics
Mathematics Curriculum
An excellent mathematics program in Alabama includes a curriculum that develops the grade level mathematics content standards along coherent learning progressions which build connections among areas of mathematical study and between mathematics and the real world There are differences among standards textbooks and curriculum The Alabama Content Standards delineate what students are expected to learn within each grade level or course A curriculum is a sequence of tasks activities and assessments that teachers enact to support students in learning the standards while drawing on a textbook or other resources when appropriate Textbooks and other resources that align with standards should be provided for teachers For example a standard might read that students will be fluent with two-digit multiplication or that students are fluent with multiplying binomials A single lesson does not accomplish either of these standards nor is it productive to have students simply practice this skill in isolation without building from conceptual understanding as described in one of the Principles to Actions mathematics teaching principles A sequence of lessons needs to include examples using concrete models or other appropriate representations to support students in developing strategies that provide a foundation for developing procedural fluency School leaders teachers and community stakeholders need to collaborate on how the curriculum is designed to provide access for all students how procedural fluency is built from conceptual understanding and how the curriculum aligns with the content standards and adopted textbooks To gain more insight read and discuss the ldquoCurriculumrdquo section in Principles to Actions (pp 70-77)
Mathematical Tools and Technology
An excellent mathematics program in Alabama seamlessly integrates tools and technology as essential resources to help students develop a deep understanding of mathematics communicate about mathematics foster fluency and support problem-solving Teachers and students should be provided with appropriate tools and technology to support student learning Students should use mathematical tools and technology in a variety of settings for a variety of purposes Teachers should design learning activities using tools and technology so that students are mastering concepts not just practicing skills For example base 10 blocks serve as a tool for learning mathematics and a document camera is technology which can share the display of base 10 blocks that students are manipulating to acquire conceptual understanding Interactive technology can help students explore mathematical ideas in order to increase their understanding of mathematics High school students may manipulate the graph of a function in a computer program using sliders that change the values in its equation in order to better understand particular types of functions Tools and technology can also be used to differentiate learning experiences Teachers should be provided with appropriate professional learning opportunities to support effective student use of these tools and technologies
8 2019 Alabama Course of Study Mathematics
School leaders teachers and community stakeholders need to analyze how mathematics classrooms currently incorporate tools and technology to develop studentsrsquo procedural fluency from conceptual understanding and how tools and technology can be further integrated to support the communication and understanding of mathematical ideas To gain more insight read and discuss ldquoTools and Technologyrdquo in Principles to Actions (pp 78-88)
Assessment of Mathematics Learning
An excellent mathematics program in Alabama includes formative assessment to inform future teaching decisions and summative assessment to assess studentsrsquo ability to problem-solve to demonstrate conceptual understanding and procedural skills and to provide feedback to inform students of their progress Two types of assessment summative and formative require attention in mathematics classrooms Traditionally instruction has focused on concluding a learning segment with summative assessments including tests projects quizzes or state assessments While use of summative assessments is essential such measures should be used to fully evaluate studentsrsquo mathematical proficiency including procedural fluency problem-solving ability and conceptual understanding To expand and improve summative assessment results students need opportunities throughout the school year to persevere with teacher support in struggling with cognitively demanding tasks Formative assessment occurs throughout this learning process as students solve tasks and teachers provide support through questioning During instruction teachers can learn a great deal about how students think as they draw on prior knowledge to solve novel problems Formative assessment is possible only when teachers are questioning studentsrsquo thinking during the learning process Formative assessments may include the use of questions that drive instructional-decision making exit slips or bell ringers teacher observation of student discourse reengagement lessons the ldquonumber talkrdquo format and evaluations of student work samples Formative assessment is a powerful tool for making instructional decisions that move student learning forward School leaders teachers and community stakeholders need to collaborate about how studentsrsquo thinking is formatively assessed during instruction and to analyze summative assessments in order to evaluate the extent to which problem-solving conceptual understanding and procedural skills are being addressed in mathematics classrooms To gain more insight read and discuss the ldquoAssessmentrdquo section in Principles to Actions (pp 89-98)
9 2019 Alabama Course of Study Mathematics
Professional Mathematics Teachers
An excellent mathematics program in Alabama requires educators to hold themselves and their colleagues accountable for seeking and engaging in professional growth to improve their practice as lifelong learners in order to promote student understanding of mathematics as a meaningful endeavor applicable to everyday life Professionals are dedicated to learning and improving their craft which ultimately benefits students To achieve growth in the five areas described in this section districts schools and teachers must recognize that continuous professional learning is required Designing and enacting effective lessons and valid assessments requires teachers to increase their knowledge and skill throughout their careers To prepare the next generation of thinkers the mathematics education community in Alabama (and beyond) must work together to support one another in learning Teaching in ways that promote student collaboration in learning mathematics from and with each other requires adults to model effective collaboration in their own learning and progress Teachers should embrace learning and professional growth Local school systems should provide face-to-face andor online professional learning specifically designed to address mathematics content and instruction for all teachers Active participation in state and national mathematics organizations and service as mentors to others are additional means through which teachers can collaborate with others and expand their practice State and national resources include Alabama Council of Teachers of Mathematics (ACTM) Alabama Learning Exchange (ALEX) Alabama Mathematics Science and Technology Initiative (AMSTI) and the National Council of Teachers of Mathematics (NCTM) School leaders teachers and community stakeholders need to collaborate on the amount of time provided and how effectively and productively the allotted time is used to plan curriculum and individual lessons reflect on instruction and design assessments to improve student learning outcomes To gain more insight read and discuss the ldquoProfessionalismrdquo section in Principles to Actions (pp 99-108) Finally we recommend that school leaders teachers and stakeholders read and discuss the ldquoTaking Actionrdquo section of Principles to Actions (pp 109-117) Discussing and reading Principles to Actions as a school community or mathematics department will stimulate productive conversations that can lead to classroom improvements which will support the mathematics learning for all students across Alabama
10 2019 Alabama Course of Study Mathematics
STUDENT MATHEMATICAL PRACTICES The Standards for Mathematical Practice called ldquoStudent Mathematical Practicesrdquo in this document describe varieties of expertise that mathematics educators at all levels should seek to develop in their students These practices are based on important processes and proficiencies that have long-standing importance in mathematics education The processes are the National Council of Teachers of Mathematics (NCTM) process standards of problem-solving reasoning and proof communication representation and connections The proficiencies are adaptive reasoning strategic competence conceptual understanding (comprehension of mathematical concepts operations and relations) procedural fluency (skill in carrying out procedures flexibly accurately efficiently and appropriately) and productive disposition (habitual inclination to see mathematics as sensible useful and worthwhile coupled with a belief in diligence and onersquos own efficacy) These are the strands of mathematical proficiency specified in the National Research Councilrsquos report Adding It Up Helping Children Learn Mathematics (2001) Most recently these Student Mathematical Practices have been supported by the National Assessment of Educational Progress (NAEP) in the draft of the 2025 NAEP Mathematics Framework which was open for public comment in the spring of 2019 The completed Mathematics Framework for the 2025 National Assessment of Educational Progress which was released November 21 2019 summarized the student mathematical practices into five NAEP Mathematical Practices and reaffirmed the importance of incorporating these approaches and behaviors in the study of mathematics at all levels The eight Student Mathematical Practices are listed below along with a description of behaviors and performances of mathematically proficient students Mathematically proficient students 1 Make sense of problems and persevere in solving them These students start by explaining to themselves the meaning of a problem and looking for entry points to its solution They analyze givens constraints relationships and goals They make conjectures about the form and meaning of the solution and plan a solution pathway rather than simply jumping into a solution attempt These students consider analogous problems and try special cases and simpler forms of the original problem in order to gain insight into its solution They monitor and evaluate their progress and change course if necessary Older students might depending on the context of the problem transform algebraic expressions or change the viewing window on their graphing calculators to obtain the information they need Mathematically proficient students can explain correspondences among equations verbal descriptions tables and graphs or draw diagrams of important features and relationships graph data and search for regularity or trends Younger students might rely on using concrete objects or pictures to help conceptualize and solve a problem Mathematically proficient students check their answers to problems using a different method and they continually ask themselves ldquoDoes this make senserdquo They can understand the approaches of others to solve complex problems and identify correspondences between different approaches
11 2019 Alabama Course of Study Mathematics
2 Reason abstractly and quantitatively Mathematically proficient students make sense of quantities and their relationships in problem situations They bring two complementary abilities to bear on problems involving quantitative relationships One is the ability to decontextualize to abstract a given situation represent it symbolically and manipulate the representing symbols as if they have a life of their own without necessarily attending to their referents The second is the ability to contextualize to pause as needed during the manipulation process in order to probe into the referents for the symbols involved Quantitative reasoning entails habits of creating a coherent representation of the problem at hand considering the units involved attending to the meaning of quantities not just how to compute them and knowing and flexibly using different properties of operations and objects 3 Construct viable arguments and critique the reasoning of others These students understand and use stated assumptions definitions and previously established results in constructing arguments They make conjectures and build a logical progression of statements to explore the truth of their conjectures They are able to analyze situations by breaking them into cases and can recognize and use counterexamples These students justify their conclusions communicate them to others and respond to the arguments of others They reason inductively about data making plausible arguments that take into account the context from which the data arose Mathematically proficient students are also able to compare the effectiveness of two plausible arguments distinguish correct logic or reasoning from that which is flawed and if there is a flaw in an argument explain what it is Elementary students can construct arguments using concrete referents such as objects drawings diagrams and actions Such arguments can make sense and be correct even though they are not generalized or made formal until the middle or upper grades Later students learn to determine domains to which an argument applies Students in all grades can listen to or read the arguments of others decide whether they make sense and ask useful questions to clarify or improve the arguments 4 Model with mathematics These students can apply the mathematics they know to solve problems arising in everyday life society and the workplace In early grades this might be as simple as writing an addition equation to describe a situation In middle grades students might apply proportional reasoning to plan a school event or analyze a problem in the community By high school students might use geometry to solve a design problem or use a function to describe how one quantity of interest depends on another Mathematically proficient students who can apply what they know are comfortable making assumptions and approximations to simplify a complicated situation realizing that these may need revision later They are able to identify important quantities in a practical situation and map their relationships using such tools as diagrams two-way tables graphs flowcharts and formulas and can analyze those relationships mathematically to draw conclusions They routinely interpret their mathematical results in the context of the situation and reflect on whether the results make sense possibly improving the model if it has not served its purpose 5 Use appropriate tools strategically Mathematically proficient students consider available tools when solving a mathematical problem These tools might include pencil and paper concrete models a ruler a protractor a calculator a spreadsheet a computer algebra system a statistical package or dynamic geometry software Proficient students are sufficiently familiar with tools appropriate for their grade or course to make sound decisions about when each of these tools might be helpful recognizing both the insight to be gained and the toolsrsquo limitations For example mathematically proficient high school students
12 2019 Alabama Course of Study Mathematics
analyze graphs of functions and solutions generated using a graphing calculator They detect possible errors by strategically using estimation and other mathematical knowledge When making mathematical models they know that technology can enable them to visualize the results of varying assumptions explore consequences and compare predictions with data Mathematically proficient students at various grade levels are able to identify relevant external mathematical resources such as digital content located on a Web site and use these to pose or solve problems They are able to use technological tools to explore and deepen their understanding of concepts 6 Attend to precision These students try to communicate mathematical ideas and concepts precisely They try to use clear definitions in discussion with others and in their own reasoning They state the meaning of the symbols they choose including using the equal sign consistently and appropriately Mathematically proficient students are careful about specifying units of measure and labeling axes to clarify the correspondence with quantities in a problem They calculate accurately and efficiently and express numerical answers with a degree of precision appropriate for the problem context In the elementary grades students give carefully formulated explanations to each other By the time they reach high school they have learned to examine claims and make explicit use of definitions 7 Look for and make use of structure Mathematically proficient students look closely to discern a pattern or structure Young students for example might notice that three and seven more is the same amount as seven and three more or they may sort a collection of shapes according to how many sides the shapes have Later students will see 7 times 8 equals 7 times 5 + 7 times 3 in preparation for learning about the distributive property In the expression x2 + 9x + 14 older students can see the 14 as 2 times 7 and the 9 as 2 + 7 They recognize the significance of an existing line in a geometric figure and can use the strategy of drawing an auxiliary line for solving problems These students also can pause and reflect for an overview or a shift in perspective They can observe the complexities of mathematics such as seeing some algebraic expressions as single objects or as being composed of several objects For example they can see 5 ndash 3(x ndash y)2 as 5 minus a positive number times a square and use that mental picture to realize that the value of the expression cannot be more than 5 for any real numbers x and y 8 Look for and express regularity in repeated reasoning Mathematically proficient students notice if calculations are repeated and look both for general methods and for shortcuts Upper elementary students might notice when dividing 25 by 11 that they are repeating the same calculations over and over again and conclude they have a repeating decimal By paying attention to the calculation of slope as they repeatedly check whether points are on the line through (1 2) with slope 3 middle school students might abstract the equation (y ndash 2)(x ndash 1) = 3 Noticing the regularity in the way terms cancel when expanding (x ndash 1) (x + 1) (x ndash 1)(x2 + x + 1) and (x ndash 1)(x3 + x2 + x + 1) might lead them to the general formula for the sum of a geometric series As students work to solve a problem mathematically proficient students maintain oversight of the process while attending to the details and continually evaluate the reasonableness of their intermediate results
13 2019 Alabama Course of Study Mathematics
Connecting the Student Mathematical Practices to the Standards for Mathematical Content
The eight Student Mathematical Practices described on the previous pages indicate ways in which developing student practitioners of the discipline of mathematics increasingly must engage with the subject matter as they grow in mathematical maturity and expertise throughout the elementary middle and high school years It is important that designers of curriculum assessment and professional development be aware of the need to connect the mathematical practices to the mathematical content standards The Student Mathematical Practices are a balanced combination of procedure and understanding Expectations that begin with the word ldquounderstandrdquo are often especially good opportunities to connect mathematical practices to mathematical content Students who lack understanding of a topic may rely too heavily on procedures Without a flexible base from which to work they may be less likely to consider analogous problems represent problems coherently justify conclusions apply the mathematics to practical situations use technology mindfully to work with the mathematics explain the mathematics accurately to other students pause for an overview or deviate from a known procedure to find a shortcut Thus a lack of understanding effectively prevents a student from engaging in the mathematical practices In this respect those content standards which set an expectation of understanding are potential ldquopoints of intersectionrdquo between the Student Mathematical Practices and the Standards for Mathematical Content These points of intersection are intended to be weighted toward central and generative concepts in the school mathematics curriculum that most merit the time resources innovative energies and focus needed to qualitatively improve curriculum instruction assessment professional development and student achievement in mathematics
14 2019 Alabama Course of Study Mathematics
DIRECTIONS FOR INTERPRETING CONTENT STANDARDS GRADES K ndash 8
The 2019 Alabama Course of Study Mathematics for Grades K-8 is organized around the following elements Student Mathematical Practices Alabama Content Areas Clusters and Content Standards These four elements are explained below The Student Mathematical Practices represent what students are doing as they learn mathematics These practices are processes and proficiencies in which students should regularly engage as they learn mathematics Proficiency with these practices is critical in using mathematics both within the classroom and in life These practices are identified at the beginning of each grade band and are to be incorporated across all grades Alabama Content Areas are large groups of related clusters and content standards In the example on the next page the Alabama Content Area is ldquoOperations with Numbers Base Tenrdquo Standards from different Alabama Content Areas may be closely related Clusters group related content standards The cluster in the example is ldquoExtend the counting sequencerdquo Because mathematics is a connected subject standards from different clusters may sometimes be closely related Content Standards listed to the right of each cluster contain the minimum required content and define what students should know and be able to do at the conclusion of a course or grade Some have sub-standards indicated with a b c d which are extensions of the content standards and are also required Some standards are followed by examples which are not required to be taught When standards indicate that drawings may be used the drawings need not show details but should show the mathematics in the problem The order in which standards are listed within a course or grade is not intended to convey a sequence for instruction Each content standard completes the stem ldquoStudents willrdquo The course of study does not dictate curriculum teaching methods or sequence Each local education authority (LEA) should create its own curriculum and pacing guide based on the Course of Study LEAs may add standards to meet local needs and incorporate local resources Even though one topic may be listed before another the first topic does not have to be taught before the second A teacher may choose to teach the second topic before the first to teach both at the same time to highlight connections or to select a different topic that leads to students reaching the standards for both topics
15 2019 Alabama Course of Study Mathematics
GRADE 1
DIRECTIONS FOR INTERPRETING THE CONTENT STANDARDS HIGH SCHOOL
Standards in the required high school courses of the 2019 Alabama Course of Study Mathematics are organized in alignment with the essential concepts described by National Council of Teachers of Mathematics (2018) which embody the concepts and skills that all students need to build their mathematical foundation for the continued study of mathematics and for future mathematical needs The essential concepts are listed the left side of the table They are divided among four Alabama Content Areas (Number Algebra and Functions Data Analysis Statistics and Probability and Geometry and Measurement) which appear as headings above the list of standards for each course Each content area (except Number) is further organized into several focus areas (groups of related concepts) similar to clusters in Grades K-8 These focus areas appear as headings above the standards Content Standards support attainment of the essential concepts and are written beside them in the table These numbered standards define what students should understand (know) and be able to do at the conclusion of a course or grade Content standards contain minimum required content Some have sub-standards
Standard Number
Content Standard
Cluster
Alabama Content Area
16 2019 Alabama Course of Study Mathematics
indicated with a b c d which are extensions of the content standards and are also required Some standards are followed by examples which are not required to be taught Some related standards appear across multiple high school courses In many cases there is a bold print statement to indicate the scope of the standard and to align the content that is taught across the courses The full scope of every standard should be addressed during instruction The order in which standards are listed within a course or grade is not intended to convey a sequence for instruction When standards indicate that drawings may be used the drawings need not show details but should show the mathematics in the problem Each content standard completes the stem ldquoStudents willrdquo The essential concepts are used to organize the required courses Geometry with Data Analysis Algebra I with Probability and Algebra II with Statistics The specialized courses taken after Algebra II with Statistics are organized in ways related to their specific subject matter which extend beyond the essential concepts to directly support studentsrsquo professional and personal goals
Alabama Content Area Focus Area
Essential Concept
Content Standard
Content Standard Number
17 2019 Alabama Course of Study Mathematics
GRADES K-2 OVERVIEW The K-2 section of the 2019 Alabama Course of Study Mathematics focuses on developing the foundations of mathematics As the diagram illustrates below K-2 students actively explore and investigate the meaning and relationships of numbers through Foundations of Counting Operations with Numbers Base Ten Operations and Algebraic Thinking Data Analysis Measurement and Geometry which are identified as Alabama Content Areas Students grow in mathematical understanding from year to year as they use the Student Mathematical Practices and attain the content standards The K-2 standards establish the groundwork for future mathematical success
The Alabama Content Areas shown below illustrate a progression designed to ensure that all students are equitably prepared to develop conceptual understanding of mathematics The NAEP (National Assessment of Educational Progress) content areas reflect an emphasis on the importance of mathematical reasoning throughout the full spectrum of mathematical content Alabama Content Areas explicitly define the framework needed for students to develop a comprehensive understanding of underlying mathematics concepts
18 2019 Alabama Course of Study Mathematics
Kindergarten Mathematics Overview
Kindergarten content is organized into six Alabama Content Areas as outlined in the table below Foundations of Counting Operations and Algebraic Thinking Operations with Numbers Base Ten Data Analysis Measurement and Geometry Related standards are grouped into clusters which are listed below each content area Standards indicate what the student should know or be able to do by the end of the grade
Alabama Content Areas
Foundations of
Counting
Operations and Algebraic
Thinking
Operations with Numbers Base
Ten
Data Analysis
Measurement
Geometry
Clusters
bull Know number names and the count sequence
bull Count to tell the number of objects
bull Compare numbers
bull Understand addition as putting together and adding to and understand subtraction as taking apart and taking from
bull Understand simple patterns
bull Work with numbers 11-19 to gain foundations for place value
bull Collect and analyze data and interpret results
bull Describe and compare measurable attributes
bull Identify and describe shapes
bull Analyze compare create and compose shapes
The eight Student Mathematical Practices listed in the chart below represent what students are doing as they learn mathematics Students should regularly engage in these processes and proficiencies at every level throughout their mathematical studies Proficiency with these practices is critical in using mathematics in the classroom and in everyday life The Student Mathematical Practices are standards to be incorporated across all grades
Student Mathematical Practices 1 Make sense of problems and persevere in solving them 5 Use appropriate tools strategically 2 Reason abstractly and quantitatively 6 Attend to precision 3 Construct viable arguments and critique the reasoning of others 7 Look for and make use of structure 4 Model with mathematics 8 Look for and express regularity in repeated reasoning
Content Priorities In kindergarten instructional time should focus on two critical areas
1 developing a sound sense of numbers by representing and comparing numbers using sets of objects and 2 recognizing and describing shapes and using spatial relations
Kindergarten Mathematics
19 2019 Alabama Course of Study Mathematics
The majority of learning time should be focused on number sense
1 Through their learning in the Foundations of Counting and Operations and Algebraic Thinking Alabama Content Areas students bull develop a formal sense of numbers including number sequence one-to-one correspondence cardinality and subitizing bull use numbers including written numerals to represent quantities and to solve quantitative problems such as counting objects in a set
counting out a given number of objects comparing sets or numerals and modeling simple joining and separating situations with sets of objects eventually with equations such as 5 + 2 = 7 and 7 ndash 2 = 5 (Note Kindergarten students should see addition and subtraction equations and student writing of equations in kindergarten is encouraged but not required)
bull choose combine and apply effective strategies for answering quantitative questions including quickly recognizing the cardinalities of small sets of objects counting and producing sets of given sizes counting the number of objects in combined sets or counting the number of objects that remain in a set after some are taken away and
bull duplicate and extend simple patterns by using concrete objects (Note Looking for duplicating and extending patterns are important processes in thinking algebraically)
2 Through their learning in the Geometry and Measurement Alabama Content Areas students
bull describe objects in their physical world using both mathematical vocabulary and geometric ideas bull identify name and describe basic two-dimensional shapes such as squares triangles circles rectangles and hexagons presented in a
variety of ways (eg in different sizes and orientations) bull identify three-dimensional shapes such as cubes cones cylinders and spheres bull use basic shapes and spatial reasoning to model objects in their environment to create and compose more complex shapes and bull explore pennies
(Note The term explore indicates that the topic is an important concept which builds the foundation for progression toward mastery in later grades)
When standards indicate that drawings may be used the drawings need not be detailed but should show the mathematics in the problem NOTE Although not all content areas in the grade level have been included in the overview all standards should be included in instruction
Kindergarten Mathematics
20 2019 Alabama Course of Study Mathematics
Kindergarten Content Standards
Each content standard completes the stem ldquoStudents willhelliprdquo Foundations of Counting Know number names and the count sequence Note on number reversals Learning to write numerals is generally more difficult than learning to read them It is common for students to reverse numerals at this stage
1 Count forward orally from 0 to 100 by ones and by tens Count backward orally from 10 to 0 by ones
2 Count to 100 by ones beginning with any given number between 0 and 99
3 Write numerals from 0 to 20 a Represent 0 to 20 using concrete objects when given a written numeral from 0 to 20 (with 0 representing a
count of no objects)
Count to tell the number of objects
4 Connect counting to cardinality using a variety of concrete objects a Say the number names in consecutive order when counting objects b Indicate that the last number name said tells the number of objects counted in a set c Indicate that the number of objects in a set is the same regardless of their arrangement or the order in
which they were counted d Explain that each successive number name refers to a quantity that is one larger
5 Count to answer ldquohow manyrdquo questions
a Count using no more than 20 concrete objects arranged in a line a rectangular array or a circle b Count using no more than 10 concrete objects in a scattered configuration c Draw the number of objects that matches a given numeral from 0 to 20
Compare numbers 6 Orally identify whether the number of objects in one group is greatermore than lessfewer than or equalthe
same as the number of objects in another group in groups containing up to 10 objects by using matching counting or other strategies
7 Compare two numbers between 0 and 10 presented as written numerals (without using inequality symbols)
Kindergarten Mathematics
21 2019 Alabama Course of Study Mathematics
Operations and Algebraic Thinking Understand addition as putting together and adding to and understand subtraction as taking apart and taking from Note Drawings need not be detailed but should show the mathematics in the problem
8 Represent addition and subtraction up to 10 with concrete objects fingers pennies mental images drawings claps or other sounds acting out situations verbal explanations expressions or equations
9 Solve addition and subtraction word problems and add and subtract within 10 by using concrete objects or drawings to represent the problem
10 Decompose numbers less than or equal to 10 into pairs of smaller numbers in more than one way by using
concrete objects or drawings and record each decomposition by a drawing or equation Example 5 = 2 + 3 and 5 = 4 + 1
11 For any number from 0 to 10 find the number that makes 10 when added to the given number by using concrete objects or drawings and record the answer with a drawing or equation
12 Fluently add and subtract within 5
Understand simple patterns
13 Duplicate and extend simple patterns using concrete objects
Operations with Numbers Work with numbers 11-19 to gain foundations for place value
14 Compose and decompose numbers from 11 to 19 by using concrete objects or drawings to demonstrate understanding that these numbers are composed of ten ones and one two three four five six seven eight or nine ones
Data Analysis Collect and analyze data and interpret results
15 Classify objects into given categories of 10 or fewer count the number of objects in each category and sort the categories by count a Categorize data on Venn diagrams pictographs and yes-no charts using real objects symbolic
representations or pictorial representations
Kindergarten Mathematics
22 2019 Alabama Course of Study Mathematics
Measurement Describe and compare measurable attributes
16 Identify and describe measurable attributes (length weight height) of a single object using vocabulary such as longshort heavylight or tallshort
17 Directly compare two objects with a measurable attribute in common to see which object has ldquomore ofrdquo or ldquoless ofrdquo the attribute and describe the difference Example Directly compare the heights of two children and describe one child as ldquotallerrdquo or ldquoshorterrdquo
Geometry Identify and describe shapes (squares circles triangles rectangles hexagons cubes cones cylinders and spheres)
18 Describe objects in the environment using names of shapes and describe the relative positions of these objects using terms such as above below beside in front of behind and next to
19 Correctly name shapes regardless of their orientations or overall sizes
20 Identify shapes as two-dimensional (lying in a plane ldquoflatrdquo) or three-dimensional (ldquosolidrdquo)
Analyze compare create and compose shapes
21 Analyze and compare two- and three-dimensional shapes in different sizes and orientations using informal language to describe their similarities differences parts (number of sides and vertices or ldquocornersrdquo) and other attributes Example having sides of equal length
22 Model shapes in the world by building them from sticks clay balls or other components and by drawing them 23 Use simple shapes to compose larger shapes
Example Join two triangles with full sides touching to make a rectangle
23 2019 Alabama Course of Study Mathematics
Grade 1 Mathematics Overview
Grade 1 content is organized into five Alabama Content Areas as outlined in the table below Operations and Algebraic Thinking Operations with Numbers Base Ten Data Analysis Measurement and Geometry Related standards are grouped into clusters which are listed below each content area Standards indicate what the student should know or be able to do by the end of the grade
Alabama
Content Areas Operations and Algebraic Thinking Operations with Numbers Base Ten Data Analysis Measurement Geometry
Clusters
bull Represent and solve problems involving addition and subtraction
bull Understand and apply properties of operations and the relationship between addition and subtraction
bull Add and subtract within 20 bull Work with addition and subtraction
equations bull Understand simple patterns
bull Extend the counting sequence
bull Understand place value bull Use place value
understanding and properties of operations to add and subtract
bull Collect and analyze data and interpret results
bull Describe and compare measurable attributes
bull Work with time and money
bull Reason with shapes and their attributes
The eight Student Mathematical Practices listed in the chart below represent what students are doing as they learn mathematics Students should regularly engage in these processes and proficiencies at every level throughout their mathematical studies Proficiency with these practices is critical in using mathematics both in the classroom and in everyday life The Student Mathematical Practices are standards to be incorporated across all grades
Student Mathematical Practices 1 Make sense of problems and persevere in solving them 5 Use appropriate tools strategically 2 Reason abstractly and quantitatively 6 Attend to precision 3 Construct viable arguments and critique the reasoning of others 7 Look for and make use of structure 4 Model with mathematics 8 Look for and express regularity in repeated reasoning
Grade 1 Mathematics
24 2019 Alabama Course of Study Mathematics
Content Priorities
In Grade 1 instructional time should focus on four critical areas 1 developing understanding of addition subtraction and strategies for addition and subtraction within 20 2 developing understanding of whole number relationships and place value including grouping in tens and ones 3 developing understanding of linear measurement and measuring lengths as iterating length units and 4 reasoning about attributes of and composing and decomposing geometric shapes
Important information regarding these four critical areas of instruction follows 1 Through their learning in the Operations and Algebraic Thinking Alabama Content Area students
bull develop strategies for adding and subtracting whole numbers based on prior work with small numbers bull use a variety of models including concrete objects and length-based models such as cubes connected to form lengths to model add-to
take-from put-together take-apart and compare situations as a means of developing meaning for the operations of addition and subtraction and developing strategies to solve arithmetic problems with these operations
bull understand connections between counting and addition and subtraction (eg adding two is the same as counting on two) bull use properties of addition to add whole numbers and to create and use increasingly sophisticated strategies based on these properties
such as ldquomaking tensrdquo to solve addition and subtraction problems within 20 bull build their understanding of the relationship between addition and subtraction by comparing a variety of solution strategies and bull reproduce extend and create patterns and sequences of numbers using a variety of materials
Note Reproducing extending and creating patterns are important processes in thinking algebraically 2 Through their learning in the Operations with Numbers Base Ten Alabama Content Area students
bull develop discuss and use efficient accurate and generalizable methods to add within 100 and to subtract multiples of 10 bull compare whole numbers at least to 100 to develop understanding of and solve problems involving their relative sizes bull think of whole numbers between 10 and 99 in terms of tens and ones (especially recognizing the numbers 11 to 19 as composed of a ten
and some ones) and bull understand the order of the counting numbers and their relative magnitudes through activities that build number sense
3 Through their learning in the Measurement Alabama Content Area students
bull develop an understanding of the meaning and processes of measurement including underlying concepts such as iterating (the mental activity of building up the length of an object with equal-sized units) and the transitivity principle for indirect measurement and
bull work with time and money
Grade 1 Mathematics
25 2019 Alabama Course of Study Mathematics
Note Students should apply the principle of transitivity of measurement to make indirect comparisons although they need not use this technical term
4 Through their learning in the Geometry Alabama Content Area students bull compose and decompose plane or solid figures including putting two triangles together to make a quadrilateral and build understanding
of part-whole relationships as well as the properties of the original and composite shapes and bull combine shapes recognize them from different perspectives and orientations describe their geometric attributes and determine how they
are alike and different to develop the background for measurement and initial understandings of properties such as congruence and symmetry for use in later grades
NOTE Although not all content areas in the grade level have been included in the overview all standards should be included in instruction
Grade 1 Content Standards Each content standard completes the stem ldquoStudents willhelliprdquo Operations and Algebraic Thinking Represent and solve problems involving addition and subtraction Note Students use properties of operations and different strategies to find the sum of three whole numbers such as counting on making tens decomposing numbers doubles and near doubles
1 Use addition and subtraction to solve word problems within 20 by using concrete objects drawings and equations with a symbol for the unknown number to represent the problem a Add to with change unknown to solve word problems within 20 b Take from with change unknown to solve word problems within 20 c Put togethertake apart with addend unknown to solve word problems within 20 d Compare quantities with difference unknown bigger unknown and smaller unknown while solving word
problems within 20
2 Solve word problems that call for addition of three whole numbers whose sum is less than or equal to 20 by using concrete objects drawings or equations with a symbol for the unknown number to represent the problem
Grade 1 Mathematics
26 2019 Alabama Course of Study Mathematics
Understand and apply properties of operations and the relationship between addition and subtraction Note Students need not use formal terms for these properties
3 Apply properties of operations as strategies to add and subtract Examples If 8 + 3 = 11 is known then 3 + 8 = 11 is also known (commutative property of addition) To add 2 + 6 + 4 the second and third numbers can be added to make a ten so 2 + 6 + 4 = 2 + 10 = 12 (associative property of addition) When adding 0 to a number the result is the same number (identity property of zero for addition)
4 Explain subtraction as an unknown-addend problem Example subtracting 10 - 8 by finding the number that makes 10 when added to 8
Add and subtract within 20 Note Fluency involves a mixture of ldquojust knowingrdquo answers knowing answers from patterns and knowing answers from the use of strategies The word fluently is used in the standards to mean accurately efficiently and flexibly
5 Relate counting to addition and subtraction Example counting on 2 to add 2 6 Add and subtract within 20
a Demonstrate fluency with addition and subtraction facts with sums or differences to 10 by counting on b Demonstrate fluency with addition and subtraction facts with sums or differences to 10 by making ten c Demonstrate fluency with addition and subtraction facts with sums or differences to 10 by decomposing a
number leading to a ten Example 13 - 4 = 13 - 3 - 1 = 10 - 1 = 9
d Demonstrate fluency with addition and subtraction facts with sums or differences to 10 by using the relationship between addition and subtraction Example Knowing that 8 + 4 = 12 one knows 12 - 8 = 4
e Demonstrate fluency with addition and subtraction facts with sums or differences to 10 by creating equivalent but easier or known sums Example adding 6 + 7 by creating the known equivalent 6 + 6 + 1 = 12 + 1 = 13
Work with addition and subtraction equations
7 Explain that the equal sign means ldquothe same asrdquo Determine whether equations involving addition and subtraction are true or false Example determining which of the following equations are true and which are false 6 = 6 7 = 8 ndash 1 5 + 2 = 2 + 5 4 + 1 = 5 + 2
8 Solve for the unknown whole number in various positions in an addition or subtraction equation relating three whole numbers that would make it true Example determining the unknown number that makes the equation true in each of the equations 8 + = 11 5 = ndash 3 and 6 + 6 =
Grade 1 Mathematics
27 2019 Alabama Course of Study Mathematics
Understand simple patterns
9 Reproduce extend and create patterns and sequences of numbers using a variety of materials
Operations with Numbers Base Ten Extend the counting sequence
10 Extend the number sequence from 0 to 120 a Count forward and backward by ones starting at any number less than 120 b Read numerals from 0 to 120 c Write numerals from 0 to 120 d Represent a number of objects from 0 to 120 with a written numeral
Understand place value 11 Explain that the two digits of a two-digit number represent amounts of tens and ones a Identify a bundle of ten ones as a ldquotenrdquo b Identify the numbers from 11 to 19 as composed of a ten and one two three four five six seven eight or nine
ones c Identify the numbers 10 20 30 40 50 60 70 80 90 as one two three four five six seven eight or nine tens
(and 0 ones)
12 Compare pairs of two-digit numbers based on the values of the tens and ones digits recording the results of comparisons with the symbols gt = and lt and orally with the words ldquois greater thanrdquo ldquois equal tordquo and ldquois less thanrdquo
Use place value understanding and properties of operations to add and subtract
13 Add within 100 using concrete models or drawings and strategies based on place value a Add a two-digit number and a one-digit number b Add a two-digit number and a multiple of 10 c Demonstrate that in adding two-digit numbers tens are added to tens ones are added to ones and sometimes it is
necessary to compose a ten d Relate the strategy for adding a two-digit number and a one-digit number to a written method and explain the
reasoning used 14 Given a two-digit number mentally find 10 more or 10 less than the number without having to count and explain
the reasoning used 15 Subtract multiples of 10 from multiples of 10 in the range 10-90 (positive or zero differences) using concrete
models or drawings and strategies based on place value properties of operations andor the relationship between addition and subtraction Relate the strategy to a written method and explain the reasoning used
Grade 1 Mathematics
28 2019 Alabama Course of Study Mathematics
Data Analysis Collect and analyze data and interpret results
16 Organize represent and interpret data with up to three categories a Ask and answer questions about the total number of data points in organized data b Summarize data on Venn diagrams pictographs and yes-no charts using real objects symbolic
representations or pictorial representations c Determine ldquohow manyrdquo in each category using up to three categories of data d Determine ldquohow many morerdquo or ldquohow many lessrdquo are in one category than in another using data organized
into two or three categories
Measurement Describe and compare measurable attributes
17 Order three objects by length compare the lengths of two objects indirectly by using a third object 18 Determine the length of an object using non-standard units with no gaps or overlaps expressing the length of the
object with a whole number
Work with time and money
19 Tell and write time to the hours and half hours using analog and digital clocks 20 Identify pennies and dimes by name and value
Geometry Reason with shapes and their attributes Note Students do not need to learn formal names such as ldquoright rectangular prismrdquo
21 Build and draw shapes which have defining attributes a Distinguish between defining attributes and non-defining attributes Examples Triangles are closed and three- sided which are defining attributes color orientation and overall
size are non-defining attributes 22 Compose two-dimensional shapes (rectangles squares trapezoids triangles half-circles and quarter-circles) or
three-dimensional shapes (cubes right rectangular prisms right circular cones and right circular cylinders) to create a composite shape and compose new shapes from the composite shape
Grade 1 Mathematics
29 2019 Alabama Course of Study Mathematics
23 Partition circles and rectangles into two and four equal shares and describe the shares using the words halves fourths and quarters and use the phrases half of fourth of and quarter of a Describe ldquothe wholerdquo as two of or four of the shares of circles and rectangles partitioned into two or four equal
shares b Explain that decomposing into more equal shares creates smaller shares of circles and rectangles
30 2019 Alabama Course of Study Mathematics
Grade 2 Mathematics Overview
Grade 2 content is organized into five Alabama Content Areas as outlined in the table below Operations and Algebraic Thinking Operations with Numbers Base Ten Data Analysis Measurement and Geometry Related standards are grouped into clusters which are listed below each content area Standards indicate what the student should know or be able to do by the end of the grade
Alabama
Content Areas
Operations and Algebraic Thinking
Operations with Numbers Base Ten
Data Analysis
Measurement Geometry
Clusters
bull Represent and solve problems involving addition and subtraction
bull Add and subtract within 20 bull Work with equal groups of
objects to gain foundations for multiplication
bull Understand simple patterns
bull Understand place value
bull Use place value understanding and properties of operations to add and subtract
bull Collect and analyze data and interpret results
bull Measure and estimate lengths in standard units
bull Relate addition and subtraction to length
bull Work with time and money
bull Reason with shapes and their attributes
The eight Student Mathematical Practices listed in the chart below represent what students are doing as they learn mathematics Students should regularly engage in these processes and proficiencies at every level throughout their mathematical studies Proficiency with these practices is critical in using mathematics in the classroom and in everyday life The Student Mathematical Practices are standards which should be incorporated across all grades
Student Mathematical Practices 1 Make sense of problems and persevere in solving them 5 Use appropriate tools strategically 2 Reason abstractly and quantitatively 6 Attend to precision 3 Construct viable arguments and critique the reasoning of others 7 Look for and make use of structure 4 Model with mathematics 8 Look for and express regularity in repeated reasoning
Content Priorities
In Grade 2 instructional time should focus on four critical areas
1 building fluency with addition and subtraction 2 extending understanding of base-ten notation 3 using standard units of measure and 4 describing and analyzing shapes
Grade 2 Mathematics
31 2019 Alabama Course of Study Mathematics
Important information regarding these four critical areas of instruction follows 1 Through their learning in the Operations and Algebraic Thinking Alabama Content Area students
bull use their understanding of addition to develop fluency with addition and subtraction within 100 including ability to state automatically the sums of all one-digit numbers by the end of the grade
bull solve problems within 1000 by applying their understanding of models for addition and subtraction and develop discuss and use efficient accurate and generalizable methods to compute sums and differences of whole numbers in base-ten notation using their understanding of place value and the properties of operations
bull select and accurately apply methods that are appropriate for the context and the numbers involved to mentally calculate sums and differences for numbers with only tens or only hundreds and
bull reproduce extend create and describe patterns and sequences using a variety of materials Note Reproducing extending creating and describing patterns are important processes in thinking algebraically
2 Through their learning in the Operations with Numbers Base Ten Alabama Content Area students
bull extend their understanding of the base-ten system This includes ideas of counting in fives tens and multiples of hundreds tens and ones as well as number relationships involving these units including comparing and
bull understand multi-digit numbers (up to 1000) written in base-ten notation recognizing that the digits in each place represent amounts of thousands hundreds tens or ones (eg 853 is 8 hundreds + 5 tens + 3 ones)
3 Through their learning in the Measurement Alabama Content Area students
bull recognize the need for standard units of measure including centimeter and inch and use rulers and other measurement tools with the understanding that linear measure involves an iteration of units and
bull recognize that the smaller the unit the more iterations are needed to cover a given length
4 Through their learning in the Geometry Alabama Content Area students bull describe and analyze shapes by examining their sides and angles bull investigate describe and reason about decomposing and combining shapes to make other shapes and bull draw partition and analyze two- and three-dimensional shapes to develop a foundation for understanding area volume congruence
similarity and symmetry in later grades When standards indicate that drawings may be used the drawings need not be detailed but should show the mathematics in the problem NOTE Although not all content areas in the grade level have been included in the overview all standards should be included in instruction
Grade 2 Mathematics
32 2019 Alabama Course of Study Mathematics
Note fluency vs automaticity Fluency involves a mixture of ldquojust knowingrdquo answers knowing answers from patterns and knowing answers from the use of strategies The word fluently is used in the standards to mean accurately efficiently and flexibly Automaticity of facts becomes evident when a student no longer uses a pattern or mental algorithm to determine the answer
Grade 2 Content Standards Each content standard completes the stem ldquoStudents willhelliprdquo Operations and Algebraic Thinking Represent and solve problems involving addition and subtraction Note Second grade problem types include adding to taking from putting together taking apart and comparing with unknowns in all positions
1 Use addition and subtraction within 100 to solve one- and two-step word problems by using drawings and equations with a symbol for the unknown number to represent the problem
Add and subtract within 20 See note regarding fluency vs automaticity in the Overview
2 Fluently add and subtract within 20 using mental strategies such as counting on making ten decomposing a number leading to ten using the relationship between addition and subtraction and creating equivalent but easier or known sums a State automatically all sums of two one-digit numbers
Work with equal groups of objects to gain foundations for multiplication
3 Use concrete objects to determine whether a group of up to 20 objects is even or odd a Write an equation to express an even number as a sum of two equal addends
4 Using concrete and pictorial representations and repeated addition determine the total number of objects in a
rectangular array with up to 5 rows and up to 5 columns a Write an equation to express the total number of objects in a rectangular array with up to 5 rows and up to 5
columns as a sum of equal addends Understand simple patterns
5 Reproduce extend create and describe patterns and sequences using a variety of materials
Grade 2 Mathematics
33 2019 Alabama Course of Study Mathematics
Operations with Numbers Base Ten Understand place value 6 Explain that the three digits of a three-digit number represent amounts of hundreds tens and ones
a Explain the following three-digit numbers as special cases 100 can be thought of as a bundle of ten tens called a ldquohundredrdquo and the numbers 100 200 300 400 500 600 700 800 900 refer to one two three four five six seven eight or nine hundreds (and 0 tens and 0 ones)
7 Count within 1000 by ones fives tens and hundreds 8 Read and write numbers to 1000 using base-ten numerals number names and expanded form 9 Compare two three-digit numbers based on the value of the hundreds tens and ones digits recording the results of
comparisons with the symbols gt = and lt and orally with the words ldquois greater thanrdquo ldquois equal tordquo and ldquois less thanrdquo
Use place value understanding and properties of operations to add and subtract
10 Fluently add and subtract within 100 using strategies based on place value properties of operations andor the relationship between addition and subtraction
11 Use a variety of strategies to add up to four two-digit numbers 12 Add and subtract within 1000 using concrete models or drawings and strategies based on place value properties of
operations andor the relationship between addition and subtraction relate the strategy to a written method a Explain that in adding or subtracting three-digit numbers one adds or subtracts hundreds and hundreds tens
and tens ones and ones and sometimes it is necessary to compose or decompose tens or hundreds 13 Mentally add and subtract 10 or 100 to a given number between 100 and 900
14 Explain why addition and subtraction strategies work using place value and the properties of operations
Note Explanations may be supported by drawings or objects
Grade 2 Mathematics
34 2019 Alabama Course of Study Mathematics
Data Analysis Collect and analyze data and interpret results
15 Measure lengths of several objects to the nearest whole unit a Create a line plot where the horizontal scale is marked off in whole-number units to show the lengths of several
measured objects 16 Create a picture graph and bar graph to represent data with up to four categories
a Using information presented in a bar graph solve simple ldquoput-togetherrdquo ldquotake-apartrdquo and ldquocomparerdquo problems
b Using Venn diagrams pictographs and yes-no charts analyze data to predict an outcome
Measurement Measure and estimate lengths in standard units
17 Measure the length of an object by selecting and using standard units of measurement shown on rulers yardsticks meter sticks or measuring tapes
18 Measure objects with two different units and describe how the two measurements relate to each other and the size
of the unit chosen 19 Estimate lengths using the following standard units of measurement inches feet centimeters and meters
20 Measure to determine how much longer one object is than another expressing the length difference of the two
objects using standard units of length
Relate addition and subtraction to length
21 Use addition and subtraction within 100 to solve word problems involving same units of length representing the problem with drawings (such as drawings of rulers) andor equations with a symbol for the unknown number
22 Create a number line diagram using whole numbers and use it to represent whole-number sums and differences
within 100
Work with time and money
23 Tell and write time from analog and digital clocks to the nearest five minutes using am and pm a Express an understanding of common terms such as but not limited to quarter past half past and quarter to
Grade 2 Mathematics
35 2019 Alabama Course of Study Mathematics
24 Solve problems with money a Identify nickels and quarters by name and value b Find the value of a collection of quarters dimes nickels and pennies c Solve word problems by adding and subtracting within one dollar using the $ and cent symbols appropriately (not
including decimal notation) Example 24cent + 26cent = 50cent
Geometry Reason with shapes and their attributes
25 Identify triangles quadrilaterals pentagons hexagons and cubes a Recognize and draw shapes having specified attributes
Examples a given number of angles or a given number of equal faces 26 Partition a rectangle into rows and columns of same-size squares and count to find the total number of squares 27 Partition circles and rectangles into two three or four equal shares Describe the shares using such terms as
halves thirds half of or a third of and describe the whole as two halves three thirds or four fourths a Explain that equal shares of identical wholes need not have the same shape
36
2019 Alabama Course of Study Mathematics
GRADES 3-5 OVERVIEW The Grades 3-5 course of study focuses on strengthening the foundations of mathematics empowering students for middle school mathematics and developing their understanding of mathematics in relation to everyday life To ensure that all students receive the preparation they deserve instruction will focus on building conceptual understanding of the mathematics needed for a lifetime Students in Grades 3-5 will extend their learning through content areas of Operations with Numbers Base Ten Operations with Numbers Fractions Operations and Algebraic Thinking Data Analysis Measurement and Geometry In order to achieve the necessary focus on Grades 3-5 content Student Mathematical Practices are integrated with instruction to foster habits of mind as students engage in critical areas for each grade level The Alabama Content Areas shown below illustrate a progression designed to ensure that all students are equitably prepared to develop conceptual understanding of mathematics The NAEP (National Assessment of Educational Progress) content areas reflect an emphasis on the importance of mathematical reasoning throughout the full spectrum of mathematical content Alabama Content Areas explicitly define the framework needed for students to develop a comprehensive understanding of underlying mathematics concepts
37 2019 Alabama Course of Study Mathematics
Grade 3 Overview Grade 3 content is organized into six Alabama Content Areas of study as outlined in the table below Operations and Algebraic Thinking Operations with Numbers Base Ten Operations with Numbers Fractions Data Analysis Measurement and Geometry Related standards are grouped into clusters which are listed below each content area Standards indicate what the student should know or be able to do by the end of the grade
Alabama
Content Areas Operations and Algebraic
Thinking
Operations with Numbers Base Ten
Operations with Numbers Fractions Data Analysis Measurement Geometry
Clusters
bull Represent and solve problems involving multiplication and division
bull Understand properties of multiplication and the relationship between multiplication and division
bull Multiply and divide within 100
bull Solve problems involving the four operations and identify and explain patterns in arithmetic
bull Use place value understanding and properties of operations to perform multi-digit arithmetic
bull Develop understanding of fractions as numbers
bull Represent and interpret data
bull Solve problems involving measurement and estimation of intervals of time liquid volumes and masses of objects
bull Geometric measurement understand concepts of area and relate area to multiplication and addition
bull Geometric measurement recognize perimeter as an attribute of plane figures and distinguish between linear and area measures
bull Reason with shapes and their attributes
The eight Student Mathematical Practices listed in the chart below represent what students are doing as they learn mathematics Students should regularly engage in these processes and proficiencies at every level throughout their mathematical studies Proficiency with these practices is critical in using mathematics both in the classroom and in everyday life The Student Mathematical Practices should be regarded as standards to be incorporated across all grades
Student Mathematical Practices
1 Make sense of problems and persevere in solving them 5 Use appropriate tools strategically 2 Reason abstractly and quantitatively 6 Attend to precision 3 Construct viable arguments and critique the reasoning of others 7 Look for and make use of structure 4 Model with mathematics 8 Look for and express regularity in repeated reasoning
Grade 3 Mathematics
38 2019 Alabama Course of Study Mathematics
Content Priorities In Grade 3 instructional time should focus on four critical areas 1 developing understanding of multiplication and division and strategies for multiplication and division within 100 2 developing understanding of fractions especially unit fractions (fractions with numerator 1) 3 developing understanding of the structure of rectangular arrays and of area and 4 describing and analyzing two-dimensional shapes
1 Through their learning in the Operations and Algebraic Thinking Alabama Content Area students
bull develop an understanding of the meanings of multiplication and division of whole numbers through activities and problems involving equal-sized groups arrays and area models multiplication is finding an unknown product and division is finding an unknown factor in these situations For equal-sized group situations division can require finding the unknown number of groups or the unknown group size
bull use properties of operations to calculate products of whole numbers using increasingly sophisticated strategies based on these properties to solve multiplication and division problems involving single-digit factors and
bull compare a variety of solution strategies to learn the relationship between multiplication and division
2 Through their learning in the Operations with Numbers Fractions Alabama Content Area students bull develop an understanding of fractions beginning with unit fractions bull view fractions in general as being composed of unit fractions and use fractions along with visual fraction models such as area models
fraction strips and number lines to represent parts of a whole bull understand that the size of a fractional part is relative to the size of the whole and use fractions to represent numbers equal to less than
and greater than one and bull solve problems that involve comparing fractions by using visual fraction models and strategies based on noticing equal numerators or
denominators
3 Through their learning in the Measurement Alabama Content Area students bull recognize area as an attribute of two-dimensional regions bull measure the area of a shape by finding the total number of same-size units of area required to cover the shape without gaps or overlaps a
square with sides of unit length being the standard unit for measuring area and bull understand that rectangular arrays can be decomposed into identical rows or into identical columns By decomposing rectangles into
rectangular arrays of squares students connect area to multiplication and justify using multiplication to determine the area of a rectangle
Grade 3 Mathematics
39 2019 Alabama Course of Study Mathematics
4 Through their learning in the Geometry Alabama Content Area students bull extend knowledge of polygons to describe analyze and compare properties of two-dimensional shapes and bull recognize shapes that areare not quadrilaterals by using informal language to classify shapes by sides and angles and connect these with
the names of the shapes
NOTE Although not all content areas in the grade level have been included in the overview all standards should be included in instruction
Note fluency vs automaticity Fluency involves a mixture of ldquojust knowingrdquo answers knowing answers from patterns and knowing answers from the use of strategies The word fluently is used in the standards to mean accurately efficiently and flexibly Automaticity of facts becomes evident when a student no longer uses a pattern or mental algorithm to determine the answer
Grade 3 Content Standards
Each content standard completes the stem ldquoStudents willhelliprdquo Operations and Algebraic Thinking Represent and solve problems involving multiplication and division
1 Illustrate the product of two whole numbers as equal groups by identifying the number of groups and the number in each group and represent as a written expression
2 Illustrate and interpret the quotient of two whole numbers as the number of objects in each group or the number of
groups when the whole is partitioned into equal shares 3 Solve word situations using multiplication and division within 100 involving equal groups arrays and
measurement quantities represent the situation using models drawings and equations with a symbol for the unknown number
4 Determine the unknown whole number in a multiplication or division equation relating three whole numbers
Grade 3 Mathematics
40 2019 Alabama Course of Study Mathematics
Understand properties of multiplication and the relationship between multiplication and division Note Students need not use formal terms for these properties
5 Develop and apply properties of operations as strategies to multiply and divide 6 Use the relationship between multiplication and division to represent division as an equation with an unknown
factor
Multiply and divide within 100
7 Use strategies based on properties and patterns of multiplication to demonstrate fluency with multiplication and division within 100 a Fluently determine all products obtained by multiplying two one-digit numbers b State automatically all products of two one-digit numbers by the end of third grade
Solve problems involving the four operations and identify and explain patterns in arithmetic
8 Determine and justify solutions for two-step word problems using the four operations and write an equation with a letter standing for the unknown quantity Determine reasonableness of answers using number sense context mental computation and estimation strategies including rounding
9 Recognize and explain arithmetic patterns using properties of operations
Operations with Numbers Base Ten Use place value understanding and properties of operations to perform multi-digit arithmetic
10 Identify the nearest 10 or 100 when rounding whole numbers using place value understanding
11 Use various strategies to add and subtract fluently within 1000
12 Use concrete materials and pictorial models based on place value and properties of operations to find the product of a one-digit whole number by a multiple of ten (from 10 to 90)
Grade 3 Mathematics
41 2019 Alabama Course of Study Mathematics
Operations with Numbers Fractions Develop understanding of fractions as numbers Denominators are limited to 2 3 4 6 and 8
13 Demonstrate that a unit fraction represents one part of an area model or length model of a whole that has been equally partitioned explain that a numerator greater than one indicates the number of unit pieces represented by the fraction
14 Interpret a fraction as a number on the number line locate or represent fractions on a number line diagram a Represent a unit fraction (1
119887119887) on a number line by defining the interval from 0 to 1 as the whole and
partitioning it into b equal parts as specified by the denominator b Represent a fraction (119886119886
119887119887) on a number line by marking off a lengths of size (1
119887119887) from zero
15 Explain equivalence and compare fractions by reasoning about their size using visual fraction models and number
lines a Express whole numbers as fractions and recognize fractions that are equivalent to whole numbers b Compare two fractions with the same numerator or with the same denominator by reasoning about their size
(recognizing that fractions must refer to the same whole for the comparison to be valid) Record comparisons using lt gt or = and justify conclusions
Data Analysis Represent and interpret data
16 For a given or collected set of data create a scaled (one-to-many) picture graph and scaled bar graph to represent a data set with several categories a Determine a simple probability from a context that includes a picture b Solve one- and two-step ldquohow many morerdquo and ldquohow many lessrdquo problems using information presented in
scaled graphs 17 Measure lengths using rulers marked with halves and fourths of an inch to generate data and create a line plot
marked off in appropriate units to display the data
Grade 3 Mathematics
42 2019 Alabama Course of Study Mathematics
Measurement Solve problems involving measurement and estimation of intervals of time liquid volumes and masses of objects
18 Tell and write time to the nearest minute measure time intervals in minutes (within 90 minutes) a Solve real-world problems involving addition and subtraction of time intervals in minutes by representing the
problem on a number line diagram
19 Estimate and measure liquid volumes and masses of objects using liters (l) grams (g) and kilograms (kg) a Use the four operations to solve one-step word problems involving masses or volumes given in the same
metric units
Geometric measurement understand concepts of area and relate area to multiplication and to addition
20 Find the area of a rectangle with whole number side lengths by tiling without gaps or overlays and counting unit squares
21 Count unit squares (square cm square m square in square ft and improvised or non-standard units) to determine
area 22 Relate area to the operations of multiplication using real-world problems concrete materials mathematical
reasoning and the distributive property 23 Decompose rectilinear figures into smaller rectangles to find the area using concrete materials
Geometric measurement Recognize perimeter as an attribute of plane figures and distinguish between linear and area measures
24 Construct rectangles with the same perimeter and different areas or the same area and different perimeters
25 Solve real-world problems involving perimeters of polygons including finding the perimeter given the side lengths and finding an unknown side length of rectangles
Geometry Reason with shapes and their attributes
26 Recognize and describe polygons (up to 8 sides) triangles and quadrilaterals (rhombuses rectangles and squares) based on the number of sides and the presence or absence of square corners a Draw examples of quadrilaterals that are and are not rhombuses rectangles and squares
43 2019 Alabama Course of Study Mathematics
Grade 4 Overview
Grade 4 content is organized into six Alabama Content Areas outlined in the table below Operations and Algebraic Thinking Operations with Numbers Base Ten Operations with Numbers Fractions Data Analysis Measurement and Geometry Related standards are grouped into clusters which are listed below each content area Standards indicate what the student should know or be able to do by the end of the grade
Alabama Content Areas
Operations and Algebraic Thinking
Operations with Numbers Base Ten
Operations with Numbers Fractions Data Analysis Measurement Geometry
Clusters
Gain familiarity with factors and multiples
Solve problems with whole numbers using the four operations
Generate and analyze patterns
Generalize place value understanding for multi-digit whole numbers
Use place value understanding and properties of operations to perform multi-digit arithmetic with whole numbers
Extend understanding of fraction equivalence and ordering
Build fractions from unit fractions by applying and extending previous understandings of operations on whole numbers
Understand decimal notation for fractions and compare decimal fractions
Represent and interpret data
Solve problems involving measurement and conversion of measurements from a larger unit to a smaller unit
Geometric measurement understand concepts of angles and measure angles
Draw and identify lines and angles and identify shapes by properties of their lines and angles
The eight Student Mathematical Practices listed in the chart below represent what students are doing as they learn mathematics Students should regularly engage in these processes and proficiencies at every level throughout their mathematical studies Proficiency with these practices is critical in using mathematics both within the classroom and in life The Student Mathematical Practices are as standards which should be incorporated across all grades
Student Mathematical Practices 1 Make sense of problems and persevere in solving them 5 Use appropriate tools strategically 2 Reason abstractly and quantitatively 6 Attend to precision 3 Construct viable arguments and critique the reasoning of others 7 Look for and make use of structure 4 Model with mathematics 8 Look for and express regularity in repeated reasoning
Grade 4 Mathematics
44 2019 Alabama Course of Study Mathematics
Content Priorities
In Grade 4 instructional time should focus on three areas 1 developing understanding and fluency with multi-digit multiplication and understanding of division to find quotients
involving multi-digit dividends 2 developing an understanding of fraction equivalence addition and subtraction of fractions with like denominators and multiplication
of fractions by whole numbers and 3 understanding that geometric figures can be analyzed and classified based on their properties such as having parallel sides
perpendicular sides particular angle measures or symmetry
1 Through their learning in the Operations with Numbers Base Ten Alabama Content Area students generalize their understanding of place value to 1000000 understanding the relative sizes of numbers in each place apply their understanding of models for multiplication (equal-sized groups arrays area models) place value and properties of
operation in particular the distributive property as they develop discuss and use efficient accurate and generalizable methods to compute products of multi-digit whole numbers
select and accurately apply appropriate methods to estimate or mentally calculate products depending on the numbers and the context develop fluency with efficient procedures for multiplying whole numbers understand and explain why the procedures work based on
place value and properties of operations and use them to solve problems apply their understanding of models for division place value properties of operations and the relationship between division and
multiplication as they develop discuss and use efficient accurate and generalizable procedures to find quotients involving multi-digit dividends and
select and accurately apply appropriate methods to estimate and mentally calculate quotients and interpret remainders based upon the context
2 Through their learning in the Operations with Numbers Fractions Alabama Content Area students
develop understanding of fraction equivalence and operations with fractions recognize that two different fractions can be equal (eg 159 = 53) and develop methods for generating and recognizing equivalent
fractions and extend previous understandings about how fractions are built from unit fractions to compose fractions from unit fractions decompose
fractions into unit fractions and use the meaning of fractions and the meaning of multiplication to multiply a fraction by a whole number
Grade 4 Mathematics
45 2019 Alabama Course of Study Mathematics
3 Through their learning in the Geometry Alabama Content Area students
describe analyze compare and identify two-dimensional shapes using formal language based on the definition of the shapes deepen their understanding of properties of two-dimensional shapes (eg angles parallelism or symmetry) and use properties of two-dimensional objects to solve problems involving symmetry
NOTE Although not all content areas in the grade level have been included in the overview all standards should be included in instruction
NOTE fluency vs automaticity Fluency involves a mixture of ldquojust knowingrdquo answers knowing answers from patterns and knowing answers from the use of strategies The word fluently is used in the standards to mean accurately efficiently and flexibly Automaticity of facts becomes evident when a student no longer uses a pattern or mental algorithm to determine the answer
Grade 4 Content Standards Each content standard completes the stem ldquoStudents willhelliprdquo Operations and Algebraic Thinking Solve problems with whole numbers using the four operations
1 Interpret and write equations for multiplicative comparisons
2 Solve word problems involving multiplicative comparison using drawings and write equations to represent the problem using a symbol for the unknown number
3 Determine and justify solutions for multi-step word problems including problems where remainders must be
interpreted a Write equations to show solutions for multi-step word problems with a letter standing for the unknown
quantity b Determine reasonableness of answers for multi-step word problems using mental computation and estimation
strategies including rounding
Gain familiarity with factors and multiples
4 For whole numbers in the range 1 to 100 find all factor pairs identifying a number as a multiple of each of its factors a Determine whether a whole number in the range 1 to 100 is a multiple of a given one-digit number b Determine whether a whole number in the range 1 to 100 is prime or composite
Grade 4 Mathematics
46 2019 Alabama Course of Study Mathematics
Generate and analyze patterns
5 Generate and analyze a number or shape pattern that follows a given rule
Operations with Numbers Base Ten Generalize place value understanding for multi-digit whole numbers
6 Using models and quantitative reasoning explain that in a multi-digit whole number a digit in any place represents ten times what it represents in the place to its right
7 Read and write multi-digit whole numbers using standard form word form and expanded form
8 Use place value understanding to compare two multi-digit numbers using gt = and lt symbols
9 Round multi-digit whole numbers to any place using place value understanding
Use place value understanding and properties of operations to perform multi-digit arithmetic with whole numbers
10 Use place value strategies to fluently add and subtract multi-digit whole numbers and connect strategies to the standard algorithm
11 Find the product of two factors (up to four digits by a one-digit number and two two-digit numbers) using strategies based on place value and the properties of operations a Illustrate and explain the product of two factors using equations rectangular arrays and area models
12 Use strategies based on place value properties of operations andor the relationship between multiplication and
division to find whole-number quotients and remainders with one-digit divisors and up to four-digit dividends a Illustrate andor explain quotients using equations rectangular arrays andor area models
Operations with Numbers Fractions Extend understanding of fraction equivalence and ordering Denominators are limited to 2 3 4 5 6 8 10 12 and 100
13 Using area and length fraction models explain why one fraction is equivalent to another taking into account that the number and size of the parts differ even though the two fractions themselves are the same size a Apply principles of fraction equivalence to recognize and generate equivalent fractions
Example ab
Ris equivalent to n times an times b
Grade 4 Mathematics
47 2019 Alabama Course of Study Mathematics
14 Compare two fractions with different numerators and different denominators using concrete models benchmarks (0 frac12 1) common denominators andor common numerators recording the comparisons with symbols gt = or lt and justifying the conclusions a Explain that comparison of two fractions is valid only when the two fractions refer to the same whole
Build fractions from unit fractions by applying and extending previous understandings of operations on whole numbers
15 Model and justify decompositions of fractions and explain addition and subtraction of fractions as joining or separating parts referring to the same whole a Decompose a fraction as a sum of unit fractions and as a sum of fractions with the same denominator in more
than one way using area models length models and equations b Add and subtract fractions and mixed numbers with like denominators using fraction equivalence properties of
operations and the relationship between addition and subtraction c Solve word problems involving addition and subtraction of fractions and mixed numbers having like
denominators using drawings visual fraction models and equations to represent the problem
16 Apply and extend previous understandings of multiplication to multiply a whole number times a fraction a Model and explain how a non-unit fraction can be represented by a whole number times the unit fraction
Example 98
= 9 times 18
b Extend previous understanding of multiplication to multiply a whole number times any fraction less than one Example 4 times 2
3 = 4 times 2
3= 8
3
c Solve word problems involving multiplying a whole number times a fraction using visual fraction models and equations to represent the problem Examples 3 times 1
2 6 times 1
8
Understand decimal notation for fractions and compare decimal fractions Denominators are limited to 10 and 100
17 Express model and explain the equivalence between fractions with denominators of 10 and 100 a Use fraction equivalency to add two fractions with denominators of 10 and 100
18 Use models and decimal notation to represent fractions with denominators of 10 and 100
19 Use visual models and reasoning to compare two decimals to hundredths (referring to the same whole) recording
comparisons using symbols gt = or lt and justifying the conclusions
Grade 4 Mathematics
48 2019 Alabama Course of Study Mathematics
Data Analysis Represent and interpret data
20 Interpret data in graphs (picture bar and line plots) to solve problems using numbers and operations a Create a line plot to display a data set of measurements in fractions of a unit (1
2 14
18)
b Solve problems involving addition and subtraction of fractions using information presented in line plots
Measurement Solve problems involving measurement and conversion of measurements from a larger unit to a smaller unit
21 Select and use an appropriate unit of measurement for a given attribute (length mass liquid volume time) within one system of units metric - km m cm kg g l ml customary - lb oz time - hr min sec a Within one system of units express measurements of a larger unit in terms of a smaller unit Record
measurement equivalents in a two-column table
22 Use the four operations to solve measurement word problems with distance intervals of time liquid volume mass of objects and money a Solve measurement problems involving simple fractions or decimals b Solve measurement problems that require expressing measurements given in a larger unit in terms of a smaller
unit c Represent measurement quantities using diagrams such as number line diagrams that feature a measurement
scale 23 Apply area and perimeter formulas for rectangles in real-world and mathematical situations
Geometric measurement understand concepts of angle and measure angles
24 Identify an angle as a geometric shape formed wherever two rays share a common endpoint
25 Use a protractor to measure angles in whole-number degrees and sketch angles of specified measure
26 Decompose an angle into non-overlapping parts to demonstrate that the angle measure of the whole is the sum of the angle measures of the parts a Solve addition and subtraction problems on a diagram to find unknown angles in real-world or mathematical
problems
Grade 4 Mathematics
49 2019 Alabama Course of Study Mathematics
Geometry Draw and identify lines and angles and identify shapes by properties of their lines and angles
27 Draw points lines line segments rays angles (right acute obtuse) and perpendicular and parallel lines and identify these in two-dimensional figures
28 Identify two-dimensional figures based on the presence or absence of parallel or perpendicular lines or the presence
or absence of angles of a specified size a Describe right triangles as a category and identify right triangles
29 Define a line of symmetry for a two-dimensional figure as a line across the figure such that the figure can be folded
along the line into matching parts a Identify line-symmetric figures and draw lines of symmetry
50 2019 Alabama Course of Study Mathematics
Grade 5 Mathematics Overview
Grade 5 content is organized into six Alabama Content Areas as outlined in the table below Operations and Algebraic Thinking Operations with Numbers Base Ten Operations with Numbers Fractions Data Analysis Measurement and Geometry Related standards are grouped into clusters which are listed below each content area Standards indicate what the student should know or be able to do by the end of the grade
The eight Student Mathematical Practices listed in the chart below represent what students are doing as they learn mathematics Students should regularly engage in these processes and proficiencies at every level throughout their mathematical studies Proficiency with these practices is critical in using mathematics both in the classroom and in everyday life The Student Mathematical Practices are standards which should be incorporated across all grades
Student Mathematical Practices 1 Make sense of problems and persevere in solving them 5 Use appropriate tools strategically 2 Reason abstractly and quantitatively 6 Attend to precision 3 Construct viable arguments and critique the reasoning of others 7 Look for and make use of structure 4 Model with mathematics 8 Look for and express regularity in repeated reasoning
Alabama Content Areas
Operations and Algebraic Thinking
Operations with Numbers Base Ten
Operations with Numbers Fractions
Data Analysis Measurement Geometry
Clusters
bull Write and interpret numerical expressions
bull Analyze patterns and relationships
bull Understand the place value system
bull Perform operations with multi-digit whole numbers and decimals to hundredths
bull Use equivalent fractions as a strategy to add and subtract fractions
bull Apply and extend previous under-standings of multiplication and division to multiply and divide fractions
bull Represent and interpret data
bull Convert like measurement units within a given measurement system
bull Geometric measurement understand concepts of volume and relate volume to multiplication and to addition
bull Graph points on the coordinate plane to solve real-world and mathematical problems
bull Classify two-dimensional figures into categories based on their properties
Grade 5 Mathematics
51 2019 Alabama Course of Study Mathematics
Content Priorities In Grade 5 instructional time should focus on three critical areas
1 developing fluency with addition and subtraction of fractions and developing understanding of the multiplication of fractions and of division of fractions in limited cases (unit fractions divided by whole numbers and whole numbers divided by unit fractions)
2 extending division to 2-digit divisors integrating decimals into the place value system and developing understanding of operations with decimals to hundredths and developing fluency with whole number and decimal operations and
3 developing understanding of volume 1 Through their learning in the Operations with Numbers Fractions Alabama Content Area students
bull apply their understanding of fractions and fraction models to represent the addition and subtraction of fractions with unlike denominators as equivalent calculations with like denominators
bull develop fluency in calculating sums and differences of fractions and make reasonable estimates of them and bull use the meaning of fractions multiplication and division and the relationship between multiplication and division to
understand and explain why the procedures for multiplying and dividing fractions make sense
2 Through their learning in the Operations with Numbers Base Ten Alabama Content Area students bull develop understanding of why division procedures work based on the meaning of base-ten numerals and properties of operations bull apply understandings of models for decimals decimal notation and properties of operations to add and subtract decimals to hundredths bull develop fluency with decimal computations and make reasonable estimates of their results bull use the relationship between decimals and fractions as well as the relationship between finite decimals and whole numbers
(ie a finite decimal multiplied by an appropriate power of 10 is a whole number) to understand and explain why the procedures for multiplying and dividing finite decimals make sense and
bull compute products and quotients of decimals to hundredths efficiently and accurately
3 Through their learning in the Measurement Alabama Content Area students bull recognize volume as an attribute of three-dimensional space bull understand that volume can be measured by finding the total number of same-size units of volume required to fill the space without gaps
or overlaps bull understand that a 1-unit by 1-unit by 1-unit cube is the standard unit for measuring volume bull select appropriate units strategies and tools for solving problems that involve estimating and measuring volume bull decompose three-dimensional shapes and find volumes of right rectangular prisms by viewing them as decomposed into layers of arrays
of cubes and bull measure necessary attributes of shapes in order to determine volumes to solve real-world and mathematical problems
Grade 5 Mathematics
52 2019 Alabama Course of Study Mathematics
NOTE Although not all content areas in the grade level have been included in the overview all standards should be included in instruction NOTE fluency vs automaticity Fluency involves a mixture of ldquojust knowingrdquo answers knowing answers from patterns and knowing answers from the use of strategies The word fluently is used in the standards to mean accurately efficiently and flexibly Automaticity of facts becomes evident when a student no longer uses a pattern or mental algorithm to determine the answer
Grade 5 Content Standards Each content standard completes the sentence stem ldquoStudents willhelliprdquo Operations and Algebraic Thinking Write and interpret numerical expressions
1 Write explain and evaluate simple numerical expressions involving the four operations to solve up to two-step problems Include expressions involving parentheses brackets or braces using commutative associative and distributive properties
Analyze patterns and relationships
2 Generate two numerical patterns using two given rules and complete an inputoutput table for the data a Use data from an inputoutput table to identify apparent relationships between corresponding terms b Form ordered pairs from values in an inputoutput table c Graph ordered pairs from an inputoutput table on a coordinate plane
Operations with Numbers Base Ten Understand the place value system
3 Using models and quantitative reasoning explain that in a multi-digit number including decimals a digit in any place represents ten times what it represents in the place to its right and 1
10 of what it represents in
the place to its left a Explain patterns in the number of zeros of the product when multiplying a number by powers of 10
using whole-number exponents to denote powers of 10 b Explain patterns in the placement of the decimal point when a decimal is multiplied or divided by a
power of 10 using whole-number exponents to denote powers of 10
Grade 5 Mathematics
53 2019 Alabama Course of Study Mathematics
4 Read write and compare decimals to thousandths a Read and write decimals to thousandths using base-ten numerals number names and expanded form
Example 347392 = 3 times 100 + 4 times 10 + 7 times 1 + 3 times ( 110
) + 9 times ( 1100
) + 2 times ( 11000
) b Compare two decimals to thousandths based on the meaning of the digits in each place using gt = and
lt to record the results of comparisons
5 Use place value understanding to round decimals to thousandths
Perform operations with multi-digit whole numbers and decimals to hundredths
6 Fluently multiply multi-digit whole numbers using the standard algorithm
7 Use strategies based on place value properties of operations andor the relationship between multiplication and division to find whole-number quotients and remainders with up to four-digit dividends and two-digit divisors Illustrate and explain the calculation by using equations rectangular arrays andor area models
8 Add subtract multiply and divide decimals to hundredths using strategies based on place value
properties of operations andor the relationships between additionsubtraction and multiplicationdivision relate the strategy to a written method and explain the reasoning used
a Use concrete models and drawings to solve problems with decimals to hundredths b Solve problems in a real-world context with decimals to hundredths
Operations with Numbers Fractions Use equivalent fractions as a strategy to add and subtract fractions
9 Model and solve real-word problems involving addition and subtraction of fractions referring to the same whole including cases of unlike denominators using visual fraction models or equations to represent the problem Use benchmark fractions and number sense of fractions to estimate mentally and assess the reasonableness of answers Example Recognize an incorrect result 2
5+ 1
2= 3
7 by observing that 3
7 lt 1
2
10 Add and subtract fractions and mixed numbers with unlike denominators using fraction equivalence to
calculate a sum or difference of fractions or mixed numbers with like denominators
Grade 5 Mathematics
54 2019 Alabama Course of Study Mathematics
Apply and extend previous understandings of multiplication and division to multiply and divide fractions
11 Solve word problems involving division of whole numbers leading to answers in the form of fractions or mixed numbers a Model and interpret a fraction as division of the numerator by the denominator (119886119886
119887119887= a divide b)
b Use visual fraction models drawings or equations to represent word problems involving division of whole numbers leading to answers in the form of fractions or mixed numbers
12 Apply and extend previous understandings of multiplication to find the product of a fraction times a whole
number or a fraction times a fraction a Use a visual fraction model (area model set model or linear model) to show (119886119886
119887119887) times q and create a story
context for this equation to interpret the product as a parts of a partition of q into b equal parts b Use a visual fraction model (area model set model or linear model) to show (119886119886
119887119887) times (119888119888
119889119889) and create a
story context for this equation to interpret the product c Multiply fractional side lengths to find areas of rectangles and represent fraction products as
rectangular areas d Find the area of a rectangle with fractional side lengths by tiling it with unit squares of the appropriate
unit fraction side lengths to show that the area is the same as would be found by multiplying the side lengths
13 Interpret multiplication as scaling (resizing)
a Compare the size of a product to the size of one factor on the basis of the size of the other factor without performing the indicated multiplication Example Use reasoning to determine which expression is greater 225 or 3
4 times 225 11
50 or 3
2 times 11
50
b Explain why multiplying a given number by a fraction greater than 1 results in a product greater than the given number and relate the principle of fraction equivalence
c Explain why multiplying a given number by a fraction less than 1 results in a product smaller than the given number and relate the principle of fraction equivalence
14 Model and solve real-world problems involving multiplication of fractions and mixed numbers using
visual fraction models drawings or equations to represent the problem
Grade 5 Mathematics
55 2019 Alabama Course of Study Mathematics
15 Apply and extend previous understandings of division to divide unit fractions by whole numbers and whole numbers by unit fractions a Solve real-world problems involving division of unit fractions by non-zero whole numbers and division
of whole numbers by unit fractions and illustrate using visual fraction models drawings and equations to represent the problem
b Create a story context for a unit fraction divided by a whole number and use a visual fraction model to show the quotient
c Create a story context for a whole number divided by a unit fraction and use a visual fraction model to show the quotient
Data Analysis Represent and interpret data 16 Make a line plot to display a data set of measurements in fractions of a unit (1
2 14 18)
a Add subtract multiply and divide fractions to solve problems involving information presented in line plots Note Division is limited to unit fractions by whole numbers and whole numbers by unit fractions
Measurement Convert like measurement units within a given measurement system
17 Convert among different-sized standard measurement units within a given measurement system and use these conversions in solving multi-step real-world problems
Geometric measurement understand concepts of volume and relate volume to multiplication and to addition
18 Identify volume as an attribute of solid figures and measure volumes by counting unit cubes using cubic cm cubic in cubic ft and improvised (non-standard) units a Pack a solid figure without gaps or overlaps using n unit cubes to demonstrate volume as n cubic units
Grade 5 Mathematics
56 2019 Alabama Course of Study Mathematics
19 Relate volume to the operations of multiplication and addition and solve real-world and mathematical problems involving volume a Use the associative property of multiplication to find the volume of a right rectangular prism and relate
it to packing the prism with unit cubes Show that the volume can be determined by multiplying the three edge lengths or by multiplying the height by the area of the base
b Apply the formulas V = l times w times h and V = B times h for rectangular prisms to find volumes of right rectangular prisms with whole-number edge lengths in the context of solving real-world and mathematical problems
c Find volumes of solid figures composed of two non-overlapping right rectangular prisms by adding the volumes of the two parts applying this technique to solve real-world problems
Geometry Graph points on the coordinate plane to solve real-world and mathematical problems
20 Graph points in the first quadrant of the coordinate plane and interpret coordinate values of points to represent real-world and mathematical problems
Classify two-dimensional figures into categories based on their properties
21 Classify triangles according to side length (isosceles equilateral scalene) and angle measure (acute obtuse right equiangular)
22 Classify quadrilaterals in a hierarchy based on properties 23 Explain that attributes belonging to a category of two-dimensional figures also belong to all subcategories
of that category Example All rectangles have four right angles and squares have four right angles so squares are rectangles
57 2019 Alabama Course of Study Mathematics
GRADES 6 - 8 OVERVIEW The course of study for Grades 6-8 Mathematics focuses on solidifying the foundations of mathematics empowering students for high school mathematics and broadening their understanding of mathematics in relation to everyday life Ensuring that each and every student receives the preparation they deserve will require focus on developing conceptual understanding of the mathematics they will need for a lifetime These standards build on critical areas of focus for each grade level Resources supporting the standards for Grades 6-8 are in Appendix D
Note Proportional reasoning is not listed as an 8th grade content area because it has been incorporated into Algebra and Functions
Grades 6-8 Overview
58 2019 Alabama Course of Study Mathematics
Pathways to Student Success
The Grades 6-8 course of study offers two flexible pathways with five courses Grade 6 Grade 7 Grade 7 Accelerated Grade 8 and Grade 8 Accelerated All middle school students begin at a shared starting point with Grade 6 Mathematics and all will complete Grade 8 prepared for Geometry with Data Analysis in Grade 9 regardless of which middle school pathway they complete The standard middle school pathway is challenging and rigorous It meets the needs of all middle school students giving them a solid mathematical foundation and preparing them for success in later mathematics courses Middle school students who are especially interested and strongly motivated to study mathematics have the option of moving a little faster by choosing an accelerated pathway which combines standards from three courses into two years of study Grade 7 Grade 8 and Algebra I with Probability (otherwise offered in Grade 10) Students who successfully complete this middle school accelerated pathway will be prepared to enter directly into Algebra II with Statistics after completing Geometry with Data Analysis in Grade 9 These students will be required to take two additional courses in Grades 11 and 12 to earn the mandatory four credits in mathematics since neither of the accelerated middle school courses (nor their combination) is equivalent to a high school mathematics credit Taking two more courses gives them the opportunity to make additional progress toward their postsecondary goals The accelerated middle school pathway is designed to challenge the most proficient and motivated students Some who start out on this pathway may find it was not the best choice for them Students who are not making adequate progress in Grade 7 Accelerated are not locked into the accelerated pathway they may exit the accelerated pathway and take the Grade 8 Mathematics course without any loss of progress Students have a second opportunity to accelerate in Grade 9 by taking Geometry with Data Analysis and Algebra I with Probability at the same time These opportunities to accelerate allow students to make additional progress toward their postsecondary goals Students and their parents should receive ongoing feedback and information about available options as students decide whether or not to pursue or continue pursuing an accelerated pathway That decision should not be made for them without consultation It is critical that all students be afforded the opportunity to pursue a pathway that supports their interests and goals
Grades 6-8 Overview
59 2019 Alabama Course of Study Mathematics
The rows of the following table provide examples of pathways that students may follow across Grades 6-8 Note that students should be enrolled in a mathematics class every year of middle and high school
Grade 6 Grade 7 Grade 8 Grade 9
Grade 6 Mathematics
Grade 7 Mathematics
Grade 8 Mathematics
Geometry with Data Analysis
Grade 6 Mathematics
Grade 7 Accelerated Mathematics
Accelerated Grade 8 Mathematics
Geometry with Data Analysis
Grade 6 Mathematics
Grade 7 Mathematics
Grade 8 Mathematics
Geometry with Data Analysis
and Algebra I with Probability
Grade 6 Mathematics
Grade 7 Accelerated Mathematics Grade 8 Mathematics Geometry with Data
Analysis
Grade 6 Mathematics
Grade 7 Accelerated Mathematics Grade 8 Mathematics
Geometry with Data Analysis
and Algebra I with Probability
Grade 6 Mathematics
Grade 7 Accelerated Mathematics
Accelerated Grade 8 Mathematics
Geometry with Data Analysis
and Algebra I with Probability
Refer to the Course of Study Grades 9-12 Overview for a full description of the pathways through the end of high school and how they connect to the postsecondary study of mathematics
60 2019 Alabama Course of Study Mathematics
Grade 6 Overview
Grade 6 content is organized into five Alabama Content Areas as outlined below Proportional Reasoning Number Systems and Operations Algebra and Functions Data Analysis Statistics and Probability and Geometry and Measurement Related standards are grouped into clusters which are listed below each content area Resources to support the Grades 6-8 standards are in Appendix D Standards indicate what students should know and be able to do by the end of the course
Alabama Content Areas
Proportional Reasoning
Number Systems and Operations Algebra and Functions Data Analysis Statistics
and Probability Geometry and Measurement
Clusters
bull Develop an understanding of ratio concepts and use reasoning about ratios to solve problems
bull Use prior knowledge of multiplication and division to divide fractions
bull Compute multi-digit numbers fluently and determine common factors and multiples
bull Apply knowledge of the number system to represent and use rational numbers in a variety of forms
bull Apply knowledge of arithmetic to read write and evaluate algebraic expressions
bull Use equations and inequalities to represent and solve real-world or mathematical problems
bull Identify and analyze relationships between independent and dependent variables
bull Use real-world and mathematical problems to analyze data and demonstrate an understanding of statistical variability and measures of center
bull Graph polygons in the coordinate plane to solve real-world and mathematical problems
bull Solve real-world and mathematical problems to determine area surface area and volume
The eight Student Mathematical Practices listed in the chart below represent what students are doing as they learn mathematics Students should regularly engage in these processes and proficiencies at every level throughout their mathematical studies Proficiency with these practices is critical in using mathematics both in the classroom and in everyday life The Student Mathematical Practices are standards to be incorporated across all grades
Student Mathematical Practices 1 Make sense of problems and persevere in solving them 5 Use appropriate tools strategically 2 Reason abstractly and quantitatively 6 Attend to precision 3 Construct viable arguments and critique the reasoning of others 7 Look for and make use of structure 4 Model with mathematics 8 Look for and express regularity in repeated reasoning
Grade 6 Mathematics
61 2019 Alabama Course of Study Mathematics
Content Priorities
In Grade 6 instructional time should focus on five essential areas 1 Connecting ratio and rate to whole number multiplication and division and using concepts of ratio and rate to solve problems
Students use reasoning about multiplication and division to solve ratio and rate problems about quantities By viewing equivalent ratios and rates as deriving from and extending pairs of rows (or columns) in the multiplication table and by analyzing simple drawings that indicate the relative size of quantities students connect their understanding of multiplication and division with ratios and rates Thus students expand the scope and variety of problems in which they use proportional reasoning to connect ratios and fractions
2 Completing understanding of division of fractions and extending the understanding of number sense to the system of rational
numbers including signed numbers Students connect the meaning of fractions multiplication and division and the relationship between multiplication and division to understand and explain procedures for dividing fractions Students use these operations to solve problems Students extend previous understanding of the magnitude and ordering of numbers to the rational number system including signed rational numbers and particularly integers They reason about the order and absolute value of rational numbers and about the location of points in all four quadrants of the coordinate plane
3 Writing interpreting and using expressions and equations Students use variables in mathematical expressions to represent quantities They write expressions and equations that correspond to real-world situations evaluate expressions and use expressions and formulas to solve problems Students understand that expressions in different forms can be equivalent and they use the properties of operations to rewrite expressions in equivalent forms Students know the solutions of an equation are the values of the variables that make the equation true They use properties of operations and the idea of maintaining the equality of both sides of an equation to solve one-step equations Students construct and analyze tables such as tables of quantities that are in equivalent ratios and they use equations (such as 3x = y) to describe relationships between dependent and independent variables
4 Developing understanding of statistical thinking Students build on and reinforce their number sense to develop the ability to think about statistical measures They recognize that a data distribution may not have a definite center and that different ways to measure center yield different values The median measures center in that it is roughly the middle value The mean measures center in that it is the value that each data point would take on if the total of the data values were redistributed equally and also in that it is a balance point Students recognize that a measure of variability (range and interquartile range) can also be useful for summarizing data because two very different sets of data may have the same mean and median
Grade 6 Mathematics
62 2019 Alabama Course of Study Mathematics
yet be distinguished by their variability Students create and use a variety of graphs to represent and interpret data They learn to describe and summarize numerical data sets identifying clusters peaks gaps and symmetry considering the context in which the data were collected
5 Developing understanding of geometrical reasoning and thinking
Students apply previous understanding about relationships among shapes to determine area surface area and volume They find areas of right triangles other triangles and special quadrilaterals by decomposing these shapes rearranging or removing pieces and relating the shapes to rectangles Using these methods students discuss develop and justify formulas for areas of triangles and parallelograms Students use nets to find areas of polygons and surface areas of prisms and pyramids by decomposing them into pieces whose area they can determine They reason about right rectangular prisms to extend formulas for the volume of a right rectangular prism to those with fractional side lengths As students develop an understanding of formulas in mathematical and real-world contexts the goal is not simply to memorize but to have a deep understanding of why each formula works and how it relates to the measure of various figures Students draw polygons in the coordinate plane to prepare for work on scale drawings and constructions in Grade 7
Grade 6 Content Standards
Each content standard completes the stem ldquoStudents willhelliprdquo Proportional Reasoning Develop an understanding of ratio concepts and use reasoning about ratios to solve problems
1 Use appropriate notations [ab a to b ab] to represent a proportional relationship between quantities and use ratio language to describe the relationship between quantities
2 Use unit rates to represent and describe ratio relationships
3 Use ratio and rate reasoning to solve mathematical and real-world problems (including but not limited to percent measurement conversion and equivalent ratios) using a variety of models including tables of equivalent ratios tape diagrams double number lines and equations
Grade 6 Mathematics
63 2019 Alabama Course of Study Mathematics
Number Systems and Operations Use prior knowledge of multiplication and division to divide fractions
4 Interpret and compute quotients of fractions using visual models and equations to represent problems a Use quotients of fractions to analyze and solve problems
Compute multi-digit numbers fluently and determine common factors and multiples
5 Fluently divide multi-digit whole numbers using a standard algorithm to solve real-world and mathematical problems
6 Add subtract multiply and divide decimals using a standard algorithm
7 Use the distributive property to express the sum of two whole numbers with a common factor as a multiple of a sum of two whole numbers with no common factor
8 Find the greatest common factor (GCF) and least common multiple (LCM) of two or more whole numbers
a Use factors and multiples to determine prime factorization
Apply knowledge of the number system to represent and use rational numbers in a variety of forms
9 Use signed numbers to describe quantities that have opposite directions or values and to represent quantities in real-world contexts
10 Locate integers and other rational numbers on a horizontal or vertical line diagram a Define opposites as numbers located on opposite sides of 0 and the same distance from 0 on a number line b Use rational numbers in real-world and mathematical situations explaining the meaning of 0 in each situation
11 Find the position of pairs of integers and other rational numbers on the coordinate plane
a Identify quadrant locations of ordered pairs on the coordinate plane based on the signs of the x and y coordinates
b Identify (ab) and (a-b) as reflections across the x-axis c Identify (ab) and (-ab) as reflections across the y-axis d Solve real-world and mathematical problems by graphing points in all four quadrants of the coordinate plane
including finding distances between points with the same first or second coordinate
12 Explain the meaning of absolute value and determine the absolute value of rational numbers in real-world contexts
Grade 6 Mathematics
64 2019 Alabama Course of Study Mathematics
13 Compare and order rational numbers and absolute value of rational numbers with and without a number line in
order to solve real-world and mathematical problems
Algebra and Functions Apply knowledge of arithmetic to read write and evaluate algebraic expressions
14 Write evaluate and compare expressions involving whole number exponents
15 Write read and evaluate expressions in which letters represent numbers in real-world contexts a Interpret a variable as an unknown value for any number in a specified set depending on the context b Write expressions to represent verbal statements and real-world scenarios c Identify parts of an expression using mathematical terms such as sum term product factor quotient and
coefficient d Evaluate expressions (which may include absolute value and whole number exponents) with respect to order of
operations 16 Generate equivalent algebraic expressions using the properties of operations including inverse identity
commutative associative and distributive 17 Determine whether two expressions are equivalent and justify the reasoning
Use equations and inequalities to represent and solve real-world or mathematical problems
18 Determine whether a value is a solution to an equation or inequality by using substitution to conclude whether a given value makes the equation or inequality true
19 Write and solve an equation in the form of x+p=q or px=q for cases in which p q and x are all non-negative
rational numbers to solve real-world and mathematical problems a Interpret the solution of an equation in the context of the problem
20 Write and solve inequalities in the form of xgtc xltc xge c or x le c to represent a constraint or condition in a real-world or mathematical problem a Interpret the solution of an inequality in the context of a problem b Represent the solutions of inequalities on a number line and explain that the solution set may contain infinitely
many solutions
Grade 6 Mathematics
65 2019 Alabama Course of Study Mathematics
Identify and analyze relationships between independent and dependent variables
21 Identify represent and analyze two quantities that change in relationship to one another in real-world or mathematical situations a Use tables graphs and equations to represent the relationship between independent and dependent variables
Data Analysis Statistics and Probability Use real-world and mathematical problems to analyze data and demonstrate an understanding of statistical variability and measures of center
22 Write examples and non-examples of statistical questions explaining that a statistical question anticipates variability in the data related to the question
23 Calculate interpret and compare measures of center (mean median mode) and variability (range and interquartile range) in real-world data sets a Determine which measure of center best represents a real-world data set b Interpret the measures of center and variability in the context of a problem
24 Represent numerical data graphically using dot plots line plots histograms stem and leaf plots and box plots a Analyze the graphical representation of data by describing the center spread shape (including approximately
symmetric or skewed) and unusual features (including gaps peaks clusters and extreme values) b Use graphical representations of real-world data to describe the context from which they were collected
Geometry and Measurement Graph polygons in the coordinate plane to solve real-world and mathematical problems
25 Graph polygons in the coordinate plane given coordinates of the vertices to solve real-world and mathematical problems a Determine missing vertices of a rectangle with the same x-coordinate or the same y-coordinate when graphed in
the coordinate plane b Use coordinates to find the length of a side between points having the same x-coordinate or the same y-
coordinate c Calculate perimeter and area of a polygon graphed in the coordinate plane (limiting to polygons in which
consecutive vertices have the same x-coordinate or the same y-coordinate)
Grade 6 Mathematics
66 2019 Alabama Course of Study Mathematics
Solve real-world and mathematical problems to determine area surface area and volume Note Students must select and use the appropriate unit for the attribute being measured when determining length area angle time or volume
26 Calculate the area of triangles special quadrilaterals and other polygons by composing and decomposing them into known shapes a Apply the techniques of composing and decomposing polygons to find area in the context of solving real-world
and mathematical problems
27 Determine the surface area of three-dimensional figures by representing them with nets composed of rectangles and triangles to solve real-world and mathematical problems
28 Apply previous understanding of volume of right rectangular prisms to those with fractional edge lengths to solve real-world and mathematical problems a Use models (cubes or drawings) and the volume formulas (V = lwh and V = Bh) to find and compare volumes
of right rectangular prisms
67 2019 Alabama Course of Study Mathematics
Grade 7 Mathematics Overview
In Grade 7 content is organized into five Alabama Content Areas as outlined below Proportional Reasoning Number Systems and Operations Algebra and Functions Data Analysis Statistics and Probability and Geometry and Measurement Related standards are grouped into clusters which are listed below each content area Resources to support the Grade 7 mathematical standards are in Appendix D Standards indicate what students should know or be able to do by the end of the course
Alabama Content Areas
Proportional Reasoning
Number Systems and Operations
Algebra and Functions Data Analysis Statistics and Probability
Geometry and Measurement
Clusters
bull Analyze proportional relationships and use them to solve real-world and mathematical problems
bull Apply and extend prior knowledge of addition subtraction multiplication and division to operations with rational numbers
bull Create equivalent expressions using the properties of operations
bull Solve real-world and mathematical problems using numerical and algebraic expressions equations and inequalities
bull Make inferences about a population using random sampling
bull Make inferences from an informal comparison of two populations
bull Investigate probability models
bull Construct and describe geometric figures analyzing relationships among them
bull Solve real-world and mathematical problems involving angle measure circumference area surface area and volume
The eight Student Mathematical Practices listed in the chart below represent what students are doing as they learn mathematics Students should regularly engage in these processes and proficiencies at every level throughout their mathematical studies Proficiency with these practices is critical in using mathematics both in the classroom and in everyday life The Student Mathematical Practices are standards to be incorporated across all grades
Student Mathematical Practices 1 Make sense of problems and persevere in solving them 5 Use appropriate tools strategically 2 Reason abstractly and quantitatively 6 Attend to precision 3 Construct viable arguments and critique the reasoning of others 7 Look for and make use of structure 4 Model with mathematics 8 Look for and express regularity in repeated reasoning
Grade 7 Mathematics
68 2019 Alabama Course of Study Mathematics
Content Priorities
In Grade 7 instructional time should focus on four essential areas all of which have equal importance
1 Developing understanding of and applying proportional relationships Students extend their understanding of ratios and develop understanding of proportionality to solve single- and multi-step problems Students solve a wide variety of percent problems (including those involving discounts interest taxes tips percent increase or decrease) and solve problems about scale drawings by relating corresponding lengths between the objects or by using the fact that relationships of lengths within an object are preserved in similar objects Students graph proportional relationships and understand the unit rate informally as a measure of the steepness of the related line called the slope They distinguish proportional relationships from other relationships
2 Developing understanding of operations with rational numbers and working with expressions and linear equations
Students develop a unified understanding of number recognizing fractions decimals (that have a finite or a repeating decimal representation) and percentages as different representations of rational numbers Students extend addition subtraction multiplication and division to all rational numbers recognizing the properties of operations and the relationships between addition and subtraction and multiplication and division By applying these properties and by viewing negative numbers in terms of everyday contexts (eg amounts owed or temperatures below zero) students explain and interpret the rules for adding subtracting multiplying and dividing with negative numbers They use the arithmetic of rational numbers as they formulate expressions and equations in one variable and use these equations to solve problems
3 Solving problems involving scale drawings and informal geometric construction and working with two- and three-dimensional
shapes to solve problems involving area surface area and volume Students continue their work with area from Grade 6 solving problems involving the area and circumference of a circle as well as surface area of three-dimensional objects In preparation for work on congruence and similarity in Grade 8 they reason about relationships among two-dimensional figures using scale drawings and informal geometric constructs and they gain familiarity with the relationships between angles formed by intersecting lines Students work with three-dimensional figures relating them to two-dimensional figures by examining cross-sections They solve real-world and mathematical problems involving area surface area and volume of two- and three-dimensional objects composed of triangles quadrilaterals polygons cubes and right prisms
4 Drawing inferences about populations based on samples
Students build on their previous work with single data distributions to compare two data distributions and address questions about differences between populations They begin informal work with random sampling to generate data sets and learn about the importance of representative samples for drawing inferences
Grade 7 Mathematics
69 2019 Alabama Course of Study Mathematics
Grade 7 Content Standards
Each content standard completes the stem ldquoStudents willhelliprdquo Proportional Reasoning Analyze proportional relationships and use them to solve real-world and mathematical problems
1 Calculate unit rates of length area and other quantities measured in like or different units that include ratios or fractions
2 Represent a relationship between two quantities and determine whether the two quantities are related
proportionally a Use equivalent ratios displayed in a table or in a graph of the relationship in the coordinate plane to determine
whether a relationship between two quantities is proportional b Identify the constant of proportionality (unit rate) and express the proportional relationship using multiple
representations including tables graphs equations diagrams and verbal descriptions c Explain in context the meaning of a point (xy) on the graph of a proportional relationship with special
attention to the points (00) and (1 r) where r is the unit rate
3 Solve multi-step percent problems in context using proportional reasoning including simple interest tax gratuities commissions fees markups and markdowns percent increase and percent decrease
Grade 7 Mathematics
70 2019 Alabama Course of Study Mathematics
Number Systems and Operations Apply and extend prior knowledge of addition subtraction multiplication and division to operations with rational numbers
4 Apply and extend knowledge of operations of whole numbers fractions and decimals to add subtract multiply and divide rational numbers including integers signed fractions and decimals a Identify and explain situations where the sum of opposite quantities is 0 and opposite quantities are defined as
additive inverses b Interpret the sum of two or more rational numbers by using a number line and in real-world contexts c Explain subtraction of rational numbers as addition of additive inverses d Use a number line to demonstrate that the distance between two rational numbers on the number line is the
absolute value of their difference and apply this principle in real-world contexts e Extend strategies of multiplication to rational numbers to develop rules for multiplying signed numbers
showing that the properties of the operations are preserved f Divide integers and explain that division by zero is undefined Interpret the quotient of integers (with a non-
zero divisor) as a rational number g Convert a rational number to a decimal using long division explaining that the decimal form of a rational
number terminates or eventually repeats
5 Solve real-world and mathematical problems involving the four operations of rational numbers including complex fractions Apply properties of operations as strategies where applicable
Algebra and Functions Create equivalent expressions using the properties of operations
6 Apply properties of operations as strategies to add subtract factor and expand linear expressions with rational coefficients
7 Generate expressions in equivalent forms based on context and explain how the quantities are related
Grade 7 Mathematics
71 2019 Alabama Course of Study Mathematics
Solve real-world and mathematical problems using numerical and algebraic expressions equations and inequalities
8 Solve multi-step real-world and mathematical problems involving rational numbers (integers signed fractions and decimals) converting between forms as needed Assess the reasonableness of answers using mental computation and estimation strategies
9 Use variables to represent quantities in real-world or mathematical problems and construct algebraic expressions
equations and inequalities to solve problems by reasoning about the quantities a Solve word problems leading to equations of the form px + q = r and p(x + q) = r where p q and r are specific
rational numbers Solve equations of these forms fluently Compare an algebraic solution to an arithmetic solution identifying the sequence of the operations used in each approach
b Solve word problems leading to inequalities of the form px + q gt r or px + q lt r where p q and r are specific rational numbers Graph the solution set of the inequality and interpret it in the context of the problem
Data Analysis Statistics and Probability Make inferences about a population using random sampling
10 Examine a sample of a population to generalize information about the population a Differentiate between a sample and a population b Compare sampling techniques to determine whether a sample is random and thus representative of a
population explaining that random sampling tends to produce representative samples and support valid inferences
c Determine whether conclusions and generalizations can be made about a population based on a sample d Use data from a random sample to draw inferences about a population with an unknown characteristic of
interest generating multiple samples to gauge variation and making predictions or conclusions about the population
e Informally explain situations in which statistical bias may exist
Make inferences from an informal comparison of two populations
11 Informally assess the degree of visual overlap of two numerical data distributions with similar variabilities measuring the difference between the centers by expressing it as a multiple of a measure of variability
12 Make informal comparative inferences about two populations using measures of center and variability andor mean absolute deviation in context
Grade 7 Mathematics
72 2019 Alabama Course of Study Mathematics
Investigate probability models
13 Use a number from 0 to 1 to represent the probability of a chance event occurring explaining that larger numbers indicate greater likelihood of the event occurring while a number near zero indicates an unlikely event
14 Define and develop a probability model including models that may or may not be uniform where uniform models
assign equal probability to all outcomes and non-uniform models involve events that are not equally likely a Collect and use data to predict probabilities of events b Compare probabilities from a model to observed frequencies explaining possible sources of discrepancy
15 Approximate the probability of an event using data generated by a simulation (experimental probability) and compare it to the theoretical probability a Observe the relative frequency of an event over the long run using simulation or technology and use those
results to predict approximate relative frequency 16 Find probabilities of simple and compound events through experimentation or simulation and by analyzing the
sample space representing the probabilities as percents decimals or fractions a Represent sample spaces for compound events using methods such as organized lists tables and tree diagrams
and determine the probability of an event by finding the fraction of outcomes in the sample space for which the compound event occurred
b Design and use a simulation to generate frequencies for compound events c Represent events described in everyday language in terms of outcomes in the sample space which composed
the event
Geometry and Measurement Construct and describe geometric figures analyzing relationships among them
17 Solve problems involving scale drawings of geometric figures including computation of actual lengths and areas from a scale drawing and reproduction of a scale drawing at a different scale
18 Construct geometric shapes (freehand using a ruler and a protractor and using technology) given a written
description or measurement constraints with an emphasis on constructing triangles from three measures of angles or sides noticing when the conditions determine a unique triangle more than one triangle or no triangle
19 Describe the two-dimensional figures created by slicing three-dimensional figures into plane sections
Grade 7 Mathematics
73 2019 Alabama Course of Study Mathematics
Solve real-world and mathematical problems involving angle measure circumference area surface area and volume Note Students must select and use the appropriate unit for the attribute being measured when determining length area angle time or volume
20 Explain the relationships among circumference diameter area and radius of a circle to demonstrate understanding of formulas for the area and circumference of a circle a Informally derive the formula for area of a circle b Solve area and circumference problems in real-world and mathematical situations involving circles
21 Use facts about supplementary complementary vertical and adjacent angles in multi-step problems to write and solve simple equations for an unknown angle in a figure
22 Solve real-world and mathematical problems involving area volume and surface area of two- and three-
dimensional objects composed of triangles quadrilaterals polygons cubes and right rectangular prisms
Grade 8 Mathematics
74 2019 Alabama Course of Study Mathematics
Grade 8 Mathematics Overview
In Grade 8 content is organized into four Alabama Content Areas outlined below Number Systems and Operations Algebra and Functions Data Analysis Statistics and Probability and Geometry and Measurement Related standards are grouped into clusters which are listed below each content area Resources to support the Grade 8 mathematical standards are in Appendix D Standards indicate what students should know or be able to do by the end of the course
Alabama Content Areas Number Systems and Operations Algebra and Functions Data Analysis Statistics
and Probability Geometry and Measurement
Clusters
bull Understand that the real number system is composed of rational and irrational numbers
bull Apply concepts of rational and integer exponents
bull Analyze the relationship between proportional and non-proportional situations
bull Analyze and solve linear equations and systems of two linear equations
bull Explain evaluate and compare functions bull Use functions to model relationships between
quantities
bull Investigate patterns of association in bivariate data
bull Understand congruence and similarity using physical models or technology
bull Analyze parallel lines cut by a transversal
bull Understand and apply the Pythagorean Theorem
bull Solve real-world and mathematical problems involving volume of cylinders cones and spheres
The eight Student Mathematical Practices listed in the chart below represent what students are doing as they learn mathematics Students should regularly engage in these processes and proficiencies at every level throughout their mathematical studies Proficiency with these practices is critical in using mathematics both in the classroom and in everyday life The Student Mathematical Practices are standards to be incorporated across all grades
Student Mathematical Practices 1 Make sense of problems and persevere in solving them 5 Use appropriate tools strategically 2 Reason abstractly and quantitatively 6 Attend to precision 3 Construct viable arguments and critique the reasoning of others 7 Look for and make use of structure 4 Model with mathematics 8 Look for and express regularity in repeated reasoning
Grade 8 Mathematics
75 2019 Alabama Course of Study Mathematics
Content Priorities
In Grade 8 instructional time should focus on three critical areas all of which have equal importance
1 Construct and reason about expressions and equations including modeling an association in bivariate data with a linear equation and solving linear equations and systems of linear equations Students use linear equations and systems of linear equations to represent analyze and solve a variety of problems Students recognize equations for proportions (yx = k or y = kx) as special linear equations (y = mx + b) understanding that the constant of proportionality (k) is the slope and the graphs are lines through the origin They understand that the slope (m) of a line is a constant rate of change Students also use a linear equation to describe the association between two quantities in bivariate data At this grade level fitting the model to the data and assessing its fit are done informally Interpreting the model in the context of the data requires students to express a relationship between the two quantities in question and to interpret components of the relationship (such as slope and y-intercept) in terms of the situation Students choose and implement procedures to solve linear equations in one variable understanding that when they use the properties of equality they maintain the solutions of the original equation Students solve systems of two linear equations in two variables and relate the systems to pairs of lines in the plane these intersect are parallel or are the same line Students use linear equations systems of linear equations linear functions and their understanding of slope of a line to analyze situations and solve problems
2 Describe the concept of a function and use functions to interpret quantitative relationships
Students grasp the concept of a function as a rule that assigns to each input exactly one output They understand that functions describe situations where one quantity determines another They describe how aspects of the function are reflected in the different representations
3 Analyze two- and three-dimensional figures and understand and apply the Pythagorean Theorem
Students use ideas about distance and angles and how they behave under translations rotations reflections and dilations and ideas about congruence and similarity to analyze and describe two-dimensional figures and to solve problems Students show that the sum of the angles in a triangle is the angle formed by a straight line Students understand and can explain the Pythagorean Theorem and its converse They apply the Pythagorean Theorem to find distances between points on the coordinate plane to find lengths and to analyze polygons Students understand and apply properties of parallel lines cut by a transversal in order to solve problems Students conclude their study on volume by solving problems involving cones cylinders and spheres
Grade 8 Mathematics
76 2019 Alabama Course of Study Mathematics
Grade 8 Mathematics Content Standards
Each content standard completes the stem ldquoStudents willhelliprdquo Number Systems and Operations Understand that the real number system is composed of rational and irrational numbers
1 Define the real number system as composed of rational and irrational numbers a Explain that every number has a decimal expansion for rational numbers the decimal expansion repeats or
terminates b Convert a decimal expansion that repeats into a rational number
2 Locate rational approximations of irrational numbers on a number line compare their sizes and estimate the values
of the irrational numbers
Algebra and Functions Apply concepts of integer exponents and radicals
3 Develop and apply properties of integer exponents to generate equivalent numerical and algebraic expressions
4 Use square root and cube root symbols to represent solutions to equations a Evaluate square roots of perfect squares (less than or equal to 225) and cube roots of perfect cubes (less than or
equal to 1000) b Explain that the square root of a non-perfect square is irrational
5 Estimate and compare very large or very small numbers in scientific notation
6 Perform operations with numbers expressed in scientific notation including problems where both decimal and
scientific notation are used a Use scientific notation and choose units of appropriate size for measurements of very large or very small
quantities b Interpret scientific notation that has been generated by technology
Grade 8 Mathematics
77 2019 Alabama Course of Study Mathematics
Analyze the relationship between proportional and non-proportional situations
7 Determine whether a relationship between two variables is proportional or non-proportional 8 Graph proportional relationships
a Interpret the unit rate of a proportional relationship describing the constant of proportionality as the slope of the graph which goes through the origin and has the equation y = mx where m is the slope
9 Interpret y = mx + b as defining a linear equation whose graph is a line with m as the slope and b as the y-intercept
a Use similar triangles to explain why the slope m is the same between any two distinct points on a non-vertical line in a coordinate plane
b Given two distinct points in a coordinate plane find the slope of the line containing the two points and explain why it will be the same for any two distinct points on the line
c Graph linear relationships interpreting the slope as the rate of change of the graph and the y-intercept as the initial value
d Given that the slopes for two different sets of points are equal demonstrate that the linear equations that include those two sets of points may have different y-intercepts
10 Compare proportional and non-proportional linear relationships represented in different ways (algebraically
graphically numerically in tables or by verbal descriptions) to solve real-world problems
Analyze and solve linear equations and systems of two linear equations
11 Solve multi-step linear equations in one variable including rational number coefficients and equations that require using the distributive property and combining like terms a Determine whether linear equations in one variable have one solution no solution or infinitely many solutions
of the form x = a a = a or a = b (where a and b are different numbers) b Represent and solve real-world and mathematical problems with equations and interpret each solution in the
context of the problem
12 Solve systems of two linear equations in two variables by graphing and substitution a Explain that the solution(s) of systems of two linear equations in two variables corresponds to points of
intersection on their graphs because points of intersection satisfy both equations simultaneously b Interpret and justify the results of systems of two linear equations in two variables (one solution no solution or
infinitely many solutions) when applied to real-world and mathematical problems
Grade 8 Mathematics
78 2019 Alabama Course of Study Mathematics
Explain evaluate and compare functions
13 Determine whether a relation is a function defining a function as a rule that assigns to each input (independent value) exactly one output (dependent value) and given a graph table mapping or set of ordered pairs
14 Evaluate functions defined by a rule or an equation given values for the independent variable 15 Compare properties of functions represented algebraically graphically numerically in tables or by verbal
descriptions a Distinguish between linear and non-linear functions
Use functions to model relationships between quantities
16 Construct a function to model a linear relationship between two variables a Interpret the rate of change (slope) and initial value of the linear function from a description of a relationship or
from two points in a table or graph
17 Analyze the relationship (increasing or decreasing linear or non-linear) between two quantities represented in a graph
Data Analysis Statistics and Probability Investigate patterns of association in bivariate data
18 Construct and interpret scatter plots for bivariate measurement data to investigate patterns of association between two quantities describing patterns in terms of positive negative or no association linear and non-linear association clustering and outliers
19 Given a scatter plot that suggests a linear association informally draw a line to fit the data and assess the model fit by judging the closeness of the data points to the line
20 Use a linear model of a real-world situation to solve problems and make predictions a Describe the rate of change and y-intercept in the context of a problem using a linear model of a real-world
situation
21 Construct and interpret a two-way table summarizing data on two categorical variables collected from the same subjects using relative frequencies calculated for rows or columns to describe possible associations between the two variables
Grade 8 Mathematics
79 2019 Alabama Course of Study Mathematics
Geometry and Measurement Understand congruence and similarity using physical models or technology
22 Verify experimentally the properties of rigid motions (rotations reflections and translations) lines are taken to lines and line segments are taken to line segments of the same length angles are taken to angles of the same measure and parallel lines are taken to parallel lines a Given a pair of two-dimensional figures determine if a series of rigid motions maps one figure onto the other
recognizing that if such a sequence exists the figures are congruent describe the transformation sequence that verifies a congruence relationship
23 Use coordinates to describe the effect of transformations (dilations translations rotations and reflections) on two-
dimensional figures
24 Given a pair of two-dimensional figures determine if a series of dilations and rigid motions maps one figure onto the other recognizing that if such a sequence exists the figures are similar describe the transformation sequence that exhibits the similarity between them
Analyze parallel lines cut by a transversal
25 Analyze and apply properties of parallel lines cut by a transversal to determine missing angle measures a Use informal arguments to establish that the sum of the interior angles of a triangle is 180 degrees
Understand and apply the Pythagorean Theorem
26 Informally justify the Pythagorean Theorem and its converse
27 Apply the Pythagorean Theorem to find the distance between two points in a coordinate plane
28 Apply the Pythagorean Theorem to determine unknown side lengths of right triangles including real-world applications
Grade 8 Mathematics
80 2019 Alabama Course of Study Mathematics
Solve real-world and mathematical problems involving volume of cylinders cones and spheres Note Students must select and use the appropriate unit for the attribute being measured when determining length area angle time or volume
29 Informally derive the formulas for the volume of cones and spheres by experimentally comparing the volumes of cones and spheres with the same radius and height to a cylinder with the same dimensions
30 Use formulas to calculate the volumes of three-dimensional figures (cylinders cones and spheres) to solve real-world problems
81 2019 Alabama Course of Study Mathematics
Grade 7 Accelerated and Grade 8 Accelerated Overview
Accelerated courses have been carefully aligned and designed for middle school students who show particular motivation and interest in mathematics In this pathway students meet all the standards of Grade 7 Grade 8 and Algebra I with Probability within the Grade 7 Accelerated and Grade 8 Accelerated courses thus merging all the standards from three years of mathematics into two years This enables students to move through the content more quickly Students who complete this pathway will be prepared to enter Geometry with Data Analysis in Grade 9 and then accelerate directly into Algebra II with Statistics in Grade 10 thus providing them with an opportunity to take additional specialized mathematics coursework in Grades 11 and 12 such as AP Calculus AP Statistics or college dual enrollment classes Clearly this pathway will be challenging and should be reserved for Grade 7 students who demonstrate a high level of motivation and interest in studying mathematics The Alabama Mathematics Content Areas shown below illustrate a progression designed to ensure that all students are equitably prepared to develop conceptual understanding of mathematics The NAEP (National Assessment of Educational Progress) content areas reflect an emphasis on the importance of mathematical reasoning through the full spectrum of mathematical content Alabama Mathematics Content Areas explicitly define the framework needed for students to develop a comprehensive understanding of underlying mathematics concepts
Grade 7 Accelerated and Grade 8 Accelerated Overview
82 2019 Alabama Course of Study Mathematics
In the graphic below the accelerated pathway from Geometry with Data Analysis is shown This pathway is acceptable for students who have completed both Grade 7 Accelerated and Grade 8 Accelerated mathematics in middle school
83 2019 Alabama Course of Study Mathematics
Grade 7 Accelerated Overview
The Grade 7 Accelerated course has been carefully aligned and designed for middle school students who show particular motivation and interest in mathematics In Grade 7 Accelerated the content is organized into five Alabama Content Areas Proportional Reasoning Number Systems and Operations Algebra and Functions Data Analysis Statistics and Probability and Geometry and Measurement Related standards are grouped into clusters which are listed below each content area Standards are labeled to indicate whether they come from Grade 7 Mathematics Grade 8 Mathematics or Algebra I with Probability Resources to support Grade 7 Accelerated mathematical standards are in Appendices D and E Standards indicate what students should know and be able to do by the end of the course While the word function is referenced in the standards for Grade 7 Accelerated function notation is reserved for Grade 8 Accelerated
Alabama Content Areas Proportional Reasoning Number Systems and
Operations Algebra and Functions Data Analysis Statistics and Probability Geometry and Measurement
Clusters
bull Analyze proportional relationships and use them to solve real-world problems and mathematical problems
bull Analyze the relationship between proportional and non-proportional situations
bull Apply and extend prior knowledge of addition subtraction multiplication and division to operations with rational numbers
bull Understand that the real number system is composed of rational and irrational numbers
bull Create equivalent expressions using the properties of operations
bull Apply concepts of rational and integer exponents
bull Solve real-world and mathematical problems using numerical and algebraic expressions equations and inequalities
bull Explain evaluate and compare functions
Make inferences about a population using random sampling
Make inferences from an informal comparison of two populations
Investigate probability models
bull Construct and describe geometrical figures analyzing relationships among them
bull Solve real-world and mathematical problems involving angle measure area surface area and volume
bull Understand congruence and similarity using physical models or technology
Grade 7 Accelerated
84 2019 Alabama Course of Study Mathematics
The eight Student Mathematical Practices listed in the chart below represent what students are doing as they learn mathematics Students should regularly engage in these processes and proficiencies at every level throughout their mathematical studies Proficiency with these practices is critical in using mathematics both in the classroom and in everyday life The Student Mathematical Practices are standards to be incorporated across all grades
Student Mathematical Practices
1 Make sense of problems and persevere in solving them 5 Use appropriate tools strategically 2 Reason abstractly and quantitatively 6 Attend to precision 3 Construct viable arguments and critique the reasoning of others 7 Look for and make use of structure 4 Model with mathematics 8 Look for and express regularity in repeated reasoning
Statements in bold print indicate the scope of the standard and align the standard to related content in other courses The full scope of every standard should be addressed during instruction
Grade 7 Accelerated Content Standards
Each content standard completes the stem ldquoStudents willhelliprdquo
Proportional Reasoning Analyze proportional relationships and use them to solve real-world problems and mathematical problems
1 Calculate unit rates of length area and other quantities measured in like or different units that include ratios or fractions [Grade 7 1]
2 Represent a relationship between two quantities and determine whether the two quantities are related
proportionally a Use equivalent ratios displayed in a table or in a graph of the relationship in the coordinate plane to
determine whether a relationship between two quantities is proportional b Identify the constant of proportionality (unit rate) and express the proportional relationship using multiple
representations including tables graphs equations diagrams and verbal descriptions of proportional relationships
c Explain in context the meaning of a point (xy) on the graph of a proportional relationship with special attention to the points (00) and (1 r) where r is the unit rate [Grade 7 2]
Grade 7 Accelerated
85 2019 Alabama Course of Study Mathematics
3 Solve multi-step percent problems in context using proportional reasoning including simple interest tax gratuities commissions fees markups and markdowns percent increase and percent decrease [Grade 7 3]
Analyze the relationship between proportional and non-proportional situations
4 Determine whether a relationship between two variables is proportional or non-proportional [Grade 8 7] 5 Graph proportional relationships
a Interpret the unit rate of a proportional relationship describing the constant of proportionality as the slope of the graph which goes through the origin and has the equation y = mx where m is the slope [Grade 8 8]
6 Interpret y = mx + b as defining a linear equation whose graph is a line with m as the slope and b as the y-intercept
a Use similar triangles to explain why the slope m is the same between any two distinct points on a non-vertical line in a coordinate plane
b Given two distinct points in a coordinate plane find the slope of the line containing the two points and explain why it will be the same for any two distinct points on the line
c Graph linear relationships interpreting the slope as the rate of change of the graph and the y-intercept as the initial value
d Given that the slopes for two different sets of points are equal demonstrate that the linear equations that include those two sets of points may have different y-intercepts [Grade 8 9]
7 Compare proportional and non-proportional linear relationships represented in different ways (algebraically
graphically numerically in tables or by verbal descriptions) to solve real-world problems [Grade 8 10]
Grade 7 Accelerated
86 2019 Alabama Course of Study Mathematics
Number Systems and Operations Apply and extend prior knowledge of addition subtraction multiplication and division to operations with rational numbers
8 Apply and extend knowledge of operations of whole numbers fractions and decimals to add subtract multiply and divide rational numbers including integers signed fractions and decimals a Identify and explain situations where the sum of opposite quantities is 0 and opposite quantities are defined as
additive inverses b Interpret the sum of two or more rational numbers by using a number line and in real-world contexts c Explain subtraction of rational numbers as addition of additive inverses d Use a number line to demonstrate that the distance between two rational numbers on the number line is the
absolute value of their difference and apply this principle in real-world contexts e Extend strategies of multiplication to rational numbers to develop rules for multiplying signed numbers
showing that the properties of the operations are preserved f Divide integers and explain that division by zero is undefined Interpret the quotient of integers (with a non-zero
divisor) as a rational number g Convert a rational number to a decimal using long division explaining that the decimal form of a rational
number terminates or eventually repeats [Grade 7 4] 9 Solve real-world and mathematical problems involving the four operations of rational numbers including complex
fractions Apply properties of operations as strategies where applicable [Grade 7 5]
Understand that the real number system is composed of rational and irrational numbers
10 Define the real number system as composed of rational and irrational numbers a Explain that every number has a decimal expansion for rational numbers the decimal expansion repeats in a
pattern or terminates b Convert a decimal expansion that repeats in a pattern into a rational number [Grade 8 1]
11 Locate rational approximations of irrational numbers on a number line compare their sizes and estimate the values
of irrational numbers [Grade 8 2]
Grade 7 Accelerated
87 2019 Alabama Course of Study Mathematics
Algebra and Functions Create equivalent expressions using the properties of operations
12 Apply properties of operations as strategies to add subtract factor and expand linear expressions with rational coefficients [Grade 7 6]
13 Generate expressions in equivalent forms based on context and explain how the quantities are related [Grade 7 7]
Apply concepts of rational and integer exponents
14 Develop and apply properties of integer exponents to generate equivalent numerical and algebraic expressions [Grade 8 3]
15 Use square root and cube root symbols to represent solutions to equations
a Evaluate square roots of perfect squares (less than or equal to 225) and cube roots of perfect cubes (less than or equal to 1000)
b Explain that the square root of a non-perfect square is irrational [Grade 8 4]
16 Express and compare very large or very small numbers in scientific notation [Grade 8 5] a Perform operations with numbers expressed in scientific notation including problems where both decimal and
scientific notation are used expressing answers in scientific notation [Grade 8 6] b Use scientific notation and choose units of appropriate size for measurements of very large or very small
quantities [Grade 8 6a] c Interpret scientific notation that has been generated by technology [Grade 8 6b]
Grade 7 Accelerated
88 2019 Alabama Course of Study Mathematics
Solve real-world and mathematical problems using numerical and algebraic expressions equations and inequalities
17 Solve multi-step real-world and mathematical problems involving rational numbers (integers signed fractions and decimals) converting between forms as needed Assess the reasonableness of answers using mental computation and estimation strategies [Grade 7 8]
18 Use variables to represent quantities in a real-world or mathematical problem and construct algebraic expressions
equations and inequalities to solve problems by reasoning about the quantities a Solve word problems leading to equations of the form px + q = r and p(x + q) = r where p q and r are specific
rational numbers Solve equations of these forms fluently Compare an algebraic solution to an arithmetic solution identifying the sequence of the operations used in each approach
b Solve word problems leading to inequalities of the form px + q gt r or px + q lt r where p q and r are specific rational numbers Graph the solution set of the inequality and interpret it in the context of the problem [Grade 7 9 and linear portion of Algebra I with Probability 11]
19 Create equations in two variables to represent relationships between quantities in context graph equations on
coordinate axes with labels and scales and use them to make predictions Limit to contexts arising from linear functions [Algebra I with Probability 12 partial]
20 Represent constraints by equations andor inequalities and interpret solutions as viable or nonviable options in a
modeling context Limit to contexts arising from linear [Algebra I with Probability 13 partial] 21 Solve multi-step linear equations in one variable including rational number coefficients and equations that require
using the distributive property and combining like terms a Determine whether linear equations in one variable have one solution no solution or infinitely many solutions
of the form x = a a = a or a = b (where a and b are different numbers) b Represent and solve real-world and mathematical problems with equations and interpret each solution in the
context of the problem [Grade 8 11]
Explain evaluate and compare functions
22 Identify the effect on the graph of replacing f (x) by f (x) + k k middot f(x) f (kx) and f (x + k) for specific values of k (both positive and negative) find the value of k given the graphs Experiment with cases and explain the effects on the graph using technology where appropriate Limit to linear functions [Algebra I with Probability 23]
Grade 7 Accelerated
89 2019 Alabama Course of Study Mathematics
23 Construct a function to model the linear relationship between two variables a Interpret the rate of change (slope) and initial value of the linear function from a description of a relationship
from two points in a table or graph [Grade 8 16] 24 Explain why the x-coordinates of the points where the graphs of the equations y = f(x) and y = g(x) intersect are the
solutions of the equation f(x) = g(x) Limit to linear equations [Algebra I with Probability 19]
25 Find approximate solutions by graphing the functions making tables of values or finding successive approximations using technology where appropriate Note Include cases where f(x) is linear and g(x) is constant or linear [Algebra I with Probability 19 edited]
Data Analysis Statistics and Probability Make inferences about a population using random sampling
26 Examine a sample of a population to generalize information about the population a Differentiate between a sample and a population b Compare sampling techniques to determine whether a sample is random and thus representative of a population
explaining that random sampling tends to produce representative samples and support valid inferences c Determine whether conclusions and generalizations can be made about a population based on a sample d Use data from a random sample to draw inferences about a population with an unknown characteristic of
interest generating multiple samples to gauge variation and make predictions or conclusions about the population
e Informally explain situations in which statistical bias may exist [Grade 7 10]
Make inferences from an informal comparison of two populations
27 Informally assess the degree of visual overlap of two numerical data distributions with similar variabilities measuring the difference between the centers by expressing it as a multiple of a measure of variability [Grade 7 11]
28 Make informal comparative inferences about two populations using measures of center and variability andor mean
absolute deviation in context [Grade 7 12]
Investigate probability models
29 Use a number between 0 and 1 to represent the probability of a chance event occurring explaining that larger numbers indicate greater likelihood of the event occurring while a number near zero indicates an unlikely event [Grade 7 13]
Grade 7 Accelerated
90 2019 Alabama Course of Study Mathematics
30 Define and develop a probability model including models that may or may not be uniform where uniform models assign equal probability to all outcomes and non-uniform models involve events that are not equally likely a Collect and use data to predict probabilities of events b Compare probabilities from a model to observe frequencies explaining possible sources of discrepancy
[Grade 7 14] 31 Approximate the probability of an event by using data generated by a simulation (experimental probability) and
compare it to theoretical probability a Observe the relative frequency of an event over the long run using simulation or technology and use those
results to predict approximate relative frequency [Grade 7 15]
32 Find probabilities of simple and compound events through experimentation or simulation and by analyzing the sample space representing the probabilities as percents decimals or fractions a Represent sample spaces for compound events using methods such as organized lists tables and tree diagrams
and determine the probability of an event by finding the fraction of outcomes in the sample space for which the compound event occurred
b Design and use a simulation to generate frequencies for compound events c Represent events described in everyday language in terms of outcomes in the sample space which composed the
event [Grade 7 16]
Geometry and Measurement Construct and describe geometrical figures analyzing relationships among them
33 Solve problems involving scale drawings of geometric figures including computation of actual lengths and areas from a scale drawing and reproduction of a scale drawing at a different scale [Grade 7 17]
34 Construct geometric shapes (freehand using a ruler and a protractor and using technology) given measurement
constraints with an emphasis on constructing triangles from three measures of angles or sides noticing when the conditions determine a unique triangle more than one triangle or no triangle [Grade 7 18]
35 Describe the two-dimensional figures created by slicing three-dimensional figures into plane sections [Grade 7 19]
Grade 7 Accelerated
91 2019 Alabama Course of Study Mathematics
Solve real-world and mathematical problems involving angle measure area surface area and volume
36 Explain the relationships among circumference diameter area and radius of a circle to demonstrate understanding of formulas for the area and circumference of a circle a Informally derive the formula for area of a circle b Solve area and circumference problems in real-world and mathematical situations involving circles [Grade 7 20]
37 Use facts about supplementary complementary vertical and adjacent angles in multi-step problems to write and
solve simple equations for an unknown angle in a figure [Grade 7 21]
38 Analyze and apply properties of parallel lines cut by a transversal to determine missing angle measures a Use informal arguments to establish that the sum of the interior angles of a triangle is 180 degrees [Grade 8 25]
39 Solve real-world and mathematical problems involving area volume and surface area of two- and three-
dimensional objects composed of triangles quadrilaterals polygons cubes and right rectangular prisms [Grade 7 22]
40 Informally derive the formulas for the volume of cones and spheres by experimentally comparing the volumes of
cones and spheres with the same radius and height to a cylinder with the same dimensions [Grade 8 29]
41 Use formulas to calculate the volumes of three-dimensional figures to solve real-world problems [Grade 8 30]
Understand congruence and similarity using physical models or technology
42 Verify experimentally the properties of rigid motions (rotations reflections and translations) lines are taken to lines and line segments are taken to line segments of the same length angles are taken to angles of the same measure and parallel lines are taken to parallel lines a Given a pair of two-dimensional figures determine if a series of rigid motions maps one figure onto the other
recognizing that if such a sequence exists the figures are congruent describe the transformation sequence that verifies a congruence relationship [Grade 8 22]
43 Use coordinates to describe the effect of transformations (dilations translations rotations and reflections) on two-
dimensional figures [Grade 8 23]
44 Given a pair of two-dimensional figures determine if a series of dilations and rigid motions maps one figure onto the other recognizing that if such a sequence exists the figures are similar describe the transformation sequence that exhibits the similarity between them [Grade 8 24]
92 2019 Alabama Course of Study Mathematics
Grade 8 Accelerated Overview
The Grade 8 Accelerated course has been carefully aligned and designed for middle school students who have completed the Grade 7 Accelerated course and show particular motivation and interest in mathematics In Grade 8 Accelerated there are four content areas Number Systems and Operations Algebra and Functions Data Analysis Statistics and Probability and Geometry and Measurement The algebra focus is on quadratic relationships Students who successfully complete this course will be prepared to enter Geometry with Data Analysis in Grade 9 and then accelerate directly into Algebra II with Statistics in Grade 10 thus providing them with an opportunity to take additional specialized mathematics coursework such as AP Calculus or AP Statistics in Grades 11 and 12 Standards have been labeled to indicate whether they come from Grade 8 Mathematics or Algebra I with Probability Resources to support Grade 8 Accelerated mathematical standards are in Appendices D and E While the word function is referenced in the standards for Grade 7 Accelerated function notation is reserved for Grade 8 Accelerated
Grade 8 Accelerated
93 2019 Alabama Course of Study Mathematics
Alabama Content Areas
Number Systems and Operations Algebra and Functions Data Analysis Statistics and Probability Geometry and
Measurement
Clusters
bull Together irrational numbers and rational numbers complete the real number system representing all points on the number line while there exist numbers beyond the real numbers called complex numbers
Expressions can be rewritten in equivalent forms by using algebraic properties including properties of addition multiplication and exponentiation to make different characteristics or features visible
Analyze and solve linear equations and systems of two linear equations
bull Finding solutions to an equation inequality or system of equations or inequalities requires the checking of candidate solutions whether generated analytically or graphically to ensure that solutions are found and that those found are not extraneous
bull The structure of an equation or inequality (including but not limited to one-variable linear and quadratic equations inequalities and systems of linear equations in two variables) can be purposefully analyzed (with and without technology) to determine an efficient strategy to find a solution if one exists and then to justify the solution
bull Expressions equations and inequalities can be used to analyze and make predictions both within mathematics and as mathematics is applied in different contexts ndash in particular contexts that arise in relation to linear quadratic and exponential situations
bull Functions shift the emphasis from a point-by-point relationship between two variables (inputoutput) to considering an entire set of ordered pairs (where each first element is paired with exactly one second element) as an entity with its own features and characteristics
bull Graphs can be used to obtain exact or approximate solutions of equations inequalities and systems of equations and inequalities ndash including systems of linear equations in two variables and systems of linear and quadratic equations (given or obtained by using technology)
bull Functions can be described by using a variety of representations mapping diagrams function notation (eg f(x) = x2) recursive definitions tables and graphs
bull Functions that are members of the same family have distinguishing attributes (structure) common to all functions within that family
Functions can be represented graphically and key features of the graphs including zeros intercepts and when relevant rate of change and maximumminimum values can be associated with and interpreted in terms of the equivalent symbolic representation
bull Functions model a wide variety of real situations and can help students understand the processes of making and changing assumptions assigning variables and finding solutions to contextual problems
Investigate patterns of association in bivariate data
Data arise from a context and come in two types quantitative (continuous or discrete) and categorical Technology can be used to ldquocleanrdquo and organize data including very large data sets into a useful and manageable structure ndash a first step in any analysis of data
The association between two categorical variables is typically represented by using two-way tables and segmented bar graphs
Data analysis techniques can be used to develop models of contextual situations and to generate and evaluate possible solutions to real problems involving those contexts
Mathematical and statistical reasoning about data can be used to evaluate conclusions and assess risks
Making and defending informed data-based decisions is a characteristic of a quantitatively literate person
Two events are independent if the occurrence of one event does not affect the probability of the other event Determining whether two events are independent can be used for finding and understanding probabilities
Conditional probabilities ndash that is those probabilities that are ldquoconditionedrdquo by some known information ndash can be computed from data organized in contingency tables Conditions or assumptions may affect the computation of a probability
Understand and apply the Pythagorean Theorem
Grade 8 Accelerated
94 2019 Alabama Course of Study Mathematics
The eight Student Mathematical Practices listed in the chart below represent what students are doing as they learn mathematics Students should regularly engage in these processes and proficiencies at every level throughout their mathematical studies Proficiency with these practices is critical in using mathematics both within the classroom and in life The Student Mathematical Practices are standards to be incorporated across all grades
Student Mathematical Practices
1 Make sense of problems and persevere in solving them 5 Use appropriate tools strategically 2 Reason abstractly and quantitatively 6 Attend to precision 3 Construct viable arguments and critique the reasoning of others 7 Look for and make use of structure 4 Model with mathematics 8 Look for and express regularity in repeated reasoning
Statements in bold print indicate the scope of the standard and align the standard to related content in other courses The full scope of every standard should be addressed during instruction
Grade 8 Accelerated Content Standards Each content standard completes the stem ldquoStudents willhelliprdquo
Number Systems and Operations Together irrational numbers and rational numbers complete the real number system representing all points on the number line while there exist numbers beyond the real numbers called complex numbers
1 Explain how the meaning of rational exponents follows from extending the properties of integer exponents to those values allowing for an additional notation for radicals in terms of rational exponents [Algebra I with Probability 1]
2 Rewrite expressions involving radicals and rational exponents using the properties of exponents [Algebra I with Probability 2]
3 Define the imaginary number i such that i 2 = -1 [Algebra I with Probability 3]
Grade 8 Accelerated
95 2019 Alabama Course of Study Mathematics
Algebra and Functions Expressions can be rewritten in equivalent forms by using algebraic properties including properties of addition multiplication and exponentiation to make different characteristics or features visible
4 Interpret linear quadratic and exponential expressions in terms of a context by viewing one or more of their parts as a single entity [Algebra I with Probability 4] Example Interpret the accrued amount of investment P(1 + r)t where P is the principal and r is the interest rate as the product of P and a factor depending on time t
5 Use the structure of an expression to identify ways to rewrite it [Algebra I with Probability 5] Example See x4 - y4 as (x2)2 - (y2)2 thus recognizing it as a difference of squares that can be factored as (x2 - y2)(x2 + y2)
6 Choose and produce an equivalent form of an expression to reveal and explain properties of the quantity represented by the expression a Factor quadratic expressions with leading coefficients of one and use the factored form to reveal the zeros
of the function it defines b Use the vertex form of a quadratic expression to reveal the maximum or minimum value and the axis of
symmetry of the function it defines complete the square to find the vertex form of quadratics with a leading coefficient of one
c Use the properties of exponents to transform expressions for exponential functions [Algebra I with Probability 6] Example Identify percent rate of change in functions such as y = (102)t y = (097)t y = (101)12t or y = (12)t10 and classify them as representing exponential growth or decay
7 Add subtract and multiply polynomials showing that polynomials form a system analogous to the integers
namely they are closed under the operations of addition subtraction and multiplication [Algebra I with Probability 7]
8 Analyze the relationship (increasing or decreasing linear or non-linear) between two quantities represented in a
graph [Grade 8 17]
Grade 8 Accelerated
96 2019 Alabama Course of Study Mathematics
Analyze and solve linear equations and systems of two linear equations
9 Solve systems of two linear equations in two variables by graphing and substitution a Explain that the solution(s) of systems of two linear equations in two variables corresponds to points of
intersection on their graphs because points of intersection satisfy both equations simultaneously b Interpret and justify the results of systems of two linear equations in two variables (one solution no solution
or infinitely many solutions) when applied to real-world and mathematical problems [Grade 8 12]
Finding solutions to an equation inequality or system of equations or inequalities requires the checking of candidate solutions whether generated analytically or graphically to ensure that solutions are found and that those found are not extraneous
10 Explain why extraneous solutions to an equation involving absolute values may arise and how to check to be sure that a candidate solution satisfies an equation [Algebra I with Probability 8]
The structure of an equation or inequality (including but not limited to one-variable linear and quadratic equations inequalities and systems of linear equations in two variables) can be purposefully analyzed (with and without technology) to determine an efficient strategy to find a solution if one exists and then to justify the solution
11 Select an appropriate method to solve a quadratic equation in one variable a Use the method of completing the square to transform any quadratic equation in x into an equation of the
form (x ndash p)2 = q that has the same solutions Explain how the quadratic formula is derived from this form b Solve quadratic equations by inspection (such as x2 = 49) taking square roots completing the square the
quadratic formula and factoring as appropriate to the initial form of the equation and recognize that some solutions may not be real [Algebra I with Probability 9]
12 Select an appropriate method to solve a system of two linear equations in two variables a Solve a system of two equations in two variables by using linear combinations contrast situations in which
use of linear combinations is more efficient with those in which substitution is more efficient b Contrast solutions to a system of two linear equations in two variables produced by algebraic methods with
graphical and tabular methods [Algebra I with Probability 10]
Grade 8 Accelerated
97 2019 Alabama Course of Study Mathematics
Expressions equations and inequalities can be used to analyze and make predictions both within mathematics and as mathematics is applied in different contexts ndash in particular contexts that arise in relation to linear quadratic and exponential situations
13 Create equations and inequalities in one variable and use them to solve problems in context either exactly or approximately Extend from contexts arising from linear functions to those involving quadratic exponential and absolute value functions [Algebra I with Probability 11]
14 Create equations in two or more variables to represent relationships between quantities in context graph equations on coordinate axes with labels and scales and use them to make predictions Limit to contexts arising from linear quadratic exponential absolute value and linear piecewise functions [Algebra I with Probability 12]
15 Represent constraints by equations andor inequalities and solve systems of equations andor inequalities
interpreting solutions as viable or nonviable options in a modeling context Limit to contexts arising from linear quadratic exponential absolute value and linear piecewise functions [Algebra I with Probability 13]
Functions shift the emphasis from a point-by-point relationship between two variables (inputoutput) to considering an entire set of ordered pairs (where each first element is paired with exactly one second element) as an entity with its own features and characteristics
16 Define a function as a mapping from one set (called the domain) to another set (called the range) that assigns to each element of the domain exactly one element of the range [Grade 8 13 edited for added content] a Use function notation evaluate functions for inputs in their domains and interpret statements that use
function notation in terms of a context [Grade 8 14 edited for added content] Note If f is a function and x is an element of its domain then f(x) denotes the output of f corresponding to the input x
b Relate the domain of a function to its graph and where applicable to the quantitative relationship it describes Limit to linear quadratic exponential and absolute value functions [Algebra I with Probability 15]
17 Given a relation defined by an equation in two variables identify the graph of the relation as the set of all its
solutions plotted in the coordinate plane [Algebra I with Probability 14] Note The graph of a relation often forms a curve (which could be a line)
18 Compare and contrast relations and functions represented by equations graphs or tables that show related values determine whether a relation is a function Identify that a function f is a special kind of relation defined by the equation y = f(x) [Algebra I with Probability 16]
Grade 8 Accelerated
98 2019 Alabama Course of Study Mathematics
19 Combine different types of standard functions to write evaluate and interpret functions in context Limit to linear quadratic exponential and absolute value functions a Use arithmetic operations to combine different types of standard functions to write and evaluate functions
Example Given two functions one representing flow rate of water and the other representing evaporation of that water combine the two functions to determine the amount of water in the container at a given time
b Use function composition to combine different types of standard functions to write and evaluate functions [Algebra I with Probability 17] Example Given the following relationships determine what the expression S(T(t)) represents
Function Input Output
G Amount of studying s Grade in course G(s)
S Grade in course g Amount of screen time S(g)
T Amount of screen time t Number of followers T(t)
Graphs can be used to obtain exact or approximate solutions of equations inequalities and systems of equations and inequalities ndash including systems of linear equations in two variables and systems of linear and quadratic equations (given or obtained by using technology)
20 Explain why the x-coordinates of the points where the graphs of the equations y = f(x) and y = g(x) intersect are the solutions of the equation f(x) = g(x) a Find the approximate solutions of an equation graphically using tables of values or finding successive
approximations using technology where appropriate [Algebra I with Probability 19] Note Include cases where f(x) is linear quadratic exponential or absolute value functions and g(x) is constant or linear
21 Graph the solutions to a linear inequality in two variables as a half-plane (excluding the boundary in the case of
a strict inequality) and graph the solution set to a system of linear inequalities in two variables as the intersection of the corresponding half-planes using technology where appropriate [Algebra I with Probability 20]
22 Solve systems consisting of linear andor quadratic equations in two variables graphically using technology
where appropriate [Algebra I with Probability 18]
Grade 8 Accelerated
99 2019 Alabama Course of Study Mathematics
Functions can be described by using a variety of representations mapping diagrams function notation (eg f(x) = x2) recursive definitions tables and graphs
23 Compare properties of two functions each represented in a different way (algebraically graphically numerically in tables or by verbal descriptions) Include linear quadratic exponential absolute value and linear piecewise [Algebra I with Probability 21 edited] a Distinguish between linear and non-linear functions [Grade 8 15a]
24 Define sequences as functions including recursive definitions whose domain is a subset of the integers
a Write explicit and recursive formulas for arithmetic and geometric sequences and connect them to linear and exponential functions [Algebra I with Probability 22] Example A sequence with constant growth will be a linear function while a sequence with proportional growth will be an exponential function
Functions that are members of the same family have distinguishing attributes (structure) common to all functions within that family
25 Identify the effect on the graph of replacing f (x) by f (x) + k kmiddotf (x) f (kx) and f (x + k) for specific values of k (both positive and negative) find the value of k given the graphs Experiment with cases and explain the effects on the graph using technology as appropriate Extend from linear to quadratic exponential absolute value and linear piecewise functions [Algebra I with Probability 23 edited]
26 Distinguish between situations that can be modeled with linear functions and those that can be modeled with exponential functions a Show that linear functions grow by equal differences over equal intervals while exponential functions grow
by equal factors over equal intervals b Define linear functions to represent situations in which one quantity changes at a constant rate per unit
interval relative to another c Define exponential functions to represent situations in which a quantity grows or decays by a constant
percent rate per unit interval relative to another [Algebra I with Probability 24]
27 Construct linear and exponential functions including arithmetic and geometric sequences given a graph a description of a relationship or two input-output pairs (include reading these from a table) [Algebra I with Probability 25]
28 Use graphs and tables to show that a quantity increasing exponentially eventually exceeds a quantity increasing linearly or quadratically [Algebra I with Probability 26]
Grade 8 Accelerated
100 2019 Alabama Course of Study Mathematics
29 Interpret the parameters of functions in terms of a context Extend from linear functions written in the form mx + b to exponential functions written in the form abx [Algebra I with Probability 27] Example If the function V(t) = 19885(075)t describes the value of a car after it has been owned for t years 19885 represents the purchase price of the car when t = 0 and 075 represents the annual rate at which its value decreases
Functions can be represented graphically and key features of the graphs including zeros intercepts and when relevant rate of change and maximumminimum values can be associated with and interpreted in terms of the equivalent symbolic representation
30 For a function that models a relationship between two quantities interpret key features of graphs and tables in terms of the quantities and sketch graphs showing key features given a verbal description of the relationship Note Key features include intercepts intervals where the function is increasing decreasing positive or negative maximums and minimums symmetries and end behavior Extend from relationships that can be represented by linear functions to quadratic exponential absolute value and general piecewise functions [Algebra I with Probability 28]
31 Calculate and interpret the average rate of change of a function (presented symbolically or as a table) over a specified interval Estimate the rate of change from a graph Limit to linear quadratic exponential and absolute value functions [Algebra I with Probability 29]
32 Graph functions expressed symbolically and show key features of the graph by hand in simple cases and using technology for more complicated cases a Graph linear and quadratic functions and show intercepts maxima and minima b Graph piecewise-defined functions including step functions and absolute value functions c Graph exponential functions showing intercepts and end behavior [Algebra I with Probability 30]
Functions model a wide variety of real situations and can help students understand the processes of making and changing assumptions assigning variables and finding solutions to contextual problems
33 Use the mathematical modeling cycle to solve real-world problems involving linear quadratic exponential absolute value and linear piecewise functions [Algebra I with Probability 31]
Grade 8 Accelerated
101 2019 Alabama Course of Study Mathematics
Data Analysis Statistics and Probability Investigate patterns of association in bivariate data
34 Construct and interpret scatter plots for bivariate measurement data to investigate patterns of association between two quantities describing patterns in terms of positive negative or no association linear and non-linear association clustering and outliers [Grade 8 18]
35 Given a scatter plot that suggests a linear association informally draw a line to fit the data and assess the model fit by judging the closeness of the data points to the line [Grade 8 19]
36 Use a linear model of a real-world situation to solve problems and make predictions a Describe the rate of change and y-intercept in the context of a problem using a linear model of a real-world
situation [Grade 8 20]
37 Construct and interpret a two-way table summarizing data on two categorical variables collected from the same subjects using relative frequencies calculated for rows or columns to describe possible associations between the two variables [Grade 8 21]
Data arise from a context and come in two types quantitative (continuous or discrete) and categorical Technology can be used to ldquocleanrdquo and organize data including very large data sets into a useful and manageable structure ndash a first step in any analysis of data
38 Distinguish between quantitative and categorical data and between the techniques that may be used for analyzing data of these two types [Algebra I with Probability 34] Example The color of cars is categorical and so is summarized by frequency and proportion for each color category while the mileage on each carrsquos odometer is quantitative and can be summarized by the mean
The association between two categorical variables is typically represented by using two-way tables and segmented bar graphs
39 Analyze the possible association between two categorical variables a Summarize categorical data for two categories in two-way frequency tables and represent using segmented
bar graphs b Interpret relative frequencies in the context of categorical data (including joint marginal and conditional
relative frequencies) c Identify possible associations and trends in categorical data [Algebra I with Probability 35]
Grade 8 Accelerated
102 2019 Alabama Course of Study Mathematics
Data analysis techniques can be used to develop models of contextual situations and to generate and evaluate possible solutions to real problems involving those contexts
40 Generate a two-way categorical table in order to find and evaluate solutions to real-world problems a Aggregate data from several groups to find an overall association between two categorical variables b Recognize and explore situations where the association between two categorical variables is reversed when a
third variable is considered (Simpsonrsquos Paradox) [Algebra I with Probability 36] Example In a certain city Hospital 1 has a higher fatality rate than Hospital 2 But when considering mildly-injured patients and severely-injured patients as separate groups Hospital 1 has a lower fatality rate among both groups than Hospital 2 since Hospital 1 is a Level 1 Trauma Center Thus Hospital 1 receives most of the severely-injured patients who are less likely to survive overall but have a better chance of surviving in Hospital 1 than they would in Hospital 2
Mathematical and statistical reasoning about data can be used to evaluate conclusions and assess risks
41 Use mathematical and statistical reasoning with bivariate categorical data in order to draw conclusions and assess risk [Algebra I with Probability 32] Example In a clinical trial comparing the effectiveness of flu shots A and B 21 subjects in treatment group A avoided getting the flu while 29 contracted it In group B 12 avoided the flu while 13 contracted it Discuss which flu shot appears to be more effective in reducing the chances of contracting the flu Possible answer Even though more people in group A avoided the flu than in group B the proportion of people avoiding the flu in group B is greater than the proportion in group A which suggests that treatment B may be more effective in lowering the risk of getting the flu
Contracted Flu Did Not Contract Flu
Flu Shot A 29 21
Flu Shot B 13 12
Total 42 33
Making and defending informed data-based decisions is a characteristic of a quantitatively literate person
42 Design and carry out an investigation to determine whether there appears to be an association between two categorical variables and write a persuasive argument based on the results of the investigation [Algebra I with Probability 33] Example Investigate whether there appears to be an association between successfully completing a task in a given length of time and listening to music while attempting to complete the task Randomly assign some students to listen to music while attempting to complete the task and others to complete the task without listening to music Discuss whether students should listen to music while studying based on that analysis
Grade 8 Accelerated
103 2019 Alabama Course of Study Mathematics
Two events are independent if the occurrence of one event does not affect the probability of the other event Determining whether two events are independent can be used for finding and understanding probabilities
43 Describe events as subsets of a sample space (the set of outcomes) using characteristics (or categories) of the outcomes or as unions intersections or complements of other events (or and not) [Algebra I with Probability 37]
44 Explain whether two events A and B are independent using two-way tables or tree diagrams [Algebra I with Probability 38]
Conditional probabilities ndash that is those probabilities that are ldquoconditionedrdquo by some known information ndash can be computed from data organized in contingency tables Conditions or assumptions may affect the computation of a probability
45 Compute the conditional probability of event A given event B using two-way tables or tree diagrams [Algebra I with Probability 39]
46 Recognize and describe the concepts of conditional probability and independence in everyday situations and explain them using everyday language [Algebra I with Probability 40] Example Contrast the chance of having lung cancer if you are a smoker with the chance of being a smoker if you have lung cancer
47 Explain why the conditional probability of A given B is the fraction of Bs outcomes that also belong to A and interpret the answer in context [Algebra I with Probability 41] Example the probability of drawing a king from a deck of cards given that it is a face card is 452
1252 which is 1
3
Geometry and Measurement Understand and apply the Pythagorean Theorem
48 Informally justify the Pythagorean Theorem and its converse [Grade 8 26]
49 Apply the Pythagorean Theorem to find the distance between two points in a coordinate plane [Grade 8 27]
50 Apply the Pythagorean Theorem to determine unknown side lengths of right triangles including real-world applications [Grade 8 28]
104 2019 Alabama Course of Study Mathematics
GRADES 9-12 OVERVIEW
The high school mathematics course of study in this document focuses on empowering students in three areas meeting their postsecondary goals whether they pursue additional study or enter the workforce functioning as effective citizens who can use mathematics to make responsible decisions about their own lives and about society as a
whole and recognizing mathematics as an inspiring enjoyable and significant human achievement
Meeting these goals requires students to understand that ldquomathematics is more than finding answers mathematics requires reasoning and problem-solving in order to solve real-world and mathematical problemsrdquo (see Teaching and Learning Mathematics Position Statement on p 7) Thus students must be consistently engaged in the Student Mathematical Practices which are listed as standards for every course At the high school level it is particularly important that students consistently use technology and other appropriate mathematical tools to explore and develop a deep understanding of the mathematics they are studying A particular emphasis on mathematical modeling (using mathematics to solve real world problems) is also incorporated throughout the courses Ensuring that all students receive the preparation they deserve requires unrelenting focus on developing their deep understanding of the most critical content that they will need not simply to pass the next test or course but also to function effectively throughout their lives In order to ensure the necessary focus on this critical content these standards build on ldquoessential conceptsrdquo for high school mathematics described by the National Council of Teachers of Mathematics (NCTM) in Catalyzing Change in High School Mathematics Initiating Critical Conversations (2018) These essential concepts are designed to be achieved by all students within the first three years of high school mathematics and they form the foundation for additional coursework designed to meet studentsrsquo specific post-high school needs and interests Note in particular the emphasis on statistics and probability which are increasingly important in todayrsquos world See the complete list of essential concepts below
Pathways to Student Success In order to be mathematically well-prepared upon graduation students need to complete four credits in high school mathematics The high school program builds on studentsrsquo preparation in Grades 6-8 with a shared pathway of three required courses taken by all students followed by additional ldquospecialized coursesrdquo that prepare students for life and study after high school including specific educational and career options Note that decisions on what pathway a student pursues should be based on his or her interests and motivation to pursue the pathway not on prejudgments about what he or she may or may not be able to achieve Students and parents
Grades 9-12 Overview
105 2019 Alabama Course of Study Mathematics
should receive full information on the different pathways and their consequences so that they can make informed decisions rather than having decisions made for them Students should also be encouraged to expand their horizons by taking a pathway that provides options beyond what they may currently be considering in order to accommodate the broadest range of future interests Placing Geometry with Data Analysis before Algebra I with Probability Following a recommendation in Catalyzing Change (NCTM 2018) Geometry with Data Analysis is the first required high school course followed by Algebra I with Probability and Algebra II with Statistics Placing Geometry with Data Analysis before Algebra I with Probability serves three major purposes First having two consecutive high school mathematics courses focusing on algebra without a geometry course in between means there is no gap in algebra content which should increase studentsrsquo retention of algebraic concepts and decrease the need for reteaching Second this arrangement allows all students no matter what pathway they followed in the middle grades to enter Geometry with Data Analysis in Grade 9 providing them with a common mathematics experience at the beginning of high school Students who did not complete the accelerated middle grades curriculum can then take Algebra I with Probability while students who have taken the accelerated middle grades curriculum and have made sufficient progress can move on to Algebra II with Statistics Third Geometry with Data Analysis develops mathematical knowledge and skills through visual representations prior to the more abstract development of algebra Beginning high school mathematics with Geometry with Data Analysis in Grade 9 offers students the opportunity to build their reasoning and sense-making skills see the applicability of mathematics and prepare more effectively for further studies in algebra Geometry with Data Analysis has been carefully designed so that its use of algebra in geometric contexts follows directly from and extends the algebraic knowledge and skills developed in Grade 8 Mathematics while reinforcing concepts included in the Grade 8 Accelerated Mathematics for students who have completed that course Support for students who are struggling School systems may not offer any of the three required courses as ldquoArdquo and ldquoBrdquo courses in which the content is spread over two courses Instead all school systems should offer lab courses to be taken concurrently with the required content courses to meet the needs of all students These lab courses might review prior knowledge needed for upcoming lessons reinforce content from previous lessons or preview upcoming content to ensure that students can fully participate in the required content classes Since lab courses do not cover additional mathematical standards students can receive only an elective credit for each of them not a mathematics credit No specific scheduling structure for the lab courses is prescribed in the course of study document Many schools and districts have intervention schedules which can be used or modified to accommodate the lab courses Students must receive the support they need for success in whatever form is possible without slowing down their progress through the curriculum which would limit their options for further study of mathematics Care should be taken to ensure that informed choices based on solid data are made about which students are assigned to lab classes or other supports Assignment to lab courses should be fluid based on frequent scrutiny of student progress rather than being a foregone conclusion based on the support they have received in the past
Grades 9-12 Overview
106 2019 Alabama Course of Study Mathematics
Support for students who are particularly motivated and interested While offering Geometry with Data Analysis before Grade 9 is not allowed an option is provided for middle school students who show particular motivation and interest in mathematicsmdashldquoacceleratedrdquo courses for Grade 7 and Grade 8 that incorporate the standards from Algebra I with Probability with the standards of Grade 7 and Grade 8 Students completing this pathway and showing adequate progress by the end of Geometry with Data Analysis in Grade 9 may move directly to Algebra II with Statistics These students will be required to take two additional courses beyond Algebra II with Statistics to earn the mandatory four credits in mathematics since neither of the accelerated middle grades courses (nor their combination) is equivalent to a high school mathematics course This provides them the opportunity to make additional progress towards their postsecondary goals The accelerated pathway is not the default for a large number of students it should be reserved for those students entering the seventh grade who are highly motivated to study mathematics very intensively However even highly motivated students may not excel in these courses Students who are not making adequate progress in Grade 7 Accelerated may elect to take the non-accelerated Grade 8 Mathematics course without any loss of progress Likewise even if students have completed the accelerated pathway they may elect to take the Algebra I with Probability course after Geometry with Data Analysis if they are not adequately prepared for Algebra II with Statistics Finally provision is made for Grade 9 students who did not complete the accelerated middle school pathway but who wish to take additional specialized mathematics courses in high school These students may take Geometry with Data Analysis and Algebra I with Probability concurrently in Grade 9 and then take Algebra II with Statistics in Grade 10 They should however also take a mathematics course in both Grade 11 and Grade 12 meaning that they earn a fifth mathematics credit in Grade 12 Continuing to study mathematics every year preserves student gains and is a key recommendation of Catalyzing Change (NCTM 2018) Students and parents should receive ongoing feedback and information on options as they decide whether or not to pursue or continue pursuing an accelerated pathway rather than having that decision made for them without consultation It is critical that all students are afforded the opportunity to pursue a pathway that supports their interests and goals Specialized mathematics courses Following Algebra II with Statistics students choose among three specialized mathematics classes that are designed to prepare them for future success in the postsecondary study of mathematics in careers and in their lifelong use and enjoyment of mathematics Again students and parents should receive full information on the different courses and the opportunities their completion will afford so that they can make informed decisions rather than having decisions made for them
Precalculus is designed for students who intend to enter mathematics-intensive majors or other majors or careers for which calculus is required These include a broad range of scientific and engineering fields as well as business and finance
Mathematical Modeling builds on the mathematics students have encountered in previous courses allowing them to explore real-world phenomena and engage in mathematical decision-making This course provides a solid foundation for students who are entering a range of
Grades 9-12 Overview
107 2019 Alabama Course of Study Mathematics
fields involving quantitative reasoning whether or not they may ultimately need calculus This course may be particularly appropriate for students who need precalculus in college
Applications of Finite Mathematics provides an introduction to mathematical thinking for solving problems that are frequently encountered in todayrsquos complex society but are not commonly encountered in the high school curriculum This course is appropriate for a broad range of students who are entering fields for which calculus is not required or who want to broaden their mathematical understanding
Note however that all of these courses are designed to allow students to progress to further studies in mathematics No course should be seen as a dead end but rather as an invitation to students to continue their journey in mathematics Students requiring two credits of mathematics after Algebra II with Statistics may take any two of the three specialized mathematics courses as their content does not substantially overlap and they may be completed in any order AP Calculus may also be taken following Precalculus in school systems where it is offered AP Calculus can provide a head start for students intending a major or career requiring calculus Extended courses AP Statistics and AP Computer Science courses are extended courses approved by ALSDE for a fourth mathematics credit These courses will supplement studentsrsquo mathematical preparation in high school but are not designed to prepare students for their initial credit-bearing post-secondary course in mathematics Students who intend to pursue a technical field may consider taking an AP Computer Science course along with either Applications of Finite Mathematics or Mathematical Modeling Students who intend to pursue a field with extensive use of statistics may consider taking AP Statistics along with either Applications of Finite Mathematics or Mathematical Modeling However to provide students with an adequate background for future mathematical endeavors it is recommended that AP Statistics and AP Computer Science courses be completed in addition to one of the specialized courses The ALSDE has approved other options for a fourth mathematics credit including dual enrollment courses see table at the end of Appendix B
Grades 9-12 Overview
108 2019 Alabama Course of Study Mathematics
Examples of Pathways The rows of the following table provide examples of pathways which students may experience across Grades 7-12 Note that students should be enrolled in a mathematics course every year of middle and high school
Grade 7 Grade 8 Grade 9 Grade 10 Grade 11 Grade 12
Grade 7 Mathematics Grade 8 Mathematics Geometry with Data
Analysis Algebra I with
Probability Algebra II with
Statistics Specialized course
Grade 7 Mathematics
OR Accelerated Grade 7
Mathematics
Grade 8 Mathematics
Geometry with Data Analysis
AND Algebra I with Probability
(concurrently)
Algebra II with Statistics
Precalculus AP Calculus
OR Additional specialized course
Mathematical Modeling
OR Applications of Finite Mathematics
Precalculus OR Other additional
specialized course
Accelerated Grade 7 Mathematics
Accelerated Grade 8 Mathematics
Geometry with Data Analysis
Algebra II with Statistics
Precalculus AP Calculus
OR Additional specialized course
Mathematical Modeling
OR Applications of Finite Mathematics
Precalculus OR Other additional
specialized course
Accelerated Grade 7 Mathematics
Grade 8 Mathematics OR Accelerated
Grade 8 Mathematics
Geometry with Data Analysis
Algebra I with Probability
Algebra II with Statistics Specialized course
See Appendix E for an exhaustive list of course pathways In addition see the figure in Appendix B which shows how each pathway connects with postsecondary options
Grades 9-12 Overview
109 2019 Alabama Course of Study Mathematics
Organization of Standards 1 A set of essential concepts is used to organize the standards in the required courses in the high school section of the course of study These essential
concepts build on those described by the National Council of Teachers of Mathematics (2018) in Catalyzing Change in High School Mathematics with some additional concepts reflecting that all Alabama students must take three courses rather than 25 These essential concepts include the concepts and skills that all students need to build the mathematical foundation required for the continued study of mathematics and for other future mathematical needs
2 Essential concepts are given for four content areas as shown in the table below Number and Quantity Algebra and Functions Data Analysis Statistics and Probability and Geometry and Measurement A table for applicable content areas appears in each course (The order of the content areas follows Catalyzing Change whereas K-8 follows the order given in the table below) A table for applicable content areas appears in each course Each content area (other than Number and Quantity) is further organized into several focus areas which appear as subheadings in the table Focus areas in Grades 9-12 are similar to clusters in K-8 groups of related essential concepts and standards within the specific content area Not every focus area appears in every course Finally the essential concepts are listed in the left column of each table alongside a list of content standards that support attainment of each The standards are collectively designed as the mathematical content of a shared pathway for all students
3 Content standards are written in the right column of each content area table and numbered as shown in the illustration below The content standards
support the attainment of the essential concepts listed on the left Standards define what students should understand (know) and be able to do at the conclusion of a course or grade Content standards in this document contain minimum required content Some have sub-standards indicated with a b c d which are extensions of the content standards and are also required Some standards include examples which are not required to be taught The order in which standards are listed within a course or grade is not intended to convey a sequence for instruction Each content standard completes the stem ldquoStudents willrdquo
Grades 9-12 Overview
110 2019 Alabama Course of Study Mathematics
4 Some related standards appear across multiple high school courses In many cases there is a bold-print statement to indicate the scope of the standard to align the content that is taught across the courses The full scope of every standard should be addressed during instruction
5 The specialized courses taken after Algebra II with Statistics are organized in ways related to their specific subject matter which extend beyond the essential concepts and directly support studentsrsquo professional and personal goals The standards indicating what students should know or be able to do are listed in the right columns of the content area tables Important concepts within these content areas are described in the left columns and focus areas within the tables are indicated
Alabama Content Area
Content Standard Number
Focus Area
Essential Concept
Content Standard
Grades 9-12 Overview
111 2019 Alabama Course of Study Mathematics
Essential Concepts All essential concepts used in the high school course of study are listed below The required courses in which the essential concepts appear are noted in the column on the right
Number and Quantity
Together irrational numbers and rational numbers complete the real number system representing all points on the number line while there exist numbers beyond the real numbers called complex numbers
Geometry with Data Analysis Algebra I with Probability Algebra II with Statistics
Quantitative reasoning includes and mathematical modeling requires attention to units of measurement Geometry with Data Analysis
Matrices are a useful way to represent information Algebra II with Statistics
Algebra and Functions
Focus 1 Algebra
Expressions can be rewritten in equivalent forms by using algebraic properties including properties of addition multiplication and exponentiation to make different characteristics or features visible
Algebra I with Probability Algebra II with Statistics
Finding solutions to an equation inequality or system of equations or inequalities requires the checking of candidate solutions whether generated analytically or graphically to ensure that solutions are found and that those found are not extraneous
Algebra I with Probability Algebra II with Statistics
The structure of an equation or inequality (including but not limited to one-variable linear and quadratic equations inequalities and systems of linear equations in two variables) can be purposefully analyzed (with and without technology) to determine an efficient strategy to find a solution if one exists and then to justify the solution
Geometry with Data Analysis Algebra I with Probability Algebra II with Statistics
Grades 9-12 Overview
112 2019 Alabama Course of Study Mathematics
Expressions equations and inequalities can be used to analyze and make predictions both within mathematics and as mathematics is applied in different contexts ndash in particular contexts that arise in relation to linear quadratic and exponential situations
Geometry with Data Analysis Algebra I with Probability Algebra II with Statistics
Focus 2 Connecting Algebra to Functions
Functions shift the emphasis from a point-by-point relationship between two variables (inputoutput) to considering an entire set of ordered pairs (where each first element is paired with exactly one second element) as an entity with its own features and characteristics
Algebra I with Probability
Graphs can be used to obtain exact or approximate solutions of equations inequalities and systems of equations and inequalities ndash including systems of linear equations in two variables and systems of linear and quadratic equations (given or obtained by using technology)
Geometry with Data Analysis Algebra I with Probability Algebra II with Statistics
Focus 3 Functions
Functions can be described by using a variety of representations mapping diagrams function notation (eg f(x) = x2) recursive definitions tables and graphs
Algebra I with Probability Algebra II with Statistics
Functions that are members of the same family have distinguishing attributes (structure) common to all functions within that family
Algebra I with Probability Algebra II with Statistics
Functions can be represented graphically and key features of the graphs including zeros intercepts and when relevant rate of change and maximumminimum values can be associated with and interpreted in terms of the equivalent symbolic representation
Algebra I with Probability Algebra II with Statistics
Functions model a wide variety of real situations and can help students understand the processes of making and changing assumptions assigning variables and finding solutions to contextual problems
Algebra I with Probability Algebra II with Statistics
Grades 9-12 Overview
113 2019 Alabama Course of Study Mathematics
Data Analysis Statistics and Probability
Focus 1 Quantitative Literacy
Mathematical and statistical reasoning about data can be used to evaluate conclusions and assess risks
Geometry with Data Analysis Algebra I with Probability Algebra II with Statistics
Making and defending informed data-based decisions is a characteristic of a quantitatively literate person
Algebra I with Probability Algebra II with Statistics
Focus 2 Visualizing and Summarizing Data
Data arise from a context and come in two types quantitative (continuous or discrete) and categorical Technology can be used to ldquocleanrdquo and organize data including very large data sets into a useful and manageable structure ndash a first step in any analysis of data
Geometry with Data Analysis Algebra I with Probability
Distributions of quantitative data (continuous or discrete) in one variable should be described in the context of the data with respect to what is typical (the shape with appropriate measures of center and variability including standard deviation) and what is not (outliers) and these characteristics can be used to compare two or more subgroups with respect to a variable
Geometry with Data Analysis Algebra II with Statistics
The association between two categorical variables is typically represented by using two-way tables and segmented bar graphs
Algebra I with Probability
Scatterplots including plots over time can reveal patterns trends clusters and gaps that are useful in analyzing the association between two contextual variables
Geometry with Data Analysis
Analyzing the association between two quantitative variables should involve statistical procedures such as examining (with technology) the sum of squared deviations in fitting a linear model analyzing residuals for patterns generating a least-squares regression line and finding a correlation coefficient and differentiating between correlation and causation
Geometry with Data Analysis
Data-analysis techniques can be used to develop models of contextual situations and to generate and evaluate possible solutions to real problems involving those contexts
Geometry with Data Analysis Algebra II with Statistics
Grades 9-12 Overview
114 2019 Alabama Course of Study Mathematics
Focus 3 Statistical Inference
Study designs are of three main types sample survey experiment and observational study
Algebra II with Statistics
The role of randomization is different in randomly selecting samples and in randomly assigning subjects to experimental treatment groups
Algebra II with Statistics
The scope and validity of statistical inferences are dependent on the role of randomization in the study design
Algebra II with Statistics
Bias such as sampling response or nonresponse bias may occur in surveys yielding results that are not representative of the population of interest
Algebra II with Statistics
The larger the sample size the less the expected variability in the sampling distribution of a sample statistic
Algebra II with Statistics
The sampling distribution of a sample statistic formed from repeated samples for a given sample size drawn from a population can be used to identify typical behavior for that statistic Examining several such sampling distributions leads to estimating a set of plausible values for the population parameter using the margin of error as a measure that describes the sampling variability
Algebra II with Statistics
Focus 4 Probability
Two events are independent if the occurrence of one event does not affect the probability of the other event Determining whether two events are independent can be used for finding and understanding probabilities
Algebra I with Probability
Conditional probabilities ndash that is those probabilities that are ldquoconditionedrdquo by some known information ndash can be computed from data organized in contingency tables Conditions or assumptions may affect the computation of a probability
Algebra I with Probability
Grades 9-12 Overview
115 2019 Alabama Course of Study Mathematics
Geometry and Measurement Focus 1 Measurement
Areas and volumes of figures can be computed by determining how the figure might be obtained from simpler figures by dissection and recombination
Geometry with Data Analysis
Constructing approximations of measurements with different tools including technology can support an understanding of measurement
Geometry with Data Analysis
When an object is the image of a known object under a similarity transformation a length area or volume on the image can be computed by using proportional relationships
Geometry with Data Analysis Algebra II with Statistics
Focus 2 Transformations
Applying geometric transformations to figures provides opportunities for describing the attributes of the figures preserved by the transformation and for describing symmetries by examining when a figure can be mapped onto itself
Geometry with Data Analysis
Showing that two figures are congruent involves showing that there is a rigid motion (translation rotation reflection or glide reflection) or equivalently a sequence of rigid motions that maps one figure to the other
Geometry with Data Analysis
Showing that two figures are similar involves finding a similarity transformation (dilation or composite of a dilation with a rigid motion) or equivalently a sequence of similarity transformations that maps one figure onto the other
Geometry with Data Analysis
Transformations in geometry serve as a connection with algebra both through the concept of functions and through the analysis of graphs of functions as geometric figures
This essential concept is not noted in any of the required courses However it is addressed within the Algebra and Functions Content Area
Grades 9-12 Overview
116 2019 Alabama Course of Study Mathematics
Focus 3 Geometric Arguments Reasoning and Proof
Proof is the means by which we demonstrate whether a statement is true or false mathematically and proofs can be communicated in a variety of ways (eg two-column paragraph)
Geometry with Data Analysis
Using technology to construct and explore figures with constraints provides an opportunity to explore the independence and dependence of assumptions and conjectures
Geometry with Data Analysis
Proofs of theorems can sometimes be made with transformations coordinates or algebra all approaches can be useful and in some cases one may provide a more accessible or understandable argument than another
Geometry with Data Analysis
Focus 4 Solving Applied Problems and Modeling in Geometry
Recognizing congruence similarity symmetry measurement opportunities and other geometric ideas including right triangle trigonometry in real-world contexts provides a means of building understanding of these concepts and is a powerful tool for solving problems related to the physical world in which we live
Geometry with Data Analysis Algebra II with Statistics
Experiencing the mathematical modeling cycle in problems involving geometric concepts from the simplification of the real problem through the solving of the simplified problem the interpretation of its solution and the checking of the solutionrsquos feasibility introduces geometric techniques tools and points of view that are valuable to problem solving
Geometry with Data Analysis
117 2019 Alabama Course of Study Mathematics
Geometry with Data Analysis Overview
Geometry with Data Analysis is a newly-designed course which builds on the studentsrsquo experiences in the middle grades It is the first of three required courses in high school mathematics providing a common Grade 9 experience for all students entering high-school-level mathematics If students need additional support while taking Geometry with Data Analysis schools are encouraged to offer a concurrent ldquolab courserdquo to meet their specific needs The lab course might review prior knowledge for upcoming lessons reinforce content from previous lessons or preview upcoming content to ensure that students can fully participate in the required class Since the lab course does not cover additional mathematical standards students can receive only an elective credit for each lab course not a mathematics credit See further details on the lab courses in the High School Overview Note that school systems will not offer Geometry with Data Analysis as ldquoArdquo and ldquoBrdquo courses in which the content is spread over two courses Geometry with Data Analysis builds essential concepts necessary for students to meet their postsecondary goals (whether they pursue additional study or enter the workforce) to function as effective citizens and to recognize the wonder joy and beauty of mathematics (NCTM 2018) It is important because it develops mathematical knowledge and skills through visual representations prior to the more abstract development of algebra Beginning high school mathematics with Geometry with Data Analysis in Grade 9 offers students the opportunity to build their reasoning and sense-making skills see the applicability of mathematics and prepare more effectively for further studies in algebra The course also focuses on data analysis which provides students with tools to describe show and summarize data in the world around them In Geometry with Data Analysis students incorporate knowledge and skills from several mathematics content areas leading to a deeper understanding of fundamental relationships within the discipline and building a solid foundation for further study In the content area of Geometry and Measurement students build on and deepen prior understanding of transformations congruence similarity and coordinate geometry concepts Informal explorations of transformations provide a foundation for more formal considerations of congruence and similarity including development of criteria for triangle congruence and similarity An emphasis on reasoning and proof throughout the content area promotes exploration conjecture testing and informal and formal justification Students extend their middle school work with conjecturing and creating informal arguments to more formal proofs in this course In the content area of Algebra and Functions students perform algebraic calculations with specific application to geometry that build on foundations of algebra from Grades 7 and 8 In the Data Analysis Statistics and Probability content area students build from earlier experiences in analyzing data and creating linear models to focus on univariate quantitative data on the real number line (shape center and variability) and bivariate quantitative data on a coordinate plane (creating linear models)
Geometry with Data Analysis
118 2019 Alabama Course of Study Mathematics
NOTE Although not all content areas in the grade level have been included in the overview all standards should be included in instruction A focus on mathematical modeling and real-world statistical problem-solving is included across the course see Appendix E for more information on the modeling cycles for mathematics and statistics It is essential for students to use technology and other mathematical tools to explore geometric shapes and their properties and to represent and analyze data The eight Student Mathematical Practices listed in the chart below represent what students are doing as they learn mathematics Students should regularly engage in these processes and proficiencies at every level throughout their mathematical studies Proficiency with these practices is critical in using mathematics both within the classroom and in life The Student Mathematical Practices are standards to be incorporated across all grades
Student Mathematical Practices
1 Make sense of problems and persevere in solving them 5 Use appropriate tools strategically 2 Reason abstractly and quantitatively 6 Attend to precision 3 Construct viable arguments and critique the reasoning of others 7 Look for and make use of structure 4 Model with mathematics 8 Look for and express regularity in repeated reasoning
The standards indicating what students should know or be able to do at the end of the course are listed in the right columns of the content standard tables The essential concepts are listed in the left columns In some cases focus areas are indicated Statements in bold print indicate the scope of the standard and align the standard to related content taught in other courses The full scope of every standard should be addressed during instruction
Geometry with Data Analysis Content Standards
Each content standard completes the stem ldquoStudents willhelliprdquo
Number and Quantity Together irrational numbers and rational numbers complete the real number system representing all points on the number line while there exist numbers beyond the real numbers called complex numbers
1 Extend understanding of irrational and rational numbers by rewriting expressions involving radicals including addition subtraction multiplication and division in order to recognize geometric patterns
Geometry with Data Analysis
119 2019 Alabama Course of Study Mathematics
Algebra and Functions Focus 1 Algebra The structure of an equation or inequality (including but not limited to one-variable linear and quadratic equations inequalities and systems of linear equations in two variables) can be purposefully analyzed (with and without technology) to determine an efficient strategy to find a solution if one exists and then to justify the solution
3 Find the coordinates of the vertices of a polygon determined by a set of lines given their equations by setting their function rules equal and solving or by using their graphs
Expressions equations and inequalities can be used to analyze and make predictions both within mathematics and as mathematics is applied in different contexts ndash in particular contexts that arise in relation to linear quadratic and exponential situations
4 Rearrange formulas to highlight a quantity of interest using the same reasoning as in solving equations Example Rearrange the formula for the area of a trapezoid to highlight one of the bases
Focus 2 Connecting Algebra to Functions Graphs can be used to obtain exact or approximate solutions of equations inequalities and systems of equations and inequalitiesmdashincluding systems of linear equations in two variables and systems of linear and quadratic equations (given or obtained by using technology)
5 Verify that the graph of a linear equation in two variables is the set of all its solutions plotted in the coordinate plane which forms a line
6 Derive the equation of a circle of given center and radius using the Pythagorean Theorem a Given the endpoints of the diameter of a circle use the midpoint formula to find its
center and then use the Pythagorean Theorem to find its equation b Derive the distance formula from the Pythagorean Theorem
Quantitative reasoning includes and mathematical modeling requires attention to units of measurement
2 Use units as a way to understand problems and to guide the solution of multi-step problems a Choose and interpret units consistently in formulas b Choose and interpret the scale and the origin in graphs and data displays c Define appropriate quantities for the purpose of descriptive modeling d Choose a level of accuracy appropriate to limitations of measurements when reporting
quantities
Geometry with Data Analysis
120 2019 Alabama Course of Study Mathematics
Data Analysis Statistics and Probability Focus 1 Quantitative Literacy Mathematical and statistical reasoning about data can be used to evaluate conclusions and assess risks
7 Use mathematical and statistical reasoning with quantitative data both univariate data (set of values) and bivariate data (set of pairs of values) that suggest a linear association in order to draw conclusions and assess risk Example Estimate the typical age at which a lung cancer patient is diagnosed and estimate how the typical age differs depending on the number of cigarettes smoked per day
Focus 2 Visualizing and Summarizing Data Data arise from a context and come in two types quantitative (continuous or discrete) and categorical Technology can be used to ldquocleanrdquo and organize data including very large data sets into a useful and manageable structure ndash a first step in any analysis of data
8 Use technology to organize data including very large data sets into a useful and manageable structure
Distributions of quantitative data (continuous or discrete) in one variable should be described in the context of the data with respect to what is typical (the shape with appropriate measures of center and variability including standard deviation) and what is not (outliers) and these characteristics can be used to compare two or more subgroups with respect to a variable
9 Represent the distribution of univariate quantitative data with plots on the real number line choosing a format (dot plot histogram or box plot) most appropriate to the data set and represent the distribution of bivariate quantitative data with a scatter plot Extend from simple cases by hand to more complex cases involving large data sets using technology
10 Use statistics appropriate to the shape of the data distribution to compare and contrast two or more data sets utilizing the mean and median for center and the interquartile range and standard deviation for variability a Explain how standard deviation develops from mean absolute deviation b Calculate the standard deviation for a data set using technology where appropriate
11 Interpret differences in shape center and spread in the context of data sets accounting for
possible effects of extreme data points (outliers) on mean and standard deviation
Geometry with Data Analysis
121 2019 Alabama Course of Study Mathematics
Scatter plots including plots over time can reveal patterns trends clusters and gaps that are useful in analyzing the association between two contextual variables
12 Represent data of two quantitative variables on a scatter plot and describe how the variables are related a Find a linear function for a scatter plot that suggests a linear association and
informally assess its fit by plotting and analyzing residuals including the squares of the residuals in order to improve its fit
b Use technology to find the least-squares line of best fit for two quantitative variables
Analyzing the association between two quantitative variables should involve statistical procedures such as examining (with technology) the sum of squared deviations in fitting a linear model analyzing residuals for patterns generating a least-squares regression line and finding a correlation coefficient and differentiating between correlation and causation
13 Compute (using technology) and interpret the correlation coefficient of a linear relationship
14 Distinguish between correlation and causation
Data analysis techniques can be used to develop models of contextual situations and to generate and evaluate possible solutions to real problems involving those contexts
15 Evaluate possible solutions to real-life problems by developing linear models of contextual situations and using them to predict unknown values a Use the linear model to solve problems in the context of the given data b Interpret the slope (rate of change) and the intercept (constant term) of a linear model in
the context of the given data
Geometry and Measurement Focus 1 Measurement Areas and volumes of figures can be computed by determining how the figure might be obtained from simpler figures by dissection and recombination
16 Identify the shapes of two-dimensional cross-sections of three-dimensional objects and identify three-dimensional objects generated by rotations of two-dimensional objects
Geometry with Data Analysis
122 2019 Alabama Course of Study Mathematics
17 Model and solve problems using surface area and volume of solids including composite solids and solids with portions removed a Give an informal argument for the formulas for the surface area and volume of a sphere
cylinder pyramid and cone using dissection arguments Cavalieris Principle and informal limit arguments
b Apply geometric concepts to find missing dimensions to solve surface area or volume problems
Constructing approximations of measurements with different tools including technology can support an understanding of measurement
18 Given the coordinates of the vertices of a polygon compute its perimeter and area using a variety of methods including the distance formula and dynamic geometry software and evaluate the accuracy of the results
When an object is the image of a known object under a similarity transformation a length area or volume on the image can be computed by using proportional relationships
19 Derive and apply the relationships between the lengths perimeters areas and volumes of similar figures in relation to their scale factor
20 Derive and apply the formula for the length of an arc and the formula for the area of a sector
Focus 2 Transformations Applying geometric transformations to figures provides opportunities for describing the attributes of the figures preserved by the transformation and for describing symmetries by examining when a figure can be mapped onto itself
21 Represent transformations and compositions of transformations in the plane (coordinate and otherwise) using tools such as tracing paper and geometry software a Describe transformations and compositions of transformations as functions that take
points in the plane as inputs and give other points as outputs using informal and formal notation
b Compare transformations which preserve distance and angle measure to those that do not
22 Explore rotations reflections and translations using graph paper tracing paper and geometry software a Given a geometric figure and a rotation reflection or translation draw the image of the
transformed figure using graph paper tracing paper or geometry software b Specify a sequence of rotations reflections or translations that will carry a given figure
onto another c Draw figures with different types of symmetries and describe their attributes
Geometry with Data Analysis
123 2019 Alabama Course of Study Mathematics
23 Develop definitions of rotation reflection and translation in terms of angles circles perpendicular lines parallel lines and line segments
Showing that two figures are congruent involves showing that there is a rigid motion (translation rotation reflection or glide reflection) or equivalently a sequence of rigid motions that maps one figure to the other
24 Define congruence of two figures in terms of rigid motions (a sequence of translations rotations and reflections) show that two figures are congruent by finding a sequence of rigid motions that maps one figure to the other Example ABC is congruent to XYZ since a reflection followed by a translation maps ABC onto XYZ
25 Verify criteria for showing triangles are congruent using a sequence of rigid motions that map
one triangle to another a Verify that two triangles are congruent if and only if corresponding pairs of sides and
corresponding pairs of angles are congruent b Verify that two triangles are congruent if (but not only if) the following groups of
corresponding parts are congruent angle-side-angle (ASA) side-angle-side (SAS) side-side-side (SSS) and angle-angle-side (AAS) Example Given two triangles with two pairs of congruent corresponding sides and a pair of congruent included angles show that there must be a sequence of rigid motions will map one onto the other
Geometry with Data Analysis
124 2019 Alabama Course of Study Mathematics
Showing that two figures are similar involves finding a similarity transformation (dilation or composite of a dilation with a rigid motion) or equivalently a sequence of similarity transformations that maps one figure onto the other
26 Verify experimentally the properties of dilations given by a center and a scale factor a Verify that a dilation takes a line not passing through the center of the dilation to a
parallel line and leaves a line passing through the center unchanged b Verify that the dilation of a line segment is longer or shorter in the ratio given by the
scale factor
27 Given two figures determine whether they are similar by identifying a similarity transformation (sequence of rigid motions and dilations) that maps one figure to the other
28 Verify criteria for showing triangles are similar using a similarity transformation (sequence of
rigid motions and dilations) that maps one triangle to another a Verify that two triangles are similar if and only if corresponding pairs of sides are
proportional and corresponding pairs of angles are congruent b Verify that two triangles are similar if (but not only if) two pairs of corresponding
angles are congruent (AA) the corresponding sides are proportional (SSS) or two pairs of corresponding sides are proportional and the pair of included angles is congruent (SAS) Example Given two triangles with two pairs of congruent corresponding sides and a pair of congruent included angles show there must be a set of rigid motions that maps one onto the other
Focus 3 Geometric Arguments Reasoning and Proof Using technology to construct and explore figures with constraints provides an opportunity to explore the independence and dependence of assumptions and conjectures
29 Find patterns and relationships in figures including lines triangles quadrilaterals and circles using technology and other tools a Construct figures using technology and other tools in order to make and test
conjectures about their properties b Identify different sets of properties necessary to define and construct figures
Proof is the means by which we demonstrate whether a statement is true or false mathematically and proofs can be communicated in a variety of ways (eg two-column paragraph)
30 Develop and use precise definitions of figures such as angle circle perpendicular lines parallel lines and line segment based on the undefined notions of point line distance along a line and distance around a circular arc
Geometry with Data Analysis
125 2019 Alabama Course of Study Mathematics
31 Justify whether conjectures are true or false in order to prove theorems and then apply those theorems in solving problems communicating proofs in a variety of ways including flow chart two-column and paragraph formats a Investigate prove and apply theorems about lines and angles including but not limited
to vertical angles are congruent when a transversal crosses parallel lines alternate interior angles are congruent and corresponding angles are congruent the points on the perpendicular bisector of a line segment are those equidistant from the segments endpoints
b Investigate prove and apply theorems about triangles including but not limited to the sum of the measures of the interior angles of a triangle is 180˚ the base angles of isosceles triangles are congruent the segment joining the midpoints of two sides of a triangle is parallel to the third side and half the length a line parallel to one side of a triangle divides the other two proportionally and conversely the Pythagorean Theorem using triangle similarity
c Investigate prove and apply theorems about parallelograms and other quadrilaterals including but not limited to both necessary and sufficient conditions for parallelograms and other quadrilaterals as well as relationships among kinds of quadrilaterals Example Prove that rectangles are parallelograms with congruent diagonals
Proofs of theorems can sometimes be made with transformations coordinates or algebra all approaches can be useful and in some cases one may provide a more accessible or understandable argument than another
32 Use coordinates to prove simple geometric theorems algebraically
33 Prove the slope criteria for parallel and perpendicular lines and use them to solve geometric problems Example Find the equation of a line parallel or perpendicular to a given line that passes through a given point
Geometry with Data Analysis
126 2019 Alabama Course of Study Mathematics
Focus 4 Solving Applied Problems and Modeling in Geometry Recognizing congruence similarity symmetry measurement opportunities and other geometric ideas including right triangle trigonometry in real-world contexts provides a means of building understanding of these concepts and is a powerful tool for solving problems related to the physical world in which we live
34 Use congruence and similarity criteria for triangles to solve problems in real-world contexts
35 Discover and apply relationships in similar right triangles a Derive and apply the constant ratios of the sides in special right triangles (45˚-45˚-90˚
and 30˚-60˚-90˚) b Use similarity to explore and define basic trigonometric ratios including sine ratio
cosine ratio and tangent ratio c Explain and use the relationship between the sine and cosine of complementary angles d Demonstrate the converse of the Pythagorean Theorem e Use trigonometric ratios and the Pythagorean Theorem to solve right triangles in applied
problems including finding areas of regular polygons
36 Use geometric shapes their measures and their properties to model objects and use those models to solve problems
37 Investigate and apply relationships among inscribed angles radii and chords including but not limited to the relationship between central inscribed and circumscribed angles inscribed angles on a diameter are right angles the radius of a circle is perpendicular to the tangent where the radius intersects the circle
Experiencing the mathematical modeling cycle in problems involving geometric concepts from the simplification of the real problem through the solving of the simplified problem the interpretation of its solution and the checking of the solutionrsquos feasibility introduces geometric techniques tools and points of view that are valuable to problem-solving
38 Use the mathematical modeling cycle involving geometric methods to solve design problems Examples Design an object or structure to satisfy physical constraints or minimize cost work with typographic grid systems based on ratios apply concepts of density based on area and volume
127 2019 Alabama Course of Study Mathematics
Algebra I with Probability Overview
Algebra I with Probability is a newly-designed course which builds upon algebraic concepts studied in the middle grades It provides students with the necessary knowledge of algebra and probability for use in everyday life and in the subsequent study of mathematics This is one of three courses required for all students Students can obtain the essential content from this course either by taking the course after completing Geometry with Data Analysis in Grade 9 or by completing the middle school accelerated pathway Alternatively students who did not take the accelerated pathway in middle school may choose to accelerate in high school by taking Algebra I with Probability in Grade 9 along with Geometry with Data Analysis If students need additional support while taking Algebra I with Probability schools are encouraged to offer a concurrent ldquolab courserdquo to meet their specific needs The lab course might review prior knowledge needed for upcoming lessons reinforce content from previous lessons or preview upcoming content to ensure that students can fully participate in the required class Since the lab course does not cover additional mathematical standards students can receive only an elective credit for each lab course not a mathematics credit See further details on the lab courses in the High School Overview School systems will not offer Algebra I with Probability as ldquoArdquo and ldquoBrdquo courses in which the content is spread over two courses Algebra I with Probability builds essential concepts necessary for students to meet their postsecondary goals (whether they pursue additional study or enter the workforce) to function as effective citizens and to recognize the wonder joy and beauty of mathematics (NCTM 2018) Algebra is important and useful in most careers It is one of the most common and malleable types of mathematics because it is valuable in a range of activities from ordinary decision-making to advanced training in scientific and technological fields The ability to understand and apply algebraic thinking is a crucial stepping stone on a successful journey in life Algebra is a collection of unifying concepts that enable one to solve problems flexibly The study of algebra is inextricably linked to the study of functions which are fundamental objects in mathematics that model many life situations involving change This course provides experiences for students to see how mathematics can be used systematically to represent patterns and relationships among numbers and other objects analyze change and model everyday events and problems of life and society Algebra I with Probability emphasizes functions including linear (as introduced in Grades 7 and 8) absolute value quadratic and exponential and functions as explicit (relation between input and output) and recursive (relation between successive values) Properties of algebra are applied to convert between forms of expressions and to solve equations (factoring completing the square rules of powers and radicals) Graphing is an important component of study in Algebra I with Probability Graphs of equations and inequalities consist of all points (discrete or continuous) whose ordered pairs satisfy the relationship within the domain and range Students find points of intersection between two graphed functions that correspond to the solutions of the equations of the two functions and transform graphs of functions (through translation reflection rotation and dilation) by performing operations on the input or output
Algebra I with Probability
128 2019 Alabama Course of Study Mathematics
Probability is important because it educates one in the logic of uncertainty and randomness which occur in almost every aspect of daily life Therefore studying probability structures will enhance studentsrsquo ability to organize information and improve decision-making The study of probability undergirds the understanding of ratio and proportion in algebra and encourages inferential reasoning about the likelihood of real-life events Categorical data are represented as marginal and conditional distributions Parallels are drawn between conditions and events in probability and inputs and outputs of functions A focus on mathematical modeling and real-world statistical problem-solving is included across the course see Appendix E for more information on the modeling cycles for mathematics and statistics It is essential for students to use technology and other mathematical tools such as graphing calculators online graphing software and spreadsheets to explore functions equations and probability The eight Student Mathematical Practices listed in the chart below represent what students are doing as they learn mathematics Students should regularly engage in these processes and proficiencies at every level throughout their mathematical studies Proficiency with these practices is critical in using mathematics both in the classroom and in everyday life The Student Mathematical Practices are standards to be incorporated across all grades
Student Mathematical Practices
1 Make sense of problems and persevere in solving them 5 Use appropriate tools strategically 2 Reason abstractly and quantitatively 6 Attend to precision 3 Construct viable arguments and critique the reasoning of others 7 Look for and make use of structure 4 Model with mathematics 8 Look for and express regularity in repeated reasoning
The standards indicating what students should know or be able to do are listed in the right columns of the content area tables The essential concepts are described in the left columns of the content area tables In some cases focus areas are indicated within the tables Only those focus areas which are appropriate for this course are included Statements in bold print indicate the scope of the standard and align the standard to related content in other courses The full scope of every standard should be addressed during instruction
Algebra I with Probability
129 2019 Alabama Course of Study Mathematics
Algebra I with Probability Content Standards
Each content standard completes the stem ldquoStudents willhelliprdquo Number and Quantity Together irrational numbers and rational numbers complete the real number system representing all points on the number line while there exist numbers beyond the real numbers called complex numbers
1 Explain how the meaning of rational exponents follows from extending the properties of integer exponents to those values allowing for an additional notation for radicals using rational exponents
2 Rewrite expressions involving radicals and rational exponents using the properties of exponents
3 Define the imaginary number i such that i 2 = -1
Algebra and Functions Focus 1 Algebra Expressions can be rewritten in equivalent forms by using algebraic properties including properties of addition multiplication and exponentiation to make different characteristics or features visible
4 Interpret linear quadratic and exponential expressions in terms of a context by viewing one or more of their parts as a single entity Example Interpret the accrued amount of investment P(1 + r)t where P is the principal and r is the interest rate as the product of P and a factor depending on time t
5 Use the structure of an expression to identify ways to rewrite it Example See x4 - y4 as (x2)2 - (y2)2 thus recognizing it as a difference of squares that can be factored as (x2 - y2)(x2 + y2)
Algebra I with Probability
130 2019 Alabama Course of Study Mathematics
6 Choose and produce an equivalent form of an expression to reveal and explain properties of the quantity represented by the expression a Factor quadratic expressions with leading coefficients of one and use the factored form
to reveal the zeros of the function it defines b Use the vertex form of a quadratic expression to reveal the maximum or minimum value
and the axis of symmetry of the function it defines complete the square to find the vertex form of quadratics with a leading coefficient of one
c Use the properties of exponents to transform expressions for exponential functions Example Identify percent rate of change in functions such as y = (102)t y = (097)t y = (101)12t y = (12)t10 and classify them as representing exponential growth or decay
7 Add subtract and multiply polynomials showing that polynomials form a system analogous to the integers namely they are closed under the operations of addition subtraction and multiplication
Finding solutions to an equation inequality or system of equations or inequalities requires the checking of candidate solutions whether generated analytically or graphically to ensure that solutions are found and that those found are not extraneous
8 Explain why extraneous solutions to an equation involving absolute values may arise and how to check to be sure that a candidate solution satisfies an equation
The structure of an equation or inequality (including but not limited to one-variable linear and quadratic equations inequalities and systems of linear equations in two variables) can be purposefully analyzed (with and without technology) to determine an efficient strategy to find a solution if one exists and then to justify the solution
9 Select an appropriate method to solve a quadratic equation in one variable a Use the method of completing the square to transform any quadratic equation in x into an
equation of the form (x ndash p)2 = q that has the same solutions Explain how the quadratic formula is derived from this form
b Solve quadratic equations by inspection (such as x2 = 49) taking square roots completing the square the quadratic formula and factoring as appropriate to the initial form of the equation and recognize that some solutions may not be real
Algebra I with Probability
131 2019 Alabama Course of Study Mathematics
10 Select an appropriate method to solve a system of two linear equations in two variables a Solve a system of two equations in two variables by using linear combinations contrast
situations in which use of linear combinations is more efficient with those in which substitution is more efficient
b Contrast solutions to a system of two linear equations in two variables produced by algebraic methods with graphical and tabular methods
Expressions equations and inequalities can be used to analyze and make predictions both within mathematics and as mathematics is applied in different contexts ndash in particular contexts that arise in relation to linear quadratic and exponential situations
11 Create equations and inequalities in one variable and use them to solve problems in context either exactly or approximately Extend from contexts arising from linear functions to those involving quadratic exponential and absolute value functions
12 Create equations in two or more variables to represent relationships between quantities in context graph equations on coordinate axes with labels and scales and use them to make predictions Limit to contexts arising from linear quadratic exponential absolute value and linear piecewise functions
13 Represent constraints by equations andor inequalities and solve systems of equations andor
inequalities interpreting solutions as viable or nonviable options in a modeling context Limit to contexts arising from linear quadratic exponential absolute value and linear piecewise functions
Focus 2 Connecting Algebra to Functions Functions shift the emphasis from a point-by-point relationship between two variables (inputoutput) to considering an entire set of ordered pairs (where each first element is paired with exactly one second element) as an entity with its own features and characteristics
14 Given a relation defined by an equation in two variables identify the graph of the relation as the set of all its solutions plotted in the coordinate plane Note The graph of a relation often forms a curve (which could be a line)
Algebra I with Probability
132 2019 Alabama Course of Study Mathematics
15 Define a function as a mapping from one set (called the domain) to another set (called the range) that assigns to each element of the domain exactly one element of the range a Use function notation evaluate functions for inputs in their domains and interpret
statements that use function notation in terms of a context Note If f is a function and x is an element of its domain then f(x) denotes the output of f corresponding to the input x
b Relate the domain of a function to its graph and where applicable to the quantitative relationship it describes Limit to linear quadratic exponential and absolute value functions
16 Compare and contrast relations and functions represented by equations graphs or tables that show related values determine whether a relation is a function Explain that a function f is a special kind of relation defined by the equation y = f(x)
17 Combine different types of standard functions to write evaluate and interpret functions in context Limit to linear quadratic exponential and absolute value functions a Use arithmetic operations to combine different types of standard functions to write and
evaluate functions Example Given two functions one representing flow rate of water and the other representing evaporation of that water combine the two functions to determine the amount of water in a container at a given time
b Use function composition to combine different types of standard functions to write and evaluate functions Example Given the following relationships determine what the expression S(T(t)) represents
Function Input Output
G Amount of studying s Grade in course G(s)
S Grade in course g Amount of screen time S(g)
T Amount of screen time t Number of followers T(t)
Algebra I with Probability
133 2019 Alabama Course of Study Mathematics
Graphs can be used to obtain exact or approximate solutions of equations inequalities and systems of equations and inequalities ndash including systems of linear equations in two variables and systems of linear and quadratic equations (given or obtained by using technology)
18 Solve systems consisting of linear andor quadratic equations in two variables graphically using technology where appropriate
19 Explain why the x-coordinates of the points where the graphs of the equations y = f(x) and y = g(x) intersect are the solutions of the equation f(x) = g(x) a Find the approximate solutions of an equation graphically using tables of values or
finding successive approximations using technology where appropriate Note Include cases where f(x) is a linear quadratic exponential or absolute value function and g(x) is constant or linear
20 Graph the solutions to a linear inequality in two variables as a half-plane (excluding the
boundary in the case of a strict inequality) and graph the solution set to a system of linear inequalities in two variables as the intersection of the corresponding half-planes using technology where appropriate
Focus 3 Functions Functions can be described by using a variety of representations mapping diagrams function notation (eg f(x) = x2) recursive definitions tables and graphs
21 Compare properties of two functions each represented in a different way (algebraically graphically numerically in tables or by verbal descriptions) Extend from linear to quadratic exponential absolute value and general piecewise
22 Define sequences as functions including recursive definitions whose domain is a subset of the integers a Write explicit and recursive formulas for arithmetic and geometric sequences and
connect them to linear and exponential functions Example A sequence with constant growth will be a linear function while a sequence with proportional growth will be an exponential function
Functions that are members of the same family have distinguishing attributes (structure) common to all functions within that family
23 Identify the effect on the graph of replacing 119891119891(119909119909) by 119891119891(119909119909) + 119896119896119896119896 middot 119891119891(119909119909) 119891119891(119896119896 middot 119909119909) and 119891119891(119909119909 + 119896119896) for specific values of k (both positive and negative) find the value of k given the graphs Experiment with cases and explain the effects on the graph using technology as appropriate Limit to linear quadratic exponential absolute value and linear piecewise functions
Algebra I with Probability
134 2019 Alabama Course of Study Mathematics
24 Distinguish between situations that can be modeled with linear functions and those that can be modeled with exponential functions a Show that linear functions grow by equal differences over equal intervals while
exponential functions grow by equal factors over equal intervals b Define linear functions to represent situations in which one quantity changes at a
constant rate per unit interval relative to another c Define exponential functions to represent situations in which a quantity grows or decays
by a constant percent rate per unit interval relative to another
25 Construct linear and exponential functions including arithmetic and geometric sequences given a graph a description of a relationship or two input-output pairs (include reading these from a table)
26 Use graphs and tables to show that a quantity increasing exponentially eventually exceeds a quantity increasing linearly or quadratically
27 Interpret the parameters of functions in terms of a context Extend from linear functions written in the form mx + b to exponential functions written in the form abx Example If the function V(t) = 19885(075)t describes the value of a car after it has been owned for t years 19885 represents the purchase price of the car when t = 0 and 075 represents the annual rate at which its value decreases
Functions can be represented graphically and key features of the graphs including zeros intercepts and when relevant rate of change and maximumminimum values can be associated with and interpreted in terms of the equivalent symbolic representation
28 For a function that models a relationship between two quantities interpret key features of graphs and tables in terms of the quantities and sketch graphs showing key features given a verbal description of the relationship Note Key features include intercepts intervals where the function is increasing decreasing positive or negative maximums and minimums symmetries and end behavior Extend from relationships that can be represented by linear functions to quadratic exponential absolute value and linear piecewise functions
29 Calculate and interpret the average rate of change of a function (presented symbolically or as a table) over a specified interval Estimate the rate of change from a graph Limit to linear quadratic exponential and absolute value functions
Algebra I with Probability
135 2019 Alabama Course of Study Mathematics
30 Graph functions expressed symbolically and show key features of the graph by hand in simple cases and using technology for more complicated cases a Graph linear and quadratic functions and show intercepts maxima and minima b Graph piecewise-defined functions including step functions and absolute value
functions c Graph exponential functions showing intercepts and end behavior
Functions model a wide variety of real situations and can help students understand the processes of making and changing assumptions assigning variables and finding solutions to contextual problems
31 Use the mathematical modeling cycle to solve real-world problems involving linear quadratic exponential absolute value and linear piecewise functions
Data Analysis Statistics and Probability Focus 1 Quantitative Literacy Mathematical and statistical reasoning about data can be used to evaluate conclusions and assess risks
32 Use mathematical and statistical reasoning with bivariate categorical data in order to draw conclusions and assess risk Example In a clinical trial comparing the effectiveness of flu shots A and B 21 subjects in treatment group A avoided getting the flu while 29 contracted it In group B 12 avoided the flu while 13 contracted it Discuss which flu shot appears to be more effective in reducing the chances of contracting the flu Possible answer Even though more people in group A avoided the flu than in group B the proportion of people avoiding the flu in group B is greater than the proportion in group A which suggests that treatment B may be more effective in lowering the risk of getting the flu
Contracted Flu Did Not Contract Flu
Flu Shot A 29 21
Flu Shot B 13 12
Total 42 33
Algebra I with Probability
136 2019 Alabama Course of Study Mathematics
Making and defending informed data-based decisions is a characteristic of a quantitatively literate person
33 Design and carry out an investigation to determine whether there appears to be an association between two categorical variables and write a persuasive argument based on the results of the investigation Example Investigate whether there appears to be an association between successfully completing a task in a given length of time and listening to music while attempting the task Randomly assign some students to listen to music while attempting to complete the task and others to complete the task without listening to music Discuss whether students should listen to music while studying based on that analysis
Focus 2 Visualizing and Summarizing Data Data arise from a context and come in two types quantitative (continuous or discrete) and categorical Technology can be used to ldquocleanrdquo and organize data including very large data sets into a useful and manageable structuremdasha first step in any analysis of data
34 Distinguish between quantitative and categorical data and between the techniques that may be used for analyzing data of these two types Example The color of cars is categorical and so is summarized by frequency and proportion for each color category while the mileage on each carrsquos odometer is quantitative and can be summarized by the mean
The association between two categorical variables is typically represented by using two-way tables and segmented bar graphs
35 Analyze the possible association between two categorical variables a Summarize categorical data for two categories in two-way frequency tables and represent
using segmented bar graphs b Interpret relative frequencies in the context of categorical data (including joint marginal
and conditional relative frequencies) c Identify possible associations and trends in categorical data
Algebra I with Probability
137 2019 Alabama Course of Study Mathematics
Data analysis techniques can be used to develop models of contextual situations and to generate and evaluate possible solutions to real problems involving those contexts
36 Generate a two-way categorical table in order to find and evaluate solutions to real-world problems a Aggregate data from several groups to find an overall association between two categorical
variables b Recognize and explore situations where the association between two categorical variables
is reversed when a third variable is considered (Simpsons Paradox) Example In a certain city Hospital 1 has a higher fatality rate than Hospital 2 But when considering mildly-injured patients and severely-injured patients as separate groups Hospital 1 has a lower fatality rate among both groups than Hospital 2 since Hospital 1 is a Level 1 Trauma Center Thus Hospital 1 receives most of the severely injured patients who are less likely to survive overall but have a better chance of surviving in Hospital 1 than they would in Hospital 2
Focus 3 Statistical Inference (Note There are no Algebra I with Probability standards in Focus 3)
Focus 4 Probability Two events are independent if the occurrence of one event does not affect the probability of the other event Determining whether two events are independent can be used for finding and understanding probabilities
37 Describe events as subsets of a sample space (the set of outcomes) using characteristics (or categories) of the outcomes or as unions intersections or complements of other events (or and not)
38 Explain whether two events A and B are independent using two-way tables or tree diagrams
Conditional probabilities ndash that is those probabilities that are ldquoconditionedrdquo by some known information ndash can be computed from data organized in contingency tables Conditions or assumptions may affect the computation of a probability
39 Compute the conditional probability of event A given event B using two-way tables or tree diagrams
40 Recognize and describe the concepts of conditional probability and independence in everyday situations and explain them using everyday language Example Contrast the chance of having lung cancer if you are a smoker with the chance of being a smoker if you have lung cancer
41 Explain why the conditional probability of A given B is the fraction of Bs outcomes that also belong to A and interpret the answer in context Example the probability of drawing a king from a deck of cards given that it is a face card is 4521252
which is 13
138 2019 Alabama Course of Study Mathematics
Algebra II with Statistics Overview
Algebra II with Statistics is a newly-designed course which builds on the studentsrsquo experiences in previous mathematics coursework It is the third of three required courses and it is to be taken following the successful completion of Geometry with Data Analysis and either Algebra I with Probability or the middle school accelerated sequence It is the culmination of the three years of required mathematics content and sets the stage for continued study of topics specific to the studentrsquos interests and plans beyond high school
If students need additional support while taking Algebra II with Statistics schools are encouraged to offer a concurrent ldquolab courserdquo to meet their specific needs The lab course might review prior knowledge needed for upcoming lessons reinforce content from previous lessons or preview upcoming content to ensure students can fully participate and succeed in the course Since the lab course does not cover additional mathematical standards students can receive only an elective credit for each lab course not a mathematics credit See further details on the lab courses in the High School Overview Algebra II with Statistics builds essential concepts necessary for students to meet their postsecondary goals (whether they pursue additional study or enter the workforce) function as effective citizens and recognize the wonder joy and beauty of mathematics (NCTM 2018) In particular it builds foundational knowledge of algebra and functions needed for students to take the specialized courses which follow it This course also focuses on inferential statistics which allows students to draw conclusions about populations and cause-and-effect based on random samples and controlled experiments In Algebra II with Statistics students incorporate knowledge and skills from several mathematics content areas leading to a deeper understanding of fundamental relationships within the discipline and building a solid foundation for further study In the content area of Algebra and Functions students explore an expanded range of functions including polynomial trigonometric (specifically sine and cosine) logarithmic reciprocal radical and general piecewise functions Students also solve equations associated with these classes of functions In the content area of Data Analysis Statistics and Probability students learn how to make inferences about a population from a random sample drawn from the population and how to analyze cause-and-effect by conducting randomized experiments Students are introduced to the study of matrices in the Number and Quantity content area A focus on mathematical modeling and real-world statistical problem-solving is included across the course see Appendix E for more information on the modeling cycles for mathematics and statistics It is essential for students to use technology and other mathematical tools such as graphing calculators online graphing software and spreadsheets to explore functions equations and analyze data
Algebra II with Statistics
139 2019 Alabama Course of Study Mathematics
The eight Student Mathematical Practices listed in the chart below represent what students are doing as they learn mathematics Students should regularly engage in these processes and proficiencies at every level throughout their mathematical studies Proficiency with these practices is critical in using mathematics both within the classroom and in life The Student Mathematical Practices are standards to be incorporated across all grades
Student Mathematical Practices
1 Make sense of problems and persevere in solving them 5 Use appropriate tools strategically 2 Reason abstractly and quantitatively 6 Attend to precision 3 Construct viable arguments and critique the reasoning of others 7 Look for and make use of structure 4 Model with mathematics 8 Look for and express regularity in repeated reasoning
The standards indicating what students should know or be able to do by the end of the course are listed in the right columns of the content area tables The essential concepts are described in the left columns of the content area tables In some cases focus areas are indicated within the tables Only those focus areas which are appropriate for this course are included
Statements in bold print indicate the scope of the standard and align the standard to related content in other courses The full scope of every standard should be addressed during instruction
Algebra II with Statistics
140 2019 Alabama Course of Study Mathematics
Algebra II with Statistics Content Standards
Each content standard completes the stem ldquoStudents willhelliprdquo
Number and Quantity
Together irrational numbers and rational numbers complete the real number system representing all points on the number line while there exist numbers beyond the real numbers called complex numbers
1 Identify numbers written in the form a + bi where a and b are real numbers and i2 = ndash1 as complex numbers
a Add subtract and multiply complex numbers using the commutative associative and distributive properties
Matrices are a useful way to represent information
2 Use matrices to represent and manipulate data
3 Multiply matrices by scalars to produce new matrices 4 Add subtract and multiply matrices of appropriate dimensions
5 Describe the roles that zero and identity matrices play in matrix addition and multiplication
recognizing that they are similar to the roles of 0 and 1 in the real numbers a Find the additive and multiplicative inverses of square matrices using technology as
appropriate b Explain the role of the determinant in determining if a square matrix has a multiplicative
inverse
Algebra II with Statistics
141 2019 Alabama Course of Study Mathematics
Algebra and Functions
Focus 1 Algebra Expressions can be rewritten in equivalent forms by using algebraic properties including properties of addition multiplication and exponentiation to make different characteristics or features visible
6 Factor polynomials using common factoring techniques and use the factored form of a polynomial to reveal the zeros of the function it defines
7 Prove polynomial identities and use them to describe numerical relationships Example The polynomial identity 1 ndash xn = (1 ndash x)(1 + x + x 2 + x3 + hellip + xn-1 + xn) can be used to find the sum of the first n terms of a geometric sequence with common ratio x by dividing both sides of the identity by (1 - x)
Finding solutions to an equation inequality or system of equations or inequalities requires the checking of candidate solutions whether generated analytically or graphically to ensure that solutions are found and that those found are not extraneous
8 Explain why extraneous solutions to an equation may arise and how to check to be sure that a candidate solution satisfies an equation Extend to radical equations
The structure of an equation or inequality (including but not limited to one-variable linear and quadratic equations inequalities and systems of linear equations in two variables) can be purposefully analyzed (with and without technology) to determine an efficient strategy to find a solution if one exists and then to justify the solution
9 For exponential models express as a logarithm the solution to abct = d where a c and d are real numbers and the base b is 2 or 10 evaluate the logarithm using technology to solve an exponential equation
Expressions equations and inequalities can be used to analyze and make predictions both within mathematics and as mathematics is applied in different contextsmdashin particular contexts that arise in relation to linear quadratic and exponential situations
10 Create equations and inequalities in one variable and use them to solve problems Extend to equations arising from polynomial trigonometric (sine and cosine) logarithmic radical and general piecewise functions
11 Solve quadratic equations with real coefficients that have complex solutions
12 Solve simple equations involving exponential radical logarithmic and trigonometric functions using inverse functions
Algebra II with Statistics
142 2019 Alabama Course of Study Mathematics
13 Create equations in two or more variables to represent relationships between quantities graph equations on coordinate axes with labels and scales and use them to make predictions Extend to polynomial trigonometric (sine and cosine) logarithmic reciprocal radical and general piecewise functions
Focus 2 Connecting Algebra to Functions Graphs can be used to obtain exact or approximate solutions of equations inequalities and systems of equations and inequalitiesmdashincluding systems of linear equations in two variables and systems of linear and quadratic equations (given or obtained by using technology)
14 Explain why the x-coordinates of the points where the graphs of the equations y = f(x) and y = g(x) intersect are the solutions of the equation f(x) = g(x) a Find the approximate solutions of an equation graphically using tables of values or
finding successive approximations using technology where appropriate Extend to cases where f(x) andor g(x) are polynomial trigonometric (sine and cosine) logarithmic radical and general piecewise functions
Focus 3 Functions Functions can be described by using a variety of representations mapping diagrams function notation (eg f(x) = x2) recursive definitions tables and graphs
15 Compare properties of two functions each represented in a different way (algebraically graphically numerically in tables or by verbal descriptions) Extend to polynomial trigonometric (sine and cosine) logarithmic radical and general piecewise functions
Functions that are members of the same family have distinguishing attributes (structure) common to all functions within that family
16 Identify the effect on the graph of replacing 119891119891(119909119909) by 119891119891(119909119909) + 119896119896119896119896 middot 119891119891(119909119909) 119891119891(119896119896 middot 119909119909) and 119891119891(119909119909 + 119896119896) for specific values of k (both positive and negative) find the value of k given the graphs Experiment with cases and illustrate an explanation of the effects on the graph using technology Extend to polynomial trigonometric (sine and cosine) logarithmic reciprocal radical and general piecewise functions
Algebra II with Statistics
143 2019 Alabama Course of Study Mathematics
Functions can be represented graphically and key features of the graphs including zeros intercepts and when relevant rate of change and maximumminimum values can be associated with and interpreted in terms of the equivalent symbolic representation
17 For a function that models a relationship between two quantities interpret key features of graphs and tables in terms of the quantities and sketch graphs showing key features given a verbal description of the relationship Note Key features include intercepts intervals where the function is increasing decreasing positive or negative maximums and minimums symmetries (including even and odd) end behavior and periodicity Extend to polynomial trigonometric (sine and cosine) logarithmic reciprocal radical and general piecewise functions
18 Relate the domain of a function to its graph and where applicable to the quantitative relationship it describes Extend to polynomial trigonometric (sine and cosine) logarithmic reciprocal radical and general piecewise functions
19 Calculate and interpret the average rate of change of a function (presented symbolically or as a table) over a specified interval Estimate the rate of change from a graph Extend to polynomial trigonometric (sine and cosine) logarithmic reciprocal radical and general piecewise functions
20 Graph functions expressed symbolically and show key features of the graph by hand in simple cases and using technology for more complicated cases Extend to polynomial trigonometric (sine and cosine) logarithmic reciprocal radical and general piecewise functions a Graph polynomial functions expressed symbolically identifying zeros when suitable
factorizations are available and showing end behavior b Graph sine and cosine functions expressed symbolically showing period midline and
amplitude c Graph logarithmic functions expressed symbolically showing intercepts and end
behavior d Graph reciprocal functions expressed symbolically identifying horizontal and vertical
asymptotes e Graph square root and cube root functions expressed symbolically f Compare the graphs of inverse functions and the relationships between their key
features including but not limited to quadratic square root exponential and logarithmic functions
Algebra II with Statistics
144 2019 Alabama Course of Study Mathematics
21 Explain how the unit circle in the coordinate plane enables the extension of trigonometric functions to all real numbers interpreted as radian measures of angles traversed counterclockwise around the unit circle building on work with non-right triangle trigonometry
Functions model a wide variety of real situations and can help students understand the processes of making and changing assumptions assigning variables and finding solutions to contextual problems
22 Use the mathematical modeling cycle to solve real-world problems involving polynomial trigonometric (sine and cosine) logarithmic radical and general piecewise functions from the simplification of the problem through the solving of the simplified problem the interpretation of its solution and the checking of the solutionrsquos feasibility
Data Analysis Statistics and Probability
Focus 1 Quantitative Literacy
Mathematical and statistical reasoning about data can be used to evaluate conclusions and assess risks
23 Use mathematical and statistical reasoning about normal distributions to draw conclusions and assess risk limit to informal arguments Example If candidate A is leading candidate B by 2 in a poll which has a margin of error of less than 3 should we be surprised if candidate B wins the election
Making and defending informed data-based decisions is a characteristic of a quantitatively literate person
24 Design and carry out an experiment or survey to answer a question of interest and write an informal persuasive argument based on the results Example Use the statistical problem-solving cycle to answer the question ldquoIs there an association between playing a musical instrument and doing well in mathematicsrdquo
Algebra II with Statistics
145 2019 Alabama Course of Study Mathematics
Focus 2 Visualizing and Summarizing Data Distributions of quantitative data (continuous or discrete) in one variable should be described in the context of the data with respect to what is typical (the shape with appropriate measures of center and variability including standard deviation) and what is not (outliers) and these characteristics can be used to compare two or more subgroups with respect to a variable
25 From a normal distribution use technology to find the mean and standard deviation and estimate population percentages by applying the empirical rule a Use technology to determine if a given set of data is normal by applying the empirical
rule b Estimate areas under a normal curve to solve problems in context using calculators
spreadsheets and tables as appropriate
Focus 3 Statistical Inference Study designs are of three main types sample survey experiment and observational study
26 Describe the purposes of and differences among sample surveys experiments and observational studies explain how randomization relates to each Examples random assignment in experiments random selection in surveys and observational studies
The role of randomization is different in randomly selecting samples and in randomly assigning subjects to experimental treatment groups
27 Distinguish between a statistic and a parameter and use statistical processes to make inferences about population parameters based on statistics from random samples from that population
28 Describe differences between randomly selecting samples and randomly assigning subjects to experimental treatment groups in terms of inferences drawn regarding a population versus regarding cause and effect Example Data from a group of plants randomly selected from a field allows inference regarding the rest of the plants in the field while randomly assigning each plant to one of two treatments allows inference regarding differences in the effects of the two treatments If the plants were both randomly selected and randomly assigned we can infer that the difference in effects of the two treatments would also be observed when applied to the rest of the plants in the field
Algebra II with Statistics
146 2019 Alabama Course of Study Mathematics
The scope and validity of statistical inferences are dependent on the role of randomization in the study design
29 Explain the consequences due to uncontrolled variables of non-randomized assignment of subjects to groups in experiments Example Students are studying whether or not listening to music while completing mathematics homework improves their quiz scores Rather than assigning students to either listen to music or not at random they simply observe what the students do on their own and find that the music-listening group has a higher mean quiz score Can they conclude that listening to music while studying is likely to raise the quiz scores of students who do not already listen to music What other factors may have been responsible for the observed difference in mean quiz scores
Bias such as sampling response or nonresponse bias may occur in surveys yielding results that are not representative of the population of interest
30 Evaluate where bias including sampling response or nonresponse bias may occur in surveys and whether results are representative of the population of interest Example Selecting students eating lunch in the cafeteria to participate in a survey may not accurately represent the student body as students who do not eat in the cafeteria may not be accounted for and may have different opinions or students may not respond honestly to questions that may be embarrassing such as how much time they spend on homework
The larger the sample size the less the expected variability in the sampling distribution of a sample statistic
31 Evaluate the effect of sample size on the expected variability in the sampling distribution of a sample statistic a Simulate a sampling distribution of sample means from a population with a known
distribution observing the effect of the sample size on the variability b Demonstrate that the standard deviation of each simulated sampling distribution is the
known standard deviation of the population divided by the square root of the sample size
The sampling distribution of a sample statistic formed from repeated samples for a given sample size drawn from a population can be used to identify typical behavior for that statistic Examining several such sampling distributions leads to estimating a set of plausible values for the population parameter using the margin of error as a measure that describes the sampling variability
32 Produce a sampling distribution by repeatedly selecting samples of the same size from a given population or from a population simulated by bootstrapping (resampling with replacement from an observed sample) Do initial examples by hand then use technology to generate a large number of samples a Verify that a sampling distribution is centered at the population mean and approximately
normal if the sample size is large enough b Verify that 95 of sample means are within two standard deviations of the sampling
distribution from the population mean c Create and interpret a 95 confidence interval based on an observed mean from a
sampling distribution
Algebra II with Statistics
147 2019 Alabama Course of Study Mathematics
33 Use data from a randomized experiment to compare two treatments limit to informal use of simulations to decide if an observed difference in the responses of the two treatment groups is unlikely to have occurred due to randomization alone thus implying that the difference between the treatment groups is meaningful Example Fifteen students are randomly assigned to a treatment group that listens to music while completing mathematics homework and another 15 are assigned to a control group that does not and their means on the next quiz are found to be different To test whether the differences seem significant all the scores from the two groups are placed on index cards and repeatedly shuffled into two new groups of 15 each each time recording the difference in the means of the two groups The differences in means of the treatment and control groups are then compared to the differences in means of the mixed groups to see how likely it is to occur
Geometry and Measurement
Focus 1 Measurement When an object is the image of a known object under a similarity transformation a length area or volume on the image can be computed by using proportional relationships
34 Define the radian measure of an angle as the constant of proportionality of the length of an arc it intercepts to the radius of the circle in particular it is the length of the arc intercepted on the unit circle
Focus 2 Transformations (Note There are no Algebra II with Statistics standards in Focus 2)
Focus 3 Geometric Argument Reasoning and Proof (Note There are no Algebra II with Statistics standards in Focus 3)
Focus 4 Solving Applied Problems and Modeling in Geometry Recognizing congruence similarity symmetry measurement opportunities and other geometric ideas including right triangle trigonometry in real-world contexts provides a means of building understanding of these concepts and is a powerful tool for solving problems related to the physical world in which we live
35 Choose trigonometric functions (sine and cosine) to model periodic phenomena with specified amplitude frequency and midline
36 Prove the Pythagorean identity sin2 (θ) + cos2 (θ) = 1 and use it to calculate trigonometric ratios
37 Derive and apply the formula A = frac12middotabmiddotsin(C) for the area of a triangle by drawing an auxiliary line from a vertex perpendicular to the opposite side extending the domain of sine to include right and obtuse angles
Algebra II with Statistics
148 2019 Alabama Course of Study Mathematics
38 Derive and apply the Law of Sines and the Law of Cosines to find unknown measurements in right and non-right triangles Extend the domain of sine and cosine to include right and obtuse angles Examples surveying problems resultant forces
149 2019 Alabama Course of Study Mathematics
Mathematical Modeling Overview
Mathematical Modeling is a newly-designed specialized mathematics course developed to expand on and reinforce the concepts introduced in Geometry with Data Analysis Algebra I with Probability and Algebra II with Statistics by applying them in the context of mathematical modeling to represent and analyze data and make predictions regarding real-world phenomena Mathematical Modeling is designed to engage students in doing thinking about and discussing mathematics statistics and modeling in everyday life It allows students to experience mathematics and its applications in a variety of ways that promote financial literacy and data-based decision-making skills This course also provides a solid foundation for students who are entering a range of fields involving quantitative reasoning whether or not they require calculus In this course students explore decision-making for financial planning and management design in three dimensions interpreting statistical studies and creating functions to model change in the environment and society Measurements are taken from the real world and technology is used extensively for computation with an emphasis on studentsrsquo interpretation and explanation of results in context Students will develop and use both the Mathematical Modeling Cycle and the Statistical Problem-Solving Cycle found in Appendix E in this specialized course to further develop authentic decision-making skills It is essential for students to use technology and other mathematical tools such as graphing calculators online graphing software and spreadsheets to explore application-based real-world problems to develop their mathematical decision-making skills and to increase precision in complex calculations throughout the mathematical modeling process The eight Student Mathematical Practices listed in the chart below represent what students are doing as they learn mathematics Students should regularly engage in these processes and proficiencies at every level throughout their mathematical studies Proficiency with these practices is critical in using mathematics both in the classroom and in everyday life The Student Mathematical Practices are standards to be incorporated across all grades
Student Mathematical Practices 1 Make sense of problems and persevere in solving them 5 Use appropriate tools strategically 2 Reason abstractly and quantitatively 6 Attend to precision 3 Construct viable arguments and critique the reasoning of others 7 Look for and make use of structure 4 Model with mathematics 8 Look for and express regularity in repeated reasoning
The standards in this course extend beyond the essential concepts described in the overview The standards indicating what students should know or be able to do are listed in the right columns of the content area tables below Important topics within these content areas are described in the left columns
Mathematical Modeling
150 2019 Alabama Course of Study Mathematics
Mathematical Modeling Content Standards Each content standard completes the stem ldquoStudents willhelliprdquo Modeling Mathematical modeling and statistical problem-solving are extensive cyclical processes that can be used to answer significant real-world problems
1 Use the full Mathematical Modeling Cycle or Statistical Problem-Solving Cycle to answer a real-world problem of particular student interest incorporating standards from across the course Examples Use a mathematical model to design a three-dimensional structure and determine whether particular design constraints are met to decide under what conditions the purchase of an electric vehicle will save money to predict the extent to which the level of the ocean will rise due to the melting polar ice caps or to interpret the claims of a statistical study regarding the economy
Financial Planning and Management Mathematical models involving growth and decay are useful in solving real-world problems involving borrowing and investing spreadsheets are a frequently-used and powerful tool to assist with modeling financial situations
2 Use elements of the Mathematical Modeling Cycle to solve real-world problems involving finances
3 Organize and display financial information using arithmetic sequences to represent simple interest and straight-line depreciation
4 Organize and display financial information using geometric sequences to represent compound interest and proportional depreciation including periodic (yearly monthly weekly) and continuous compounding a Explain the relationship between annual percentage yield (APY) and annual
percentage rate (APR) as values for r in the formulas A=P(1+r)t and A=Pert
5 Compare simple and compound interest and straight-line and proportional depreciation
6 Investigate growth and reduction of credit card debt using spreadsheets including variables such as beginning balance payment structures credits interest rates new purchases finance charges and fees
Mathematical Modeling
151 2019 Alabama Course of Study Mathematics
7 Compare and contrast housing finance options including renting leasing to purchase purchasing with a mortgage and purchasing with cash a Research and evaluate various mortgage products available to consumers b Compare monthly mortgage payments for different terms interest rates and down
payments c Analyze the financial consequence of buying a home (mortgage payments vs
potentially increasing resale value) versus investing the money saved when renting assuming that renting is the less expensive option
8 Investigate the advantages and disadvantages of various means of paying for an automobile including leasing purchasing by cash and purchasing by loan
Design in Three Dimensions Two- and three-dimensional representations coordinates systems geometric transformations and scale models are useful tools in planning designing and constructing solutions to real-world problems
9 Use the Mathematical Modeling Cycle to solve real-world problems involving the design of three-dimensional objects
10 Construct a two-dimensional visual representation of a three-dimensional object or structure a Determine the level of precision and the appropriate tools for taking the measurements
in constructing a two-dimensional visual representation of a three-dimensional object or structure
b Create an elevation drawing to represent a given solid structure using technology where appropriate
c Determine which measurements cannot be taken directly and must be calculated based on other measurements when constructing a two-dimensional visual representation of a three-dimensional object or structure
d Determine an appropriate means to visually represent an object or structure such as drawings on paper or graphics on computer screens
Mathematical Modeling
152 2019 Alabama Course of Study Mathematics
11 Plot coordinates on a three-dimensional Cartesian coordinate system and use relationships between coordinates to solve design problems a Describe the features of a three-dimensional Cartesian coordinate system and use them
to graph points b Graph a point in space as the vertex of a right prism drawn in the appropriate octant
with edges along the x y and z axes c Find the distance between two objects in space given the coordinates of each
Examples Determine whether two aircraft are flying far enough apart to be safe find how long a zipline cable would need to be to connect two platforms at different heights on two trees
d Find the midpoint between two objects in space given the coordinates of each Example If two asteroids in space are traveling toward each other at the same speed find where they will collide
12 Use technology and other tools to explore the results of simple transformations using three-dimensional coordinates including translations in the x y andor z directions rotations of 90ordm 180ordm or 270ordm about the x y and z axes reflections over the xy yz and xy planes and dilations from the origin Example Given the coordinates of the corners of a room in a house find the coordinates of the same room facing a different direction
13 Create a scale model of a complex three-dimensional structure based on observed measurements and indirect measurements using translations reflections rotations and dilations of its components Example Develop a plan for a bridge structure using geometric properties of its parts to determine unknown measures and represent the plan in three dimensions
Mathematical Modeling
153 2019 Alabama Course of Study Mathematics
Creating Functions to Model Change in the Environment and Society Functions can be used to represent general trends in conditions that change over time and to predict future conditions based on present observations
14 Use elements of the Mathematical Modeling Cycle to make predictions based on measurements that change over time including motion growth decay and cycling
15 Use regression with statistical graphing technology to determine an equation that best fits a
set of bivariate data including nonlinear patterns Examples global temperatures stock market values hours of daylight animal population carbon dating measurements online streaming viewership a Create a scatter plot with a sufficient number of data points to predict a pattern b Describe the overall relationship between two quantitative variables (increase
decrease linearity concavity extrema inflection) or pattern of change c Make a prediction based upon patterns
16 Create a linear representation of non-linear data and interpret solutions using technology
and the process of linearization with logarithms
Modeling to Interpret Statistical Studies Statistical studies allow a conclusion to be drawn about a population that is too large to survey completely or about cause and effect in an experiment
17 Use the Statistical Problem Solving Cycle to answer real-world questions
18 Construct a probability distribution based on empirical observations of a variable Example Record the number of student absences in class each day and find the
probability that each number of students will be absent on any future day a Estimate the probability of each value for a random variable based on empirical
observations or simulations using technology b Represent a probability distribution by a relative frequency histogram andor a
cumulative relative frequency graph c Find the mean standard deviation median and interquartile range of a probability
distribution and make long-term predictions about future possibilities Determine which measures are most appropriate based upon the shape of the distribution
Mathematical Modeling
154 2019 Alabama Course of Study Mathematics
19 Construct a sampling distribution for a random event or random sample Examples How many times do we expect a fair coin to come up ldquoheadsrdquo in 100 flips and on average how far away from this expected value do we expect to be on a specific set of flips What do we expect to be the average height for a random sample of students in a local high school given the mean and standard deviation of the heights of all students in the high school a Use the binomial theorem to construct the sampling distribution for the number of
successes in a binary event or the number of positive responses to a yesno question in a random sample
b Use the normal approximation of a proportion from a random event or sample when conditions are met
c Use the central limit theorem to construct a normal sampling distribution for the sample mean when conditions are met
d Find the long-term probability of a given range of outcomes from a random event or random sample
20 Perform inference procedures based on the results of samples and experiments a Use a point estimator and margin of error to construct a confidence interval for a
proportion or mean b Interpret a confidence interval in context and use it to make strategic decisions
Example short-term and long-term budget projections for a business c Perform a significance test for null and alternative hypotheses d Interpret the significance level of a test in the context of error probabilities and use
the results to make strategic decisions Example How do you reduce the rate of human error on the floor of a manufacturing plant
21 Critique the validity of reported conclusions from statistical studies in terms of bias and random error probabilities
Mathematical Modeling
155 2019 Alabama Course of Study Mathematics
22 Conduct a randomized study on a topic of student interest (sample or experiment) and draw conclusions based upon the results Example Record the heights of thirty randomly selected students at your high school Construct a confidence interval to estimate the true average height of students at your high school Question whether or not this data provides significant evidence that your schoolrsquos average height is higher than the known national average and discuss error probabilities
156 2019 Alabama Course of Study Mathematics
Applications of Finite Mathematics Overview
Applications of Finite Mathematics is a newly-designed specialized course developed for inclusion in the 2019 Alabama Course of Study Mathematics Applications of Finite Mathematics was developed as a fourth-year course that extends beyond the three years of essential content that is required for all high school students Applications of Finite Mathematics provides students with the opportunity to explore mathematics concepts related to discrete mathematics and their application to computer science and other fields Students who are interested in postsecondary programs of study that do not require calculus (such as elementary and early childhood education English history art music and technical and trade certifications) would benefit from choosing Applications of Finite Mathematics as their fourth high school mathematics credit It may also be a useful supplemental course for students pursuing a career in computer science This course is an important non-calculus option that presents mathematics as relevant and meaningful in everyday life Its objective is to help students experience the usefulness of mathematics in solving problems that are frequently encountered in todayrsquos complex society Finite mathematics includes areas of study that are critical to the fast-paced growth of a technologically advancing world The wide range of topics in Applications of Finite Mathematics includes logic counting methods information processing graph theory election theory and fair division with an emphasis on relevance to real-world problems Logic includes recognizing and developing logical arguments and using principles of logic to solve problems Students are encouraged to use a variety of approaches and representations to make sense of advanced counting problems then develop formulas that can be used to explain patterns Applications in graph theory allow students to use mathematical structures to represent real world problems and make informed decisions Election theory and fair division applications also engage students in democratic decision-making so that they recognize the power of mathematics in shaping society Applications of Finite Mathematics exhibits tremendous diversity with respect to both content and approach Teachers are encouraged to engage students using an investigative approach to instruction including the Student Mathematical Practices Students should be given opportunities to engage in learning and decision-making with technology and hands-on tools The eight Student Mathematical Practices listed in the chart below represent what students are doing as they learn mathematics Students should regularly engage in these processes and proficiencies at every level throughout their mathematical studies Proficiency with these practices is critical in using mathematics both in the classroom and in everyday life The Student Mathematical Practices are standards to be incorporated across all grades
Applications of Finite Mathematics
157 2019 Alabama Course of Study Mathematics
Student Mathematical Practices
1 Make sense of problems and persevere in solving them 5 Use appropriate tools strategically 2 Reason abstractly and quantitatively 6 Attend to precision 3 Construct viable arguments and critique the reasoning of others 7 Look for and make use of structure 4 Model with mathematics 8 Look for and express regularity in repeated reasoning
The standards in this course extend beyond the essential concepts described in the overview for high school The standards indicating what students should know or be able to do are listed in the right columns of tables below organized by relevant content areas
Applications of Finite Mathematics Content Standards Each numbered standard completes the sentence stem ldquoStudents willhelliprdquo Logical Reasoning The validity of a statement or argument can be determined using the models and language of first order logic
1 Represent logic statements in words with symbols and in truth tables including conditional biconditional converse inverse contrapositive and quantified statements
2 Represent logic operations such as and or not nor and x or (exclusive or) in words with symbols and in truth tables
3 Use truth tables to solve application-based logic problems and determine the truth value of simple and compound statements including negations and implications a Determine whether statements are equivalent and construct equivalent statements Example Show that the contrapositive of a statement is its logical equivalent
4 Determine whether a logical argument is valid or invalid using laws of logic such as the law of syllogism and the law of detachment a Determine whether a logical argument is a tautology or a contradiction
5 Prove a statement indirectly by proving the contrapositive of the statement
Applications of Finite Mathematics
158 2019 Alabama Course of Study Mathematics
Advanced Counting Complex counting problems can be solved efficiently using a variety of techniques
6 Use multiple representations and methods for counting objects and developing more efficient counting techniques Note Representations and methods may include tree diagrams lists manipulatives overcounting methods recursive patterns and explicit formulas
7 Develop and use the Fundamental Counting Principle for counting independent and dependent events a Use various counting models (including tree diagrams and lists) to identify the
distinguishing factors of a context in which the Fundamental Counting Principle can be applied Example Apply the Fundamental Counting Principle in a context that can be represented by a tree diagram in which there are the same number of branches from each node at each level of the tree
8 Using application-based problems develop formulas for permutations combinations and
combinations with repetition and compare student-derived formulas to standard representations of the formulas Example If there are r objects chosen from n objects then the number of permutations can be found by the product [n(n-1) hellip (n-r)(n-r+1)] as compared to the standard formula n(n-r) a Identify differences between applications of combinations and permutations b Using application-based problems calculate the number of permutations of a set with n
elements Calculate the number of permutations of r elements taken from a set of n elements
c Using application-based problems calculate the number of subsets of size r that can be chosen from a set of n elements explaining this number as the number of combinations ldquon choose rrdquo
d Using application-based problems calculate the number of combinations with repetitions of r elements from a set of n elements as ldquo(n + r ndash 1) choose rrdquo
9 Use various counting techniques to determine probabilities of events
10 Use the Pigeonhole Principle to solve counting problems
Applications of Finite Mathematics
159 2019 Alabama Course of Study Mathematics
Recursion Recursion is a method of problem solving where a given relation or routine operation is repeatedly applied
11 Find patterns in application problems involving series and sequences and develop recursive and explicit formulas as models to understand and describe sequential change Examples fractals population growth
12 Determine characteristics of sequences including the Fibonacci Sequence the triangular numbers and pentagonal numbers Example Write a sequence of the first 10 triangular numbers and hypothesize a formula to find the nth triangular number
13 Use the recursive process and difference equations to create fractals population growth models sequences and series
14 Use mathematical induction to prove statements involving the positive integers Examples Prove that 3 divides 22n ndash 1 for all positive integers n prove that 1 + 2 + 3 + + n = n(n + 1)2 prove that a given recursive sequence has a closed form expression
15 Develop and apply connections between Pascalrsquos Triangle and combinations
Networks Complex problems can be modeled using vertex and edge graphs and characteristics of the different structures are used to find solutions
16 Use vertex and edge graphs to model mathematical situations involving networks a Identify properties of simple graphs complete graphs bipartite graphs complete bipartite
graphs and trees
Applications of Finite Mathematics
160 2019 Alabama Course of Study Mathematics
17 Solve problems involving networks through investigation and application of existence and nonexistence of Euler paths Euler circuits Hamilton paths and Hamilton circuits Note Real-world contexts modeled by graphs may include roads or communication networks Example show why a 5x5 grid has no Hamilton circuit a Develop optimal solutions of application-based problems using existing and student-
created algorithms b Give an argument for graph properties
Example Explain why a graph has a Euler cycle if and only if the graph is connected and every vertex has even degree Show that any tree with n vertices has n ndash 1 edges
18 Apply algorithms relating to minimum weight spanning trees networks flows and Steiner trees Example traveling salesman problem a Use shortest path techniques to find optimal shipping routes b Show that every connected graph has a minimal spanning tree c Use Kruskalrsquos Algorithm and Primrsquos Algorithm to determine the minimal spanning tree
of a weighted graph
19 Use vertex-coloring edge-coloring and matching techniques to solve application-based problems involving conflict Examples Use graph-coloring techniques to color a map of the western states of the United States so that no adjacent states are the same color determining the minimum number of colors needed and why no fewer colors may be used use vertex colorings to determine the minimum number of zoo enclosures needed to house ten animals given their cohabitation constraints use vertex colorings to develop a time table for scenarios such as scheduling club meetings or for housing hazardous chemicals that cannot all be safely stored together in warehouses
20 Determine the minimum time to complete a project using algorithms to schedule tasks in
order including critical path analysis the list-processing algorithm and student-created algorithms
21 Use the adjacency matrix of a graph to determine the number of walks of length n in a graph
Applications of Finite Mathematics
161 2019 Alabama Course of Study Mathematics
Fairness and Democracy Various methods for determining a winner in a voting system can result in paradoxes or other issues of fairness
22 Analyze advantages and disadvantages of different types of ballot voting systems a Identify impacts of using a preferential ballot voting system and compare it to single
candidate voting and other voting systems b Analyze the impact of legal and cultural features of political systems on the mathematical
aspects of elections Examples mathematical disadvantages of third parties the cost of run-off elections
23 Apply a variety of methods for determining a winner using a preferential ballot voting system including plurality majority run-off with majority sequential run-off with majority Borda count pairwise comparison Condorcet and approval voting
24 Identify issues of fairness for different methods of determining a winner using a preferential voting ballot and other voting systems and identify paradoxes that can result Example Arrowrsquos Theorem
25 Use methods of weighted voting and identify issues of fairness related to weighted voting Example determine the power of voting bodies using the Banzhaf power index a Distinguish between weight and power in voting
Fair Division Methods used to solve non-trivial problems of division of objects often reveal issues of fairness
26 Explain and apply mathematical aspects of fair division with respect to classic problems of apportionment cake cutting and estate division Include applications in other contexts and modern situations
27 Identify and apply historic methods of apportionment for voting districts including Hamilton Jefferson Adams Webster and Huntington-Hill Identify issues of fairness and paradoxes that may result from methods Examples the Alabama paradox population paradox
Applications of Finite Mathematics
162 2019 Alabama Course of Study Mathematics
28 Use spreadsheets to examine apportionment methods in large problems Example apportion the 435 seats in the US House of Representatives using historically applied methods
Information Processing Effective systems for sending and receiving information include components that impact accuracy efficiency and security
29 Critically analyze issues related to information processing including accuracy efficiency and security
30 Apply ciphers (encryption and decryption algorithms) and cryptosystems for encrypting and decrypting including symmetric-key or public-key systems a Use modular arithmetic to apply RSA (Rivest-Shamir-Adleman) public-key
cryptosystems b Use matrices and their inverses to encode and decode messages
31 Apply error-detecting codes and error-correcting codes to determine accuracy of information
processing
32 Apply methods of data compression Example Huffman codes
163 2019 Alabama Course of Study Mathematics
Precalculus Overview
Precalculus is designed for students who intend to pursue a career in science technology engineering or mathematics (STEM) that requires the study of calculus It prepares students for calculus at the postsecondary level or AP Calculus at the high school level Students must successfully complete Algebra II with Statistics before enrolling in Precalculus Precalculus builds on the study of algebra and functions in Algebra II with Statistics adding rational functions all trigonometric functions and general piecewise-defined functions to the families of functions considered In addition to focusing on the families of functions Precalculus takes a deeper look at functions as a system including composition of functions and inverses Precalculus also expands on the study of trigonometry in previous courses and considers vectors and their operations Other topics such as statistics that are frequently added to precalculus courses are not included because the coursersquos primary focus is preparing students for the study of calculus In particular a focus on mathematical modeling is included across the course see Appendix E for more information on the Mathematical Modeling Cycle Studentsrsquo use of technology (such as graphing calculators online graphing software and spreadsheets) is essential in exploring the functions and equations addressed in Precalculus The eight Student Mathematical Practices listed in the chart below represent what students are doing as they learn mathematics Students should regularly engage in these processes and proficiencies at every level throughout their mathematical studies Proficiency with these practices is critical in using mathematics both within the classroom and in life The Student Mathematical Practices are standards to be incorporated across all grades
Student Mathematical Practices
1 Make sense of problems and persevere in solving them 5 Use appropriate tools strategically 2 Reason abstractly and quantitatively 6 Attend to precision 3 Construct viable arguments and critique the reasoning of others 7 Look for and make use of structure 4 Model with mathematics 8 Look for and express regularity in repeated reasoning
The standards in this course extend beyond the essential concepts described in the overview The standards indicating what students should know or be able to do are listed in the right columns of the content area tables Important concepts within these content areas are described in the left columns and focus areas within the tables are indicated Only those focus areas which are appropriate for this course are included Statements in bold print indicate the scope of the standard and align the standard to related content in other courses The full scope of every standard should be addressed during instruction
Precalculus
164 2019 Alabama Course of Study Mathematics
Precalculus Content Standards Each numbered standard completes the stem ldquoStudents willhelliprdquo
Number and Quantity The Complex Number System Perform arithmetic operations with complex numbers
1 Define the constant e in a variety of contexts Example the total interest earned if a 100 annual rate is continuously compounded a Explore the behavior of the function y=ex and its applications b Explore the behavior of ln(x) the logarithmic function with base e and its
applications
2 Find the conjugate of a complex number use conjugates to find moduli and quotients of complex numbers
Represent complex numbers and their operations on the complex plane
3 Represent complex numbers on the complex plane in rectangular and polar form (including real and imaginary numbers) and explain why the rectangular and polar forms of a given complex number represent the same number
4 Represent addition subtraction multiplication and conjugation of complex numbers geometrically on the complex plane use properties of this representation for computation Example (minus1 + radic3119894119894)3 = 8 because (minus1 + radic3119894119894) has modulus 2 and argument 120deg
5 Calculate the distance between numbers in the complex plane as the modulus of the difference and the midpoint of a segment as the average of the numbers at its endpoints
Use complex numbers in polynomial identities and equations
6 Analyze possible zeros for a polynomial function over the complex numbers by applying the Fundamental Theorem of Algebra using a graph of the function or factoring with algebraic identities
Precalculus
165 2019 Alabama Course of Study Mathematics
Limits Understand limits of functions 7 Determine numerically algebraically and graphically the limits of functions at
specific values and at infinity a Apply limits of functions at specific values and at infinity in problems
involving convergence and divergence
Vector and Matrix Quantities Represent and model with vector quantities 8 Explain that vector quantities have both magnitude and direction Represent vector
quantities by directed line segments and use appropriate symbols for vectors and their magnitudes Examples v |v| ||v|| v
9 Find the components of a vector by subtracting the coordinates of an initial point from the coordinates of a terminal point
10 Solve problems involving velocity and other quantities that can be represented by vectors
11 Find the scalar (dot) product of two vectors as the sum of the products of corresponding components and explain its relationship to the cosine of the angle formed by two vectors
Precalculus
166 2019 Alabama Course of Study Mathematics
Perform operations on vectors 12 Add and subtract vectors a Add vectors end-to-end component-wise and by the parallelogram rule
understanding that the magnitude of a sum of two vectors is not always the sum of the magnitudes
b Given two vectors in magnitude and direction form determine the magnitude and direction of their sum
c Explain vector subtraction v ndash w as v + (ndashw) where ndashw is the additive inverse of w with the same magnitude as w and pointing in the opposite direction Represent vector subtraction graphically by connecting the tips in the appropriate order and perform vector subtraction component-wise
13 Multiply a vector by a scalar a Represent scalar multiplication graphically by scaling vectors and possibly
reversing their direction perform scalar multiplication component-wise Example c(vx vy) = (cvx cvy)
b Compute the magnitude of a scalar multiple cv using ||cv|| = |c|v Compute the direction of cv knowing that when |c|v ne 0 the direction of cv is either along v (for c gt 0) or against v (for c lt 0)
14 Multiply a vector (regarded as a matrix with one column) by a matrix of suitable dimensions to produce another vector Work with matrices as transformations of vectors
Algebra Seeing Structure in Expressions Write expressions in equivalent forms to solve problems
15 Derive the formula for the sum of a finite geometric series (when the common ratio is not 1) and use the formula to solve problems extending to infinite geometric series Examples calculate mortgage payments determine the long-term level of medication if a patient takes 50 mg of a medication every 4 hours while 70 of the medication is filtered out of the patientrsquos blood
Precalculus
167 2019 Alabama Course of Study Mathematics
Arithmetic With Polynomials and Rational Expressions Understand the relationship between zeros and factors of polynomials
16 Derive and apply the Remainder Theorem For a polynomial p(x) and a number a the remainder on division by x ndash a is p(a) so p(a) = 0 if and only if (x ndash a) is a factor of p(x)
Use polynomial identities to solve problems
17 Know and apply the Binomial Theorem for the expansion of (x + y)n in powers of x and y for a positive integer n where x and y are any numbers
Rewrite rational expressions 18 Rewrite simple rational expressions in different forms write a(x)b(x) in the form q(x) + r(x)b(x) where a(x) b(x) q(x) and r(x) are polynomials with the degree of r(x) less than the degree of b(x) using inspection long division or for the more complicated cases a computer algebra system
19 Add subtract multiply and divide rational expressions a Explain why rational expressions form a system analogous to the rational
numbers which is closed under addition subtraction multiplication and division by a non-zero rational expression
Reasoning With Equations and Inequalities Understand solving equations as a process of reasoning and explain the reasoning
20 Explain each step in solving an equation as following from the equality of numbers asserted at the previous step starting from the assumption that the original equation has a clear-cut solution Construct a viable argument to justify a solution method Include equations that may involve linear quadratic polynomial exponential logarithmic absolute value radical rational piecewise and trigonometric functions and their inverses
21 Solve simple rational equations in one variable and give examples showing how extraneous solutions may arise
Solve systems of equations 22 Represent a system of linear equations as a single matrix equation in a vector variable
23 Find the inverse of a matrix if it exists and use it to solve systems of linear equations (using technology for matrices of dimension 3 x 3 or greater)
Precalculus
168 2019 Alabama Course of Study Mathematics
Functions Interpreting Functions Interpret functions that arise in applications in terms of the context
24 Compare and contrast families of functions and their representations algebraically graphically numerically and verbally in terms of their key features Note Key features include intercepts intervals where the function is increasing decreasing positive or negative maximums and minimums symmetries (including even and odd) end behavior asymptotes and periodicity Families of functions include but are not limited to linear quadratic polynomial exponential logarithmic absolute value radical rational piecewise trigonometric and their inverses
25 Calculate and interpret the average rate of change of a function (presented symbolically or as a table) over a specified interval Estimate the rate of change from a graph Extend from polynomial exponential logarithmic and radical to rational and all trigonometric functions
a Find the difference quotient 119891119891(119909119909+∆119909119909)minus119891119891(119909119909)∆119909119909
of a function and use it to evaluate the average rate of change at a point
b Explore how the average rate of change of a function over an interval (presented symbolically or as a table) can be used to approximate the instantaneous rate of change at a point as the interval decreases
Analyze functions using different representations
26 Graph functions expressed symbolically and show key features of the graph by hand and using technology Use the equation of functions to identify key features in order to generate a graph a Graph rational functions identifying zeros and asymptotes when suitable
factorizations are available and showing end behavior b Graph trigonometric functions and their inverses showing period midline
amplitude and phase shift
Precalculus
169 2019 Alabama Course of Study Mathematics
Building Functions Build a function that models a relationship between two quantities
27 Compose functions Extend to polynomial trigonometric radical and rational functions Example If T(y) is the temperature in the atmosphere as a function of height and h(t) is the height of a weather balloon as a function of time then T(h(t)) is the temperature at the location of the weather balloon as a function of time
Build new functions from existing functions
28 Find inverse functions a Given that a function has an inverse write an expression for the inverse of the
function Example Given f(x) = 2 x3 or f(x) = (x + 1)(x ndash 1) for x ne 1 find f-1(x)
b Verify by composition that one function is the inverse of another c Read values of an inverse function from a graph or a table given that the
function has an inverse d Produce an invertible function from a non-invertible function by restricting
the domain
29 Use the inverse relationship between exponents and logarithms to solve problems involving logarithms and exponents Extend from logarithms with base 2 and 10 to a base of e
30 Identify the effect on the graph of replacing 119891119891(119909119909) by 119891119891(119909119909) + 119896119896119896119896 middot 119891119891(119909119909) 119891119891(119896119896 middot 119909119909) and 119891119891(119909119909 + 119896119896) for specific values of k (both positive and negative) find the value of k given the graphs Extend the analysis to include all trigonometric rational and general piecewise-defined functions with and without technology Example Describe the sequence of transformations that will relate y=sin(x) and y=2sin(3x)
Precalculus
170 2019 Alabama Course of Study Mathematics
31 Graph conic sections from second-degree equations extending from circles and parabolas to ellipses and hyperbolas using technology to discover patterns a Graph conic sections given their standard form
Example The graph of 1199091199092
9+ (119910119910minus3)2
4= 1 will be an ellipse centered at (03)
with major axis 3 and minor axis 2 while the graph of 1199091199092
9minus (119910119910minus3)2
4= 1 will
be a hyperbola centered at (03) with asymptotes with slope plusmn32 b Identify the conic section that will be formed given its equation in general
form Example 5y2 minus 25x2 = minus25 will be a hyperbola
Trigonometric Functions Recognize attributes of trigonometric functions and solve problems involving trigonometry
32 Solve application-based problems involving parametric and polar equations a Graph parametric and polar equations b Convert parametric and polar equations to rectangular form
Extend the domain of trigonometric functions using the unit circle
33 Use special triangles to determine geometrically the values of sine cosine and tangent for π3 π4 and π6 and use the unit circle to express the values of sine cosine and tangent for π ndash x π + x and 2π ndash x in terms of their values for x where x is any real number
34 Use the unit circle to explain symmetry (odd and even) and periodicity of trigonometric functions
Model periodic phenomena with trigonometric functions
35 Demonstrate that restricting a trigonometric function to a domain on which it is always increasing or always decreasing allows its inverse to be constructed
36 Use inverse functions to solve trigonometric equations that arise in modeling contexts evaluate the solutions using technology and interpret them in terms of the context
Precalculus
171 2019 Alabama Course of Study Mathematics
Prove and apply trigonometric identities 37 Use trigonometric identities to solve problems a Use the Pythagorean identity sin2 (θ) + cos2(θ) = 1 to derive the other forms
of the identity Example 1 + cot2 (θ) = csc2 (θ)
b Use the angle sum formulas for sine cosine and tangent to derive the double angle formulas
c Use the Pythagorean and double angle identities to prove other simple identities
Appendix A
172 2019 Alabama Course of Study Mathematics
Mathematics Teaching Practices Supporting Equitable Mathematics Teaching
Mathematics Teaching Practices Equitable Teaching Establish mathematics goals to focus learning Effective teaching of mathematics establishes clear goals for the mathematics that students are learning situates goals within learning progressions and uses the goals to guide instructional decisions
Establish learning progressions that build studentsrsquo mathematical understanding increase their confidence and support their mathematical identities as doers of mathematics
Establish high expectations to ensure that each and every student has the opportunity to meet the mathematical goals
Establish classroom norms for participation that position each and every student as a competent mathematics thinker
Establish classroom environments that promote learning mathematics as just equitable and inclusive
Implement tasks that promote reasoning and problem solving Effective teaching of mathematics engages students in solving and discussing tasks that promote mathematical reasoning and problem solving and allow multiple entry points and varied solution strategies
Engage students in tasks that provide multiple pathways for success and that require reasoning problem solving and modeling thus enhancing each studentrsquos mathematical identity and sense of agency
Engage students in tasks that are culturally relevant Engage students in tasks that allow them to draw on their funds of knowledge (ie the
resources that students bring to the classroom including their home cultural and language experiences)
Use and connect mathematical representations Effective teaching of mathematics engages students in making connections among mathematical representations to deepen understanding of mathematics concepts and procedures and to use as tools for problem solving
Use multiple representations so that students draw on multiple resources of knowledge to position them as competent
Use multiple representations to draw on knowledge and experiences related to the resources that students bring to mathematics (culture contexts and experiences)
Use multiple representations to promote the creation and discussion of unique mathematical representations to position students as mathematically competent
Appendix A
173 2019 Alabama Course of Study Mathematics
Facilitate meaningful mathematical discourse Effective teaching of mathematics facilitates discourse among students to build shared understanding of mathematical ideas by analyzing and comparing students approaches and arguments
Use discourse to elicit studentsrsquo ideas and strategies and create space for students to interact with peers to value multiple contributions and diminish hierarchical status among students (ie perceptions of differences and ability to participate)
Use discourse to attend to ways in which students position one another as capable or not capable of doing mathematics
Make discourse an expected and natural part of mathematical thinking and reasoning providing students with the space and confidence to ask questions that enhance their own mathematical learning
Use discourse as a means to disrupt structures and language that marginalize students
Pose purposeful questions Effective teaching of mathematics uses purposeful questions to assess and advance studentsrsquo reasoning and sense-making about important mathematical ideas and relationships
Pose purposeful questions and then listen to and understand studentsrsquo thinking to signal to students that their thinking is valued and makes sense
Pose purposeful questions to assign competence to students Verbally mark studentsrsquo ideas as interesting or identify an important aspect of studentsrsquo strategies to position them as competent
Be mindful of the fact that the questions that a teacher asks a student and how the teacher follows up on the studentrsquos response can support the studentrsquos development of a positive mathematical identity and sense of agency as a thinker and doer of mathematics
Build procedural fluency from conceptual understanding Effective teaching of mathematics builds fluency with procedures on a foundation of conceptual understanding so that students over time become skillful in using procedures flexibly as they solve contextual and mathematical problems
Connect conceptual understanding with procedural fluency to help students make sense of the mathematics and develop a positive disposition toward mathematics
Connect conceptual understanding with procedural fluency to reduce mathematical anxiety and position students as mathematical knowers and doers
Connect conceptual understanding with procedural fluency to provide students with a wider range of options for entering a task and building mathematical meaning
Support productive struggle in learning mathematics Effective teaching of mathematics consistently provides students individually and collectively with opportunities and supports to engage in productive struggle as they grapple with mathematical ideas and relationships
Allow time for students to engage with mathematical ideas to support perseverance and identity development
Hold high expectations while offering just enough support and scaffolding to facilitate student progress on challenging work to communicate caring and confidence in students
Appendix A
174 2019 Alabama Course of Study Mathematics
Elicit and use evidence of student thinking Effective teaching of mathematics uses evidence of student thinking to assess progress toward mathematical understanding and to adjust instruction continually in ways that support and extend learning
Elicit student thinking and make use of it during a lesson to send positive messages about studentsrsquo mathematical identities
Make student thinking public and then choose to elevate a student to a more prominent position in the discussion by identifying his or her idea as worth exploring to cultivate a positive mathematical identity
Promote a classroom culture in which mistakes and errors are viewed as important reasoning opportunities to encourage a wider range of students to engage in mathematical discussions with their peers and the teacher
Appendix B
175 2019 Alabama Course of Study Mathematics
2019 Alabama Course of Study Mathematics Pathways
Appendix B depicts the pathways the 2019 Alabama Course of Study Mathematics provides for students in Alabama public schools Chart 1 shows the pathways through K-12 Mathematics Chart 2 shows how K-12 pathways extend to postsecondary study of mathematics supporting studentsrsquo progress toward their future goals Important decisions about which mathematics courses students will take should be made at the middle and high school levels
As shown in Chart 1 the high school program builds on studentsrsquo mathematical preparation in Grades 6-8 with a common pathway of three required courses taken by all students followed by additional specialized courses that prepare students for life after high school Three options are provided for completing the required courses
1 Complete Geometry with Data Analysis in Grade 9 Algebra I with Probability in Grade 10 and Algebra II with Statistics in Grade 11 followed by a specialized course in Grade 12
2 Complete accelerated courses for Mathematics Grade 7 and Mathematics Grade 8 that incorporate the standards from Algebra I with Probability with the standards of Mathematics Grade 7 and Mathematics Grade 8 Students who have shown adequate progress by the end of Geometry with Data Analysis in Grade 9 may move directly to Algebra II with Statistics in Grade 10 These students will be required to take two additional courses in Grades 11 and 12 to earn the mandatory four credits in mathematics since neither of the accelerated middle grades courses (nor their combination) is equivalent to a high school mathematics credit Taking additional specialized course(s) enables students to make additional progress towards their postsecondary goals
3 Complete Geometry with Data Analysis and Algebra I with Probability concurrently in Grade 9 and Algebra II with Statistics in Grade 10 These students should continue to take a mathematics course in both Grade 11 and Grade 12 therefore students would earn a fifth mathematics credit in Grade 12
Chart 1 also depicts mathematics lab courses to be offered by school districts to meet the needs of students struggling in the required courses These lab courses meet concurrently with the required content courses Lab courses might provide a review of prior knowledge needed for upcoming lessons reinforce content from previous lessons or preview upcoming content to ensure that students can fully participate in the required content classes Since these lab courses do not cover additional mathematical standards students can earn only an elective credit for each of them not a mathematics credit Care should be taken to ensure that informed choices based on solid data are made about which students are assigned to lab classes or other supports Assignment to lab courses should be fluid based on frequent scrutiny of student progress rather than being a foregone conclusion based on the support they have received in the past See further discussion in the Overview to the High School Standards
Chart 2 depicts the connections between K-8 mathematics the three required high school mathematics courses additional courses needed to earn four credits in mathematics and their connections to postsecondary study and use of mathematics in the workforce Following Algebra II with Statistics students will complete courses from the box entitled ldquoCourses for Fourth Mathematics Creditrdquo As noted above some students will need to complete two of these courses in order to earn the required four mathematics credits and any student may choose to complete additional courses
Appendix B
176 2019 Alabama Course of Study Mathematics
To earn the fourth mathematics credit students select one or more specialized courses that prepare them for future success in the postsecondary study of mathematics in careers and in their lifelong use and enjoyment of mathematics The specialized courses are designed to prepare students for credit-bearing postsecondary study of mathematics and other future mathematical needs as depicted in the block entitled ldquoExample Postsecondary Coursesrdquo Working backwards from a desired field of study or profession students can identify what their postsecondary needs may be and then determine which specialized courses might best prepare them to reach their future goals
Students requiring two credits of mathematics after Algebra II with Statistics have the opportunity to take any two of the three specialized mathematics courses in any order as their content does not substantially overlap In addition an AP Calculus course may be taken following Precalculus in school systems where it is offered
AP Statistics AP Computer Science and other ALSDE approved courses are extended courses that satisfy a fourth mathematics credit These courses will supplement studentsrsquo mathematical preparation in high school but are not designed to prepare students for their initial credit-bearing post-secondary course in mathematics Students who intend to pursue a technical field may consider taking an AP Computer Science or other approved computer science courses along with either Applications of Finite Mathematics or Mathematical Modeling Students who intend to pursue a field with extensive use of statistics may consider taking AP Statistics along with either Applications of Finite Mathematics or Mathematical Modeling While AP Statistics AP Computer Science and other ALSDE approved courses may satisfy a fourth mathematics credit it is recommended that one of the specialized courses also be completed to provide students with an adequate background for future mathematical endeavors The ALSDE has approved other options for a fourth mathematics credit including dual enrollment courses see Options for Mathematics Credit after Algebra II with Statistics at the end of Appendix B Given the impact these decisions may have on their future prospects students and their parents in consultation with school personnel should carefully consider the consequences of the different options and what options will best meet each studentrsquos needs Students should be encouraged to pursue a pathway that provides options beyond current considerations to accommodate the broadest range of future academic and career interests
Appendix B
177 2019 Alabama Course of Study Mathematics
Chart 1 Pathways through K-12 Mathematics
Appendix B
178 2019 Alabama Course of Study Mathematics
Chart 2 Pathways through K-12 Mathematics to Postsecondary
Appendix B
179 2019 Alabama Course of Study Mathematics
Options for Mathematics Credit After Algebra II with Statistics
1 Applications of Finite Mathematics 2 Mathematical Modeling 3 Precalculus 4 Credit-eligible Advanced Placement mathematics and computer science courses 5 Credit-eligible International Baccalaureate mathematics and computer science courses 6 Credit-eligible Career and Technical Education mathematics courses 7 ALSDE-approved computer science courses 8 ALSDE-approved dual enrollmentpostsecondary mathematics courses 9 ALSDE-approved locally-developed courses
School administrators school counselors classroom teachers school staff students and parents should always refer to the ALSDE Academic Guide for sample approved mathematics course pathways
Appendix C
180 2019 Alabama Course of Study Mathematics
Resources
Table 1 Student Mathematical Practices
1 Make sense of problems and persevere in solving them
Students canhellip Because teachers arehellip show patience and positive attitudes modeling patience and positive attitudes ask themselves if their answers make sense providing wait-time for processing and finding solutions use concrete objects or pictures to help conceptualize and solve a problem choosing and posing rich tasks with multiple entry points actively engage in problem-solving circulating to pose open-ended questions (also including assessing and
advancing questions) as they monitor student progress understand the approaches of others to solving complex problems modeling listening and speaking skills
2 Reason abstractly and quantitatively
Students canhellip Because teachers arehellip understand there are multiple ways to break apart the problem in order to find the solution
asking students to explain their thinking regardless of accuracy
use symbols pictures or other representations to describe the different sections of the problem allowing students to use context skills
accepting varied solutions and representations
explain their thinking facilitating discussion through guided questions and representations attend to the meaning of quantities and can use numbers flexibly by applying properties of operations and using objects
highlighting flexible use of numbers (Can be done through Math Talks or Number Talks)
ask themselves if their problem-solving and answers make sense providing wait-time for processing and finding solutions
Appendix C
181 2019 Alabama Course of Study Mathematics
3 Construct viable arguments and critique the reasoning of others
Students canhellip Because teachers arehellip justify their conclusions communicate them to others and respond to the arguments of others
aiming to create a common mathematical language that can be used to discuss and explain math as well as support or disagree with othersrsquo work
use appropriate math vocabulary while justifying their thinking intentionally using math vocabulary that is easily integrated into daily lesson plans in order for students to be able to communicate effectively (Whole school agreement on math vocabulary)
listen to the reasoning of others compare arguments and ask useful questions to clarify othersrsquo thinking
asking clarifying and probing questions
make reasonable guesses to explore their ideas providing opportunities for students to listen to the conclusions and arguments of others
establishing and facilitating a safe environment for rich discussion avoiding giving too much assistance (for example providing answers
procedures or too much explanation)
4 Model with mathematics
Students canhellip Because teachers arehellip apply the mathematics they know to solve problems arising in everyday life choosing real life situations for students because they know math does not
end at the classroom door reflect on whether the results make sense possibly improving the model if it does not serve its purpose
intentionally posing problems connected to previous concepts
model their thinking with objects pictures acting out numbers or words using purposeful and planned representations
5 Use appropriate tools strategically
Students canhellip Because teachers arehellip select and use tools strategically and flexibly then discuss what worked and what didnrsquot
choosing open-ended tasks that will require students to select math tools
detect possible errors by strategically using estimation and other mathematical knowledge
making appropriate tools available for learning
use technological tools and resources to solve problems and deepen understanding
using tools with instruction
providing students opportunities to use tools and see significance in real world situations
Appendix C
182 2019 Alabama Course of Study Mathematics
6 Attend to precision
Students canhellip Because teachers arehellip use clear definitions in discussion with others and in their own reasoning (This includes explaining their thinking using mathematics vocabulary)
modeling the importance of precision and exact answers in mathematics
speak and problem-solve paying attention to exactness and detail recognizing and modeling efficient strategies for computation give carefully explanations to each other including when they are confused using and challenging students to use mathematics vocabulary accurately
and consistently use appropriate symbols and specify units of measure
7 Look for and make use of structure
Students canhellip Because teachers arehellip use many different skills to determine the answer providing time for students to apply and discuss properties look closely to discern a pattern or structure asking questions about patterns adopt mental math strategies based on patterns highlighting different mental math strategies through Number Talks Math
Talks etc apply reasonable thoughts about patterns and properties to new situations
8 Look for and express regularity in repeated reasoning
Students canhellip Because teachers arehellip work on applying their mathematical reasoning to various situations and problems
providing tasks with patterns
continually check their work by asking themselves ldquoDoes this make senserdquo asking about answers before and reasonableness after computations look for shortcuts in patterns and repeated calculations
This project used work created by and adapted from the Departments of Education in Ohio North Carolina Georgia Kansas and resources created by Achieve the Core EngageNY Illustrative Mathematics NCTM and Howard County Public School System in Columbia MD
DRAFT
Appendix D
183 2019 Alabama Course of Study Mathematics
Resources for Grades 6 ndash 8 TABLE 1 PROPERTIES OF OPERATIONS
Here a b and c stand for arbitrary numbers in a given number system The properties of operations apply to the rational number system the real number system and the complex number system
Associative property of addition (a + b) + c = a + (b + c) Commutative property of addition a + b = b + a Additive identity property of 0 a + 0 = 0 + a = a Existence of additive inverses For every a there exists ndasha so that a + (ndasha) = (ndasha) + a = 0 Associative property of multiplication (a times b) times c = a times (b times c) Commutative property of multiplication a times b = b times a Multiplicative identity property of 1 a times 1 = 1 times a = a Existence of multiplicative inverses For every a ne 0 there exists 1a so that a times 1a = 1a times a = 1 Distributive property of multiplication over addition a times (b + c) = a times b + a times c
TABLE 2 PROPERTIES OF EQUALITY
Here a b and c stand for arbitrary numbers in the rational real or complex number systems Reflexive property of equality a = a Symmetric property of equality If a = b then b = a Transitive property of equality If a = b and b = c then a = c Addition property of equality If a = b then a + c = b + c Subtraction property of equality If a = b then a ndash c = b ndash c Multiplication property of equality If a = b then a times c = b times c Division property of equality If a = b and c ne 0 then a divide c = b divide c Substitution property of equality If a = b then b may be substituted for a in any expression
containing a
DRAFT
Appendix D
184 2019 Alabama Course of Study Mathematics
TABLE 3 PROPERTIES OF INEQUALITY Here a b and c stand for arbitrary numbers in the rational or real
number systems Exactly one of the following is true a lt b a = b a gt b If a gt b and b gt c then a gt c If a gt b then b lt a If a gt b then ndasha lt ndashb If a gt b then a plusmn c gt b plusmn c If a gt b and c gt 0 then a times c gt b times c If a gt b and c lt 0 then a times c lt b times c If a gt b and c gt 0 then a divide c gt b divide c If a gt b and c lt 0 then a divide c lt b divide c
DRAFT
Appendix D
185 2019 Alabama Course of Study Mathematics
Table 4 Functions
DRAFT
Appendix D
186 2019 Alabama Course of Study Mathematics
Table 5 Reference Page
Some Abbreviations Used in Formulas 11988711988711198871198872= bases of a trapezoid C = circumference SA = surface area b = base of a polygon r = radius V = volume h = height or altitude d = diameter B = area of a base l = length pi = 120587120587 asymp 314 S = sum of interior angles of a convex polygon w = width P = perimeter n = number of sides of a convex polygon A = area m = slope LA = lateral area
Formulas
Triangle 119860119860 = 12119887119887ℎ
Parallelogram 119860119860 = 119887119887ℎ Rectangle 119860119860 = 119897119897119897119897
Trapezoid 119860119860 = 12ℎ(1198871198871 + 1198871198872)
Slope 119898119898 = 1199101199102minus1199101199101
1199091199092minus1199091199091
Circle 119860119860 = 1205871205871199031199032 119862119862 = 120587120587120587120587 119862119862 = 2120587120587119903119903
Interest =principal x rate x time Sum of Measures of Interior Angles of Convex Polygon 119878119878 = 180(119899119899 minus 2) Pythagorean Theorem 1198881198882 = 1198861198862 + 1198871198872
Shape Surface Area Volume
Rectangular Prism LA = Ph
SA = Ph + 2B or SA = 2(wh + lh + lw)
V = Bh or
V = lwh
Cylinder LA = 2120587120587rh SA = 2120587120587rh + 2120587120587r2 V = 120587120587r2h
Square Pyramid NA V = 13Bh
Triangular Pyramid
NA V = 13Bh
Forms of Equations
Standard form of an equation of a line Ax + By = C Slope-intercept form of an equation of a line y = mx + b Point-slope form of an equation of a line y mdash y1 = m(x mdash x1)
Appendix E
187 2019 Alabama Course of Study Mathematics
Resources for Grades 9-12
Possible Pathways for Students Completing Grade 8 Mathematics
Before deciding on a pathway consider the following
Students have several options for high school mathematics even if they did not take accelerated mathematics in middle school The first pathway option (shaded blue) is for students who wish to earn four high school mathematics credits and do not want to take additional specialized courses However students who have the interest and motivation can still access additional specialized mathematics courses in high school by taking both Geometry with Data Analysis and Algebra I with Probability concurrently in Grade 9 These pathways are shaded yellow in the chart below Selecting this option does not exempt students from taking a mathematics course each year of high school All pathways are designed so that students take mathematics in each of the four years of high school
Students should be informed of the intended purpose of each specialized course in order to make appropriate decisions when choosing a pathway
Grade Suggested Possible Pathways
9 Geometry with Data Analysis Geometry with Data Analysis and Algebra I with Probability (concurrently)
Geometry with Data Analysis and Algebra I with Probability (concurrently)
10 Algebra I with Probability Algebra II with Statistics Algebra II with Statistics 11 Algebra II with Statistics Specialized Course Precalculus 12 Specialized Course Specialized Course (5th credit) AP Calculus (5th credit)
Required Courses Geometry with Data Analysis Algebra I with Probability Algebra II with Statistics
Specialized courses Applications of Finite Mathematics Mathematical Modeling Precalculus Specialized courses can be taken in any order after Algebra II with Statistics AP Calculus may be considered following Precalculus Extended courses such as AP Statistics and AP Computer Science may also be
considered for a credit following Algebra II with Statistics
Appendix E
188 2019 Alabama Course of Study Mathematics
Possible Pathways for Students Completing Grade 8 Accelerated Mathematics Before deciding on a pathway consider the following Students who have completed Grade 8 Accelerated Mathematics may or may not be ready to continue on an accelerated pathway The first two pathway options (shaded blue) are for students who are well prepared to continue on an accelerated pathway The last three pathway options (shaded yellow) are for students who need more experience with the content in Algebra I with Probability before moving on to Algebra II with Statistics Students may gain this experience by taking Geometry with Data Analysis and Algebra I with Probability concurrently in Grade 9 This option does not exempt students from taking a mathematics course each year of high school Thus all pathways are designed so that students take mathematics in each of the four years of high school Students should be aware of the intended purpose of each specialized course in order to make appropriate decisions when choosing a pathway
Grade Suggested Possible Pathways 9 Geometry with
Data Analysis Geometry with Data Analysis
Geometry with Data Analysis
Geometry with Data Analysis and Algebra I with Probability (concurrently)
Geometry with Data Analysis and Algebra I with Probability (concurrently)
10 Algebra II with Statistics
Algebra II with Statistics
Algebra I with Probability
Algebra II with Statistics Algebra II with Statistics
11 Specialized Course
Precalculus Algebra II with Statistics
Specialized Course Precalculus
12 Specialized Course
AP Calculus Specialized Course
Specialized Course (5th credit)
AP Calculus (5th credit)
Appendix E
189 2019 Alabama Course of Study Mathematics
The Mathematical Modeling Cycle Mathematical modeling ldquouses mathematics to answer big messy reality-based questionsrdquo (Bliss Levy Teague Giordano amp Garfunkel 2019 p 34) Modeling is a process that is often represented as a cycle where thoughts ideas and calculations can be reviewed and refined over time see figure below Mathematical modeling like real life is not composed of a series of predefined steps but must be navigated and reworked to determine the best results The use of this modeling process becomes inherently applicable to much more than mathematics When teaching students through modeling teachers equip their students to make decisions evaluate those decisions and revisit and revise their work and thus allow the student to experience the process for determining a solution that goes beyond the traditional prescribed steps Note Using models of mathematical ideas (such as manipulatives or graphs) is not the same as engaging in the Mathematical Modeling Cycle
Depiction of the Mathematical Modeling Cycle (Lai Teague amp Franklin 2019)
While aspects of mathematical modeling should be experienced at all levels of education as a way to apply the mathematics learned in school to daily life and for use as informed citizens in a global society by the time students reach the high school level they should be engaged in the full Mathematical Modeling Cycle Mathematical modeling involves problems that can be solved in a variety of ways to reach several valid solutions Mathematical modeling problems are either open-ended or open-middle type problems where students must make authentic decisions and choices in order to solve the problem Mathematical modeling is different from a traditional word problem in that it has more than one solution and involves choice To transform mathematics problems into mathematical modeling problems teachers must go beyond adding units to the variables as in traditional word problems Modeling problems must also require students to make meaning of the problem and provide students the opportunity to interpret and make decisions throughout the solution process
Appendix E
190 2019 Alabama Course of Study Mathematics
The basic modeling cycle is summarized in the diagram above It involves (1) defining the problem to be answered (2) making assumptions to simplify the situation identifying variables in the situation and selecting those that represent essential features in order to formulate a mathematical model (3) analyzing and performing operations to draw conclusions (4) assessing the model and solutions in terms of the original situation (5) refining and extending the model as needed and (6) reporting on the conclusions and the reasoning behind them The arrows among these steps suggest that one need not go through them in a set order and that one may repeat aspects of the cycle in order to improve the results obtained Choices assumptions and approximations are present throughout this cycle Teachers are encouraged to select or develop tasks using contexts that are familiar to students Teachers are also encouraged to anticipate student responses and pathways in order to support students when necessary Statistical Problem-Solving While mathematics focuses on drawing logical conclusions from a set of assumptions statistics involves understanding and analyzing the variability in a set of data This requires an adaptation of the mathematical modeling cycle into a related model of statistical problem-solving as depicted in the following diagram This cycle includes formulating a question designing a study collecting data analyzing the results interpreting and refining solutions and communicating interpretations and limitations The arrows among these steps suggest that one need not go through them in a set order and that one may repeat aspects of the cycle in order to improve the results obtained
Depiction of Statistical Problem Solving (Lai Teague amp Franklin 2019)
Appendix E
191 2019 Alabama Course of Study Mathematics
In summary both the Mathematical Modeling Cycle and Statistical Problem-Solving Cycle should be incorporated throughout the three required courses of high school mathematics including using aspects of the cycles as well as the full cycles to explore real-world contexts The specialized course Mathematical Modeling was created specifically to focus on both of these cycles in preparation for studentsrsquo future mathematical endeavors in careers and life Students will be able to experience the full mathematical modeling and statistical problem-solving cycles multiple times in varying contexts For more information on the Mathematical Modeling course see the standards for that course
Resources Bliss K Levy R Teague D Giordano F amp Garfunkel S (2019) Guidelines for Assessment and Instruction in Mathematical Modeling
Education (2nd Edition) Consortium for Mathematics and its Applications and Society for Industrial and Applied Mathematics Retrieved from httpswwwsiamorgpublicationsreportsdetailguidelines-for-assessment-and-instruction-in-mathematical-modeling-education
Lai Y Teague D amp Franklin C (2019) Process Parallels [digital image] Retrieved from httpsdrivegooglecomopenid=1lx81ZJisLiB-3MEj3RDLpih8VWBxxWZj
DRAFT
Appendix F
ALABAMA HIGH SCHOOL GRADUATION REQUIREMENTS
192 2019 Alabama Course of Study Mathematics
(Alabama Administrative Code 290-3-1-02(8) and (8)(a))
Effective for students in the ninth grade in the 2013-2014 school year all students shall earn the required credits for the Alabama High School Diploma A local board of education may establish requirements for receipt of diplomas and endorsements but any diploma or endorsement shall include the requirements of the Alabama High School Diploma The Alabama courses of study shall be followed in determining minimum required content in each discipline
COURSE REQUIREMENTS
English Language Arts
Four credits to include Credits English 9 1 English 10 1 English 11 1 English 12 1 Equivalent options may include Advanced PlacementInternational Baccalaureatepostsecondary equivalent courses
English Language Arts Total Credits 4
Mathematics
Three credits to include Credits Algebra I or its equivalent 1 Geometry or its equivalent 1 Algebra II wTrigonometry or Algebra II or its equivalent 1
One credit from Alabama Course of Study Mathematics or Career and Technical EducationAdvanced PlacementInternational Baccalaureatepostsecondary equivalent courses
1
Mathematics Total Credits 4
Science
Two credits to include Credits Biology 1 A physical science (Chemistry Physics Physical Science) 1
Two credits from Alabama Course of Study Science or Career and Technical EducationAdvanced PlacementInternational Baccalaureatepostsecondary equivalent courses 2
Science Total Credits 4
Social Studies
Four credits to include Credits World History 1 United States History I 1 United States History II 1 United States Government 05 Economics 05 Equivalent options may include Advanced PlacementInternational Baccalaureatepostsecondary equivalent courses
Social Studies Total Credits 4 Physical Education Lifelong Individualized Fitness Education (LIFE) 1 Health Education 05 Career Preparedness 1 Career and Technical Education andor Foreign Language andor Arts Education 3 Electives 25 Local boards shall offer foreign languages arts education physical education wellness education career and technical education and driver education as electives
Total Credits 24
Appendix G
193 2019 Alabama Course of Study Mathematics
GUIDELINES AND SUGGESTIONS FOR LOCAL TIME REQUIREMENTS AND HOMEWORK
Total Instructional Time The total instructional time of each school day in all schools and at all grade levels shall be not less than 6 hours or 360 minutes exclusive of lunch periods recess or time used for changing classes (Code of Alabama 1975 sect16-1-1) Suggested Time Allotments for Grades 1 - 6 The allocations below are based on considerations of a balanced educational program for Grades 1-6 Local school systems are encouraged to develop a general plan for scheduling that supports interdisciplinary instruction Remedial andor enrichment activities should be a part of the time scheduled for the specific subject area
Subject Area Grades 1-3 Grades 4-6
Language Arts 150 minutes daily 120 minutes daily
Mathematics 60 minutes daily 60 minutes daily
Science 30 minutes daily 45 minutes daily
Social Studies 30 minutes daily 45 minutes daily
Physical Education 30 minutes daily 30 minutes daily
Health 60 minutes weekly 60 minutes weekly
Technology Education (Computer Applications) 60 minutes weekly 60 minutes weekly
Character Education 10 minutes daily 10 minutes daily
Appendix G
194 2019 Alabama Course of Study Mathematics
Arts Education Dance Music Theatre Visual Arts
Daily instruction with certified arts specialists in each of the arts disciplines is the most desirable schedule However schools unable to provide daily arts instruction in each discipline are encouraged to schedule in Grades 1 through 3 two 30- to 45-minute arts instruction sessions per week and in Grades 4 through 6 a minimum of 60 minutes of instruction per week Interdisciplinary instruction within the regular classroom setting is encouraged as an alternative approach for scheduling time for arts instruction when certified arts specialists are not available
Established by the Alabama State Department of Education in accordance with Code of Alabama 1975 sect16-40-1 Established by the Alabama State Department of Education in accordance with Code of Alabama 1975 sect16-6B-2(h) Kindergarten In accordance with Alabama Administrative Code r 290-5-1-01(5) Minimum Standards for Organizing Kindergarten Programs in Alabama Schools the daily time schedule of the kindergartens shall be the same as the schedule of the elementary schools in the systems of which they are a part since kindergartens in Alabama operate as full-day programs There are no established time guidelines for individual subject areas for the kindergarten classroom The emphasis is on large blocks of time that allow children the opportunity to explore all areas of the curriculum in an unhurried manner It is suggested that the full-day kindergarten program be organized utilizing large blocks of time for large groups small groups center time lunch outdoor activities snacks transitions routines and afternoon review Individual exploration small-group interest activities interaction with peers and teachers manipulation of concrete materials and involvement in many other real-world experiences are needed to provide a balance in the kindergarten classroom Grades 7-12 One credit may be granted in Grades 9-12 for required or elective courses consisting of a minimum of 140 instructional hours or in which students demonstrate mastery of Alabama course of study content standards in one credit courses without specified instructional time (Alabama Administrative Code r 290-3-1-02 (9)(a)) In those schools where Grades 7 and 8 are housed with other elementary grades the school may choose the time requirements listed for Grades 4-6 or those listed for Grades 7-12
Appendix G
195 2019 Alabama Course of Study Mathematics
Character Education For all grades not less than 10 minutes instruction per day shall focus upon the studentsrsquo development of the following character traits courage patriotism citizenship honesty fairness respect for others kindness cooperation self-respect self-control courtesy compassion tolerance diligence generosity punctuality cleanliness cheerfulness school pride respect of the environment patience creativity sportsmanship loyalty and perseverance Homework Homework is an important component of every studentrsquos instructional program Students teachers and parents should have a clear understanding of the objectives to be accomplished through homework and the role it plays in meeting curriculum requirements Homework reflects practices that have been taught in the classroom and provides reinforcement and remediation for students It should be student-managed and the amount should be age-appropriate encouraging learning through problem-solving and practice At every grade level homework should be meaning-centered and mirror classroom activities and experiences Independent and collaborative projects that foster creativity problem-solving abilities and student responsibility are appropriate Parental support and supervision reinforce the quality of practice or product as well as skill development Each local board of education shall establish a policy on homework consistent with the Alabama State Board of Education resolution adopted February 23 1984 (Action Item F-2)
DRAFT
Bibliography
2019 Alabama Course of Study Mathematics 196
BIBLIOGRAPHY
Alabama Course of Study Mathematics Alabama State Department of Education 2009 Catalyzing Change in High School Mathematics Initiating Critical Conversations The National Council of Teachers of Mathematics 2018 Cross Christopher T et al editors Mathematics in Early Childhood Paths Toward Excellence and Equity Committee on Early Childhood
Mathematics National Research Council 2009 Gojak Linda M and Ruth Harbin Miles The Common Core Companion The Standards Decoded GR3-5 What They Say What They Mean How to Teach Them Corwin 2016
Kilpatrick Jeremy et al editors Adding It Up Helping Children Learn Mathematics Mathematics Learning Study Committee National Research Council 2001 doi10172269822
McGatha Maggie B et al Everything You Need for Mathematics Coaching Tools Plans and a Process That Works for Any Instructional Leader Corwin 2018
Principles and Standards for School Mathematics The National Council of Teachers of Mathematics 2000 Principles to Action Ensuring Mathematics Success for All The National Council of Teachers of Mathematics 2014 Revised Alabama Course of Study Mathematics Alabama State Department of Education 2016 United States Department of Education National Assessment Reviewing Board Draft Mathematics Assessment Framework for the 2025 National Assessment of Educational Progress wwwfederalregistergovdocuments201904262019-08393draft-mathematics-assessment-framework-for-the-2025-national-assessment-of-educational-progress Van de Walle John A et al Teaching Student-Centered Mathematics Developmentally Appropriate Instruction for Grades 3-5 Pearson 2018
Glossary
197 2019 Alabama Course of Study Mathematics
GLOSSARY
Absolute value The distance from a number to zero
Absolute value function See Appendix D Table 4
Acute angle An angle that measures between 0˚ and 90˚
Addend Any of the numbers added to find a sum
Addition and subtraction within 5 10 20 100 or 1000 Addition or subtraction of two whole numbers with whole number answers and with sum or minuend in the range 0-5 0-10 0-20 0-100 or 0-1000 respectively Example 8 + 2 = 10 is an addition within 10 14 ndash 5 = 9 is a subtraction within 20 and 55 ndash 18 = 37 is a subtraction within 100
Additive inverses Two numbers whose sum is 0 are additive inverses of one another Example 3
4 and minus3
4 are additive inverses of one another because 3
4+ minus3
4= 0
Adjacent angles Two angles that share a common vertex and a common side but do not share any interior points
Algorithm A process or set of rules for solving a problem
Amplitude The distance from the midline to the maximum or minimum value of a periodic function calculated as (maximum value - minimum value)2
Arc A section of a circle contained between two points
Area The measure of the interior of a two-dimensional figure (square units)
Area model A concrete model for multiplication or division made up of a rectangle The length and width represent the factors and the area represents the product Area models can also be used for multiplying and factoring polynomials and for completing the square
Arithmetic sequence A sequence in which the difference between two consecutive terms is constant
Glossary
198 2019 Alabama Course of Study Mathematics
Array A concrete model for multiplication in which items are arranged in rows and columns Each row (or column) represents the number of groups and each column (or row) represents the number of items in a group Example The array shown below represents 5 x 4 = 20 since there are 5 rows of 4 stars for a total of 20 stars It could also represent 4 x 5 = 20 since there are 4 columns of 5 stars for a total of 20 stars
Association (Data Analysis Statistics and Probability Grades 9-12) A relationship between two categorical variables in which a specific value of one variable is more likely to coincide with a specific value of another variable
Asymptote A line that a curve becomes arbitrarily close to as one of the coordinates of the curve approaches infinity
Automaticity The ability to perform mathematical operations accurately and quickly
Average See mean
Axis of symmetry A line that divides a function into two congruent parts so that points on one side of the line are a reflection of the points on the other side for all values of x f(x) = f(-x)
B (as in V=Bh) Area of the base of a three-dimensional figure
Benchmark number A number or numbers that help to estimate a value Examples 10 100 0 frac12 and 1
Bias (statistical bias) Using a sampling method that favors some outcomes over others so that it consistently overestimates or underestimates the true value
Bivariate data Set of paired values for two related variables Examples a personrsquos race and gender (both categorical) a personrsquos height and weight (both quantitative) or a personrsquos gender and height (categorical and quantitative)
Box-and-whisker plot (box plot) A method of visually displaying variation in a set of data values by using the median quartiles and extremes of the data set
Categorical data Variables with values that may be divided into groups Examples race gender educational level zip code
Categorical variable A variable whose possible values can be placed into groups and for which arithmetic (eg average) does not make sense
Glossary
199 2019 Alabama Course of Study Mathematics
Causation A change in one variable results in the change of another variable
Cavalierirsquos Principle A method for showing that two solids have the same volume by showing that areas of corresponding cross sections are equal
Center A value that represents a typical value or middle of a set of quantitative data such as mean or median
Center of a circle A point that is equidistant from all points on a circle in a plane
Chord A segment joining two points on a circle
Circle A set of points in a plane equidistant from a given point which is called the center
Circumscribed polygon A polygon whose sides are all tangent to a given circle The circle is said to be inscribed in the polygon
Closure If an operation is performed on two elements of a set the result is always an element of a set
Coefficient The numerical factor in a term that contains one or more variables Example In 2xy2 2 is the coefficient
Combination A way of selecting items from a set or collection such that the order of selection does not matter
Complementary angles Two angles whose measures have a sum of 90˚
Complex fraction A fraction AB where A andor B are fractions (where B is non-zero)
Complex number A number written in the form a + bi where a and b are real numbers and b is multiplied by the imaginary unit i
Compose To put together a number or shape using existing numbers or shapes
Composition The process of combining two functions in which one function is performed first and then its output is used as the input for the second function Conditional probability The probability of an event given that another event has occurred
Conditional relative frequency The ratio of a joint relative frequency to a related marginal relative frequency
Glossary
200 2019 Alabama Course of Study Mathematics
Confidence interval An interval combined with a probability statement that is used to express the degree of uncertainty associated with a sample statistic and that estimates where a population parameter will lie Example We are 95 confident that the mean salary of the population lies within $512 of the sample mean
Congruent figures Two plane or solid figures are congruent if one can be mapped to the other by a rigid motion (a sequence of rotations reflections and translations)
Conic section A figure formed by the intersection of a plane and a right circular cone Examples ellipse parabola or hyperbola
Conjugate An expression formed by changing the sign of the second term For numbers of the form a + bi where a and b are real numbers the conjugate is a - bi such that the product of the number and its conjugate is a2+b2
Constant A variable that has a fixed value
Constant function A function that has the same output for every input See Appendix D Table 4
Constraint A restriction on what solutions to a problem are valid
Continuous quantitative data Data items within a set that can take on any value within a range including non-integer values Example A personrsquos height or the length of a personrsquos foot
Coordinate plane (system) A two-dimensional system for locating points in the plane consisting of two number lines where the horizontal number line (x-axis) and vertical number line (y-axis) are perpendicular and intersect at a point (origin) Points are described by their relative locations on the two number lines
Correlation An association or relationship between two quantitative variables
Correlation coefficient A statistic (r) which measures the strength of the linear association between two quantitative variables Values range from -1 to 1 where 1 denotes a perfect positive relationship -1 a perfect negative relationship and 0 no relationship at all
Corresponding parts The sides angles and vertices of one figure that are mapped onto those of another figure using a geometric transformation
Counting on A strategy for finding the number of objects in a group without having to count every member of the group Example If a stack of books is known to have 8 books and 3 more books are added to the top it is not necessary to count the entire stack all over again One can find the total by counting onmdashpointing to the top book and saying ldquoeightrdquo following this with ldquonine ten eleven There are eleven books nowrdquo
Glossary
201 2019 Alabama Course of Study Mathematics
Cube root A cube root of x is the number that when multiplied by itself three times (or cubed) gives the number x Example 2 is the cube root of 8 because 23 = 222 = 8
Cubic function A polynomial function whose highest degree is 3 See Appendix D Table 4
Decimal number A quantity represented using base-10 notation using a decimal point to separate the whole number and fractional parts
Decompose To separate numbers or shapes into component or smaller parts
Denominator The divisor in a fraction or rational expression
Dependent events Two or more events in which the outcome of one is affected by the outcome(s) of the other(s)
Dependent variable A variable in an expression equation or function whose value is determined by the choice of the other variables
Descriptive statistics Values used to describe features of a univariate or bivariate quantitative data set Common statistics involve measures of center and measures of spread
Dilation A geometric transformation in which the image of each point lies along the line from a fixed center point through the given point where its distance is multiplied by a common scale factor Images of geometric figures using a dilation are similar to the given figures
Discrete quantitative data Data items within a set which can take on only a finite number of values Examples A personrsquos shoe size or rolling a die
Distribution A description of the relative number of times each possible outcome of a statistical variable occurs or will occur in a number of trials
Dividend a where a divide b = c
Divisor b where a divide b = c
Domain The set of inputs for a function or relation
Dot plot See line plot
Ellipse The set of all points in a two-dimensional plane where the sum of the distance from two distinct points (foci) is constant
Glossary
202 2019 Alabama Course of Study Mathematics
Empirical Rule A description of a normal distribution of data In a normal distribution almost all data will fall within three standard deviations of the mean Approximately 68 of the values lie within one standard deviation of the mean approximately 95 of the values lie within two standard deviations of the mean and approximately 997 lie within three standard deviations of the mean Also known as the 68-95-997 Rule
End behavior In a function the values the dependent variable approaches as the independent variable approaches either negative or positive infinity
Equation A mathematical relationship in which two expressions are equal
Equivalent expression Expressions that represent the same amount equations or inequalities that have the same solution set
Evaluate To determine or calculate the value of an expression once specific values have been substituted for each of the variables in the expression
Even function A function whose graph is symmetric with respect to the y-axis f(x) = f(-x) for all x
Event A set of possible outcomes of an experiment or study a subset of the sample space
Expanded form A multi-digit number written as a sum of single-digit multiples of powers of ten Example 643 = 600 + 40 + 3
Expected value For a random variable the weighted average of its possible values with weights given by their respective probabilities
Experiment A controlled study used to find the differences between groups subjected to different treatments
Experimental probability The number of occurrences of an event in a set of trials divided by the total number of trials Contrast to theoretical probability
Exponent The small number placed to the upper right of a base number indicating how many copies of the base number are multiplied together Example In 24 2 is the base number and 4 is the exponent
Exponential function A function in which the dependent variable is an exponent with a constant base See Appendix D Table 4
Exponential notation A general version of scientific notation in which the base does not have to be 10
Expression A mathematical phrase that combines numbers andor variables using mathematical operations Examples 3 x 6 4 + 7 x 3 8 2ℎ + 3119896119896
Extraneous solution A solution to an equation that emerges from the process of solving the problem but is not a valid solution to the original problem
Glossary
203 2019 Alabama Course of Study Mathematics
Factors of a number or expression Numbers or terms multiplied together to find a product Example a and b where a ⨉ b = c Where c is a whole number integer or polynomial a and b are often limited to whole numbers integers or polynomials respectively c is called the product
Fair share model (partitive division) A division model in which the total number of items and the number of groups is known and the number of items in each group is the unknown
Fibonacci Sequence A recurrence relation where successive terms are found by adding the two previous terms given that the first two terms are 0 and 1
Fluency The ability to use strategies andor procedures that are flexible efficient accurate and generalizable to answer mathematical questions
Fraction A number expressible in the form 119886119886119887119887 where a is a whole number and b is a positive whole number (The word fraction in these standards
always refers to a non-negative number) See also rational number
Frequency The number of cycles of a periodic function that occur within a given distance of the dependent variable the number of occurrences of a value in a distribution of discrete data
Frequency table A table that lists the frequency of each item in a distribution of discrete data In the lower grades tally marks may be used to record the number of times each item occurs
Function Relationship between two variables where each input (value of the independent variable) has a single output (value of the dependent variable)
Function notation Use of f(x) notation to define a function
Fundamental Counting Principle A way to figure out the total number of ways different events can occur (outcomes) in a probability problem If there are two independent events with m and n possible outcomes respectively then there are 119898119898 ∙ 119899119899 total possible outcomes for the two events together
Geometric sequence A sequence in which the ratio between two consecutive terms is constant
Geometric series The sums of the terms in a geometric sequence
Geometric transformation A function that maps all the points of the plane onto the plane
Greatest integer function A function that assigns each input value to the greatest integer that is less than that value See Appendix D Table 4
Glossary
204 2019 Alabama Course of Study Mathematics
Histogram A graphical display representing the frequency distribution of continuous numerical data where the data are grouped into bins Each bin represents a range of data
Hyperbola The set of all points in a two-dimensional plane where the difference of the distances from two distinct points (foci) is constant
Identity An equation that is true for all values of the variables
Identity function A function that assigns each input value to itself See Appendix D Table 4
Identity matrix A square matrix whose elements consist of ones along the diagonal (from upper right to lower left) and zeros everywhere else Multiplying any matrix by an identity matrix of the appropriate size will yield that same matrix
Identity property of 0 a + 0 = 0 + a = a for all a See Appendix D Table 1
Image A figure or set of points that results from a transformation
Imaginary number (complex number) The square root of a negative number The square root of negative 1 or radic(-1) is defined to be i See also complex number
Independence A lack of association between two categorical variables in which a specific value of one variable is equally likely to coincide with all values of the other variable
Independent events Two or more events in which the outcome of one is not affected by the outcome of the other(s)
Independent variable A variable in an expression equation or function whose value is freely chosen regardless of the value of the other quantities
Inequality A mathematical sentence that compares the order of two quantities greater than (gt) greater than or equal to (ge) less than (lt) less than or equal to (le)
Inference (statistical inference) Conclusions drawn based on data
Inferential statistics The mathematical science of using data collection and analysis to make predictions about a population based on a random sample or to draw conclusions of cause and effect based on a random assignment of treatments
Inscribed polygon A polygon whose vertices are all contained on a given circle The circle is said to be circumscribed about the polygon
Glossary
205 2019 Alabama Course of Study Mathematics
Integer Any of the natural numbers the negatives of these numbers or zero
Interquartile range A measure of variation in a set of numerical data The interquartile range is the distance between the first and third quartiles of the data set Example For the data set 1 3 6 7 10 12 14 15 22 120 the interquartile range is 15 ndash 6 = 9
Inverse function A function that ldquoundoesrdquo a given function mapping that functionrsquos outputs to its inputs
Inverse operations Operations that ldquoundordquo one another Example 5+4=9 and 9-4=5 demonstrating that subtraction is the inverse operation of addition
Irrational number A real number r such that there are no integers a and b (b ne 0) where r = a divide b (such as 120587120587)
Joint relative frequency The ratio of the frequency in a particular category and the total number of data values
Like terms Two or more terms that have the same variables and powers but possibly different coefficients Note any constant c can be written as 119888119888 ∙ 1199091199090 Thus all constants are like terms
Limit A value that a function approaches as the input approaches some number
Line plot A method of visually displaying a distribution of data values where each data value is shown as a dot or mark above a number line (also known as a dot plot)
Line segment Set of points between two endpoints A and B that lie on the line that contains A and B
Linear association A relationship between two quantitative variables that can be represented using a linear equation On a scatter plot the relationship can be represented by a line
Linear equation An equation of two linear expressions Linear equations including two variables can be represented by a line in the coordinate plane
Linear expression An expression whose terms each include at most one variable with degree one (raised to the first power) For example 2x + 7 or 3x + 4y ndash 11
Linear function A function whose output is determined by a linear expression A linear function can be represented by a line in the coordinate plane See Appendix D Table 4
Glossary
206 2019 Alabama Course of Study Mathematics
Logarithm The exponent to which a given base must be raised to yield a given value Example the logarithm of 1000 base 10 is 3 since 103=1000
Logarithmic function The inverse function of an exponential function
Magnitude of a vector The length of a vector
Marginal relative frequency The ratio of the sum of the joint relative frequency in a row or column and the total number of data values
Mass A measure of how much matter is in an object usually defined in grams
Mathematical modeling Using mathematics to solve a complicated real-world problem where there is no clear-cut method to solve the problem Note that mathematical modeling is different from using manipulatives and other representations to model mathematical concepts See Appendix E
Matrix A rectangular array of numbers or other data The dimensions of the matrix are determined by its number of rows and columns Example The dimensions of a matrix with two rows and three columns would be 2 x 3
Maximum The greatest value in a data set or the greatest possible value of an expression or function
Mean (arithmetic mean or average) A measure of center in a set of numerical data computed by adding the values in a list and then dividing by the number of values in the list the balance point For the data set x1 x2 x3 hellip xn the mean (often written 119909) = 1
119899119899sum 119909119909119894119894119899119899119894119894=1 Example For the data
set 1 3 6 7 10 12 14 15 22 120 the mean is 21
Mean absolute deviation The average distance between each value in a set of numerical data and the mean of the data set For the data set x1 x2 x3 hellip xnwith mean 119909 MAD = 1
119899119899sum |119909119909119894119894 minus 119909|119899119899119894119894=1 Example For the data set 2 3 6 7 10 12 14 15 22 120 the mean absolute deviation is 1996
Median A measure of center in a set of numerical data The median of a list of values is the number at the center of an ordered listmdashor the mean of the two numbers in the middle if there are an even number of elements Example For the data set 2 3 6 7 10 12 14 15 22 90 the median is 11
Metric system A measurement system used throughout the world that is based on units that are related by powers of 10 using a standard set of prefixes The base unit for measuring length is the meter the base unit for capacity is the liter and the base unit for mass is grams Commonly-used prefixes include milli- denoting 11000 of the base unit centi- denoting 1100 of a unit and kilo- denoting 1000 base units For example a milliliter is 11000 of a liter a centimeter is 1100 of a meter and a kilometer is 1000 meters Temperature is measured in degrees Celsius in which 0˚ C is the freezing point of water and 100˚ is the boiling point of water
Midline In the graph of a trigonometric function the horizontal line halfway between its maximum and minimum values
Glossary
207 2019 Alabama Course of Study Mathematics
Midpoint A point on a segment that is equidistant from the endpoints
Minimum The smallest value in a data set or the smallest possible value of an expression or function
Mode The value that occurs most frequently in a data set
Modular arithmetic If a and b are integers and m is a positive integer then a is said to be congruent to b modulo m if m divides a ndash b
Monomial A mathematical expression consisting of a single term
Multiple A number that is the result of multiplying a given whole number (or integer) by another whole number (or integer) Example Multiples of 5 are 0 5 10 15 20 25 30hellip
Multiplication A mathematical operation involving two factors One factor describes the number of groups or sets the other factor describes the number of items in a group or set and the result or product describes the total number of items
Multiplication and division within 100 Multiplication or division of two whole numbers with whole number answers with product or dividend in the range 0-100 Example 72 divide 8 = 9
Multiplicative inverses Two numbers whose product is 1 are multiplicative inverses of one another Example 34 and 4
3 are multiplicative inverses
of one another because 34
times 43
= 43
times 34
= 1
Natural number Whole numbers excluding zero ldquocounting numbersrdquo
Nonresponse bias Bias that occurs when individuals chosen for a sample are unable or unwilling to respond and differ in meaningful ways from those who do respond
Normal distribution A naturally occurring distribution that is symmetric about the mean bell shaped and dispersed systematically Also known as a normal curve
Number line diagram A line diagram used to represent numbers and support reasoning about them In a number line diagram for measurement quantities the interval from 0 to 1 on the diagram represents the unit of measure for the quantity
Numerator The number in a fraction that indicates the number of parts of the whole that are being considered the top number in a fraction
Obtuse angle An angle measuring more than 90˚ but less than 180˚
Glossary
208 2019 Alabama Course of Study Mathematics
Odd function A function whose graph is 180˚ rotationally symmetric about the origin f(-x) = -f(x) for all x
Open figure A shape made up of line segments with at least one line segment that isnrsquot connected to anything at one of its endpoints
Ordered pair A set of numbers (x y) where the first number (x-coordinate) shows position to the left or right of the origin (0 0) and the second number (y-coordinate) shows position above or below the origin on a coordinate plane
Outlier Values in a data set that are much smaller or larger than the rest of the values
Parabola The set of all values in a two-dimensional plane that are the same distance from a fixed point (focus) and a line (directrix)
Parallel lines Two lines in a plane that do not intersect
Parameter In statistics a numerical measure that describes a characteristic of a population In algebra parameters are quantities that influence the output or behavior of a mathematical object that are not explicitly varied but viewed as being held constant Example for 119910119910 = 119898119898119909119909 + 119887119887 m and b are parameters and x and y are variables Also the independent variable used in parametric equations
Parametric equations A set of equations used to define the coordinates of a set of points in terms of an independent variable called a parameter
Partial product A part of the product in a multiplication calculation usually based on place value and the distributive property
Partial quotient A part of the quotient in a division calculation usually based on place value and the distributive property
Pattern Set of numbers or objects that can be described by a specific rule
Percent rate of change A rate of change expressed as a percent Example If a population grows from 50 to 55 in a year it grew by 550
= 10 per year
Perimeter The distance around a figure or object
Period The length of the dependent variable in a periodic function for a complete cycle to occur
Permutation An arrangement of all the members of a set or collection into some sequence or order or if the set is already ordered the reordering of its elements a process called permuting
Perpendicular lines Two lines or line segments that intersect to form a right angle (90˚)
Glossary
209 2019 Alabama Course of Study Mathematics
Piecewise function A function in which more than one formula is used to define the output over different intervals (pieces) of the domain
Pigeonhole Principle A concept used in problem-solving which states that if there are more pigeons than pigeonholes then at least one pigeonhole has at least two pigeons in it
Plane figure A two-dimensional shape
Point An exact position or location on a plane surface or in space
Polar equations An equation defining an algebraic curve expressed in polar coordinates r and θ where r is the distance from the origin and θ is the angle of rotation from the x-axis
Polygon Any closed plane shape formed by line segments (also called sides of the polygon) where each endpoint of a side (also called a vertex of the polygon) is shared by exactly two sides
Polyhedron A three-dimensional figure formed by polygons (also called faces of the polyhedron) where each side of a face (also called an edge of the polyhedron) is common to exactly two faces The vertices of the polygons (also called vertices of the polyhedron) may be shared by multiple edges
Polynomial A mathematical expression containing real numbers and variables related only by the operations of addition subtraction multiplication and non-negative integer exponents The standard form of a polynomial is written as a sum of terms each of which is simplified to be the product of a constant andor variables raised to whole number exponents greater than 0 Example 3x2 + 4xy3 + 9 is a polynomial written in standard form
Population The entire group of objects people or events about which information is sought in a statistical study
Population distribution The distribution of all values of a variable for all individuals in the population
Power Exponent the number of times a base number is multiplied by itself
Preimage A figure or set of points that is an input to a transformation
Prime number A number that has exactly two factors 1 and itself
Prism Polyhedron with two congruent and parallel faces that are polygons the rest of the faces are parallelograms
Probability A number between 0 and 1 used to quantify likelihood
Glossary
210 2019 Alabama Course of Study Mathematics
Probability distribution The set of possible values of a random variable with a probability assigned to each
Probability model A model used to assign probabilities to outcomes of a chance process by examining the nature of the process The set of all outcomes is called the sample space and their probabilities sum to 1 See also uniform probability model
Product The result when two or more numbers or terms are multiplied together
Properties Characteristics such as color size or height statements that are always true for some class of objects
Proportional Term describing two quantities that are related by a constant ratio whose value is called the constant of proportionality
Pythagorean Theorem The sum of the squares of the lengths of the legs of a right triangle is equal to the square of the length of the hypotenuse 1198861198862 + 1198871198872 = 1198881198882 where a and b are the lengths of the legs and c is the length of the hypotenuse
Quadrant One of the four parts into which a coordinate plane is divided by the x-axis and y-axis
Quadratic equation An equation which equates a quadratic expression to another quadratic expression linear expression or constant
Quadratic expression A polynomial expression in one variable where the largest exponent of the variable is 2 when written in standard form
Quadratic formula x = minus119887119887plusmnradic1198871198872minus41198861198861198861198862119886119886
where x is the solution of an equation of the form ax2 + bx + c = 0 and 119886119886 ne 0
Quadratic function A function in which each input value is related to its output value by a quadratic expression See Appendix D Table 4
Qualitative variable See categorical variable
Quantitative literacy The ability to use mathematical and statistical reasoning to address practical civic professional recreational and cultural issues
Quantitative variable A variable whose possible values are numerical and represent a measurable quantity Examples a personrsquos weight or age
Quartile A grouping of data points Three points in a ranked set of data divide the data into four equal groups where each group contains a quarter of the data points The three points include the median of the full set of data (Q2) the median of the set of values above the median of the full set (Q3) and the median of the set of values below the median of the full set (Q1)
Quotient c where a divide b = c
Glossary
211 2019 Alabama Course of Study Mathematics
Radian The radian measure of an angle is equal to the ratio of the length of the subtended arc of the angle to the radius
Radical equation An equation in which at least one variable expression is under a radical
Random sample A method of selection in which members of the statistical population are chosen by chance with each member of the population having an equal probability of being chosen
Random variable A statistical variable whose values are the result of a random process
Range The maximum value minus the minimum value in a data set The range of a function is the set of outputs from the domain
Ratio The multiplicative comparison of two non-zero quantities Represented as ab ab and a to b
Rational expression A quotient of two polynomials with a non-zero denominator
Rational number A number that can be expressed as a fraction in the form of 119886119886119887119887 where 119887119887 ne 0
Ray A set of points on a line that begins at a point (called the endpoint) and extends infinitely in one direction
Real number The set of all possible values on a number line that is the set of all rational and irrational numbers Each real number can be represented by a decimal number either finite or infinite
Reciprocal The multiplicative inverse of a number
Reciprocal function A function defined by the reciprocal of a linear function See Appendix D Table 4
Remainder Amount remaining when one whole number is unevenly divided by another whole number
Repeating decimal A decimal number in which a string of one or more digits following the decimal point repeats indefinitely Example 2137232323hellip is a repeating decimal since the string ldquo23rdquo repeats
Response bias Bias that results from problems in the measurement process Examples leading questions social desirability
Right angle An angle that measures exactly 90˚
Rigid motion A geometric transformation of points consisting of a sequence of one or more translations reflections andor rotations which preserve distances and angle measures
Glossary
212 2019 Alabama Course of Study Mathematics
Round To use mathematical rules to alter a number to one that is less exact but easier to use in mental computation The number is kept close to its original value
Sample A subset of data selected from a statistical population by a defined procedure
Sample space All possible outcomes of an event
Sample survey A study that obtains data from a subset of a population to estimate population parameters
Sampling bias The partiality that occurs when a sample statistic does not accurately reflect the true value of the parameter in the population
Sampling distribution A distribution of values taken by a statistic in all possible samples of the same size from the same population
Scalar Numerical values or quantities that are fully described by magnitude alone a number multiplied by each element of a vector or matrix
Scale (multiplication) To compare the size of a product to the size of one factor on the basis of the size of the other factor
Example Compare the area of these rectangles When one dimension is doubled the area (A) is doubled
10 in 5 in
A = 50 in2
5 in 5 in
A= 25 in2
Scale factor The common factor by which distances of points from a given center in a dilation are multiplied
Scatter plot A graph in the coordinate plane representing a set of bivariate data Example the heights and weights of a group of people could be displayed on a scatter plot where the heights are the x-coordinates of the points and the weights for the y-coordinates
Scientific notation A way of writing very large or very small numbers using a number between 1 and 10 multiplied by a power of 10
Glossary
213 2019 Alabama Course of Study Mathematics
Shape of distribution (Statistics and Probability Grades 9-12) A description of a distribution Examples number of peaks symmetry skewness or uniformity
Similar figures Two plane or solid figures which can be obtained from each other by a similarity motion (a sequence of dilations rotations reflections andor translations) Congruent figures are similar with a scale factor of 100
Similarity motion A geometric transformation of points consisting of a sequence of one or more dilations translations reflections andor rotations Similarity motions preserve angle measure and change lengths proportionally The constant ratio comparing side lengths is called the scale factor
Simulation The process of using a mathematical model to recreate real phenomenon often repeatedly so that the likelihood of various outcomes can be more accurately estimated
Simultaneous equations See system of equations
Skewed Term which describes a distribution of data that is not symmetrical about its mean
Slope (rate of change) The ratio of vertical change to horizontal change the ratio of change in an independent variable compared to change in the dependent variable
Solid figure A three-dimensional object
Solution A value which makes an equation or inequality true
Solution to a system of equations A solution that is common to each of the equations in the system
Square root A square root of x is the number that when multiplied by itself gives the number x Example 5 is the square root of 25 because 55=25
Square root function A function in which the output of the function is found by taking the square root of the input value preceded or followed by addition subtraction or multiplication of the value by one or more constants See Appendix D Table 4
Square unit The area of a square with side lengths of 1 unit used as a unit of measure for area
Standard algorithm A generally accepted method used to perform a particular mathematical computation
Glossary
214 2019 Alabama Course of Study Mathematics
Standard deviation A measurement of dispersion that measures how far each number in the data set is from the mean It is the square root of the
variance divided by the number of cases For the data set x1 x2 x3 hellip xn with mean 119909 SD = 1119899119899sum (119909119909119894119894 minus 119909)2119899119899119894119894=1 If the data set is a sample of a
population SD = 1119899119899minus1
sum (119909119909119894119894 minus 119909)2119899119899119894119894=1
Statistic A characteristic of a sample used to estimate the value of a population parameter
Statistically significant An observed event is considered statistically significant when in the presence of randomness the observed results are not likely due to chance alone
Stem-and-leaf plot A graphical display of quantitative data that contains two columns separated by a vertical line Each value is split into a stem and a leaf the stem being the first digit(s) and the leaf being the last digit The stems are typically given in the left column and the leaves are given in order to the right
Step function A discontinuous piecewise defined function in which each piece is a horizontal line segment or a point Example greatest integer function
Strategy A plan or approach to find an answer or solve a problem
Subject (Data Analysis Statistics and Probability Grades 9-12) An individual to which treatments are applied within a statistical experiment
Sum The result of quantities added together
Supplementary angles Two angles whose measures have a sum of 180˚
Survey A study that obtains data from a subset of a population to draw conclusions
Symmetry A quality a figure has when the figure is mapped onto itself by a rigid motion in which the points of the figure are not all mapped to themselves Figures that have symmetry are said to be symmetric and the rigid motion is called a symmetry of the figure Example equilateral triangles have a rotational symmetry of 120˚ since each vertex of an equilateral triangle will be mapped to another vertex when rotated 120˚ about the center of the triangle Thus equilateral triangles are said to be rotationally symmetric
System of equations A set of two or more equations that has a common set of solutions Solving the system means finding those common solutions
Glossary
215 2019 Alabama Course of Study Mathematics
Tape diagram A visual model that uses rectangles of uniform size to illustrate and solve a variety of problems including number relationship and ratio problems
Term A single number or variable or numbers and variables multiplied together
Terminating decimal A decimal number which can be expressed in a finite number of digits a decimal that ends
Theorem A geometric statement that can be proven to be true based on definitions axioms and previously proven theorems
Theoretical probability The number of ways that an event can occur divided by the total number of outcomes from the sample space Contrast to experimental probability
Transitivity principle for indirect measurement A measurement principle stating that if the length of object A is greater than the length of object B and the length of object B is greater than the length of object C then the length of object A is greater than the length of object C This principle applies to measurement of other quantities as well
Transversal A line that intersects two or more lines in a plane
Treatment A condition or set of conditions that is applied to one group in an experiment
Treatment group (Statistics and Probability Grades 9-12) The group of subjects to which the same treatment is assigned in an experiment
Tree diagram In probability a diagram that shows all possible outcomes of an event
Triangular numbers The set of numbers (1 3 6 10 15 hellip) that are obtained from the summation of natural numbers that can be arranged in an equilateral triangle
Trigonometric function A function that relates the angles and sides of a right triangle whose input is an angle and whose output is a designated ratio of sides Trigonometric functions include sine cosine tangent secant cosecant and cotangent
Truth table A table used to display all possible truth values of logical expressions
Glossary
216 2019 Alabama Course of Study Mathematics
Two-way table A table listing the frequencies of two categorical variables whose values have been paired
Uniform probability model A probability model which assigns equal probability to all outcomes See also probability model
Unit circle A circle with the equation 1199091199092 + 1199101199102 = 1 It has a radius of 1 unit
Unit rate In a proportional relationship the number of units of the first quantity that correspond to one unit of the second quantity Example My rate of travel was 30 miles in one hour (mph)
Univariate data A data set that is described by one variable (one type of data)
Variable A symbol used to represent a quantity which may have a fixed value or have changing values In statistics a variable is a characteristic of members of a population that can be measured (quantitative) or counted (categorical) Examples The height of a person is a quantitative variable while eye color is a categorical variable
Variability A measure of the spread of a data set Examples interquartile range mean absolute deviation standard deviation
Variance A measure of dispersion expressed in square units that considers how far each number in a data set is from its mean calculated by finding the sum of the square of the distance of each value from the mean Example For the data set x1 x2 x3 hellip xn with mean 119909 the variance = sum (119909119909119894119894 minus 119909)2119899119899119894119894=1
Vector A quantity with magnitude and direction in the plane or in space It can be defined by an ordered pair or triple of real numbers
Vertex The common endpoint of two or more rays or line segments Plural vertices
Vertex form The equation describing a quadratic equation using the vertex (maximum or minimum point) of its graph which is a parabola If (h k) is the vertex of the graph represented by an equation then the vertex form for that equation will be f(x) = a(x ndash h)2 + k where a is a non-zero constant
Vertical angles Two nonadjacent angles formed by a pair of intersecting lines
Visual fraction model A method of showing fractions Examples tape diagram number line diagram area model
Volume The measure of the amount of space inside of a solid figure such as a cube ball cylinder or pyramid expressed in cubic units
Whole numbers The numbers 0 1 2 3 hellip without any decimal or fractional parts
Glossary
217 2019 Alabama Course of Study Mathematics
x-intercept The x-coordinate of the ordered pair where a graph crosses the x-axis where y = 0
y-intercept The y-coordinate of the ordered pair where a graph crosses the y-axis where x = 0
Zero matrix A matrix consisting of all zeros Any matrix added to a zero matrix of matching dimension will yield itself
Zero of a function A value of the independent variable where the value of the function equals 0
Zero property The product of any number and zero is zero

2019 Alabama Course of Study Mathematics iii
2019 Alabama Course of Study Mathematics
Eric G Mackey State Superintendent of Education
2019 Alabama Course of Study Mathematics iv
STATE SUPERINTENDENT OF EDUCATIONrsquoS MESSAGE
Dear Educator
Society and the workplace require that all Alabama students receive a solid foundation of knowledge skills and understanding in mathematics Alabama educators must focus on the teaching of mathematics in ways that enable students to expand professional opportunities understand and critique the world and experience the joy wonder and beauty of mathematics To address this goal the content of the 2019 Alabama Course of Study Mathematics sets high standards for all students and reflects changes designed to better meet the needs of students and teachers in the State of Alabama
The 2019 Alabama Course of Study Mathematics was developed by educators and business and community leaders to provide a foundation for building quality mathematics programs across the state Implementing the content of this document through appropriate instruction will enable all Alabama students to be mathematically well-prepared graduates
Eric G Mackey State Superintendent of Education
MEMBERS of the
ALABAMA STATE BOARD OF EDUCATION
Governor Kay Ivey
President of the State Board of Education
District
I Jackie Zeigler President Pro Tem II Tracie West
III Stephanie W Bell
IV Yvette Richardson EdD V Ella B Bell VI Cynthia Sanders McCarty PhD
VII Jeffery Newman Vice President VIII Wayne Reynolds EdD
State Superintendent Eric G Mackey
Secretary and Executive Officer
2019 Alabama Course of Study Mathematics v
2019 Alabama Course of Study Mathematics Table of Contents
PREFACE viii
ACKNOWLEDGEMENTS ix
GENERAL INTRODUCTION 1
CONCEPTUAL FRAMEWORK 2
POSITION STATEMENTS 5
STUDENT MATHEMATICAL PRACTICES 10
DIRECTIONS FOR INTERPRETING THE CONTENT STANDARDS FOR GRADES K-8 14
DIRECTIONS FOR INTERPRETING THE CONTENT STANDARDS FOR HIGH SCHOOL 15
GRADES K-8 MINIMUM REQUIRED CONTENT
GRADES K-2 OVERVIEW 17
KINDERGARTEN 18
GRADE 1 23
GRADE 2 30
GRADES 3-5 OVERVIEW 36
GRADE 3 37
GRADE 4 43
GRADE 5 50
GRADES 6-8 OVERVIEW 57
GRADE 6 60
GRADE 7 67
GRADE 8 74
GRADE 7 ACCELERATED AND GRADE 8 ACCELERATED OVERVIEW 81
GRADE 7 ACCELERATED 83
GRADE 8 ACCELERATED 92
2019 Alabama Course of Study Mathematics vi
GRADES 9-12 CONTENT
GRADES 9-12 OVERVIEW 104
PATHWAYS TO STUDENT SUCCESS 104
GEOMETRY WITH DATA ANALYSIS BEFORE ALGEBRA I WITH PROBABILITY 105
SUPPORT FOR STRUGGLING STUDENTS 105
SUPPORT FOR PARTICULARLY MOTIVATED AND INTERESTED STUDENTS 106
SPECIALIZED MATHEMATICS COURSES 106
EXTENDED COURSES 107
EXAMPLES OF PATHWAYS 108
ORGANIZATION OF STANDARDS 109
ESSENTIAL CONCEPTS 111
GEOMETRY WITH DATA ANALYSIS 117
ALGEBRA I WITH PROBABILITY 127
ALGEBRA II WITH STATISTICS 138
MATHEMATICAL MODELING 149
APPLICATIONS OF FINITE MATHEMATICS 156
PRECALCULUS 163
APPENDIX A
MATHEMATICS TEACHING PRACTICES SUPPORTING EQUITABLE MATHEMATICS TEACHING 172
APPENDIX B
2019 ALABAMA COURSE OF STUDY PATHWAYS 175
CHART 1 PATHWAYS THROUGH K-12 MATHEMATICS 177
CHART 2 PATHWAYS THROUGH K-12 MATHEMATICS TO POSTSECONDARY 178
OPTIONS FOR MATHEMATICS CREDIT AFTER ALGEBRA II WITH STATISTICS 179
APPENDIX C
RESOURCES 180
APPENDIX D
RESOURCES FOR GRADES 6-8 183
2019 Alabama Course of Study Mathematics vii
APPENDIX E
POSSIBLE PATHWAYS FOR STUDENTS COMPLETING GRADE 8 MATHEMATICS 187
POSSIBLE PATHWAYS FOR STUDENTS COMPLETING GRADE 8 ACCELERATED MATHEMATICS 188
THE MATHEMATICAL MODELING CYCLE AND STATISTICAL PROBLEM-SOLVING CYCLE 189
APPENDIX F
ALABAMA HIGH SCHOOL GRADUATION REQUIREMENTS 192
APPENDIX G
GUIDELINES AND SUGGESTIONS FOR LOCAL TIME REQUIREMENTS AND HOMEWORK 194
BIBLIOGRAPHY 197
GLOSSARY 198
2019 Alabama Course of Study Mathematics viii
2019 Alabama Course of Study Mathematics
PREFACE
The 2019 Alabama Course of Study Mathematics provides the framework for the Grades K-12 mathematics program in Alabamarsquos public schools Content standards in this document are minimum and required (Code of Alabama 1975 sect16-35-4) They are fundamental and specific but not exhaustive In developing local curriculum school systems may include additional content standards to reflect local philosophies and add implementation guidelines resources and activities which are beyond the scope of this document The 2019 Alabama Mathematics Course of Study Committee and Task Force conducted exhaustive research during the development of this Course of Study analyzing mathematics standards and curricula from other states the 2016 Revised Alabama Course of Study Mathematics national reports and recommendations on K-12 mathematics education the latest NAEP Frameworks and numerous articles in professional journals and magazines Many members attended state regional and national conventions to update their knowledge of current trends and issues in mathematics education The Committee and Task Force also listened to and read statements from interested individuals and groups throughout the state and thoroughly discussed issues among themselves and with colleagues The Committee and Task Force reached consensus and developed what members believe to be the best Grades K-12 Mathematics Course of Study for students in Alabamarsquos public schools
2019 Alabama Course of Study Mathematics ix
2019 Alabama Course of Study Mathematics
ACKNOWLEDGMENTS
This document was developed by the 2019 Alabama Mathematics Course of Study Committee and Task Force composed of early childhood intermediate school middle school high school and college educators appointed by the Alabama State Board of Education and business and professional persons appointed by the Governor (Code of Alabama 1975 sect16-35-1) The Committee and Task Force began work in March of 2018 and submitted the document to the Alabama State Board of Education for adoption at the December 12 2019 meeting
2019 Alabama Mathematics Course of Study Committee and Task Force
Chair Matt Akin PhD Superintendent Gulf Shores City Schools
Rebecca Boykin Teacher Pizitz Middle School Vestavia Hills City Schools
Justin D Boyle EdD Assistant Professor The University of Alabama
Calvin Briggs EdD Executive Director The Southern Center for Broadening Participation in STEM
Suzanne Culbreth Instructor UABTeach University of Alabama at Birmingham
Derallus Davis Teacher McAdory High School Jefferson County Board of Education
Emilee E Daws Teacher Athens Middle School Athens City Board of Education
Beth Dotson Director of Huntington Learning Center Daphne
Amelia Hattaway Evans Teacher Pinson Elementary School Jefferson County Board of Education
Keri Flowers Mathematics Specialist AMSTI Troy University
Michelle J Foster PhD Associate Professor Alabama State University
Mike Foust PhD Senior Vice President ABT Inc Madison AL
2019 Alabama Course of Study Mathematics x
Christy Fox Teacher W S Neal Elementary School Escambia County Board of Education
Nancee Garcia PhD Teacher Auburn High School Auburn City Schools
Harry Gilder Jr Attorney Harry L Gilder Jr Attorney at Law LLC
Gayle Holladay Mathematics Instructional Coach Opelika City Schools
Sheila Clay Holt Director AMSTI University of Alabama in Huntsville
Adrienne King Teacher Discovery Middle School Madison City Schools
Kathryn Lanier PhD Director of STEM Education Outreach Southern Research
Lee Ann Latta Mathematics Content Director Grades 6 - 11 A+ College Ready
W Gary Martin EdD Professor Auburn University
Frankie E Mathis EdD Director of Secondary Education Saraland Board of Education
Lisa McDonough Mathematics Specialist AMSTI University of Alabama in Huntsville
Sue D Noah Teacher Athens Elementary School Athens City Board of Education
Vicky Ohlson PhD Director of Special Projects Alabama Community College System
Amanda Daniel Pendergrass PhD Associate Professor The University of West Alabama
Anne Penney EdD Retired Auburn City School Board
Andrew Poker Teacher Spain Park High School Hoover City Schools
Denise Porch Mathematics Specialist AMSTI University of Alabama in Huntsville
Leslie Richards EdS Secondary Mathematics Supervisor Jefferson County Schools
Dolores Sparks Retired Teacher Red Bay High School Franklin County Schools
Shannon Noel Tillison Teacher White Plains Elementary School Calhoun County Board of Education
Leigh Farrell Twigg Mathematics Specialist Calhoun County Board of Education
2019 Alabama Course of Study Mathematics xi
Appreciation is extended to Megan Burton PhD Auburn University Shelia Ingram PhD Birmingham-Southern College Kyoko Johns PhD Jacksonville State University Marilyn Strutchens PhD Auburn University and Jeremy Zelkowski PhD The University of Alabama who served as content reviewers of this document
State Department of Education personnel who managed the development process were Eric G Mackey PhD State Superintendent of Education Daniel Boyd PhD Deputy State Superintendent Elisabeth Davis EdD Assistant State Superintendent Office of Student Learning Sean J Stevens Program Coordinator Instructional Services Cathy Jones Executive Secretary State Courses of Study Committees Instructional Services Robin A Nelson Program Coordinator Instructional Services retired Michele Matin Executive Secretary State Courses of Study Committees Instructional Services retired
The State Department of Education process specialists who assisted the Task Force in developing the document were Karen Anderson PhD Education Administrator School Improvement Cindy Augustine Education Specialist Special Education Services retired Willietta Ellis Conner EdD Education Specialist Counseling and Guidance Diane Duncan EdS Education Administrator AMSTI Kathy G Padgett PhD Education Specialist Student Assessment Angie Pelton EdD Education Specialist Professional Learning Gay Finn Education Administrator Instructional Services K Elizabeth Hammonds Education Specialist AMSTI Phenicia Nunn Education Specialist AMSTI Kristie Taylor Education Specialist AMSTI Charles V Creel Graphic Arts Specialist Communication Section assisted in the development of the graphic design Catherine Wilbourne Eufaula City Schools (retired) edited and proofread the document
1 2019 Alabama Course of Study Mathematics
2019 Alabama Course of Study Mathematics GENERAL INTRODUCTION
The 2019 Alabama Course of Study Mathematics defines the knowledge and skills students should know and be able to do after each course and upon graduation from high school Mastery of the standards enables students to expand professional opportunities understand and critique the world and experience the joy wonder and beauty of mathematics (National Council of Teacher of Mathematics [NCTM] 2018) Courses within the 2019 Alabama Course of Study Mathematics are organized into Alabama Content Areas which are adapted from those present in the draft of the NAEP 2025 Mathematics Framework High school courses also incorporate recommendations for the Essential Concepts as identified by the National Council of Teachers of Mathematics (2018) and other documents All standards contained in this document are
aligned with college and work expectations
written in a clear understandable and consistent format
designed to include rigorous focused and critical content and application of knowledge through high-order skills
formulated upon strengths and lessons of current Alabama standards
informed by high-performing mathematics curricula in other countries to ensure all students are prepared to succeed in our global economy and society and
grounded on sound evidence-based research
What students can learn at any particular grade level depends upon prior learning Grade placements for specific topics have been made on the basis of state and international comparisons and on the collective experience and professional judgment of educators researchers and mathematicians Learning opportunities will continue to vary across schools and school systems and educators should make every effort to meet the needs of individual students based on the studentrsquos current understanding Mastery of the standards enables students to build a solid foundation of knowledge skills and understanding in mathematics To ensure student success effective implementation of the 2019 Alabama Course of Study Mathematics requires local education agencies to develop local curriculum guides utilizing the minimum required content of this document
2 2019 Alabama Course of Study Mathematics
2019 Alabama Course of Study Mathematics CONCEPTUAL FRAMEWORK
3 2019 Alabama Course of Study Mathematics
2019 Alabama Course of Study Mathematics
CONCEPTUAL FRAMEWORK
The conceptual framework graphic illustrates the purpose of the 2019 Alabama Course of Study Mathematics which is to ensure that all students receive the mathematics preparation they need to access further educational and professional opportunities to understand and critique the world around them and to experience the joy wonder and beauty of mathematics (NCTM 2018) This purpose is depicted by a cyclical pattern formed by position statements content student mathematical practices and mathematics teaching practices that contribute to the development of the mathematically-prepared graduate represented by the diploma and mortarboard in the center The cycle has no defined starting or ending point all of its components must be continuously incorporated into the teaching and learning of mathematics This integration is essential to the development of an excellent mathematics education program for public schools in Alabama represented by the shaded map of the state behind the cycle The four critical components of an excellent mathematics education program are Student Mathematical Practices Alabama Content Areas and 9-12 Essential Content Mathematics Teaching Practices and Position Statements The Student Mathematical Practices also referred to as the Standards for Mathematical Practice embody the processes and proficiencies in which students should regularly engage as they learn mathematics These practices include making sense of problems and persevering in solving them constructing arguments and critiquing reasoning of others modeling using appropriate tools attending to precision finding and using structure and finding and expressing regularity in repeated reasoning Proficiency with these practices is critical in using mathematics both within the classroom and in life Mathematical Practices are a fundamental component in the National Assessment of Educational Progress (NAEP) framework and are included as Alabama standards to be incorporated across all grades they are explained in further detail on pages 11-14 The vehicle for developing these practices is found in the next component of the cycle the content standards These standards specify what students should know and be able to do at the end of each grade or course The standards are organized in Alabama Content Areas which are based on the content areas in the 2025 NAEP mathematics framework They are designed to provide an effective trajectory of learning across the grades that ensures students are well-prepared for future success In Grades 9-12 the Alabama Content Standards are organized into subgroups of essential concepts described by the National Council of Teachers of Mathematics (NCTM) in its seminal publication Catalyzing Change in High School Mathematics Initiating Critical Conversations (2018) These essential concepts are designed to be achieved by all students within the first three years of high school mathematics and they form the foundation for additional coursework designed to meet studentsrsquo specific post-high school needs and interests The next component of the cycle consists of the eight Mathematics Teaching Practices (NCTM 2014) which should be consistent components of every mathematics lesson across grades K-12 They are
4 2019 Alabama Course of Study Mathematics
1 Establish mathematics goals to focus learning Effective teaching of mathematics establishes clear goals for the mathematics that students are learning situates goals within learning progressions and uses the goals to guide instructional decisions
2 Implement tasks that promote reasoning and problem solving Effective teaching of mathematics engages students in solving and discussing tasks that promote mathematical reasoning and problem-solving and allow multiple entry points and varied solution strategies
3 Use and connect mathematical representations Effective teaching of mathematics engages students in making connections among mathematical representations to deepen understanding of mathematics concepts and procedures and as tools for problem-solving
4 Facilitate meaningful mathematical discourse Effective teaching of mathematics facilitates discourse among students to build shared understanding of mathematical ideas by analyzing and comparing student approaches and arguments
5 Pose purposeful questions Effective teaching of mathematics uses purposeful questions to assess and advance studentsrsquo reasoning and sense-making about important mathematical ideas and relationships
6 Build procedural fluency from conceptual understanding Effective teaching of mathematics builds fluency with procedures on a foundation of conceptual understanding so that students over time become skillful in using procedures flexibly as they solve contextual and mathematical problems
7 Support productive struggle in learning mathematics Effective teaching of mathematics consistently provides students individually and collectively with opportunities and supports to engage in productive struggle as they grapple with mathematical ideas and relationships
8 Elicit and use evidence of student thinking Effective teaching of mathematics uses evidence of student thinking to assess progress toward mathematical understanding and to adjust instruction continually in ways that support and extend learning
Appendix A provides information that illustrates how these Mathematics Teaching Practices support equitable instruction in the mathematics classroom The final component of the cycle is the Position Statements which are explained in detail in the next section of this document The Position Statements set forth the foundational requirements for excellence in mathematics education They deal with access and equity teaching and learning curriculum tools and technology assessment and professionalism All stakeholders from parents and teachers to policy-makers and business leaders should examine and embrace these Position Statements to foster excellence in mathematics education in Alabama The graphic depicts a dynamic process of establishing and achieving an excellent mathematics program for the State of Alabama Placement of a diploma at the center is no accident because all efforts are focused on preparing Alabama students for their future Mathematics will be part of that future and students must be well equipped to meet the challenges of higher education and meaningful employment
5 2019 Alabama Course of Study Mathematics
POSITION STATEMENTS Today mathematics is at the heart of most innovations in the ldquoinformation economyrdquo which is increasingly driven by data Mathematics serves as the foundation for careers in science technology engineering and mathematics (STEM) and increasingly as the foundation for careers outside STEM Moreover mathematical literacy is needed more than ever to filter understand and act on the enormous amount of data and information that we encounter every day The digital age inundates us with numbers in the form of data rates quantities probabilities and averages and this fact of twenty-first-century life increases the importance of and need for todayrsquos students to be mathematically and statistically literate consumers if not producers of information (National Council of Teachers of Mathematics [NCTM] Catalyzing Change in High School Mathematics 2018 p 1)
Mathematics is critical for the future success of each and every student in Alabama enabling them to expand their professional opportunities understand and critique the world and experience the joy wonder and beauty of mathematics (NCTM 2018) To help students achieve this goal schools should implement the six position statements which outline foundational practices to ensure excellence in Alabama mathematics programs Specific pages in Principles to Action Ensuring Mathematical Success for All (NCTM 2014) that are related to each position statement are indicated in italics at the end of the statement All stakeholders from parents and teachers to policy-makers and business leaders should examine and embrace these principles to foster excellence in mathematics education in Alabama
Access and Equity in Mathematics Education
An excellent mathematics program in Alabama promotes access and equity which requires being responsive to studentsrsquo backgrounds experiences and knowledge when designing implementing and assessing the effectiveness of a mathematics program so that all students have equitable opportunity to advance their understanding each school year Access and equity in mathematics at the school and classroom levels is founded on beliefs and practices that empower each and every student to participate meaningfully in learning mathematics and to achieve outcomes in mathematics that are not predicted by or associated with student characteristics For all students mathematics is an intellectually challenging activity that transcends their racial ethnic linguistic gender and socioeconomic backgrounds Promoting curiosity and wonder through mathematical discourse is possible when schools and classrooms provide equitable access to challenging curriculum and set high expectations for all students School leaders teachers and community stakeholders need to collaborate on issues impacting access and equity for each and every student such as tracking beliefs about innate levels of mathematical ability and differentiated learning To gain more insight read and discuss ldquoAccess and Equityrdquo in Principles to Actions (pp 59-69)
6 2019 Alabama Course of Study Mathematics
Teaching and Learning Mathematics
An excellent mathematics program in Alabama requires teaching practices that enable students to understand that mathematics is more than finding answers mathematics requires reasoning and problem-solving in order to solve real-world and mathematical problems Teaching matters Teachers bear the responsibility of ensuring student attainment of content by all who enter their classrooms regardless of pre-existing skills and knowledge To increase student proficiency in mathematics the following mathematics teaching practices (NCTM 2014) should be integrated into daily instruction
Establish mathematics goals to focus learning Implement tasks that promote reasoning and problem-solving Use and connect mathematical representations Facilitate meaningful mathematical discourse Pose purposeful questions Build procedural fluency from conceptual understanding Support productive struggle in learning mathematics Elicit and use evidence of student thinking
These mathematics teaching practices are also an element of the Conceptual Framework See Appendix A
Student learning involves more than developing discrete mathematical skills mathematical proficiency has been defined by the National Research Council (2001) to include five strands conceptual understanding procedural fluency strategic competence adaptive reasoning and a productive disposition Note that procedural fluency involves not just finding answers quickly but ldquoskill in carrying out procedures flexibly accurately efficiently and appropriatelyrdquo (National Research Council 2001) School leaders teachers and community stakeholders need to collaborate on issues impacting teaching and learning mathematics such as mathematics learning goals opportunities students are afforded to discuss their thinking studentsrsquo understanding and encouragement to persevere as they reason problem-solve and develop conceptual understanding and teachersrsquo orchestration of and student participation in whole class discussions To gain more insight read and discuss the ldquoMathematics Teaching Practicesrdquo section in Principles to Actions (pp 7-57)
7 2019 Alabama Course of Study Mathematics
Mathematics Curriculum
An excellent mathematics program in Alabama includes a curriculum that develops the grade level mathematics content standards along coherent learning progressions which build connections among areas of mathematical study and between mathematics and the real world There are differences among standards textbooks and curriculum The Alabama Content Standards delineate what students are expected to learn within each grade level or course A curriculum is a sequence of tasks activities and assessments that teachers enact to support students in learning the standards while drawing on a textbook or other resources when appropriate Textbooks and other resources that align with standards should be provided for teachers For example a standard might read that students will be fluent with two-digit multiplication or that students are fluent with multiplying binomials A single lesson does not accomplish either of these standards nor is it productive to have students simply practice this skill in isolation without building from conceptual understanding as described in one of the Principles to Actions mathematics teaching principles A sequence of lessons needs to include examples using concrete models or other appropriate representations to support students in developing strategies that provide a foundation for developing procedural fluency School leaders teachers and community stakeholders need to collaborate on how the curriculum is designed to provide access for all students how procedural fluency is built from conceptual understanding and how the curriculum aligns with the content standards and adopted textbooks To gain more insight read and discuss the ldquoCurriculumrdquo section in Principles to Actions (pp 70-77)
Mathematical Tools and Technology
An excellent mathematics program in Alabama seamlessly integrates tools and technology as essential resources to help students develop a deep understanding of mathematics communicate about mathematics foster fluency and support problem-solving Teachers and students should be provided with appropriate tools and technology to support student learning Students should use mathematical tools and technology in a variety of settings for a variety of purposes Teachers should design learning activities using tools and technology so that students are mastering concepts not just practicing skills For example base 10 blocks serve as a tool for learning mathematics and a document camera is technology which can share the display of base 10 blocks that students are manipulating to acquire conceptual understanding Interactive technology can help students explore mathematical ideas in order to increase their understanding of mathematics High school students may manipulate the graph of a function in a computer program using sliders that change the values in its equation in order to better understand particular types of functions Tools and technology can also be used to differentiate learning experiences Teachers should be provided with appropriate professional learning opportunities to support effective student use of these tools and technologies
8 2019 Alabama Course of Study Mathematics
School leaders teachers and community stakeholders need to analyze how mathematics classrooms currently incorporate tools and technology to develop studentsrsquo procedural fluency from conceptual understanding and how tools and technology can be further integrated to support the communication and understanding of mathematical ideas To gain more insight read and discuss ldquoTools and Technologyrdquo in Principles to Actions (pp 78-88)
Assessment of Mathematics Learning
An excellent mathematics program in Alabama includes formative assessment to inform future teaching decisions and summative assessment to assess studentsrsquo ability to problem-solve to demonstrate conceptual understanding and procedural skills and to provide feedback to inform students of their progress Two types of assessment summative and formative require attention in mathematics classrooms Traditionally instruction has focused on concluding a learning segment with summative assessments including tests projects quizzes or state assessments While use of summative assessments is essential such measures should be used to fully evaluate studentsrsquo mathematical proficiency including procedural fluency problem-solving ability and conceptual understanding To expand and improve summative assessment results students need opportunities throughout the school year to persevere with teacher support in struggling with cognitively demanding tasks Formative assessment occurs throughout this learning process as students solve tasks and teachers provide support through questioning During instruction teachers can learn a great deal about how students think as they draw on prior knowledge to solve novel problems Formative assessment is possible only when teachers are questioning studentsrsquo thinking during the learning process Formative assessments may include the use of questions that drive instructional-decision making exit slips or bell ringers teacher observation of student discourse reengagement lessons the ldquonumber talkrdquo format and evaluations of student work samples Formative assessment is a powerful tool for making instructional decisions that move student learning forward School leaders teachers and community stakeholders need to collaborate about how studentsrsquo thinking is formatively assessed during instruction and to analyze summative assessments in order to evaluate the extent to which problem-solving conceptual understanding and procedural skills are being addressed in mathematics classrooms To gain more insight read and discuss the ldquoAssessmentrdquo section in Principles to Actions (pp 89-98)
9 2019 Alabama Course of Study Mathematics
Professional Mathematics Teachers
An excellent mathematics program in Alabama requires educators to hold themselves and their colleagues accountable for seeking and engaging in professional growth to improve their practice as lifelong learners in order to promote student understanding of mathematics as a meaningful endeavor applicable to everyday life Professionals are dedicated to learning and improving their craft which ultimately benefits students To achieve growth in the five areas described in this section districts schools and teachers must recognize that continuous professional learning is required Designing and enacting effective lessons and valid assessments requires teachers to increase their knowledge and skill throughout their careers To prepare the next generation of thinkers the mathematics education community in Alabama (and beyond) must work together to support one another in learning Teaching in ways that promote student collaboration in learning mathematics from and with each other requires adults to model effective collaboration in their own learning and progress Teachers should embrace learning and professional growth Local school systems should provide face-to-face andor online professional learning specifically designed to address mathematics content and instruction for all teachers Active participation in state and national mathematics organizations and service as mentors to others are additional means through which teachers can collaborate with others and expand their practice State and national resources include Alabama Council of Teachers of Mathematics (ACTM) Alabama Learning Exchange (ALEX) Alabama Mathematics Science and Technology Initiative (AMSTI) and the National Council of Teachers of Mathematics (NCTM) School leaders teachers and community stakeholders need to collaborate on the amount of time provided and how effectively and productively the allotted time is used to plan curriculum and individual lessons reflect on instruction and design assessments to improve student learning outcomes To gain more insight read and discuss the ldquoProfessionalismrdquo section in Principles to Actions (pp 99-108) Finally we recommend that school leaders teachers and stakeholders read and discuss the ldquoTaking Actionrdquo section of Principles to Actions (pp 109-117) Discussing and reading Principles to Actions as a school community or mathematics department will stimulate productive conversations that can lead to classroom improvements which will support the mathematics learning for all students across Alabama
10 2019 Alabama Course of Study Mathematics
STUDENT MATHEMATICAL PRACTICES The Standards for Mathematical Practice called ldquoStudent Mathematical Practicesrdquo in this document describe varieties of expertise that mathematics educators at all levels should seek to develop in their students These practices are based on important processes and proficiencies that have long-standing importance in mathematics education The processes are the National Council of Teachers of Mathematics (NCTM) process standards of problem-solving reasoning and proof communication representation and connections The proficiencies are adaptive reasoning strategic competence conceptual understanding (comprehension of mathematical concepts operations and relations) procedural fluency (skill in carrying out procedures flexibly accurately efficiently and appropriately) and productive disposition (habitual inclination to see mathematics as sensible useful and worthwhile coupled with a belief in diligence and onersquos own efficacy) These are the strands of mathematical proficiency specified in the National Research Councilrsquos report Adding It Up Helping Children Learn Mathematics (2001) Most recently these Student Mathematical Practices have been supported by the National Assessment of Educational Progress (NAEP) in the draft of the 2025 NAEP Mathematics Framework which was open for public comment in the spring of 2019 The completed Mathematics Framework for the 2025 National Assessment of Educational Progress which was released November 21 2019 summarized the student mathematical practices into five NAEP Mathematical Practices and reaffirmed the importance of incorporating these approaches and behaviors in the study of mathematics at all levels The eight Student Mathematical Practices are listed below along with a description of behaviors and performances of mathematically proficient students Mathematically proficient students 1 Make sense of problems and persevere in solving them These students start by explaining to themselves the meaning of a problem and looking for entry points to its solution They analyze givens constraints relationships and goals They make conjectures about the form and meaning of the solution and plan a solution pathway rather than simply jumping into a solution attempt These students consider analogous problems and try special cases and simpler forms of the original problem in order to gain insight into its solution They monitor and evaluate their progress and change course if necessary Older students might depending on the context of the problem transform algebraic expressions or change the viewing window on their graphing calculators to obtain the information they need Mathematically proficient students can explain correspondences among equations verbal descriptions tables and graphs or draw diagrams of important features and relationships graph data and search for regularity or trends Younger students might rely on using concrete objects or pictures to help conceptualize and solve a problem Mathematically proficient students check their answers to problems using a different method and they continually ask themselves ldquoDoes this make senserdquo They can understand the approaches of others to solve complex problems and identify correspondences between different approaches
11 2019 Alabama Course of Study Mathematics
2 Reason abstractly and quantitatively Mathematically proficient students make sense of quantities and their relationships in problem situations They bring two complementary abilities to bear on problems involving quantitative relationships One is the ability to decontextualize to abstract a given situation represent it symbolically and manipulate the representing symbols as if they have a life of their own without necessarily attending to their referents The second is the ability to contextualize to pause as needed during the manipulation process in order to probe into the referents for the symbols involved Quantitative reasoning entails habits of creating a coherent representation of the problem at hand considering the units involved attending to the meaning of quantities not just how to compute them and knowing and flexibly using different properties of operations and objects 3 Construct viable arguments and critique the reasoning of others These students understand and use stated assumptions definitions and previously established results in constructing arguments They make conjectures and build a logical progression of statements to explore the truth of their conjectures They are able to analyze situations by breaking them into cases and can recognize and use counterexamples These students justify their conclusions communicate them to others and respond to the arguments of others They reason inductively about data making plausible arguments that take into account the context from which the data arose Mathematically proficient students are also able to compare the effectiveness of two plausible arguments distinguish correct logic or reasoning from that which is flawed and if there is a flaw in an argument explain what it is Elementary students can construct arguments using concrete referents such as objects drawings diagrams and actions Such arguments can make sense and be correct even though they are not generalized or made formal until the middle or upper grades Later students learn to determine domains to which an argument applies Students in all grades can listen to or read the arguments of others decide whether they make sense and ask useful questions to clarify or improve the arguments 4 Model with mathematics These students can apply the mathematics they know to solve problems arising in everyday life society and the workplace In early grades this might be as simple as writing an addition equation to describe a situation In middle grades students might apply proportional reasoning to plan a school event or analyze a problem in the community By high school students might use geometry to solve a design problem or use a function to describe how one quantity of interest depends on another Mathematically proficient students who can apply what they know are comfortable making assumptions and approximations to simplify a complicated situation realizing that these may need revision later They are able to identify important quantities in a practical situation and map their relationships using such tools as diagrams two-way tables graphs flowcharts and formulas and can analyze those relationships mathematically to draw conclusions They routinely interpret their mathematical results in the context of the situation and reflect on whether the results make sense possibly improving the model if it has not served its purpose 5 Use appropriate tools strategically Mathematically proficient students consider available tools when solving a mathematical problem These tools might include pencil and paper concrete models a ruler a protractor a calculator a spreadsheet a computer algebra system a statistical package or dynamic geometry software Proficient students are sufficiently familiar with tools appropriate for their grade or course to make sound decisions about when each of these tools might be helpful recognizing both the insight to be gained and the toolsrsquo limitations For example mathematically proficient high school students
12 2019 Alabama Course of Study Mathematics
analyze graphs of functions and solutions generated using a graphing calculator They detect possible errors by strategically using estimation and other mathematical knowledge When making mathematical models they know that technology can enable them to visualize the results of varying assumptions explore consequences and compare predictions with data Mathematically proficient students at various grade levels are able to identify relevant external mathematical resources such as digital content located on a Web site and use these to pose or solve problems They are able to use technological tools to explore and deepen their understanding of concepts 6 Attend to precision These students try to communicate mathematical ideas and concepts precisely They try to use clear definitions in discussion with others and in their own reasoning They state the meaning of the symbols they choose including using the equal sign consistently and appropriately Mathematically proficient students are careful about specifying units of measure and labeling axes to clarify the correspondence with quantities in a problem They calculate accurately and efficiently and express numerical answers with a degree of precision appropriate for the problem context In the elementary grades students give carefully formulated explanations to each other By the time they reach high school they have learned to examine claims and make explicit use of definitions 7 Look for and make use of structure Mathematically proficient students look closely to discern a pattern or structure Young students for example might notice that three and seven more is the same amount as seven and three more or they may sort a collection of shapes according to how many sides the shapes have Later students will see 7 times 8 equals 7 times 5 + 7 times 3 in preparation for learning about the distributive property In the expression x2 + 9x + 14 older students can see the 14 as 2 times 7 and the 9 as 2 + 7 They recognize the significance of an existing line in a geometric figure and can use the strategy of drawing an auxiliary line for solving problems These students also can pause and reflect for an overview or a shift in perspective They can observe the complexities of mathematics such as seeing some algebraic expressions as single objects or as being composed of several objects For example they can see 5 ndash 3(x ndash y)2 as 5 minus a positive number times a square and use that mental picture to realize that the value of the expression cannot be more than 5 for any real numbers x and y 8 Look for and express regularity in repeated reasoning Mathematically proficient students notice if calculations are repeated and look both for general methods and for shortcuts Upper elementary students might notice when dividing 25 by 11 that they are repeating the same calculations over and over again and conclude they have a repeating decimal By paying attention to the calculation of slope as they repeatedly check whether points are on the line through (1 2) with slope 3 middle school students might abstract the equation (y ndash 2)(x ndash 1) = 3 Noticing the regularity in the way terms cancel when expanding (x ndash 1) (x + 1) (x ndash 1)(x2 + x + 1) and (x ndash 1)(x3 + x2 + x + 1) might lead them to the general formula for the sum of a geometric series As students work to solve a problem mathematically proficient students maintain oversight of the process while attending to the details and continually evaluate the reasonableness of their intermediate results
13 2019 Alabama Course of Study Mathematics
Connecting the Student Mathematical Practices to the Standards for Mathematical Content
The eight Student Mathematical Practices described on the previous pages indicate ways in which developing student practitioners of the discipline of mathematics increasingly must engage with the subject matter as they grow in mathematical maturity and expertise throughout the elementary middle and high school years It is important that designers of curriculum assessment and professional development be aware of the need to connect the mathematical practices to the mathematical content standards The Student Mathematical Practices are a balanced combination of procedure and understanding Expectations that begin with the word ldquounderstandrdquo are often especially good opportunities to connect mathematical practices to mathematical content Students who lack understanding of a topic may rely too heavily on procedures Without a flexible base from which to work they may be less likely to consider analogous problems represent problems coherently justify conclusions apply the mathematics to practical situations use technology mindfully to work with the mathematics explain the mathematics accurately to other students pause for an overview or deviate from a known procedure to find a shortcut Thus a lack of understanding effectively prevents a student from engaging in the mathematical practices In this respect those content standards which set an expectation of understanding are potential ldquopoints of intersectionrdquo between the Student Mathematical Practices and the Standards for Mathematical Content These points of intersection are intended to be weighted toward central and generative concepts in the school mathematics curriculum that most merit the time resources innovative energies and focus needed to qualitatively improve curriculum instruction assessment professional development and student achievement in mathematics
14 2019 Alabama Course of Study Mathematics
DIRECTIONS FOR INTERPRETING CONTENT STANDARDS GRADES K ndash 8
The 2019 Alabama Course of Study Mathematics for Grades K-8 is organized around the following elements Student Mathematical Practices Alabama Content Areas Clusters and Content Standards These four elements are explained below The Student Mathematical Practices represent what students are doing as they learn mathematics These practices are processes and proficiencies in which students should regularly engage as they learn mathematics Proficiency with these practices is critical in using mathematics both within the classroom and in life These practices are identified at the beginning of each grade band and are to be incorporated across all grades Alabama Content Areas are large groups of related clusters and content standards In the example on the next page the Alabama Content Area is ldquoOperations with Numbers Base Tenrdquo Standards from different Alabama Content Areas may be closely related Clusters group related content standards The cluster in the example is ldquoExtend the counting sequencerdquo Because mathematics is a connected subject standards from different clusters may sometimes be closely related Content Standards listed to the right of each cluster contain the minimum required content and define what students should know and be able to do at the conclusion of a course or grade Some have sub-standards indicated with a b c d which are extensions of the content standards and are also required Some standards are followed by examples which are not required to be taught When standards indicate that drawings may be used the drawings need not show details but should show the mathematics in the problem The order in which standards are listed within a course or grade is not intended to convey a sequence for instruction Each content standard completes the stem ldquoStudents willrdquo The course of study does not dictate curriculum teaching methods or sequence Each local education authority (LEA) should create its own curriculum and pacing guide based on the Course of Study LEAs may add standards to meet local needs and incorporate local resources Even though one topic may be listed before another the first topic does not have to be taught before the second A teacher may choose to teach the second topic before the first to teach both at the same time to highlight connections or to select a different topic that leads to students reaching the standards for both topics
15 2019 Alabama Course of Study Mathematics
GRADE 1
DIRECTIONS FOR INTERPRETING THE CONTENT STANDARDS HIGH SCHOOL
Standards in the required high school courses of the 2019 Alabama Course of Study Mathematics are organized in alignment with the essential concepts described by National Council of Teachers of Mathematics (2018) which embody the concepts and skills that all students need to build their mathematical foundation for the continued study of mathematics and for future mathematical needs The essential concepts are listed the left side of the table They are divided among four Alabama Content Areas (Number Algebra and Functions Data Analysis Statistics and Probability and Geometry and Measurement) which appear as headings above the list of standards for each course Each content area (except Number) is further organized into several focus areas (groups of related concepts) similar to clusters in Grades K-8 These focus areas appear as headings above the standards Content Standards support attainment of the essential concepts and are written beside them in the table These numbered standards define what students should understand (know) and be able to do at the conclusion of a course or grade Content standards contain minimum required content Some have sub-standards
Standard Number
Content Standard
Cluster
Alabama Content Area
16 2019 Alabama Course of Study Mathematics
indicated with a b c d which are extensions of the content standards and are also required Some standards are followed by examples which are not required to be taught Some related standards appear across multiple high school courses In many cases there is a bold print statement to indicate the scope of the standard and to align the content that is taught across the courses The full scope of every standard should be addressed during instruction The order in which standards are listed within a course or grade is not intended to convey a sequence for instruction When standards indicate that drawings may be used the drawings need not show details but should show the mathematics in the problem Each content standard completes the stem ldquoStudents willrdquo The essential concepts are used to organize the required courses Geometry with Data Analysis Algebra I with Probability and Algebra II with Statistics The specialized courses taken after Algebra II with Statistics are organized in ways related to their specific subject matter which extend beyond the essential concepts to directly support studentsrsquo professional and personal goals
Alabama Content Area Focus Area
Essential Concept
Content Standard
Content Standard Number
17 2019 Alabama Course of Study Mathematics
GRADES K-2 OVERVIEW The K-2 section of the 2019 Alabama Course of Study Mathematics focuses on developing the foundations of mathematics As the diagram illustrates below K-2 students actively explore and investigate the meaning and relationships of numbers through Foundations of Counting Operations with Numbers Base Ten Operations and Algebraic Thinking Data Analysis Measurement and Geometry which are identified as Alabama Content Areas Students grow in mathematical understanding from year to year as they use the Student Mathematical Practices and attain the content standards The K-2 standards establish the groundwork for future mathematical success
The Alabama Content Areas shown below illustrate a progression designed to ensure that all students are equitably prepared to develop conceptual understanding of mathematics The NAEP (National Assessment of Educational Progress) content areas reflect an emphasis on the importance of mathematical reasoning throughout the full spectrum of mathematical content Alabama Content Areas explicitly define the framework needed for students to develop a comprehensive understanding of underlying mathematics concepts
18 2019 Alabama Course of Study Mathematics
Kindergarten Mathematics Overview
Kindergarten content is organized into six Alabama Content Areas as outlined in the table below Foundations of Counting Operations and Algebraic Thinking Operations with Numbers Base Ten Data Analysis Measurement and Geometry Related standards are grouped into clusters which are listed below each content area Standards indicate what the student should know or be able to do by the end of the grade
Alabama Content Areas
Foundations of
Counting
Operations and Algebraic
Thinking
Operations with Numbers Base
Ten
Data Analysis
Measurement
Geometry
Clusters
bull Know number names and the count sequence
bull Count to tell the number of objects
bull Compare numbers
bull Understand addition as putting together and adding to and understand subtraction as taking apart and taking from
bull Understand simple patterns
bull Work with numbers 11-19 to gain foundations for place value
bull Collect and analyze data and interpret results
bull Describe and compare measurable attributes
bull Identify and describe shapes
bull Analyze compare create and compose shapes
The eight Student Mathematical Practices listed in the chart below represent what students are doing as they learn mathematics Students should regularly engage in these processes and proficiencies at every level throughout their mathematical studies Proficiency with these practices is critical in using mathematics in the classroom and in everyday life The Student Mathematical Practices are standards to be incorporated across all grades
Student Mathematical Practices 1 Make sense of problems and persevere in solving them 5 Use appropriate tools strategically 2 Reason abstractly and quantitatively 6 Attend to precision 3 Construct viable arguments and critique the reasoning of others 7 Look for and make use of structure 4 Model with mathematics 8 Look for and express regularity in repeated reasoning
Content Priorities In kindergarten instructional time should focus on two critical areas
1 developing a sound sense of numbers by representing and comparing numbers using sets of objects and 2 recognizing and describing shapes and using spatial relations
Kindergarten Mathematics
19 2019 Alabama Course of Study Mathematics
The majority of learning time should be focused on number sense
1 Through their learning in the Foundations of Counting and Operations and Algebraic Thinking Alabama Content Areas students bull develop a formal sense of numbers including number sequence one-to-one correspondence cardinality and subitizing bull use numbers including written numerals to represent quantities and to solve quantitative problems such as counting objects in a set
counting out a given number of objects comparing sets or numerals and modeling simple joining and separating situations with sets of objects eventually with equations such as 5 + 2 = 7 and 7 ndash 2 = 5 (Note Kindergarten students should see addition and subtraction equations and student writing of equations in kindergarten is encouraged but not required)
bull choose combine and apply effective strategies for answering quantitative questions including quickly recognizing the cardinalities of small sets of objects counting and producing sets of given sizes counting the number of objects in combined sets or counting the number of objects that remain in a set after some are taken away and
bull duplicate and extend simple patterns by using concrete objects (Note Looking for duplicating and extending patterns are important processes in thinking algebraically)
2 Through their learning in the Geometry and Measurement Alabama Content Areas students
bull describe objects in their physical world using both mathematical vocabulary and geometric ideas bull identify name and describe basic two-dimensional shapes such as squares triangles circles rectangles and hexagons presented in a
variety of ways (eg in different sizes and orientations) bull identify three-dimensional shapes such as cubes cones cylinders and spheres bull use basic shapes and spatial reasoning to model objects in their environment to create and compose more complex shapes and bull explore pennies
(Note The term explore indicates that the topic is an important concept which builds the foundation for progression toward mastery in later grades)
When standards indicate that drawings may be used the drawings need not be detailed but should show the mathematics in the problem NOTE Although not all content areas in the grade level have been included in the overview all standards should be included in instruction
Kindergarten Mathematics
20 2019 Alabama Course of Study Mathematics
Kindergarten Content Standards
Each content standard completes the stem ldquoStudents willhelliprdquo Foundations of Counting Know number names and the count sequence Note on number reversals Learning to write numerals is generally more difficult than learning to read them It is common for students to reverse numerals at this stage
1 Count forward orally from 0 to 100 by ones and by tens Count backward orally from 10 to 0 by ones
2 Count to 100 by ones beginning with any given number between 0 and 99
3 Write numerals from 0 to 20 a Represent 0 to 20 using concrete objects when given a written numeral from 0 to 20 (with 0 representing a
count of no objects)
Count to tell the number of objects
4 Connect counting to cardinality using a variety of concrete objects a Say the number names in consecutive order when counting objects b Indicate that the last number name said tells the number of objects counted in a set c Indicate that the number of objects in a set is the same regardless of their arrangement or the order in
which they were counted d Explain that each successive number name refers to a quantity that is one larger
5 Count to answer ldquohow manyrdquo questions
a Count using no more than 20 concrete objects arranged in a line a rectangular array or a circle b Count using no more than 10 concrete objects in a scattered configuration c Draw the number of objects that matches a given numeral from 0 to 20
Compare numbers 6 Orally identify whether the number of objects in one group is greatermore than lessfewer than or equalthe
same as the number of objects in another group in groups containing up to 10 objects by using matching counting or other strategies
7 Compare two numbers between 0 and 10 presented as written numerals (without using inequality symbols)
Kindergarten Mathematics
21 2019 Alabama Course of Study Mathematics
Operations and Algebraic Thinking Understand addition as putting together and adding to and understand subtraction as taking apart and taking from Note Drawings need not be detailed but should show the mathematics in the problem
8 Represent addition and subtraction up to 10 with concrete objects fingers pennies mental images drawings claps or other sounds acting out situations verbal explanations expressions or equations
9 Solve addition and subtraction word problems and add and subtract within 10 by using concrete objects or drawings to represent the problem
10 Decompose numbers less than or equal to 10 into pairs of smaller numbers in more than one way by using
concrete objects or drawings and record each decomposition by a drawing or equation Example 5 = 2 + 3 and 5 = 4 + 1
11 For any number from 0 to 10 find the number that makes 10 when added to the given number by using concrete objects or drawings and record the answer with a drawing or equation
12 Fluently add and subtract within 5
Understand simple patterns
13 Duplicate and extend simple patterns using concrete objects
Operations with Numbers Work with numbers 11-19 to gain foundations for place value
14 Compose and decompose numbers from 11 to 19 by using concrete objects or drawings to demonstrate understanding that these numbers are composed of ten ones and one two three four five six seven eight or nine ones
Data Analysis Collect and analyze data and interpret results
15 Classify objects into given categories of 10 or fewer count the number of objects in each category and sort the categories by count a Categorize data on Venn diagrams pictographs and yes-no charts using real objects symbolic
representations or pictorial representations
Kindergarten Mathematics
22 2019 Alabama Course of Study Mathematics
Measurement Describe and compare measurable attributes
16 Identify and describe measurable attributes (length weight height) of a single object using vocabulary such as longshort heavylight or tallshort
17 Directly compare two objects with a measurable attribute in common to see which object has ldquomore ofrdquo or ldquoless ofrdquo the attribute and describe the difference Example Directly compare the heights of two children and describe one child as ldquotallerrdquo or ldquoshorterrdquo
Geometry Identify and describe shapes (squares circles triangles rectangles hexagons cubes cones cylinders and spheres)
18 Describe objects in the environment using names of shapes and describe the relative positions of these objects using terms such as above below beside in front of behind and next to
19 Correctly name shapes regardless of their orientations or overall sizes
20 Identify shapes as two-dimensional (lying in a plane ldquoflatrdquo) or three-dimensional (ldquosolidrdquo)
Analyze compare create and compose shapes
21 Analyze and compare two- and three-dimensional shapes in different sizes and orientations using informal language to describe their similarities differences parts (number of sides and vertices or ldquocornersrdquo) and other attributes Example having sides of equal length
22 Model shapes in the world by building them from sticks clay balls or other components and by drawing them 23 Use simple shapes to compose larger shapes
Example Join two triangles with full sides touching to make a rectangle
23 2019 Alabama Course of Study Mathematics
Grade 1 Mathematics Overview
Grade 1 content is organized into five Alabama Content Areas as outlined in the table below Operations and Algebraic Thinking Operations with Numbers Base Ten Data Analysis Measurement and Geometry Related standards are grouped into clusters which are listed below each content area Standards indicate what the student should know or be able to do by the end of the grade
Alabama
Content Areas Operations and Algebraic Thinking Operations with Numbers Base Ten Data Analysis Measurement Geometry
Clusters
bull Represent and solve problems involving addition and subtraction
bull Understand and apply properties of operations and the relationship between addition and subtraction
bull Add and subtract within 20 bull Work with addition and subtraction
equations bull Understand simple patterns
bull Extend the counting sequence
bull Understand place value bull Use place value
understanding and properties of operations to add and subtract
bull Collect and analyze data and interpret results
bull Describe and compare measurable attributes
bull Work with time and money
bull Reason with shapes and their attributes
The eight Student Mathematical Practices listed in the chart below represent what students are doing as they learn mathematics Students should regularly engage in these processes and proficiencies at every level throughout their mathematical studies Proficiency with these practices is critical in using mathematics both in the classroom and in everyday life The Student Mathematical Practices are standards to be incorporated across all grades
Student Mathematical Practices 1 Make sense of problems and persevere in solving them 5 Use appropriate tools strategically 2 Reason abstractly and quantitatively 6 Attend to precision 3 Construct viable arguments and critique the reasoning of others 7 Look for and make use of structure 4 Model with mathematics 8 Look for and express regularity in repeated reasoning
Grade 1 Mathematics
24 2019 Alabama Course of Study Mathematics
Content Priorities
In Grade 1 instructional time should focus on four critical areas 1 developing understanding of addition subtraction and strategies for addition and subtraction within 20 2 developing understanding of whole number relationships and place value including grouping in tens and ones 3 developing understanding of linear measurement and measuring lengths as iterating length units and 4 reasoning about attributes of and composing and decomposing geometric shapes
Important information regarding these four critical areas of instruction follows 1 Through their learning in the Operations and Algebraic Thinking Alabama Content Area students
bull develop strategies for adding and subtracting whole numbers based on prior work with small numbers bull use a variety of models including concrete objects and length-based models such as cubes connected to form lengths to model add-to
take-from put-together take-apart and compare situations as a means of developing meaning for the operations of addition and subtraction and developing strategies to solve arithmetic problems with these operations
bull understand connections between counting and addition and subtraction (eg adding two is the same as counting on two) bull use properties of addition to add whole numbers and to create and use increasingly sophisticated strategies based on these properties
such as ldquomaking tensrdquo to solve addition and subtraction problems within 20 bull build their understanding of the relationship between addition and subtraction by comparing a variety of solution strategies and bull reproduce extend and create patterns and sequences of numbers using a variety of materials
Note Reproducing extending and creating patterns are important processes in thinking algebraically 2 Through their learning in the Operations with Numbers Base Ten Alabama Content Area students
bull develop discuss and use efficient accurate and generalizable methods to add within 100 and to subtract multiples of 10 bull compare whole numbers at least to 100 to develop understanding of and solve problems involving their relative sizes bull think of whole numbers between 10 and 99 in terms of tens and ones (especially recognizing the numbers 11 to 19 as composed of a ten
and some ones) and bull understand the order of the counting numbers and their relative magnitudes through activities that build number sense
3 Through their learning in the Measurement Alabama Content Area students
bull develop an understanding of the meaning and processes of measurement including underlying concepts such as iterating (the mental activity of building up the length of an object with equal-sized units) and the transitivity principle for indirect measurement and
bull work with time and money
Grade 1 Mathematics
25 2019 Alabama Course of Study Mathematics
Note Students should apply the principle of transitivity of measurement to make indirect comparisons although they need not use this technical term
4 Through their learning in the Geometry Alabama Content Area students bull compose and decompose plane or solid figures including putting two triangles together to make a quadrilateral and build understanding
of part-whole relationships as well as the properties of the original and composite shapes and bull combine shapes recognize them from different perspectives and orientations describe their geometric attributes and determine how they
are alike and different to develop the background for measurement and initial understandings of properties such as congruence and symmetry for use in later grades
NOTE Although not all content areas in the grade level have been included in the overview all standards should be included in instruction
Grade 1 Content Standards Each content standard completes the stem ldquoStudents willhelliprdquo Operations and Algebraic Thinking Represent and solve problems involving addition and subtraction Note Students use properties of operations and different strategies to find the sum of three whole numbers such as counting on making tens decomposing numbers doubles and near doubles
1 Use addition and subtraction to solve word problems within 20 by using concrete objects drawings and equations with a symbol for the unknown number to represent the problem a Add to with change unknown to solve word problems within 20 b Take from with change unknown to solve word problems within 20 c Put togethertake apart with addend unknown to solve word problems within 20 d Compare quantities with difference unknown bigger unknown and smaller unknown while solving word
problems within 20
2 Solve word problems that call for addition of three whole numbers whose sum is less than or equal to 20 by using concrete objects drawings or equations with a symbol for the unknown number to represent the problem
Grade 1 Mathematics
26 2019 Alabama Course of Study Mathematics
Understand and apply properties of operations and the relationship between addition and subtraction Note Students need not use formal terms for these properties
3 Apply properties of operations as strategies to add and subtract Examples If 8 + 3 = 11 is known then 3 + 8 = 11 is also known (commutative property of addition) To add 2 + 6 + 4 the second and third numbers can be added to make a ten so 2 + 6 + 4 = 2 + 10 = 12 (associative property of addition) When adding 0 to a number the result is the same number (identity property of zero for addition)
4 Explain subtraction as an unknown-addend problem Example subtracting 10 - 8 by finding the number that makes 10 when added to 8
Add and subtract within 20 Note Fluency involves a mixture of ldquojust knowingrdquo answers knowing answers from patterns and knowing answers from the use of strategies The word fluently is used in the standards to mean accurately efficiently and flexibly
5 Relate counting to addition and subtraction Example counting on 2 to add 2 6 Add and subtract within 20
a Demonstrate fluency with addition and subtraction facts with sums or differences to 10 by counting on b Demonstrate fluency with addition and subtraction facts with sums or differences to 10 by making ten c Demonstrate fluency with addition and subtraction facts with sums or differences to 10 by decomposing a
number leading to a ten Example 13 - 4 = 13 - 3 - 1 = 10 - 1 = 9
d Demonstrate fluency with addition and subtraction facts with sums or differences to 10 by using the relationship between addition and subtraction Example Knowing that 8 + 4 = 12 one knows 12 - 8 = 4
e Demonstrate fluency with addition and subtraction facts with sums or differences to 10 by creating equivalent but easier or known sums Example adding 6 + 7 by creating the known equivalent 6 + 6 + 1 = 12 + 1 = 13
Work with addition and subtraction equations
7 Explain that the equal sign means ldquothe same asrdquo Determine whether equations involving addition and subtraction are true or false Example determining which of the following equations are true and which are false 6 = 6 7 = 8 ndash 1 5 + 2 = 2 + 5 4 + 1 = 5 + 2
8 Solve for the unknown whole number in various positions in an addition or subtraction equation relating three whole numbers that would make it true Example determining the unknown number that makes the equation true in each of the equations 8 + = 11 5 = ndash 3 and 6 + 6 =
Grade 1 Mathematics
27 2019 Alabama Course of Study Mathematics
Understand simple patterns
9 Reproduce extend and create patterns and sequences of numbers using a variety of materials
Operations with Numbers Base Ten Extend the counting sequence
10 Extend the number sequence from 0 to 120 a Count forward and backward by ones starting at any number less than 120 b Read numerals from 0 to 120 c Write numerals from 0 to 120 d Represent a number of objects from 0 to 120 with a written numeral
Understand place value 11 Explain that the two digits of a two-digit number represent amounts of tens and ones a Identify a bundle of ten ones as a ldquotenrdquo b Identify the numbers from 11 to 19 as composed of a ten and one two three four five six seven eight or nine
ones c Identify the numbers 10 20 30 40 50 60 70 80 90 as one two three four five six seven eight or nine tens
(and 0 ones)
12 Compare pairs of two-digit numbers based on the values of the tens and ones digits recording the results of comparisons with the symbols gt = and lt and orally with the words ldquois greater thanrdquo ldquois equal tordquo and ldquois less thanrdquo
Use place value understanding and properties of operations to add and subtract
13 Add within 100 using concrete models or drawings and strategies based on place value a Add a two-digit number and a one-digit number b Add a two-digit number and a multiple of 10 c Demonstrate that in adding two-digit numbers tens are added to tens ones are added to ones and sometimes it is
necessary to compose a ten d Relate the strategy for adding a two-digit number and a one-digit number to a written method and explain the
reasoning used 14 Given a two-digit number mentally find 10 more or 10 less than the number without having to count and explain
the reasoning used 15 Subtract multiples of 10 from multiples of 10 in the range 10-90 (positive or zero differences) using concrete
models or drawings and strategies based on place value properties of operations andor the relationship between addition and subtraction Relate the strategy to a written method and explain the reasoning used
Grade 1 Mathematics
28 2019 Alabama Course of Study Mathematics
Data Analysis Collect and analyze data and interpret results
16 Organize represent and interpret data with up to three categories a Ask and answer questions about the total number of data points in organized data b Summarize data on Venn diagrams pictographs and yes-no charts using real objects symbolic
representations or pictorial representations c Determine ldquohow manyrdquo in each category using up to three categories of data d Determine ldquohow many morerdquo or ldquohow many lessrdquo are in one category than in another using data organized
into two or three categories
Measurement Describe and compare measurable attributes
17 Order three objects by length compare the lengths of two objects indirectly by using a third object 18 Determine the length of an object using non-standard units with no gaps or overlaps expressing the length of the
object with a whole number
Work with time and money
19 Tell and write time to the hours and half hours using analog and digital clocks 20 Identify pennies and dimes by name and value
Geometry Reason with shapes and their attributes Note Students do not need to learn formal names such as ldquoright rectangular prismrdquo
21 Build and draw shapes which have defining attributes a Distinguish between defining attributes and non-defining attributes Examples Triangles are closed and three- sided which are defining attributes color orientation and overall
size are non-defining attributes 22 Compose two-dimensional shapes (rectangles squares trapezoids triangles half-circles and quarter-circles) or
three-dimensional shapes (cubes right rectangular prisms right circular cones and right circular cylinders) to create a composite shape and compose new shapes from the composite shape
Grade 1 Mathematics
29 2019 Alabama Course of Study Mathematics
23 Partition circles and rectangles into two and four equal shares and describe the shares using the words halves fourths and quarters and use the phrases half of fourth of and quarter of a Describe ldquothe wholerdquo as two of or four of the shares of circles and rectangles partitioned into two or four equal
shares b Explain that decomposing into more equal shares creates smaller shares of circles and rectangles
30 2019 Alabama Course of Study Mathematics
Grade 2 Mathematics Overview
Grade 2 content is organized into five Alabama Content Areas as outlined in the table below Operations and Algebraic Thinking Operations with Numbers Base Ten Data Analysis Measurement and Geometry Related standards are grouped into clusters which are listed below each content area Standards indicate what the student should know or be able to do by the end of the grade
Alabama
Content Areas
Operations and Algebraic Thinking
Operations with Numbers Base Ten
Data Analysis
Measurement Geometry
Clusters
bull Represent and solve problems involving addition and subtraction
bull Add and subtract within 20 bull Work with equal groups of
objects to gain foundations for multiplication
bull Understand simple patterns
bull Understand place value
bull Use place value understanding and properties of operations to add and subtract
bull Collect and analyze data and interpret results
bull Measure and estimate lengths in standard units
bull Relate addition and subtraction to length
bull Work with time and money
bull Reason with shapes and their attributes
The eight Student Mathematical Practices listed in the chart below represent what students are doing as they learn mathematics Students should regularly engage in these processes and proficiencies at every level throughout their mathematical studies Proficiency with these practices is critical in using mathematics in the classroom and in everyday life The Student Mathematical Practices are standards which should be incorporated across all grades
Student Mathematical Practices 1 Make sense of problems and persevere in solving them 5 Use appropriate tools strategically 2 Reason abstractly and quantitatively 6 Attend to precision 3 Construct viable arguments and critique the reasoning of others 7 Look for and make use of structure 4 Model with mathematics 8 Look for and express regularity in repeated reasoning
Content Priorities
In Grade 2 instructional time should focus on four critical areas
1 building fluency with addition and subtraction 2 extending understanding of base-ten notation 3 using standard units of measure and 4 describing and analyzing shapes
Grade 2 Mathematics
31 2019 Alabama Course of Study Mathematics
Important information regarding these four critical areas of instruction follows 1 Through their learning in the Operations and Algebraic Thinking Alabama Content Area students
bull use their understanding of addition to develop fluency with addition and subtraction within 100 including ability to state automatically the sums of all one-digit numbers by the end of the grade
bull solve problems within 1000 by applying their understanding of models for addition and subtraction and develop discuss and use efficient accurate and generalizable methods to compute sums and differences of whole numbers in base-ten notation using their understanding of place value and the properties of operations
bull select and accurately apply methods that are appropriate for the context and the numbers involved to mentally calculate sums and differences for numbers with only tens or only hundreds and
bull reproduce extend create and describe patterns and sequences using a variety of materials Note Reproducing extending creating and describing patterns are important processes in thinking algebraically
2 Through their learning in the Operations with Numbers Base Ten Alabama Content Area students
bull extend their understanding of the base-ten system This includes ideas of counting in fives tens and multiples of hundreds tens and ones as well as number relationships involving these units including comparing and
bull understand multi-digit numbers (up to 1000) written in base-ten notation recognizing that the digits in each place represent amounts of thousands hundreds tens or ones (eg 853 is 8 hundreds + 5 tens + 3 ones)
3 Through their learning in the Measurement Alabama Content Area students
bull recognize the need for standard units of measure including centimeter and inch and use rulers and other measurement tools with the understanding that linear measure involves an iteration of units and
bull recognize that the smaller the unit the more iterations are needed to cover a given length
4 Through their learning in the Geometry Alabama Content Area students bull describe and analyze shapes by examining their sides and angles bull investigate describe and reason about decomposing and combining shapes to make other shapes and bull draw partition and analyze two- and three-dimensional shapes to develop a foundation for understanding area volume congruence
similarity and symmetry in later grades When standards indicate that drawings may be used the drawings need not be detailed but should show the mathematics in the problem NOTE Although not all content areas in the grade level have been included in the overview all standards should be included in instruction
Grade 2 Mathematics
32 2019 Alabama Course of Study Mathematics
Note fluency vs automaticity Fluency involves a mixture of ldquojust knowingrdquo answers knowing answers from patterns and knowing answers from the use of strategies The word fluently is used in the standards to mean accurately efficiently and flexibly Automaticity of facts becomes evident when a student no longer uses a pattern or mental algorithm to determine the answer
Grade 2 Content Standards Each content standard completes the stem ldquoStudents willhelliprdquo Operations and Algebraic Thinking Represent and solve problems involving addition and subtraction Note Second grade problem types include adding to taking from putting together taking apart and comparing with unknowns in all positions
1 Use addition and subtraction within 100 to solve one- and two-step word problems by using drawings and equations with a symbol for the unknown number to represent the problem
Add and subtract within 20 See note regarding fluency vs automaticity in the Overview
2 Fluently add and subtract within 20 using mental strategies such as counting on making ten decomposing a number leading to ten using the relationship between addition and subtraction and creating equivalent but easier or known sums a State automatically all sums of two one-digit numbers
Work with equal groups of objects to gain foundations for multiplication
3 Use concrete objects to determine whether a group of up to 20 objects is even or odd a Write an equation to express an even number as a sum of two equal addends
4 Using concrete and pictorial representations and repeated addition determine the total number of objects in a
rectangular array with up to 5 rows and up to 5 columns a Write an equation to express the total number of objects in a rectangular array with up to 5 rows and up to 5
columns as a sum of equal addends Understand simple patterns
5 Reproduce extend create and describe patterns and sequences using a variety of materials
Grade 2 Mathematics
33 2019 Alabama Course of Study Mathematics
Operations with Numbers Base Ten Understand place value 6 Explain that the three digits of a three-digit number represent amounts of hundreds tens and ones
a Explain the following three-digit numbers as special cases 100 can be thought of as a bundle of ten tens called a ldquohundredrdquo and the numbers 100 200 300 400 500 600 700 800 900 refer to one two three four five six seven eight or nine hundreds (and 0 tens and 0 ones)
7 Count within 1000 by ones fives tens and hundreds 8 Read and write numbers to 1000 using base-ten numerals number names and expanded form 9 Compare two three-digit numbers based on the value of the hundreds tens and ones digits recording the results of
comparisons with the symbols gt = and lt and orally with the words ldquois greater thanrdquo ldquois equal tordquo and ldquois less thanrdquo
Use place value understanding and properties of operations to add and subtract
10 Fluently add and subtract within 100 using strategies based on place value properties of operations andor the relationship between addition and subtraction
11 Use a variety of strategies to add up to four two-digit numbers 12 Add and subtract within 1000 using concrete models or drawings and strategies based on place value properties of
operations andor the relationship between addition and subtraction relate the strategy to a written method a Explain that in adding or subtracting three-digit numbers one adds or subtracts hundreds and hundreds tens
and tens ones and ones and sometimes it is necessary to compose or decompose tens or hundreds 13 Mentally add and subtract 10 or 100 to a given number between 100 and 900
14 Explain why addition and subtraction strategies work using place value and the properties of operations
Note Explanations may be supported by drawings or objects
Grade 2 Mathematics
34 2019 Alabama Course of Study Mathematics
Data Analysis Collect and analyze data and interpret results
15 Measure lengths of several objects to the nearest whole unit a Create a line plot where the horizontal scale is marked off in whole-number units to show the lengths of several
measured objects 16 Create a picture graph and bar graph to represent data with up to four categories
a Using information presented in a bar graph solve simple ldquoput-togetherrdquo ldquotake-apartrdquo and ldquocomparerdquo problems
b Using Venn diagrams pictographs and yes-no charts analyze data to predict an outcome
Measurement Measure and estimate lengths in standard units
17 Measure the length of an object by selecting and using standard units of measurement shown on rulers yardsticks meter sticks or measuring tapes
18 Measure objects with two different units and describe how the two measurements relate to each other and the size
of the unit chosen 19 Estimate lengths using the following standard units of measurement inches feet centimeters and meters
20 Measure to determine how much longer one object is than another expressing the length difference of the two
objects using standard units of length
Relate addition and subtraction to length
21 Use addition and subtraction within 100 to solve word problems involving same units of length representing the problem with drawings (such as drawings of rulers) andor equations with a symbol for the unknown number
22 Create a number line diagram using whole numbers and use it to represent whole-number sums and differences
within 100
Work with time and money
23 Tell and write time from analog and digital clocks to the nearest five minutes using am and pm a Express an understanding of common terms such as but not limited to quarter past half past and quarter to
Grade 2 Mathematics
35 2019 Alabama Course of Study Mathematics
24 Solve problems with money a Identify nickels and quarters by name and value b Find the value of a collection of quarters dimes nickels and pennies c Solve word problems by adding and subtracting within one dollar using the $ and cent symbols appropriately (not
including decimal notation) Example 24cent + 26cent = 50cent
Geometry Reason with shapes and their attributes
25 Identify triangles quadrilaterals pentagons hexagons and cubes a Recognize and draw shapes having specified attributes
Examples a given number of angles or a given number of equal faces 26 Partition a rectangle into rows and columns of same-size squares and count to find the total number of squares 27 Partition circles and rectangles into two three or four equal shares Describe the shares using such terms as
halves thirds half of or a third of and describe the whole as two halves three thirds or four fourths a Explain that equal shares of identical wholes need not have the same shape
36
2019 Alabama Course of Study Mathematics
GRADES 3-5 OVERVIEW The Grades 3-5 course of study focuses on strengthening the foundations of mathematics empowering students for middle school mathematics and developing their understanding of mathematics in relation to everyday life To ensure that all students receive the preparation they deserve instruction will focus on building conceptual understanding of the mathematics needed for a lifetime Students in Grades 3-5 will extend their learning through content areas of Operations with Numbers Base Ten Operations with Numbers Fractions Operations and Algebraic Thinking Data Analysis Measurement and Geometry In order to achieve the necessary focus on Grades 3-5 content Student Mathematical Practices are integrated with instruction to foster habits of mind as students engage in critical areas for each grade level The Alabama Content Areas shown below illustrate a progression designed to ensure that all students are equitably prepared to develop conceptual understanding of mathematics The NAEP (National Assessment of Educational Progress) content areas reflect an emphasis on the importance of mathematical reasoning throughout the full spectrum of mathematical content Alabama Content Areas explicitly define the framework needed for students to develop a comprehensive understanding of underlying mathematics concepts
37 2019 Alabama Course of Study Mathematics
Grade 3 Overview Grade 3 content is organized into six Alabama Content Areas of study as outlined in the table below Operations and Algebraic Thinking Operations with Numbers Base Ten Operations with Numbers Fractions Data Analysis Measurement and Geometry Related standards are grouped into clusters which are listed below each content area Standards indicate what the student should know or be able to do by the end of the grade
Alabama
Content Areas Operations and Algebraic
Thinking
Operations with Numbers Base Ten
Operations with Numbers Fractions Data Analysis Measurement Geometry
Clusters
bull Represent and solve problems involving multiplication and division
bull Understand properties of multiplication and the relationship between multiplication and division
bull Multiply and divide within 100
bull Solve problems involving the four operations and identify and explain patterns in arithmetic
bull Use place value understanding and properties of operations to perform multi-digit arithmetic
bull Develop understanding of fractions as numbers
bull Represent and interpret data
bull Solve problems involving measurement and estimation of intervals of time liquid volumes and masses of objects
bull Geometric measurement understand concepts of area and relate area to multiplication and addition
bull Geometric measurement recognize perimeter as an attribute of plane figures and distinguish between linear and area measures
bull Reason with shapes and their attributes
The eight Student Mathematical Practices listed in the chart below represent what students are doing as they learn mathematics Students should regularly engage in these processes and proficiencies at every level throughout their mathematical studies Proficiency with these practices is critical in using mathematics both in the classroom and in everyday life The Student Mathematical Practices should be regarded as standards to be incorporated across all grades
Student Mathematical Practices
1 Make sense of problems and persevere in solving them 5 Use appropriate tools strategically 2 Reason abstractly and quantitatively 6 Attend to precision 3 Construct viable arguments and critique the reasoning of others 7 Look for and make use of structure 4 Model with mathematics 8 Look for and express regularity in repeated reasoning
Grade 3 Mathematics
38 2019 Alabama Course of Study Mathematics
Content Priorities In Grade 3 instructional time should focus on four critical areas 1 developing understanding of multiplication and division and strategies for multiplication and division within 100 2 developing understanding of fractions especially unit fractions (fractions with numerator 1) 3 developing understanding of the structure of rectangular arrays and of area and 4 describing and analyzing two-dimensional shapes
1 Through their learning in the Operations and Algebraic Thinking Alabama Content Area students
bull develop an understanding of the meanings of multiplication and division of whole numbers through activities and problems involving equal-sized groups arrays and area models multiplication is finding an unknown product and division is finding an unknown factor in these situations For equal-sized group situations division can require finding the unknown number of groups or the unknown group size
bull use properties of operations to calculate products of whole numbers using increasingly sophisticated strategies based on these properties to solve multiplication and division problems involving single-digit factors and
bull compare a variety of solution strategies to learn the relationship between multiplication and division
2 Through their learning in the Operations with Numbers Fractions Alabama Content Area students bull develop an understanding of fractions beginning with unit fractions bull view fractions in general as being composed of unit fractions and use fractions along with visual fraction models such as area models
fraction strips and number lines to represent parts of a whole bull understand that the size of a fractional part is relative to the size of the whole and use fractions to represent numbers equal to less than
and greater than one and bull solve problems that involve comparing fractions by using visual fraction models and strategies based on noticing equal numerators or
denominators
3 Through their learning in the Measurement Alabama Content Area students bull recognize area as an attribute of two-dimensional regions bull measure the area of a shape by finding the total number of same-size units of area required to cover the shape without gaps or overlaps a
square with sides of unit length being the standard unit for measuring area and bull understand that rectangular arrays can be decomposed into identical rows or into identical columns By decomposing rectangles into
rectangular arrays of squares students connect area to multiplication and justify using multiplication to determine the area of a rectangle
Grade 3 Mathematics
39 2019 Alabama Course of Study Mathematics
4 Through their learning in the Geometry Alabama Content Area students bull extend knowledge of polygons to describe analyze and compare properties of two-dimensional shapes and bull recognize shapes that areare not quadrilaterals by using informal language to classify shapes by sides and angles and connect these with
the names of the shapes
NOTE Although not all content areas in the grade level have been included in the overview all standards should be included in instruction
Note fluency vs automaticity Fluency involves a mixture of ldquojust knowingrdquo answers knowing answers from patterns and knowing answers from the use of strategies The word fluently is used in the standards to mean accurately efficiently and flexibly Automaticity of facts becomes evident when a student no longer uses a pattern or mental algorithm to determine the answer
Grade 3 Content Standards
Each content standard completes the stem ldquoStudents willhelliprdquo Operations and Algebraic Thinking Represent and solve problems involving multiplication and division
1 Illustrate the product of two whole numbers as equal groups by identifying the number of groups and the number in each group and represent as a written expression
2 Illustrate and interpret the quotient of two whole numbers as the number of objects in each group or the number of
groups when the whole is partitioned into equal shares 3 Solve word situations using multiplication and division within 100 involving equal groups arrays and
measurement quantities represent the situation using models drawings and equations with a symbol for the unknown number
4 Determine the unknown whole number in a multiplication or division equation relating three whole numbers
Grade 3 Mathematics
40 2019 Alabama Course of Study Mathematics
Understand properties of multiplication and the relationship between multiplication and division Note Students need not use formal terms for these properties
5 Develop and apply properties of operations as strategies to multiply and divide 6 Use the relationship between multiplication and division to represent division as an equation with an unknown
factor
Multiply and divide within 100
7 Use strategies based on properties and patterns of multiplication to demonstrate fluency with multiplication and division within 100 a Fluently determine all products obtained by multiplying two one-digit numbers b State automatically all products of two one-digit numbers by the end of third grade
Solve problems involving the four operations and identify and explain patterns in arithmetic
8 Determine and justify solutions for two-step word problems using the four operations and write an equation with a letter standing for the unknown quantity Determine reasonableness of answers using number sense context mental computation and estimation strategies including rounding
9 Recognize and explain arithmetic patterns using properties of operations
Operations with Numbers Base Ten Use place value understanding and properties of operations to perform multi-digit arithmetic
10 Identify the nearest 10 or 100 when rounding whole numbers using place value understanding
11 Use various strategies to add and subtract fluently within 1000
12 Use concrete materials and pictorial models based on place value and properties of operations to find the product of a one-digit whole number by a multiple of ten (from 10 to 90)
Grade 3 Mathematics
41 2019 Alabama Course of Study Mathematics
Operations with Numbers Fractions Develop understanding of fractions as numbers Denominators are limited to 2 3 4 6 and 8
13 Demonstrate that a unit fraction represents one part of an area model or length model of a whole that has been equally partitioned explain that a numerator greater than one indicates the number of unit pieces represented by the fraction
14 Interpret a fraction as a number on the number line locate or represent fractions on a number line diagram a Represent a unit fraction (1
119887119887) on a number line by defining the interval from 0 to 1 as the whole and
partitioning it into b equal parts as specified by the denominator b Represent a fraction (119886119886
119887119887) on a number line by marking off a lengths of size (1
119887119887) from zero
15 Explain equivalence and compare fractions by reasoning about their size using visual fraction models and number
lines a Express whole numbers as fractions and recognize fractions that are equivalent to whole numbers b Compare two fractions with the same numerator or with the same denominator by reasoning about their size
(recognizing that fractions must refer to the same whole for the comparison to be valid) Record comparisons using lt gt or = and justify conclusions
Data Analysis Represent and interpret data
16 For a given or collected set of data create a scaled (one-to-many) picture graph and scaled bar graph to represent a data set with several categories a Determine a simple probability from a context that includes a picture b Solve one- and two-step ldquohow many morerdquo and ldquohow many lessrdquo problems using information presented in
scaled graphs 17 Measure lengths using rulers marked with halves and fourths of an inch to generate data and create a line plot
marked off in appropriate units to display the data
Grade 3 Mathematics
42 2019 Alabama Course of Study Mathematics
Measurement Solve problems involving measurement and estimation of intervals of time liquid volumes and masses of objects
18 Tell and write time to the nearest minute measure time intervals in minutes (within 90 minutes) a Solve real-world problems involving addition and subtraction of time intervals in minutes by representing the
problem on a number line diagram
19 Estimate and measure liquid volumes and masses of objects using liters (l) grams (g) and kilograms (kg) a Use the four operations to solve one-step word problems involving masses or volumes given in the same
metric units
Geometric measurement understand concepts of area and relate area to multiplication and to addition
20 Find the area of a rectangle with whole number side lengths by tiling without gaps or overlays and counting unit squares
21 Count unit squares (square cm square m square in square ft and improvised or non-standard units) to determine
area 22 Relate area to the operations of multiplication using real-world problems concrete materials mathematical
reasoning and the distributive property 23 Decompose rectilinear figures into smaller rectangles to find the area using concrete materials
Geometric measurement Recognize perimeter as an attribute of plane figures and distinguish between linear and area measures
24 Construct rectangles with the same perimeter and different areas or the same area and different perimeters
25 Solve real-world problems involving perimeters of polygons including finding the perimeter given the side lengths and finding an unknown side length of rectangles
Geometry Reason with shapes and their attributes
26 Recognize and describe polygons (up to 8 sides) triangles and quadrilaterals (rhombuses rectangles and squares) based on the number of sides and the presence or absence of square corners a Draw examples of quadrilaterals that are and are not rhombuses rectangles and squares
43 2019 Alabama Course of Study Mathematics
Grade 4 Overview
Grade 4 content is organized into six Alabama Content Areas outlined in the table below Operations and Algebraic Thinking Operations with Numbers Base Ten Operations with Numbers Fractions Data Analysis Measurement and Geometry Related standards are grouped into clusters which are listed below each content area Standards indicate what the student should know or be able to do by the end of the grade
Alabama Content Areas
Operations and Algebraic Thinking
Operations with Numbers Base Ten
Operations with Numbers Fractions Data Analysis Measurement Geometry
Clusters
Gain familiarity with factors and multiples
Solve problems with whole numbers using the four operations
Generate and analyze patterns
Generalize place value understanding for multi-digit whole numbers
Use place value understanding and properties of operations to perform multi-digit arithmetic with whole numbers
Extend understanding of fraction equivalence and ordering
Build fractions from unit fractions by applying and extending previous understandings of operations on whole numbers
Understand decimal notation for fractions and compare decimal fractions
Represent and interpret data
Solve problems involving measurement and conversion of measurements from a larger unit to a smaller unit
Geometric measurement understand concepts of angles and measure angles
Draw and identify lines and angles and identify shapes by properties of their lines and angles
The eight Student Mathematical Practices listed in the chart below represent what students are doing as they learn mathematics Students should regularly engage in these processes and proficiencies at every level throughout their mathematical studies Proficiency with these practices is critical in using mathematics both within the classroom and in life The Student Mathematical Practices are as standards which should be incorporated across all grades
Student Mathematical Practices 1 Make sense of problems and persevere in solving them 5 Use appropriate tools strategically 2 Reason abstractly and quantitatively 6 Attend to precision 3 Construct viable arguments and critique the reasoning of others 7 Look for and make use of structure 4 Model with mathematics 8 Look for and express regularity in repeated reasoning
Grade 4 Mathematics
44 2019 Alabama Course of Study Mathematics
Content Priorities
In Grade 4 instructional time should focus on three areas 1 developing understanding and fluency with multi-digit multiplication and understanding of division to find quotients
involving multi-digit dividends 2 developing an understanding of fraction equivalence addition and subtraction of fractions with like denominators and multiplication
of fractions by whole numbers and 3 understanding that geometric figures can be analyzed and classified based on their properties such as having parallel sides
perpendicular sides particular angle measures or symmetry
1 Through their learning in the Operations with Numbers Base Ten Alabama Content Area students generalize their understanding of place value to 1000000 understanding the relative sizes of numbers in each place apply their understanding of models for multiplication (equal-sized groups arrays area models) place value and properties of
operation in particular the distributive property as they develop discuss and use efficient accurate and generalizable methods to compute products of multi-digit whole numbers
select and accurately apply appropriate methods to estimate or mentally calculate products depending on the numbers and the context develop fluency with efficient procedures for multiplying whole numbers understand and explain why the procedures work based on
place value and properties of operations and use them to solve problems apply their understanding of models for division place value properties of operations and the relationship between division and
multiplication as they develop discuss and use efficient accurate and generalizable procedures to find quotients involving multi-digit dividends and
select and accurately apply appropriate methods to estimate and mentally calculate quotients and interpret remainders based upon the context
2 Through their learning in the Operations with Numbers Fractions Alabama Content Area students
develop understanding of fraction equivalence and operations with fractions recognize that two different fractions can be equal (eg 159 = 53) and develop methods for generating and recognizing equivalent
fractions and extend previous understandings about how fractions are built from unit fractions to compose fractions from unit fractions decompose
fractions into unit fractions and use the meaning of fractions and the meaning of multiplication to multiply a fraction by a whole number
Grade 4 Mathematics
45 2019 Alabama Course of Study Mathematics
3 Through their learning in the Geometry Alabama Content Area students
describe analyze compare and identify two-dimensional shapes using formal language based on the definition of the shapes deepen their understanding of properties of two-dimensional shapes (eg angles parallelism or symmetry) and use properties of two-dimensional objects to solve problems involving symmetry
NOTE Although not all content areas in the grade level have been included in the overview all standards should be included in instruction
NOTE fluency vs automaticity Fluency involves a mixture of ldquojust knowingrdquo answers knowing answers from patterns and knowing answers from the use of strategies The word fluently is used in the standards to mean accurately efficiently and flexibly Automaticity of facts becomes evident when a student no longer uses a pattern or mental algorithm to determine the answer
Grade 4 Content Standards Each content standard completes the stem ldquoStudents willhelliprdquo Operations and Algebraic Thinking Solve problems with whole numbers using the four operations
1 Interpret and write equations for multiplicative comparisons
2 Solve word problems involving multiplicative comparison using drawings and write equations to represent the problem using a symbol for the unknown number
3 Determine and justify solutions for multi-step word problems including problems where remainders must be
interpreted a Write equations to show solutions for multi-step word problems with a letter standing for the unknown
quantity b Determine reasonableness of answers for multi-step word problems using mental computation and estimation
strategies including rounding
Gain familiarity with factors and multiples
4 For whole numbers in the range 1 to 100 find all factor pairs identifying a number as a multiple of each of its factors a Determine whether a whole number in the range 1 to 100 is a multiple of a given one-digit number b Determine whether a whole number in the range 1 to 100 is prime or composite
Grade 4 Mathematics
46 2019 Alabama Course of Study Mathematics
Generate and analyze patterns
5 Generate and analyze a number or shape pattern that follows a given rule
Operations with Numbers Base Ten Generalize place value understanding for multi-digit whole numbers
6 Using models and quantitative reasoning explain that in a multi-digit whole number a digit in any place represents ten times what it represents in the place to its right
7 Read and write multi-digit whole numbers using standard form word form and expanded form
8 Use place value understanding to compare two multi-digit numbers using gt = and lt symbols
9 Round multi-digit whole numbers to any place using place value understanding
Use place value understanding and properties of operations to perform multi-digit arithmetic with whole numbers
10 Use place value strategies to fluently add and subtract multi-digit whole numbers and connect strategies to the standard algorithm
11 Find the product of two factors (up to four digits by a one-digit number and two two-digit numbers) using strategies based on place value and the properties of operations a Illustrate and explain the product of two factors using equations rectangular arrays and area models
12 Use strategies based on place value properties of operations andor the relationship between multiplication and
division to find whole-number quotients and remainders with one-digit divisors and up to four-digit dividends a Illustrate andor explain quotients using equations rectangular arrays andor area models
Operations with Numbers Fractions Extend understanding of fraction equivalence and ordering Denominators are limited to 2 3 4 5 6 8 10 12 and 100
13 Using area and length fraction models explain why one fraction is equivalent to another taking into account that the number and size of the parts differ even though the two fractions themselves are the same size a Apply principles of fraction equivalence to recognize and generate equivalent fractions
Example ab
Ris equivalent to n times an times b
Grade 4 Mathematics
47 2019 Alabama Course of Study Mathematics
14 Compare two fractions with different numerators and different denominators using concrete models benchmarks (0 frac12 1) common denominators andor common numerators recording the comparisons with symbols gt = or lt and justifying the conclusions a Explain that comparison of two fractions is valid only when the two fractions refer to the same whole
Build fractions from unit fractions by applying and extending previous understandings of operations on whole numbers
15 Model and justify decompositions of fractions and explain addition and subtraction of fractions as joining or separating parts referring to the same whole a Decompose a fraction as a sum of unit fractions and as a sum of fractions with the same denominator in more
than one way using area models length models and equations b Add and subtract fractions and mixed numbers with like denominators using fraction equivalence properties of
operations and the relationship between addition and subtraction c Solve word problems involving addition and subtraction of fractions and mixed numbers having like
denominators using drawings visual fraction models and equations to represent the problem
16 Apply and extend previous understandings of multiplication to multiply a whole number times a fraction a Model and explain how a non-unit fraction can be represented by a whole number times the unit fraction
Example 98
= 9 times 18
b Extend previous understanding of multiplication to multiply a whole number times any fraction less than one Example 4 times 2
3 = 4 times 2
3= 8
3
c Solve word problems involving multiplying a whole number times a fraction using visual fraction models and equations to represent the problem Examples 3 times 1
2 6 times 1
8
Understand decimal notation for fractions and compare decimal fractions Denominators are limited to 10 and 100
17 Express model and explain the equivalence between fractions with denominators of 10 and 100 a Use fraction equivalency to add two fractions with denominators of 10 and 100
18 Use models and decimal notation to represent fractions with denominators of 10 and 100
19 Use visual models and reasoning to compare two decimals to hundredths (referring to the same whole) recording
comparisons using symbols gt = or lt and justifying the conclusions
Grade 4 Mathematics
48 2019 Alabama Course of Study Mathematics
Data Analysis Represent and interpret data
20 Interpret data in graphs (picture bar and line plots) to solve problems using numbers and operations a Create a line plot to display a data set of measurements in fractions of a unit (1
2 14
18)
b Solve problems involving addition and subtraction of fractions using information presented in line plots
Measurement Solve problems involving measurement and conversion of measurements from a larger unit to a smaller unit
21 Select and use an appropriate unit of measurement for a given attribute (length mass liquid volume time) within one system of units metric - km m cm kg g l ml customary - lb oz time - hr min sec a Within one system of units express measurements of a larger unit in terms of a smaller unit Record
measurement equivalents in a two-column table
22 Use the four operations to solve measurement word problems with distance intervals of time liquid volume mass of objects and money a Solve measurement problems involving simple fractions or decimals b Solve measurement problems that require expressing measurements given in a larger unit in terms of a smaller
unit c Represent measurement quantities using diagrams such as number line diagrams that feature a measurement
scale 23 Apply area and perimeter formulas for rectangles in real-world and mathematical situations
Geometric measurement understand concepts of angle and measure angles
24 Identify an angle as a geometric shape formed wherever two rays share a common endpoint
25 Use a protractor to measure angles in whole-number degrees and sketch angles of specified measure
26 Decompose an angle into non-overlapping parts to demonstrate that the angle measure of the whole is the sum of the angle measures of the parts a Solve addition and subtraction problems on a diagram to find unknown angles in real-world or mathematical
problems
Grade 4 Mathematics
49 2019 Alabama Course of Study Mathematics
Geometry Draw and identify lines and angles and identify shapes by properties of their lines and angles
27 Draw points lines line segments rays angles (right acute obtuse) and perpendicular and parallel lines and identify these in two-dimensional figures
28 Identify two-dimensional figures based on the presence or absence of parallel or perpendicular lines or the presence
or absence of angles of a specified size a Describe right triangles as a category and identify right triangles
29 Define a line of symmetry for a two-dimensional figure as a line across the figure such that the figure can be folded
along the line into matching parts a Identify line-symmetric figures and draw lines of symmetry
50 2019 Alabama Course of Study Mathematics
Grade 5 Mathematics Overview
Grade 5 content is organized into six Alabama Content Areas as outlined in the table below Operations and Algebraic Thinking Operations with Numbers Base Ten Operations with Numbers Fractions Data Analysis Measurement and Geometry Related standards are grouped into clusters which are listed below each content area Standards indicate what the student should know or be able to do by the end of the grade
The eight Student Mathematical Practices listed in the chart below represent what students are doing as they learn mathematics Students should regularly engage in these processes and proficiencies at every level throughout their mathematical studies Proficiency with these practices is critical in using mathematics both in the classroom and in everyday life The Student Mathematical Practices are standards which should be incorporated across all grades
Student Mathematical Practices 1 Make sense of problems and persevere in solving them 5 Use appropriate tools strategically 2 Reason abstractly and quantitatively 6 Attend to precision 3 Construct viable arguments and critique the reasoning of others 7 Look for and make use of structure 4 Model with mathematics 8 Look for and express regularity in repeated reasoning
Alabama Content Areas
Operations and Algebraic Thinking
Operations with Numbers Base Ten
Operations with Numbers Fractions
Data Analysis Measurement Geometry
Clusters
bull Write and interpret numerical expressions
bull Analyze patterns and relationships
bull Understand the place value system
bull Perform operations with multi-digit whole numbers and decimals to hundredths
bull Use equivalent fractions as a strategy to add and subtract fractions
bull Apply and extend previous under-standings of multiplication and division to multiply and divide fractions
bull Represent and interpret data
bull Convert like measurement units within a given measurement system
bull Geometric measurement understand concepts of volume and relate volume to multiplication and to addition
bull Graph points on the coordinate plane to solve real-world and mathematical problems
bull Classify two-dimensional figures into categories based on their properties
Grade 5 Mathematics
51 2019 Alabama Course of Study Mathematics
Content Priorities In Grade 5 instructional time should focus on three critical areas
1 developing fluency with addition and subtraction of fractions and developing understanding of the multiplication of fractions and of division of fractions in limited cases (unit fractions divided by whole numbers and whole numbers divided by unit fractions)
2 extending division to 2-digit divisors integrating decimals into the place value system and developing understanding of operations with decimals to hundredths and developing fluency with whole number and decimal operations and
3 developing understanding of volume 1 Through their learning in the Operations with Numbers Fractions Alabama Content Area students
bull apply their understanding of fractions and fraction models to represent the addition and subtraction of fractions with unlike denominators as equivalent calculations with like denominators
bull develop fluency in calculating sums and differences of fractions and make reasonable estimates of them and bull use the meaning of fractions multiplication and division and the relationship between multiplication and division to
understand and explain why the procedures for multiplying and dividing fractions make sense
2 Through their learning in the Operations with Numbers Base Ten Alabama Content Area students bull develop understanding of why division procedures work based on the meaning of base-ten numerals and properties of operations bull apply understandings of models for decimals decimal notation and properties of operations to add and subtract decimals to hundredths bull develop fluency with decimal computations and make reasonable estimates of their results bull use the relationship between decimals and fractions as well as the relationship between finite decimals and whole numbers
(ie a finite decimal multiplied by an appropriate power of 10 is a whole number) to understand and explain why the procedures for multiplying and dividing finite decimals make sense and
bull compute products and quotients of decimals to hundredths efficiently and accurately
3 Through their learning in the Measurement Alabama Content Area students bull recognize volume as an attribute of three-dimensional space bull understand that volume can be measured by finding the total number of same-size units of volume required to fill the space without gaps
or overlaps bull understand that a 1-unit by 1-unit by 1-unit cube is the standard unit for measuring volume bull select appropriate units strategies and tools for solving problems that involve estimating and measuring volume bull decompose three-dimensional shapes and find volumes of right rectangular prisms by viewing them as decomposed into layers of arrays
of cubes and bull measure necessary attributes of shapes in order to determine volumes to solve real-world and mathematical problems
Grade 5 Mathematics
52 2019 Alabama Course of Study Mathematics
NOTE Although not all content areas in the grade level have been included in the overview all standards should be included in instruction NOTE fluency vs automaticity Fluency involves a mixture of ldquojust knowingrdquo answers knowing answers from patterns and knowing answers from the use of strategies The word fluently is used in the standards to mean accurately efficiently and flexibly Automaticity of facts becomes evident when a student no longer uses a pattern or mental algorithm to determine the answer
Grade 5 Content Standards Each content standard completes the sentence stem ldquoStudents willhelliprdquo Operations and Algebraic Thinking Write and interpret numerical expressions
1 Write explain and evaluate simple numerical expressions involving the four operations to solve up to two-step problems Include expressions involving parentheses brackets or braces using commutative associative and distributive properties
Analyze patterns and relationships
2 Generate two numerical patterns using two given rules and complete an inputoutput table for the data a Use data from an inputoutput table to identify apparent relationships between corresponding terms b Form ordered pairs from values in an inputoutput table c Graph ordered pairs from an inputoutput table on a coordinate plane
Operations with Numbers Base Ten Understand the place value system
3 Using models and quantitative reasoning explain that in a multi-digit number including decimals a digit in any place represents ten times what it represents in the place to its right and 1
10 of what it represents in
the place to its left a Explain patterns in the number of zeros of the product when multiplying a number by powers of 10
using whole-number exponents to denote powers of 10 b Explain patterns in the placement of the decimal point when a decimal is multiplied or divided by a
power of 10 using whole-number exponents to denote powers of 10
Grade 5 Mathematics
53 2019 Alabama Course of Study Mathematics
4 Read write and compare decimals to thousandths a Read and write decimals to thousandths using base-ten numerals number names and expanded form
Example 347392 = 3 times 100 + 4 times 10 + 7 times 1 + 3 times ( 110
) + 9 times ( 1100
) + 2 times ( 11000
) b Compare two decimals to thousandths based on the meaning of the digits in each place using gt = and
lt to record the results of comparisons
5 Use place value understanding to round decimals to thousandths
Perform operations with multi-digit whole numbers and decimals to hundredths
6 Fluently multiply multi-digit whole numbers using the standard algorithm
7 Use strategies based on place value properties of operations andor the relationship between multiplication and division to find whole-number quotients and remainders with up to four-digit dividends and two-digit divisors Illustrate and explain the calculation by using equations rectangular arrays andor area models
8 Add subtract multiply and divide decimals to hundredths using strategies based on place value
properties of operations andor the relationships between additionsubtraction and multiplicationdivision relate the strategy to a written method and explain the reasoning used
a Use concrete models and drawings to solve problems with decimals to hundredths b Solve problems in a real-world context with decimals to hundredths
Operations with Numbers Fractions Use equivalent fractions as a strategy to add and subtract fractions
9 Model and solve real-word problems involving addition and subtraction of fractions referring to the same whole including cases of unlike denominators using visual fraction models or equations to represent the problem Use benchmark fractions and number sense of fractions to estimate mentally and assess the reasonableness of answers Example Recognize an incorrect result 2
5+ 1
2= 3
7 by observing that 3
7 lt 1
2
10 Add and subtract fractions and mixed numbers with unlike denominators using fraction equivalence to
calculate a sum or difference of fractions or mixed numbers with like denominators
Grade 5 Mathematics
54 2019 Alabama Course of Study Mathematics
Apply and extend previous understandings of multiplication and division to multiply and divide fractions
11 Solve word problems involving division of whole numbers leading to answers in the form of fractions or mixed numbers a Model and interpret a fraction as division of the numerator by the denominator (119886119886
119887119887= a divide b)
b Use visual fraction models drawings or equations to represent word problems involving division of whole numbers leading to answers in the form of fractions or mixed numbers
12 Apply and extend previous understandings of multiplication to find the product of a fraction times a whole
number or a fraction times a fraction a Use a visual fraction model (area model set model or linear model) to show (119886119886
119887119887) times q and create a story
context for this equation to interpret the product as a parts of a partition of q into b equal parts b Use a visual fraction model (area model set model or linear model) to show (119886119886
119887119887) times (119888119888
119889119889) and create a
story context for this equation to interpret the product c Multiply fractional side lengths to find areas of rectangles and represent fraction products as
rectangular areas d Find the area of a rectangle with fractional side lengths by tiling it with unit squares of the appropriate
unit fraction side lengths to show that the area is the same as would be found by multiplying the side lengths
13 Interpret multiplication as scaling (resizing)
a Compare the size of a product to the size of one factor on the basis of the size of the other factor without performing the indicated multiplication Example Use reasoning to determine which expression is greater 225 or 3
4 times 225 11
50 or 3
2 times 11
50
b Explain why multiplying a given number by a fraction greater than 1 results in a product greater than the given number and relate the principle of fraction equivalence
c Explain why multiplying a given number by a fraction less than 1 results in a product smaller than the given number and relate the principle of fraction equivalence
14 Model and solve real-world problems involving multiplication of fractions and mixed numbers using
visual fraction models drawings or equations to represent the problem
Grade 5 Mathematics
55 2019 Alabama Course of Study Mathematics
15 Apply and extend previous understandings of division to divide unit fractions by whole numbers and whole numbers by unit fractions a Solve real-world problems involving division of unit fractions by non-zero whole numbers and division
of whole numbers by unit fractions and illustrate using visual fraction models drawings and equations to represent the problem
b Create a story context for a unit fraction divided by a whole number and use a visual fraction model to show the quotient
c Create a story context for a whole number divided by a unit fraction and use a visual fraction model to show the quotient
Data Analysis Represent and interpret data 16 Make a line plot to display a data set of measurements in fractions of a unit (1
2 14 18)
a Add subtract multiply and divide fractions to solve problems involving information presented in line plots Note Division is limited to unit fractions by whole numbers and whole numbers by unit fractions
Measurement Convert like measurement units within a given measurement system
17 Convert among different-sized standard measurement units within a given measurement system and use these conversions in solving multi-step real-world problems
Geometric measurement understand concepts of volume and relate volume to multiplication and to addition
18 Identify volume as an attribute of solid figures and measure volumes by counting unit cubes using cubic cm cubic in cubic ft and improvised (non-standard) units a Pack a solid figure without gaps or overlaps using n unit cubes to demonstrate volume as n cubic units
Grade 5 Mathematics
56 2019 Alabama Course of Study Mathematics
19 Relate volume to the operations of multiplication and addition and solve real-world and mathematical problems involving volume a Use the associative property of multiplication to find the volume of a right rectangular prism and relate
it to packing the prism with unit cubes Show that the volume can be determined by multiplying the three edge lengths or by multiplying the height by the area of the base
b Apply the formulas V = l times w times h and V = B times h for rectangular prisms to find volumes of right rectangular prisms with whole-number edge lengths in the context of solving real-world and mathematical problems
c Find volumes of solid figures composed of two non-overlapping right rectangular prisms by adding the volumes of the two parts applying this technique to solve real-world problems
Geometry Graph points on the coordinate plane to solve real-world and mathematical problems
20 Graph points in the first quadrant of the coordinate plane and interpret coordinate values of points to represent real-world and mathematical problems
Classify two-dimensional figures into categories based on their properties
21 Classify triangles according to side length (isosceles equilateral scalene) and angle measure (acute obtuse right equiangular)
22 Classify quadrilaterals in a hierarchy based on properties 23 Explain that attributes belonging to a category of two-dimensional figures also belong to all subcategories
of that category Example All rectangles have four right angles and squares have four right angles so squares are rectangles
57 2019 Alabama Course of Study Mathematics
GRADES 6 - 8 OVERVIEW The course of study for Grades 6-8 Mathematics focuses on solidifying the foundations of mathematics empowering students for high school mathematics and broadening their understanding of mathematics in relation to everyday life Ensuring that each and every student receives the preparation they deserve will require focus on developing conceptual understanding of the mathematics they will need for a lifetime These standards build on critical areas of focus for each grade level Resources supporting the standards for Grades 6-8 are in Appendix D
Note Proportional reasoning is not listed as an 8th grade content area because it has been incorporated into Algebra and Functions
Grades 6-8 Overview
58 2019 Alabama Course of Study Mathematics
Pathways to Student Success
The Grades 6-8 course of study offers two flexible pathways with five courses Grade 6 Grade 7 Grade 7 Accelerated Grade 8 and Grade 8 Accelerated All middle school students begin at a shared starting point with Grade 6 Mathematics and all will complete Grade 8 prepared for Geometry with Data Analysis in Grade 9 regardless of which middle school pathway they complete The standard middle school pathway is challenging and rigorous It meets the needs of all middle school students giving them a solid mathematical foundation and preparing them for success in later mathematics courses Middle school students who are especially interested and strongly motivated to study mathematics have the option of moving a little faster by choosing an accelerated pathway which combines standards from three courses into two years of study Grade 7 Grade 8 and Algebra I with Probability (otherwise offered in Grade 10) Students who successfully complete this middle school accelerated pathway will be prepared to enter directly into Algebra II with Statistics after completing Geometry with Data Analysis in Grade 9 These students will be required to take two additional courses in Grades 11 and 12 to earn the mandatory four credits in mathematics since neither of the accelerated middle school courses (nor their combination) is equivalent to a high school mathematics credit Taking two more courses gives them the opportunity to make additional progress toward their postsecondary goals The accelerated middle school pathway is designed to challenge the most proficient and motivated students Some who start out on this pathway may find it was not the best choice for them Students who are not making adequate progress in Grade 7 Accelerated are not locked into the accelerated pathway they may exit the accelerated pathway and take the Grade 8 Mathematics course without any loss of progress Students have a second opportunity to accelerate in Grade 9 by taking Geometry with Data Analysis and Algebra I with Probability at the same time These opportunities to accelerate allow students to make additional progress toward their postsecondary goals Students and their parents should receive ongoing feedback and information about available options as students decide whether or not to pursue or continue pursuing an accelerated pathway That decision should not be made for them without consultation It is critical that all students be afforded the opportunity to pursue a pathway that supports their interests and goals
Grades 6-8 Overview
59 2019 Alabama Course of Study Mathematics
The rows of the following table provide examples of pathways that students may follow across Grades 6-8 Note that students should be enrolled in a mathematics class every year of middle and high school
Grade 6 Grade 7 Grade 8 Grade 9
Grade 6 Mathematics
Grade 7 Mathematics
Grade 8 Mathematics
Geometry with Data Analysis
Grade 6 Mathematics
Grade 7 Accelerated Mathematics
Accelerated Grade 8 Mathematics
Geometry with Data Analysis
Grade 6 Mathematics
Grade 7 Mathematics
Grade 8 Mathematics
Geometry with Data Analysis
and Algebra I with Probability
Grade 6 Mathematics
Grade 7 Accelerated Mathematics Grade 8 Mathematics Geometry with Data
Analysis
Grade 6 Mathematics
Grade 7 Accelerated Mathematics Grade 8 Mathematics
Geometry with Data Analysis
and Algebra I with Probability
Grade 6 Mathematics
Grade 7 Accelerated Mathematics
Accelerated Grade 8 Mathematics
Geometry with Data Analysis
and Algebra I with Probability
Refer to the Course of Study Grades 9-12 Overview for a full description of the pathways through the end of high school and how they connect to the postsecondary study of mathematics
60 2019 Alabama Course of Study Mathematics
Grade 6 Overview
Grade 6 content is organized into five Alabama Content Areas as outlined below Proportional Reasoning Number Systems and Operations Algebra and Functions Data Analysis Statistics and Probability and Geometry and Measurement Related standards are grouped into clusters which are listed below each content area Resources to support the Grades 6-8 standards are in Appendix D Standards indicate what students should know and be able to do by the end of the course
Alabama Content Areas
Proportional Reasoning
Number Systems and Operations Algebra and Functions Data Analysis Statistics
and Probability Geometry and Measurement
Clusters
bull Develop an understanding of ratio concepts and use reasoning about ratios to solve problems
bull Use prior knowledge of multiplication and division to divide fractions
bull Compute multi-digit numbers fluently and determine common factors and multiples
bull Apply knowledge of the number system to represent and use rational numbers in a variety of forms
bull Apply knowledge of arithmetic to read write and evaluate algebraic expressions
bull Use equations and inequalities to represent and solve real-world or mathematical problems
bull Identify and analyze relationships between independent and dependent variables
bull Use real-world and mathematical problems to analyze data and demonstrate an understanding of statistical variability and measures of center
bull Graph polygons in the coordinate plane to solve real-world and mathematical problems
bull Solve real-world and mathematical problems to determine area surface area and volume
The eight Student Mathematical Practices listed in the chart below represent what students are doing as they learn mathematics Students should regularly engage in these processes and proficiencies at every level throughout their mathematical studies Proficiency with these practices is critical in using mathematics both in the classroom and in everyday life The Student Mathematical Practices are standards to be incorporated across all grades
Student Mathematical Practices 1 Make sense of problems and persevere in solving them 5 Use appropriate tools strategically 2 Reason abstractly and quantitatively 6 Attend to precision 3 Construct viable arguments and critique the reasoning of others 7 Look for and make use of structure 4 Model with mathematics 8 Look for and express regularity in repeated reasoning
Grade 6 Mathematics
61 2019 Alabama Course of Study Mathematics
Content Priorities
In Grade 6 instructional time should focus on five essential areas 1 Connecting ratio and rate to whole number multiplication and division and using concepts of ratio and rate to solve problems
Students use reasoning about multiplication and division to solve ratio and rate problems about quantities By viewing equivalent ratios and rates as deriving from and extending pairs of rows (or columns) in the multiplication table and by analyzing simple drawings that indicate the relative size of quantities students connect their understanding of multiplication and division with ratios and rates Thus students expand the scope and variety of problems in which they use proportional reasoning to connect ratios and fractions
2 Completing understanding of division of fractions and extending the understanding of number sense to the system of rational
numbers including signed numbers Students connect the meaning of fractions multiplication and division and the relationship between multiplication and division to understand and explain procedures for dividing fractions Students use these operations to solve problems Students extend previous understanding of the magnitude and ordering of numbers to the rational number system including signed rational numbers and particularly integers They reason about the order and absolute value of rational numbers and about the location of points in all four quadrants of the coordinate plane
3 Writing interpreting and using expressions and equations Students use variables in mathematical expressions to represent quantities They write expressions and equations that correspond to real-world situations evaluate expressions and use expressions and formulas to solve problems Students understand that expressions in different forms can be equivalent and they use the properties of operations to rewrite expressions in equivalent forms Students know the solutions of an equation are the values of the variables that make the equation true They use properties of operations and the idea of maintaining the equality of both sides of an equation to solve one-step equations Students construct and analyze tables such as tables of quantities that are in equivalent ratios and they use equations (such as 3x = y) to describe relationships between dependent and independent variables
4 Developing understanding of statistical thinking Students build on and reinforce their number sense to develop the ability to think about statistical measures They recognize that a data distribution may not have a definite center and that different ways to measure center yield different values The median measures center in that it is roughly the middle value The mean measures center in that it is the value that each data point would take on if the total of the data values were redistributed equally and also in that it is a balance point Students recognize that a measure of variability (range and interquartile range) can also be useful for summarizing data because two very different sets of data may have the same mean and median
Grade 6 Mathematics
62 2019 Alabama Course of Study Mathematics
yet be distinguished by their variability Students create and use a variety of graphs to represent and interpret data They learn to describe and summarize numerical data sets identifying clusters peaks gaps and symmetry considering the context in which the data were collected
5 Developing understanding of geometrical reasoning and thinking
Students apply previous understanding about relationships among shapes to determine area surface area and volume They find areas of right triangles other triangles and special quadrilaterals by decomposing these shapes rearranging or removing pieces and relating the shapes to rectangles Using these methods students discuss develop and justify formulas for areas of triangles and parallelograms Students use nets to find areas of polygons and surface areas of prisms and pyramids by decomposing them into pieces whose area they can determine They reason about right rectangular prisms to extend formulas for the volume of a right rectangular prism to those with fractional side lengths As students develop an understanding of formulas in mathematical and real-world contexts the goal is not simply to memorize but to have a deep understanding of why each formula works and how it relates to the measure of various figures Students draw polygons in the coordinate plane to prepare for work on scale drawings and constructions in Grade 7
Grade 6 Content Standards
Each content standard completes the stem ldquoStudents willhelliprdquo Proportional Reasoning Develop an understanding of ratio concepts and use reasoning about ratios to solve problems
1 Use appropriate notations [ab a to b ab] to represent a proportional relationship between quantities and use ratio language to describe the relationship between quantities
2 Use unit rates to represent and describe ratio relationships
3 Use ratio and rate reasoning to solve mathematical and real-world problems (including but not limited to percent measurement conversion and equivalent ratios) using a variety of models including tables of equivalent ratios tape diagrams double number lines and equations
Grade 6 Mathematics
63 2019 Alabama Course of Study Mathematics
Number Systems and Operations Use prior knowledge of multiplication and division to divide fractions
4 Interpret and compute quotients of fractions using visual models and equations to represent problems a Use quotients of fractions to analyze and solve problems
Compute multi-digit numbers fluently and determine common factors and multiples
5 Fluently divide multi-digit whole numbers using a standard algorithm to solve real-world and mathematical problems
6 Add subtract multiply and divide decimals using a standard algorithm
7 Use the distributive property to express the sum of two whole numbers with a common factor as a multiple of a sum of two whole numbers with no common factor
8 Find the greatest common factor (GCF) and least common multiple (LCM) of two or more whole numbers
a Use factors and multiples to determine prime factorization
Apply knowledge of the number system to represent and use rational numbers in a variety of forms
9 Use signed numbers to describe quantities that have opposite directions or values and to represent quantities in real-world contexts
10 Locate integers and other rational numbers on a horizontal or vertical line diagram a Define opposites as numbers located on opposite sides of 0 and the same distance from 0 on a number line b Use rational numbers in real-world and mathematical situations explaining the meaning of 0 in each situation
11 Find the position of pairs of integers and other rational numbers on the coordinate plane
a Identify quadrant locations of ordered pairs on the coordinate plane based on the signs of the x and y coordinates
b Identify (ab) and (a-b) as reflections across the x-axis c Identify (ab) and (-ab) as reflections across the y-axis d Solve real-world and mathematical problems by graphing points in all four quadrants of the coordinate plane
including finding distances between points with the same first or second coordinate
12 Explain the meaning of absolute value and determine the absolute value of rational numbers in real-world contexts
Grade 6 Mathematics
64 2019 Alabama Course of Study Mathematics
13 Compare and order rational numbers and absolute value of rational numbers with and without a number line in
order to solve real-world and mathematical problems
Algebra and Functions Apply knowledge of arithmetic to read write and evaluate algebraic expressions
14 Write evaluate and compare expressions involving whole number exponents
15 Write read and evaluate expressions in which letters represent numbers in real-world contexts a Interpret a variable as an unknown value for any number in a specified set depending on the context b Write expressions to represent verbal statements and real-world scenarios c Identify parts of an expression using mathematical terms such as sum term product factor quotient and
coefficient d Evaluate expressions (which may include absolute value and whole number exponents) with respect to order of
operations 16 Generate equivalent algebraic expressions using the properties of operations including inverse identity
commutative associative and distributive 17 Determine whether two expressions are equivalent and justify the reasoning
Use equations and inequalities to represent and solve real-world or mathematical problems
18 Determine whether a value is a solution to an equation or inequality by using substitution to conclude whether a given value makes the equation or inequality true
19 Write and solve an equation in the form of x+p=q or px=q for cases in which p q and x are all non-negative
rational numbers to solve real-world and mathematical problems a Interpret the solution of an equation in the context of the problem
20 Write and solve inequalities in the form of xgtc xltc xge c or x le c to represent a constraint or condition in a real-world or mathematical problem a Interpret the solution of an inequality in the context of a problem b Represent the solutions of inequalities on a number line and explain that the solution set may contain infinitely
many solutions
Grade 6 Mathematics
65 2019 Alabama Course of Study Mathematics
Identify and analyze relationships between independent and dependent variables
21 Identify represent and analyze two quantities that change in relationship to one another in real-world or mathematical situations a Use tables graphs and equations to represent the relationship between independent and dependent variables
Data Analysis Statistics and Probability Use real-world and mathematical problems to analyze data and demonstrate an understanding of statistical variability and measures of center
22 Write examples and non-examples of statistical questions explaining that a statistical question anticipates variability in the data related to the question
23 Calculate interpret and compare measures of center (mean median mode) and variability (range and interquartile range) in real-world data sets a Determine which measure of center best represents a real-world data set b Interpret the measures of center and variability in the context of a problem
24 Represent numerical data graphically using dot plots line plots histograms stem and leaf plots and box plots a Analyze the graphical representation of data by describing the center spread shape (including approximately
symmetric or skewed) and unusual features (including gaps peaks clusters and extreme values) b Use graphical representations of real-world data to describe the context from which they were collected
Geometry and Measurement Graph polygons in the coordinate plane to solve real-world and mathematical problems
25 Graph polygons in the coordinate plane given coordinates of the vertices to solve real-world and mathematical problems a Determine missing vertices of a rectangle with the same x-coordinate or the same y-coordinate when graphed in
the coordinate plane b Use coordinates to find the length of a side between points having the same x-coordinate or the same y-
coordinate c Calculate perimeter and area of a polygon graphed in the coordinate plane (limiting to polygons in which
consecutive vertices have the same x-coordinate or the same y-coordinate)
Grade 6 Mathematics
66 2019 Alabama Course of Study Mathematics
Solve real-world and mathematical problems to determine area surface area and volume Note Students must select and use the appropriate unit for the attribute being measured when determining length area angle time or volume
26 Calculate the area of triangles special quadrilaterals and other polygons by composing and decomposing them into known shapes a Apply the techniques of composing and decomposing polygons to find area in the context of solving real-world
and mathematical problems
27 Determine the surface area of three-dimensional figures by representing them with nets composed of rectangles and triangles to solve real-world and mathematical problems
28 Apply previous understanding of volume of right rectangular prisms to those with fractional edge lengths to solve real-world and mathematical problems a Use models (cubes or drawings) and the volume formulas (V = lwh and V = Bh) to find and compare volumes
of right rectangular prisms
67 2019 Alabama Course of Study Mathematics
Grade 7 Mathematics Overview
In Grade 7 content is organized into five Alabama Content Areas as outlined below Proportional Reasoning Number Systems and Operations Algebra and Functions Data Analysis Statistics and Probability and Geometry and Measurement Related standards are grouped into clusters which are listed below each content area Resources to support the Grade 7 mathematical standards are in Appendix D Standards indicate what students should know or be able to do by the end of the course
Alabama Content Areas
Proportional Reasoning
Number Systems and Operations
Algebra and Functions Data Analysis Statistics and Probability
Geometry and Measurement
Clusters
bull Analyze proportional relationships and use them to solve real-world and mathematical problems
bull Apply and extend prior knowledge of addition subtraction multiplication and division to operations with rational numbers
bull Create equivalent expressions using the properties of operations
bull Solve real-world and mathematical problems using numerical and algebraic expressions equations and inequalities
bull Make inferences about a population using random sampling
bull Make inferences from an informal comparison of two populations
bull Investigate probability models
bull Construct and describe geometric figures analyzing relationships among them
bull Solve real-world and mathematical problems involving angle measure circumference area surface area and volume
The eight Student Mathematical Practices listed in the chart below represent what students are doing as they learn mathematics Students should regularly engage in these processes and proficiencies at every level throughout their mathematical studies Proficiency with these practices is critical in using mathematics both in the classroom and in everyday life The Student Mathematical Practices are standards to be incorporated across all grades
Student Mathematical Practices 1 Make sense of problems and persevere in solving them 5 Use appropriate tools strategically 2 Reason abstractly and quantitatively 6 Attend to precision 3 Construct viable arguments and critique the reasoning of others 7 Look for and make use of structure 4 Model with mathematics 8 Look for and express regularity in repeated reasoning
Grade 7 Mathematics
68 2019 Alabama Course of Study Mathematics
Content Priorities
In Grade 7 instructional time should focus on four essential areas all of which have equal importance
1 Developing understanding of and applying proportional relationships Students extend their understanding of ratios and develop understanding of proportionality to solve single- and multi-step problems Students solve a wide variety of percent problems (including those involving discounts interest taxes tips percent increase or decrease) and solve problems about scale drawings by relating corresponding lengths between the objects or by using the fact that relationships of lengths within an object are preserved in similar objects Students graph proportional relationships and understand the unit rate informally as a measure of the steepness of the related line called the slope They distinguish proportional relationships from other relationships
2 Developing understanding of operations with rational numbers and working with expressions and linear equations
Students develop a unified understanding of number recognizing fractions decimals (that have a finite or a repeating decimal representation) and percentages as different representations of rational numbers Students extend addition subtraction multiplication and division to all rational numbers recognizing the properties of operations and the relationships between addition and subtraction and multiplication and division By applying these properties and by viewing negative numbers in terms of everyday contexts (eg amounts owed or temperatures below zero) students explain and interpret the rules for adding subtracting multiplying and dividing with negative numbers They use the arithmetic of rational numbers as they formulate expressions and equations in one variable and use these equations to solve problems
3 Solving problems involving scale drawings and informal geometric construction and working with two- and three-dimensional
shapes to solve problems involving area surface area and volume Students continue their work with area from Grade 6 solving problems involving the area and circumference of a circle as well as surface area of three-dimensional objects In preparation for work on congruence and similarity in Grade 8 they reason about relationships among two-dimensional figures using scale drawings and informal geometric constructs and they gain familiarity with the relationships between angles formed by intersecting lines Students work with three-dimensional figures relating them to two-dimensional figures by examining cross-sections They solve real-world and mathematical problems involving area surface area and volume of two- and three-dimensional objects composed of triangles quadrilaterals polygons cubes and right prisms
4 Drawing inferences about populations based on samples
Students build on their previous work with single data distributions to compare two data distributions and address questions about differences between populations They begin informal work with random sampling to generate data sets and learn about the importance of representative samples for drawing inferences
Grade 7 Mathematics
69 2019 Alabama Course of Study Mathematics
Grade 7 Content Standards
Each content standard completes the stem ldquoStudents willhelliprdquo Proportional Reasoning Analyze proportional relationships and use them to solve real-world and mathematical problems
1 Calculate unit rates of length area and other quantities measured in like or different units that include ratios or fractions
2 Represent a relationship between two quantities and determine whether the two quantities are related
proportionally a Use equivalent ratios displayed in a table or in a graph of the relationship in the coordinate plane to determine
whether a relationship between two quantities is proportional b Identify the constant of proportionality (unit rate) and express the proportional relationship using multiple
representations including tables graphs equations diagrams and verbal descriptions c Explain in context the meaning of a point (xy) on the graph of a proportional relationship with special
attention to the points (00) and (1 r) where r is the unit rate
3 Solve multi-step percent problems in context using proportional reasoning including simple interest tax gratuities commissions fees markups and markdowns percent increase and percent decrease
Grade 7 Mathematics
70 2019 Alabama Course of Study Mathematics
Number Systems and Operations Apply and extend prior knowledge of addition subtraction multiplication and division to operations with rational numbers
4 Apply and extend knowledge of operations of whole numbers fractions and decimals to add subtract multiply and divide rational numbers including integers signed fractions and decimals a Identify and explain situations where the sum of opposite quantities is 0 and opposite quantities are defined as
additive inverses b Interpret the sum of two or more rational numbers by using a number line and in real-world contexts c Explain subtraction of rational numbers as addition of additive inverses d Use a number line to demonstrate that the distance between two rational numbers on the number line is the
absolute value of their difference and apply this principle in real-world contexts e Extend strategies of multiplication to rational numbers to develop rules for multiplying signed numbers
showing that the properties of the operations are preserved f Divide integers and explain that division by zero is undefined Interpret the quotient of integers (with a non-
zero divisor) as a rational number g Convert a rational number to a decimal using long division explaining that the decimal form of a rational
number terminates or eventually repeats
5 Solve real-world and mathematical problems involving the four operations of rational numbers including complex fractions Apply properties of operations as strategies where applicable
Algebra and Functions Create equivalent expressions using the properties of operations
6 Apply properties of operations as strategies to add subtract factor and expand linear expressions with rational coefficients
7 Generate expressions in equivalent forms based on context and explain how the quantities are related
Grade 7 Mathematics
71 2019 Alabama Course of Study Mathematics
Solve real-world and mathematical problems using numerical and algebraic expressions equations and inequalities
8 Solve multi-step real-world and mathematical problems involving rational numbers (integers signed fractions and decimals) converting between forms as needed Assess the reasonableness of answers using mental computation and estimation strategies
9 Use variables to represent quantities in real-world or mathematical problems and construct algebraic expressions
equations and inequalities to solve problems by reasoning about the quantities a Solve word problems leading to equations of the form px + q = r and p(x + q) = r where p q and r are specific
rational numbers Solve equations of these forms fluently Compare an algebraic solution to an arithmetic solution identifying the sequence of the operations used in each approach
b Solve word problems leading to inequalities of the form px + q gt r or px + q lt r where p q and r are specific rational numbers Graph the solution set of the inequality and interpret it in the context of the problem
Data Analysis Statistics and Probability Make inferences about a population using random sampling
10 Examine a sample of a population to generalize information about the population a Differentiate between a sample and a population b Compare sampling techniques to determine whether a sample is random and thus representative of a
population explaining that random sampling tends to produce representative samples and support valid inferences
c Determine whether conclusions and generalizations can be made about a population based on a sample d Use data from a random sample to draw inferences about a population with an unknown characteristic of
interest generating multiple samples to gauge variation and making predictions or conclusions about the population
e Informally explain situations in which statistical bias may exist
Make inferences from an informal comparison of two populations
11 Informally assess the degree of visual overlap of two numerical data distributions with similar variabilities measuring the difference between the centers by expressing it as a multiple of a measure of variability
12 Make informal comparative inferences about two populations using measures of center and variability andor mean absolute deviation in context
Grade 7 Mathematics
72 2019 Alabama Course of Study Mathematics
Investigate probability models
13 Use a number from 0 to 1 to represent the probability of a chance event occurring explaining that larger numbers indicate greater likelihood of the event occurring while a number near zero indicates an unlikely event
14 Define and develop a probability model including models that may or may not be uniform where uniform models
assign equal probability to all outcomes and non-uniform models involve events that are not equally likely a Collect and use data to predict probabilities of events b Compare probabilities from a model to observed frequencies explaining possible sources of discrepancy
15 Approximate the probability of an event using data generated by a simulation (experimental probability) and compare it to the theoretical probability a Observe the relative frequency of an event over the long run using simulation or technology and use those
results to predict approximate relative frequency 16 Find probabilities of simple and compound events through experimentation or simulation and by analyzing the
sample space representing the probabilities as percents decimals or fractions a Represent sample spaces for compound events using methods such as organized lists tables and tree diagrams
and determine the probability of an event by finding the fraction of outcomes in the sample space for which the compound event occurred
b Design and use a simulation to generate frequencies for compound events c Represent events described in everyday language in terms of outcomes in the sample space which composed
the event
Geometry and Measurement Construct and describe geometric figures analyzing relationships among them
17 Solve problems involving scale drawings of geometric figures including computation of actual lengths and areas from a scale drawing and reproduction of a scale drawing at a different scale
18 Construct geometric shapes (freehand using a ruler and a protractor and using technology) given a written
description or measurement constraints with an emphasis on constructing triangles from three measures of angles or sides noticing when the conditions determine a unique triangle more than one triangle or no triangle
19 Describe the two-dimensional figures created by slicing three-dimensional figures into plane sections
Grade 7 Mathematics
73 2019 Alabama Course of Study Mathematics
Solve real-world and mathematical problems involving angle measure circumference area surface area and volume Note Students must select and use the appropriate unit for the attribute being measured when determining length area angle time or volume
20 Explain the relationships among circumference diameter area and radius of a circle to demonstrate understanding of formulas for the area and circumference of a circle a Informally derive the formula for area of a circle b Solve area and circumference problems in real-world and mathematical situations involving circles
21 Use facts about supplementary complementary vertical and adjacent angles in multi-step problems to write and solve simple equations for an unknown angle in a figure
22 Solve real-world and mathematical problems involving area volume and surface area of two- and three-
dimensional objects composed of triangles quadrilaterals polygons cubes and right rectangular prisms
Grade 8 Mathematics
74 2019 Alabama Course of Study Mathematics
Grade 8 Mathematics Overview
In Grade 8 content is organized into four Alabama Content Areas outlined below Number Systems and Operations Algebra and Functions Data Analysis Statistics and Probability and Geometry and Measurement Related standards are grouped into clusters which are listed below each content area Resources to support the Grade 8 mathematical standards are in Appendix D Standards indicate what students should know or be able to do by the end of the course
Alabama Content Areas Number Systems and Operations Algebra and Functions Data Analysis Statistics
and Probability Geometry and Measurement
Clusters
bull Understand that the real number system is composed of rational and irrational numbers
bull Apply concepts of rational and integer exponents
bull Analyze the relationship between proportional and non-proportional situations
bull Analyze and solve linear equations and systems of two linear equations
bull Explain evaluate and compare functions bull Use functions to model relationships between
quantities
bull Investigate patterns of association in bivariate data
bull Understand congruence and similarity using physical models or technology
bull Analyze parallel lines cut by a transversal
bull Understand and apply the Pythagorean Theorem
bull Solve real-world and mathematical problems involving volume of cylinders cones and spheres
The eight Student Mathematical Practices listed in the chart below represent what students are doing as they learn mathematics Students should regularly engage in these processes and proficiencies at every level throughout their mathematical studies Proficiency with these practices is critical in using mathematics both in the classroom and in everyday life The Student Mathematical Practices are standards to be incorporated across all grades
Student Mathematical Practices 1 Make sense of problems and persevere in solving them 5 Use appropriate tools strategically 2 Reason abstractly and quantitatively 6 Attend to precision 3 Construct viable arguments and critique the reasoning of others 7 Look for and make use of structure 4 Model with mathematics 8 Look for and express regularity in repeated reasoning
Grade 8 Mathematics
75 2019 Alabama Course of Study Mathematics
Content Priorities
In Grade 8 instructional time should focus on three critical areas all of which have equal importance
1 Construct and reason about expressions and equations including modeling an association in bivariate data with a linear equation and solving linear equations and systems of linear equations Students use linear equations and systems of linear equations to represent analyze and solve a variety of problems Students recognize equations for proportions (yx = k or y = kx) as special linear equations (y = mx + b) understanding that the constant of proportionality (k) is the slope and the graphs are lines through the origin They understand that the slope (m) of a line is a constant rate of change Students also use a linear equation to describe the association between two quantities in bivariate data At this grade level fitting the model to the data and assessing its fit are done informally Interpreting the model in the context of the data requires students to express a relationship between the two quantities in question and to interpret components of the relationship (such as slope and y-intercept) in terms of the situation Students choose and implement procedures to solve linear equations in one variable understanding that when they use the properties of equality they maintain the solutions of the original equation Students solve systems of two linear equations in two variables and relate the systems to pairs of lines in the plane these intersect are parallel or are the same line Students use linear equations systems of linear equations linear functions and their understanding of slope of a line to analyze situations and solve problems
2 Describe the concept of a function and use functions to interpret quantitative relationships
Students grasp the concept of a function as a rule that assigns to each input exactly one output They understand that functions describe situations where one quantity determines another They describe how aspects of the function are reflected in the different representations
3 Analyze two- and three-dimensional figures and understand and apply the Pythagorean Theorem
Students use ideas about distance and angles and how they behave under translations rotations reflections and dilations and ideas about congruence and similarity to analyze and describe two-dimensional figures and to solve problems Students show that the sum of the angles in a triangle is the angle formed by a straight line Students understand and can explain the Pythagorean Theorem and its converse They apply the Pythagorean Theorem to find distances between points on the coordinate plane to find lengths and to analyze polygons Students understand and apply properties of parallel lines cut by a transversal in order to solve problems Students conclude their study on volume by solving problems involving cones cylinders and spheres
Grade 8 Mathematics
76 2019 Alabama Course of Study Mathematics
Grade 8 Mathematics Content Standards
Each content standard completes the stem ldquoStudents willhelliprdquo Number Systems and Operations Understand that the real number system is composed of rational and irrational numbers
1 Define the real number system as composed of rational and irrational numbers a Explain that every number has a decimal expansion for rational numbers the decimal expansion repeats or
terminates b Convert a decimal expansion that repeats into a rational number
2 Locate rational approximations of irrational numbers on a number line compare their sizes and estimate the values
of the irrational numbers
Algebra and Functions Apply concepts of integer exponents and radicals
3 Develop and apply properties of integer exponents to generate equivalent numerical and algebraic expressions
4 Use square root and cube root symbols to represent solutions to equations a Evaluate square roots of perfect squares (less than or equal to 225) and cube roots of perfect cubes (less than or
equal to 1000) b Explain that the square root of a non-perfect square is irrational
5 Estimate and compare very large or very small numbers in scientific notation
6 Perform operations with numbers expressed in scientific notation including problems where both decimal and
scientific notation are used a Use scientific notation and choose units of appropriate size for measurements of very large or very small
quantities b Interpret scientific notation that has been generated by technology
Grade 8 Mathematics
77 2019 Alabama Course of Study Mathematics
Analyze the relationship between proportional and non-proportional situations
7 Determine whether a relationship between two variables is proportional or non-proportional 8 Graph proportional relationships
a Interpret the unit rate of a proportional relationship describing the constant of proportionality as the slope of the graph which goes through the origin and has the equation y = mx where m is the slope
9 Interpret y = mx + b as defining a linear equation whose graph is a line with m as the slope and b as the y-intercept
a Use similar triangles to explain why the slope m is the same between any two distinct points on a non-vertical line in a coordinate plane
b Given two distinct points in a coordinate plane find the slope of the line containing the two points and explain why it will be the same for any two distinct points on the line
c Graph linear relationships interpreting the slope as the rate of change of the graph and the y-intercept as the initial value
d Given that the slopes for two different sets of points are equal demonstrate that the linear equations that include those two sets of points may have different y-intercepts
10 Compare proportional and non-proportional linear relationships represented in different ways (algebraically
graphically numerically in tables or by verbal descriptions) to solve real-world problems
Analyze and solve linear equations and systems of two linear equations
11 Solve multi-step linear equations in one variable including rational number coefficients and equations that require using the distributive property and combining like terms a Determine whether linear equations in one variable have one solution no solution or infinitely many solutions
of the form x = a a = a or a = b (where a and b are different numbers) b Represent and solve real-world and mathematical problems with equations and interpret each solution in the
context of the problem
12 Solve systems of two linear equations in two variables by graphing and substitution a Explain that the solution(s) of systems of two linear equations in two variables corresponds to points of
intersection on their graphs because points of intersection satisfy both equations simultaneously b Interpret and justify the results of systems of two linear equations in two variables (one solution no solution or
infinitely many solutions) when applied to real-world and mathematical problems
Grade 8 Mathematics
78 2019 Alabama Course of Study Mathematics
Explain evaluate and compare functions
13 Determine whether a relation is a function defining a function as a rule that assigns to each input (independent value) exactly one output (dependent value) and given a graph table mapping or set of ordered pairs
14 Evaluate functions defined by a rule or an equation given values for the independent variable 15 Compare properties of functions represented algebraically graphically numerically in tables or by verbal
descriptions a Distinguish between linear and non-linear functions
Use functions to model relationships between quantities
16 Construct a function to model a linear relationship between two variables a Interpret the rate of change (slope) and initial value of the linear function from a description of a relationship or
from two points in a table or graph
17 Analyze the relationship (increasing or decreasing linear or non-linear) between two quantities represented in a graph
Data Analysis Statistics and Probability Investigate patterns of association in bivariate data
18 Construct and interpret scatter plots for bivariate measurement data to investigate patterns of association between two quantities describing patterns in terms of positive negative or no association linear and non-linear association clustering and outliers
19 Given a scatter plot that suggests a linear association informally draw a line to fit the data and assess the model fit by judging the closeness of the data points to the line
20 Use a linear model of a real-world situation to solve problems and make predictions a Describe the rate of change and y-intercept in the context of a problem using a linear model of a real-world
situation
21 Construct and interpret a two-way table summarizing data on two categorical variables collected from the same subjects using relative frequencies calculated for rows or columns to describe possible associations between the two variables
Grade 8 Mathematics
79 2019 Alabama Course of Study Mathematics
Geometry and Measurement Understand congruence and similarity using physical models or technology
22 Verify experimentally the properties of rigid motions (rotations reflections and translations) lines are taken to lines and line segments are taken to line segments of the same length angles are taken to angles of the same measure and parallel lines are taken to parallel lines a Given a pair of two-dimensional figures determine if a series of rigid motions maps one figure onto the other
recognizing that if such a sequence exists the figures are congruent describe the transformation sequence that verifies a congruence relationship
23 Use coordinates to describe the effect of transformations (dilations translations rotations and reflections) on two-
dimensional figures
24 Given a pair of two-dimensional figures determine if a series of dilations and rigid motions maps one figure onto the other recognizing that if such a sequence exists the figures are similar describe the transformation sequence that exhibits the similarity between them
Analyze parallel lines cut by a transversal
25 Analyze and apply properties of parallel lines cut by a transversal to determine missing angle measures a Use informal arguments to establish that the sum of the interior angles of a triangle is 180 degrees
Understand and apply the Pythagorean Theorem
26 Informally justify the Pythagorean Theorem and its converse
27 Apply the Pythagorean Theorem to find the distance between two points in a coordinate plane
28 Apply the Pythagorean Theorem to determine unknown side lengths of right triangles including real-world applications
Grade 8 Mathematics
80 2019 Alabama Course of Study Mathematics
Solve real-world and mathematical problems involving volume of cylinders cones and spheres Note Students must select and use the appropriate unit for the attribute being measured when determining length area angle time or volume
29 Informally derive the formulas for the volume of cones and spheres by experimentally comparing the volumes of cones and spheres with the same radius and height to a cylinder with the same dimensions
30 Use formulas to calculate the volumes of three-dimensional figures (cylinders cones and spheres) to solve real-world problems
81 2019 Alabama Course of Study Mathematics
Grade 7 Accelerated and Grade 8 Accelerated Overview
Accelerated courses have been carefully aligned and designed for middle school students who show particular motivation and interest in mathematics In this pathway students meet all the standards of Grade 7 Grade 8 and Algebra I with Probability within the Grade 7 Accelerated and Grade 8 Accelerated courses thus merging all the standards from three years of mathematics into two years This enables students to move through the content more quickly Students who complete this pathway will be prepared to enter Geometry with Data Analysis in Grade 9 and then accelerate directly into Algebra II with Statistics in Grade 10 thus providing them with an opportunity to take additional specialized mathematics coursework in Grades 11 and 12 such as AP Calculus AP Statistics or college dual enrollment classes Clearly this pathway will be challenging and should be reserved for Grade 7 students who demonstrate a high level of motivation and interest in studying mathematics The Alabama Mathematics Content Areas shown below illustrate a progression designed to ensure that all students are equitably prepared to develop conceptual understanding of mathematics The NAEP (National Assessment of Educational Progress) content areas reflect an emphasis on the importance of mathematical reasoning through the full spectrum of mathematical content Alabama Mathematics Content Areas explicitly define the framework needed for students to develop a comprehensive understanding of underlying mathematics concepts
Grade 7 Accelerated and Grade 8 Accelerated Overview
82 2019 Alabama Course of Study Mathematics
In the graphic below the accelerated pathway from Geometry with Data Analysis is shown This pathway is acceptable for students who have completed both Grade 7 Accelerated and Grade 8 Accelerated mathematics in middle school
83 2019 Alabama Course of Study Mathematics
Grade 7 Accelerated Overview
The Grade 7 Accelerated course has been carefully aligned and designed for middle school students who show particular motivation and interest in mathematics In Grade 7 Accelerated the content is organized into five Alabama Content Areas Proportional Reasoning Number Systems and Operations Algebra and Functions Data Analysis Statistics and Probability and Geometry and Measurement Related standards are grouped into clusters which are listed below each content area Standards are labeled to indicate whether they come from Grade 7 Mathematics Grade 8 Mathematics or Algebra I with Probability Resources to support Grade 7 Accelerated mathematical standards are in Appendices D and E Standards indicate what students should know and be able to do by the end of the course While the word function is referenced in the standards for Grade 7 Accelerated function notation is reserved for Grade 8 Accelerated
Alabama Content Areas Proportional Reasoning Number Systems and
Operations Algebra and Functions Data Analysis Statistics and Probability Geometry and Measurement
Clusters
bull Analyze proportional relationships and use them to solve real-world problems and mathematical problems
bull Analyze the relationship between proportional and non-proportional situations
bull Apply and extend prior knowledge of addition subtraction multiplication and division to operations with rational numbers
bull Understand that the real number system is composed of rational and irrational numbers
bull Create equivalent expressions using the properties of operations
bull Apply concepts of rational and integer exponents
bull Solve real-world and mathematical problems using numerical and algebraic expressions equations and inequalities
bull Explain evaluate and compare functions
Make inferences about a population using random sampling
Make inferences from an informal comparison of two populations
Investigate probability models
bull Construct and describe geometrical figures analyzing relationships among them
bull Solve real-world and mathematical problems involving angle measure area surface area and volume
bull Understand congruence and similarity using physical models or technology
Grade 7 Accelerated
84 2019 Alabama Course of Study Mathematics
The eight Student Mathematical Practices listed in the chart below represent what students are doing as they learn mathematics Students should regularly engage in these processes and proficiencies at every level throughout their mathematical studies Proficiency with these practices is critical in using mathematics both in the classroom and in everyday life The Student Mathematical Practices are standards to be incorporated across all grades
Student Mathematical Practices
1 Make sense of problems and persevere in solving them 5 Use appropriate tools strategically 2 Reason abstractly and quantitatively 6 Attend to precision 3 Construct viable arguments and critique the reasoning of others 7 Look for and make use of structure 4 Model with mathematics 8 Look for and express regularity in repeated reasoning
Statements in bold print indicate the scope of the standard and align the standard to related content in other courses The full scope of every standard should be addressed during instruction
Grade 7 Accelerated Content Standards
Each content standard completes the stem ldquoStudents willhelliprdquo
Proportional Reasoning Analyze proportional relationships and use them to solve real-world problems and mathematical problems
1 Calculate unit rates of length area and other quantities measured in like or different units that include ratios or fractions [Grade 7 1]
2 Represent a relationship between two quantities and determine whether the two quantities are related
proportionally a Use equivalent ratios displayed in a table or in a graph of the relationship in the coordinate plane to
determine whether a relationship between two quantities is proportional b Identify the constant of proportionality (unit rate) and express the proportional relationship using multiple
representations including tables graphs equations diagrams and verbal descriptions of proportional relationships
c Explain in context the meaning of a point (xy) on the graph of a proportional relationship with special attention to the points (00) and (1 r) where r is the unit rate [Grade 7 2]
Grade 7 Accelerated
85 2019 Alabama Course of Study Mathematics
3 Solve multi-step percent problems in context using proportional reasoning including simple interest tax gratuities commissions fees markups and markdowns percent increase and percent decrease [Grade 7 3]
Analyze the relationship between proportional and non-proportional situations
4 Determine whether a relationship between two variables is proportional or non-proportional [Grade 8 7] 5 Graph proportional relationships
a Interpret the unit rate of a proportional relationship describing the constant of proportionality as the slope of the graph which goes through the origin and has the equation y = mx where m is the slope [Grade 8 8]
6 Interpret y = mx + b as defining a linear equation whose graph is a line with m as the slope and b as the y-intercept
a Use similar triangles to explain why the slope m is the same between any two distinct points on a non-vertical line in a coordinate plane
b Given two distinct points in a coordinate plane find the slope of the line containing the two points and explain why it will be the same for any two distinct points on the line
c Graph linear relationships interpreting the slope as the rate of change of the graph and the y-intercept as the initial value
d Given that the slopes for two different sets of points are equal demonstrate that the linear equations that include those two sets of points may have different y-intercepts [Grade 8 9]
7 Compare proportional and non-proportional linear relationships represented in different ways (algebraically
graphically numerically in tables or by verbal descriptions) to solve real-world problems [Grade 8 10]
Grade 7 Accelerated
86 2019 Alabama Course of Study Mathematics
Number Systems and Operations Apply and extend prior knowledge of addition subtraction multiplication and division to operations with rational numbers
8 Apply and extend knowledge of operations of whole numbers fractions and decimals to add subtract multiply and divide rational numbers including integers signed fractions and decimals a Identify and explain situations where the sum of opposite quantities is 0 and opposite quantities are defined as
additive inverses b Interpret the sum of two or more rational numbers by using a number line and in real-world contexts c Explain subtraction of rational numbers as addition of additive inverses d Use a number line to demonstrate that the distance between two rational numbers on the number line is the
absolute value of their difference and apply this principle in real-world contexts e Extend strategies of multiplication to rational numbers to develop rules for multiplying signed numbers
showing that the properties of the operations are preserved f Divide integers and explain that division by zero is undefined Interpret the quotient of integers (with a non-zero
divisor) as a rational number g Convert a rational number to a decimal using long division explaining that the decimal form of a rational
number terminates or eventually repeats [Grade 7 4] 9 Solve real-world and mathematical problems involving the four operations of rational numbers including complex
fractions Apply properties of operations as strategies where applicable [Grade 7 5]
Understand that the real number system is composed of rational and irrational numbers
10 Define the real number system as composed of rational and irrational numbers a Explain that every number has a decimal expansion for rational numbers the decimal expansion repeats in a
pattern or terminates b Convert a decimal expansion that repeats in a pattern into a rational number [Grade 8 1]
11 Locate rational approximations of irrational numbers on a number line compare their sizes and estimate the values
of irrational numbers [Grade 8 2]
Grade 7 Accelerated
87 2019 Alabama Course of Study Mathematics
Algebra and Functions Create equivalent expressions using the properties of operations
12 Apply properties of operations as strategies to add subtract factor and expand linear expressions with rational coefficients [Grade 7 6]
13 Generate expressions in equivalent forms based on context and explain how the quantities are related [Grade 7 7]
Apply concepts of rational and integer exponents
14 Develop and apply properties of integer exponents to generate equivalent numerical and algebraic expressions [Grade 8 3]
15 Use square root and cube root symbols to represent solutions to equations
a Evaluate square roots of perfect squares (less than or equal to 225) and cube roots of perfect cubes (less than or equal to 1000)
b Explain that the square root of a non-perfect square is irrational [Grade 8 4]
16 Express and compare very large or very small numbers in scientific notation [Grade 8 5] a Perform operations with numbers expressed in scientific notation including problems where both decimal and
scientific notation are used expressing answers in scientific notation [Grade 8 6] b Use scientific notation and choose units of appropriate size for measurements of very large or very small
quantities [Grade 8 6a] c Interpret scientific notation that has been generated by technology [Grade 8 6b]
Grade 7 Accelerated
88 2019 Alabama Course of Study Mathematics
Solve real-world and mathematical problems using numerical and algebraic expressions equations and inequalities
17 Solve multi-step real-world and mathematical problems involving rational numbers (integers signed fractions and decimals) converting between forms as needed Assess the reasonableness of answers using mental computation and estimation strategies [Grade 7 8]
18 Use variables to represent quantities in a real-world or mathematical problem and construct algebraic expressions
equations and inequalities to solve problems by reasoning about the quantities a Solve word problems leading to equations of the form px + q = r and p(x + q) = r where p q and r are specific
rational numbers Solve equations of these forms fluently Compare an algebraic solution to an arithmetic solution identifying the sequence of the operations used in each approach
b Solve word problems leading to inequalities of the form px + q gt r or px + q lt r where p q and r are specific rational numbers Graph the solution set of the inequality and interpret it in the context of the problem [Grade 7 9 and linear portion of Algebra I with Probability 11]
19 Create equations in two variables to represent relationships between quantities in context graph equations on
coordinate axes with labels and scales and use them to make predictions Limit to contexts arising from linear functions [Algebra I with Probability 12 partial]
20 Represent constraints by equations andor inequalities and interpret solutions as viable or nonviable options in a
modeling context Limit to contexts arising from linear [Algebra I with Probability 13 partial] 21 Solve multi-step linear equations in one variable including rational number coefficients and equations that require
using the distributive property and combining like terms a Determine whether linear equations in one variable have one solution no solution or infinitely many solutions
of the form x = a a = a or a = b (where a and b are different numbers) b Represent and solve real-world and mathematical problems with equations and interpret each solution in the
context of the problem [Grade 8 11]
Explain evaluate and compare functions
22 Identify the effect on the graph of replacing f (x) by f (x) + k k middot f(x) f (kx) and f (x + k) for specific values of k (both positive and negative) find the value of k given the graphs Experiment with cases and explain the effects on the graph using technology where appropriate Limit to linear functions [Algebra I with Probability 23]
Grade 7 Accelerated
89 2019 Alabama Course of Study Mathematics
23 Construct a function to model the linear relationship between two variables a Interpret the rate of change (slope) and initial value of the linear function from a description of a relationship
from two points in a table or graph [Grade 8 16] 24 Explain why the x-coordinates of the points where the graphs of the equations y = f(x) and y = g(x) intersect are the
solutions of the equation f(x) = g(x) Limit to linear equations [Algebra I with Probability 19]
25 Find approximate solutions by graphing the functions making tables of values or finding successive approximations using technology where appropriate Note Include cases where f(x) is linear and g(x) is constant or linear [Algebra I with Probability 19 edited]
Data Analysis Statistics and Probability Make inferences about a population using random sampling
26 Examine a sample of a population to generalize information about the population a Differentiate between a sample and a population b Compare sampling techniques to determine whether a sample is random and thus representative of a population
explaining that random sampling tends to produce representative samples and support valid inferences c Determine whether conclusions and generalizations can be made about a population based on a sample d Use data from a random sample to draw inferences about a population with an unknown characteristic of
interest generating multiple samples to gauge variation and make predictions or conclusions about the population
e Informally explain situations in which statistical bias may exist [Grade 7 10]
Make inferences from an informal comparison of two populations
27 Informally assess the degree of visual overlap of two numerical data distributions with similar variabilities measuring the difference between the centers by expressing it as a multiple of a measure of variability [Grade 7 11]
28 Make informal comparative inferences about two populations using measures of center and variability andor mean
absolute deviation in context [Grade 7 12]
Investigate probability models
29 Use a number between 0 and 1 to represent the probability of a chance event occurring explaining that larger numbers indicate greater likelihood of the event occurring while a number near zero indicates an unlikely event [Grade 7 13]
Grade 7 Accelerated
90 2019 Alabama Course of Study Mathematics
30 Define and develop a probability model including models that may or may not be uniform where uniform models assign equal probability to all outcomes and non-uniform models involve events that are not equally likely a Collect and use data to predict probabilities of events b Compare probabilities from a model to observe frequencies explaining possible sources of discrepancy
[Grade 7 14] 31 Approximate the probability of an event by using data generated by a simulation (experimental probability) and
compare it to theoretical probability a Observe the relative frequency of an event over the long run using simulation or technology and use those
results to predict approximate relative frequency [Grade 7 15]
32 Find probabilities of simple and compound events through experimentation or simulation and by analyzing the sample space representing the probabilities as percents decimals or fractions a Represent sample spaces for compound events using methods such as organized lists tables and tree diagrams
and determine the probability of an event by finding the fraction of outcomes in the sample space for which the compound event occurred
b Design and use a simulation to generate frequencies for compound events c Represent events described in everyday language in terms of outcomes in the sample space which composed the
event [Grade 7 16]
Geometry and Measurement Construct and describe geometrical figures analyzing relationships among them
33 Solve problems involving scale drawings of geometric figures including computation of actual lengths and areas from a scale drawing and reproduction of a scale drawing at a different scale [Grade 7 17]
34 Construct geometric shapes (freehand using a ruler and a protractor and using technology) given measurement
constraints with an emphasis on constructing triangles from three measures of angles or sides noticing when the conditions determine a unique triangle more than one triangle or no triangle [Grade 7 18]
35 Describe the two-dimensional figures created by slicing three-dimensional figures into plane sections [Grade 7 19]
Grade 7 Accelerated
91 2019 Alabama Course of Study Mathematics
Solve real-world and mathematical problems involving angle measure area surface area and volume
36 Explain the relationships among circumference diameter area and radius of a circle to demonstrate understanding of formulas for the area and circumference of a circle a Informally derive the formula for area of a circle b Solve area and circumference problems in real-world and mathematical situations involving circles [Grade 7 20]
37 Use facts about supplementary complementary vertical and adjacent angles in multi-step problems to write and
solve simple equations for an unknown angle in a figure [Grade 7 21]
38 Analyze and apply properties of parallel lines cut by a transversal to determine missing angle measures a Use informal arguments to establish that the sum of the interior angles of a triangle is 180 degrees [Grade 8 25]
39 Solve real-world and mathematical problems involving area volume and surface area of two- and three-
dimensional objects composed of triangles quadrilaterals polygons cubes and right rectangular prisms [Grade 7 22]
40 Informally derive the formulas for the volume of cones and spheres by experimentally comparing the volumes of
cones and spheres with the same radius and height to a cylinder with the same dimensions [Grade 8 29]
41 Use formulas to calculate the volumes of three-dimensional figures to solve real-world problems [Grade 8 30]
Understand congruence and similarity using physical models or technology
42 Verify experimentally the properties of rigid motions (rotations reflections and translations) lines are taken to lines and line segments are taken to line segments of the same length angles are taken to angles of the same measure and parallel lines are taken to parallel lines a Given a pair of two-dimensional figures determine if a series of rigid motions maps one figure onto the other
recognizing that if such a sequence exists the figures are congruent describe the transformation sequence that verifies a congruence relationship [Grade 8 22]
43 Use coordinates to describe the effect of transformations (dilations translations rotations and reflections) on two-
dimensional figures [Grade 8 23]
44 Given a pair of two-dimensional figures determine if a series of dilations and rigid motions maps one figure onto the other recognizing that if such a sequence exists the figures are similar describe the transformation sequence that exhibits the similarity between them [Grade 8 24]
92 2019 Alabama Course of Study Mathematics
Grade 8 Accelerated Overview
The Grade 8 Accelerated course has been carefully aligned and designed for middle school students who have completed the Grade 7 Accelerated course and show particular motivation and interest in mathematics In Grade 8 Accelerated there are four content areas Number Systems and Operations Algebra and Functions Data Analysis Statistics and Probability and Geometry and Measurement The algebra focus is on quadratic relationships Students who successfully complete this course will be prepared to enter Geometry with Data Analysis in Grade 9 and then accelerate directly into Algebra II with Statistics in Grade 10 thus providing them with an opportunity to take additional specialized mathematics coursework such as AP Calculus or AP Statistics in Grades 11 and 12 Standards have been labeled to indicate whether they come from Grade 8 Mathematics or Algebra I with Probability Resources to support Grade 8 Accelerated mathematical standards are in Appendices D and E While the word function is referenced in the standards for Grade 7 Accelerated function notation is reserved for Grade 8 Accelerated
Grade 8 Accelerated
93 2019 Alabama Course of Study Mathematics
Alabama Content Areas
Number Systems and Operations Algebra and Functions Data Analysis Statistics and Probability Geometry and
Measurement
Clusters
bull Together irrational numbers and rational numbers complete the real number system representing all points on the number line while there exist numbers beyond the real numbers called complex numbers
Expressions can be rewritten in equivalent forms by using algebraic properties including properties of addition multiplication and exponentiation to make different characteristics or features visible
Analyze and solve linear equations and systems of two linear equations
bull Finding solutions to an equation inequality or system of equations or inequalities requires the checking of candidate solutions whether generated analytically or graphically to ensure that solutions are found and that those found are not extraneous
bull The structure of an equation or inequality (including but not limited to one-variable linear and quadratic equations inequalities and systems of linear equations in two variables) can be purposefully analyzed (with and without technology) to determine an efficient strategy to find a solution if one exists and then to justify the solution
bull Expressions equations and inequalities can be used to analyze and make predictions both within mathematics and as mathematics is applied in different contexts ndash in particular contexts that arise in relation to linear quadratic and exponential situations
bull Functions shift the emphasis from a point-by-point relationship between two variables (inputoutput) to considering an entire set of ordered pairs (where each first element is paired with exactly one second element) as an entity with its own features and characteristics
bull Graphs can be used to obtain exact or approximate solutions of equations inequalities and systems of equations and inequalities ndash including systems of linear equations in two variables and systems of linear and quadratic equations (given or obtained by using technology)
bull Functions can be described by using a variety of representations mapping diagrams function notation (eg f(x) = x2) recursive definitions tables and graphs
bull Functions that are members of the same family have distinguishing attributes (structure) common to all functions within that family
Functions can be represented graphically and key features of the graphs including zeros intercepts and when relevant rate of change and maximumminimum values can be associated with and interpreted in terms of the equivalent symbolic representation
bull Functions model a wide variety of real situations and can help students understand the processes of making and changing assumptions assigning variables and finding solutions to contextual problems
Investigate patterns of association in bivariate data
Data arise from a context and come in two types quantitative (continuous or discrete) and categorical Technology can be used to ldquocleanrdquo and organize data including very large data sets into a useful and manageable structure ndash a first step in any analysis of data
The association between two categorical variables is typically represented by using two-way tables and segmented bar graphs
Data analysis techniques can be used to develop models of contextual situations and to generate and evaluate possible solutions to real problems involving those contexts
Mathematical and statistical reasoning about data can be used to evaluate conclusions and assess risks
Making and defending informed data-based decisions is a characteristic of a quantitatively literate person
Two events are independent if the occurrence of one event does not affect the probability of the other event Determining whether two events are independent can be used for finding and understanding probabilities
Conditional probabilities ndash that is those probabilities that are ldquoconditionedrdquo by some known information ndash can be computed from data organized in contingency tables Conditions or assumptions may affect the computation of a probability
Understand and apply the Pythagorean Theorem
Grade 8 Accelerated
94 2019 Alabama Course of Study Mathematics
The eight Student Mathematical Practices listed in the chart below represent what students are doing as they learn mathematics Students should regularly engage in these processes and proficiencies at every level throughout their mathematical studies Proficiency with these practices is critical in using mathematics both within the classroom and in life The Student Mathematical Practices are standards to be incorporated across all grades
Student Mathematical Practices
1 Make sense of problems and persevere in solving them 5 Use appropriate tools strategically 2 Reason abstractly and quantitatively 6 Attend to precision 3 Construct viable arguments and critique the reasoning of others 7 Look for and make use of structure 4 Model with mathematics 8 Look for and express regularity in repeated reasoning
Statements in bold print indicate the scope of the standard and align the standard to related content in other courses The full scope of every standard should be addressed during instruction
Grade 8 Accelerated Content Standards Each content standard completes the stem ldquoStudents willhelliprdquo
Number Systems and Operations Together irrational numbers and rational numbers complete the real number system representing all points on the number line while there exist numbers beyond the real numbers called complex numbers
1 Explain how the meaning of rational exponents follows from extending the properties of integer exponents to those values allowing for an additional notation for radicals in terms of rational exponents [Algebra I with Probability 1]
2 Rewrite expressions involving radicals and rational exponents using the properties of exponents [Algebra I with Probability 2]
3 Define the imaginary number i such that i 2 = -1 [Algebra I with Probability 3]
Grade 8 Accelerated
95 2019 Alabama Course of Study Mathematics
Algebra and Functions Expressions can be rewritten in equivalent forms by using algebraic properties including properties of addition multiplication and exponentiation to make different characteristics or features visible
4 Interpret linear quadratic and exponential expressions in terms of a context by viewing one or more of their parts as a single entity [Algebra I with Probability 4] Example Interpret the accrued amount of investment P(1 + r)t where P is the principal and r is the interest rate as the product of P and a factor depending on time t
5 Use the structure of an expression to identify ways to rewrite it [Algebra I with Probability 5] Example See x4 - y4 as (x2)2 - (y2)2 thus recognizing it as a difference of squares that can be factored as (x2 - y2)(x2 + y2)
6 Choose and produce an equivalent form of an expression to reveal and explain properties of the quantity represented by the expression a Factor quadratic expressions with leading coefficients of one and use the factored form to reveal the zeros
of the function it defines b Use the vertex form of a quadratic expression to reveal the maximum or minimum value and the axis of
symmetry of the function it defines complete the square to find the vertex form of quadratics with a leading coefficient of one
c Use the properties of exponents to transform expressions for exponential functions [Algebra I with Probability 6] Example Identify percent rate of change in functions such as y = (102)t y = (097)t y = (101)12t or y = (12)t10 and classify them as representing exponential growth or decay
7 Add subtract and multiply polynomials showing that polynomials form a system analogous to the integers
namely they are closed under the operations of addition subtraction and multiplication [Algebra I with Probability 7]
8 Analyze the relationship (increasing or decreasing linear or non-linear) between two quantities represented in a
graph [Grade 8 17]
Grade 8 Accelerated
96 2019 Alabama Course of Study Mathematics
Analyze and solve linear equations and systems of two linear equations
9 Solve systems of two linear equations in two variables by graphing and substitution a Explain that the solution(s) of systems of two linear equations in two variables corresponds to points of
intersection on their graphs because points of intersection satisfy both equations simultaneously b Interpret and justify the results of systems of two linear equations in two variables (one solution no solution
or infinitely many solutions) when applied to real-world and mathematical problems [Grade 8 12]
Finding solutions to an equation inequality or system of equations or inequalities requires the checking of candidate solutions whether generated analytically or graphically to ensure that solutions are found and that those found are not extraneous
10 Explain why extraneous solutions to an equation involving absolute values may arise and how to check to be sure that a candidate solution satisfies an equation [Algebra I with Probability 8]
The structure of an equation or inequality (including but not limited to one-variable linear and quadratic equations inequalities and systems of linear equations in two variables) can be purposefully analyzed (with and without technology) to determine an efficient strategy to find a solution if one exists and then to justify the solution
11 Select an appropriate method to solve a quadratic equation in one variable a Use the method of completing the square to transform any quadratic equation in x into an equation of the
form (x ndash p)2 = q that has the same solutions Explain how the quadratic formula is derived from this form b Solve quadratic equations by inspection (such as x2 = 49) taking square roots completing the square the
quadratic formula and factoring as appropriate to the initial form of the equation and recognize that some solutions may not be real [Algebra I with Probability 9]
12 Select an appropriate method to solve a system of two linear equations in two variables a Solve a system of two equations in two variables by using linear combinations contrast situations in which
use of linear combinations is more efficient with those in which substitution is more efficient b Contrast solutions to a system of two linear equations in two variables produced by algebraic methods with
graphical and tabular methods [Algebra I with Probability 10]
Grade 8 Accelerated
97 2019 Alabama Course of Study Mathematics
Expressions equations and inequalities can be used to analyze and make predictions both within mathematics and as mathematics is applied in different contexts ndash in particular contexts that arise in relation to linear quadratic and exponential situations
13 Create equations and inequalities in one variable and use them to solve problems in context either exactly or approximately Extend from contexts arising from linear functions to those involving quadratic exponential and absolute value functions [Algebra I with Probability 11]
14 Create equations in two or more variables to represent relationships between quantities in context graph equations on coordinate axes with labels and scales and use them to make predictions Limit to contexts arising from linear quadratic exponential absolute value and linear piecewise functions [Algebra I with Probability 12]
15 Represent constraints by equations andor inequalities and solve systems of equations andor inequalities
interpreting solutions as viable or nonviable options in a modeling context Limit to contexts arising from linear quadratic exponential absolute value and linear piecewise functions [Algebra I with Probability 13]
Functions shift the emphasis from a point-by-point relationship between two variables (inputoutput) to considering an entire set of ordered pairs (where each first element is paired with exactly one second element) as an entity with its own features and characteristics
16 Define a function as a mapping from one set (called the domain) to another set (called the range) that assigns to each element of the domain exactly one element of the range [Grade 8 13 edited for added content] a Use function notation evaluate functions for inputs in their domains and interpret statements that use
function notation in terms of a context [Grade 8 14 edited for added content] Note If f is a function and x is an element of its domain then f(x) denotes the output of f corresponding to the input x
b Relate the domain of a function to its graph and where applicable to the quantitative relationship it describes Limit to linear quadratic exponential and absolute value functions [Algebra I with Probability 15]
17 Given a relation defined by an equation in two variables identify the graph of the relation as the set of all its
solutions plotted in the coordinate plane [Algebra I with Probability 14] Note The graph of a relation often forms a curve (which could be a line)
18 Compare and contrast relations and functions represented by equations graphs or tables that show related values determine whether a relation is a function Identify that a function f is a special kind of relation defined by the equation y = f(x) [Algebra I with Probability 16]
Grade 8 Accelerated
98 2019 Alabama Course of Study Mathematics
19 Combine different types of standard functions to write evaluate and interpret functions in context Limit to linear quadratic exponential and absolute value functions a Use arithmetic operations to combine different types of standard functions to write and evaluate functions
Example Given two functions one representing flow rate of water and the other representing evaporation of that water combine the two functions to determine the amount of water in the container at a given time
b Use function composition to combine different types of standard functions to write and evaluate functions [Algebra I with Probability 17] Example Given the following relationships determine what the expression S(T(t)) represents
Function Input Output
G Amount of studying s Grade in course G(s)
S Grade in course g Amount of screen time S(g)
T Amount of screen time t Number of followers T(t)
Graphs can be used to obtain exact or approximate solutions of equations inequalities and systems of equations and inequalities ndash including systems of linear equations in two variables and systems of linear and quadratic equations (given or obtained by using technology)
20 Explain why the x-coordinates of the points where the graphs of the equations y = f(x) and y = g(x) intersect are the solutions of the equation f(x) = g(x) a Find the approximate solutions of an equation graphically using tables of values or finding successive
approximations using technology where appropriate [Algebra I with Probability 19] Note Include cases where f(x) is linear quadratic exponential or absolute value functions and g(x) is constant or linear
21 Graph the solutions to a linear inequality in two variables as a half-plane (excluding the boundary in the case of
a strict inequality) and graph the solution set to a system of linear inequalities in two variables as the intersection of the corresponding half-planes using technology where appropriate [Algebra I with Probability 20]
22 Solve systems consisting of linear andor quadratic equations in two variables graphically using technology
where appropriate [Algebra I with Probability 18]
Grade 8 Accelerated
99 2019 Alabama Course of Study Mathematics
Functions can be described by using a variety of representations mapping diagrams function notation (eg f(x) = x2) recursive definitions tables and graphs
23 Compare properties of two functions each represented in a different way (algebraically graphically numerically in tables or by verbal descriptions) Include linear quadratic exponential absolute value and linear piecewise [Algebra I with Probability 21 edited] a Distinguish between linear and non-linear functions [Grade 8 15a]
24 Define sequences as functions including recursive definitions whose domain is a subset of the integers
a Write explicit and recursive formulas for arithmetic and geometric sequences and connect them to linear and exponential functions [Algebra I with Probability 22] Example A sequence with constant growth will be a linear function while a sequence with proportional growth will be an exponential function
Functions that are members of the same family have distinguishing attributes (structure) common to all functions within that family
25 Identify the effect on the graph of replacing f (x) by f (x) + k kmiddotf (x) f (kx) and f (x + k) for specific values of k (both positive and negative) find the value of k given the graphs Experiment with cases and explain the effects on the graph using technology as appropriate Extend from linear to quadratic exponential absolute value and linear piecewise functions [Algebra I with Probability 23 edited]
26 Distinguish between situations that can be modeled with linear functions and those that can be modeled with exponential functions a Show that linear functions grow by equal differences over equal intervals while exponential functions grow
by equal factors over equal intervals b Define linear functions to represent situations in which one quantity changes at a constant rate per unit
interval relative to another c Define exponential functions to represent situations in which a quantity grows or decays by a constant
percent rate per unit interval relative to another [Algebra I with Probability 24]
27 Construct linear and exponential functions including arithmetic and geometric sequences given a graph a description of a relationship or two input-output pairs (include reading these from a table) [Algebra I with Probability 25]
28 Use graphs and tables to show that a quantity increasing exponentially eventually exceeds a quantity increasing linearly or quadratically [Algebra I with Probability 26]
Grade 8 Accelerated
100 2019 Alabama Course of Study Mathematics
29 Interpret the parameters of functions in terms of a context Extend from linear functions written in the form mx + b to exponential functions written in the form abx [Algebra I with Probability 27] Example If the function V(t) = 19885(075)t describes the value of a car after it has been owned for t years 19885 represents the purchase price of the car when t = 0 and 075 represents the annual rate at which its value decreases
Functions can be represented graphically and key features of the graphs including zeros intercepts and when relevant rate of change and maximumminimum values can be associated with and interpreted in terms of the equivalent symbolic representation
30 For a function that models a relationship between two quantities interpret key features of graphs and tables in terms of the quantities and sketch graphs showing key features given a verbal description of the relationship Note Key features include intercepts intervals where the function is increasing decreasing positive or negative maximums and minimums symmetries and end behavior Extend from relationships that can be represented by linear functions to quadratic exponential absolute value and general piecewise functions [Algebra I with Probability 28]
31 Calculate and interpret the average rate of change of a function (presented symbolically or as a table) over a specified interval Estimate the rate of change from a graph Limit to linear quadratic exponential and absolute value functions [Algebra I with Probability 29]
32 Graph functions expressed symbolically and show key features of the graph by hand in simple cases and using technology for more complicated cases a Graph linear and quadratic functions and show intercepts maxima and minima b Graph piecewise-defined functions including step functions and absolute value functions c Graph exponential functions showing intercepts and end behavior [Algebra I with Probability 30]
Functions model a wide variety of real situations and can help students understand the processes of making and changing assumptions assigning variables and finding solutions to contextual problems
33 Use the mathematical modeling cycle to solve real-world problems involving linear quadratic exponential absolute value and linear piecewise functions [Algebra I with Probability 31]
Grade 8 Accelerated
101 2019 Alabama Course of Study Mathematics
Data Analysis Statistics and Probability Investigate patterns of association in bivariate data
34 Construct and interpret scatter plots for bivariate measurement data to investigate patterns of association between two quantities describing patterns in terms of positive negative or no association linear and non-linear association clustering and outliers [Grade 8 18]
35 Given a scatter plot that suggests a linear association informally draw a line to fit the data and assess the model fit by judging the closeness of the data points to the line [Grade 8 19]
36 Use a linear model of a real-world situation to solve problems and make predictions a Describe the rate of change and y-intercept in the context of a problem using a linear model of a real-world
situation [Grade 8 20]
37 Construct and interpret a two-way table summarizing data on two categorical variables collected from the same subjects using relative frequencies calculated for rows or columns to describe possible associations between the two variables [Grade 8 21]
Data arise from a context and come in two types quantitative (continuous or discrete) and categorical Technology can be used to ldquocleanrdquo and organize data including very large data sets into a useful and manageable structure ndash a first step in any analysis of data
38 Distinguish between quantitative and categorical data and between the techniques that may be used for analyzing data of these two types [Algebra I with Probability 34] Example The color of cars is categorical and so is summarized by frequency and proportion for each color category while the mileage on each carrsquos odometer is quantitative and can be summarized by the mean
The association between two categorical variables is typically represented by using two-way tables and segmented bar graphs
39 Analyze the possible association between two categorical variables a Summarize categorical data for two categories in two-way frequency tables and represent using segmented
bar graphs b Interpret relative frequencies in the context of categorical data (including joint marginal and conditional
relative frequencies) c Identify possible associations and trends in categorical data [Algebra I with Probability 35]
Grade 8 Accelerated
102 2019 Alabama Course of Study Mathematics
Data analysis techniques can be used to develop models of contextual situations and to generate and evaluate possible solutions to real problems involving those contexts
40 Generate a two-way categorical table in order to find and evaluate solutions to real-world problems a Aggregate data from several groups to find an overall association between two categorical variables b Recognize and explore situations where the association between two categorical variables is reversed when a
third variable is considered (Simpsonrsquos Paradox) [Algebra I with Probability 36] Example In a certain city Hospital 1 has a higher fatality rate than Hospital 2 But when considering mildly-injured patients and severely-injured patients as separate groups Hospital 1 has a lower fatality rate among both groups than Hospital 2 since Hospital 1 is a Level 1 Trauma Center Thus Hospital 1 receives most of the severely-injured patients who are less likely to survive overall but have a better chance of surviving in Hospital 1 than they would in Hospital 2
Mathematical and statistical reasoning about data can be used to evaluate conclusions and assess risks
41 Use mathematical and statistical reasoning with bivariate categorical data in order to draw conclusions and assess risk [Algebra I with Probability 32] Example In a clinical trial comparing the effectiveness of flu shots A and B 21 subjects in treatment group A avoided getting the flu while 29 contracted it In group B 12 avoided the flu while 13 contracted it Discuss which flu shot appears to be more effective in reducing the chances of contracting the flu Possible answer Even though more people in group A avoided the flu than in group B the proportion of people avoiding the flu in group B is greater than the proportion in group A which suggests that treatment B may be more effective in lowering the risk of getting the flu
Contracted Flu Did Not Contract Flu
Flu Shot A 29 21
Flu Shot B 13 12
Total 42 33
Making and defending informed data-based decisions is a characteristic of a quantitatively literate person
42 Design and carry out an investigation to determine whether there appears to be an association between two categorical variables and write a persuasive argument based on the results of the investigation [Algebra I with Probability 33] Example Investigate whether there appears to be an association between successfully completing a task in a given length of time and listening to music while attempting to complete the task Randomly assign some students to listen to music while attempting to complete the task and others to complete the task without listening to music Discuss whether students should listen to music while studying based on that analysis
Grade 8 Accelerated
103 2019 Alabama Course of Study Mathematics
Two events are independent if the occurrence of one event does not affect the probability of the other event Determining whether two events are independent can be used for finding and understanding probabilities
43 Describe events as subsets of a sample space (the set of outcomes) using characteristics (or categories) of the outcomes or as unions intersections or complements of other events (or and not) [Algebra I with Probability 37]
44 Explain whether two events A and B are independent using two-way tables or tree diagrams [Algebra I with Probability 38]
Conditional probabilities ndash that is those probabilities that are ldquoconditionedrdquo by some known information ndash can be computed from data organized in contingency tables Conditions or assumptions may affect the computation of a probability
45 Compute the conditional probability of event A given event B using two-way tables or tree diagrams [Algebra I with Probability 39]
46 Recognize and describe the concepts of conditional probability and independence in everyday situations and explain them using everyday language [Algebra I with Probability 40] Example Contrast the chance of having lung cancer if you are a smoker with the chance of being a smoker if you have lung cancer
47 Explain why the conditional probability of A given B is the fraction of Bs outcomes that also belong to A and interpret the answer in context [Algebra I with Probability 41] Example the probability of drawing a king from a deck of cards given that it is a face card is 452
1252 which is 1
3
Geometry and Measurement Understand and apply the Pythagorean Theorem
48 Informally justify the Pythagorean Theorem and its converse [Grade 8 26]
49 Apply the Pythagorean Theorem to find the distance between two points in a coordinate plane [Grade 8 27]
50 Apply the Pythagorean Theorem to determine unknown side lengths of right triangles including real-world applications [Grade 8 28]
104 2019 Alabama Course of Study Mathematics
GRADES 9-12 OVERVIEW
The high school mathematics course of study in this document focuses on empowering students in three areas meeting their postsecondary goals whether they pursue additional study or enter the workforce functioning as effective citizens who can use mathematics to make responsible decisions about their own lives and about society as a
whole and recognizing mathematics as an inspiring enjoyable and significant human achievement
Meeting these goals requires students to understand that ldquomathematics is more than finding answers mathematics requires reasoning and problem-solving in order to solve real-world and mathematical problemsrdquo (see Teaching and Learning Mathematics Position Statement on p 7) Thus students must be consistently engaged in the Student Mathematical Practices which are listed as standards for every course At the high school level it is particularly important that students consistently use technology and other appropriate mathematical tools to explore and develop a deep understanding of the mathematics they are studying A particular emphasis on mathematical modeling (using mathematics to solve real world problems) is also incorporated throughout the courses Ensuring that all students receive the preparation they deserve requires unrelenting focus on developing their deep understanding of the most critical content that they will need not simply to pass the next test or course but also to function effectively throughout their lives In order to ensure the necessary focus on this critical content these standards build on ldquoessential conceptsrdquo for high school mathematics described by the National Council of Teachers of Mathematics (NCTM) in Catalyzing Change in High School Mathematics Initiating Critical Conversations (2018) These essential concepts are designed to be achieved by all students within the first three years of high school mathematics and they form the foundation for additional coursework designed to meet studentsrsquo specific post-high school needs and interests Note in particular the emphasis on statistics and probability which are increasingly important in todayrsquos world See the complete list of essential concepts below
Pathways to Student Success In order to be mathematically well-prepared upon graduation students need to complete four credits in high school mathematics The high school program builds on studentsrsquo preparation in Grades 6-8 with a shared pathway of three required courses taken by all students followed by additional ldquospecialized coursesrdquo that prepare students for life and study after high school including specific educational and career options Note that decisions on what pathway a student pursues should be based on his or her interests and motivation to pursue the pathway not on prejudgments about what he or she may or may not be able to achieve Students and parents
Grades 9-12 Overview
105 2019 Alabama Course of Study Mathematics
should receive full information on the different pathways and their consequences so that they can make informed decisions rather than having decisions made for them Students should also be encouraged to expand their horizons by taking a pathway that provides options beyond what they may currently be considering in order to accommodate the broadest range of future interests Placing Geometry with Data Analysis before Algebra I with Probability Following a recommendation in Catalyzing Change (NCTM 2018) Geometry with Data Analysis is the first required high school course followed by Algebra I with Probability and Algebra II with Statistics Placing Geometry with Data Analysis before Algebra I with Probability serves three major purposes First having two consecutive high school mathematics courses focusing on algebra without a geometry course in between means there is no gap in algebra content which should increase studentsrsquo retention of algebraic concepts and decrease the need for reteaching Second this arrangement allows all students no matter what pathway they followed in the middle grades to enter Geometry with Data Analysis in Grade 9 providing them with a common mathematics experience at the beginning of high school Students who did not complete the accelerated middle grades curriculum can then take Algebra I with Probability while students who have taken the accelerated middle grades curriculum and have made sufficient progress can move on to Algebra II with Statistics Third Geometry with Data Analysis develops mathematical knowledge and skills through visual representations prior to the more abstract development of algebra Beginning high school mathematics with Geometry with Data Analysis in Grade 9 offers students the opportunity to build their reasoning and sense-making skills see the applicability of mathematics and prepare more effectively for further studies in algebra Geometry with Data Analysis has been carefully designed so that its use of algebra in geometric contexts follows directly from and extends the algebraic knowledge and skills developed in Grade 8 Mathematics while reinforcing concepts included in the Grade 8 Accelerated Mathematics for students who have completed that course Support for students who are struggling School systems may not offer any of the three required courses as ldquoArdquo and ldquoBrdquo courses in which the content is spread over two courses Instead all school systems should offer lab courses to be taken concurrently with the required content courses to meet the needs of all students These lab courses might review prior knowledge needed for upcoming lessons reinforce content from previous lessons or preview upcoming content to ensure that students can fully participate in the required content classes Since lab courses do not cover additional mathematical standards students can receive only an elective credit for each of them not a mathematics credit No specific scheduling structure for the lab courses is prescribed in the course of study document Many schools and districts have intervention schedules which can be used or modified to accommodate the lab courses Students must receive the support they need for success in whatever form is possible without slowing down their progress through the curriculum which would limit their options for further study of mathematics Care should be taken to ensure that informed choices based on solid data are made about which students are assigned to lab classes or other supports Assignment to lab courses should be fluid based on frequent scrutiny of student progress rather than being a foregone conclusion based on the support they have received in the past
Grades 9-12 Overview
106 2019 Alabama Course of Study Mathematics
Support for students who are particularly motivated and interested While offering Geometry with Data Analysis before Grade 9 is not allowed an option is provided for middle school students who show particular motivation and interest in mathematicsmdashldquoacceleratedrdquo courses for Grade 7 and Grade 8 that incorporate the standards from Algebra I with Probability with the standards of Grade 7 and Grade 8 Students completing this pathway and showing adequate progress by the end of Geometry with Data Analysis in Grade 9 may move directly to Algebra II with Statistics These students will be required to take two additional courses beyond Algebra II with Statistics to earn the mandatory four credits in mathematics since neither of the accelerated middle grades courses (nor their combination) is equivalent to a high school mathematics course This provides them the opportunity to make additional progress towards their postsecondary goals The accelerated pathway is not the default for a large number of students it should be reserved for those students entering the seventh grade who are highly motivated to study mathematics very intensively However even highly motivated students may not excel in these courses Students who are not making adequate progress in Grade 7 Accelerated may elect to take the non-accelerated Grade 8 Mathematics course without any loss of progress Likewise even if students have completed the accelerated pathway they may elect to take the Algebra I with Probability course after Geometry with Data Analysis if they are not adequately prepared for Algebra II with Statistics Finally provision is made for Grade 9 students who did not complete the accelerated middle school pathway but who wish to take additional specialized mathematics courses in high school These students may take Geometry with Data Analysis and Algebra I with Probability concurrently in Grade 9 and then take Algebra II with Statistics in Grade 10 They should however also take a mathematics course in both Grade 11 and Grade 12 meaning that they earn a fifth mathematics credit in Grade 12 Continuing to study mathematics every year preserves student gains and is a key recommendation of Catalyzing Change (NCTM 2018) Students and parents should receive ongoing feedback and information on options as they decide whether or not to pursue or continue pursuing an accelerated pathway rather than having that decision made for them without consultation It is critical that all students are afforded the opportunity to pursue a pathway that supports their interests and goals Specialized mathematics courses Following Algebra II with Statistics students choose among three specialized mathematics classes that are designed to prepare them for future success in the postsecondary study of mathematics in careers and in their lifelong use and enjoyment of mathematics Again students and parents should receive full information on the different courses and the opportunities their completion will afford so that they can make informed decisions rather than having decisions made for them
Precalculus is designed for students who intend to enter mathematics-intensive majors or other majors or careers for which calculus is required These include a broad range of scientific and engineering fields as well as business and finance
Mathematical Modeling builds on the mathematics students have encountered in previous courses allowing them to explore real-world phenomena and engage in mathematical decision-making This course provides a solid foundation for students who are entering a range of
Grades 9-12 Overview
107 2019 Alabama Course of Study Mathematics
fields involving quantitative reasoning whether or not they may ultimately need calculus This course may be particularly appropriate for students who need precalculus in college
Applications of Finite Mathematics provides an introduction to mathematical thinking for solving problems that are frequently encountered in todayrsquos complex society but are not commonly encountered in the high school curriculum This course is appropriate for a broad range of students who are entering fields for which calculus is not required or who want to broaden their mathematical understanding
Note however that all of these courses are designed to allow students to progress to further studies in mathematics No course should be seen as a dead end but rather as an invitation to students to continue their journey in mathematics Students requiring two credits of mathematics after Algebra II with Statistics may take any two of the three specialized mathematics courses as their content does not substantially overlap and they may be completed in any order AP Calculus may also be taken following Precalculus in school systems where it is offered AP Calculus can provide a head start for students intending a major or career requiring calculus Extended courses AP Statistics and AP Computer Science courses are extended courses approved by ALSDE for a fourth mathematics credit These courses will supplement studentsrsquo mathematical preparation in high school but are not designed to prepare students for their initial credit-bearing post-secondary course in mathematics Students who intend to pursue a technical field may consider taking an AP Computer Science course along with either Applications of Finite Mathematics or Mathematical Modeling Students who intend to pursue a field with extensive use of statistics may consider taking AP Statistics along with either Applications of Finite Mathematics or Mathematical Modeling However to provide students with an adequate background for future mathematical endeavors it is recommended that AP Statistics and AP Computer Science courses be completed in addition to one of the specialized courses The ALSDE has approved other options for a fourth mathematics credit including dual enrollment courses see table at the end of Appendix B
Grades 9-12 Overview
108 2019 Alabama Course of Study Mathematics
Examples of Pathways The rows of the following table provide examples of pathways which students may experience across Grades 7-12 Note that students should be enrolled in a mathematics course every year of middle and high school
Grade 7 Grade 8 Grade 9 Grade 10 Grade 11 Grade 12
Grade 7 Mathematics Grade 8 Mathematics Geometry with Data
Analysis Algebra I with
Probability Algebra II with
Statistics Specialized course
Grade 7 Mathematics
OR Accelerated Grade 7
Mathematics
Grade 8 Mathematics
Geometry with Data Analysis
AND Algebra I with Probability
(concurrently)
Algebra II with Statistics
Precalculus AP Calculus
OR Additional specialized course
Mathematical Modeling
OR Applications of Finite Mathematics
Precalculus OR Other additional
specialized course
Accelerated Grade 7 Mathematics
Accelerated Grade 8 Mathematics
Geometry with Data Analysis
Algebra II with Statistics
Precalculus AP Calculus
OR Additional specialized course
Mathematical Modeling
OR Applications of Finite Mathematics
Precalculus OR Other additional
specialized course
Accelerated Grade 7 Mathematics
Grade 8 Mathematics OR Accelerated
Grade 8 Mathematics
Geometry with Data Analysis
Algebra I with Probability
Algebra II with Statistics Specialized course
See Appendix E for an exhaustive list of course pathways In addition see the figure in Appendix B which shows how each pathway connects with postsecondary options
Grades 9-12 Overview
109 2019 Alabama Course of Study Mathematics
Organization of Standards 1 A set of essential concepts is used to organize the standards in the required courses in the high school section of the course of study These essential
concepts build on those described by the National Council of Teachers of Mathematics (2018) in Catalyzing Change in High School Mathematics with some additional concepts reflecting that all Alabama students must take three courses rather than 25 These essential concepts include the concepts and skills that all students need to build the mathematical foundation required for the continued study of mathematics and for other future mathematical needs
2 Essential concepts are given for four content areas as shown in the table below Number and Quantity Algebra and Functions Data Analysis Statistics and Probability and Geometry and Measurement A table for applicable content areas appears in each course (The order of the content areas follows Catalyzing Change whereas K-8 follows the order given in the table below) A table for applicable content areas appears in each course Each content area (other than Number and Quantity) is further organized into several focus areas which appear as subheadings in the table Focus areas in Grades 9-12 are similar to clusters in K-8 groups of related essential concepts and standards within the specific content area Not every focus area appears in every course Finally the essential concepts are listed in the left column of each table alongside a list of content standards that support attainment of each The standards are collectively designed as the mathematical content of a shared pathway for all students
3 Content standards are written in the right column of each content area table and numbered as shown in the illustration below The content standards
support the attainment of the essential concepts listed on the left Standards define what students should understand (know) and be able to do at the conclusion of a course or grade Content standards in this document contain minimum required content Some have sub-standards indicated with a b c d which are extensions of the content standards and are also required Some standards include examples which are not required to be taught The order in which standards are listed within a course or grade is not intended to convey a sequence for instruction Each content standard completes the stem ldquoStudents willrdquo
Grades 9-12 Overview
110 2019 Alabama Course of Study Mathematics
4 Some related standards appear across multiple high school courses In many cases there is a bold-print statement to indicate the scope of the standard to align the content that is taught across the courses The full scope of every standard should be addressed during instruction
5 The specialized courses taken after Algebra II with Statistics are organized in ways related to their specific subject matter which extend beyond the essential concepts and directly support studentsrsquo professional and personal goals The standards indicating what students should know or be able to do are listed in the right columns of the content area tables Important concepts within these content areas are described in the left columns and focus areas within the tables are indicated
Alabama Content Area
Content Standard Number
Focus Area
Essential Concept
Content Standard
Grades 9-12 Overview
111 2019 Alabama Course of Study Mathematics
Essential Concepts All essential concepts used in the high school course of study are listed below The required courses in which the essential concepts appear are noted in the column on the right
Number and Quantity
Together irrational numbers and rational numbers complete the real number system representing all points on the number line while there exist numbers beyond the real numbers called complex numbers
Geometry with Data Analysis Algebra I with Probability Algebra II with Statistics
Quantitative reasoning includes and mathematical modeling requires attention to units of measurement Geometry with Data Analysis
Matrices are a useful way to represent information Algebra II with Statistics
Algebra and Functions
Focus 1 Algebra
Expressions can be rewritten in equivalent forms by using algebraic properties including properties of addition multiplication and exponentiation to make different characteristics or features visible
Algebra I with Probability Algebra II with Statistics
Finding solutions to an equation inequality or system of equations or inequalities requires the checking of candidate solutions whether generated analytically or graphically to ensure that solutions are found and that those found are not extraneous
Algebra I with Probability Algebra II with Statistics
The structure of an equation or inequality (including but not limited to one-variable linear and quadratic equations inequalities and systems of linear equations in two variables) can be purposefully analyzed (with and without technology) to determine an efficient strategy to find a solution if one exists and then to justify the solution
Geometry with Data Analysis Algebra I with Probability Algebra II with Statistics
Grades 9-12 Overview
112 2019 Alabama Course of Study Mathematics
Expressions equations and inequalities can be used to analyze and make predictions both within mathematics and as mathematics is applied in different contexts ndash in particular contexts that arise in relation to linear quadratic and exponential situations
Geometry with Data Analysis Algebra I with Probability Algebra II with Statistics
Focus 2 Connecting Algebra to Functions
Functions shift the emphasis from a point-by-point relationship between two variables (inputoutput) to considering an entire set of ordered pairs (where each first element is paired with exactly one second element) as an entity with its own features and characteristics
Algebra I with Probability
Graphs can be used to obtain exact or approximate solutions of equations inequalities and systems of equations and inequalities ndash including systems of linear equations in two variables and systems of linear and quadratic equations (given or obtained by using technology)
Geometry with Data Analysis Algebra I with Probability Algebra II with Statistics
Focus 3 Functions
Functions can be described by using a variety of representations mapping diagrams function notation (eg f(x) = x2) recursive definitions tables and graphs
Algebra I with Probability Algebra II with Statistics
Functions that are members of the same family have distinguishing attributes (structure) common to all functions within that family
Algebra I with Probability Algebra II with Statistics
Functions can be represented graphically and key features of the graphs including zeros intercepts and when relevant rate of change and maximumminimum values can be associated with and interpreted in terms of the equivalent symbolic representation
Algebra I with Probability Algebra II with Statistics
Functions model a wide variety of real situations and can help students understand the processes of making and changing assumptions assigning variables and finding solutions to contextual problems
Algebra I with Probability Algebra II with Statistics
Grades 9-12 Overview
113 2019 Alabama Course of Study Mathematics
Data Analysis Statistics and Probability
Focus 1 Quantitative Literacy
Mathematical and statistical reasoning about data can be used to evaluate conclusions and assess risks
Geometry with Data Analysis Algebra I with Probability Algebra II with Statistics
Making and defending informed data-based decisions is a characteristic of a quantitatively literate person
Algebra I with Probability Algebra II with Statistics
Focus 2 Visualizing and Summarizing Data
Data arise from a context and come in two types quantitative (continuous or discrete) and categorical Technology can be used to ldquocleanrdquo and organize data including very large data sets into a useful and manageable structure ndash a first step in any analysis of data
Geometry with Data Analysis Algebra I with Probability
Distributions of quantitative data (continuous or discrete) in one variable should be described in the context of the data with respect to what is typical (the shape with appropriate measures of center and variability including standard deviation) and what is not (outliers) and these characteristics can be used to compare two or more subgroups with respect to a variable
Geometry with Data Analysis Algebra II with Statistics
The association between two categorical variables is typically represented by using two-way tables and segmented bar graphs
Algebra I with Probability
Scatterplots including plots over time can reveal patterns trends clusters and gaps that are useful in analyzing the association between two contextual variables
Geometry with Data Analysis
Analyzing the association between two quantitative variables should involve statistical procedures such as examining (with technology) the sum of squared deviations in fitting a linear model analyzing residuals for patterns generating a least-squares regression line and finding a correlation coefficient and differentiating between correlation and causation
Geometry with Data Analysis
Data-analysis techniques can be used to develop models of contextual situations and to generate and evaluate possible solutions to real problems involving those contexts
Geometry with Data Analysis Algebra II with Statistics
Grades 9-12 Overview
114 2019 Alabama Course of Study Mathematics
Focus 3 Statistical Inference
Study designs are of three main types sample survey experiment and observational study
Algebra II with Statistics
The role of randomization is different in randomly selecting samples and in randomly assigning subjects to experimental treatment groups
Algebra II with Statistics
The scope and validity of statistical inferences are dependent on the role of randomization in the study design
Algebra II with Statistics
Bias such as sampling response or nonresponse bias may occur in surveys yielding results that are not representative of the population of interest
Algebra II with Statistics
The larger the sample size the less the expected variability in the sampling distribution of a sample statistic
Algebra II with Statistics
The sampling distribution of a sample statistic formed from repeated samples for a given sample size drawn from a population can be used to identify typical behavior for that statistic Examining several such sampling distributions leads to estimating a set of plausible values for the population parameter using the margin of error as a measure that describes the sampling variability
Algebra II with Statistics
Focus 4 Probability
Two events are independent if the occurrence of one event does not affect the probability of the other event Determining whether two events are independent can be used for finding and understanding probabilities
Algebra I with Probability
Conditional probabilities ndash that is those probabilities that are ldquoconditionedrdquo by some known information ndash can be computed from data organized in contingency tables Conditions or assumptions may affect the computation of a probability
Algebra I with Probability
Grades 9-12 Overview
115 2019 Alabama Course of Study Mathematics
Geometry and Measurement Focus 1 Measurement
Areas and volumes of figures can be computed by determining how the figure might be obtained from simpler figures by dissection and recombination
Geometry with Data Analysis
Constructing approximations of measurements with different tools including technology can support an understanding of measurement
Geometry with Data Analysis
When an object is the image of a known object under a similarity transformation a length area or volume on the image can be computed by using proportional relationships
Geometry with Data Analysis Algebra II with Statistics
Focus 2 Transformations
Applying geometric transformations to figures provides opportunities for describing the attributes of the figures preserved by the transformation and for describing symmetries by examining when a figure can be mapped onto itself
Geometry with Data Analysis
Showing that two figures are congruent involves showing that there is a rigid motion (translation rotation reflection or glide reflection) or equivalently a sequence of rigid motions that maps one figure to the other
Geometry with Data Analysis
Showing that two figures are similar involves finding a similarity transformation (dilation or composite of a dilation with a rigid motion) or equivalently a sequence of similarity transformations that maps one figure onto the other
Geometry with Data Analysis
Transformations in geometry serve as a connection with algebra both through the concept of functions and through the analysis of graphs of functions as geometric figures
This essential concept is not noted in any of the required courses However it is addressed within the Algebra and Functions Content Area
Grades 9-12 Overview
116 2019 Alabama Course of Study Mathematics
Focus 3 Geometric Arguments Reasoning and Proof
Proof is the means by which we demonstrate whether a statement is true or false mathematically and proofs can be communicated in a variety of ways (eg two-column paragraph)
Geometry with Data Analysis
Using technology to construct and explore figures with constraints provides an opportunity to explore the independence and dependence of assumptions and conjectures
Geometry with Data Analysis
Proofs of theorems can sometimes be made with transformations coordinates or algebra all approaches can be useful and in some cases one may provide a more accessible or understandable argument than another
Geometry with Data Analysis
Focus 4 Solving Applied Problems and Modeling in Geometry
Recognizing congruence similarity symmetry measurement opportunities and other geometric ideas including right triangle trigonometry in real-world contexts provides a means of building understanding of these concepts and is a powerful tool for solving problems related to the physical world in which we live
Geometry with Data Analysis Algebra II with Statistics
Experiencing the mathematical modeling cycle in problems involving geometric concepts from the simplification of the real problem through the solving of the simplified problem the interpretation of its solution and the checking of the solutionrsquos feasibility introduces geometric techniques tools and points of view that are valuable to problem solving
Geometry with Data Analysis
117 2019 Alabama Course of Study Mathematics
Geometry with Data Analysis Overview
Geometry with Data Analysis is a newly-designed course which builds on the studentsrsquo experiences in the middle grades It is the first of three required courses in high school mathematics providing a common Grade 9 experience for all students entering high-school-level mathematics If students need additional support while taking Geometry with Data Analysis schools are encouraged to offer a concurrent ldquolab courserdquo to meet their specific needs The lab course might review prior knowledge for upcoming lessons reinforce content from previous lessons or preview upcoming content to ensure that students can fully participate in the required class Since the lab course does not cover additional mathematical standards students can receive only an elective credit for each lab course not a mathematics credit See further details on the lab courses in the High School Overview Note that school systems will not offer Geometry with Data Analysis as ldquoArdquo and ldquoBrdquo courses in which the content is spread over two courses Geometry with Data Analysis builds essential concepts necessary for students to meet their postsecondary goals (whether they pursue additional study or enter the workforce) to function as effective citizens and to recognize the wonder joy and beauty of mathematics (NCTM 2018) It is important because it develops mathematical knowledge and skills through visual representations prior to the more abstract development of algebra Beginning high school mathematics with Geometry with Data Analysis in Grade 9 offers students the opportunity to build their reasoning and sense-making skills see the applicability of mathematics and prepare more effectively for further studies in algebra The course also focuses on data analysis which provides students with tools to describe show and summarize data in the world around them In Geometry with Data Analysis students incorporate knowledge and skills from several mathematics content areas leading to a deeper understanding of fundamental relationships within the discipline and building a solid foundation for further study In the content area of Geometry and Measurement students build on and deepen prior understanding of transformations congruence similarity and coordinate geometry concepts Informal explorations of transformations provide a foundation for more formal considerations of congruence and similarity including development of criteria for triangle congruence and similarity An emphasis on reasoning and proof throughout the content area promotes exploration conjecture testing and informal and formal justification Students extend their middle school work with conjecturing and creating informal arguments to more formal proofs in this course In the content area of Algebra and Functions students perform algebraic calculations with specific application to geometry that build on foundations of algebra from Grades 7 and 8 In the Data Analysis Statistics and Probability content area students build from earlier experiences in analyzing data and creating linear models to focus on univariate quantitative data on the real number line (shape center and variability) and bivariate quantitative data on a coordinate plane (creating linear models)
Geometry with Data Analysis
118 2019 Alabama Course of Study Mathematics
NOTE Although not all content areas in the grade level have been included in the overview all standards should be included in instruction A focus on mathematical modeling and real-world statistical problem-solving is included across the course see Appendix E for more information on the modeling cycles for mathematics and statistics It is essential for students to use technology and other mathematical tools to explore geometric shapes and their properties and to represent and analyze data The eight Student Mathematical Practices listed in the chart below represent what students are doing as they learn mathematics Students should regularly engage in these processes and proficiencies at every level throughout their mathematical studies Proficiency with these practices is critical in using mathematics both within the classroom and in life The Student Mathematical Practices are standards to be incorporated across all grades
Student Mathematical Practices
1 Make sense of problems and persevere in solving them 5 Use appropriate tools strategically 2 Reason abstractly and quantitatively 6 Attend to precision 3 Construct viable arguments and critique the reasoning of others 7 Look for and make use of structure 4 Model with mathematics 8 Look for and express regularity in repeated reasoning
The standards indicating what students should know or be able to do at the end of the course are listed in the right columns of the content standard tables The essential concepts are listed in the left columns In some cases focus areas are indicated Statements in bold print indicate the scope of the standard and align the standard to related content taught in other courses The full scope of every standard should be addressed during instruction
Geometry with Data Analysis Content Standards
Each content standard completes the stem ldquoStudents willhelliprdquo
Number and Quantity Together irrational numbers and rational numbers complete the real number system representing all points on the number line while there exist numbers beyond the real numbers called complex numbers
1 Extend understanding of irrational and rational numbers by rewriting expressions involving radicals including addition subtraction multiplication and division in order to recognize geometric patterns
Geometry with Data Analysis
119 2019 Alabama Course of Study Mathematics
Algebra and Functions Focus 1 Algebra The structure of an equation or inequality (including but not limited to one-variable linear and quadratic equations inequalities and systems of linear equations in two variables) can be purposefully analyzed (with and without technology) to determine an efficient strategy to find a solution if one exists and then to justify the solution
3 Find the coordinates of the vertices of a polygon determined by a set of lines given their equations by setting their function rules equal and solving or by using their graphs
Expressions equations and inequalities can be used to analyze and make predictions both within mathematics and as mathematics is applied in different contexts ndash in particular contexts that arise in relation to linear quadratic and exponential situations
4 Rearrange formulas to highlight a quantity of interest using the same reasoning as in solving equations Example Rearrange the formula for the area of a trapezoid to highlight one of the bases
Focus 2 Connecting Algebra to Functions Graphs can be used to obtain exact or approximate solutions of equations inequalities and systems of equations and inequalitiesmdashincluding systems of linear equations in two variables and systems of linear and quadratic equations (given or obtained by using technology)
5 Verify that the graph of a linear equation in two variables is the set of all its solutions plotted in the coordinate plane which forms a line
6 Derive the equation of a circle of given center and radius using the Pythagorean Theorem a Given the endpoints of the diameter of a circle use the midpoint formula to find its
center and then use the Pythagorean Theorem to find its equation b Derive the distance formula from the Pythagorean Theorem
Quantitative reasoning includes and mathematical modeling requires attention to units of measurement
2 Use units as a way to understand problems and to guide the solution of multi-step problems a Choose and interpret units consistently in formulas b Choose and interpret the scale and the origin in graphs and data displays c Define appropriate quantities for the purpose of descriptive modeling d Choose a level of accuracy appropriate to limitations of measurements when reporting
quantities
Geometry with Data Analysis
120 2019 Alabama Course of Study Mathematics
Data Analysis Statistics and Probability Focus 1 Quantitative Literacy Mathematical and statistical reasoning about data can be used to evaluate conclusions and assess risks
7 Use mathematical and statistical reasoning with quantitative data both univariate data (set of values) and bivariate data (set of pairs of values) that suggest a linear association in order to draw conclusions and assess risk Example Estimate the typical age at which a lung cancer patient is diagnosed and estimate how the typical age differs depending on the number of cigarettes smoked per day
Focus 2 Visualizing and Summarizing Data Data arise from a context and come in two types quantitative (continuous or discrete) and categorical Technology can be used to ldquocleanrdquo and organize data including very large data sets into a useful and manageable structure ndash a first step in any analysis of data
8 Use technology to organize data including very large data sets into a useful and manageable structure
Distributions of quantitative data (continuous or discrete) in one variable should be described in the context of the data with respect to what is typical (the shape with appropriate measures of center and variability including standard deviation) and what is not (outliers) and these characteristics can be used to compare two or more subgroups with respect to a variable
9 Represent the distribution of univariate quantitative data with plots on the real number line choosing a format (dot plot histogram or box plot) most appropriate to the data set and represent the distribution of bivariate quantitative data with a scatter plot Extend from simple cases by hand to more complex cases involving large data sets using technology
10 Use statistics appropriate to the shape of the data distribution to compare and contrast two or more data sets utilizing the mean and median for center and the interquartile range and standard deviation for variability a Explain how standard deviation develops from mean absolute deviation b Calculate the standard deviation for a data set using technology where appropriate
11 Interpret differences in shape center and spread in the context of data sets accounting for
possible effects of extreme data points (outliers) on mean and standard deviation
Geometry with Data Analysis
121 2019 Alabama Course of Study Mathematics
Scatter plots including plots over time can reveal patterns trends clusters and gaps that are useful in analyzing the association between two contextual variables
12 Represent data of two quantitative variables on a scatter plot and describe how the variables are related a Find a linear function for a scatter plot that suggests a linear association and
informally assess its fit by plotting and analyzing residuals including the squares of the residuals in order to improve its fit
b Use technology to find the least-squares line of best fit for two quantitative variables
Analyzing the association between two quantitative variables should involve statistical procedures such as examining (with technology) the sum of squared deviations in fitting a linear model analyzing residuals for patterns generating a least-squares regression line and finding a correlation coefficient and differentiating between correlation and causation
13 Compute (using technology) and interpret the correlation coefficient of a linear relationship
14 Distinguish between correlation and causation
Data analysis techniques can be used to develop models of contextual situations and to generate and evaluate possible solutions to real problems involving those contexts
15 Evaluate possible solutions to real-life problems by developing linear models of contextual situations and using them to predict unknown values a Use the linear model to solve problems in the context of the given data b Interpret the slope (rate of change) and the intercept (constant term) of a linear model in
the context of the given data
Geometry and Measurement Focus 1 Measurement Areas and volumes of figures can be computed by determining how the figure might be obtained from simpler figures by dissection and recombination
16 Identify the shapes of two-dimensional cross-sections of three-dimensional objects and identify three-dimensional objects generated by rotations of two-dimensional objects
Geometry with Data Analysis
122 2019 Alabama Course of Study Mathematics
17 Model and solve problems using surface area and volume of solids including composite solids and solids with portions removed a Give an informal argument for the formulas for the surface area and volume of a sphere
cylinder pyramid and cone using dissection arguments Cavalieris Principle and informal limit arguments
b Apply geometric concepts to find missing dimensions to solve surface area or volume problems
Constructing approximations of measurements with different tools including technology can support an understanding of measurement
18 Given the coordinates of the vertices of a polygon compute its perimeter and area using a variety of methods including the distance formula and dynamic geometry software and evaluate the accuracy of the results
When an object is the image of a known object under a similarity transformation a length area or volume on the image can be computed by using proportional relationships
19 Derive and apply the relationships between the lengths perimeters areas and volumes of similar figures in relation to their scale factor
20 Derive and apply the formula for the length of an arc and the formula for the area of a sector
Focus 2 Transformations Applying geometric transformations to figures provides opportunities for describing the attributes of the figures preserved by the transformation and for describing symmetries by examining when a figure can be mapped onto itself
21 Represent transformations and compositions of transformations in the plane (coordinate and otherwise) using tools such as tracing paper and geometry software a Describe transformations and compositions of transformations as functions that take
points in the plane as inputs and give other points as outputs using informal and formal notation
b Compare transformations which preserve distance and angle measure to those that do not
22 Explore rotations reflections and translations using graph paper tracing paper and geometry software a Given a geometric figure and a rotation reflection or translation draw the image of the
transformed figure using graph paper tracing paper or geometry software b Specify a sequence of rotations reflections or translations that will carry a given figure
onto another c Draw figures with different types of symmetries and describe their attributes
Geometry with Data Analysis
123 2019 Alabama Course of Study Mathematics
23 Develop definitions of rotation reflection and translation in terms of angles circles perpendicular lines parallel lines and line segments
Showing that two figures are congruent involves showing that there is a rigid motion (translation rotation reflection or glide reflection) or equivalently a sequence of rigid motions that maps one figure to the other
24 Define congruence of two figures in terms of rigid motions (a sequence of translations rotations and reflections) show that two figures are congruent by finding a sequence of rigid motions that maps one figure to the other Example ABC is congruent to XYZ since a reflection followed by a translation maps ABC onto XYZ
25 Verify criteria for showing triangles are congruent using a sequence of rigid motions that map
one triangle to another a Verify that two triangles are congruent if and only if corresponding pairs of sides and
corresponding pairs of angles are congruent b Verify that two triangles are congruent if (but not only if) the following groups of
corresponding parts are congruent angle-side-angle (ASA) side-angle-side (SAS) side-side-side (SSS) and angle-angle-side (AAS) Example Given two triangles with two pairs of congruent corresponding sides and a pair of congruent included angles show that there must be a sequence of rigid motions will map one onto the other
Geometry with Data Analysis
124 2019 Alabama Course of Study Mathematics
Showing that two figures are similar involves finding a similarity transformation (dilation or composite of a dilation with a rigid motion) or equivalently a sequence of similarity transformations that maps one figure onto the other
26 Verify experimentally the properties of dilations given by a center and a scale factor a Verify that a dilation takes a line not passing through the center of the dilation to a
parallel line and leaves a line passing through the center unchanged b Verify that the dilation of a line segment is longer or shorter in the ratio given by the
scale factor
27 Given two figures determine whether they are similar by identifying a similarity transformation (sequence of rigid motions and dilations) that maps one figure to the other
28 Verify criteria for showing triangles are similar using a similarity transformation (sequence of
rigid motions and dilations) that maps one triangle to another a Verify that two triangles are similar if and only if corresponding pairs of sides are
proportional and corresponding pairs of angles are congruent b Verify that two triangles are similar if (but not only if) two pairs of corresponding
angles are congruent (AA) the corresponding sides are proportional (SSS) or two pairs of corresponding sides are proportional and the pair of included angles is congruent (SAS) Example Given two triangles with two pairs of congruent corresponding sides and a pair of congruent included angles show there must be a set of rigid motions that maps one onto the other
Focus 3 Geometric Arguments Reasoning and Proof Using technology to construct and explore figures with constraints provides an opportunity to explore the independence and dependence of assumptions and conjectures
29 Find patterns and relationships in figures including lines triangles quadrilaterals and circles using technology and other tools a Construct figures using technology and other tools in order to make and test
conjectures about their properties b Identify different sets of properties necessary to define and construct figures
Proof is the means by which we demonstrate whether a statement is true or false mathematically and proofs can be communicated in a variety of ways (eg two-column paragraph)
30 Develop and use precise definitions of figures such as angle circle perpendicular lines parallel lines and line segment based on the undefined notions of point line distance along a line and distance around a circular arc
Geometry with Data Analysis
125 2019 Alabama Course of Study Mathematics
31 Justify whether conjectures are true or false in order to prove theorems and then apply those theorems in solving problems communicating proofs in a variety of ways including flow chart two-column and paragraph formats a Investigate prove and apply theorems about lines and angles including but not limited
to vertical angles are congruent when a transversal crosses parallel lines alternate interior angles are congruent and corresponding angles are congruent the points on the perpendicular bisector of a line segment are those equidistant from the segments endpoints
b Investigate prove and apply theorems about triangles including but not limited to the sum of the measures of the interior angles of a triangle is 180˚ the base angles of isosceles triangles are congruent the segment joining the midpoints of two sides of a triangle is parallel to the third side and half the length a line parallel to one side of a triangle divides the other two proportionally and conversely the Pythagorean Theorem using triangle similarity
c Investigate prove and apply theorems about parallelograms and other quadrilaterals including but not limited to both necessary and sufficient conditions for parallelograms and other quadrilaterals as well as relationships among kinds of quadrilaterals Example Prove that rectangles are parallelograms with congruent diagonals
Proofs of theorems can sometimes be made with transformations coordinates or algebra all approaches can be useful and in some cases one may provide a more accessible or understandable argument than another
32 Use coordinates to prove simple geometric theorems algebraically
33 Prove the slope criteria for parallel and perpendicular lines and use them to solve geometric problems Example Find the equation of a line parallel or perpendicular to a given line that passes through a given point
Geometry with Data Analysis
126 2019 Alabama Course of Study Mathematics
Focus 4 Solving Applied Problems and Modeling in Geometry Recognizing congruence similarity symmetry measurement opportunities and other geometric ideas including right triangle trigonometry in real-world contexts provides a means of building understanding of these concepts and is a powerful tool for solving problems related to the physical world in which we live
34 Use congruence and similarity criteria for triangles to solve problems in real-world contexts
35 Discover and apply relationships in similar right triangles a Derive and apply the constant ratios of the sides in special right triangles (45˚-45˚-90˚
and 30˚-60˚-90˚) b Use similarity to explore and define basic trigonometric ratios including sine ratio
cosine ratio and tangent ratio c Explain and use the relationship between the sine and cosine of complementary angles d Demonstrate the converse of the Pythagorean Theorem e Use trigonometric ratios and the Pythagorean Theorem to solve right triangles in applied
problems including finding areas of regular polygons
36 Use geometric shapes their measures and their properties to model objects and use those models to solve problems
37 Investigate and apply relationships among inscribed angles radii and chords including but not limited to the relationship between central inscribed and circumscribed angles inscribed angles on a diameter are right angles the radius of a circle is perpendicular to the tangent where the radius intersects the circle
Experiencing the mathematical modeling cycle in problems involving geometric concepts from the simplification of the real problem through the solving of the simplified problem the interpretation of its solution and the checking of the solutionrsquos feasibility introduces geometric techniques tools and points of view that are valuable to problem-solving
38 Use the mathematical modeling cycle involving geometric methods to solve design problems Examples Design an object or structure to satisfy physical constraints or minimize cost work with typographic grid systems based on ratios apply concepts of density based on area and volume
127 2019 Alabama Course of Study Mathematics
Algebra I with Probability Overview
Algebra I with Probability is a newly-designed course which builds upon algebraic concepts studied in the middle grades It provides students with the necessary knowledge of algebra and probability for use in everyday life and in the subsequent study of mathematics This is one of three courses required for all students Students can obtain the essential content from this course either by taking the course after completing Geometry with Data Analysis in Grade 9 or by completing the middle school accelerated pathway Alternatively students who did not take the accelerated pathway in middle school may choose to accelerate in high school by taking Algebra I with Probability in Grade 9 along with Geometry with Data Analysis If students need additional support while taking Algebra I with Probability schools are encouraged to offer a concurrent ldquolab courserdquo to meet their specific needs The lab course might review prior knowledge needed for upcoming lessons reinforce content from previous lessons or preview upcoming content to ensure that students can fully participate in the required class Since the lab course does not cover additional mathematical standards students can receive only an elective credit for each lab course not a mathematics credit See further details on the lab courses in the High School Overview School systems will not offer Algebra I with Probability as ldquoArdquo and ldquoBrdquo courses in which the content is spread over two courses Algebra I with Probability builds essential concepts necessary for students to meet their postsecondary goals (whether they pursue additional study or enter the workforce) to function as effective citizens and to recognize the wonder joy and beauty of mathematics (NCTM 2018) Algebra is important and useful in most careers It is one of the most common and malleable types of mathematics because it is valuable in a range of activities from ordinary decision-making to advanced training in scientific and technological fields The ability to understand and apply algebraic thinking is a crucial stepping stone on a successful journey in life Algebra is a collection of unifying concepts that enable one to solve problems flexibly The study of algebra is inextricably linked to the study of functions which are fundamental objects in mathematics that model many life situations involving change This course provides experiences for students to see how mathematics can be used systematically to represent patterns and relationships among numbers and other objects analyze change and model everyday events and problems of life and society Algebra I with Probability emphasizes functions including linear (as introduced in Grades 7 and 8) absolute value quadratic and exponential and functions as explicit (relation between input and output) and recursive (relation between successive values) Properties of algebra are applied to convert between forms of expressions and to solve equations (factoring completing the square rules of powers and radicals) Graphing is an important component of study in Algebra I with Probability Graphs of equations and inequalities consist of all points (discrete or continuous) whose ordered pairs satisfy the relationship within the domain and range Students find points of intersection between two graphed functions that correspond to the solutions of the equations of the two functions and transform graphs of functions (through translation reflection rotation and dilation) by performing operations on the input or output
Algebra I with Probability
128 2019 Alabama Course of Study Mathematics
Probability is important because it educates one in the logic of uncertainty and randomness which occur in almost every aspect of daily life Therefore studying probability structures will enhance studentsrsquo ability to organize information and improve decision-making The study of probability undergirds the understanding of ratio and proportion in algebra and encourages inferential reasoning about the likelihood of real-life events Categorical data are represented as marginal and conditional distributions Parallels are drawn between conditions and events in probability and inputs and outputs of functions A focus on mathematical modeling and real-world statistical problem-solving is included across the course see Appendix E for more information on the modeling cycles for mathematics and statistics It is essential for students to use technology and other mathematical tools such as graphing calculators online graphing software and spreadsheets to explore functions equations and probability The eight Student Mathematical Practices listed in the chart below represent what students are doing as they learn mathematics Students should regularly engage in these processes and proficiencies at every level throughout their mathematical studies Proficiency with these practices is critical in using mathematics both in the classroom and in everyday life The Student Mathematical Practices are standards to be incorporated across all grades
Student Mathematical Practices
1 Make sense of problems and persevere in solving them 5 Use appropriate tools strategically 2 Reason abstractly and quantitatively 6 Attend to precision 3 Construct viable arguments and critique the reasoning of others 7 Look for and make use of structure 4 Model with mathematics 8 Look for and express regularity in repeated reasoning
The standards indicating what students should know or be able to do are listed in the right columns of the content area tables The essential concepts are described in the left columns of the content area tables In some cases focus areas are indicated within the tables Only those focus areas which are appropriate for this course are included Statements in bold print indicate the scope of the standard and align the standard to related content in other courses The full scope of every standard should be addressed during instruction
Algebra I with Probability
129 2019 Alabama Course of Study Mathematics
Algebra I with Probability Content Standards
Each content standard completes the stem ldquoStudents willhelliprdquo Number and Quantity Together irrational numbers and rational numbers complete the real number system representing all points on the number line while there exist numbers beyond the real numbers called complex numbers
1 Explain how the meaning of rational exponents follows from extending the properties of integer exponents to those values allowing for an additional notation for radicals using rational exponents
2 Rewrite expressions involving radicals and rational exponents using the properties of exponents
3 Define the imaginary number i such that i 2 = -1
Algebra and Functions Focus 1 Algebra Expressions can be rewritten in equivalent forms by using algebraic properties including properties of addition multiplication and exponentiation to make different characteristics or features visible
4 Interpret linear quadratic and exponential expressions in terms of a context by viewing one or more of their parts as a single entity Example Interpret the accrued amount of investment P(1 + r)t where P is the principal and r is the interest rate as the product of P and a factor depending on time t
5 Use the structure of an expression to identify ways to rewrite it Example See x4 - y4 as (x2)2 - (y2)2 thus recognizing it as a difference of squares that can be factored as (x2 - y2)(x2 + y2)
Algebra I with Probability
130 2019 Alabama Course of Study Mathematics
6 Choose and produce an equivalent form of an expression to reveal and explain properties of the quantity represented by the expression a Factor quadratic expressions with leading coefficients of one and use the factored form
to reveal the zeros of the function it defines b Use the vertex form of a quadratic expression to reveal the maximum or minimum value
and the axis of symmetry of the function it defines complete the square to find the vertex form of quadratics with a leading coefficient of one
c Use the properties of exponents to transform expressions for exponential functions Example Identify percent rate of change in functions such as y = (102)t y = (097)t y = (101)12t y = (12)t10 and classify them as representing exponential growth or decay
7 Add subtract and multiply polynomials showing that polynomials form a system analogous to the integers namely they are closed under the operations of addition subtraction and multiplication
Finding solutions to an equation inequality or system of equations or inequalities requires the checking of candidate solutions whether generated analytically or graphically to ensure that solutions are found and that those found are not extraneous
8 Explain why extraneous solutions to an equation involving absolute values may arise and how to check to be sure that a candidate solution satisfies an equation
The structure of an equation or inequality (including but not limited to one-variable linear and quadratic equations inequalities and systems of linear equations in two variables) can be purposefully analyzed (with and without technology) to determine an efficient strategy to find a solution if one exists and then to justify the solution
9 Select an appropriate method to solve a quadratic equation in one variable a Use the method of completing the square to transform any quadratic equation in x into an
equation of the form (x ndash p)2 = q that has the same solutions Explain how the quadratic formula is derived from this form
b Solve quadratic equations by inspection (such as x2 = 49) taking square roots completing the square the quadratic formula and factoring as appropriate to the initial form of the equation and recognize that some solutions may not be real
Algebra I with Probability
131 2019 Alabama Course of Study Mathematics
10 Select an appropriate method to solve a system of two linear equations in two variables a Solve a system of two equations in two variables by using linear combinations contrast
situations in which use of linear combinations is more efficient with those in which substitution is more efficient
b Contrast solutions to a system of two linear equations in two variables produced by algebraic methods with graphical and tabular methods
Expressions equations and inequalities can be used to analyze and make predictions both within mathematics and as mathematics is applied in different contexts ndash in particular contexts that arise in relation to linear quadratic and exponential situations
11 Create equations and inequalities in one variable and use them to solve problems in context either exactly or approximately Extend from contexts arising from linear functions to those involving quadratic exponential and absolute value functions
12 Create equations in two or more variables to represent relationships between quantities in context graph equations on coordinate axes with labels and scales and use them to make predictions Limit to contexts arising from linear quadratic exponential absolute value and linear piecewise functions
13 Represent constraints by equations andor inequalities and solve systems of equations andor
inequalities interpreting solutions as viable or nonviable options in a modeling context Limit to contexts arising from linear quadratic exponential absolute value and linear piecewise functions
Focus 2 Connecting Algebra to Functions Functions shift the emphasis from a point-by-point relationship between two variables (inputoutput) to considering an entire set of ordered pairs (where each first element is paired with exactly one second element) as an entity with its own features and characteristics
14 Given a relation defined by an equation in two variables identify the graph of the relation as the set of all its solutions plotted in the coordinate plane Note The graph of a relation often forms a curve (which could be a line)
Algebra I with Probability
132 2019 Alabama Course of Study Mathematics
15 Define a function as a mapping from one set (called the domain) to another set (called the range) that assigns to each element of the domain exactly one element of the range a Use function notation evaluate functions for inputs in their domains and interpret
statements that use function notation in terms of a context Note If f is a function and x is an element of its domain then f(x) denotes the output of f corresponding to the input x
b Relate the domain of a function to its graph and where applicable to the quantitative relationship it describes Limit to linear quadratic exponential and absolute value functions
16 Compare and contrast relations and functions represented by equations graphs or tables that show related values determine whether a relation is a function Explain that a function f is a special kind of relation defined by the equation y = f(x)
17 Combine different types of standard functions to write evaluate and interpret functions in context Limit to linear quadratic exponential and absolute value functions a Use arithmetic operations to combine different types of standard functions to write and
evaluate functions Example Given two functions one representing flow rate of water and the other representing evaporation of that water combine the two functions to determine the amount of water in a container at a given time
b Use function composition to combine different types of standard functions to write and evaluate functions Example Given the following relationships determine what the expression S(T(t)) represents
Function Input Output
G Amount of studying s Grade in course G(s)
S Grade in course g Amount of screen time S(g)
T Amount of screen time t Number of followers T(t)
Algebra I with Probability
133 2019 Alabama Course of Study Mathematics
Graphs can be used to obtain exact or approximate solutions of equations inequalities and systems of equations and inequalities ndash including systems of linear equations in two variables and systems of linear and quadratic equations (given or obtained by using technology)
18 Solve systems consisting of linear andor quadratic equations in two variables graphically using technology where appropriate
19 Explain why the x-coordinates of the points where the graphs of the equations y = f(x) and y = g(x) intersect are the solutions of the equation f(x) = g(x) a Find the approximate solutions of an equation graphically using tables of values or
finding successive approximations using technology where appropriate Note Include cases where f(x) is a linear quadratic exponential or absolute value function and g(x) is constant or linear
20 Graph the solutions to a linear inequality in two variables as a half-plane (excluding the
boundary in the case of a strict inequality) and graph the solution set to a system of linear inequalities in two variables as the intersection of the corresponding half-planes using technology where appropriate
Focus 3 Functions Functions can be described by using a variety of representations mapping diagrams function notation (eg f(x) = x2) recursive definitions tables and graphs
21 Compare properties of two functions each represented in a different way (algebraically graphically numerically in tables or by verbal descriptions) Extend from linear to quadratic exponential absolute value and general piecewise
22 Define sequences as functions including recursive definitions whose domain is a subset of the integers a Write explicit and recursive formulas for arithmetic and geometric sequences and
connect them to linear and exponential functions Example A sequence with constant growth will be a linear function while a sequence with proportional growth will be an exponential function
Functions that are members of the same family have distinguishing attributes (structure) common to all functions within that family
23 Identify the effect on the graph of replacing 119891119891(119909119909) by 119891119891(119909119909) + 119896119896119896119896 middot 119891119891(119909119909) 119891119891(119896119896 middot 119909119909) and 119891119891(119909119909 + 119896119896) for specific values of k (both positive and negative) find the value of k given the graphs Experiment with cases and explain the effects on the graph using technology as appropriate Limit to linear quadratic exponential absolute value and linear piecewise functions
Algebra I with Probability
134 2019 Alabama Course of Study Mathematics
24 Distinguish between situations that can be modeled with linear functions and those that can be modeled with exponential functions a Show that linear functions grow by equal differences over equal intervals while
exponential functions grow by equal factors over equal intervals b Define linear functions to represent situations in which one quantity changes at a
constant rate per unit interval relative to another c Define exponential functions to represent situations in which a quantity grows or decays
by a constant percent rate per unit interval relative to another
25 Construct linear and exponential functions including arithmetic and geometric sequences given a graph a description of a relationship or two input-output pairs (include reading these from a table)
26 Use graphs and tables to show that a quantity increasing exponentially eventually exceeds a quantity increasing linearly or quadratically
27 Interpret the parameters of functions in terms of a context Extend from linear functions written in the form mx + b to exponential functions written in the form abx Example If the function V(t) = 19885(075)t describes the value of a car after it has been owned for t years 19885 represents the purchase price of the car when t = 0 and 075 represents the annual rate at which its value decreases
Functions can be represented graphically and key features of the graphs including zeros intercepts and when relevant rate of change and maximumminimum values can be associated with and interpreted in terms of the equivalent symbolic representation
28 For a function that models a relationship between two quantities interpret key features of graphs and tables in terms of the quantities and sketch graphs showing key features given a verbal description of the relationship Note Key features include intercepts intervals where the function is increasing decreasing positive or negative maximums and minimums symmetries and end behavior Extend from relationships that can be represented by linear functions to quadratic exponential absolute value and linear piecewise functions
29 Calculate and interpret the average rate of change of a function (presented symbolically or as a table) over a specified interval Estimate the rate of change from a graph Limit to linear quadratic exponential and absolute value functions
Algebra I with Probability
135 2019 Alabama Course of Study Mathematics
30 Graph functions expressed symbolically and show key features of the graph by hand in simple cases and using technology for more complicated cases a Graph linear and quadratic functions and show intercepts maxima and minima b Graph piecewise-defined functions including step functions and absolute value
functions c Graph exponential functions showing intercepts and end behavior
Functions model a wide variety of real situations and can help students understand the processes of making and changing assumptions assigning variables and finding solutions to contextual problems
31 Use the mathematical modeling cycle to solve real-world problems involving linear quadratic exponential absolute value and linear piecewise functions
Data Analysis Statistics and Probability Focus 1 Quantitative Literacy Mathematical and statistical reasoning about data can be used to evaluate conclusions and assess risks
32 Use mathematical and statistical reasoning with bivariate categorical data in order to draw conclusions and assess risk Example In a clinical trial comparing the effectiveness of flu shots A and B 21 subjects in treatment group A avoided getting the flu while 29 contracted it In group B 12 avoided the flu while 13 contracted it Discuss which flu shot appears to be more effective in reducing the chances of contracting the flu Possible answer Even though more people in group A avoided the flu than in group B the proportion of people avoiding the flu in group B is greater than the proportion in group A which suggests that treatment B may be more effective in lowering the risk of getting the flu
Contracted Flu Did Not Contract Flu
Flu Shot A 29 21
Flu Shot B 13 12
Total 42 33
Algebra I with Probability
136 2019 Alabama Course of Study Mathematics
Making and defending informed data-based decisions is a characteristic of a quantitatively literate person
33 Design and carry out an investigation to determine whether there appears to be an association between two categorical variables and write a persuasive argument based on the results of the investigation Example Investigate whether there appears to be an association between successfully completing a task in a given length of time and listening to music while attempting the task Randomly assign some students to listen to music while attempting to complete the task and others to complete the task without listening to music Discuss whether students should listen to music while studying based on that analysis
Focus 2 Visualizing and Summarizing Data Data arise from a context and come in two types quantitative (continuous or discrete) and categorical Technology can be used to ldquocleanrdquo and organize data including very large data sets into a useful and manageable structuremdasha first step in any analysis of data
34 Distinguish between quantitative and categorical data and between the techniques that may be used for analyzing data of these two types Example The color of cars is categorical and so is summarized by frequency and proportion for each color category while the mileage on each carrsquos odometer is quantitative and can be summarized by the mean
The association between two categorical variables is typically represented by using two-way tables and segmented bar graphs
35 Analyze the possible association between two categorical variables a Summarize categorical data for two categories in two-way frequency tables and represent
using segmented bar graphs b Interpret relative frequencies in the context of categorical data (including joint marginal
and conditional relative frequencies) c Identify possible associations and trends in categorical data
Algebra I with Probability
137 2019 Alabama Course of Study Mathematics
Data analysis techniques can be used to develop models of contextual situations and to generate and evaluate possible solutions to real problems involving those contexts
36 Generate a two-way categorical table in order to find and evaluate solutions to real-world problems a Aggregate data from several groups to find an overall association between two categorical
variables b Recognize and explore situations where the association between two categorical variables
is reversed when a third variable is considered (Simpsons Paradox) Example In a certain city Hospital 1 has a higher fatality rate than Hospital 2 But when considering mildly-injured patients and severely-injured patients as separate groups Hospital 1 has a lower fatality rate among both groups than Hospital 2 since Hospital 1 is a Level 1 Trauma Center Thus Hospital 1 receives most of the severely injured patients who are less likely to survive overall but have a better chance of surviving in Hospital 1 than they would in Hospital 2
Focus 3 Statistical Inference (Note There are no Algebra I with Probability standards in Focus 3)
Focus 4 Probability Two events are independent if the occurrence of one event does not affect the probability of the other event Determining whether two events are independent can be used for finding and understanding probabilities
37 Describe events as subsets of a sample space (the set of outcomes) using characteristics (or categories) of the outcomes or as unions intersections or complements of other events (or and not)
38 Explain whether two events A and B are independent using two-way tables or tree diagrams
Conditional probabilities ndash that is those probabilities that are ldquoconditionedrdquo by some known information ndash can be computed from data organized in contingency tables Conditions or assumptions may affect the computation of a probability
39 Compute the conditional probability of event A given event B using two-way tables or tree diagrams
40 Recognize and describe the concepts of conditional probability and independence in everyday situations and explain them using everyday language Example Contrast the chance of having lung cancer if you are a smoker with the chance of being a smoker if you have lung cancer
41 Explain why the conditional probability of A given B is the fraction of Bs outcomes that also belong to A and interpret the answer in context Example the probability of drawing a king from a deck of cards given that it is a face card is 4521252
which is 13
138 2019 Alabama Course of Study Mathematics
Algebra II with Statistics Overview
Algebra II with Statistics is a newly-designed course which builds on the studentsrsquo experiences in previous mathematics coursework It is the third of three required courses and it is to be taken following the successful completion of Geometry with Data Analysis and either Algebra I with Probability or the middle school accelerated sequence It is the culmination of the three years of required mathematics content and sets the stage for continued study of topics specific to the studentrsquos interests and plans beyond high school
If students need additional support while taking Algebra II with Statistics schools are encouraged to offer a concurrent ldquolab courserdquo to meet their specific needs The lab course might review prior knowledge needed for upcoming lessons reinforce content from previous lessons or preview upcoming content to ensure students can fully participate and succeed in the course Since the lab course does not cover additional mathematical standards students can receive only an elective credit for each lab course not a mathematics credit See further details on the lab courses in the High School Overview Algebra II with Statistics builds essential concepts necessary for students to meet their postsecondary goals (whether they pursue additional study or enter the workforce) function as effective citizens and recognize the wonder joy and beauty of mathematics (NCTM 2018) In particular it builds foundational knowledge of algebra and functions needed for students to take the specialized courses which follow it This course also focuses on inferential statistics which allows students to draw conclusions about populations and cause-and-effect based on random samples and controlled experiments In Algebra II with Statistics students incorporate knowledge and skills from several mathematics content areas leading to a deeper understanding of fundamental relationships within the discipline and building a solid foundation for further study In the content area of Algebra and Functions students explore an expanded range of functions including polynomial trigonometric (specifically sine and cosine) logarithmic reciprocal radical and general piecewise functions Students also solve equations associated with these classes of functions In the content area of Data Analysis Statistics and Probability students learn how to make inferences about a population from a random sample drawn from the population and how to analyze cause-and-effect by conducting randomized experiments Students are introduced to the study of matrices in the Number and Quantity content area A focus on mathematical modeling and real-world statistical problem-solving is included across the course see Appendix E for more information on the modeling cycles for mathematics and statistics It is essential for students to use technology and other mathematical tools such as graphing calculators online graphing software and spreadsheets to explore functions equations and analyze data
Algebra II with Statistics
139 2019 Alabama Course of Study Mathematics
The eight Student Mathematical Practices listed in the chart below represent what students are doing as they learn mathematics Students should regularly engage in these processes and proficiencies at every level throughout their mathematical studies Proficiency with these practices is critical in using mathematics both within the classroom and in life The Student Mathematical Practices are standards to be incorporated across all grades
Student Mathematical Practices
1 Make sense of problems and persevere in solving them 5 Use appropriate tools strategically 2 Reason abstractly and quantitatively 6 Attend to precision 3 Construct viable arguments and critique the reasoning of others 7 Look for and make use of structure 4 Model with mathematics 8 Look for and express regularity in repeated reasoning
The standards indicating what students should know or be able to do by the end of the course are listed in the right columns of the content area tables The essential concepts are described in the left columns of the content area tables In some cases focus areas are indicated within the tables Only those focus areas which are appropriate for this course are included
Statements in bold print indicate the scope of the standard and align the standard to related content in other courses The full scope of every standard should be addressed during instruction
Algebra II with Statistics
140 2019 Alabama Course of Study Mathematics
Algebra II with Statistics Content Standards
Each content standard completes the stem ldquoStudents willhelliprdquo
Number and Quantity
Together irrational numbers and rational numbers complete the real number system representing all points on the number line while there exist numbers beyond the real numbers called complex numbers
1 Identify numbers written in the form a + bi where a and b are real numbers and i2 = ndash1 as complex numbers
a Add subtract and multiply complex numbers using the commutative associative and distributive properties
Matrices are a useful way to represent information
2 Use matrices to represent and manipulate data
3 Multiply matrices by scalars to produce new matrices 4 Add subtract and multiply matrices of appropriate dimensions
5 Describe the roles that zero and identity matrices play in matrix addition and multiplication
recognizing that they are similar to the roles of 0 and 1 in the real numbers a Find the additive and multiplicative inverses of square matrices using technology as
appropriate b Explain the role of the determinant in determining if a square matrix has a multiplicative
inverse
Algebra II with Statistics
141 2019 Alabama Course of Study Mathematics
Algebra and Functions
Focus 1 Algebra Expressions can be rewritten in equivalent forms by using algebraic properties including properties of addition multiplication and exponentiation to make different characteristics or features visible
6 Factor polynomials using common factoring techniques and use the factored form of a polynomial to reveal the zeros of the function it defines
7 Prove polynomial identities and use them to describe numerical relationships Example The polynomial identity 1 ndash xn = (1 ndash x)(1 + x + x 2 + x3 + hellip + xn-1 + xn) can be used to find the sum of the first n terms of a geometric sequence with common ratio x by dividing both sides of the identity by (1 - x)
Finding solutions to an equation inequality or system of equations or inequalities requires the checking of candidate solutions whether generated analytically or graphically to ensure that solutions are found and that those found are not extraneous
8 Explain why extraneous solutions to an equation may arise and how to check to be sure that a candidate solution satisfies an equation Extend to radical equations
The structure of an equation or inequality (including but not limited to one-variable linear and quadratic equations inequalities and systems of linear equations in two variables) can be purposefully analyzed (with and without technology) to determine an efficient strategy to find a solution if one exists and then to justify the solution
9 For exponential models express as a logarithm the solution to abct = d where a c and d are real numbers and the base b is 2 or 10 evaluate the logarithm using technology to solve an exponential equation
Expressions equations and inequalities can be used to analyze and make predictions both within mathematics and as mathematics is applied in different contextsmdashin particular contexts that arise in relation to linear quadratic and exponential situations
10 Create equations and inequalities in one variable and use them to solve problems Extend to equations arising from polynomial trigonometric (sine and cosine) logarithmic radical and general piecewise functions
11 Solve quadratic equations with real coefficients that have complex solutions
12 Solve simple equations involving exponential radical logarithmic and trigonometric functions using inverse functions
Algebra II with Statistics
142 2019 Alabama Course of Study Mathematics
13 Create equations in two or more variables to represent relationships between quantities graph equations on coordinate axes with labels and scales and use them to make predictions Extend to polynomial trigonometric (sine and cosine) logarithmic reciprocal radical and general piecewise functions
Focus 2 Connecting Algebra to Functions Graphs can be used to obtain exact or approximate solutions of equations inequalities and systems of equations and inequalitiesmdashincluding systems of linear equations in two variables and systems of linear and quadratic equations (given or obtained by using technology)
14 Explain why the x-coordinates of the points where the graphs of the equations y = f(x) and y = g(x) intersect are the solutions of the equation f(x) = g(x) a Find the approximate solutions of an equation graphically using tables of values or
finding successive approximations using technology where appropriate Extend to cases where f(x) andor g(x) are polynomial trigonometric (sine and cosine) logarithmic radical and general piecewise functions
Focus 3 Functions Functions can be described by using a variety of representations mapping diagrams function notation (eg f(x) = x2) recursive definitions tables and graphs
15 Compare properties of two functions each represented in a different way (algebraically graphically numerically in tables or by verbal descriptions) Extend to polynomial trigonometric (sine and cosine) logarithmic radical and general piecewise functions
Functions that are members of the same family have distinguishing attributes (structure) common to all functions within that family
16 Identify the effect on the graph of replacing 119891119891(119909119909) by 119891119891(119909119909) + 119896119896119896119896 middot 119891119891(119909119909) 119891119891(119896119896 middot 119909119909) and 119891119891(119909119909 + 119896119896) for specific values of k (both positive and negative) find the value of k given the graphs Experiment with cases and illustrate an explanation of the effects on the graph using technology Extend to polynomial trigonometric (sine and cosine) logarithmic reciprocal radical and general piecewise functions
Algebra II with Statistics
143 2019 Alabama Course of Study Mathematics
Functions can be represented graphically and key features of the graphs including zeros intercepts and when relevant rate of change and maximumminimum values can be associated with and interpreted in terms of the equivalent symbolic representation
17 For a function that models a relationship between two quantities interpret key features of graphs and tables in terms of the quantities and sketch graphs showing key features given a verbal description of the relationship Note Key features include intercepts intervals where the function is increasing decreasing positive or negative maximums and minimums symmetries (including even and odd) end behavior and periodicity Extend to polynomial trigonometric (sine and cosine) logarithmic reciprocal radical and general piecewise functions
18 Relate the domain of a function to its graph and where applicable to the quantitative relationship it describes Extend to polynomial trigonometric (sine and cosine) logarithmic reciprocal radical and general piecewise functions
19 Calculate and interpret the average rate of change of a function (presented symbolically or as a table) over a specified interval Estimate the rate of change from a graph Extend to polynomial trigonometric (sine and cosine) logarithmic reciprocal radical and general piecewise functions
20 Graph functions expressed symbolically and show key features of the graph by hand in simple cases and using technology for more complicated cases Extend to polynomial trigonometric (sine and cosine) logarithmic reciprocal radical and general piecewise functions a Graph polynomial functions expressed symbolically identifying zeros when suitable
factorizations are available and showing end behavior b Graph sine and cosine functions expressed symbolically showing period midline and
amplitude c Graph logarithmic functions expressed symbolically showing intercepts and end
behavior d Graph reciprocal functions expressed symbolically identifying horizontal and vertical
asymptotes e Graph square root and cube root functions expressed symbolically f Compare the graphs of inverse functions and the relationships between their key
features including but not limited to quadratic square root exponential and logarithmic functions
Algebra II with Statistics
144 2019 Alabama Course of Study Mathematics
21 Explain how the unit circle in the coordinate plane enables the extension of trigonometric functions to all real numbers interpreted as radian measures of angles traversed counterclockwise around the unit circle building on work with non-right triangle trigonometry
Functions model a wide variety of real situations and can help students understand the processes of making and changing assumptions assigning variables and finding solutions to contextual problems
22 Use the mathematical modeling cycle to solve real-world problems involving polynomial trigonometric (sine and cosine) logarithmic radical and general piecewise functions from the simplification of the problem through the solving of the simplified problem the interpretation of its solution and the checking of the solutionrsquos feasibility
Data Analysis Statistics and Probability
Focus 1 Quantitative Literacy
Mathematical and statistical reasoning about data can be used to evaluate conclusions and assess risks
23 Use mathematical and statistical reasoning about normal distributions to draw conclusions and assess risk limit to informal arguments Example If candidate A is leading candidate B by 2 in a poll which has a margin of error of less than 3 should we be surprised if candidate B wins the election
Making and defending informed data-based decisions is a characteristic of a quantitatively literate person
24 Design and carry out an experiment or survey to answer a question of interest and write an informal persuasive argument based on the results Example Use the statistical problem-solving cycle to answer the question ldquoIs there an association between playing a musical instrument and doing well in mathematicsrdquo
Algebra II with Statistics
145 2019 Alabama Course of Study Mathematics
Focus 2 Visualizing and Summarizing Data Distributions of quantitative data (continuous or discrete) in one variable should be described in the context of the data with respect to what is typical (the shape with appropriate measures of center and variability including standard deviation) and what is not (outliers) and these characteristics can be used to compare two or more subgroups with respect to a variable
25 From a normal distribution use technology to find the mean and standard deviation and estimate population percentages by applying the empirical rule a Use technology to determine if a given set of data is normal by applying the empirical
rule b Estimate areas under a normal curve to solve problems in context using calculators
spreadsheets and tables as appropriate
Focus 3 Statistical Inference Study designs are of three main types sample survey experiment and observational study
26 Describe the purposes of and differences among sample surveys experiments and observational studies explain how randomization relates to each Examples random assignment in experiments random selection in surveys and observational studies
The role of randomization is different in randomly selecting samples and in randomly assigning subjects to experimental treatment groups
27 Distinguish between a statistic and a parameter and use statistical processes to make inferences about population parameters based on statistics from random samples from that population
28 Describe differences between randomly selecting samples and randomly assigning subjects to experimental treatment groups in terms of inferences drawn regarding a population versus regarding cause and effect Example Data from a group of plants randomly selected from a field allows inference regarding the rest of the plants in the field while randomly assigning each plant to one of two treatments allows inference regarding differences in the effects of the two treatments If the plants were both randomly selected and randomly assigned we can infer that the difference in effects of the two treatments would also be observed when applied to the rest of the plants in the field
Algebra II with Statistics
146 2019 Alabama Course of Study Mathematics
The scope and validity of statistical inferences are dependent on the role of randomization in the study design
29 Explain the consequences due to uncontrolled variables of non-randomized assignment of subjects to groups in experiments Example Students are studying whether or not listening to music while completing mathematics homework improves their quiz scores Rather than assigning students to either listen to music or not at random they simply observe what the students do on their own and find that the music-listening group has a higher mean quiz score Can they conclude that listening to music while studying is likely to raise the quiz scores of students who do not already listen to music What other factors may have been responsible for the observed difference in mean quiz scores
Bias such as sampling response or nonresponse bias may occur in surveys yielding results that are not representative of the population of interest
30 Evaluate where bias including sampling response or nonresponse bias may occur in surveys and whether results are representative of the population of interest Example Selecting students eating lunch in the cafeteria to participate in a survey may not accurately represent the student body as students who do not eat in the cafeteria may not be accounted for and may have different opinions or students may not respond honestly to questions that may be embarrassing such as how much time they spend on homework
The larger the sample size the less the expected variability in the sampling distribution of a sample statistic
31 Evaluate the effect of sample size on the expected variability in the sampling distribution of a sample statistic a Simulate a sampling distribution of sample means from a population with a known
distribution observing the effect of the sample size on the variability b Demonstrate that the standard deviation of each simulated sampling distribution is the
known standard deviation of the population divided by the square root of the sample size
The sampling distribution of a sample statistic formed from repeated samples for a given sample size drawn from a population can be used to identify typical behavior for that statistic Examining several such sampling distributions leads to estimating a set of plausible values for the population parameter using the margin of error as a measure that describes the sampling variability
32 Produce a sampling distribution by repeatedly selecting samples of the same size from a given population or from a population simulated by bootstrapping (resampling with replacement from an observed sample) Do initial examples by hand then use technology to generate a large number of samples a Verify that a sampling distribution is centered at the population mean and approximately
normal if the sample size is large enough b Verify that 95 of sample means are within two standard deviations of the sampling
distribution from the population mean c Create and interpret a 95 confidence interval based on an observed mean from a
sampling distribution
Algebra II with Statistics
147 2019 Alabama Course of Study Mathematics
33 Use data from a randomized experiment to compare two treatments limit to informal use of simulations to decide if an observed difference in the responses of the two treatment groups is unlikely to have occurred due to randomization alone thus implying that the difference between the treatment groups is meaningful Example Fifteen students are randomly assigned to a treatment group that listens to music while completing mathematics homework and another 15 are assigned to a control group that does not and their means on the next quiz are found to be different To test whether the differences seem significant all the scores from the two groups are placed on index cards and repeatedly shuffled into two new groups of 15 each each time recording the difference in the means of the two groups The differences in means of the treatment and control groups are then compared to the differences in means of the mixed groups to see how likely it is to occur
Geometry and Measurement
Focus 1 Measurement When an object is the image of a known object under a similarity transformation a length area or volume on the image can be computed by using proportional relationships
34 Define the radian measure of an angle as the constant of proportionality of the length of an arc it intercepts to the radius of the circle in particular it is the length of the arc intercepted on the unit circle
Focus 2 Transformations (Note There are no Algebra II with Statistics standards in Focus 2)
Focus 3 Geometric Argument Reasoning and Proof (Note There are no Algebra II with Statistics standards in Focus 3)
Focus 4 Solving Applied Problems and Modeling in Geometry Recognizing congruence similarity symmetry measurement opportunities and other geometric ideas including right triangle trigonometry in real-world contexts provides a means of building understanding of these concepts and is a powerful tool for solving problems related to the physical world in which we live
35 Choose trigonometric functions (sine and cosine) to model periodic phenomena with specified amplitude frequency and midline
36 Prove the Pythagorean identity sin2 (θ) + cos2 (θ) = 1 and use it to calculate trigonometric ratios
37 Derive and apply the formula A = frac12middotabmiddotsin(C) for the area of a triangle by drawing an auxiliary line from a vertex perpendicular to the opposite side extending the domain of sine to include right and obtuse angles
Algebra II with Statistics
148 2019 Alabama Course of Study Mathematics
38 Derive and apply the Law of Sines and the Law of Cosines to find unknown measurements in right and non-right triangles Extend the domain of sine and cosine to include right and obtuse angles Examples surveying problems resultant forces
149 2019 Alabama Course of Study Mathematics
Mathematical Modeling Overview
Mathematical Modeling is a newly-designed specialized mathematics course developed to expand on and reinforce the concepts introduced in Geometry with Data Analysis Algebra I with Probability and Algebra II with Statistics by applying them in the context of mathematical modeling to represent and analyze data and make predictions regarding real-world phenomena Mathematical Modeling is designed to engage students in doing thinking about and discussing mathematics statistics and modeling in everyday life It allows students to experience mathematics and its applications in a variety of ways that promote financial literacy and data-based decision-making skills This course also provides a solid foundation for students who are entering a range of fields involving quantitative reasoning whether or not they require calculus In this course students explore decision-making for financial planning and management design in three dimensions interpreting statistical studies and creating functions to model change in the environment and society Measurements are taken from the real world and technology is used extensively for computation with an emphasis on studentsrsquo interpretation and explanation of results in context Students will develop and use both the Mathematical Modeling Cycle and the Statistical Problem-Solving Cycle found in Appendix E in this specialized course to further develop authentic decision-making skills It is essential for students to use technology and other mathematical tools such as graphing calculators online graphing software and spreadsheets to explore application-based real-world problems to develop their mathematical decision-making skills and to increase precision in complex calculations throughout the mathematical modeling process The eight Student Mathematical Practices listed in the chart below represent what students are doing as they learn mathematics Students should regularly engage in these processes and proficiencies at every level throughout their mathematical studies Proficiency with these practices is critical in using mathematics both in the classroom and in everyday life The Student Mathematical Practices are standards to be incorporated across all grades
Student Mathematical Practices 1 Make sense of problems and persevere in solving them 5 Use appropriate tools strategically 2 Reason abstractly and quantitatively 6 Attend to precision 3 Construct viable arguments and critique the reasoning of others 7 Look for and make use of structure 4 Model with mathematics 8 Look for and express regularity in repeated reasoning
The standards in this course extend beyond the essential concepts described in the overview The standards indicating what students should know or be able to do are listed in the right columns of the content area tables below Important topics within these content areas are described in the left columns
Mathematical Modeling
150 2019 Alabama Course of Study Mathematics
Mathematical Modeling Content Standards Each content standard completes the stem ldquoStudents willhelliprdquo Modeling Mathematical modeling and statistical problem-solving are extensive cyclical processes that can be used to answer significant real-world problems
1 Use the full Mathematical Modeling Cycle or Statistical Problem-Solving Cycle to answer a real-world problem of particular student interest incorporating standards from across the course Examples Use a mathematical model to design a three-dimensional structure and determine whether particular design constraints are met to decide under what conditions the purchase of an electric vehicle will save money to predict the extent to which the level of the ocean will rise due to the melting polar ice caps or to interpret the claims of a statistical study regarding the economy
Financial Planning and Management Mathematical models involving growth and decay are useful in solving real-world problems involving borrowing and investing spreadsheets are a frequently-used and powerful tool to assist with modeling financial situations
2 Use elements of the Mathematical Modeling Cycle to solve real-world problems involving finances
3 Organize and display financial information using arithmetic sequences to represent simple interest and straight-line depreciation
4 Organize and display financial information using geometric sequences to represent compound interest and proportional depreciation including periodic (yearly monthly weekly) and continuous compounding a Explain the relationship between annual percentage yield (APY) and annual
percentage rate (APR) as values for r in the formulas A=P(1+r)t and A=Pert
5 Compare simple and compound interest and straight-line and proportional depreciation
6 Investigate growth and reduction of credit card debt using spreadsheets including variables such as beginning balance payment structures credits interest rates new purchases finance charges and fees
Mathematical Modeling
151 2019 Alabama Course of Study Mathematics
7 Compare and contrast housing finance options including renting leasing to purchase purchasing with a mortgage and purchasing with cash a Research and evaluate various mortgage products available to consumers b Compare monthly mortgage payments for different terms interest rates and down
payments c Analyze the financial consequence of buying a home (mortgage payments vs
potentially increasing resale value) versus investing the money saved when renting assuming that renting is the less expensive option
8 Investigate the advantages and disadvantages of various means of paying for an automobile including leasing purchasing by cash and purchasing by loan
Design in Three Dimensions Two- and three-dimensional representations coordinates systems geometric transformations and scale models are useful tools in planning designing and constructing solutions to real-world problems
9 Use the Mathematical Modeling Cycle to solve real-world problems involving the design of three-dimensional objects
10 Construct a two-dimensional visual representation of a three-dimensional object or structure a Determine the level of precision and the appropriate tools for taking the measurements
in constructing a two-dimensional visual representation of a three-dimensional object or structure
b Create an elevation drawing to represent a given solid structure using technology where appropriate
c Determine which measurements cannot be taken directly and must be calculated based on other measurements when constructing a two-dimensional visual representation of a three-dimensional object or structure
d Determine an appropriate means to visually represent an object or structure such as drawings on paper or graphics on computer screens
Mathematical Modeling
152 2019 Alabama Course of Study Mathematics
11 Plot coordinates on a three-dimensional Cartesian coordinate system and use relationships between coordinates to solve design problems a Describe the features of a three-dimensional Cartesian coordinate system and use them
to graph points b Graph a point in space as the vertex of a right prism drawn in the appropriate octant
with edges along the x y and z axes c Find the distance between two objects in space given the coordinates of each
Examples Determine whether two aircraft are flying far enough apart to be safe find how long a zipline cable would need to be to connect two platforms at different heights on two trees
d Find the midpoint between two objects in space given the coordinates of each Example If two asteroids in space are traveling toward each other at the same speed find where they will collide
12 Use technology and other tools to explore the results of simple transformations using three-dimensional coordinates including translations in the x y andor z directions rotations of 90ordm 180ordm or 270ordm about the x y and z axes reflections over the xy yz and xy planes and dilations from the origin Example Given the coordinates of the corners of a room in a house find the coordinates of the same room facing a different direction
13 Create a scale model of a complex three-dimensional structure based on observed measurements and indirect measurements using translations reflections rotations and dilations of its components Example Develop a plan for a bridge structure using geometric properties of its parts to determine unknown measures and represent the plan in three dimensions
Mathematical Modeling
153 2019 Alabama Course of Study Mathematics
Creating Functions to Model Change in the Environment and Society Functions can be used to represent general trends in conditions that change over time and to predict future conditions based on present observations
14 Use elements of the Mathematical Modeling Cycle to make predictions based on measurements that change over time including motion growth decay and cycling
15 Use regression with statistical graphing technology to determine an equation that best fits a
set of bivariate data including nonlinear patterns Examples global temperatures stock market values hours of daylight animal population carbon dating measurements online streaming viewership a Create a scatter plot with a sufficient number of data points to predict a pattern b Describe the overall relationship between two quantitative variables (increase
decrease linearity concavity extrema inflection) or pattern of change c Make a prediction based upon patterns
16 Create a linear representation of non-linear data and interpret solutions using technology
and the process of linearization with logarithms
Modeling to Interpret Statistical Studies Statistical studies allow a conclusion to be drawn about a population that is too large to survey completely or about cause and effect in an experiment
17 Use the Statistical Problem Solving Cycle to answer real-world questions
18 Construct a probability distribution based on empirical observations of a variable Example Record the number of student absences in class each day and find the
probability that each number of students will be absent on any future day a Estimate the probability of each value for a random variable based on empirical
observations or simulations using technology b Represent a probability distribution by a relative frequency histogram andor a
cumulative relative frequency graph c Find the mean standard deviation median and interquartile range of a probability
distribution and make long-term predictions about future possibilities Determine which measures are most appropriate based upon the shape of the distribution
Mathematical Modeling
154 2019 Alabama Course of Study Mathematics
19 Construct a sampling distribution for a random event or random sample Examples How many times do we expect a fair coin to come up ldquoheadsrdquo in 100 flips and on average how far away from this expected value do we expect to be on a specific set of flips What do we expect to be the average height for a random sample of students in a local high school given the mean and standard deviation of the heights of all students in the high school a Use the binomial theorem to construct the sampling distribution for the number of
successes in a binary event or the number of positive responses to a yesno question in a random sample
b Use the normal approximation of a proportion from a random event or sample when conditions are met
c Use the central limit theorem to construct a normal sampling distribution for the sample mean when conditions are met
d Find the long-term probability of a given range of outcomes from a random event or random sample
20 Perform inference procedures based on the results of samples and experiments a Use a point estimator and margin of error to construct a confidence interval for a
proportion or mean b Interpret a confidence interval in context and use it to make strategic decisions
Example short-term and long-term budget projections for a business c Perform a significance test for null and alternative hypotheses d Interpret the significance level of a test in the context of error probabilities and use
the results to make strategic decisions Example How do you reduce the rate of human error on the floor of a manufacturing plant
21 Critique the validity of reported conclusions from statistical studies in terms of bias and random error probabilities
Mathematical Modeling
155 2019 Alabama Course of Study Mathematics
22 Conduct a randomized study on a topic of student interest (sample or experiment) and draw conclusions based upon the results Example Record the heights of thirty randomly selected students at your high school Construct a confidence interval to estimate the true average height of students at your high school Question whether or not this data provides significant evidence that your schoolrsquos average height is higher than the known national average and discuss error probabilities
156 2019 Alabama Course of Study Mathematics
Applications of Finite Mathematics Overview
Applications of Finite Mathematics is a newly-designed specialized course developed for inclusion in the 2019 Alabama Course of Study Mathematics Applications of Finite Mathematics was developed as a fourth-year course that extends beyond the three years of essential content that is required for all high school students Applications of Finite Mathematics provides students with the opportunity to explore mathematics concepts related to discrete mathematics and their application to computer science and other fields Students who are interested in postsecondary programs of study that do not require calculus (such as elementary and early childhood education English history art music and technical and trade certifications) would benefit from choosing Applications of Finite Mathematics as their fourth high school mathematics credit It may also be a useful supplemental course for students pursuing a career in computer science This course is an important non-calculus option that presents mathematics as relevant and meaningful in everyday life Its objective is to help students experience the usefulness of mathematics in solving problems that are frequently encountered in todayrsquos complex society Finite mathematics includes areas of study that are critical to the fast-paced growth of a technologically advancing world The wide range of topics in Applications of Finite Mathematics includes logic counting methods information processing graph theory election theory and fair division with an emphasis on relevance to real-world problems Logic includes recognizing and developing logical arguments and using principles of logic to solve problems Students are encouraged to use a variety of approaches and representations to make sense of advanced counting problems then develop formulas that can be used to explain patterns Applications in graph theory allow students to use mathematical structures to represent real world problems and make informed decisions Election theory and fair division applications also engage students in democratic decision-making so that they recognize the power of mathematics in shaping society Applications of Finite Mathematics exhibits tremendous diversity with respect to both content and approach Teachers are encouraged to engage students using an investigative approach to instruction including the Student Mathematical Practices Students should be given opportunities to engage in learning and decision-making with technology and hands-on tools The eight Student Mathematical Practices listed in the chart below represent what students are doing as they learn mathematics Students should regularly engage in these processes and proficiencies at every level throughout their mathematical studies Proficiency with these practices is critical in using mathematics both in the classroom and in everyday life The Student Mathematical Practices are standards to be incorporated across all grades
Applications of Finite Mathematics
157 2019 Alabama Course of Study Mathematics
Student Mathematical Practices
1 Make sense of problems and persevere in solving them 5 Use appropriate tools strategically 2 Reason abstractly and quantitatively 6 Attend to precision 3 Construct viable arguments and critique the reasoning of others 7 Look for and make use of structure 4 Model with mathematics 8 Look for and express regularity in repeated reasoning
The standards in this course extend beyond the essential concepts described in the overview for high school The standards indicating what students should know or be able to do are listed in the right columns of tables below organized by relevant content areas
Applications of Finite Mathematics Content Standards Each numbered standard completes the sentence stem ldquoStudents willhelliprdquo Logical Reasoning The validity of a statement or argument can be determined using the models and language of first order logic
1 Represent logic statements in words with symbols and in truth tables including conditional biconditional converse inverse contrapositive and quantified statements
2 Represent logic operations such as and or not nor and x or (exclusive or) in words with symbols and in truth tables
3 Use truth tables to solve application-based logic problems and determine the truth value of simple and compound statements including negations and implications a Determine whether statements are equivalent and construct equivalent statements Example Show that the contrapositive of a statement is its logical equivalent
4 Determine whether a logical argument is valid or invalid using laws of logic such as the law of syllogism and the law of detachment a Determine whether a logical argument is a tautology or a contradiction
5 Prove a statement indirectly by proving the contrapositive of the statement
Applications of Finite Mathematics
158 2019 Alabama Course of Study Mathematics
Advanced Counting Complex counting problems can be solved efficiently using a variety of techniques
6 Use multiple representations and methods for counting objects and developing more efficient counting techniques Note Representations and methods may include tree diagrams lists manipulatives overcounting methods recursive patterns and explicit formulas
7 Develop and use the Fundamental Counting Principle for counting independent and dependent events a Use various counting models (including tree diagrams and lists) to identify the
distinguishing factors of a context in which the Fundamental Counting Principle can be applied Example Apply the Fundamental Counting Principle in a context that can be represented by a tree diagram in which there are the same number of branches from each node at each level of the tree
8 Using application-based problems develop formulas for permutations combinations and
combinations with repetition and compare student-derived formulas to standard representations of the formulas Example If there are r objects chosen from n objects then the number of permutations can be found by the product [n(n-1) hellip (n-r)(n-r+1)] as compared to the standard formula n(n-r) a Identify differences between applications of combinations and permutations b Using application-based problems calculate the number of permutations of a set with n
elements Calculate the number of permutations of r elements taken from a set of n elements
c Using application-based problems calculate the number of subsets of size r that can be chosen from a set of n elements explaining this number as the number of combinations ldquon choose rrdquo
d Using application-based problems calculate the number of combinations with repetitions of r elements from a set of n elements as ldquo(n + r ndash 1) choose rrdquo
9 Use various counting techniques to determine probabilities of events
10 Use the Pigeonhole Principle to solve counting problems
Applications of Finite Mathematics
159 2019 Alabama Course of Study Mathematics
Recursion Recursion is a method of problem solving where a given relation or routine operation is repeatedly applied
11 Find patterns in application problems involving series and sequences and develop recursive and explicit formulas as models to understand and describe sequential change Examples fractals population growth
12 Determine characteristics of sequences including the Fibonacci Sequence the triangular numbers and pentagonal numbers Example Write a sequence of the first 10 triangular numbers and hypothesize a formula to find the nth triangular number
13 Use the recursive process and difference equations to create fractals population growth models sequences and series
14 Use mathematical induction to prove statements involving the positive integers Examples Prove that 3 divides 22n ndash 1 for all positive integers n prove that 1 + 2 + 3 + + n = n(n + 1)2 prove that a given recursive sequence has a closed form expression
15 Develop and apply connections between Pascalrsquos Triangle and combinations
Networks Complex problems can be modeled using vertex and edge graphs and characteristics of the different structures are used to find solutions
16 Use vertex and edge graphs to model mathematical situations involving networks a Identify properties of simple graphs complete graphs bipartite graphs complete bipartite
graphs and trees
Applications of Finite Mathematics
160 2019 Alabama Course of Study Mathematics
17 Solve problems involving networks through investigation and application of existence and nonexistence of Euler paths Euler circuits Hamilton paths and Hamilton circuits Note Real-world contexts modeled by graphs may include roads or communication networks Example show why a 5x5 grid has no Hamilton circuit a Develop optimal solutions of application-based problems using existing and student-
created algorithms b Give an argument for graph properties
Example Explain why a graph has a Euler cycle if and only if the graph is connected and every vertex has even degree Show that any tree with n vertices has n ndash 1 edges
18 Apply algorithms relating to minimum weight spanning trees networks flows and Steiner trees Example traveling salesman problem a Use shortest path techniques to find optimal shipping routes b Show that every connected graph has a minimal spanning tree c Use Kruskalrsquos Algorithm and Primrsquos Algorithm to determine the minimal spanning tree
of a weighted graph
19 Use vertex-coloring edge-coloring and matching techniques to solve application-based problems involving conflict Examples Use graph-coloring techniques to color a map of the western states of the United States so that no adjacent states are the same color determining the minimum number of colors needed and why no fewer colors may be used use vertex colorings to determine the minimum number of zoo enclosures needed to house ten animals given their cohabitation constraints use vertex colorings to develop a time table for scenarios such as scheduling club meetings or for housing hazardous chemicals that cannot all be safely stored together in warehouses
20 Determine the minimum time to complete a project using algorithms to schedule tasks in
order including critical path analysis the list-processing algorithm and student-created algorithms
21 Use the adjacency matrix of a graph to determine the number of walks of length n in a graph
Applications of Finite Mathematics
161 2019 Alabama Course of Study Mathematics
Fairness and Democracy Various methods for determining a winner in a voting system can result in paradoxes or other issues of fairness
22 Analyze advantages and disadvantages of different types of ballot voting systems a Identify impacts of using a preferential ballot voting system and compare it to single
candidate voting and other voting systems b Analyze the impact of legal and cultural features of political systems on the mathematical
aspects of elections Examples mathematical disadvantages of third parties the cost of run-off elections
23 Apply a variety of methods for determining a winner using a preferential ballot voting system including plurality majority run-off with majority sequential run-off with majority Borda count pairwise comparison Condorcet and approval voting
24 Identify issues of fairness for different methods of determining a winner using a preferential voting ballot and other voting systems and identify paradoxes that can result Example Arrowrsquos Theorem
25 Use methods of weighted voting and identify issues of fairness related to weighted voting Example determine the power of voting bodies using the Banzhaf power index a Distinguish between weight and power in voting
Fair Division Methods used to solve non-trivial problems of division of objects often reveal issues of fairness
26 Explain and apply mathematical aspects of fair division with respect to classic problems of apportionment cake cutting and estate division Include applications in other contexts and modern situations
27 Identify and apply historic methods of apportionment for voting districts including Hamilton Jefferson Adams Webster and Huntington-Hill Identify issues of fairness and paradoxes that may result from methods Examples the Alabama paradox population paradox
Applications of Finite Mathematics
162 2019 Alabama Course of Study Mathematics
28 Use spreadsheets to examine apportionment methods in large problems Example apportion the 435 seats in the US House of Representatives using historically applied methods
Information Processing Effective systems for sending and receiving information include components that impact accuracy efficiency and security
29 Critically analyze issues related to information processing including accuracy efficiency and security
30 Apply ciphers (encryption and decryption algorithms) and cryptosystems for encrypting and decrypting including symmetric-key or public-key systems a Use modular arithmetic to apply RSA (Rivest-Shamir-Adleman) public-key
cryptosystems b Use matrices and their inverses to encode and decode messages
31 Apply error-detecting codes and error-correcting codes to determine accuracy of information
processing
32 Apply methods of data compression Example Huffman codes
163 2019 Alabama Course of Study Mathematics
Precalculus Overview
Precalculus is designed for students who intend to pursue a career in science technology engineering or mathematics (STEM) that requires the study of calculus It prepares students for calculus at the postsecondary level or AP Calculus at the high school level Students must successfully complete Algebra II with Statistics before enrolling in Precalculus Precalculus builds on the study of algebra and functions in Algebra II with Statistics adding rational functions all trigonometric functions and general piecewise-defined functions to the families of functions considered In addition to focusing on the families of functions Precalculus takes a deeper look at functions as a system including composition of functions and inverses Precalculus also expands on the study of trigonometry in previous courses and considers vectors and their operations Other topics such as statistics that are frequently added to precalculus courses are not included because the coursersquos primary focus is preparing students for the study of calculus In particular a focus on mathematical modeling is included across the course see Appendix E for more information on the Mathematical Modeling Cycle Studentsrsquo use of technology (such as graphing calculators online graphing software and spreadsheets) is essential in exploring the functions and equations addressed in Precalculus The eight Student Mathematical Practices listed in the chart below represent what students are doing as they learn mathematics Students should regularly engage in these processes and proficiencies at every level throughout their mathematical studies Proficiency with these practices is critical in using mathematics both within the classroom and in life The Student Mathematical Practices are standards to be incorporated across all grades
Student Mathematical Practices
1 Make sense of problems and persevere in solving them 5 Use appropriate tools strategically 2 Reason abstractly and quantitatively 6 Attend to precision 3 Construct viable arguments and critique the reasoning of others 7 Look for and make use of structure 4 Model with mathematics 8 Look for and express regularity in repeated reasoning
The standards in this course extend beyond the essential concepts described in the overview The standards indicating what students should know or be able to do are listed in the right columns of the content area tables Important concepts within these content areas are described in the left columns and focus areas within the tables are indicated Only those focus areas which are appropriate for this course are included Statements in bold print indicate the scope of the standard and align the standard to related content in other courses The full scope of every standard should be addressed during instruction
Precalculus
164 2019 Alabama Course of Study Mathematics
Precalculus Content Standards Each numbered standard completes the stem ldquoStudents willhelliprdquo
Number and Quantity The Complex Number System Perform arithmetic operations with complex numbers
1 Define the constant e in a variety of contexts Example the total interest earned if a 100 annual rate is continuously compounded a Explore the behavior of the function y=ex and its applications b Explore the behavior of ln(x) the logarithmic function with base e and its
applications
2 Find the conjugate of a complex number use conjugates to find moduli and quotients of complex numbers
Represent complex numbers and their operations on the complex plane
3 Represent complex numbers on the complex plane in rectangular and polar form (including real and imaginary numbers) and explain why the rectangular and polar forms of a given complex number represent the same number
4 Represent addition subtraction multiplication and conjugation of complex numbers geometrically on the complex plane use properties of this representation for computation Example (minus1 + radic3119894119894)3 = 8 because (minus1 + radic3119894119894) has modulus 2 and argument 120deg
5 Calculate the distance between numbers in the complex plane as the modulus of the difference and the midpoint of a segment as the average of the numbers at its endpoints
Use complex numbers in polynomial identities and equations
6 Analyze possible zeros for a polynomial function over the complex numbers by applying the Fundamental Theorem of Algebra using a graph of the function or factoring with algebraic identities
Precalculus
165 2019 Alabama Course of Study Mathematics
Limits Understand limits of functions 7 Determine numerically algebraically and graphically the limits of functions at
specific values and at infinity a Apply limits of functions at specific values and at infinity in problems
involving convergence and divergence
Vector and Matrix Quantities Represent and model with vector quantities 8 Explain that vector quantities have both magnitude and direction Represent vector
quantities by directed line segments and use appropriate symbols for vectors and their magnitudes Examples v |v| ||v|| v
9 Find the components of a vector by subtracting the coordinates of an initial point from the coordinates of a terminal point
10 Solve problems involving velocity and other quantities that can be represented by vectors
11 Find the scalar (dot) product of two vectors as the sum of the products of corresponding components and explain its relationship to the cosine of the angle formed by two vectors
Precalculus
166 2019 Alabama Course of Study Mathematics
Perform operations on vectors 12 Add and subtract vectors a Add vectors end-to-end component-wise and by the parallelogram rule
understanding that the magnitude of a sum of two vectors is not always the sum of the magnitudes
b Given two vectors in magnitude and direction form determine the magnitude and direction of their sum
c Explain vector subtraction v ndash w as v + (ndashw) where ndashw is the additive inverse of w with the same magnitude as w and pointing in the opposite direction Represent vector subtraction graphically by connecting the tips in the appropriate order and perform vector subtraction component-wise
13 Multiply a vector by a scalar a Represent scalar multiplication graphically by scaling vectors and possibly
reversing their direction perform scalar multiplication component-wise Example c(vx vy) = (cvx cvy)
b Compute the magnitude of a scalar multiple cv using ||cv|| = |c|v Compute the direction of cv knowing that when |c|v ne 0 the direction of cv is either along v (for c gt 0) or against v (for c lt 0)
14 Multiply a vector (regarded as a matrix with one column) by a matrix of suitable dimensions to produce another vector Work with matrices as transformations of vectors
Algebra Seeing Structure in Expressions Write expressions in equivalent forms to solve problems
15 Derive the formula for the sum of a finite geometric series (when the common ratio is not 1) and use the formula to solve problems extending to infinite geometric series Examples calculate mortgage payments determine the long-term level of medication if a patient takes 50 mg of a medication every 4 hours while 70 of the medication is filtered out of the patientrsquos blood
Precalculus
167 2019 Alabama Course of Study Mathematics
Arithmetic With Polynomials and Rational Expressions Understand the relationship between zeros and factors of polynomials
16 Derive and apply the Remainder Theorem For a polynomial p(x) and a number a the remainder on division by x ndash a is p(a) so p(a) = 0 if and only if (x ndash a) is a factor of p(x)
Use polynomial identities to solve problems
17 Know and apply the Binomial Theorem for the expansion of (x + y)n in powers of x and y for a positive integer n where x and y are any numbers
Rewrite rational expressions 18 Rewrite simple rational expressions in different forms write a(x)b(x) in the form q(x) + r(x)b(x) where a(x) b(x) q(x) and r(x) are polynomials with the degree of r(x) less than the degree of b(x) using inspection long division or for the more complicated cases a computer algebra system
19 Add subtract multiply and divide rational expressions a Explain why rational expressions form a system analogous to the rational
numbers which is closed under addition subtraction multiplication and division by a non-zero rational expression
Reasoning With Equations and Inequalities Understand solving equations as a process of reasoning and explain the reasoning
20 Explain each step in solving an equation as following from the equality of numbers asserted at the previous step starting from the assumption that the original equation has a clear-cut solution Construct a viable argument to justify a solution method Include equations that may involve linear quadratic polynomial exponential logarithmic absolute value radical rational piecewise and trigonometric functions and their inverses
21 Solve simple rational equations in one variable and give examples showing how extraneous solutions may arise
Solve systems of equations 22 Represent a system of linear equations as a single matrix equation in a vector variable
23 Find the inverse of a matrix if it exists and use it to solve systems of linear equations (using technology for matrices of dimension 3 x 3 or greater)
Precalculus
168 2019 Alabama Course of Study Mathematics
Functions Interpreting Functions Interpret functions that arise in applications in terms of the context
24 Compare and contrast families of functions and their representations algebraically graphically numerically and verbally in terms of their key features Note Key features include intercepts intervals where the function is increasing decreasing positive or negative maximums and minimums symmetries (including even and odd) end behavior asymptotes and periodicity Families of functions include but are not limited to linear quadratic polynomial exponential logarithmic absolute value radical rational piecewise trigonometric and their inverses
25 Calculate and interpret the average rate of change of a function (presented symbolically or as a table) over a specified interval Estimate the rate of change from a graph Extend from polynomial exponential logarithmic and radical to rational and all trigonometric functions
a Find the difference quotient 119891119891(119909119909+∆119909119909)minus119891119891(119909119909)∆119909119909
of a function and use it to evaluate the average rate of change at a point
b Explore how the average rate of change of a function over an interval (presented symbolically or as a table) can be used to approximate the instantaneous rate of change at a point as the interval decreases
Analyze functions using different representations
26 Graph functions expressed symbolically and show key features of the graph by hand and using technology Use the equation of functions to identify key features in order to generate a graph a Graph rational functions identifying zeros and asymptotes when suitable
factorizations are available and showing end behavior b Graph trigonometric functions and their inverses showing period midline
amplitude and phase shift
Precalculus
169 2019 Alabama Course of Study Mathematics
Building Functions Build a function that models a relationship between two quantities
27 Compose functions Extend to polynomial trigonometric radical and rational functions Example If T(y) is the temperature in the atmosphere as a function of height and h(t) is the height of a weather balloon as a function of time then T(h(t)) is the temperature at the location of the weather balloon as a function of time
Build new functions from existing functions
28 Find inverse functions a Given that a function has an inverse write an expression for the inverse of the
function Example Given f(x) = 2 x3 or f(x) = (x + 1)(x ndash 1) for x ne 1 find f-1(x)
b Verify by composition that one function is the inverse of another c Read values of an inverse function from a graph or a table given that the
function has an inverse d Produce an invertible function from a non-invertible function by restricting
the domain
29 Use the inverse relationship between exponents and logarithms to solve problems involving logarithms and exponents Extend from logarithms with base 2 and 10 to a base of e
30 Identify the effect on the graph of replacing 119891119891(119909119909) by 119891119891(119909119909) + 119896119896119896119896 middot 119891119891(119909119909) 119891119891(119896119896 middot 119909119909) and 119891119891(119909119909 + 119896119896) for specific values of k (both positive and negative) find the value of k given the graphs Extend the analysis to include all trigonometric rational and general piecewise-defined functions with and without technology Example Describe the sequence of transformations that will relate y=sin(x) and y=2sin(3x)
Precalculus
170 2019 Alabama Course of Study Mathematics
31 Graph conic sections from second-degree equations extending from circles and parabolas to ellipses and hyperbolas using technology to discover patterns a Graph conic sections given their standard form
Example The graph of 1199091199092
9+ (119910119910minus3)2
4= 1 will be an ellipse centered at (03)
with major axis 3 and minor axis 2 while the graph of 1199091199092
9minus (119910119910minus3)2
4= 1 will
be a hyperbola centered at (03) with asymptotes with slope plusmn32 b Identify the conic section that will be formed given its equation in general
form Example 5y2 minus 25x2 = minus25 will be a hyperbola
Trigonometric Functions Recognize attributes of trigonometric functions and solve problems involving trigonometry
32 Solve application-based problems involving parametric and polar equations a Graph parametric and polar equations b Convert parametric and polar equations to rectangular form
Extend the domain of trigonometric functions using the unit circle
33 Use special triangles to determine geometrically the values of sine cosine and tangent for π3 π4 and π6 and use the unit circle to express the values of sine cosine and tangent for π ndash x π + x and 2π ndash x in terms of their values for x where x is any real number
34 Use the unit circle to explain symmetry (odd and even) and periodicity of trigonometric functions
Model periodic phenomena with trigonometric functions
35 Demonstrate that restricting a trigonometric function to a domain on which it is always increasing or always decreasing allows its inverse to be constructed
36 Use inverse functions to solve trigonometric equations that arise in modeling contexts evaluate the solutions using technology and interpret them in terms of the context
Precalculus
171 2019 Alabama Course of Study Mathematics
Prove and apply trigonometric identities 37 Use trigonometric identities to solve problems a Use the Pythagorean identity sin2 (θ) + cos2(θ) = 1 to derive the other forms
of the identity Example 1 + cot2 (θ) = csc2 (θ)
b Use the angle sum formulas for sine cosine and tangent to derive the double angle formulas
c Use the Pythagorean and double angle identities to prove other simple identities
Appendix A
172 2019 Alabama Course of Study Mathematics
Mathematics Teaching Practices Supporting Equitable Mathematics Teaching
Mathematics Teaching Practices Equitable Teaching Establish mathematics goals to focus learning Effective teaching of mathematics establishes clear goals for the mathematics that students are learning situates goals within learning progressions and uses the goals to guide instructional decisions
Establish learning progressions that build studentsrsquo mathematical understanding increase their confidence and support their mathematical identities as doers of mathematics
Establish high expectations to ensure that each and every student has the opportunity to meet the mathematical goals
Establish classroom norms for participation that position each and every student as a competent mathematics thinker
Establish classroom environments that promote learning mathematics as just equitable and inclusive
Implement tasks that promote reasoning and problem solving Effective teaching of mathematics engages students in solving and discussing tasks that promote mathematical reasoning and problem solving and allow multiple entry points and varied solution strategies
Engage students in tasks that provide multiple pathways for success and that require reasoning problem solving and modeling thus enhancing each studentrsquos mathematical identity and sense of agency
Engage students in tasks that are culturally relevant Engage students in tasks that allow them to draw on their funds of knowledge (ie the
resources that students bring to the classroom including their home cultural and language experiences)
Use and connect mathematical representations Effective teaching of mathematics engages students in making connections among mathematical representations to deepen understanding of mathematics concepts and procedures and to use as tools for problem solving
Use multiple representations so that students draw on multiple resources of knowledge to position them as competent
Use multiple representations to draw on knowledge and experiences related to the resources that students bring to mathematics (culture contexts and experiences)
Use multiple representations to promote the creation and discussion of unique mathematical representations to position students as mathematically competent
Appendix A
173 2019 Alabama Course of Study Mathematics
Facilitate meaningful mathematical discourse Effective teaching of mathematics facilitates discourse among students to build shared understanding of mathematical ideas by analyzing and comparing students approaches and arguments
Use discourse to elicit studentsrsquo ideas and strategies and create space for students to interact with peers to value multiple contributions and diminish hierarchical status among students (ie perceptions of differences and ability to participate)
Use discourse to attend to ways in which students position one another as capable or not capable of doing mathematics
Make discourse an expected and natural part of mathematical thinking and reasoning providing students with the space and confidence to ask questions that enhance their own mathematical learning
Use discourse as a means to disrupt structures and language that marginalize students
Pose purposeful questions Effective teaching of mathematics uses purposeful questions to assess and advance studentsrsquo reasoning and sense-making about important mathematical ideas and relationships
Pose purposeful questions and then listen to and understand studentsrsquo thinking to signal to students that their thinking is valued and makes sense
Pose purposeful questions to assign competence to students Verbally mark studentsrsquo ideas as interesting or identify an important aspect of studentsrsquo strategies to position them as competent
Be mindful of the fact that the questions that a teacher asks a student and how the teacher follows up on the studentrsquos response can support the studentrsquos development of a positive mathematical identity and sense of agency as a thinker and doer of mathematics
Build procedural fluency from conceptual understanding Effective teaching of mathematics builds fluency with procedures on a foundation of conceptual understanding so that students over time become skillful in using procedures flexibly as they solve contextual and mathematical problems
Connect conceptual understanding with procedural fluency to help students make sense of the mathematics and develop a positive disposition toward mathematics
Connect conceptual understanding with procedural fluency to reduce mathematical anxiety and position students as mathematical knowers and doers
Connect conceptual understanding with procedural fluency to provide students with a wider range of options for entering a task and building mathematical meaning
Support productive struggle in learning mathematics Effective teaching of mathematics consistently provides students individually and collectively with opportunities and supports to engage in productive struggle as they grapple with mathematical ideas and relationships
Allow time for students to engage with mathematical ideas to support perseverance and identity development
Hold high expectations while offering just enough support and scaffolding to facilitate student progress on challenging work to communicate caring and confidence in students
Appendix A
174 2019 Alabama Course of Study Mathematics
Elicit and use evidence of student thinking Effective teaching of mathematics uses evidence of student thinking to assess progress toward mathematical understanding and to adjust instruction continually in ways that support and extend learning
Elicit student thinking and make use of it during a lesson to send positive messages about studentsrsquo mathematical identities
Make student thinking public and then choose to elevate a student to a more prominent position in the discussion by identifying his or her idea as worth exploring to cultivate a positive mathematical identity
Promote a classroom culture in which mistakes and errors are viewed as important reasoning opportunities to encourage a wider range of students to engage in mathematical discussions with their peers and the teacher
Appendix B
175 2019 Alabama Course of Study Mathematics
2019 Alabama Course of Study Mathematics Pathways
Appendix B depicts the pathways the 2019 Alabama Course of Study Mathematics provides for students in Alabama public schools Chart 1 shows the pathways through K-12 Mathematics Chart 2 shows how K-12 pathways extend to postsecondary study of mathematics supporting studentsrsquo progress toward their future goals Important decisions about which mathematics courses students will take should be made at the middle and high school levels
As shown in Chart 1 the high school program builds on studentsrsquo mathematical preparation in Grades 6-8 with a common pathway of three required courses taken by all students followed by additional specialized courses that prepare students for life after high school Three options are provided for completing the required courses
1 Complete Geometry with Data Analysis in Grade 9 Algebra I with Probability in Grade 10 and Algebra II with Statistics in Grade 11 followed by a specialized course in Grade 12
2 Complete accelerated courses for Mathematics Grade 7 and Mathematics Grade 8 that incorporate the standards from Algebra I with Probability with the standards of Mathematics Grade 7 and Mathematics Grade 8 Students who have shown adequate progress by the end of Geometry with Data Analysis in Grade 9 may move directly to Algebra II with Statistics in Grade 10 These students will be required to take two additional courses in Grades 11 and 12 to earn the mandatory four credits in mathematics since neither of the accelerated middle grades courses (nor their combination) is equivalent to a high school mathematics credit Taking additional specialized course(s) enables students to make additional progress towards their postsecondary goals
3 Complete Geometry with Data Analysis and Algebra I with Probability concurrently in Grade 9 and Algebra II with Statistics in Grade 10 These students should continue to take a mathematics course in both Grade 11 and Grade 12 therefore students would earn a fifth mathematics credit in Grade 12
Chart 1 also depicts mathematics lab courses to be offered by school districts to meet the needs of students struggling in the required courses These lab courses meet concurrently with the required content courses Lab courses might provide a review of prior knowledge needed for upcoming lessons reinforce content from previous lessons or preview upcoming content to ensure that students can fully participate in the required content classes Since these lab courses do not cover additional mathematical standards students can earn only an elective credit for each of them not a mathematics credit Care should be taken to ensure that informed choices based on solid data are made about which students are assigned to lab classes or other supports Assignment to lab courses should be fluid based on frequent scrutiny of student progress rather than being a foregone conclusion based on the support they have received in the past See further discussion in the Overview to the High School Standards
Chart 2 depicts the connections between K-8 mathematics the three required high school mathematics courses additional courses needed to earn four credits in mathematics and their connections to postsecondary study and use of mathematics in the workforce Following Algebra II with Statistics students will complete courses from the box entitled ldquoCourses for Fourth Mathematics Creditrdquo As noted above some students will need to complete two of these courses in order to earn the required four mathematics credits and any student may choose to complete additional courses
Appendix B
176 2019 Alabama Course of Study Mathematics
To earn the fourth mathematics credit students select one or more specialized courses that prepare them for future success in the postsecondary study of mathematics in careers and in their lifelong use and enjoyment of mathematics The specialized courses are designed to prepare students for credit-bearing postsecondary study of mathematics and other future mathematical needs as depicted in the block entitled ldquoExample Postsecondary Coursesrdquo Working backwards from a desired field of study or profession students can identify what their postsecondary needs may be and then determine which specialized courses might best prepare them to reach their future goals
Students requiring two credits of mathematics after Algebra II with Statistics have the opportunity to take any two of the three specialized mathematics courses in any order as their content does not substantially overlap In addition an AP Calculus course may be taken following Precalculus in school systems where it is offered
AP Statistics AP Computer Science and other ALSDE approved courses are extended courses that satisfy a fourth mathematics credit These courses will supplement studentsrsquo mathematical preparation in high school but are not designed to prepare students for their initial credit-bearing post-secondary course in mathematics Students who intend to pursue a technical field may consider taking an AP Computer Science or other approved computer science courses along with either Applications of Finite Mathematics or Mathematical Modeling Students who intend to pursue a field with extensive use of statistics may consider taking AP Statistics along with either Applications of Finite Mathematics or Mathematical Modeling While AP Statistics AP Computer Science and other ALSDE approved courses may satisfy a fourth mathematics credit it is recommended that one of the specialized courses also be completed to provide students with an adequate background for future mathematical endeavors The ALSDE has approved other options for a fourth mathematics credit including dual enrollment courses see Options for Mathematics Credit after Algebra II with Statistics at the end of Appendix B Given the impact these decisions may have on their future prospects students and their parents in consultation with school personnel should carefully consider the consequences of the different options and what options will best meet each studentrsquos needs Students should be encouraged to pursue a pathway that provides options beyond current considerations to accommodate the broadest range of future academic and career interests
Appendix B
177 2019 Alabama Course of Study Mathematics
Chart 1 Pathways through K-12 Mathematics
Appendix B
178 2019 Alabama Course of Study Mathematics
Chart 2 Pathways through K-12 Mathematics to Postsecondary
Appendix B
179 2019 Alabama Course of Study Mathematics
Options for Mathematics Credit After Algebra II with Statistics
1 Applications of Finite Mathematics 2 Mathematical Modeling 3 Precalculus 4 Credit-eligible Advanced Placement mathematics and computer science courses 5 Credit-eligible International Baccalaureate mathematics and computer science courses 6 Credit-eligible Career and Technical Education mathematics courses 7 ALSDE-approved computer science courses 8 ALSDE-approved dual enrollmentpostsecondary mathematics courses 9 ALSDE-approved locally-developed courses
School administrators school counselors classroom teachers school staff students and parents should always refer to the ALSDE Academic Guide for sample approved mathematics course pathways
Appendix C
180 2019 Alabama Course of Study Mathematics
Resources
Table 1 Student Mathematical Practices
1 Make sense of problems and persevere in solving them
Students canhellip Because teachers arehellip show patience and positive attitudes modeling patience and positive attitudes ask themselves if their answers make sense providing wait-time for processing and finding solutions use concrete objects or pictures to help conceptualize and solve a problem choosing and posing rich tasks with multiple entry points actively engage in problem-solving circulating to pose open-ended questions (also including assessing and
advancing questions) as they monitor student progress understand the approaches of others to solving complex problems modeling listening and speaking skills
2 Reason abstractly and quantitatively
Students canhellip Because teachers arehellip understand there are multiple ways to break apart the problem in order to find the solution
asking students to explain their thinking regardless of accuracy
use symbols pictures or other representations to describe the different sections of the problem allowing students to use context skills
accepting varied solutions and representations
explain their thinking facilitating discussion through guided questions and representations attend to the meaning of quantities and can use numbers flexibly by applying properties of operations and using objects
highlighting flexible use of numbers (Can be done through Math Talks or Number Talks)
ask themselves if their problem-solving and answers make sense providing wait-time for processing and finding solutions
Appendix C
181 2019 Alabama Course of Study Mathematics
3 Construct viable arguments and critique the reasoning of others
Students canhellip Because teachers arehellip justify their conclusions communicate them to others and respond to the arguments of others
aiming to create a common mathematical language that can be used to discuss and explain math as well as support or disagree with othersrsquo work
use appropriate math vocabulary while justifying their thinking intentionally using math vocabulary that is easily integrated into daily lesson plans in order for students to be able to communicate effectively (Whole school agreement on math vocabulary)
listen to the reasoning of others compare arguments and ask useful questions to clarify othersrsquo thinking
asking clarifying and probing questions
make reasonable guesses to explore their ideas providing opportunities for students to listen to the conclusions and arguments of others
establishing and facilitating a safe environment for rich discussion avoiding giving too much assistance (for example providing answers
procedures or too much explanation)
4 Model with mathematics
Students canhellip Because teachers arehellip apply the mathematics they know to solve problems arising in everyday life choosing real life situations for students because they know math does not
end at the classroom door reflect on whether the results make sense possibly improving the model if it does not serve its purpose
intentionally posing problems connected to previous concepts
model their thinking with objects pictures acting out numbers or words using purposeful and planned representations
5 Use appropriate tools strategically
Students canhellip Because teachers arehellip select and use tools strategically and flexibly then discuss what worked and what didnrsquot
choosing open-ended tasks that will require students to select math tools
detect possible errors by strategically using estimation and other mathematical knowledge
making appropriate tools available for learning
use technological tools and resources to solve problems and deepen understanding
using tools with instruction
providing students opportunities to use tools and see significance in real world situations
Appendix C
182 2019 Alabama Course of Study Mathematics
6 Attend to precision
Students canhellip Because teachers arehellip use clear definitions in discussion with others and in their own reasoning (This includes explaining their thinking using mathematics vocabulary)
modeling the importance of precision and exact answers in mathematics
speak and problem-solve paying attention to exactness and detail recognizing and modeling efficient strategies for computation give carefully explanations to each other including when they are confused using and challenging students to use mathematics vocabulary accurately
and consistently use appropriate symbols and specify units of measure
7 Look for and make use of structure
Students canhellip Because teachers arehellip use many different skills to determine the answer providing time for students to apply and discuss properties look closely to discern a pattern or structure asking questions about patterns adopt mental math strategies based on patterns highlighting different mental math strategies through Number Talks Math
Talks etc apply reasonable thoughts about patterns and properties to new situations
8 Look for and express regularity in repeated reasoning
Students canhellip Because teachers arehellip work on applying their mathematical reasoning to various situations and problems
providing tasks with patterns
continually check their work by asking themselves ldquoDoes this make senserdquo asking about answers before and reasonableness after computations look for shortcuts in patterns and repeated calculations
This project used work created by and adapted from the Departments of Education in Ohio North Carolina Georgia Kansas and resources created by Achieve the Core EngageNY Illustrative Mathematics NCTM and Howard County Public School System in Columbia MD
DRAFT
Appendix D
183 2019 Alabama Course of Study Mathematics
Resources for Grades 6 ndash 8 TABLE 1 PROPERTIES OF OPERATIONS
Here a b and c stand for arbitrary numbers in a given number system The properties of operations apply to the rational number system the real number system and the complex number system
Associative property of addition (a + b) + c = a + (b + c) Commutative property of addition a + b = b + a Additive identity property of 0 a + 0 = 0 + a = a Existence of additive inverses For every a there exists ndasha so that a + (ndasha) = (ndasha) + a = 0 Associative property of multiplication (a times b) times c = a times (b times c) Commutative property of multiplication a times b = b times a Multiplicative identity property of 1 a times 1 = 1 times a = a Existence of multiplicative inverses For every a ne 0 there exists 1a so that a times 1a = 1a times a = 1 Distributive property of multiplication over addition a times (b + c) = a times b + a times c
TABLE 2 PROPERTIES OF EQUALITY
Here a b and c stand for arbitrary numbers in the rational real or complex number systems Reflexive property of equality a = a Symmetric property of equality If a = b then b = a Transitive property of equality If a = b and b = c then a = c Addition property of equality If a = b then a + c = b + c Subtraction property of equality If a = b then a ndash c = b ndash c Multiplication property of equality If a = b then a times c = b times c Division property of equality If a = b and c ne 0 then a divide c = b divide c Substitution property of equality If a = b then b may be substituted for a in any expression
containing a
DRAFT
Appendix D
184 2019 Alabama Course of Study Mathematics
TABLE 3 PROPERTIES OF INEQUALITY Here a b and c stand for arbitrary numbers in the rational or real
number systems Exactly one of the following is true a lt b a = b a gt b If a gt b and b gt c then a gt c If a gt b then b lt a If a gt b then ndasha lt ndashb If a gt b then a plusmn c gt b plusmn c If a gt b and c gt 0 then a times c gt b times c If a gt b and c lt 0 then a times c lt b times c If a gt b and c gt 0 then a divide c gt b divide c If a gt b and c lt 0 then a divide c lt b divide c
DRAFT
Appendix D
185 2019 Alabama Course of Study Mathematics
Table 4 Functions
DRAFT
Appendix D
186 2019 Alabama Course of Study Mathematics
Table 5 Reference Page
Some Abbreviations Used in Formulas 11988711988711198871198872= bases of a trapezoid C = circumference SA = surface area b = base of a polygon r = radius V = volume h = height or altitude d = diameter B = area of a base l = length pi = 120587120587 asymp 314 S = sum of interior angles of a convex polygon w = width P = perimeter n = number of sides of a convex polygon A = area m = slope LA = lateral area
Formulas
Triangle 119860119860 = 12119887119887ℎ
Parallelogram 119860119860 = 119887119887ℎ Rectangle 119860119860 = 119897119897119897119897
Trapezoid 119860119860 = 12ℎ(1198871198871 + 1198871198872)
Slope 119898119898 = 1199101199102minus1199101199101
1199091199092minus1199091199091
Circle 119860119860 = 1205871205871199031199032 119862119862 = 120587120587120587120587 119862119862 = 2120587120587119903119903
Interest =principal x rate x time Sum of Measures of Interior Angles of Convex Polygon 119878119878 = 180(119899119899 minus 2) Pythagorean Theorem 1198881198882 = 1198861198862 + 1198871198872
Shape Surface Area Volume
Rectangular Prism LA = Ph
SA = Ph + 2B or SA = 2(wh + lh + lw)
V = Bh or
V = lwh
Cylinder LA = 2120587120587rh SA = 2120587120587rh + 2120587120587r2 V = 120587120587r2h
Square Pyramid NA V = 13Bh
Triangular Pyramid
NA V = 13Bh
Forms of Equations
Standard form of an equation of a line Ax + By = C Slope-intercept form of an equation of a line y = mx + b Point-slope form of an equation of a line y mdash y1 = m(x mdash x1)
Appendix E
187 2019 Alabama Course of Study Mathematics
Resources for Grades 9-12
Possible Pathways for Students Completing Grade 8 Mathematics
Before deciding on a pathway consider the following
Students have several options for high school mathematics even if they did not take accelerated mathematics in middle school The first pathway option (shaded blue) is for students who wish to earn four high school mathematics credits and do not want to take additional specialized courses However students who have the interest and motivation can still access additional specialized mathematics courses in high school by taking both Geometry with Data Analysis and Algebra I with Probability concurrently in Grade 9 These pathways are shaded yellow in the chart below Selecting this option does not exempt students from taking a mathematics course each year of high school All pathways are designed so that students take mathematics in each of the four years of high school
Students should be informed of the intended purpose of each specialized course in order to make appropriate decisions when choosing a pathway
Grade Suggested Possible Pathways
9 Geometry with Data Analysis Geometry with Data Analysis and Algebra I with Probability (concurrently)
Geometry with Data Analysis and Algebra I with Probability (concurrently)
10 Algebra I with Probability Algebra II with Statistics Algebra II with Statistics 11 Algebra II with Statistics Specialized Course Precalculus 12 Specialized Course Specialized Course (5th credit) AP Calculus (5th credit)
Required Courses Geometry with Data Analysis Algebra I with Probability Algebra II with Statistics
Specialized courses Applications of Finite Mathematics Mathematical Modeling Precalculus Specialized courses can be taken in any order after Algebra II with Statistics AP Calculus may be considered following Precalculus Extended courses such as AP Statistics and AP Computer Science may also be
considered for a credit following Algebra II with Statistics
Appendix E
188 2019 Alabama Course of Study Mathematics
Possible Pathways for Students Completing Grade 8 Accelerated Mathematics Before deciding on a pathway consider the following Students who have completed Grade 8 Accelerated Mathematics may or may not be ready to continue on an accelerated pathway The first two pathway options (shaded blue) are for students who are well prepared to continue on an accelerated pathway The last three pathway options (shaded yellow) are for students who need more experience with the content in Algebra I with Probability before moving on to Algebra II with Statistics Students may gain this experience by taking Geometry with Data Analysis and Algebra I with Probability concurrently in Grade 9 This option does not exempt students from taking a mathematics course each year of high school Thus all pathways are designed so that students take mathematics in each of the four years of high school Students should be aware of the intended purpose of each specialized course in order to make appropriate decisions when choosing a pathway
Grade Suggested Possible Pathways 9 Geometry with
Data Analysis Geometry with Data Analysis
Geometry with Data Analysis
Geometry with Data Analysis and Algebra I with Probability (concurrently)
Geometry with Data Analysis and Algebra I with Probability (concurrently)
10 Algebra II with Statistics
Algebra II with Statistics
Algebra I with Probability
Algebra II with Statistics Algebra II with Statistics
11 Specialized Course
Precalculus Algebra II with Statistics
Specialized Course Precalculus
12 Specialized Course
AP Calculus Specialized Course
Specialized Course (5th credit)
AP Calculus (5th credit)
Appendix E
189 2019 Alabama Course of Study Mathematics
The Mathematical Modeling Cycle Mathematical modeling ldquouses mathematics to answer big messy reality-based questionsrdquo (Bliss Levy Teague Giordano amp Garfunkel 2019 p 34) Modeling is a process that is often represented as a cycle where thoughts ideas and calculations can be reviewed and refined over time see figure below Mathematical modeling like real life is not composed of a series of predefined steps but must be navigated and reworked to determine the best results The use of this modeling process becomes inherently applicable to much more than mathematics When teaching students through modeling teachers equip their students to make decisions evaluate those decisions and revisit and revise their work and thus allow the student to experience the process for determining a solution that goes beyond the traditional prescribed steps Note Using models of mathematical ideas (such as manipulatives or graphs) is not the same as engaging in the Mathematical Modeling Cycle
Depiction of the Mathematical Modeling Cycle (Lai Teague amp Franklin 2019)
While aspects of mathematical modeling should be experienced at all levels of education as a way to apply the mathematics learned in school to daily life and for use as informed citizens in a global society by the time students reach the high school level they should be engaged in the full Mathematical Modeling Cycle Mathematical modeling involves problems that can be solved in a variety of ways to reach several valid solutions Mathematical modeling problems are either open-ended or open-middle type problems where students must make authentic decisions and choices in order to solve the problem Mathematical modeling is different from a traditional word problem in that it has more than one solution and involves choice To transform mathematics problems into mathematical modeling problems teachers must go beyond adding units to the variables as in traditional word problems Modeling problems must also require students to make meaning of the problem and provide students the opportunity to interpret and make decisions throughout the solution process
Appendix E
190 2019 Alabama Course of Study Mathematics
The basic modeling cycle is summarized in the diagram above It involves (1) defining the problem to be answered (2) making assumptions to simplify the situation identifying variables in the situation and selecting those that represent essential features in order to formulate a mathematical model (3) analyzing and performing operations to draw conclusions (4) assessing the model and solutions in terms of the original situation (5) refining and extending the model as needed and (6) reporting on the conclusions and the reasoning behind them The arrows among these steps suggest that one need not go through them in a set order and that one may repeat aspects of the cycle in order to improve the results obtained Choices assumptions and approximations are present throughout this cycle Teachers are encouraged to select or develop tasks using contexts that are familiar to students Teachers are also encouraged to anticipate student responses and pathways in order to support students when necessary Statistical Problem-Solving While mathematics focuses on drawing logical conclusions from a set of assumptions statistics involves understanding and analyzing the variability in a set of data This requires an adaptation of the mathematical modeling cycle into a related model of statistical problem-solving as depicted in the following diagram This cycle includes formulating a question designing a study collecting data analyzing the results interpreting and refining solutions and communicating interpretations and limitations The arrows among these steps suggest that one need not go through them in a set order and that one may repeat aspects of the cycle in order to improve the results obtained
Depiction of Statistical Problem Solving (Lai Teague amp Franklin 2019)
Appendix E
191 2019 Alabama Course of Study Mathematics
In summary both the Mathematical Modeling Cycle and Statistical Problem-Solving Cycle should be incorporated throughout the three required courses of high school mathematics including using aspects of the cycles as well as the full cycles to explore real-world contexts The specialized course Mathematical Modeling was created specifically to focus on both of these cycles in preparation for studentsrsquo future mathematical endeavors in careers and life Students will be able to experience the full mathematical modeling and statistical problem-solving cycles multiple times in varying contexts For more information on the Mathematical Modeling course see the standards for that course
Resources Bliss K Levy R Teague D Giordano F amp Garfunkel S (2019) Guidelines for Assessment and Instruction in Mathematical Modeling
Education (2nd Edition) Consortium for Mathematics and its Applications and Society for Industrial and Applied Mathematics Retrieved from httpswwwsiamorgpublicationsreportsdetailguidelines-for-assessment-and-instruction-in-mathematical-modeling-education
Lai Y Teague D amp Franklin C (2019) Process Parallels [digital image] Retrieved from httpsdrivegooglecomopenid=1lx81ZJisLiB-3MEj3RDLpih8VWBxxWZj
DRAFT
Appendix F
ALABAMA HIGH SCHOOL GRADUATION REQUIREMENTS
192 2019 Alabama Course of Study Mathematics
(Alabama Administrative Code 290-3-1-02(8) and (8)(a))
Effective for students in the ninth grade in the 2013-2014 school year all students shall earn the required credits for the Alabama High School Diploma A local board of education may establish requirements for receipt of diplomas and endorsements but any diploma or endorsement shall include the requirements of the Alabama High School Diploma The Alabama courses of study shall be followed in determining minimum required content in each discipline
COURSE REQUIREMENTS
English Language Arts
Four credits to include Credits English 9 1 English 10 1 English 11 1 English 12 1 Equivalent options may include Advanced PlacementInternational Baccalaureatepostsecondary equivalent courses
English Language Arts Total Credits 4
Mathematics
Three credits to include Credits Algebra I or its equivalent 1 Geometry or its equivalent 1 Algebra II wTrigonometry or Algebra II or its equivalent 1
One credit from Alabama Course of Study Mathematics or Career and Technical EducationAdvanced PlacementInternational Baccalaureatepostsecondary equivalent courses
1
Mathematics Total Credits 4
Science
Two credits to include Credits Biology 1 A physical science (Chemistry Physics Physical Science) 1
Two credits from Alabama Course of Study Science or Career and Technical EducationAdvanced PlacementInternational Baccalaureatepostsecondary equivalent courses 2
Science Total Credits 4
Social Studies
Four credits to include Credits World History 1 United States History I 1 United States History II 1 United States Government 05 Economics 05 Equivalent options may include Advanced PlacementInternational Baccalaureatepostsecondary equivalent courses
Social Studies Total Credits 4 Physical Education Lifelong Individualized Fitness Education (LIFE) 1 Health Education 05 Career Preparedness 1 Career and Technical Education andor Foreign Language andor Arts Education 3 Electives 25 Local boards shall offer foreign languages arts education physical education wellness education career and technical education and driver education as electives
Total Credits 24
Appendix G
193 2019 Alabama Course of Study Mathematics
GUIDELINES AND SUGGESTIONS FOR LOCAL TIME REQUIREMENTS AND HOMEWORK
Total Instructional Time The total instructional time of each school day in all schools and at all grade levels shall be not less than 6 hours or 360 minutes exclusive of lunch periods recess or time used for changing classes (Code of Alabama 1975 sect16-1-1) Suggested Time Allotments for Grades 1 - 6 The allocations below are based on considerations of a balanced educational program for Grades 1-6 Local school systems are encouraged to develop a general plan for scheduling that supports interdisciplinary instruction Remedial andor enrichment activities should be a part of the time scheduled for the specific subject area
Subject Area Grades 1-3 Grades 4-6
Language Arts 150 minutes daily 120 minutes daily
Mathematics 60 minutes daily 60 minutes daily
Science 30 minutes daily 45 minutes daily
Social Studies 30 minutes daily 45 minutes daily
Physical Education 30 minutes daily 30 minutes daily
Health 60 minutes weekly 60 minutes weekly
Technology Education (Computer Applications) 60 minutes weekly 60 minutes weekly
Character Education 10 minutes daily 10 minutes daily
Appendix G
194 2019 Alabama Course of Study Mathematics
Arts Education Dance Music Theatre Visual Arts
Daily instruction with certified arts specialists in each of the arts disciplines is the most desirable schedule However schools unable to provide daily arts instruction in each discipline are encouraged to schedule in Grades 1 through 3 two 30- to 45-minute arts instruction sessions per week and in Grades 4 through 6 a minimum of 60 minutes of instruction per week Interdisciplinary instruction within the regular classroom setting is encouraged as an alternative approach for scheduling time for arts instruction when certified arts specialists are not available
Established by the Alabama State Department of Education in accordance with Code of Alabama 1975 sect16-40-1 Established by the Alabama State Department of Education in accordance with Code of Alabama 1975 sect16-6B-2(h) Kindergarten In accordance with Alabama Administrative Code r 290-5-1-01(5) Minimum Standards for Organizing Kindergarten Programs in Alabama Schools the daily time schedule of the kindergartens shall be the same as the schedule of the elementary schools in the systems of which they are a part since kindergartens in Alabama operate as full-day programs There are no established time guidelines for individual subject areas for the kindergarten classroom The emphasis is on large blocks of time that allow children the opportunity to explore all areas of the curriculum in an unhurried manner It is suggested that the full-day kindergarten program be organized utilizing large blocks of time for large groups small groups center time lunch outdoor activities snacks transitions routines and afternoon review Individual exploration small-group interest activities interaction with peers and teachers manipulation of concrete materials and involvement in many other real-world experiences are needed to provide a balance in the kindergarten classroom Grades 7-12 One credit may be granted in Grades 9-12 for required or elective courses consisting of a minimum of 140 instructional hours or in which students demonstrate mastery of Alabama course of study content standards in one credit courses without specified instructional time (Alabama Administrative Code r 290-3-1-02 (9)(a)) In those schools where Grades 7 and 8 are housed with other elementary grades the school may choose the time requirements listed for Grades 4-6 or those listed for Grades 7-12
Appendix G
195 2019 Alabama Course of Study Mathematics
Character Education For all grades not less than 10 minutes instruction per day shall focus upon the studentsrsquo development of the following character traits courage patriotism citizenship honesty fairness respect for others kindness cooperation self-respect self-control courtesy compassion tolerance diligence generosity punctuality cleanliness cheerfulness school pride respect of the environment patience creativity sportsmanship loyalty and perseverance Homework Homework is an important component of every studentrsquos instructional program Students teachers and parents should have a clear understanding of the objectives to be accomplished through homework and the role it plays in meeting curriculum requirements Homework reflects practices that have been taught in the classroom and provides reinforcement and remediation for students It should be student-managed and the amount should be age-appropriate encouraging learning through problem-solving and practice At every grade level homework should be meaning-centered and mirror classroom activities and experiences Independent and collaborative projects that foster creativity problem-solving abilities and student responsibility are appropriate Parental support and supervision reinforce the quality of practice or product as well as skill development Each local board of education shall establish a policy on homework consistent with the Alabama State Board of Education resolution adopted February 23 1984 (Action Item F-2)
DRAFT
Bibliography
2019 Alabama Course of Study Mathematics 196
BIBLIOGRAPHY
Alabama Course of Study Mathematics Alabama State Department of Education 2009 Catalyzing Change in High School Mathematics Initiating Critical Conversations The National Council of Teachers of Mathematics 2018 Cross Christopher T et al editors Mathematics in Early Childhood Paths Toward Excellence and Equity Committee on Early Childhood
Mathematics National Research Council 2009 Gojak Linda M and Ruth Harbin Miles The Common Core Companion The Standards Decoded GR3-5 What They Say What They Mean How to Teach Them Corwin 2016
Kilpatrick Jeremy et al editors Adding It Up Helping Children Learn Mathematics Mathematics Learning Study Committee National Research Council 2001 doi10172269822
McGatha Maggie B et al Everything You Need for Mathematics Coaching Tools Plans and a Process That Works for Any Instructional Leader Corwin 2018
Principles and Standards for School Mathematics The National Council of Teachers of Mathematics 2000 Principles to Action Ensuring Mathematics Success for All The National Council of Teachers of Mathematics 2014 Revised Alabama Course of Study Mathematics Alabama State Department of Education 2016 United States Department of Education National Assessment Reviewing Board Draft Mathematics Assessment Framework for the 2025 National Assessment of Educational Progress wwwfederalregistergovdocuments201904262019-08393draft-mathematics-assessment-framework-for-the-2025-national-assessment-of-educational-progress Van de Walle John A et al Teaching Student-Centered Mathematics Developmentally Appropriate Instruction for Grades 3-5 Pearson 2018
Glossary
197 2019 Alabama Course of Study Mathematics
GLOSSARY
Absolute value The distance from a number to zero
Absolute value function See Appendix D Table 4
Acute angle An angle that measures between 0˚ and 90˚
Addend Any of the numbers added to find a sum
Addition and subtraction within 5 10 20 100 or 1000 Addition or subtraction of two whole numbers with whole number answers and with sum or minuend in the range 0-5 0-10 0-20 0-100 or 0-1000 respectively Example 8 + 2 = 10 is an addition within 10 14 ndash 5 = 9 is a subtraction within 20 and 55 ndash 18 = 37 is a subtraction within 100
Additive inverses Two numbers whose sum is 0 are additive inverses of one another Example 3
4 and minus3
4 are additive inverses of one another because 3
4+ minus3
4= 0
Adjacent angles Two angles that share a common vertex and a common side but do not share any interior points
Algorithm A process or set of rules for solving a problem
Amplitude The distance from the midline to the maximum or minimum value of a periodic function calculated as (maximum value - minimum value)2
Arc A section of a circle contained between two points
Area The measure of the interior of a two-dimensional figure (square units)
Area model A concrete model for multiplication or division made up of a rectangle The length and width represent the factors and the area represents the product Area models can also be used for multiplying and factoring polynomials and for completing the square
Arithmetic sequence A sequence in which the difference between two consecutive terms is constant
Glossary
198 2019 Alabama Course of Study Mathematics
Array A concrete model for multiplication in which items are arranged in rows and columns Each row (or column) represents the number of groups and each column (or row) represents the number of items in a group Example The array shown below represents 5 x 4 = 20 since there are 5 rows of 4 stars for a total of 20 stars It could also represent 4 x 5 = 20 since there are 4 columns of 5 stars for a total of 20 stars
Association (Data Analysis Statistics and Probability Grades 9-12) A relationship between two categorical variables in which a specific value of one variable is more likely to coincide with a specific value of another variable
Asymptote A line that a curve becomes arbitrarily close to as one of the coordinates of the curve approaches infinity
Automaticity The ability to perform mathematical operations accurately and quickly
Average See mean
Axis of symmetry A line that divides a function into two congruent parts so that points on one side of the line are a reflection of the points on the other side for all values of x f(x) = f(-x)
B (as in V=Bh) Area of the base of a three-dimensional figure
Benchmark number A number or numbers that help to estimate a value Examples 10 100 0 frac12 and 1
Bias (statistical bias) Using a sampling method that favors some outcomes over others so that it consistently overestimates or underestimates the true value
Bivariate data Set of paired values for two related variables Examples a personrsquos race and gender (both categorical) a personrsquos height and weight (both quantitative) or a personrsquos gender and height (categorical and quantitative)
Box-and-whisker plot (box plot) A method of visually displaying variation in a set of data values by using the median quartiles and extremes of the data set
Categorical data Variables with values that may be divided into groups Examples race gender educational level zip code
Categorical variable A variable whose possible values can be placed into groups and for which arithmetic (eg average) does not make sense
Glossary
199 2019 Alabama Course of Study Mathematics
Causation A change in one variable results in the change of another variable
Cavalierirsquos Principle A method for showing that two solids have the same volume by showing that areas of corresponding cross sections are equal
Center A value that represents a typical value or middle of a set of quantitative data such as mean or median
Center of a circle A point that is equidistant from all points on a circle in a plane
Chord A segment joining two points on a circle
Circle A set of points in a plane equidistant from a given point which is called the center
Circumscribed polygon A polygon whose sides are all tangent to a given circle The circle is said to be inscribed in the polygon
Closure If an operation is performed on two elements of a set the result is always an element of a set
Coefficient The numerical factor in a term that contains one or more variables Example In 2xy2 2 is the coefficient
Combination A way of selecting items from a set or collection such that the order of selection does not matter
Complementary angles Two angles whose measures have a sum of 90˚
Complex fraction A fraction AB where A andor B are fractions (where B is non-zero)
Complex number A number written in the form a + bi where a and b are real numbers and b is multiplied by the imaginary unit i
Compose To put together a number or shape using existing numbers or shapes
Composition The process of combining two functions in which one function is performed first and then its output is used as the input for the second function Conditional probability The probability of an event given that another event has occurred
Conditional relative frequency The ratio of a joint relative frequency to a related marginal relative frequency
Glossary
200 2019 Alabama Course of Study Mathematics
Confidence interval An interval combined with a probability statement that is used to express the degree of uncertainty associated with a sample statistic and that estimates where a population parameter will lie Example We are 95 confident that the mean salary of the population lies within $512 of the sample mean
Congruent figures Two plane or solid figures are congruent if one can be mapped to the other by a rigid motion (a sequence of rotations reflections and translations)
Conic section A figure formed by the intersection of a plane and a right circular cone Examples ellipse parabola or hyperbola
Conjugate An expression formed by changing the sign of the second term For numbers of the form a + bi where a and b are real numbers the conjugate is a - bi such that the product of the number and its conjugate is a2+b2
Constant A variable that has a fixed value
Constant function A function that has the same output for every input See Appendix D Table 4
Constraint A restriction on what solutions to a problem are valid
Continuous quantitative data Data items within a set that can take on any value within a range including non-integer values Example A personrsquos height or the length of a personrsquos foot
Coordinate plane (system) A two-dimensional system for locating points in the plane consisting of two number lines where the horizontal number line (x-axis) and vertical number line (y-axis) are perpendicular and intersect at a point (origin) Points are described by their relative locations on the two number lines
Correlation An association or relationship between two quantitative variables
Correlation coefficient A statistic (r) which measures the strength of the linear association between two quantitative variables Values range from -1 to 1 where 1 denotes a perfect positive relationship -1 a perfect negative relationship and 0 no relationship at all
Corresponding parts The sides angles and vertices of one figure that are mapped onto those of another figure using a geometric transformation
Counting on A strategy for finding the number of objects in a group without having to count every member of the group Example If a stack of books is known to have 8 books and 3 more books are added to the top it is not necessary to count the entire stack all over again One can find the total by counting onmdashpointing to the top book and saying ldquoeightrdquo following this with ldquonine ten eleven There are eleven books nowrdquo
Glossary
201 2019 Alabama Course of Study Mathematics
Cube root A cube root of x is the number that when multiplied by itself three times (or cubed) gives the number x Example 2 is the cube root of 8 because 23 = 222 = 8
Cubic function A polynomial function whose highest degree is 3 See Appendix D Table 4
Decimal number A quantity represented using base-10 notation using a decimal point to separate the whole number and fractional parts
Decompose To separate numbers or shapes into component or smaller parts
Denominator The divisor in a fraction or rational expression
Dependent events Two or more events in which the outcome of one is affected by the outcome(s) of the other(s)
Dependent variable A variable in an expression equation or function whose value is determined by the choice of the other variables
Descriptive statistics Values used to describe features of a univariate or bivariate quantitative data set Common statistics involve measures of center and measures of spread
Dilation A geometric transformation in which the image of each point lies along the line from a fixed center point through the given point where its distance is multiplied by a common scale factor Images of geometric figures using a dilation are similar to the given figures
Discrete quantitative data Data items within a set which can take on only a finite number of values Examples A personrsquos shoe size or rolling a die
Distribution A description of the relative number of times each possible outcome of a statistical variable occurs or will occur in a number of trials
Dividend a where a divide b = c
Divisor b where a divide b = c
Domain The set of inputs for a function or relation
Dot plot See line plot
Ellipse The set of all points in a two-dimensional plane where the sum of the distance from two distinct points (foci) is constant
Glossary
202 2019 Alabama Course of Study Mathematics
Empirical Rule A description of a normal distribution of data In a normal distribution almost all data will fall within three standard deviations of the mean Approximately 68 of the values lie within one standard deviation of the mean approximately 95 of the values lie within two standard deviations of the mean and approximately 997 lie within three standard deviations of the mean Also known as the 68-95-997 Rule
End behavior In a function the values the dependent variable approaches as the independent variable approaches either negative or positive infinity
Equation A mathematical relationship in which two expressions are equal
Equivalent expression Expressions that represent the same amount equations or inequalities that have the same solution set
Evaluate To determine or calculate the value of an expression once specific values have been substituted for each of the variables in the expression
Even function A function whose graph is symmetric with respect to the y-axis f(x) = f(-x) for all x
Event A set of possible outcomes of an experiment or study a subset of the sample space
Expanded form A multi-digit number written as a sum of single-digit multiples of powers of ten Example 643 = 600 + 40 + 3
Expected value For a random variable the weighted average of its possible values with weights given by their respective probabilities
Experiment A controlled study used to find the differences between groups subjected to different treatments
Experimental probability The number of occurrences of an event in a set of trials divided by the total number of trials Contrast to theoretical probability
Exponent The small number placed to the upper right of a base number indicating how many copies of the base number are multiplied together Example In 24 2 is the base number and 4 is the exponent
Exponential function A function in which the dependent variable is an exponent with a constant base See Appendix D Table 4
Exponential notation A general version of scientific notation in which the base does not have to be 10
Expression A mathematical phrase that combines numbers andor variables using mathematical operations Examples 3 x 6 4 + 7 x 3 8 2ℎ + 3119896119896
Extraneous solution A solution to an equation that emerges from the process of solving the problem but is not a valid solution to the original problem
Glossary
203 2019 Alabama Course of Study Mathematics
Factors of a number or expression Numbers or terms multiplied together to find a product Example a and b where a ⨉ b = c Where c is a whole number integer or polynomial a and b are often limited to whole numbers integers or polynomials respectively c is called the product
Fair share model (partitive division) A division model in which the total number of items and the number of groups is known and the number of items in each group is the unknown
Fibonacci Sequence A recurrence relation where successive terms are found by adding the two previous terms given that the first two terms are 0 and 1
Fluency The ability to use strategies andor procedures that are flexible efficient accurate and generalizable to answer mathematical questions
Fraction A number expressible in the form 119886119886119887119887 where a is a whole number and b is a positive whole number (The word fraction in these standards
always refers to a non-negative number) See also rational number
Frequency The number of cycles of a periodic function that occur within a given distance of the dependent variable the number of occurrences of a value in a distribution of discrete data
Frequency table A table that lists the frequency of each item in a distribution of discrete data In the lower grades tally marks may be used to record the number of times each item occurs
Function Relationship between two variables where each input (value of the independent variable) has a single output (value of the dependent variable)
Function notation Use of f(x) notation to define a function
Fundamental Counting Principle A way to figure out the total number of ways different events can occur (outcomes) in a probability problem If there are two independent events with m and n possible outcomes respectively then there are 119898119898 ∙ 119899119899 total possible outcomes for the two events together
Geometric sequence A sequence in which the ratio between two consecutive terms is constant
Geometric series The sums of the terms in a geometric sequence
Geometric transformation A function that maps all the points of the plane onto the plane
Greatest integer function A function that assigns each input value to the greatest integer that is less than that value See Appendix D Table 4
Glossary
204 2019 Alabama Course of Study Mathematics
Histogram A graphical display representing the frequency distribution of continuous numerical data where the data are grouped into bins Each bin represents a range of data
Hyperbola The set of all points in a two-dimensional plane where the difference of the distances from two distinct points (foci) is constant
Identity An equation that is true for all values of the variables
Identity function A function that assigns each input value to itself See Appendix D Table 4
Identity matrix A square matrix whose elements consist of ones along the diagonal (from upper right to lower left) and zeros everywhere else Multiplying any matrix by an identity matrix of the appropriate size will yield that same matrix
Identity property of 0 a + 0 = 0 + a = a for all a See Appendix D Table 1
Image A figure or set of points that results from a transformation
Imaginary number (complex number) The square root of a negative number The square root of negative 1 or radic(-1) is defined to be i See also complex number
Independence A lack of association between two categorical variables in which a specific value of one variable is equally likely to coincide with all values of the other variable
Independent events Two or more events in which the outcome of one is not affected by the outcome of the other(s)
Independent variable A variable in an expression equation or function whose value is freely chosen regardless of the value of the other quantities
Inequality A mathematical sentence that compares the order of two quantities greater than (gt) greater than or equal to (ge) less than (lt) less than or equal to (le)
Inference (statistical inference) Conclusions drawn based on data
Inferential statistics The mathematical science of using data collection and analysis to make predictions about a population based on a random sample or to draw conclusions of cause and effect based on a random assignment of treatments
Inscribed polygon A polygon whose vertices are all contained on a given circle The circle is said to be circumscribed about the polygon
Glossary
205 2019 Alabama Course of Study Mathematics
Integer Any of the natural numbers the negatives of these numbers or zero
Interquartile range A measure of variation in a set of numerical data The interquartile range is the distance between the first and third quartiles of the data set Example For the data set 1 3 6 7 10 12 14 15 22 120 the interquartile range is 15 ndash 6 = 9
Inverse function A function that ldquoundoesrdquo a given function mapping that functionrsquos outputs to its inputs
Inverse operations Operations that ldquoundordquo one another Example 5+4=9 and 9-4=5 demonstrating that subtraction is the inverse operation of addition
Irrational number A real number r such that there are no integers a and b (b ne 0) where r = a divide b (such as 120587120587)
Joint relative frequency The ratio of the frequency in a particular category and the total number of data values
Like terms Two or more terms that have the same variables and powers but possibly different coefficients Note any constant c can be written as 119888119888 ∙ 1199091199090 Thus all constants are like terms
Limit A value that a function approaches as the input approaches some number
Line plot A method of visually displaying a distribution of data values where each data value is shown as a dot or mark above a number line (also known as a dot plot)
Line segment Set of points between two endpoints A and B that lie on the line that contains A and B
Linear association A relationship between two quantitative variables that can be represented using a linear equation On a scatter plot the relationship can be represented by a line
Linear equation An equation of two linear expressions Linear equations including two variables can be represented by a line in the coordinate plane
Linear expression An expression whose terms each include at most one variable with degree one (raised to the first power) For example 2x + 7 or 3x + 4y ndash 11
Linear function A function whose output is determined by a linear expression A linear function can be represented by a line in the coordinate plane See Appendix D Table 4
Glossary
206 2019 Alabama Course of Study Mathematics
Logarithm The exponent to which a given base must be raised to yield a given value Example the logarithm of 1000 base 10 is 3 since 103=1000
Logarithmic function The inverse function of an exponential function
Magnitude of a vector The length of a vector
Marginal relative frequency The ratio of the sum of the joint relative frequency in a row or column and the total number of data values
Mass A measure of how much matter is in an object usually defined in grams
Mathematical modeling Using mathematics to solve a complicated real-world problem where there is no clear-cut method to solve the problem Note that mathematical modeling is different from using manipulatives and other representations to model mathematical concepts See Appendix E
Matrix A rectangular array of numbers or other data The dimensions of the matrix are determined by its number of rows and columns Example The dimensions of a matrix with two rows and three columns would be 2 x 3
Maximum The greatest value in a data set or the greatest possible value of an expression or function
Mean (arithmetic mean or average) A measure of center in a set of numerical data computed by adding the values in a list and then dividing by the number of values in the list the balance point For the data set x1 x2 x3 hellip xn the mean (often written 119909) = 1
119899119899sum 119909119909119894119894119899119899119894119894=1 Example For the data
set 1 3 6 7 10 12 14 15 22 120 the mean is 21
Mean absolute deviation The average distance between each value in a set of numerical data and the mean of the data set For the data set x1 x2 x3 hellip xnwith mean 119909 MAD = 1
119899119899sum |119909119909119894119894 minus 119909|119899119899119894119894=1 Example For the data set 2 3 6 7 10 12 14 15 22 120 the mean absolute deviation is 1996
Median A measure of center in a set of numerical data The median of a list of values is the number at the center of an ordered listmdashor the mean of the two numbers in the middle if there are an even number of elements Example For the data set 2 3 6 7 10 12 14 15 22 90 the median is 11
Metric system A measurement system used throughout the world that is based on units that are related by powers of 10 using a standard set of prefixes The base unit for measuring length is the meter the base unit for capacity is the liter and the base unit for mass is grams Commonly-used prefixes include milli- denoting 11000 of the base unit centi- denoting 1100 of a unit and kilo- denoting 1000 base units For example a milliliter is 11000 of a liter a centimeter is 1100 of a meter and a kilometer is 1000 meters Temperature is measured in degrees Celsius in which 0˚ C is the freezing point of water and 100˚ is the boiling point of water
Midline In the graph of a trigonometric function the horizontal line halfway between its maximum and minimum values
Glossary
207 2019 Alabama Course of Study Mathematics
Midpoint A point on a segment that is equidistant from the endpoints
Minimum The smallest value in a data set or the smallest possible value of an expression or function
Mode The value that occurs most frequently in a data set
Modular arithmetic If a and b are integers and m is a positive integer then a is said to be congruent to b modulo m if m divides a ndash b
Monomial A mathematical expression consisting of a single term
Multiple A number that is the result of multiplying a given whole number (or integer) by another whole number (or integer) Example Multiples of 5 are 0 5 10 15 20 25 30hellip
Multiplication A mathematical operation involving two factors One factor describes the number of groups or sets the other factor describes the number of items in a group or set and the result or product describes the total number of items
Multiplication and division within 100 Multiplication or division of two whole numbers with whole number answers with product or dividend in the range 0-100 Example 72 divide 8 = 9
Multiplicative inverses Two numbers whose product is 1 are multiplicative inverses of one another Example 34 and 4
3 are multiplicative inverses
of one another because 34
times 43
= 43
times 34
= 1
Natural number Whole numbers excluding zero ldquocounting numbersrdquo
Nonresponse bias Bias that occurs when individuals chosen for a sample are unable or unwilling to respond and differ in meaningful ways from those who do respond
Normal distribution A naturally occurring distribution that is symmetric about the mean bell shaped and dispersed systematically Also known as a normal curve
Number line diagram A line diagram used to represent numbers and support reasoning about them In a number line diagram for measurement quantities the interval from 0 to 1 on the diagram represents the unit of measure for the quantity
Numerator The number in a fraction that indicates the number of parts of the whole that are being considered the top number in a fraction
Obtuse angle An angle measuring more than 90˚ but less than 180˚
Glossary
208 2019 Alabama Course of Study Mathematics
Odd function A function whose graph is 180˚ rotationally symmetric about the origin f(-x) = -f(x) for all x
Open figure A shape made up of line segments with at least one line segment that isnrsquot connected to anything at one of its endpoints
Ordered pair A set of numbers (x y) where the first number (x-coordinate) shows position to the left or right of the origin (0 0) and the second number (y-coordinate) shows position above or below the origin on a coordinate plane
Outlier Values in a data set that are much smaller or larger than the rest of the values
Parabola The set of all values in a two-dimensional plane that are the same distance from a fixed point (focus) and a line (directrix)
Parallel lines Two lines in a plane that do not intersect
Parameter In statistics a numerical measure that describes a characteristic of a population In algebra parameters are quantities that influence the output or behavior of a mathematical object that are not explicitly varied but viewed as being held constant Example for 119910119910 = 119898119898119909119909 + 119887119887 m and b are parameters and x and y are variables Also the independent variable used in parametric equations
Parametric equations A set of equations used to define the coordinates of a set of points in terms of an independent variable called a parameter
Partial product A part of the product in a multiplication calculation usually based on place value and the distributive property
Partial quotient A part of the quotient in a division calculation usually based on place value and the distributive property
Pattern Set of numbers or objects that can be described by a specific rule
Percent rate of change A rate of change expressed as a percent Example If a population grows from 50 to 55 in a year it grew by 550
= 10 per year
Perimeter The distance around a figure or object
Period The length of the dependent variable in a periodic function for a complete cycle to occur
Permutation An arrangement of all the members of a set or collection into some sequence or order or if the set is already ordered the reordering of its elements a process called permuting
Perpendicular lines Two lines or line segments that intersect to form a right angle (90˚)
Glossary
209 2019 Alabama Course of Study Mathematics
Piecewise function A function in which more than one formula is used to define the output over different intervals (pieces) of the domain
Pigeonhole Principle A concept used in problem-solving which states that if there are more pigeons than pigeonholes then at least one pigeonhole has at least two pigeons in it
Plane figure A two-dimensional shape
Point An exact position or location on a plane surface or in space
Polar equations An equation defining an algebraic curve expressed in polar coordinates r and θ where r is the distance from the origin and θ is the angle of rotation from the x-axis
Polygon Any closed plane shape formed by line segments (also called sides of the polygon) where each endpoint of a side (also called a vertex of the polygon) is shared by exactly two sides
Polyhedron A three-dimensional figure formed by polygons (also called faces of the polyhedron) where each side of a face (also called an edge of the polyhedron) is common to exactly two faces The vertices of the polygons (also called vertices of the polyhedron) may be shared by multiple edges
Polynomial A mathematical expression containing real numbers and variables related only by the operations of addition subtraction multiplication and non-negative integer exponents The standard form of a polynomial is written as a sum of terms each of which is simplified to be the product of a constant andor variables raised to whole number exponents greater than 0 Example 3x2 + 4xy3 + 9 is a polynomial written in standard form
Population The entire group of objects people or events about which information is sought in a statistical study
Population distribution The distribution of all values of a variable for all individuals in the population
Power Exponent the number of times a base number is multiplied by itself
Preimage A figure or set of points that is an input to a transformation
Prime number A number that has exactly two factors 1 and itself
Prism Polyhedron with two congruent and parallel faces that are polygons the rest of the faces are parallelograms
Probability A number between 0 and 1 used to quantify likelihood
Glossary
210 2019 Alabama Course of Study Mathematics
Probability distribution The set of possible values of a random variable with a probability assigned to each
Probability model A model used to assign probabilities to outcomes of a chance process by examining the nature of the process The set of all outcomes is called the sample space and their probabilities sum to 1 See also uniform probability model
Product The result when two or more numbers or terms are multiplied together
Properties Characteristics such as color size or height statements that are always true for some class of objects
Proportional Term describing two quantities that are related by a constant ratio whose value is called the constant of proportionality
Pythagorean Theorem The sum of the squares of the lengths of the legs of a right triangle is equal to the square of the length of the hypotenuse 1198861198862 + 1198871198872 = 1198881198882 where a and b are the lengths of the legs and c is the length of the hypotenuse
Quadrant One of the four parts into which a coordinate plane is divided by the x-axis and y-axis
Quadratic equation An equation which equates a quadratic expression to another quadratic expression linear expression or constant
Quadratic expression A polynomial expression in one variable where the largest exponent of the variable is 2 when written in standard form
Quadratic formula x = minus119887119887plusmnradic1198871198872minus41198861198861198861198862119886119886
where x is the solution of an equation of the form ax2 + bx + c = 0 and 119886119886 ne 0
Quadratic function A function in which each input value is related to its output value by a quadratic expression See Appendix D Table 4
Qualitative variable See categorical variable
Quantitative literacy The ability to use mathematical and statistical reasoning to address practical civic professional recreational and cultural issues
Quantitative variable A variable whose possible values are numerical and represent a measurable quantity Examples a personrsquos weight or age
Quartile A grouping of data points Three points in a ranked set of data divide the data into four equal groups where each group contains a quarter of the data points The three points include the median of the full set of data (Q2) the median of the set of values above the median of the full set (Q3) and the median of the set of values below the median of the full set (Q1)
Quotient c where a divide b = c
Glossary
211 2019 Alabama Course of Study Mathematics
Radian The radian measure of an angle is equal to the ratio of the length of the subtended arc of the angle to the radius
Radical equation An equation in which at least one variable expression is under a radical
Random sample A method of selection in which members of the statistical population are chosen by chance with each member of the population having an equal probability of being chosen
Random variable A statistical variable whose values are the result of a random process
Range The maximum value minus the minimum value in a data set The range of a function is the set of outputs from the domain
Ratio The multiplicative comparison of two non-zero quantities Represented as ab ab and a to b
Rational expression A quotient of two polynomials with a non-zero denominator
Rational number A number that can be expressed as a fraction in the form of 119886119886119887119887 where 119887119887 ne 0
Ray A set of points on a line that begins at a point (called the endpoint) and extends infinitely in one direction
Real number The set of all possible values on a number line that is the set of all rational and irrational numbers Each real number can be represented by a decimal number either finite or infinite
Reciprocal The multiplicative inverse of a number
Reciprocal function A function defined by the reciprocal of a linear function See Appendix D Table 4
Remainder Amount remaining when one whole number is unevenly divided by another whole number
Repeating decimal A decimal number in which a string of one or more digits following the decimal point repeats indefinitely Example 2137232323hellip is a repeating decimal since the string ldquo23rdquo repeats
Response bias Bias that results from problems in the measurement process Examples leading questions social desirability
Right angle An angle that measures exactly 90˚
Rigid motion A geometric transformation of points consisting of a sequence of one or more translations reflections andor rotations which preserve distances and angle measures
Glossary
212 2019 Alabama Course of Study Mathematics
Round To use mathematical rules to alter a number to one that is less exact but easier to use in mental computation The number is kept close to its original value
Sample A subset of data selected from a statistical population by a defined procedure
Sample space All possible outcomes of an event
Sample survey A study that obtains data from a subset of a population to estimate population parameters
Sampling bias The partiality that occurs when a sample statistic does not accurately reflect the true value of the parameter in the population
Sampling distribution A distribution of values taken by a statistic in all possible samples of the same size from the same population
Scalar Numerical values or quantities that are fully described by magnitude alone a number multiplied by each element of a vector or matrix
Scale (multiplication) To compare the size of a product to the size of one factor on the basis of the size of the other factor
Example Compare the area of these rectangles When one dimension is doubled the area (A) is doubled
10 in 5 in
A = 50 in2
5 in 5 in
A= 25 in2
Scale factor The common factor by which distances of points from a given center in a dilation are multiplied
Scatter plot A graph in the coordinate plane representing a set of bivariate data Example the heights and weights of a group of people could be displayed on a scatter plot where the heights are the x-coordinates of the points and the weights for the y-coordinates
Scientific notation A way of writing very large or very small numbers using a number between 1 and 10 multiplied by a power of 10
Glossary
213 2019 Alabama Course of Study Mathematics
Shape of distribution (Statistics and Probability Grades 9-12) A description of a distribution Examples number of peaks symmetry skewness or uniformity
Similar figures Two plane or solid figures which can be obtained from each other by a similarity motion (a sequence of dilations rotations reflections andor translations) Congruent figures are similar with a scale factor of 100
Similarity motion A geometric transformation of points consisting of a sequence of one or more dilations translations reflections andor rotations Similarity motions preserve angle measure and change lengths proportionally The constant ratio comparing side lengths is called the scale factor
Simulation The process of using a mathematical model to recreate real phenomenon often repeatedly so that the likelihood of various outcomes can be more accurately estimated
Simultaneous equations See system of equations
Skewed Term which describes a distribution of data that is not symmetrical about its mean
Slope (rate of change) The ratio of vertical change to horizontal change the ratio of change in an independent variable compared to change in the dependent variable
Solid figure A three-dimensional object
Solution A value which makes an equation or inequality true
Solution to a system of equations A solution that is common to each of the equations in the system
Square root A square root of x is the number that when multiplied by itself gives the number x Example 5 is the square root of 25 because 55=25
Square root function A function in which the output of the function is found by taking the square root of the input value preceded or followed by addition subtraction or multiplication of the value by one or more constants See Appendix D Table 4
Square unit The area of a square with side lengths of 1 unit used as a unit of measure for area
Standard algorithm A generally accepted method used to perform a particular mathematical computation
Glossary
214 2019 Alabama Course of Study Mathematics
Standard deviation A measurement of dispersion that measures how far each number in the data set is from the mean It is the square root of the
variance divided by the number of cases For the data set x1 x2 x3 hellip xn with mean 119909 SD = 1119899119899sum (119909119909119894119894 minus 119909)2119899119899119894119894=1 If the data set is a sample of a
population SD = 1119899119899minus1
sum (119909119909119894119894 minus 119909)2119899119899119894119894=1
Statistic A characteristic of a sample used to estimate the value of a population parameter
Statistically significant An observed event is considered statistically significant when in the presence of randomness the observed results are not likely due to chance alone
Stem-and-leaf plot A graphical display of quantitative data that contains two columns separated by a vertical line Each value is split into a stem and a leaf the stem being the first digit(s) and the leaf being the last digit The stems are typically given in the left column and the leaves are given in order to the right
Step function A discontinuous piecewise defined function in which each piece is a horizontal line segment or a point Example greatest integer function
Strategy A plan or approach to find an answer or solve a problem
Subject (Data Analysis Statistics and Probability Grades 9-12) An individual to which treatments are applied within a statistical experiment
Sum The result of quantities added together
Supplementary angles Two angles whose measures have a sum of 180˚
Survey A study that obtains data from a subset of a population to draw conclusions
Symmetry A quality a figure has when the figure is mapped onto itself by a rigid motion in which the points of the figure are not all mapped to themselves Figures that have symmetry are said to be symmetric and the rigid motion is called a symmetry of the figure Example equilateral triangles have a rotational symmetry of 120˚ since each vertex of an equilateral triangle will be mapped to another vertex when rotated 120˚ about the center of the triangle Thus equilateral triangles are said to be rotationally symmetric
System of equations A set of two or more equations that has a common set of solutions Solving the system means finding those common solutions
Glossary
215 2019 Alabama Course of Study Mathematics
Tape diagram A visual model that uses rectangles of uniform size to illustrate and solve a variety of problems including number relationship and ratio problems
Term A single number or variable or numbers and variables multiplied together
Terminating decimal A decimal number which can be expressed in a finite number of digits a decimal that ends
Theorem A geometric statement that can be proven to be true based on definitions axioms and previously proven theorems
Theoretical probability The number of ways that an event can occur divided by the total number of outcomes from the sample space Contrast to experimental probability
Transitivity principle for indirect measurement A measurement principle stating that if the length of object A is greater than the length of object B and the length of object B is greater than the length of object C then the length of object A is greater than the length of object C This principle applies to measurement of other quantities as well
Transversal A line that intersects two or more lines in a plane
Treatment A condition or set of conditions that is applied to one group in an experiment
Treatment group (Statistics and Probability Grades 9-12) The group of subjects to which the same treatment is assigned in an experiment
Tree diagram In probability a diagram that shows all possible outcomes of an event
Triangular numbers The set of numbers (1 3 6 10 15 hellip) that are obtained from the summation of natural numbers that can be arranged in an equilateral triangle
Trigonometric function A function that relates the angles and sides of a right triangle whose input is an angle and whose output is a designated ratio of sides Trigonometric functions include sine cosine tangent secant cosecant and cotangent
Truth table A table used to display all possible truth values of logical expressions
Glossary
216 2019 Alabama Course of Study Mathematics
Two-way table A table listing the frequencies of two categorical variables whose values have been paired
Uniform probability model A probability model which assigns equal probability to all outcomes See also probability model
Unit circle A circle with the equation 1199091199092 + 1199101199102 = 1 It has a radius of 1 unit
Unit rate In a proportional relationship the number of units of the first quantity that correspond to one unit of the second quantity Example My rate of travel was 30 miles in one hour (mph)
Univariate data A data set that is described by one variable (one type of data)
Variable A symbol used to represent a quantity which may have a fixed value or have changing values In statistics a variable is a characteristic of members of a population that can be measured (quantitative) or counted (categorical) Examples The height of a person is a quantitative variable while eye color is a categorical variable
Variability A measure of the spread of a data set Examples interquartile range mean absolute deviation standard deviation
Variance A measure of dispersion expressed in square units that considers how far each number in a data set is from its mean calculated by finding the sum of the square of the distance of each value from the mean Example For the data set x1 x2 x3 hellip xn with mean 119909 the variance = sum (119909119909119894119894 minus 119909)2119899119899119894119894=1
Vector A quantity with magnitude and direction in the plane or in space It can be defined by an ordered pair or triple of real numbers
Vertex The common endpoint of two or more rays or line segments Plural vertices
Vertex form The equation describing a quadratic equation using the vertex (maximum or minimum point) of its graph which is a parabola If (h k) is the vertex of the graph represented by an equation then the vertex form for that equation will be f(x) = a(x ndash h)2 + k where a is a non-zero constant
Vertical angles Two nonadjacent angles formed by a pair of intersecting lines
Visual fraction model A method of showing fractions Examples tape diagram number line diagram area model
Volume The measure of the amount of space inside of a solid figure such as a cube ball cylinder or pyramid expressed in cubic units
Whole numbers The numbers 0 1 2 3 hellip without any decimal or fractional parts
Glossary
217 2019 Alabama Course of Study Mathematics
x-intercept The x-coordinate of the ordered pair where a graph crosses the x-axis where y = 0
y-intercept The y-coordinate of the ordered pair where a graph crosses the y-axis where x = 0
Zero matrix A matrix consisting of all zeros Any matrix added to a zero matrix of matching dimension will yield itself
Zero of a function A value of the independent variable where the value of the function equals 0
Zero property The product of any number and zero is zero