Embed Size (px)
Citation preview

2019-2020 State Policy Report: Dropout Prevention and Student
Engagement
Submitted to: Office of the Governor
Colorado State Board of Education Colorado House Education Committee Colorado Senate Education Committee
This report was prepared pursuant to C.R.S. 22-14-111 and covers the 2019-2020 school year, the following staff from the Colorado Department of Education’s Office of Student Engagement and Dropout Prevention:
Angelica Kim, M.A.
Research Consultant
Juliana Rosa, Ph.D. Research and Evaluation Consultant
Ashley Idrees, Ed.D.
Director [email protected]
May 2021
Division of Student Pathways
Office of Student Engagement and Dropout Prevention 201 E. Colfax Avenue, Denver, CO 80203

2019-2020 Legislative Report
Table of Contents
Overview 1
Four-Year Graduation and Completion Rates 2 Extended-Year Graduation and Completion Rates 3 Graduation and Completion Rates by Instructional Program Services Type 4 Graduation and Completion Rates by Race, Ethnicity, and Gender 9 Additional Outcomes 13 Dropout Rates 13 Dropout Rates by Instructional Program Services Type 16 Dropout Rates by Race, Gender, and Ethnicity 17 District Overview 18 COVID-19 Impact to Graduation, Completion, and Dropout Rates 20 Student Re-engagement 21 Student Engagement 22 Office of Student Engagement and Dropout Prevention Priorities 24 Response to COVID-19 29 State Priorities 30 Conclusion 31 Appendices 32 Endnotes 37

2019-2020 Legislative Report
- 1 -
Overview Earning a high school credential is directly correlated to lifelong positive outcomes that include but are not limited to, lower unemployment rates, livable wage earnings, homeownership, and healthy economic growth.1 Increases in lifetime earnings and annual state and local tax revenue are estimated at $230,000 per high school graduate.2
State statistics show that Colorado is making progress in increasing high school completion and keeping more students in school. The four-year graduation rate for the Class of 2020 was 81.9 percent, a 0.8 percentage point increase since the previous year and a 9.5 percentage point increase since 2010.
While most Colorado students finished high school within four years of entering ninth grade, other students needed more time in high school to meet local graduation requirements and pursue pathways to postsecondary and workforce readiness. Extended year rates for students taking five, six and seven years to graduate also have steadily improved.
The dropout rate significantly fell to an all-time low from 2.0 percent in the 2018-2019 academic year to 1.8 percent in the 2019-2020 academic year. Since the 2009-2010 school year, the dropout rate for Colorado has decreased by 1.1 percentage points.
Not all students are fully benefiting from the state’s educational gains. Historically underserved students, specifically those from economically challenged communities, students of color, and students with disabilities continue to fall short of their academic potential and are missing the skills to compete with their peers in the workforce.3 Graduation, completion, and dropout rates for these students continue to be lower than for their peers across the nation.4 Colorado statistics show that minority male students, students of color, youth experiencing homelessness, and those in foster care experience disproportionate rates of graduation, dropout, and school disciplinary actions, which negatively impacts school engagement.5 Students express that negative school experiences lead to dis-engaging from the public education system.6 Colorado must address persistent educational disparities in order to accelerate progress in high school completion and educational outcomes. To prevent students from dis-engaging, a whole-systems approach is needed. The Colorado Dropout Prevention Framework is an evidence-based framework designed to create an ecosystem for institutional change. The framework outlines how to accelerate progress at the school and district level and provides a foundation for rigorous and relevant coursework, teacher preparedness and instruction, and development of systems to support students who need more attention to reach their full potential. Lastly, the current and future impacts on grantees and the students as a direct result of COVID-19 are discussed in the present report. While it is not possible to predict precisely how the pandemic will impact student high school completion, it is rational to predict that the impact from COVID-19 will have long-lasting effects on graduation, completion, and dropout rates. In order to gain better understanding of the unique experiences of grantees in the 2019-2020 school year, grantees were asked to discuss the challenges they faced in the school year as a result of the pandemic and the strategies they used to help alleviate some of the experienced struggles. Reporting Requirements State law requires the Office of Student Engagement and Dropout Prevention (formally the Office of Dropout Prevention and Student Re-engagement) to complete an annual report on reducing the student dropout rate, increasing the high school graduation and completion rates, and improving student engagement. This report

2019-2020 Legislative Report
- 2 -
was prepared in accordance with state statute, section 22-14-111, C.R.S, for the 2019-2020 school year. Data included in this report were pulled from the 2019-2020 Student End-of-Year Snapshot, Student October Snapshot, and the School Discipline and Attendance collection. See Appendix A for relevant definitions of terms included in this report. Four-Year Graduation and Completion Rates
The Colorado Department of Education (CDE) collects and publicly reports graduation, completion, and still-enrolled rates (available at Graduation Statistics). See Appendix A for a definition of graduation rates and completion rates. Class of 2020 Graduation Rate The Class of 2020 achieved a four-year graduation rate of 81.9 percent. Out of the 67,450 students counted in the 2020 graduating cohort, 55,220 students met their local graduation requirements to receive a high school diploma within four years. Compared to the previous year, Colorado’s four-year graduation rate increased 0.8 percentage points. The 2019-2020 rate set a new record for the highest rate since 2010, which is the year CDE began reporting an adjusted cohort rate (9.5 percentage point increase). See Chart 1 for the four-year graduation rates from 2010 to 2020.
Note: In the 2015-16 school year, CDE automated the process districts use to remove duplicate records, which improved the accuracy of graduation and completion rates. In prior years, it was possible for students to remain
81.9% 2020 FOUR-YEAR
GRADUATION RATE
72.4%
73.9%
75.4%
76.9% 77.3% 77.3%
78.9% 79.0%
80.7%* 81.1%81.9%
2010 2011 2012 2013 2014 2015 2016 2017 2018 2019 2020
Gra
duat
ion
Rate
s
Class of...
Chart 1: Colorado 4-year Graduation Rates from 2010 to 2020
Source: CDE Office of Data Services and Office of Student Engagement and Dropout Prevention *Note: Starting in 2018, graduation rates included ASCENT and P-TECH students who were still enrolled but met graduation

2019-2020 Legislative Report
- 3 -
in the graduation base of a school or district even though they had later enrolled elsewhere in Colorado. This enhancement prevented such duplications in the 2015-16 calculation and future years. Class of 2020 Completion Rate The completion rate represents a cohort-based rate which includes the number of students who graduate plus those who receive a high school equivalency diploma or other designation of high school completion. Like the graduation rate, the completion rate is calculated as a percent of those who were in membership over the previous four-year period (i.e., from grades 9 to 12) and could have graduated or completed in the currently reported school year. The Class of 2020 achieved a four-year completion rate of 83.4 percent. Out of the 67,450 students counted in the 2020 graduating cohort, 56,251 students who completed high school includes the number of individuals who graduated and those who received a high school equivalency diploma or other designation of high school completion. Extended-Year Graduation and Completion Rates On average, more than half of students in a class cohort who did not receive a diploma or high school equivalency within four years of entering high school are counted as still-enrolled. Still-enrolled students have an opportunity to complete their high school education within five, six, or seven years of entering ninth grade. Like the four-year rate, extended rates reported in 2019-2020 are higher than those reported in 2018-2019. A close-up look at the extended-year graduation rates from the Class of 2010 to the Class of 2017 show, when afforded more time, more students graduate - an average of 7.4 percentage points difference from the four-year rate to the seven-year rate. Additionally, a total of 9.4 percent (6,341 students) of students in the Class of 2020 remain enrolled and have the opportunity to graduate or complete in five, six or seven years from entering ninth grade. For example, the five-year graduation rate has increased by the data shown in Table 1: Extended-Year Graduation Rates from 2010 to 2020 provide support that extended time to graduation and completion requirements, improving the number of students who graduate annually.
Table 1: Extended-Year Graduation Rates from 2010 to 2020
Class of
4-Year Rate 5-Year Rate 6-Year Rate 7-Year Rate
Graduation Completion Graduation Completion Graduation Completion Graduation Completion
2010 72.4 75.8 77.1 81.9 78.5 84.3 79.4 85.8 2011 73.9 76.8 78.7 82.9 80.1 85.4 80.9 86.4 2012 75.4 78.2 80.1 84.2 81.2 85.8 82.2 86.7 2013 76.9 79.6 81.2 84.6 82.5 86.0 84.2 87.8 2014 77.3 79.5 81.7 84.3 84.3 87.1 85.3 88.3 2015 77.3 78.8 83.3 85.4 84.9 87.5 85.6 88.4 2016 78.9 80.3 84.1 86.1 85.6 88.0 86.4 89.1 2017 79.0 80.8 84.2 86.5 85.7 88.3 86.4 89.2 2018 80.7 82.5 84.9 87.2 86.2 88.8 Available 2020-2021 2019 81.1 82.9 85.1 87.3 Available 2020-2021 Available 2021-2022 2020 81.9 83.4 Available 2020-2021 Available 2021-2022 Available 2022-2023
Source: Colorado Department of Education, Data Services and Office of Student Engagement and Dropout Prevention

2019-2020 Legislative Report
- 4 -
Graduation and Completion Rates by Instructional Program Services Type As in recent years, these data continue to show a graduation gap between the overall state rate and rates for most Instructional Program Services Type (IPST) student groups, which includes economically disadvantaged, English learners, gifted and talented, homeless, migrant students, and students with disabilities. Students with disabilities, youth experiencing homelessness, and those in foster care have lower four-year and extended graduation and completion rates compared to their peers. Foster care youth represent the lowest graduation and completion rates in the IPST category. The graduation rate for foster care youth in the Class of 2020 was 30.5 percent and the completion rate was 29.5 percent. When compared to the state graduation and completion rates (81.9 and 83.4 percent), foster care youth have a 51.4 percentage point difference in graduation rate and a 53.9 percentage point difference in completion rate for the Class of 2020. Compared to 2018-2019, the Class of 2020 had an increase in graduation across all IPST categories. See Chart 2 for the Statewide Four-year Graduation and Completion Rates by Institutional Program Service Type for the Classes of 2019 and 2020.
81.1
%
70.9
%
68.6
%
94.0
%
55.5
% 68.8
%
59.2
%
26.6
%
81.9
%
72.3
%
70.2
%
94.2
%
56.7
% 71.7
%
61.8
%
30.5
%
82.9
%
73.1
%
69.6
%
95.3
%
58.6
% 70.5
%
61.3
%
38.5
%
83.4
%
74.1
%
71.0
%
95.5
%
59.3
% 72.8
%
63.9
%
29.5
%State Economically
DisadvantagedEnglish
LearnersGifted andTalented
Homeless Migrant Disabilities Foster Care
Gra
duat
ion
and
Com
plet
ion
Rate
s
Instructional Program Service Type
Chart 2: Colorado Statewide 4-Year Graduation and Completion Rates by Instructional Program Service Type:Class of 2019 and 2020 Comparison
2019 Graduation Rate 2020 Graduation Rate 2019 Completion Rate 2020 Completion Rate
Source: CDE Office of Data Services and Office of Student Engagement and Dropout Prevention *Note: Starting in 2018, graduation rates included ASCENT and P-TECH students who were still enrolled but met graduation requirements. Rates for students in foster care are produced in accordance with a data-sharing agreement with the Colorado Department of Human Services. The numbers of students in each student group are not mutually exclusive, as a study may be classified in more than one category.

2019-2020 Legislative Report
- 5 -
When looking at extended graduation and completion rates for the Class of 2017, the highest graduation rates are among gifted and talented students and economically disadvantaged students, with seven-year graduation rates rising to 96.2 percent and 78.6 percent. The extended rates show that the highest gains from four-year to seven-year rates were for students with disabilities with a 19.5 percent increase for graduation rates and 20.9 percentage point increase for completion rates. Following that, migrant students (13.9 percentage points for graduation and completion), and English learners (13.0 percentage points for graduation; 13.9 percentage points for completion) also indicate high percent differences from the four-year graduation rates to the seven-year graduation rates. In reviewing the four-year and seven-year graduation and completion rates for the Class of 2017, it can be seen that if youth are provided with an opportunity to continue pursuing their education, then the graduation and completion rates increase. For the Class of 2017, the four-year graduation rate was 23.6 percent, and the completion rate was 33.6 percent. The seven-year graduation rate was 33.3 percent (9.0 percentage point difference), and the completion rate rose to 51.4 percent (17.8 percent point difference). In conclusion, it appears that when given the opportunity to continue their education, many students are able to take that opportunity and meet graduation or completion requirements. Economically Disadvantaged Students
● The four-year graduation and completion rates showed that 72.3 percent and 74.1 percent of economically disadvantaged students in the Class of 2020 finished high school by receiving a diploma, high school equivalency, or certificate of completion. This represents a 1.4 and 1.0 percentage point increase compared to their Class of 2019 cohort.
● The highest rate of high school graduation and completion for this student group were the seven-year rates (78.6 percent and 82.2 percent, respectively) for the Class of 2017.
● For the Class of 2017, the seven-year graduation and completion rates increased by 10.1 percentage and 11.7 percentage points from the four-year rates.
See Table 2 for the extended-year graduation and completion rates of economically disadvantaged students.
Table 2: Extended-Year Graduation and Completion Rates of Economically Disadvantaged Students
Class of
4-Year Rate 5-Year Rate 6-Year Rate 7-Year Rate
Graduation Completion Graduation Completion Graduation Completion Graduation Completion
2015 65.5 67.2 74.0 76.5 76.4 79.5 77.5 80.9 2016 67.8 69.3 75.0 77.4 77.2 80.2 78.4 81.8 2017 68.5 70.5 75.5 78.4 77.6 81.0 78.6 82.2 2018 70.7 72.8 76.4 79.2 78.3 81.6 Available 2020-2021 2019 70.9 73.1 76.3 79.1 Available 2020-2021 Available 2021-2022 2020 72.3 74.1 Available 2020-2021 Available 2021-2022 Available 2022-2023
Source: Colorado Department of Education, Data Services and Office of Student Engagement and Dropout Prevention

2019-2020 Legislative Report
- 6 -
English Learners ● The four-year graduation and completion rates showed that 70.2 percent and 71.0 percent of English
Language Learner students in the Class of 2020 finished high school by graduating, receiving a diploma, high school equivalency, or certificate of completion. This represents a 1.6 and 1.4 percentage point increase compared to their Class of 2019 cohort.
● The highest rate of high school graduation and completion for this student group were the seven-year rates (77.6 percent and 79.2 percent, respectively) for the Class of 2017.
● For the Class of 2017, the seven-year graduation and completion rates increased by 13.0 percentage and 13.9 percentage points from the four-year rates.
See Table 3 for the extended-year graduation and completion rates of English learners.
Table 3: Extended-Year Graduation and Completion Rates of English Learners
Class of
4-Year Rate 5-Year Rate 6-Year Rate 7-Year Rate
Graduation Completion Graduation Completion Graduation Completion Graduation Completion
2015 61.1 61.7 72.2 73.2 75.0 76.4 76.1 77.7 2016 61.4 62.0 71.8 72.8 74.6 76.0 76.0 77.7 2017 64.6 65.3 73.9 75.1 76.6 78.0 77.6 79.2 2018 67.0 67.8 74.0 75.3 76.6 78.3 Available 2020-2021 2019 68.6 69.6 75.5 76.7 Available 2020-2021 Available 2021-2022 2020 70.2 71.0 Available 2020-2021 Available 2021-2022 Available 2022-2023
Source: Colorado Department of Education, Data Services and Office of Student Engagement and Dropout Prevention Gifted and Talented Students
● The four-year graduation and completion rates showed that 94.2 percent and 95.5 percent of gifted and talented students in the Class of 2020 finished high school by graduating, receiving a diploma, high school equivalency, or certificate of completion. This represents a 0.2 percentage point increase compared to their Class of 2019 cohort.
● The highest rate of high school graduation and completion for this student group were the seven-year rates (96.2 percent and 98.1 percent, respectively) for the Class of 2017.
● For the Class of 2017, the seven-year graduation and completion rates increased by 3.2 percentage and 3.8 percentage points from the four-year rates.
See Table 4 for the extended-year graduation and completion rates of gifted and talented students.
Table 4: Extended-Year Graduation and Completion Rates of Gifted and Talented Students
Class of
4-Year Rate 5-Year Rate 6-Year Rate 7-Year Rate
Graduation Completion Graduation Completion Graduation Completion Graduation Completion
2015 92.2 93.4 94.8 96.3 95.2 97.0 95.4 97.4 2016 93.2 94.5 95.5 97.2 95.9 97.7 96.0 97.9 2017 93.0 94.3 95.6 97.3 96.1 97.9 96.2 98.1 2018 93.7 95.1 95.4 97.1 95.7 97.5 Available 2020-2021 2019 94.0 95.3 95.4 97.1 Available 2020-2021 Available 2021-2022 2020 94.2 95.5 Available 2020-2021 Available 2021-2022 Available 2022-2023
Source: Colorado Department of Education, Data Services and Office of Student Engagement and Dropout Prevention

2019-2020 Legislative Report
- 7 -
McKinney-Vento Homeless Education Students • The four-year graduation and completion rates showed that 56.7 percent and 59.3 percent of McKinney-
Vento Homeless Education students in the Class of 2020 finished high school by graduating, receiving a diploma, high school equivalency, or certificate of completion. This represents a 1.2 and 0.7 percentage point increase compared to their Class of 2019 cohort.
• The highest rate of high school graduation and completion for this student group were the seven-year rates (66.3 percent and 71.3 percent, respectively) for the Class of 2017.
• For the Class of 2017, the seven-year graduation and completion rates increased by 10.5 percentage and 13.3 percentage points from the four-year rates.
See Table 5 for the extended-year graduation and completion rates of homeless students.
Table 5: Extended-Year Graduation and Completion Rates of Homeless Students
Class of
4-Year Rate 5-Year Rate 6-Year Rate 7-Year Rate
Graduation Completion Graduation Completion Graduation Completion Graduation Completion
2015 52.8 54.8 61.2 64.4 63.9 68.1 65.3 70.0 2016 53.2 54.9 60.1 63.1 63.1 66.9 64.5 69.1 2017 55.8 58.4 62.7 66.6 65.3 70.0 66.3 71.3 2018 55.4 58.1 62.0 65.7 64.4 68.9 Available 2020-2021 2019 55.5 58.6 61.5 65.0 Available 2020-2021 Available 2021-2022 2020 56.7 59.3 Available 2020-2021 Available 2021-2022 Available 2022-2023
Source: Colorado Department of Education, Data Services and Office of Student Engagement and Dropout Prevention Migrant Students
● The four-year graduation and completion rates showed that 71.7 percent and 72.8 percent of migrant students in the Class of 2020 finished high school by graduating, receiving a diploma, high school equivalency, or certificate of completion. This represents a 2.9 and 2.3 percentage point increase compared to their Class of 2019 cohort.
● The highest rate of high school graduation and completion for this student group were the seven-year rates (80.1 percent and 82.1 percent, respectively) for the Class of 2015.
● For the Class of 2017, the seven-year graduation and completion rates increased by 13.9 percentage points from the four-year graduation and completion rates.
See Table 6 for the extended-year graduation and completion rates of migrant students.
Table 6: Extended-Year Graduation and Completion Rates of Migrant Students
Class of
4-Year Rate 5-Year Rate 6-Year Rate 7-Year Rate
Graduation Completion Graduation Completion Graduation Completion Graduation Completion
2015 67.9 68.9 77.3 78.9 79.4 81.4 80.1 82.1 2016 62.8 63.2 69.7 70.0 73.2 73.9 75.0 75.6 2017 61.8 63.4 71.9 73.5 74.3 75.9 75.7 77.3 2018 66.9 67.2 70.3 70.6 73.0 73.3 Available 2020-2021 2019 68.8 70.5 73.9 75.8 Available 2020-2021 Available 2021-2022 2020 71.7 72.8 Available 2020-2021 Available 2021-2022 Available 2022-2023
Source: Colorado Department of Education, Data Services and Office of Student Engagement and Dropout Prevention

2019-2020 Legislative Report
- 8 -
Students with Disabilities ● The four-year graduation and completion rates showed that 61.8 percent and 63.9 percent of students
with disabilities in the Class of 2020 finished high school by graduating, receiving a diploma, high school equivalency, or certificate of completion. This represents a 2.6 percentage point increase for both graduation and completion rates compared to their Class of 2019 cohort.
● The highest rate of high school graduation and completion for this student group were the seven-year rates (76.3 percent and 79.2 percent, respectively) for the Class of 2016.
● For the Class of 2017, the seven-year graduation and completion rates increased by 19.5 percentage and 20.9 percentage points from the four-year rates.
See Table 7 for the extended-year graduation and completion rates of students with disabilities.
Students in Foster Care
● The four-year graduation and completion rates showed that 30.5 percent and 29.5 percent of students in foster care in the Class of 2020 finished high school by graduating, receiving a diploma, high school equivalency, or certificate of completion. This represents a 3.9 percentage point increase in graduation compared to their Class of 2019 cohort. However, the current four-year completion rate for this student group decreased (9.0 percentage point) compared to their Class of 2019 cohort.
● The highest rate of high school graduation and completion for this student group were the seven-year rates (44.9 percent and 55.0 percent, respectively) for the Class of 2016.
● For the Class of 2017, the seven-year graduation and completion rates increased by 9.7 and 17.8 percentage points from the four-year graduation and completion rates.
See Table 8 for the extended-year graduation and completion rates of students in foster care.
Table 8: Extended-Year Graduation and Completion Rates of Students in Foster Care
Class of
4-Year Rate 5-Year Rate 6-Year Rate 7-Year Rate
Graduation Completion Graduation Completion Graduation Completion Graduation Completion
2015 29.3 35.9 37.6 46.9 40.3 51.0 41.4 53.6 2016 33.2 37.4 40.2 46.4 42.5 51.1 44.9 55.0 2017 23.6 33.6 29.6 43.8 32.0 48.8 33.3 51.4 2018 24.8 37.8 31.3 48.4 33.0 51.5 Available 2020-2021 2019 26.6 38.5 33.4 47.3 Available 2020-2021 Available 2021-2022 2020 30.5 29.5 Available 2020-2021 Available 2021-2022 Available 2022-2023
Table 7: Extended-Year Graduation and Completion Rates of Students with Disabilities
Class of
4-Year Rate 5-Year Rate 6-Year Rate 7-Year Rate
Graduation Completion Graduation Completion Graduation Completion Graduation Completion
2015 53.8 55.0 64.8 66.8 70.0 72.6 74.1 77.2 2016 57.2 58.4 66.3 68.0 71.7 74.1 76.5 79.2 2017 56.8 58.3 66.2 68.4 71.9 74.5 76.3 79.2 2018 58.6 60.3 67.1 69.4 71.9 75.1 Available 2020-2021 2019 59.2 61.3 67.8 70.8 Available 2020-2021 Available 2021-2022 2020 61.8 63.9 Available 2020-2021 Available 2021-2022 Available 2022-2023
Source: Colorado Department of Education, Data Services and Office of Student Engagement and Dropout Prevention

2019-2020 Legislative Report
- 9 -
Source: Colorado Department of Education, Data Services and Office of Student Engagement and Dropout Prevention. The foster care education data is made available through a data-sharing agreement between the Colorado Department of Education and the Colorado Department of Human Services. Foster care education data by county of the school district is available at www.cde.state.co.us/dropoutprevention/rad_coloradolegislaturereports
Graduation and Completion Rates by Race, Ethnicity, and Gender The four-year graduation and completion rates varied by race, ethnicity, and gender. As in recent years, the data continues to show a graduation gap between the overall state rate and rates for most students of color (SOC). When comparing the Class of 2020 to the Class of 2019 4-year graduation rates, there were gains seen with both male and female SOC, but the gap still persists. When comparing male SOC (12.0 percent) versus white males (10.8 percent), there was a 1.2 percentage point decrease; and when comparing female SOC (8.0 percent) versus white female students (7.1 percent), there was a 0.9 percentage point decrease. Additionally, the four-year graduation rate for SOC for 2019-2020 was 77.1 percent, an increase of 1.6 percentage points from the previous year. See Chart 3 for the statewide four-year graduation and completion rates by gender and race/ethnicity for the classes of 2019 and 2020.
The graduation rates by race and ethnicity indicate that the four-year graduation rate was the highest among Asian students (91.2%) and lowest among American Indian or Alaska Native (66.6%), which represents a gap of 24.6 percentage points. Additionally, the greatest gains were seen for Black students from 2019 to 2020, with an
81.1
%
71.1
% 83.1
%
80.1
% 88.8
%
81.9
%
72.7
% 83.5
%
81.7
%
88.8
%
82.9
%
73.0
% 85.5
%
81.3
% 90.3
%
83.4
%
74.3
% 85.8
%
82.6
%
90.0
%
State Male Students ofColor
White Male Students Female Students ofColor
White FemaleStudents
Gra
duat
ion
and
Com
plet
ion
Rate
s
Gender and Race/Ethnicity
Chart 3: Colorado Statewide 4-Year Graduation and Completion Rates by Gender and Race/Ethnicity:
Class of 2019 and 2020 Comparision
2019 Graduation rate 2020 Graduation Rate 2019 Completion Rate 2020 Completion Rate
Source: CDE Office of Data Services and Office of Student Engagement and Dropout Prevention *Note: Starting in 2018, graduation rates included ASCENT and P-TECH students who were still enrolled but met graduation requirements.

2019-2020 Legislative Report
- 10 -
increase of 2.2 percentage points. However, the four-year graduation rate for Native Hawaiian or Other Pacific Islander decreased by 3.2 percentage points. When looking at extended graduation rates for the Class of 2017, the highest graduation rates are among white females and white males, with seven-year graduation rates rising to 91.8 percent and 87.3 percent, respectively. Additionally, extended rates show the highest gains from four-year to seven-year among male SOC with a 10.0 percentage point increase and female SOC with an 8.9 percentage point increase. However, the graduation gap between students of color and white students continues, with the largest gap being between white female students and male SOC with a gap of 18.1 percentage points for the four-year graduation rate and a 13.1 percentage gap for the seven-year rate. Male SOC continue to experience the lowest rates of graduation among their peers. The widest graduation rate gap was of 18 percentage points, between the high four-year graduation rate of 86.8 percent for white female students and the low four-year rate of 68.7 percent for male SOC. See Chart 4 for the Colorado Statewide 4-year and extended-year graduation rates by gender and race/ethnicity for the Class of 2017.
Source: CDE Office of Data Services and Office of Student Engagement and Dropout Prevention *Note: Starting in 2018, graduation rates included ASCENT and P-TECH students who were still enrolled but met graduation requirements.
79.0%
84.2%85.7% 86.4%
68.7%
75.7%
77.7%78.7%
77.7%
83.8%
85.8%
86.6%
81.0%
85.3%86.6%
87.3%86.8%
90.4%91.4% 91.8%
4-year Rate 5-year Rate 6-year Rate 7-year Rate
Gra
duat
ion
Rate
s
Extended Rates
Chart 4: Colorado Statewide 4-Year and Extended-Year Graduation Rates by Gender and Race/Ethnicity for the Class of 2017
State Male Students of Color Female Students of ColorWhite Male Students White Female Students

2019-2020 Legislative Report
- 11 -
More broadly, when looking at how graduation and completion rates have improved over time for the last five cohorts of students (2016 to 2020), there is evidence that more time in school resulted in an increased number of students that graduate or complete school. The data available for these cohorts indicate that female and male SOC especially benefit from extended-year opportunities and programming. Male Students of Color
● The four-year graduation and completion rates showed that 72.7 percent and 74.3 percent of male students of color in the Class of 2020 finished high school by graduating, receiving a diploma, high school equivalency, or certificate of completion. This represents a 1.6 and 1.3 percentage point increase compared to their Class of 2019 cohort.
● The highest rate of high school graduation and completion for this student group were the seven-year rates (78.7 percent and 81.8 percent, respectively) for the Class of 2017.
● For the Class of 2017, the seven-year graduation and completion rates increased by 10.0 percentage and 11.4 percentage points from the four-year rates.
See Table 9 for the extended-year graduation and completion rates of male students of color.
Table 9: Extended-Year Graduation and Completion Rates of Male Students of Color
Class of
4-Year Rate 5-Year Rate 6-Year Rate 7-Year Rate
Graduation Completion Graduation Completion Graduation Completion Graduation Completion
2015 65.4 66.8 73.6 75.9 75.9 78.8 76.8 80.0 2016 67.2 68.6 74.4 76.5 76.4 79.1 77.6 80.6 2017 68.7 70.4 75.7 78.2 77.7 80.8 78.7 81.8 2018 70.5 72.4 76.1 78.7 77.9 80.9 Available 2020-2021 2019 71.1 73.0 76.6 79.0 Available 2020-2021 Available 2021-2022 2020 72.7 74.3 Available 2020-2021 Available 2021-2022 Available 2022-2023
Source: Colorado Department of Education, Data Services and Office of Student Engagement and Dropout Prevention White Male Students
● The four-year graduation and completion rates showed that 83.5 percent and 85.8 percent of white male students in the Class of 2020 finished high school by graduating, receiving a diploma, high school equivalency, or certificate of completion. This represents a 0.4 and 0.3 percentage point increase compared to their Class of 2019 cohort.
● The highest rate of high school graduation and completion for this student group were the seven-year rates (87.9 percent and 91.3 percent, respectively) for the Class of 2016.
● For the Class of 2017, the seven-year graduation and completion rates increased by 6.3 percentage and 7.4 percentage points from the four-year rates.
See Table 10 for the extended-year graduation and completion rates of white male students.

2019-2020 Legislative Report
- 12 -
Table 10: Extended-Year Graduation and Completion Rates of White Male Students
Class of
4-Year Rate 5-Year Rate 6-Year Rate 7-Year Rate
Graduation Completion Graduation Completion Graduation Completion Graduation Completion
2015 79.7 81.9 84.6 87.4 85.8 89.1 86.4 90.0 2016 81.4 83.2 85.9 88.6 87.1 90.3 87.9 91.3 2017 81.0 83.6 85.3 88.5 86.6 90.2 87.3 91.0 2018 82.5 85.0 86.2 89.3 87.3 90.8 Available 2020-2021 2019 83.1 85.5 86.5 89.5 Available 2020-2021 Available 2021-2022 2020 83.5 85.8 Available 2020-2021 Available 2021-2022 Available 2022-2023
Source: Colorado Department of Education, Data Services and Office of Student Engagement and Dropout Prevention Female Students of Color
● The four-year graduation and completion rates showed that 81.7 percent and 82.6 percent of female students of color in the Class of 2020 finished high school by graduating, receiving a diploma, high school equivalency, or certificate of completion. This represents a 1.6 and 1.3 percentage point increase compared to their Class of 2019 cohort.
● The highest rate of high school graduation and completion for this student group were the seven-year rates (86.6 percent and 88.6 percent, respectively) for the Class of 2017.
● For the Class of 2017, the seven-year graduation and completion rates increased by 8.9 percentage and 9.8 percentage points from the four-year rates.
See Table 11 for the extended-year graduation and completion rates of female students of color.
Table 11: Extended-Year Graduation and Completion Rates of Female Students of Color
Class of
4-Year Rate 5-Year Rate 6-Year Rate 7-Year Rate
Graduation Completion Graduation Completion Graduation Completion Graduation Completion
2015 75.3 76.1 83.0 84.3 85.0 86.7 85.9 87.9 2016 76.7 77.5 83.2 84.6 85.1 86.8 86.0 88.0 2017 77.7 78.8 83.8 85.2 85.8 87.6 86.6 88.6 2018 80.2 81.2 84.8 86.3 86.7 88.3 Available 2020-2021 2019 80.1 81.3 84.7 86.2 Available 2020-2021 Available 2021-2022 2020 81.7 82.6 Available 2020-2021 Available 2021-2022 Available 2022-2023
Source: Colorado Department of Education, Data Services and Office of Student Engagement and Dropout Prevention White Female Students
● The four-year graduation and completion rates showed that 88.8 percent and 90.0 percent of white female students in the Class of 2020 finished high school by graduating, receiving a diploma, high school equivalency, or certificate of completion. This represents a 0-percentage point increase for the graduation rate and a 0.3 decrease in the completion rates compared to their Class of 2019 cohort.
● The highest rate of high school graduation and completion for this student group were the seven-year rates (92.4 percent and 94.5 percent, respectively) for the Class of 2016.
● For the Class of 2017, the seven-year graduation and completion rates increased by 5.0 percentage and 5.7 percentage points from the four-year rates.
See Table 12 for the extended-year graduation and completion rates of white female students.

2019-2020 Legislative Report
- 13 -
Table 12: Extended-Year Graduation and Completion Rates of White Female Students from 2020
Class of
4-Year Rate 5-Year Rate 6-Year Rate 7-Year Rate
Graduation Completion Graduation Completion Graduation Completion Graduation Completion
2015 85.6 86.9 89.6 91.5 90.7 92.9 91.3 93.6 2016 87.5 88.8 90.8 92.5 91.8 93.7 92.4 94.5 2017 86.8 88.2 90.4 92.2 91.4 93.4 91.8 93.9 2018 88.3 89.8 91.2 93.0 92.1 94.1 Available 2020-21 2019 88.8 90.3 91.6 93.3 Available 2020-21 Available 2021-22 2020 88.8 90.0 Available 2020-2021 Available 2021-2022 Available 2022-2023
Source: Colorado Department of Education, Data Services and Office of Student Engagement and Dropout Prevention
Additional Outcomes Of the 67,450 students in the Class of 2020 cohort, 16.6 percent (11,199 students) did not complete high school with their graduating cohort or attain a high school credential (either a diploma or high school equivalency credential).
● 9.4 percent of the students in the cohort (6,341 students) were still enrolled at the end of the school year. Still-enrolled students may persist to complete high school in a later year and those who graduate will be counted in the extended-year graduation rates. Those who attain a high school credential (either a diploma or high school equivalency credential) will be counted in the extended-year completion rates.
● 6.1 percent of the students in the cohort (4,095 students) were considered unrecovered dropouts who dropped out of high school at some point. The focus of dropout recovery programs should be outreach to these out-of-school youth and re-engaging them in their education.
● Additional student outcomes for the remaining students include illness/injury, death, exit to detention center, expulsion without return to school, transfer to a facility school or other program, transfer to homeschool, or exit to prepare for high school equivalency.
Dropout Rates CDE collects and publicly reports on dropout rates (available at Dropout Statistics). See Appendix A for a definition of dropout rate. More Colorado students are staying in school and persisting in their education as evidenced by steady improvement in the annual dropout rate. The dropout rate for the 2019-2020 school year was 1.8 percent. Out of the 468,196 students enrolled in grades seven to 12 in Colorado, 8,561 students dropped out of school during the 2019-2020 school year. Compared to the previous year, Colorado’s dropout rate decreased 0.2 percentage points, which indicates that 716 fewer students dropped out in the 2019-2020 school year than during the 2018-2019 school year. This
1.8%
2018-2019 DROPOUT RATE
2019-2020 Legislative Report
- 14 -
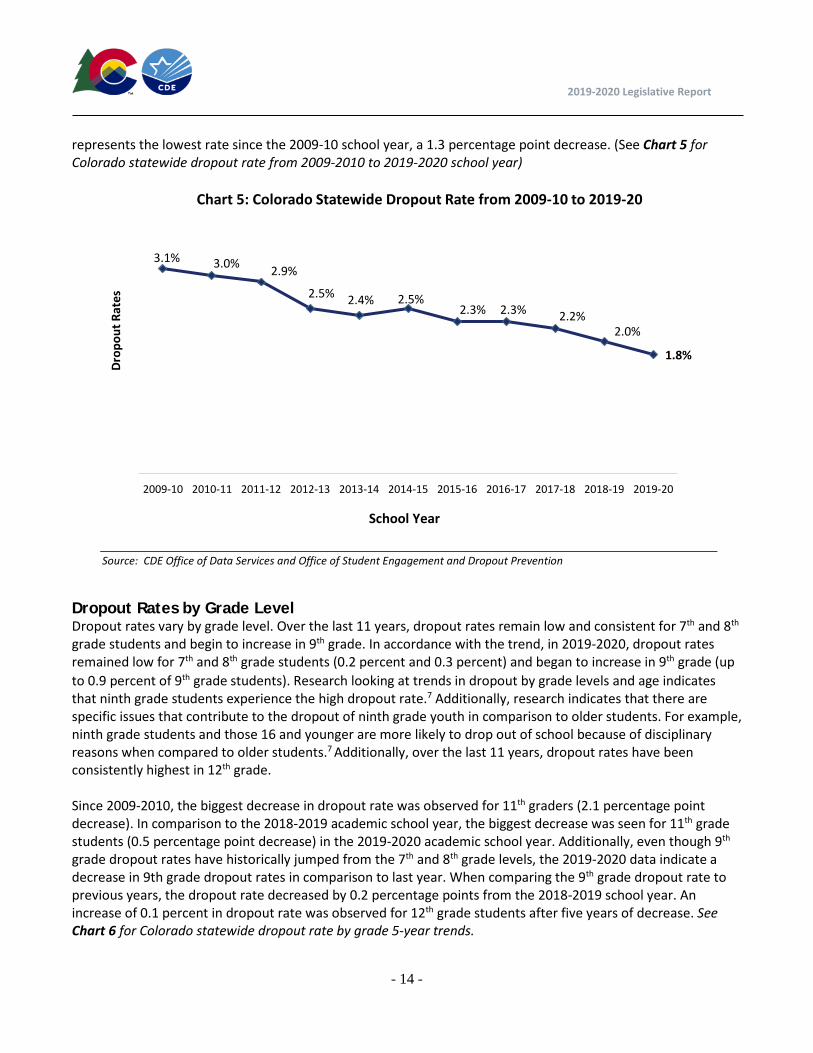
represents the lowest rate since the 2009-10 school year, a 1.3 percentage point decrease. (See Chart 5 for Colorado statewide dropout rate from 2009-2010 to 2019-2020 school year)
Dropout Rates by Grade Level Dropout rates vary by grade level. Over the last 11 years, dropout rates remain low and consistent for 7th and 8th grade students and begin to increase in 9th grade. In accordance with the trend, in 2019-2020, dropout rates remained low for 7th and 8th grade students (0.2 percent and 0.3 percent) and began to increase in 9th grade (up to 0.9 percent of 9th grade students). Research looking at trends in dropout by grade levels and age indicates that ninth grade students experience the high dropout rate.7 Additionally, research indicates that there are specific issues that contribute to the dropout of ninth grade youth in comparison to older students. For example, ninth grade students and those 16 and younger are more likely to drop out of school because of disciplinary reasons when compared to older students.7 Additionally, over the last 11 years, dropout rates have been consistently highest in 12th grade. Since 2009-2010, the biggest decrease in dropout rate was observed for 11th graders (2.1 percentage point decrease). In comparison to the 2018-2019 academic school year, the biggest decrease was seen for 11th grade students (0.5 percentage point decrease) in the 2019-2020 academic school year. Additionally, even though 9th grade dropout rates have historically jumped from the 7th and 8th grade levels, the 2019-2020 data indicate a decrease in 9th grade dropout rates in comparison to last year. When comparing the 9th grade dropout rate to previous years, the dropout rate decreased by 0.2 percentage points from the 2018-2019 school year. An increase of 0.1 percent in dropout rate was observed for 12th grade students after five years of decrease. See Chart 6 for Colorado statewide dropout rate by grade 5-year trends.
3.1% 3.0% 2.9%
2.5% 2.4% 2.5%2.3% 2.3% 2.2%
2.0%
1.8%
2009-10 2010-11 2011-12 2012-13 2013-14 2014-15 2015-16 2016-17 2017-18 2018-19 2019-20
Drop
out R
ates
School Year
Chart 5: Colorado Statewide Dropout Rate from 2009-10 to 2019-20
Source: CDE Office of Data Services and Office of Student Engagement and Dropout Prevention

2019-2020 Legislative Report
- 15 -
Rates for Alternative Education Campuses (AECs) Alternative Education Campuses (AECs) commonly serve Colorado youth who previously dropped out of school or are at high-risk for dropping out. In the 2019-2020 school year, there were 91 AECs across Colorado serving more than 30,000 students. These schools are designated with AEC status by meeting the statutory requirements and receiving approval by the State Board of Education. More information on AECs is available at: CDE Alternative Education Campuses. In Colorado, AECs actively seek to provide dedicated educators and special supports to re-engage and re-connect students to viable pathways to high school completion and postsecondary and workforce readiness. At least 90 percent of students in AECs are considered at “high-risk” of dropping out. Each AEC has a specialized mission and serves special needs or at-risk populations. An analysis of AECs shows that the current AEC dropout rate was 15.1 percent (4,679 student dropouts), which represents 54.6 percent of all student dropouts in Colorado. The dropout rate for AECs was 13.3 percentage points higher than the overall state rate (1.8 percent). In response to the COVID-19 pandemic, no new AEC data was collected in the 2019-2020 school year, pursuant to the suspension outlined in 1 CCR 301-37.
0.3% 0.3% 0.3%0.2%
0.3% 0.3%
1.1% 1.2% 1.2% 1.1%0.9%
1.7% 1.7% 1.7% 1.5%
1.1%
3.4% 3.3% 3.1%2.7%
2.2%
7.3%7.0%
6.6%
6.0% 6.1%
2015-16 2016-17 2017-18 2018-19 2019-20
Drop
out R
ates
Year
Chart 6: Colorado Statewide Dropout Rate by Grade Level from 2015-16 to 2019-20
7th Grade 8th Grade 9th Grade 10th Grade 11th Grade 12th Grade
Source: CDE Office of Data Services and Office of Student Engagement and Dropout Prevention.

2019-2020 Legislative Report
- 16 -
Dropout Rates by Instructional Program Services Type Dropout rates varied by IPST student groups. The highest dropout rates were seen for homeless students (4.9 percent for the 2019-2020 academic school year) and students in foster care (6.4 percent for the 2019-2020 academic school year). The majority of the IPST groups made improvements from the 2018-2019 academic school year. The greatest improvement was seen among migrant students with the dropout rate decreasing by 0.8 percentage points from the previous year. Additionally, homeless, and foster care youth also saw significant reduction in dropout rates from the previous year (0.5 percentage point decreases for both groups). See Appendix B for a historical overview of dropout rates across these student groups. See Chart 7 for Colorado statewide dropout rate by instructional program service type for 2018-2019 and 2019-2020 school year.
Source: CDE Office of Data Services and Office of Student Engagement and Dropout Prevention
2.0%
0.4%
2.3%2.8%
3.7% 3.9%
5.4%
6.9%
1.8%
0.4%
2.1%2.6%
3.4% 3.1%
4.9%
6.4%
State Gifted-Talented Disabilities EconomicallyDisadvantaged
EnglishLearners
Migrant Homeless Foster
Drop
out R
ates
Instructional Program Service Type
Chart 7: Colorado Statewide Dropout Rates by Instructional Program Service Type for 2018-19 and 2019-20 School Year
2018-19 2019-20

2019-2020 Legislative Report
- 17 -
Dropout Rates by Race, Gender, and Ethnicity Dropout rates varied by race, gender, and ethnicity student groups. White female students and white male students had the lowest dropout rates in 2019-2020, 0.9 percent and 1.3 percent, respectively. The highest dropout rates were seen for male students of color (3.0 percent) and female students of color (2.1 percent) for the 2019-2020 academic school year. The majority of the student groups made improvement from the 2018-2019 academic school year. While male and female students of color had the highest dropout rates for the 2019-2020 academic school year, they also had the greatest gains. Both groups decreased in the number of dropouts by 0.3 percentage points. The greatest gains in dropout rates in the last five years have been among male students of color, with a 1.1 percentage point decrease from the 2014-2015 to the 2019-2020 school year. However, male students of color continue to experience the highest dropout rates compared to their peers. Overtime, the average dropout rate for these students has been about 2.0 percentage points higher than the overall state rate and about 2.1 percentage points higher than for their white female peers. See Appendix B for a historical overview of dropout rates across these student groups. See Chart 8 for Colorado statewide dropout rates from 2015-2016 to 2019-2020 school year by gender and race/ethnicity.
2.3% 2.3% 2.2%2.0%
1.8%
3.9%3.7% 3.6%
3.3%3.0%
1.8% 1.7% 1.6%1.4% 1.3%
2.8% 2.8%2.6%
2.4%2.1%
1.2% 1.3% 1.2%
0.9% 0.9%
2015-16 2016-17 2017-18 2018-19 2019-20
Drop
out R
ates
School Year
Chart 8: Colorado Statewide Dropout Rates from 2015-16 to 2019-20 School Year by Gender and Race/Ethnicity
State Male Students of Color White Male Students
Female Students of Color White Female Students
Source: CDE Office of Data Services and Office of Student Engagement and Dropout Prevention

2019-2020 Legislative Report
- 18 -
District Overview Overview of Four-Year Graduation and Completion Rates In Colorado, locally elected school boards set graduation requirements for their school districts, which means expectations for earning a diploma may differ from district to district. Beginning with the Class of 2021, students will graduate under locally determined requirements that meet or exceed the Colorado Graduation Guidelines adopted by the State Board of Education. For more information, see: CDE Graduation Guidelines.
Out of 178 Colorado school districts and BOCES, 76.4 percent reached an overall four-year graduation rate at or above the state rate of 81.9 percent. Thirty-two districts achieved a four-year graduation rate of 100 percent for the Class of 2020, and 46.6 percent of districts reported an increase in four-year graduation rate from the 2018-2019 school year.
When looking more specifically at district rates by settings (e.g., outlying towns, Denver metro, outlying cities, remote, and urban-suburban) in the state of Colorado, there are varying four-year graduation rates. For outlying towns, the graduation rate for the 2019-2020 school year was at 85.2 percent. For the Denver Metro area, the 2019-2020 graduation rate was at 84.0 percent. For outlying city settings, the 2019-2020 graduation rate was at 82.8 percent. For remote settings, the 2019-2020 graduation rate was at 79.7 percent. For urban-suburban settings, the 2019-2020 graduation rate was at 77.9 percent.
Note: The Education Accountability Act of 2009 (SB 09-163) and HB18-1355 authorizes the Colorado Department of Education to conduct an annual review of the performance of public schools and districts in the state and to make recommendations to the State Board of Education concerning the type of school improvement plan to be implemented in each school and determine the accreditation category for each district. The State Board of

2019-2020 Legislative Report
- 19 -
Education established a state expectation for all districts to meet or exceed a graduation rate of 85 percent for either the four-year or an extended-year graduation rate. For more information, see: CDE State Accountability. Colorado school districts are making progress towards this goal, with a growing number of districts meeting or exceeding graduation rates at 85 percent. In response to the evolving conditions under COVID-19, an executive order was issued in the Spring of 2020 and later codified by the General Assembly in H.B. 20-1418 to pause the state accountability frameworks to enable schools and districts to focus on providing alternative learning opportunities for students during this time.
Overview of Dropout Rates
Out of 178 Colorado school districts and BOCES, 83.1 percent reported a dropout rate at or below the overall state rate of 1.8 percent. Fifty-seven districts reported no dropouts in 2019-2020, and 40.4 percent of districts reported a decrease in drop out from the 2018-2019 academic school year.
When looking more specifically at district rates by settings (e.g., outlying towns, Denver metro, outlying cities, remote, and urban-suburban) in the state of Colorado, there are varying dropout rates. For outlying cities, the dropout rate for the 2019-2020 school year was at 1.9 percent. For the Denver Metro area, the 2019-2020 dropout rate was at 1.6 percent. For outlying town settings, the 2019-2020 dropout rate was at 1.7 percent. For remote settings, the 2019-2020 dropout rate was at 0.9 percent. For urban-suburban settings, the 2019-2020 dropout rate was at 2.3 percent.

2019-2020 Legislative Report
- 20 -
COVID-19 Impact to Graduation, Completion, and Dropout Rates The COVID-19 pandemic has impacted all aspects of education nationwide and in Colorado. When discussing the impact that the COVID-19 pandemic has had on graduation, completion, and dropout rates, the data highlighted above indicates that pandemic did not have a significant impact on the graduation, completion, and dropout rates for the 2019-2020 school year. The minimal immediate effects of the pandemic on graduation, completion, and dropout rates may be associated with the following reasons. Districts in Colorado indicated that the majority of students had already completed or were on track to complete their high school graduation requirements when the pandemic caused schools to close in mid-March. One national study found that worsening employment opportunities due to COVID-19 impacted completion rates in 2020. The largest increases in high school completion rates were observed in areas of higher employment losses - students had lower prospects for employment; therefore, they were more likely to stay in school.8
Additionally, results from the Spring and Fall Needs Inventories conducted by the Colorado Education Initiative in partnership with CDE showed that Colorado school districts implemented and continue to implement several best practices for preventing student dropout, such as: utilizing multiple outreach strategies to keep students engaged; prioritizing building and maintaining relationships with students during transitions; offering flexibility in learning environments and instructional models (if possible) with the option to transition between models to fit student needs; and creating engaging and meaningful learning opportunities for students, including robust work-based learning and other experiential learning opportunities for students.9,10 For more information, see: Colorado School District Community Needs Inventory. In relation to how the pandemic has impacted specific student groups, there is an indication that the pandemic has disproportionately impacted some student groups over others.11 More specifically, the four-year, five-year, six-year, and seven-year graduation and completion rates increased for almost every student group and for students who take part in different instructional programs (e.g., students learning English, students who qualify for free- or reduced-price lunch, students on individualized education plans, students who experience homelessness, etc.). While their four-year and extended graduation rates improved (from 26.6% in 2018-19 to 30.5% in 2019-20), the students in the foster care continue to have the lowest overall four-year graduation rate, largely due to increased mobility as a result of their living situation.12
When looking forward to the 2020-2021 school year, it is not possible to predict precisely how the pandemic will affect student high school completion; however, it is reasonable to expect that the pandemic will have long-lasting effects on graduation, completion, and dropout rates. With the challenges of student engagement in the virtual space, it can be anticipated that rates may regress somewhat in the 2020-2021 school year, and that this trend may continue for the next four years as currently enrolled students’ progress through their high school careers. We will continue to encourage schools to offer students the time they need to meet high school graduation requirements, even if that takes more than four years. A recent national survey conducted by America’s Promise found that about a quarter of high school students surveyed felt less connected to classmates, staff, and school putting them at higher risk for dropping out.13 Available international projections predict that between 7 to 9 million children across the country may not return to school.14, 15

2019-2020 Legislative Report
- 21 -
Student Re-engagement On average, about 30 percent of students who dropped out will re-enroll in school. In 2019-2020, 30.3 percent of students (2,767students) who dropped out in the previous school year (2018-2019), re-enrolled in school. Per historical trends, over half of these re-enrolled students will stay in school or complete high school, which represents a re-engagement rate of between 50 to 60 percent. In 2019-2020, 69.2 percent of students who dropped out the previous school year (2018-2019) graduated, completed school, transferred to a high school equivalency program, or persisted in school. Historically, the remaining students are at higher risk of dropping out again, which is referred to as dropout recidivism. In 2019-2020, 27.7 percent of students (766 students) of the 2,767 students who had dropped out in 2018-2019 and re-enrolled in school in 2019-2020 dropped out again. Decreasing dropout recidivism is key to improving disaggregated dropout rates. Effective re-engagement requires identifying and understanding the challenges and circumstances of out-of-school youth, and reconnecting them to high-quality educational opportunities, postsecondary education, and careers.16
Colorado’s policies regarding dropout prevention support schools and school districts recovering students who dropped out by counting multiple dropout events in an academic year only once toward the school or school district’s dropout rate. However, students who have a dropout event over several academic years are counted as dropped out in each year.

2019-2020 Legislative Report
- 22 -
Student Engagement Research has shown that there are three main indicators associated with dropout known as the ABCs of disengagement. These include attendance, behavior, and course performance.17
School Attendance The 2019-2020 attendance data reported to CDE represents attendance from the start of school to the start of remote-learning for districts due to COVID-19 (March 2020). State attendance data trends show that some Colorado students are missing school and may be on a path toward dropping out. The attendance rate in the 2019-2020 school year was 92.8 percent and the truancy rate was 2.7 percent. Chronically absent students include K-12 students who are absent for any reason (e.g., illness, suspension, or the need to care for a family member), regardless of whether absences are excused or unexcused; 22.6 percent of all students enrolled in 2019-2020 (212,642 students) were reported chronically absent from school. To be considered habitually truant, a student who is at least the age of six years on or before August 1 of the year in question and is under the age of 17 years, is reported as having four unexcused absences from public school in any one month, or 10 unexcused absences from public school during any school year. In 2019-2020, 87,065 students were reported as habitually truant. The statistics provided below represent proportions of habitually truant students.
● 22.9 percent (19,915 students) had four unexcused absences in one month. ● 15.6 percent (13,566 students) had 10 unexcused absences in the school year. ● 61.5 percent (53,584 students) met both conditions.
Note: The Colorado Department of Education collects school and district level attendance data. Student level attendance data was collected for the first time in 2019-2020; however, trends by student groups could not be determined since it was the first year of the collection. More information on student attendance can be found at CDE Attendance Information. In 2019-2020, districts were instructed to report on attendance data until the school transitioned to remote learning due to COVID. Behavior Incidents The Colorado legislature has shifted school discipline policy from strict, mandatory punishment to supportive school discipline through the passage of a series of bills that led to the end of "zero tolerance.” In 2011, the passage of House Bill 11-1032 encouraged the use of restorative practices as a school’s first consideration to remediate several types of offenses. In 2012, House Bill 12-1345 eliminated the statutory mandate to expel students for drugs, weapons (except firearms), serious assaults, and robbery, as well as encouraged alternatives to exclusionary discipline. The implementation of these bills coincides with a reduction of expulsions from 2,163 incidents in the 2009-10 school year to 653 incidents in 2019-2020, reaching an all-time low in expulsion rates for the state of Colorado. In 2019-2020, 60,723 students were disciplined (e.g., classroom removal, in-school suspension, out-of-school suspension, expulsion), 12,488 less students disciplined than in the previous school year. This represents 6.6 percent of the students enrolled in 2019-2020.

2019-2020 Legislative Report
- 23 -
Source: CDE Office of Data Services and Office of Student Engagement and Dropout Prevention Source: CDE Office of Data Services and Office of Student Engagement and Dropout Prevention S CDE Offi f D t S i d Offi f St d t E t d D t P ti
Patterns in discipline have varied across race/ethnicity and gender. Male students were disciplined at a higher rate in 2019-2020 (70.3 percent of students disciplined) than female students (29.7 percent of students disciplined). CDE conducted an analysis to better understand how many students within each race/ethnicity were disciplined out of the total number of enrolled students. A closer look at the discipline rate by student enrollment and race/ethnicity shows a disproportionately higher rate of discipline among minority students when compared to discipline rates for their peers. See Chart 9 for the five-year trend of students disciplined by race/ethnicity.
More information about evidence-based supportive disciplinary methods that serve as alternatives to suspensions and expulsions can be found in the CDE Dropout Prevention Best Practices Guide.
Note: The Colorado Department of Education collects school and district level discipline data. Student level attendance data was collected for the first time in 2019-2020; however, trends by student groups could not be determined since it was the first year of the collection. More information on student discipline can be found at CDE Suspension/Expulsion Statistics. In 2019-2020, districts were instructed to report on discipline data until the transition to remote learning due to COVID. Note: The Colorado Department of Education does collect data on course performance. See Assessment Data and Results for data on academic achievement.
2015-2016 2016-2017 2017-2018 2018-2019 2019-2020American Indian 11.8% 12.3% 13.4% 14.0% 11.1%Asian 2.2% 2.7% 3.1% 3.3% 2.5%Black 14.1% 15.6% 16.0% 15.7% 12.4%Hispanic 8.0% 9.0% 9.6% 9.8% 8.2%White 4.9% 5.7% 6.5% 6.3% 5.2%Native Hawaiian/Pacific Islander 7.8% 8.6% 8.2% 8.6% 6.9%Two or More Races 6.9% 8.5% 9.9% 9.3% 7.5%
0.0%
2.0%
4.0%
6.0%
8.0%
10.0%
12.0%
14.0%
16.0%
18.0%
Stud
ents
Dis
cipl
ined
Chart 9: Five Year Trend of Students Disciplined by Race/Ethnicity
Source: CDE Office of Data Services and Office of Student Engagement and Dropout Prevention

2019-2020 Legislative Report
- 24 -
Office of Student Engagement and Dropout Prevention Priorities The Office of Student Engagement and Dropout Prevention (SEDP; previously the Office of Dropout Prevention and Student Re-engagement) was launched in 2009 and was created to expand efforts in reducing the dropout rate, increasing the graduation rate and advancing credential attainment. This effort is authorized by statute, in section 22-14-101, C.R.S., and builds on the state’s commitment to ensure graduation and school success for all students and re-engaging out of school youth. The main responsibilities of the office are to: (1) analyze student data pertaining to dropout, completion rates, truancy, suspension and expulsion rates, discipline incidence and student growth; (2) coordinate efforts across CDE and lead initiatives to address dropout prevention, student engagement, and student re-engagement; and (3) secure and manage resources to fund services and supports. The Colorado Dropout Prevention Framework SEDP also continuously identifies and recommends best practices and effective strategies to reduce student dropout rates and increase student engagement and re-engagement, which are highlighted in Colorado’s Dropout Prevention Framework. The framework outlines how to accelerate progress at the school and district level. The evidence-based framework is designed to create an ecosystem for institutional change. It provides a foundation for rigorous and relevant coursework, teacher preparedness and instruction, and development of systems for students needing more attention to reach their full potential. This multi-faceted framework includes evidence-based systems, essential elements, and strategies focused on the following:
● Identification: Identifying students who are at risk of dropping out of school through data analysis, early warning systems, and the review of policies and practices as a means of preventing student disengagement before it starts.
● Intervention and Support: Successful efforts include transition planning and support, whole school strategies and tiered interventions for students identified as being off-track to graduate or at risk for dropping out. Intervention and supports are data-informed and contextualized to meet student needs. Example methods and strategies include increasing community engagement, counseling and mentoring, course completion and credit recovery, family partnering, student re-engagement, multiple pathways to graduation, and transition programs.
● Institutional Change: System-wide changes that can be utilized to create an ecosystem for student success, including improving school climate, evaluating policies and practices, and understanding the multiple pathways to graduation that can be used to re-engage students and increase graduation rates.
Legislative Review Article 14 of Title 22 of the Colorado Revised Statutes requires CDE to report on the amount of state moneys appropriated for dropout prevention and student engagement. A statutory review identified 42 state statutes that impact or pertain to dropout prevention, student engagement and attainment of a high school credential. In FY 2019-2020, funds were appropriated to dropout prevention and student re-engagement efforts through the Student Re-engagement Grant Program ($2 million), the Ninth Grade Success Grant Program ($725,000), and the Expelled and At-Risk Students Services Grant Program ($9,493,560). SEDP oversees these three state funded programs that support communities, local education agencies, and schools in reducing student dropout and increasing school engagement. See the figure below for funded districts.

2019-2020 Legislative Report
- 25 -
SEDP Program Evaluation SEDP is responsible for tracking progress and results for these programs, which are highlighted below. Overall, these programs have served over 10,000 students. See Table 13 for more information about SEDP programs.
Table 13: SEDP Program Evaluation Results
Program Purpose Framework Strategy Example 2019-2020 Evaluation Summary
Expelled and At-Risk Student Services (EARSS) Grant Program The EARSS Grant Program (EARSS) is authorized by Colorado Revised Statute 22-33-205 to assist in providing educational and support services to expelled students, students at risk of suspension and expulsion, and students at risk of habitual truancy as defined by unexcused absences. For the 2019-2020 school year the appropriation was $9,493,560.
Strategies funded include: • Course
completion/credit recovery
• School climate • Counseling and
mentoring • Family partnering
Funded LEAs • 58 EARSS grantees located in 28 counties. Students Served • 7,347 students served. • 62 percent of 7th to 12th grade students
served by the grant were identified as at-risk for dropping out of school.
Student Outcomes • 80 percent of students served experienced
positive outcomes such as school completion and continuation of education.
• 96 percent of students served remained in school.

2019-2020 Legislative Report
- 26 -
Student Re-engagement Grant (SRG) Program The Student Re-engagement
Grant Program (SRG) is authorized by Colorado
Revised Statute 22-14-109 to provide educational services
and supports to local education providers to
maintain student engagement and facilitate student re-engagement for students from 6th to 12th grade. In each fiscal year,
$1.9 million is distributed to grantees.
SRG funds all methods and strategies highlighted in the framework. Strategies most funded include: • Data analysis • Counseling and
mentoring • School Climate • Course
completion/credit • Family partnering
Funded LEAs • 11 SRG grantees in Year 2 out of 3 of the
grant. • 21 schools funded. Students Served • 2,542 students served. • 6 percent of students served were recovered
out-of-school youth. Student Outcomes • 82 percent of students served experienced
positive outcomes such as school completion and continuation of education.
• 93 percent of students served remained in school.
Ninth Grade Success Grant (NGSG) Program The Ninth Grade Success Grant Program (NGSG) is authorized by Senate Bill 19-246 to assist students enrolled in ninth grade to develop the skills they need to successfully persist in graduating from high school. Approximately $725,000 in grant funding was available for the 2019-2020 fiscal year. The program was eliminated for the 2020-21 fiscal year.
Strategies most funded include: • Eighth to ninth grade
transition • Early warning
systems • Data analysis • Multiple pathways
Funded LEAs • 9 NGSG grantees in Year 1 out of 4 of the
grant. • 10 schools funded. Students Served • 998 students served. • 23 percent of students served were identified
as at-risk for dropping out of school. Program Outcomes • 66 percent of grantees reported partially or
fully implementing their work plan for the grant.
Source: CDE Office of Student Engagement and Dropout Prevention, Program End-of-Year Collections Impact of COVID-19 on SEDP Programs The COVID-19 pandemic has impacted all aspects of education and the access to programs for many students in the state of Colorado and nationwide. EARSS, SRG, and NGSG grantees were asked to discuss the challenges that they experienced in 2019-2020 as a result of COVID-19 and the strategies they used to help alleviate some of the experienced struggles. Results of a thematic analysis of responses (N=86) revealed that nearly all grantees stated that the switch to a virtual platform and remote learning impacted them and the modalities they used to implement their program and reach the students they serve. However, despite the unprecedented challenges that followed the pandemic, grantees also discussed how they strived to continue to make deep and meaningful connections with their students and families, and it was clear that they all put forth a tremendous amount of effort to do so. The next few sections reflect the results of a thematic analysis of responses given by SEDP grantees.

2019-2020 Legislative Report
- 27 -
Theme: Disruption in Service Delivery Grantees reported that there was a significant disruption in service delivery due to breaks in communication and the disruption or halt of services or annually held events. In fact, grantees stated that as a result of no face-to-face contact and no opportunity for in-home or site visits, they experienced a difficult time in checking-in with students. Oftentimes the students that were the hardest to reach were foster-care youth and highly mobile students. Due to a significant disconnection from families and loss of community partnerships, grantees could not sustain the level of support that students needed and there was a disruption in the number of students that grantees could serve.
Theme: Impact of Virtual Learning Grantees spoke directly about the impact that virtual learning had on student and family engagement and attendance. Grantees endorsed that virtual platforms commonly led to disengagement with students and families. Oftentimes it was difficult to determine if students were engaged and paying attention during the times they were logged on virtually. Additionally, grantees reported that there were significant issues with attendance as a result of the use of a virtual learning platform.
Theme: Difficulty Tracking Outcomes Grantees expressed the difficulty their sites experienced with accurately tracking student outcomes (i.e., academic, attendance, behavior). Part of the problem grantees faced in tracking outcomes was due to change in district policies as a result of the pandemic. More specifically, due to change in district policies such as the implementation of the reduction of grades rule or of not counting absences, sites had a difficult time getting an accurate representation of how much the grant program helped their students. The difficulty grantees experienced in tracking vital information made it difficult to determine student well-being, course progress, academic data, etc..
“The most difficult part of COVID19 plans in regards to the NGSG was not being able to see our students in person.
So often we could catch students in the hallways, in the media center, or sneaking off to the bathroom and have a quick check in with them. In the virtual world, everything had to be somewhat planned. A lot of our communication
with students was through their parents, which while beneficial, is a different experience than being in school and being able to talk directly with kids. We also had a
hard time tracking some vital information. Attendance was almost impossible to track in an online environment, which
in a lot of cases, are big indicators for us on a student’s well-being and course progress.”
(NGSG Grantee)
“With COVID-19 we had to provide virtual services, we had to use our limited technology to continue our contact with
students. We used FB, messaging, text, phone calls and set up a 24-hour hotline for our at risk students. We found that
students did not like to talk on the phone at home because they did not want parents to overhear their conversations. Some
students did not want to get on Google Hangouts because they were ashamed of their home. 51% of our students did not have internet access. We had to revise our budget to provide chrome
books to students and purchase hot spots to give students access. We leveraged money though other grants and COVID Relief to meet student needs. Many lessons were learned along
the way and we continue learning.” (EARSS Grantee)
“Beginning in March our district when virtually and put a directive that schools would not be taking attendance as well
as no student grade would be impacted by COVID. Specifically, student grades would be held harmless and only
be allowed to improve. Given the district directive, end of year data for attendance and GPA are incredibly skewed and would not be an accurate reflection of the interventions we
put in place for students served through EARSS.” (EARSS Grantee)

2019-2020 Legislative Report
- 28 -
Theme: Loss of Resources for Students and Families Grantees stated that they often had to also navigate challenges associated with families losing essential resources (e.g., access to internet, technology, transportation). For a lot of the families grantees served, going on a virtual platform meant loss of essential security items (e.g., food, clothing, water, electricity, etc.). Additionally, grantees stated that when families experienced these significant concerns, often students worked to support their families. If students were working to help support the family, then they were not attending school and not accessing the services they needed. Grantees stated that this was an inflated problem for marginalized families. Theme: Shift in Focus to Relationship Building
Despite all of the challenges that grantees faced, some grantees discussed how they shifted their focus from academics to meet student needs by building relationships and focusing on student well-being. For a lot of these grantees, not being able to see students face-to-face meant that they had to re-group and re-organize to meet students where they were at and meet their needs. The grantees who reported this shift in focus from grades to well-being, relationship building, and connecting families with resources, spoke about the positive aspects that they experienced as a result of the shift. Additionally, some sites reported having to
take on different roles, such as helping students process home life events due to quarantining with family members. It appears that the shift in focus to relationship building helped a lot of students and families served through SEDP Programs overcome what at times seemed like insurmountable challenges as a result of COVID-19.
“COVID-19 helped us evaluate and realize how important relationships with students and families are. We were able to maintain connections and even continue learning in
spite of a virtual setting.” (SRG Grantee)
“Despite the abrupt changes that COVID-19 caused, I am proud of our district and the decisions made around keeping our students, families, staff, and community safe. Change is never easy, but COVID forced us to take a deeper look at our processes and how we
were going to rise from the given challenge. Although we could not meet face-to-face, our staff pressed forward with resiliency, compassion and immense strength. An all-online learning platform was difficult for our district students, as technology and internet
service is a luxury some can’t afford. After conquering that hurdle, we were met with how to fully support students online who either refused to log in and do their online work, or who genuinely couldn’t handle the all-online platform. The situations were different
across our campuses, but the underlying theme was…it was more difficult than our students and staff anticipated it to be.” (EARSS Grantee)

2019-2020 Legislative Report
- 29 -
Response to COVID-19 It is clear from the thematic analyses of grantees’ responses, that COVID-19 had a significant impact on program implementation. Additionally, the COVID-19 pandemic posed a new challenge to retaining students and preventing dropout. To assist programs and local education agencies across Colorado during the pandemic, SEDP participated in town hall meetings and hosted office hours to discuss strategies for student engagement and academic success. Additionally, each school district in Colorado has a CDE-assigned support coordinator or other support person. These coordinators work with districts to determine needs and ways that the department can help support these needs. Schools and districts certainly rose to the challenges they faced because of the pandemic and are commended for their hard work and effort. SEDP also recently created the COVID Related Colorado Dropout Prevention Framework with information shared by schools and districts across Colorado on strategies and promising practices related to student engagement and dropout prevention during COVID-19. For more information about SEDP, visit Dropout Prevention and Student Re-engagement. The framework was split into three sections to better guide schools and districts as they navigate through the challenges posed by COVID-19. See Table 14 for COVID related dropout prevention framework elements.
Table 14. COVID Related Dropout Prevention Framework Elements
Area of Support Target Goals Areas with Recommendations to Consider
Identification
Identifying students who are at risk of dropping out of school through the use of data analysis, early warning systems, and the review of policies and practices as a means of preventing student disengagement before it starts.
• Data Analysis • Early Warning Signs • Policies and Practices Review
Intervention and Support
Successful efforts include transition planning and support, school-wide strategies and tiered interventions for students identified as being off-track to graduate or at risk of dropping out.
• Community Engagement • Counseling and Mentoring • Course Completion and Credit
Recovery • Family Partnering • Multiple Pathways to Graduation • Student Engagement and Re-
engagement • Transition Programs
Institutional Change
System-wide changes that can be utilized to create an ecosystem for student success, including improving school climate, evaluating policies and practices, and understanding that multiple pathways to graduation can be used to re-engage students and increase graduation rates.
• School Climate
Find more information on approaches and best and promising practices at CDE’s Dropout Prevention and Student Re-Engagement webpage.

2019-2020 Legislative Report
- 30 -
Best Practices around Dropout Prevention during COVID-19 and beyond It is important to continue the effort to reduce student dropout and increase student retention in order to help students graduate high school successfully and reach their highest potential after high school. In previous reports there has been a focus on the improvement of school climate and culture so as to help reduce dropout rates. Some of the effective school practices that could contribute to reduced dropout rates, and that have been mentioned in previous reports, include the development and implementation of the following:
• Strategies designed to catch students up, such as: self-paced catch-up courses, project-based learning, differentiated flexible school schedules, job training embedded as part of the academic program.
• Policies and practices that promote personalized learning environments and opportunities for individualized instruction, such as tutoring, case management, and small classes focused on building close staff-student relationships.
• A tiered and prevention-based framework like Positive Behavioral Interventions and Supports (PBIS) and Multi-Tiered System of Supports (MTSS) that approaches students from a strength-based perspective, teaches students how to be successful, and celebrates their accomplishments with clear benchmarks for attaining student success.
• Mechanisms by which students can connect to strong adult and peer relationships through mentoring programs and partnering with social service agencies.
• Incentives and recognition programs for students and schools when there is improvement in attendance to positively impact school climate.
• A whole child approach which focuses on students’ well-being and connectedness, academic progress, and overall development and success.
State Priorities In the past year, state agencies have set goals to improve educational opportunities and outcomes for all students. Collective state priorities include:
● Cross-systems coordination and collaboration, with special attention in serving students involved in public service systems (e.g., child welfare and juvenile corrections), students experiencing homelessness, and students from rural areas with limited access to services.18
● Talent development to address teacher shortages, especially in early childhood education and care, special education, and secondary-level mathematics and science.19
● Erasing equity gaps among traditionally underserved populations, with special attention to minority males and students living in poverty.20, 21
Steps to accelerate progress are occurring across the state. There is collective momentum to stem and reverse negative trends. CDE’s strategic plan focuses attention on systemic inequities on student outcomes, seeks to expand successful high school models and commits to developing a strong pipeline of high-quality teachers and principals.

2019-2020 Legislative Report
- 31 -
Conclusion Given the complexities associated with the global pandemic, school districts rose to the occasion and provided significant support to aid in the success of their students—in the hopes of maintaining engagement while decreasing their dropout rates. As the final section of this legislative report makes clear, success comes from a commitment to well-designed plans that emphasize student engagement and dropout prevention strategies and methods. Gaps are still persistent among our students of color and white students, and more work needs to be done. The Office of Student Engagement and Dropout Prevention is dedicated to continuously aligning resources and coordinating supports to enhance student engagement and re-engagement, to ultimately reduce the dropout rates across the state of Colorado. In utilizing the dropout prevention framework, which provides guidance to systemic change, schools and districts incorporate strategies and methods influenced by state standards and learning supports for students to attain a high school diploma or equivalency. The Colorado Department of Education is committed to being an active partner to districts in supporting this endeavor.
2019-2020 Legislative Report
- 32 -
Appendices APPENDIX A: Definitions of Terms The following definitions are taken from Colorado Revised Statutes, the Colorado Code of Regulations and the CDE data dictionary. Adjusted Cohort Rate: Under the “Anticipated Year of Graduation” cohort formula that was implemented beginning in 2010, students are assigned an unchanging anticipated year of graduation when they enter into ninth grade. The anticipated year of graduation is assigned by adding three years to the school year that a student begins ninth grade. For example, the formula anticipates that a student starting ninth grade in the fall of the 2015-2016 school year will graduate with the Class of 2019. Dropout: A person who leaves school for any reason, except death, before completion of a high school diploma or its equivalent, and who does not transfer to another public or private school or enroll in an approved home study program. Students who reach the age of 21 before receiving a diploma or designation of completion (“age-outs”) are also counted as dropouts. Not at dropout: A student who transfers to an educational program recognized by the district, completes a high school equivalency or registers in a program leading to a high school equivalency, is committed to an institution that maintains educational programs, or is ill and unable to participate in a homebound or special therapy program. See Frequently Asked Questions (FAQ) at CDE dropout statistics, www.cde.state.co.us/cdereval/dropoutcurrent.htm. Dropout Rate: An annual rate, reflecting the percentage of all students enrolled in grades 7 to 12 who leave school during a single school year without subsequently attending another school or educational program. The Colorado dropout rate is not the inverse of the graduation rate. FAQ and calculation details are available at CDE dropout statistics, www.cde.state.co.us/cdereval/dropoutcurrent.htm. Discipline Incidents: The total number of incidents (not students) that are reported by local education agencies to CDE. Examples include, but are not limited to, classroom suspension/teacher removal, in school suspension, out of school suspension, and expulsion. More details can be found at CDE suspension/expulsion, www.cde.state.co.us/cdereval/suspend-expelcurrent.
● Classroom Removal Incidents: Reporting includes total number of incidents (not students) in which the most severe action taken was the student(s) being suspended from the classroom or removed by the teacher. Includes only incidents where a teacher removal process was followed (e.g., contacting parent/guardian, student-parent-teacher conference and if the second removal, developing a behavior plan). ● In-School Suspension Incidents: The total number of incidents (not students) involving the reported behavior in which the most severe action taken was the student(s) being suspended in school. Student suspended from classroom to another location in the school in accordance with local school board policy. ● Out of School Suspension Incidents: Student suspended from school grounds in accordance with local school board policy.

2019-2020 Legislative Report
- 33 -
● Expulsion Incidents: The total number of incidents (not students) involving the reported behavior in which the most severe action was the student(s) being expelled. Student expelled in accordance with local school board policy. ● Expulsion Rate: Indicates number of students expelled during the year divided by the student
enrollment as of October 1. Graduation Rates and Completion Rates Four-year and Extended-year Graduation Rates: The graduation rate is a cohort rate. Included in the cohort are students with the same Anticipated Year of Graduation (AYG). Under the AYG cohort formula, students are assigned an unchanging anticipated year of graduation when they enter into ninth grade. AYG is assigned by adding three years to the school year that a student begins ninth grade. Regardless if it takes four years or up to seven years to graduate, students are always included in the graduate membership base (the denominator) of their AYG cohort. Upon receiving a diploma, a student is counted in the graduates total (the numerator). FAQ and calculation details can be found at CDE Graduation Statistics, www.cde.state.co.us/cdereval/gradcurrent. Notes:
● In school year 2015-16, CDE automated the reporting process districts use to remove duplicate records, which improved the accuracy of graduation and completion rates. In prior years it was possible for students to remain in the graduation base of a school or district even though they had later enrolled elsewhere in Colorado.
Completion Rate (four-year and extended-year): A cohort-based rate which includes the number of students who graduate plus those who receive a high school equivalency diploma or other designation of high school completion. Like the graduation rate, the completion rate is calculated as a percent of those who were in membership over the previous four-year period (i.e., from grades 9 to 12) and could have graduated or completed in the currently reported school year. Extended-year completion rates are calculated following the same logic as the extended-year graduation rates, but the numerator includes regular diploma graduates, high school equivalency completers and students receiving other completion certificates. Note: Colorado has approved the use of three High School Equivalency (HSE) tests: General Educational Development (GED®) Test, High School Equivalency Test (HiSET®); and Test Assessing Secondary Completion (TASC™). Students, 17 years of age and older, are eligible to take an HSE test, however, younger students may receive an age waiver if they meet specific conditions. More information at CDE High School Equivalency Testing Program, www.cde.state.co.us/postsecondary/hse. Economically Disadvantaged: Student qualifies for either the free or reduced lunch program. The Federal National School Lunch Act establishes eligibility for the reduced price lunch program for families with income up to 185 percent of the federal poverty level (in 2009, this amount was $39,220 for a family of four). Families with income up to 130 percent of the federal poverty level qualify for the free lunch program (in 2009 this amount was $27,560 for a family of four). Gifted and Talented: Students who have been formally identified, using district-wide procedures aligned with CDE guidelines, as being endowed with a high degree of exceptionality or potential in mental ability, academics, creativity, or talents (visual, performing, musical arts, or leadership.

2019-2020 Legislative Report
- 34 -
Habitually Truant: A child who is “habitually truant” means a child who has attained the age of six years on or before August 1 of the year in question and is under the age of 17 years having four unexcused absences from public school in any one month, or 10 unexcused absences from public school during any school year. Authorizing legislation: C.R.S. 22-33-107 Homeless: According to the McKinney Act, a “homeless individual”: lacks a fixed, regular, and adequate nighttime residence. Instructional Program Service Type (IPST): This includes students who are economically disadvantaged, Title I, limited English Proficient, migrant, homeless, gifted and talented, and students with disabilities. Limited English Proficient: This designation encompasses all students identified as either non-English proficient or limited English proficient. Non-English proficient is defined as a student who speaks a language other than English and does not comprehend, speak, read, or write English. Limited English proficient is defined as a student who comprehends, speaks, reads, or writes some English, but whose predominant comprehension or speech is in a language other than English. Districts must provide language services to all limited English proficient students. Local Education Agencies (Local Education Provider): These terms mean a school district, a board of cooperative services created pursuant to article 5 of title 22, or the state Charter School Institute created pursuant to C.R.S 22-30.5-503. Migrant: Students enrolled in a specially designed program for children who are, or whose parent or spouse is a migratory agricultural worker, and who, in the preceding 36 months, in order to obtain, or accompany such parent or spouse in order to obtain, temporary or seasonal employment in agricultural work has moved from one school district to another. Postsecondary and Workforce Readiness (PWR): Performance indicator in the state accountability performance frameworks that reflects student preparedness for college or careers upon completing high school. The indicator includes student graduation rates, disaggregated graduation rates for historically disadvantaged students (free/reduced price lunch eligible, minority students, students with disabilities, English learners), dropout rates (overall and disaggregated) Colorado SAT mean scale scores (overall and disaggregated), and matriculation rates that represent the percent of high school graduates that go on to CTE (Career and Technical Education) programs, community colleges, or four-year institutions in the year after they graduate high school. Pupil Count: The total (cumulative) number of students in membership at any time during the academic year. Student Engagement: Refers to a student’s sense of belonging, safety and involvement in school that leads to academic achievement, regular school attendance, and graduation. Elements of promoting student engagement include providing rigorous and relevant instruction, creating positive relationships with teachers and counselors, providing social and emotional support services for students and their families, creating partnerships with community organizations and families that foster learning outside of the classroom, and cultivating regular school attendance.

2019-2020 Legislative Report
- 35 -
Student Re-engagement: Means a student re-enrolls in school after dropping out prior to completion. Student re-engagement can be facilitated through a local education provider’s use of evidence- or research-based strategies to reach out to students who have dropped out of school and to assist them in transitioning back into school and obtaining a high school diploma or certificate of completion. Student Re-engagement Rate: Percent of students who dropped out in the prior year and re-enrolled in their home school/district in the following year and the percent who dropped out and were retrieved anywhere in the state in the following year. Calculation information cited in CCR 301-84, Rules for Dropout Prevention and Student Re-engagement, www.sos.state.co.us/CCR/GenerateRulePdf.do?ruleVersionId=3542. Students with Disabilities: Students who have been formally identified as having physical or health conditions that may have a significant impact on the student’s ability to learn and therefore warrant placing the student on an Individual Educational Program (IEP). Truancy: In general, truancy refers to a student who is absent without excuse by the parent/guardian or if the student leaves school or a class without permission of the teacher or administrator in charge, it will be considered to be an unexcused absence and the student shall be considered truant. Local school district policy provides details on what types of absences are considered excused or unexcused. Truancy Rate: Total Student Days Unexcused divided by Total Student Days Possible. Annual district and school-by-school truancy rates at CDE Attendance Information, www.cde.state.co.us/cdereval/truancystatistics.

2019-2020 Legislative Report
- 36 -
APPENDIX B: Historical Overview of Annual Dropout Rates
School Year 2009-2010
2010-2011
2011-2012
2012-2013
2013-2014
2014-2015
2015-2016
2016-2017
2017-2018
2018-2019
2019-2020
State Total (all students) 3.1 3.0 2.9 2.5 2.4 2.5 2.3 2.3 2.2 2.0 1.8 American Indian / Alaska Native 5.3 6.5 5.4 4.4 5.0 4.7 4.4 4.1 4.3 4.0 4.0
Asian 1.6 1.7 1.6 1.3 1.3 1.4 1.3 0.9 0.9 0.8 0.7 Black or African American 4.6 4.4 4.4 3.5 3.7 3.7 3.4 3.4 3.1 3.0 2.8
Hispanic or Latino 5.4 4.9 4.7 4.0 3.8 3.9 3.7 3.5 3.5 3.2 2.8 White 2.0 2.0 1.9 1.6 1.6 1.6 1.5 1.5 1.4 1.2 1.1 Hawaiian / Pac. Islander N/R 2.9 3.8 3.6 2.4 3.3 2.7 2.5 3.0 3.4 3.9
Two or More Races N/R 1.7 1.7 2.0 1.8 1.9 1.7 1.9 1.7 1.6 1.6
Male 3.4 3.2 3.2 2.8 2.7 2.9 2.7 2.6 2.6 2.3 2.1 Female 2.9 2.8 2.7 2.2 2.1 2.2 1.9 2.0 1.9 1.7 1.5 Students with Disabilities 2.3 2.2 2.2 1.7 2.9 3.0 2.8 2.8 2.6 2.3 2.1 Limited English Proficient 6.0 5.5 5.1 4.4 4.1 4.1 4.0 3.8 3.9 3.7 3.4 Economically Disadvantaged 3.4 3.0 3.2 2.9 2.7 3.1 2.9 3.1 3.0 2.8 2.6
Migrant 4.1 4.2 3.5 3.6 4.2 4.1 3.6 4.2 4.1 3.9 3.1 Title I 4.9 5.2 5.7 4.4 4.2 4.5 5.2 5.4 5.1 4.0 3.4 Homeless 7.2 6.7 8.5 6.0 5.5 6.1 6.1 5.9 6.1 5.4 4.9 Gifted & Talented 0.7 0.4 0.5 0.6 0.6 0.5 0.4 0.5 0.4 0.4 0.4 Students in Foster Care** N/R N/R N/R 4.5 5.4 6.8 9.3 8.4 8.6 6.9 6.4
Source: CDE Office of Data Services and Office of Student Engagement and Dropout Prevention. More information can be found at www.cde.state.co.us/cdereval.
**Foster Care rates were made available through a data-sharing agreement between CDE and the Colorado Department of Human Services. N/R = not reported

2019-2020 Legislative Report
- 37 -
End Notes _______________________ 1 Alliance for Excellent Education (2017). The Graduation Effect: Every Student Potential to Impact a Community. Retrieved from http://impact.all4ed.org/Infographics/State/CO-GradEffect-Infographic-FINAL.PDF. 2 Alliance for Excellent Education (2013). The Economic Benefits of Increasing the High School Graduation Rate for Public School Students. Retrieved from https://all4ed.org/wp-content/uploads/2014/01/Colorado_econ.pdf. 3 Colorado Department of Education (2017). 2017-2022 Strategic Plan. Retrieved from www.cde.state.co.us/cdecomm/strategicplan.
4 McFarland, J., Cui, J., Holmes, J., and Wang, X. (2019). Trends in High School Dropout and Completion Rates in the United States: 2019 (NCES 2020-117). U.S. Department of Education. Washington, DC: National Center for Education Statistics. Retrieved from https://nces.ed.gov/pubsearch.
5 Rumberger, R. & Sum, A. (2008). Why Students Drop Out of School: A Review of 25 Years of Research. Santa Barbara, CA: California Dropout Research Project, University of California, Santa Barbara. Retrieved from http://cdrpsb.org/pubs_reports.htm, Policy Brief 15. 6 Youth surveys by the General Educational Development (GED), a test credential for high school equivalency. More than 1,500 Colorado GED testers were surveyed about their reason(s) for leaving and not completing high school. 7 Stearns, E. & Glennie E. J. (2006) When and Why Dropouts Leave High School. Youth & Society, 38(1), 29-57. 8 Ahn, K., Lee, J. Y., & Winters, J. V. (2020) Economics Working Papers: Department of Economics, Iowa State University. 2020. Retrieved from https://lib.dr.iastate.edu/econ_workingpapers/115 9 Colorado Department of Education and Colorado Education Initiative (Spring 2020). Colorado School District Needs Inventory. Retrieved from https://www.cde.state.co.us/communications/needsinventory-results 10 Colorado Department of Education and Colorado Education Initiative (Fall 2020). Colorado School District Needs Inventory. Retrieved from https://www.cde.state.co.us/safeschools/needsinventory-fall2020-report 11 United States Census Bureau (2021). Measuring Household Experiences during the Coronavirus Pandemic. Retrieved from https://www.census.gov/data/experimental-data-products/household-pulse-survey.html 12 Browman, A. S., Destin, M., Kearney, M. S., & Levine, P. B. (2019). How economic inequality shapes mobility expectations and behaviour in disadvantaged youth. Nat Hum Behav 3, 214–220. https://doi.org/10.1038/s41562-018-0523-0 13 America’s Promise (2020). National Survey of High School Students During COVID-19 Finds Widespread Negative Impact on Learning Time, Emotional Health, Social Connection. Retrieved from https://www.americaspromise.org/press-release/national-survey-high-school-students-during-covid-19-finds-widespread-negative-impact. 14 World Bank Group (June 2020) Simulating the Potential Impacts of COVID-19 School Closures on Schooling and Learning Outcomes: A Set of Global Estimates. Retrieved from http://pubdocs.worldbank.org/en/798061592482682799/covid-and-education-June17-r6.pdf 15 Save the Children (2020). Save Our Education: Protect Every Child’s Right to Learn in COVID-19 Response and Recovery. Retrieved from https://www.savethechildren.net/save-our-education-report/. 16 Barrat, V. X., Berliner, B., & Fong, A. B. (2012). When dropping out is not a permanent high school outcome: Student characteristics, motivations, and re-enrollment challenges. Journal of Education for Students Placed at Risk, 17(4), 217-233. 17 Mac Iver, M. A., & Mac Iver, D. J. (2009). Beyond the indicators: An integrated school-level approach to dropout prevention. Arlington, VA: The Mid-Atlantic Equity Center, The George Washington University Center for Equity and Excellence in Education

2019-2020 Legislative Report
- 38 -
18 Colorado Department of Human Services. (2014). 2014 Statewide Youth Development Gaps and Themes. Retrieved from (2018 State Youth Development Plan) http://co4kids.org/sites/default/files/SYDP%202019_2020%20Final.pdf. 19 Colorado Workforce Development Council (2018). 2018 The Colorado Talent Pipeline Report. Retrieved from www.colorado.gov/pacific/sites/default/files/2018_Talent_Pipeline_Report_Web.pdf. 20 Colorado Commission on Higher Education (2017). Colorado Rises: Advancing Education and Talent Development. Retrieved from https://highered.colorado.gov/Publications/CDHE-Master-Plan-2017.pdf. 21 Colorado Department of Education (2017). 2017-2022 Strategic Plan. Retrieved from www.cde.state.co.us/cdecomm/strategicplan.