Embed Size (px)
Citation preview
U.S. Department of Transportation
Urban Mass Transportation Administration
Office of Socio-Econom ic Research and Special Projects Washington , D.C.
S.C.R. T.D. LIBRARY
An Analysis of the U.S. Market for Automated Guideway Transit
Volume 2: Urban Area Case Studies
R ECEIVED
S L r, i cJ Offi' ')F
MGR. RAPT ·\/S il DEPT .
Report No. UMTA-IT-06-0165-79-3 November 1980
NOTICE
This document is disseminated under the sponsorship of the Department of Transportation in the interest of information exchange. The United States Government assumes no liability for its contents or use thereof.
NOTICE
The United States Government does not endorse products or manufacturers. Trade or manufacturers' names appear therein solely because they are considered essential to the object of this report.
S.C.R.T .D. LIBRARY 1. Report No. 2. · Government Accession No.
UMTA IT-06-0165-79-3
4. Title one! Subtitle
An Analysis of the U.S. Market for Automated Guideway Transit
Technical keport Documentation Page
3. Recipient's Catalog No.
5. Report Dote
November, 1980 6 . Performing Orgoni zotion Code
Final Report Volume II -- Urban Area Case Studies 8. Performing Or11oni zotion Report No.
l-,7,-.-A-ut_h_o_r1""'s),-----------------------------t
G. Kocur*, R. Hendersorrc*, W. Stern*, D. Smith** 9. Performing Organization Nome one! Acfcfress
Cambridge Systematics, Inc.* 238 Main Street Cambridge, Massachusetts 02142
10. Wark Unit No. (TRAIS)
11. Contract or Grant No.
DOT-UT- 700-0 8 ---------~--1 13. Type of Report oncf Period Covered
f--------------------------------1 12. Sponsoring Agency Nome and Address Final Report U.S. Department of Transportation October, 1977-November, 1980 Urban Mass Transportation Administration Office of Socio-Economic Research & Special Projects Washington, D.C. 20590
14. Sponsoring Agency Code
UTD-10 15 . Supp lementory Notes
Part of a three-volume final report series. Subcontractor support provided by: Skidmore, Owings & Merrill** 334 Boylston Street, Boston, Massachusetts 02134
16. Abstract
An important component of the Urban Mass Transportation Administration's research and development program involving automated guideway Transit (AGT) is the determination of where and under what conditions AGT service characteristics will satisfy the trayel needs and socio-economic. requirements of urban areas in a manner that is competitive with or superior to other transportation alternatives. To contribute to this determination, three general activities were undertaken:
o eleven site-specific alternatives analyses within three representative urban areas; reported in this document, Volume II.
o a two-phased consumer survey to determine individual preferences toward AGT, documented in Volume III.
o a national markets estimate based on data from 46 urban areas to identify a target implementation potential, documented in Volume I.
This volume describes the results of case studies conducted in the Chicago, Atlanta and Dallas urban areas. Specific settings examined include corridors, central business districts (CBDs) ; · suburban activity centers, and medical centers. System design, ridership and cost estimates are reviewed for each site. In addition, institutional issues, connnunity and urban design impact issues, and local reactions to the feasibility of AGT are discussed.
17. KeyWords Urban Transportation Mass Transit
18. Distribution Statement
Available to the public through the National Technical Information Service:
Automated Guideway Transportation Market Analysis
Springfield, VA 22161
19. Security Clossif. (of this report)
Unclassified
Form DOT F 1700.7 (8-72l
20. Security Clossif. (of this poge)
Unclassified
Reprod,1ctioo. of completed page authorized
21• No. of Pages 22. Price
2">4
.,....
.. ~ .. ...
... ~· ~ ....
.. "'
... -n ..
.. ..
.,1 ,., ~
..
A,,111IM1l1 C1•v111i101 11 M111ic Muu111
.... , .. ·-.. ..... .... , .... ......
_..._, -·....... -. _ ..... ..... _,, ....... lhat110fl■
I- .. I
--· .......... ltuW CIIMCM ._ ..... -· ...... a,Mc:fMt a.INC ylHa
Meltlply ,,
l(NGTH
u )0 ... ...
All_lA
I.I 0.0, ... , .. 0 .4
MASS Lwei.e!J_
11 o.u 0.1
VOLUME
11 )0
0.24 0.47 .... 1.1 0,0J 0.11
TUIP'ERATUIIE (nact)
, ....... i, - '" , ..... - ... Jll
Tt flo<I
C.nl1""9t••
CMtunel•fl ,....,.,. k1lor,iet.,a
........ et11t11W1t•■ .... ,. ,,..,.,. aqu .... ""'·· 9ctw.,• kil01"91MS
h«w ..
.,_, ki'°9rM\I .......
lft i lt l llteta
,nillili~• ffl11fili-.,1
liters lit•• l i t.,,
111-.1
c..tt,cmet•• cubic..,...,,
Celaiua ,.,......,__..
.,., ..
. .. ... ...
.,., .. , .. , ... , .. • . , "'' "'' .. , I
I .. , .. ,
•c
METRIC CO~SION FACTORS
~ ~ :1
s : ;;,-
- =-----a i- ~
~~
: :: --.. ~ ':: =--- -
: : ~ == ;; -: § :! == § -= = "
1 I : ~ ~ a ..
I i : ~ ~ ~
j 5 ~ : "
I _i : "
----= ~ -----== ~
h•hl
...
.,.; MJ .... ..
••
Ml
I .. , .. ,
•c
A-,rui•••• C10v1nl111 It•• Mtlrlc Muuru
wi-u v .. ••••
mllllffltt-,1
Ceflll_t .. a ,,..,.,. ,,., ... 1111~,-·
.... ,cet1t1Met•1 ..,., . .,.., ....
.,._. lltlCSMt••
tt.c:, ... 110.000 '"21
11,1,1,1, ,,
LENGTH
0.04 0 .4 u 1.1 0.1
AREA
0.11 1.Z 0 .4 u
MASS 1.!!!!e.!J. .,_, , .......... '°""'' 11000 .... ,
"'111111, ••
Ii~
lit.,• lit•• cwb•c ,..,.,..,,
cutMc ,,..,.,,
O.OJI u 1.1
VOLUME
0.03 z., , ... ....
n 1.3
TEMPUIATURE (uoct)
C•l•iu• ,_.,.,.eu,.
,.
t/11 ..... .... 121
OU
To flo<I
IIIChH
l11che1 , ... , .... Miltl
....,. incflel
~yatdl
9qUMt nult•
tc,,.•
.._ .. -· lhot110ftl
lluHI~•
pi"u -· ....... culticfff1 culJ,ic ywcl■
f ...... i t -- .. ... .. -•o .... -•o •c
.,.. -zo + I I ·~ I ~ r ·~
0
I I I ·~
0
I I I i i I I I to 40 •o 10 ~ ., •c
..... 1
h .. Ml
,., ~ ... ,
., M
.... .. .. ... •' ,.,
. ,
< + ;...:. -i • J> t·J D r-..:i t.ri o
~'-.i
0 '-11 00 f--'
.;:::a..
AN ANALYSIS OF THE US MARKET FOR
AUTOMATED GUIDEWAY TRANSIT
VOLUME II--Urban Area Case Studies
Final Report
Prepared for
US Department of Transportation Urban Mass Transportation Administration
Washington, DC
Contract DOT-UT-70008
by
CAMBRIDGE SYSTEMATICS, INC. Kendall Square Building
238 Main Street Cambridge, Massachusetts 02142
and
SKIDMORE, OWINGS & MERRILL 344 Boylston Street
Boston, Massachusetts 02134
November, 1980

i
PREFACE
This study was funded by the U.S. Department of Transportation, Urban Mass Transportation Administration {UMTA), AGT Socio-Economic Research Program. The study team consisted of Cambridge Systematics, Inc.; Skidmore, Owings & Merrill; and National Analysts. The members of the study wish to thank Howard Evoy, the project monitor, Robert Mccown and Ron Nawrocki of UMTA for their support throughout the effort.
We received wonderful cooperation from people too numerous to list in all the case study cities; to all of them we owe a great debt of gratitude. We would like to especially thank Pam Dunlop and Marsden Burger of the City of Chicago, Dave Phillips of the Chicago Transit Authority, Mildred Cox and Rod Kelly of the City of Dallas, John Wilson of the Atlanta Regional Commission, and Trent Germano and Bruce Emory of the Metropolitan Atlanta Rapid Transit Authority.
The authors also wish to thank the following Cambridge Systematics staff who contributed to this volume: Melissa Laube, Peter Fisher, Doug Bell, and Daniel Nagin. Skidmore, Owings & Merrill staff included Mary Helen Lorenz and Oliver Gillham. In addition, the firm of Transportation Assistance, Inc. provided technical support which contributed importantly to the final results.
The contents of this report reflect the views of the authors, and they are fully responsible for the facts, the accuracy of the data, and the conclusions expressed herein. The contents should not be interpreted as necessarily representing the views, opinions, or policies of either the Department of Transportation or the United States Government.

TABLE OF CONTENTS
CHAPTER l -- CASE STUDY APPROACH
1.1 DESIGN, PLANNING AND COMMUNITY ISSUES
1.2 SERVICE, DEMAND AND COST ANALYSIS
CHAPTER 2 -- CHICAGO 2-1
1-1
1-1
1-2
2.1 NORTH MICHIGAN AVENUE/ILLINOIS CENTRAL AIR RIGHTS 2-1
2.1.l SITE CHARACERTISTICS 2-1
2.1.2 ALTERNATIVES DESCRIPTION 2-3
2.1.3 DEMAND AND COST ISSUES 2-8
2.1.4 COMMUNITY AND URBAN DESIGN IMPACT ISSUES 2-12
2.1.5 INSTITUTIONAL ISSUES 2-26
2.1.6
2.1.5.l Setting 2.1.5.2 Key Issues
SUMMARY
2.2 MERRILLVILLE
2-26 2-28
2-32
2-34
2.2.l SITE CHARACTERISTICS 2-34
2.2.2 ALTERNATIVES DESCRIPTION 2-34
2.2.3 DEMAND AND COST ISSUES 2-38
2.2.4 COMMUNITY AND URBAN DESIGN IMPACT ISSUES 2-43
2.2.5 INSTITUTIONAL ISSUES 2-49
2.2.6
2.2.5.l Setting 2.2.5.2 Key Issues
SUMMARY
2-49 2-50
2-53
2.3 OAK BROOK 2-55
2.3.l SITE CHARACTERISTICS 2-55
2.3.2 ALTERNATIVES DESCRIPTION 2-56
2.3.3 DEMAND AND COST ISSUES 2-60
2.3.4 COMMUNITY AND URBAN DESIGN IMPACT ISSUES 2-64
2.3.5 INSTITUTIONAL ISSUES 2-70
2.3.5.l Setting 2-70 2.3.5.2 Key Issues 2-71
2.3.6 SUMMARY 2-73
2.4 STATE OF ILLINOIS MEDICAL CENTER 2-75
2.4 .1 SI TE CHARACTERISTICS 2-75
2.4.2 ALTERNATIVES DESCRIPTION 2-76
2.4.3 DEMAND AND COST ISSUES 2-81
2.4.4 COMMUNITY AND URBAN DESIGN IMPACT ISSUES 2-84
2.4.5 INSTITUTIONAL ISSUES 2-96
2.4.5.l Setting 2-96 2.4.5.2 Key Issues 2-97
2.4.6 SUMMARY 2-100
CHAPTER 3 -- ATLANTA 3-1
3.1 NORTH CORRIDOR 3-1
3.1.l SITE CHARACTERISTICS 3-1
3.1.2 ALTERNATIVES DESCRIPTION 3-2
3.1.3 DEMAND AND COST ISSUES 3-8
3.1.4 COMMUNITY AND URBAN DESIGN IMPACT ISSUES 3-8
3.1.5 INSTITUTIONAL ISSUES 3-19
3.1.5.l Setting 3-19 3.1.5.2 Key Issues 3-20

3.1.6 SUMMARY 3-22
3 .2 SOUTHEAST CORRIDOR 3-23
3.2.1 SITE CHARACTERISTICS 3-23
3.2.2 ALTERNATIVES DESCRIPTION 3-24
3.2.3 DEMAND AND COST ISSUES 3-24
3.2.4 COMMUNITY AND URBAN DESIGN IMPACT ISSUES 3-30
3.2.5 INSTITUTIONAL ISSUES 3-36
3.2.6 SUMMARY 3-37
CHAPTER 4 -- DALLAS
4 .1 STEMMONS AND NORI'H CENTRAL CORRIDORS
4-1
4-1
4.1.1 SITE CHARACTERIS'l'ICS 4-1
4.1.2 ALTERNATIVES DESCRIPTION 4-3
4.1.3 DEMAND AND COST ISSUES 4-10
4.1.4 COMMUNITY AND URBAN DESIGN IMPACT ISSUES 4-14
4.1.5
4.1.6
4.1.4.1 Sternmons Corridor 4.1.4.2 North Central Corridor
INSTITUTIONAL ISSUES
4.1.5.1 4.1.5.2
SUMMARY
Setting Key Issues
4 .2 DALLAS CENTRAL BUSINESS DISTRICT
4-14 4-17
4-27
4-27 4-29
4-38
4-39
4.2.1 SITE CHARACTERISTICS 4-39
4.2.2 ALTERNATIVES DESCRIPTION 4-40
4.2.3 DEMAND AND COST ISSUES 4-43
4.2.4 (X)MMUNITY AND URBAN DESIGN IMPACT ISSUES 4-47
4.2.5 INSTITUTIONAL ISSUES 4-57
4.2.5.l Setting 4-57 4.2.5.2 Key Issues 4-58
4.2.6 SUMMARY 4-60
4.3 NORTH PARK ACTIVITY CENTER 4-62
4.3.l SITE CHARACTERISTICS 4-62
4.3.2 ALTERNATIVES DESCRIPTION 4-63
4.3.3 DE.M.i\ND AND COST ISSUES 4-67
4.3.4 COMMUNITY AND URBAN DESIGN IMPACT ISSUES 4-70
4.3.5 INSTITUTIONAL ISSUES 4-74
4.3.5.l Setting 4-74 4.3.5.2 Key Issues 4-74
4.3.6 SUMMARY 4-77
4.4 .M.i\RKET CENTER 4-78
4. 4 .1 SI TE CHARACTERISTICS 4-78
4.4.2 ALTERNATIVES DESCRIPTION 4-78
4.4.3 DEMAND AND COST ISSUES 4-80
4.4.4 COMMUNITY AND URBAN DESIGN IMPACT JSSUES 4-83
4.4.5 INSTITUTIONAL ISSUES 4-83
4.4.5.l Setting 4-83 4.4.5.2 Key Issues 4-83
4.4.6 SUMMARY 4-85
APPENDIX A--TRANSIT SKETCH PLANNING PROCEDURE A-1
LIST OF FIGURES
1.1.a 1.1.b 1.1.c 1.1.d 1.2.a 1.2.b 1.3.a
1.3.b
1.4.a
1.4.b 1.5.a 1.5. b 1.6 1. 7. a.
1. 7. b
1.8
1.9
2.1 2.2 2.3
2.4
2.5 2.6 2.7
2.8 2.9
2.10 2.ll 2.12 2.13
2.14
Single Lane Low Volume Suspended System Dual Lane Low Volume Suspended System Dual Lane Low Volume Supported System Dual Lane High Volume Supported System Elevated Light Rail Transit Elevated Heavy Rail Transit Suspended Low Volume System, Slide Platform
Station Suspended Low Volume System, Island Platform
Station Suspended Low Volume System, Split Platform
Station Suspended Low Volume System, Offline Station Supported System, Island Platform Station Supported System, Split Platform Station Supported System, Offline Station Supported High Volume System Island Platform
Station Supported High Volume System Split Platform
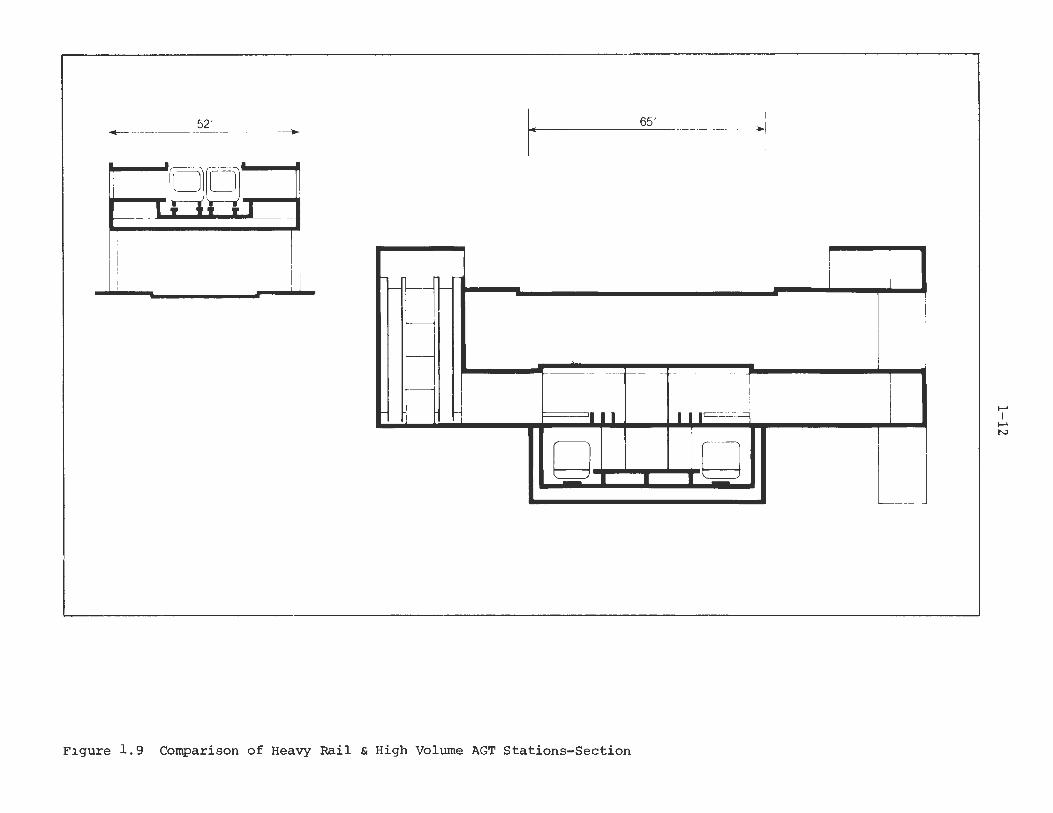
Station Comparison of Heavy Rail & High Volume AGT
Station-Plans Comparison of Heavy Rail & High Volume AGT
Stations Section North Michigan Ave./IC Air Rights Study Area North Michigan Ave., Alternative 2: Rail North Michigan Ave., Alternative 3: Initial
AGT Alignment North Michigan Ave., Alternative 4: Modified
AGT Alignment Aerial View of North Michigan Ave. Site North Michigan Ave. Perspective Section of Proposed IC Air
Rights Development AGT Guideway Turn at End of St. Clair St. Proposed Station Site at Wabash and Chestnut
Streets View of Chicago River View of AGT Guideway Crossing Chicago River View of St. Clair St. View of Proposed AGT Station on
St. Clair Street Merrillville Study Area
1-4 1-4 1-4 1-4
1-5 1-5
1-6
1-6
1-7 1-7 1-8 1-8 1-9
1-10
1-10
1-11
1-12 2-2 2-4
2-5
2-6 2-17 2-18
2-19 2-20
2-21 2-22 2-23 2-24
2-25 2-35
2.15 2.16 2.17 2 .18
2.19 2.20 2.21 2.22 2 .2 3 2.24
2.25 2 .26 2.27 2 .28 2.29
2.30 2.31
2 .32
2.33 2.34
3.1
3.2 3.3 3.4 3.5 3.6 3.7 3.8
3.9 3 .10
3.11
3 .12
3.13 3 .14 3 .15
Merrillville, Alternative 1: Bus Merrillville, Alternative 2: AGT View of Merrillville Plan and Section of Suspended AGT Station
at Southlake Mall Oak Brook, Alternative 1: Bus Oak Brook, Alternative 2: AGT View of Office Buildings in Oak Brook View of Windsor Drive View of Enterprise Drive View of Suspended AGT Station at
Enterprise Drive Medical Center, Alternative 1: Medical Center, Alternative 2: View of Medical Center
Status Quo AGT
View of Cook County Hospital View of Elevated Rail Transit for
Medical Center Area View of Wood Street View of Suspehded AGT System Along
Wood Street AGT System with Wood Street Closed
to Traftic View at Cook County Hospital View of Suspended AGT System Next to
Cook County Hospital Atlanta North Corridor, Alternative 1:
Improved Bus Atlanta North Corridor, Alternative 2: LRT Atlanta North Corridor, Alternative 3: AGT Roswell Road at I-285 Roswell Road in Residential Area View of AGT Along Roswell Road View of Buckhead Site Plan and Cross-Section of AGT Station
at Buckhead View of AGT Station at Buckhead Atlanta Southeast Corridor, Alternative 1:
Improved Bus Atlanta Southeast Corridor, Alternative 2:
LRT Atlanta Southeast Corridor, Alternative 3:
AGT View of Columbia Road at Memorial Drive View of Columbia Road AGT System Along Columbia Road
2-36 2-37 2-4 7
2-48 2-57 2-58 2-66 2-67 2-68
2-69 2-77 2-79 2-88 2-89
2-90 2-91
2:-9 2
2-93 2-94
2-95
3-3 3-4 3-5
3-13 3-14 3-15 3-16
3-17 3-18
3-25
3-26
3-27 3-33 3-34 3-35
4.1
4.2
4.3 4.4 4.5 4.6 4.7 4.8 4.9
4 .10 4.11
4 .12
4 .13 4 .14 4. 15 4.16
4 .17 4.18 4 .19 4.20 4. 21 4 .22
4.23 4.24 4.25 4.26
4.27 4 .28 4.29 4 .3 0 4.31 4. 3 2
4 .3 3
A.l
Dallas Corridors, Expressway Alignment, Al 1 Gu ideway Modes
Dallas Corridors, Rail Alignment, All Guideway Modes
Dallas CBD: Transitway Distribution Dallas CBD: Dallas Transit Plan Alignment Dallas CBD: LRT Distribution Dallas CBD: DPM/ AGT Alignment Dallas CBD: Alternate AGT Alignment Dallas Corridors: Network Volumes View of Rail Portion of North Central
Corridor 4-19 View of North Central Expressway View of AGT System Along North Central
Expressway View of Proposed Station Site at Haskell
Avenue View of AGT Station at Haskell Avenue View of Stemrnons Corridor, Rail Right-of-Way View of Sternrnons Corridor View of Elevated AGT Guideway Along
Sternrnons Corridor Dallas CBD: AGT Operating Strategy Aerial View of Dallas CBD oowntown Dallas View of Elm Street View of Elevated AGT Along Elm Street Site Plan and Section of AGT Station
on Elm Street View of Dallas City Hall from Young Street View of AGT Along Young Street View of Scottish Rites Hall on Young Street Effect of AGT Guideway on View of Scottish
Rites Hall Dallas North Park: Shuttle Bus Dallas North Park: AGT Alignment 1 Dallas North Park: AGT Alignment 2 View of North Park Shopping Center View of North Park Office Park Dallas Market Center: Internal Transit
Allignment Aerial View of Market Center
Major Steps in Sketch Planning Procedures
4-4
4-5 4-6 4-7 4-8 4-9
4-11 4-15
4-20
4-21
4-22 4-23 4-24 4-25
4-26 4-42 4-48 4-49 4-50 4-51
4-52 4-53 4-54 4-55
4-56 4-64 4-65 4-66 4-72 4-73
4-79 4-82
A-3
LIST OF TABLES
2.1
2.2
2.3
2.4 2.5 2.6 2.7 2.8
2.9 2.10 2.11
2.12 2.13 2 .14
3.1
3.2
3.3
3.4
3.5
3.6
4.1
4.2
4.3
4.4 4.5 4.6 4.7 4.8 4.9
Alternatives Description, Chicago, North Michigan Avenue/I.C. Air Rights
Weekday Ridership Summary, Chicago, North Michigan Avenue/I .C. Air Rights
Revenue and Cost Summary, Chicago, North Michigan Avenue/I.C. Air Rights
Description of Alternatives, Merrillville Basic Travel Characteristics, Merrillville Daily Ridership Summary, Merrillville Revenue and Cost Summary, Merrillville Alternatives Description, Oak Brook Daily Ridership Summary, Oak Brook Revenue and Cost Summary, Oak Brook Existing Transit Services Operated by
Medical Center Institutions Alternatives Description, Medical Center Daily Ridership Summary, Medical Center Revenue and Cost Summary, Medical Summary
Alternatives Description, Atlanta, North Corridor
Weekday Transit Ridership, Atlanta, North Corridor
Revenue and Cost Summary, Atlanta, North Corridor
Alternatives Description, Atlanta, Southeast Corridor
Weekday Transit Ridership, Atlanta, Southeast Corridor
Revenue and Cost Summary, Atlanta, Southeast Corridor
Alternatives Description, Dallas, Stemmons and North Central Corridors
Weekday Ridership Summary, Dallas, Stemmons and North Central Corridors
Revenue and Cost Summary, Dallas, Stemmons and North Central Corridors
Dallas CBD, Internal Travel Demand Estimates Dallas CBD, Revenue and Cost Summary Alternatives Description, Dallas, North Park Ridership Summary, Dallas, North Park Revenue and Cost Summary, Dallas, North Park Ridership, Revenue and Cost Summary, Dallas,
Market Center
2-9
2-10
2-13 2-39 2-41 2-42 2-44 2-59 2-62 2-63
2-78 2-80 2-82 2-83
3-7
3-9
3-10
3-28
3-29
3-31
4-12
4-13
4-16 4-44 4-46 4-68 4-69 4-71
4-81
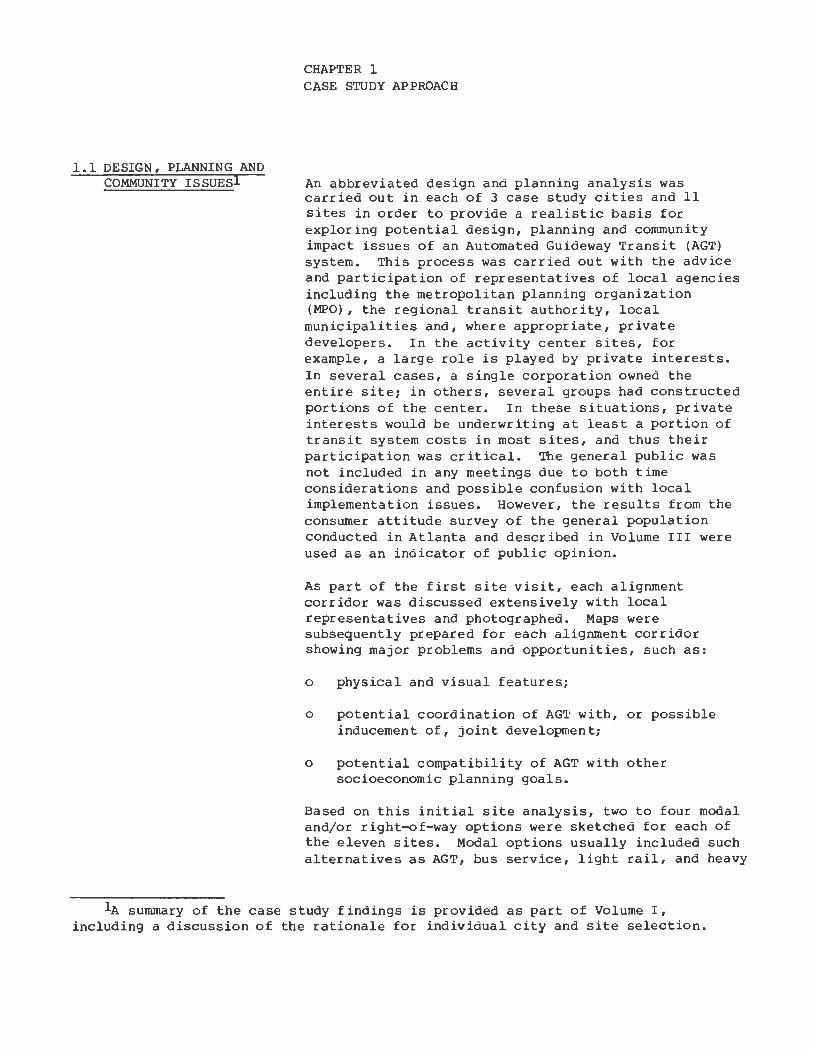
1.1 DESIGN, PLANNING AND COMMUNITY ISSUESl
CHAPTER 1 CASE STUDY APPROACH
An abbreviated design and planning analysis was carried out in each of 3 case study cities and 11 sites in order to provide a realistic basis for exploring potential design, planning and community impact issues of an Automated Guideway Transit (AGT) system. This process was carried out with the advice and participation of representatives of local agencies including the metropolitan planning organization (MPO), the regional transit authority, local municipalities and, where appropriate, private developers. In the activity center sites, for example, a large role is played by private interests. In several cases, a single corporation owned the entire site; in others, several groups had constructed portions of the center. In these situations, private interests would be underwriting at least a portion of transit system costs in most sites, and thus their participation was critical. The general public was not included in any meetings due to both time considerations and possible confusion with local implementation issues. However, the results from the consumer attitude survey of the general population conducted in Atlanta and described in Volume III were used as an indicator of public opinion.
As part of the first site visit, each alignment corridor was discussed extensively with local representatives and photographed. Maps were subsequently prepared for each alignment corridor showing major problems and opportunities, such as:
o physical and visual features;
o potential coordination of AGT with, or possible inducement of, joint development;
o potential compatibility of AGT with other socioeconomic planning goals.
Based on this initial site analysis, two to four modal and/or right-of-way options were sketched for each of the eleven sites. Modal options usually included such alternatives as AGT, bus service, light rail, and heavy
lA summary of the case study findings is provided as part of Volume I, including a discussion of the rationale for individual city and site selection.
1. 2 SERVICE, DEW\ND AND COST ANALYSIS
1-2
rail systems. Right-of-way options generally included use of local street, arterial highway, expressway, rail corridor, and parking lot segments.
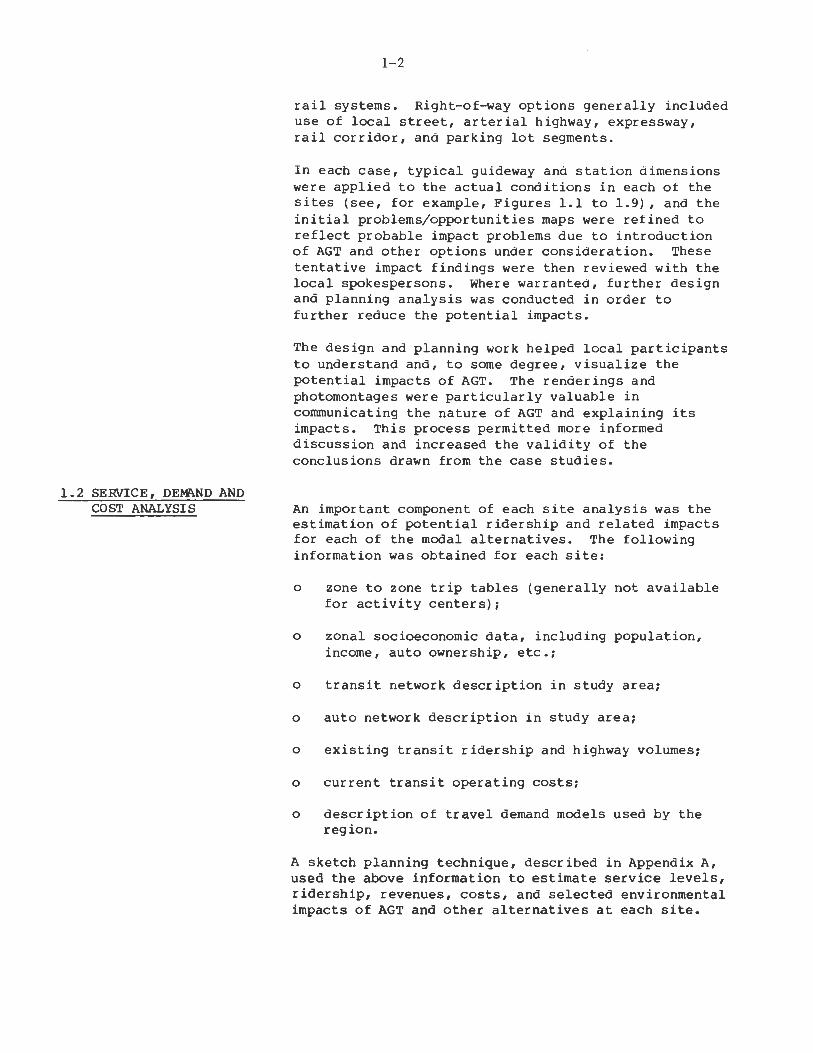
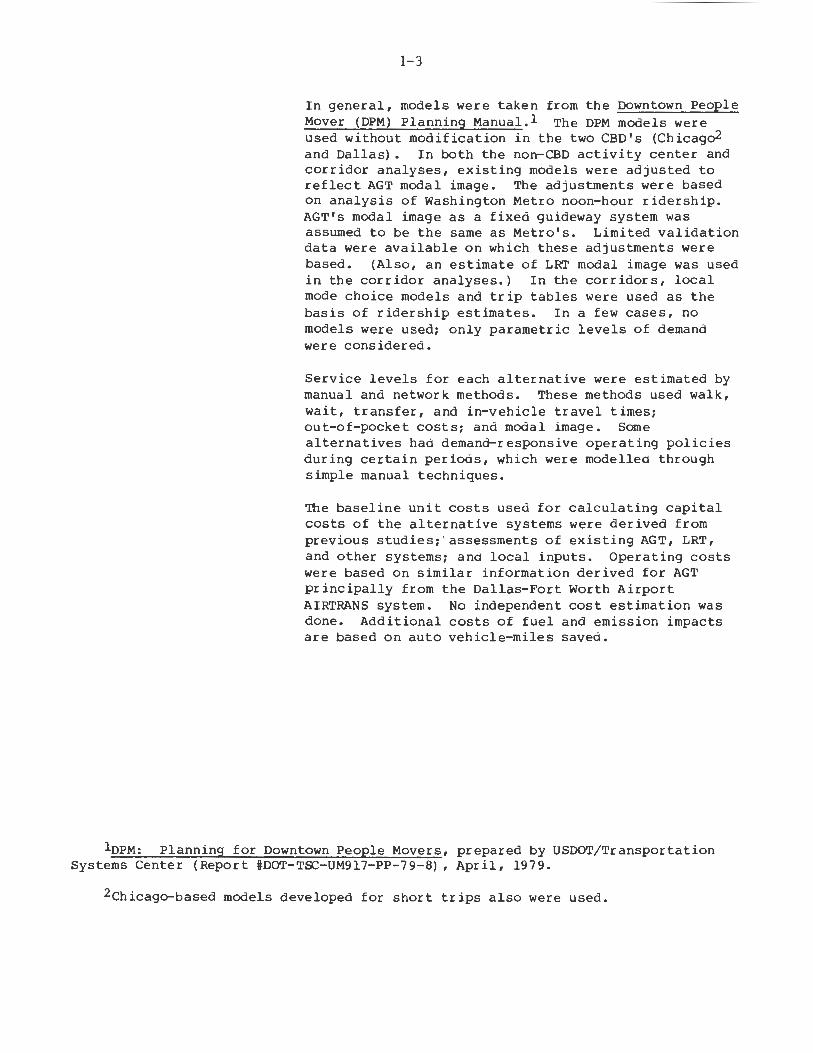
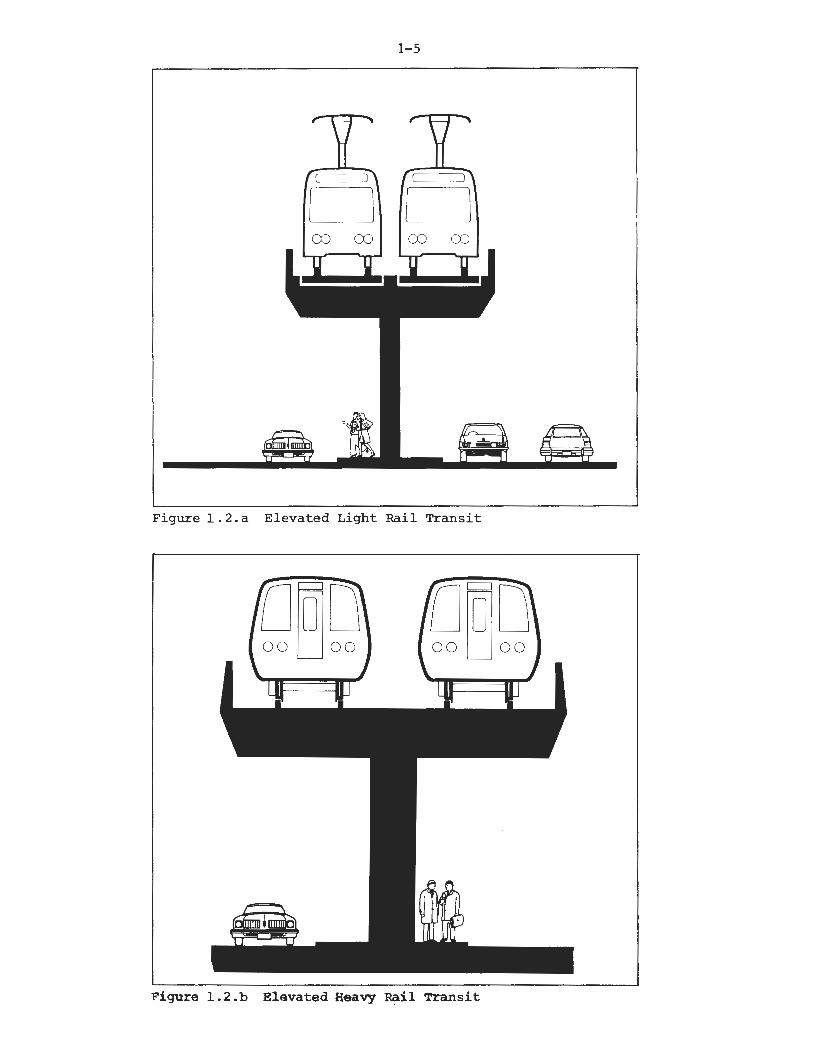
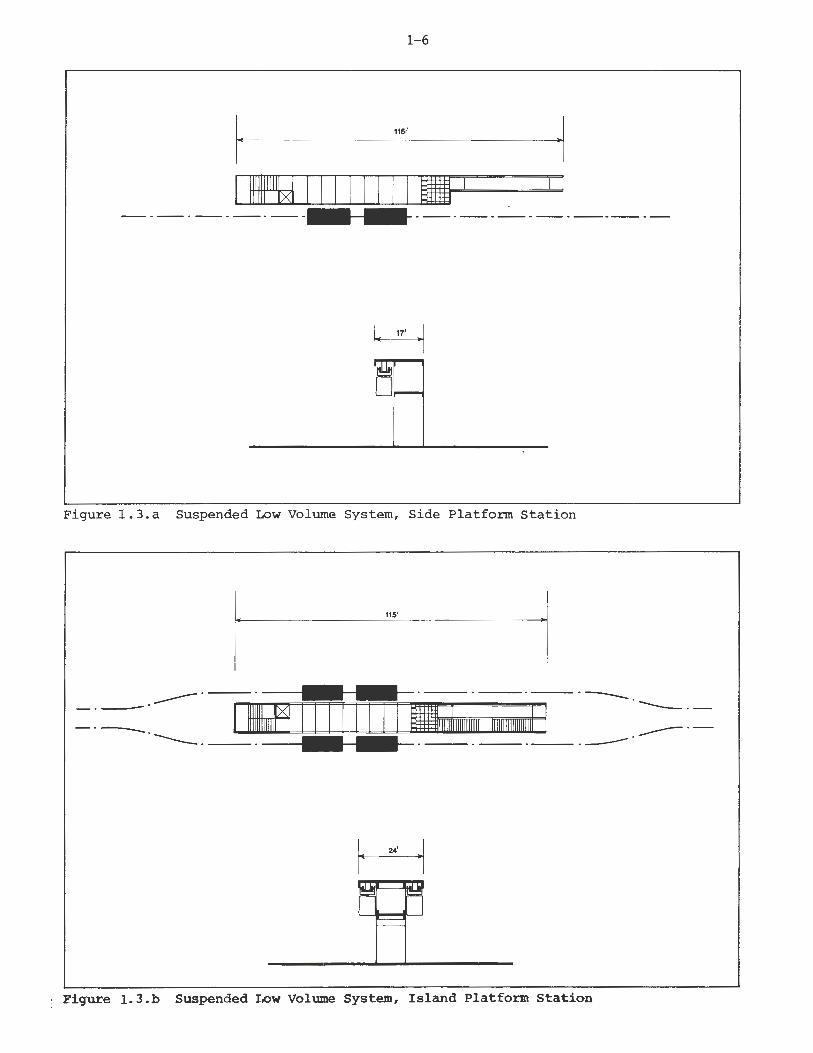
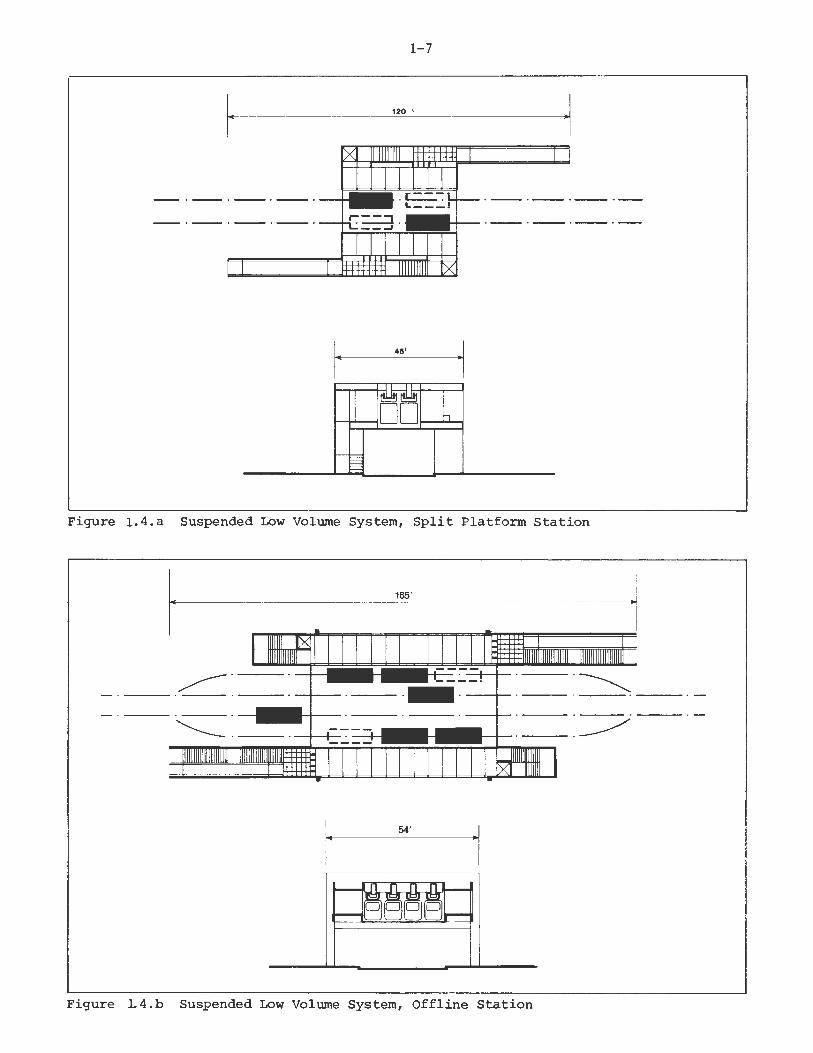
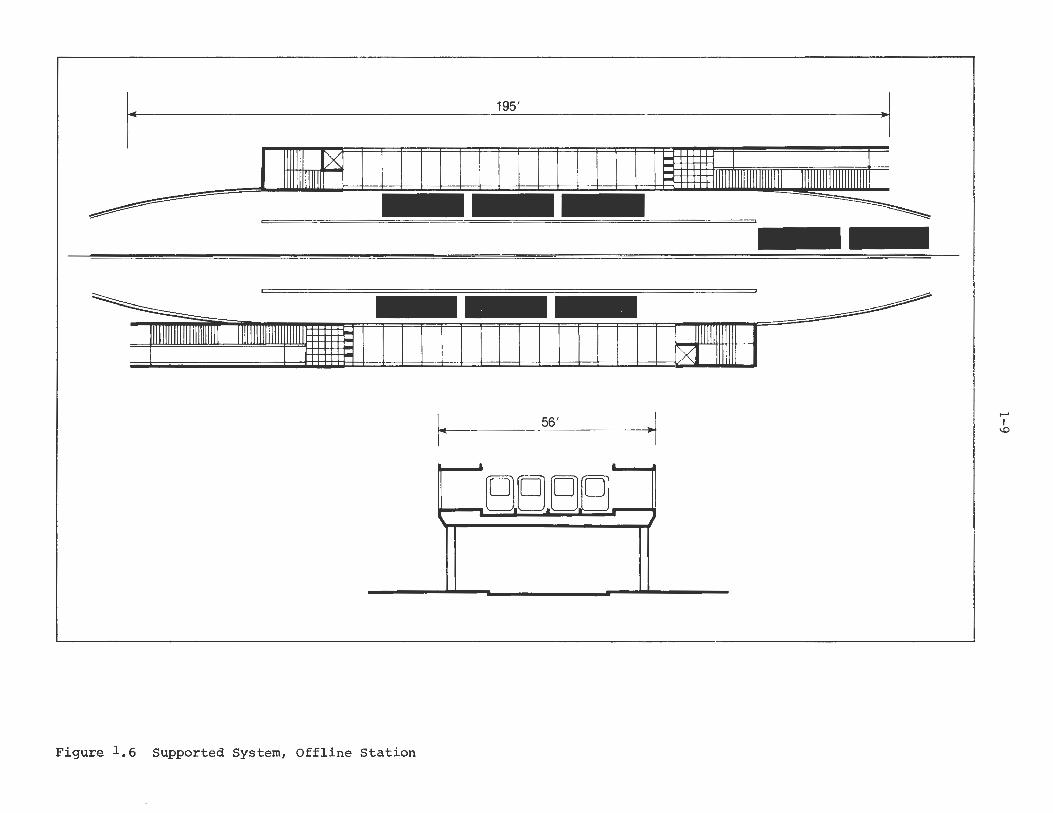
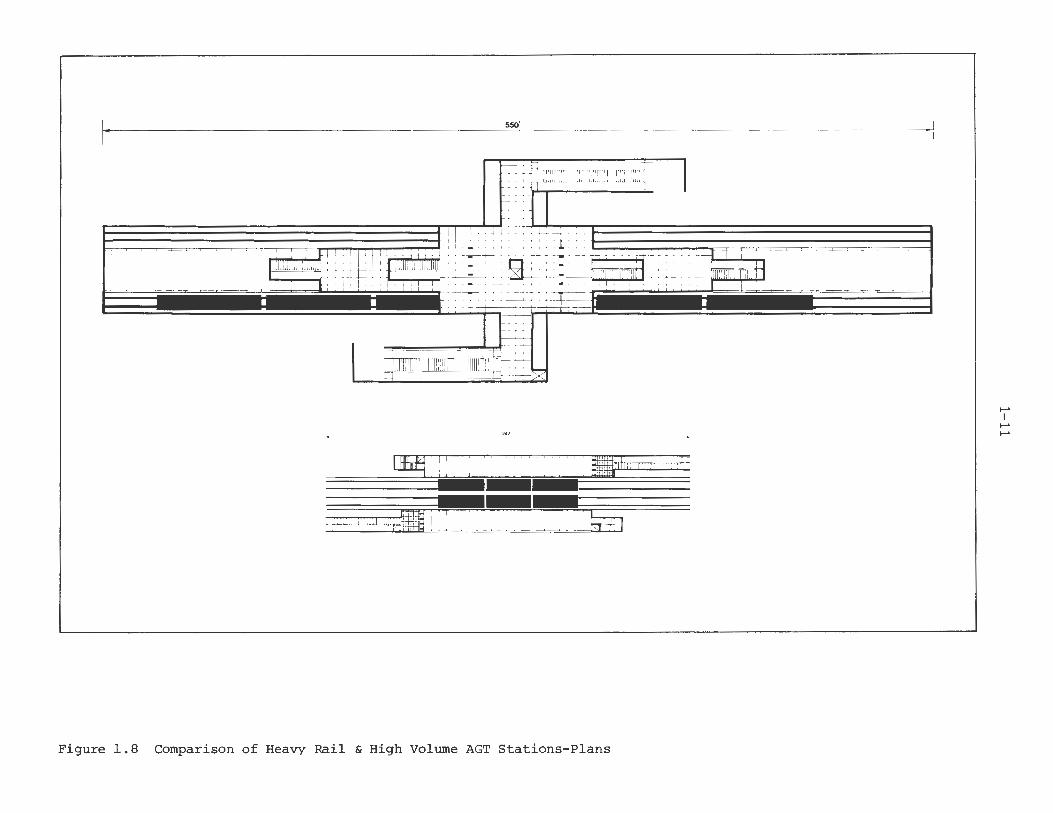
In each case, typical guideway and station dimensions were applied to the actual conditions in each of the sites (see, for example, Figures 1.1 to 1.9), and the initial problems/opportunities maps were refined to reflect probable impact problems due to introduction of AGT and other options under consideration. These tentative impact findings were then reviewed with the local spokespersons. Where warranted, further design and planning analysis was conducted in order to further reduce the potential impacts.
The design and planning work helped local participants to understand and, to some degree, visualize the potential impacts of AGT. The renderings and photomontages were particularly valuable in communicating the nature of AGT and explaining its impacts. This process permitted more informed discussion and increased the validity of the conclusions drawn from the case studies.
An important component of each site analysis was the estimation of potential ridership and related impacts for each of the modal alternatives. The following information was obtained for each site:
o zone to zone trip tables (generally not available for activity centers);
o zonal socioeconomic data, including population, income, auto ownership, etc.;
o transit network description in study area;
o auto network description in study area;
o existing transit ridership and highway volumes;
o current transit operating costs;
o description of travel demand models used by the region.
A sketch planning technique, described in Appendix A, used the above information to estimate service levels, ridership, revenues, costs, and selected environmental impacts of AGT and other alternatives at each site.
1-3
In general, models were taken from the Downtown People Mover (DPM) Planning Manual.l The DPM models were used without modification in the two CBD's (Chicago2 and Dallas). In both the non-CBD activity center and corridor analyses, existing models were adjusted to reflect AGT modal image. The adjustments were based on analysis of Washington Metro noon-hour ridership. AGT's modal image as a fixed guideway system was assumed to be the same as Metro's. Limited validation data were available on which these adjustments were based. (Also, an estimate of LRT modal image was used in the corridor analyses.) In the corridors, local mode choice models and trip tables were used as the basis of ridership estimates. In a few cases, no models were used; only parametric levels of demand were considered.
Service levels for each alternative were estimated by manual and network methods. These methods used walk, wait, transfer, and in-vehicle travel times; out-of-pocket costs; and modal image. Some alternatives had demand-responsive operating policies during certain periods, which were modelled through simple manual techniques.
The baseline unit costs used for calculating capital costs of the alternative systems were derived from previous studies; ' assessments of existing AGT, LRT, and other systems; and local inputs. Operating costs were based on similar information derived for AGT principally from the Dallas-Fort Worth Airport AIRTRANS system. No independent cost estimation was done. Additional costs of fuel and emission impacts are based on auto vehicle-miles saved.
lDPM: Planning for Downtown People Movers, prepared by USDOT/Transportation Systems Center (Report iDOT-TSC-UM917-PP-79-8), April, 1979.
2chicago-based models developed for short trips also were used.
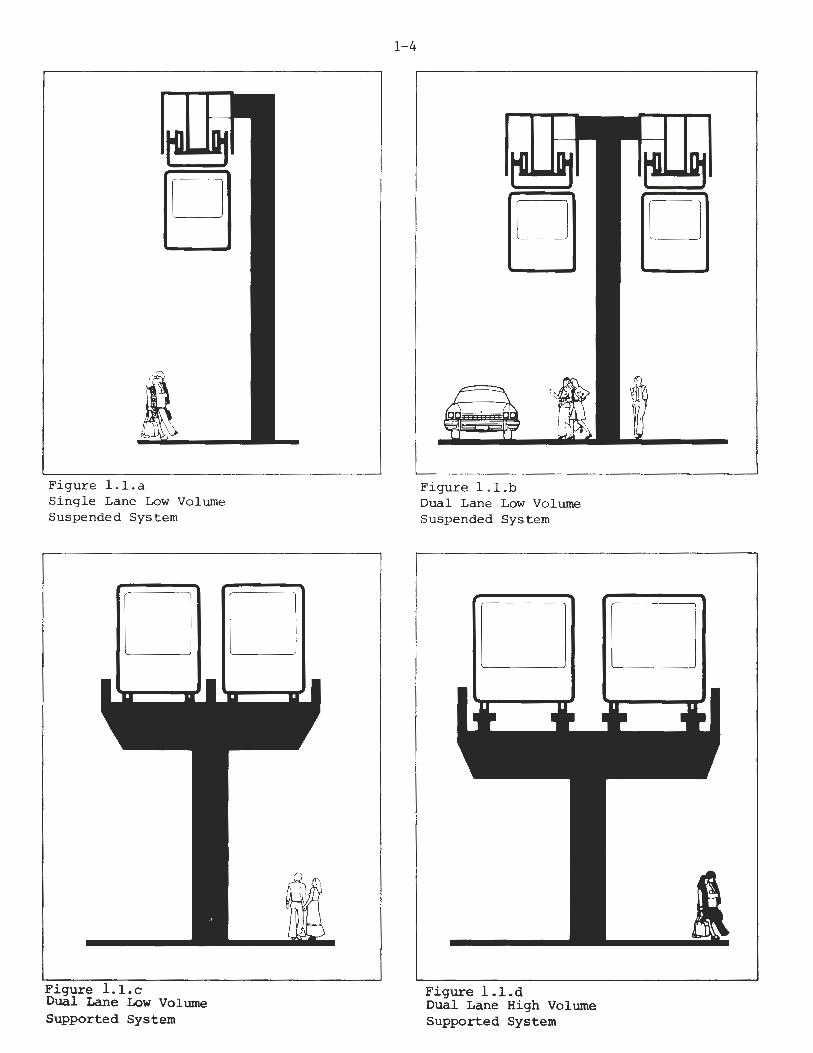
Figure 1.1.a Single Lane Low Volume Suspended System
DD
Figure 1.1.c Dual Lane Low Volume Supported System
1-4
Figure 1.1.b Dual Lane Low Volume Suspended System
□ □
Figure 1.1.d Dual Lane High Volume Supported System
1-5
CD CD CD CD
Figure 1.2.a Elevated Light Rail Transit
Figure 1.2.b Elevated Heavy Rail Transit
1-6
I· 115'
·I I 111 111
11 11txi 11111111 lfi 1 11
- ------·- ·----·-·-· - -- ------
Figure 1.3.a Suspended Low Volume System, Side Platform Station
•·
1151
·• ·-------· ---- ---- ·---- · I !1 1111 111 111~ I I I I I I I I g 1
11111111111111 11 111 I ---------. =1111111111 11 111111 ---------- --------- ---· ~ llol '-
__ ,,..
r ii ~
~
Figure 1.3.b Suspended I~w Volume System, Island Platform Station
1-7
I· 120 '
Figure 1.4.a Suspended Low Volume System, Split Platform Station
I· 165'
~-
----- ·--+- ---· ----__ _/
Figure L4.b Suspended Low Volume System, Offline Station

1-8
1201
14---------
-~=~.=T1 llll1M~n1=r1=r1 =r-1 r=1 r1 n1 17 1711ltffi!L111r:1l1111=1111 11=1=111111=111111I11I r====---
~ -- ------~-----======--------
I· ,a• ·I
TP Figure 1.5.a Supported System; Island Platform Station
180'
~11111111111111111111 1111]111~1 1 _ . . . . _ . . . 11111rn111110II\IIII lllllllllmlllllllmHIIII --,111111111111 1111,111,im 1111111111111111111
1111111i 111 11111 W
. ·-···· 111111111111111111111~
Figure 1.5.b Supported System, Split Platform Station
195'
~
~ 1111111111111111111111■ I iii!1 1 11 1111111 g111111111111 r
r 56' 1 . .
B.B.BB
Figure 1.6 Supported System, Offline Station
-~
..... I
'°

1-10
1651
1111111111111111 1111111111111111 I
I- 33'
Figure 1.7.a Supported High Volume System Island Platform Station
2101
■111111111 1111111111111 1111111111111
111m1111111
IIIIIIUIIIII 111111 1 1111■ 111111111111111 W1111lilllll I
I- 52' •I
DIil JI I ....... I
Figure 1.7.b Supported High Volume System Split Platform Station
550'
I I I A-:t J~ M '- ~ 1 - ...::.1 - ~~q11~n l-, ~ I 1 ! 1 I 1-qJ t t - ~ -----: t....J. ,. · ---~--- :: ~ : . ·
,.,
ipur::;:;:c
~'11 I' 'rn -i----U L .. ~J ]== I"_ -~ ,. ~-
Figure 1.8 Comparison of Heavy Rail & High Volume AGT Stations-Plans
I-' I
I-' I-'
I· 52 '
+---- · --- ----• . n,g
I 1
r-l• • I r---. ·-
I ! -! - - -
-
-e -
- • I
□,
Figure 1.9 Comparison of Heavy Rail & High Volume AGT Stations-Section
65 '
I I
I ,□
I
·1
I-' I
I-' N
2 .1 NORI'H MICHIGAN AVENUE/ ILLINOIS CENTRAL AIR RIGHTS
2.1.1 SITE CHARACTERISTICS
CHAPTER 2 CHICAGO
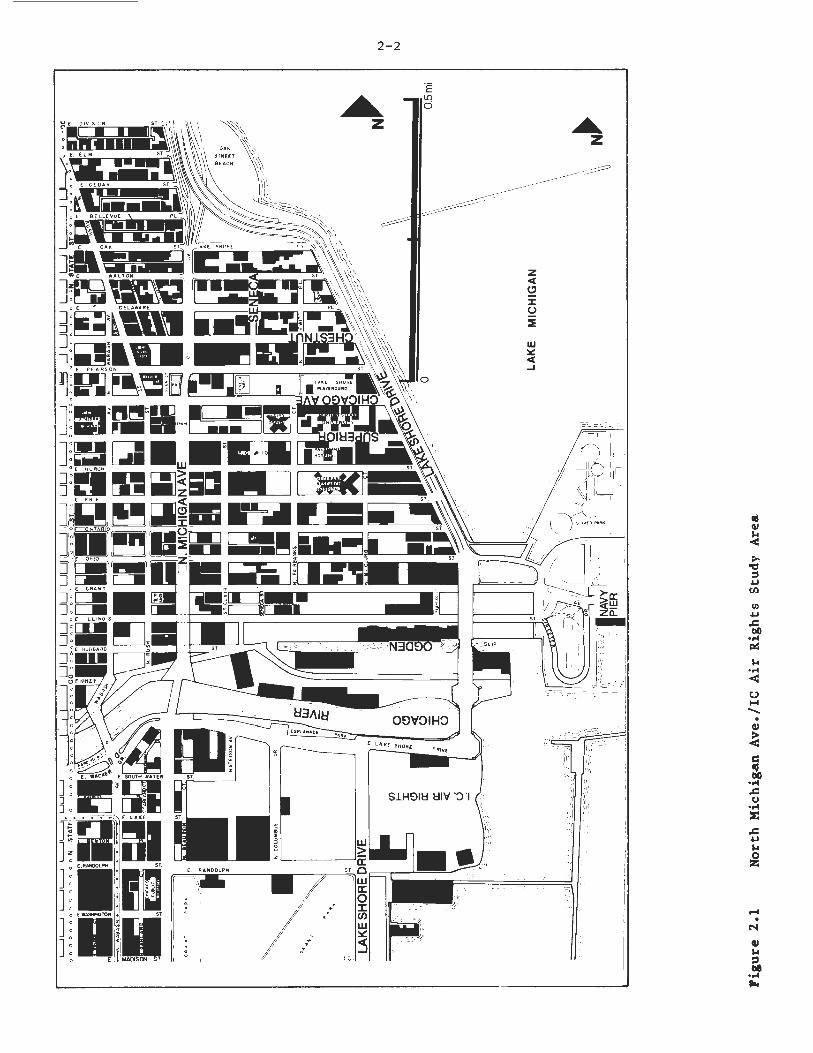
The North Michigan Avenue/Illinois Central Air Rights study site is an area of heavy retail and office activity located in central Chicago. Encompassing part of the residential Gold Coast area to the north and bounded by the heavily commercial Loop area to the south, the study area contains many large hotels, large retail establishments, office towers, high rise apartment buildings, and institutional facilities. Some older industrial buildings are also located in the area along the Chicago River and Ogden Slip.
The study area shown in Figure 2.1 is bounded by Randolph Street on the south, State Street on the west, Chestnut Street on the north, and the Lake on the east. The area is approximately one mile by one-half mile in dimension.
In physical composition, the North Michigan Avenue area is similar to Chicago's Central Business District (traditionally defined by the area known as the Loop), and in fact, much of the recent growth in that area represents a shift in the focus of development from the Loop. The area can be viewed as highly characteristic of an older, center city urban environment in the process of continuing development. While the North Michigan Avenue site is typical of areas in many older industrial cities throughout the Northeast and Midwest, it differs significantly from other urban applications considered in this study by virtue of age, density, and wide mix of land uses (especially residential).
The North Michigan Avenue area has both a high daytime employment density and, in many places, a very active night life. Bridging the Loop and the Gold Coast, many of the retail establishments along North Michigan Avenue tend to be higher priced, and office space rents at a higher cost per square foot than in many areas of the Loop. Over 70,000,000 square feet of commercial, institutional, and other floor space is contained in the area.
Significant features of the area include the Illinois Central Air Rights development, Water Tower Place, the
2-2
A z
llli ST.
I : !
w ::iic: ct ...I
A z
. Q)
~

2.1.2 ALTERNATIVES DESCRIPTION
2-3
Navy Pier Exhibition Area, and the Hancock Tower. Institutional facilities include the Chicago campus of Northwestern University, Loyola University, and Passavant and Veterans Research Hospitals. Open space tends to be scarce, with the only major areas located along the lake shore. Seneca Park, Connors Park, and the Esplanade are the only open space areas not actually on the lake.
The study area is highly influenced by its gridiron street network, resulting in long sight lines down avenues and streets and out toward Lake Michigan. There are many older buildings in the area, with many of the buildings dating from the period between the turn of the century and World War II. The older, smaller scale, more intricately detailed facades along North Michigan Avenue make issues of visual intrusion particularly important. Post-war development in the area is often of high design quality and includes projects such as the new Water Tower Place retail/hotel/ office complex.
The partially completed Illinois Central (I.C.) Air Rights development is adjacent to the North Michigan Avenue area, south of the Chicago River. This development is occurring on what was a railroad yard for the Illinois Central Gulf Railroad. When completed, the I.C. Air Rights development will contain a mix of high-rise office, hotel, and residential buildings, as well as recreational open space and underground parking. This area is likely to have strong links to both the North Michigan Avenue area and the Loop.
Existing travel between the Loop and the North Michigan Avenue area is significant and is likely to increase substantially with the development of the I.C. Air Rights site. Given the current congestion of streets in the study area, a north-south transit link located east of State Street, close to North Michigan Avenue, and capable of accommodating high volumes will be an important consideration in plans for future development of the area.
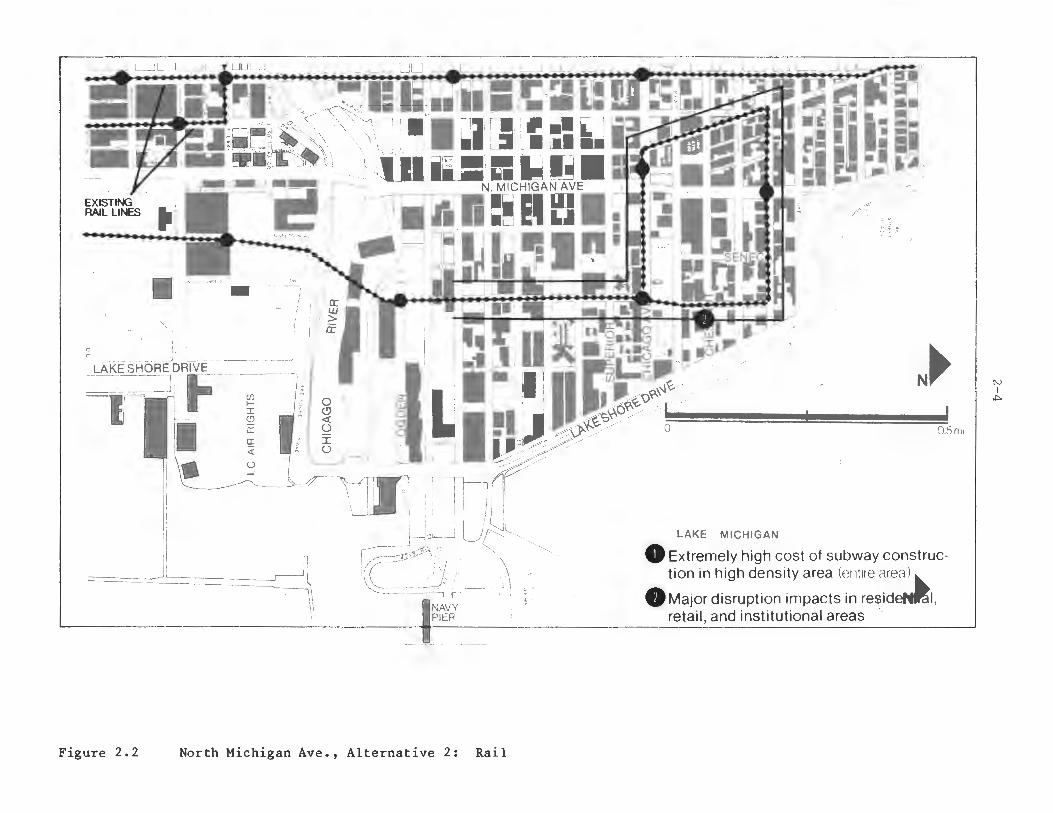
Figures 2.1 through 2.4 show the four primary alternatives considered. Alternative 1 is the status quo. The existing transit network includes an underground rail rapid transit line running under State Street, with stations in the study area at Washington Street, Grand Avenue, and Chicago Avenue. The northeast corner of the Loop elevated system runs along Wabash Avenue, turns west at Lake Street and has study area stations at Randolph Street and State Street. Existing
j L IU~L
I ~ V
-
■ - :i.
' LAKESHOfilDRIVE = ~ / 1 J• I I-~ U ~ [&C- ~uv f- ~ I . '"' \ / z ■ ! 1111 I ,_,, n~,~~ N►
I I
Figure 2.2
. I
I a ii a: 4: (j
I, (.) ■ 'I . ,, -
n -7~
" ~i
11 x• • • =-• . ■ ..... ~'(.}.'t--"'
r-
NAVY PIER
North Michigan Ave., Alternative 2: Rail
',
0 CJ.Sm,
LAKE MICHIGAN
8 Extremely high cost of subway construction in high density area (er 11 1r e ci reci) ..,_
8Major disruption impacts in reside. I, retail , and institutional areas ·
I !
2- 5
... ■
r
UJ ::.:: <t ..J
I< :j I \\ )
I
i I I I
_Ji
7' I ' /I ! I
I
. Cl)
> < i:: <1l .w bO C::
•.-1 Cl) ,.c: s u t:
•.-1 b() ~-.-1
M ,.c: < .w ~ ~ 0 c.., Z<
, , LAKE SHORE DRIVE __ _ 1 1-. 11 L ~ /·;, o, I .- I :.l CJ
' ('.l , - , <( I a: o II ff: ·\I I < . -\ 0 \r1 (.) \,_ ~-,. '
0Joint deveVt[P._"!_~rJ.tf)Ot(}_r r~i) l 9 long) lyn-1 at Ogden Slip
8visual intrusion at Ch1 cagr.J RivPr Crnssing 4J 1 _ ,
(J)Jotnt development potential of I. C. A(r-RrqrJJ~~~ ,j, , 7 . ~---· ii ,
e-vi ..,ua-Hrlitri35-10 n at.N ~ h•'.i,~ A ✓e . d~ss~ngs~ \
®Joint development potential 'iJ. t Benton Place n~;v~
Figure 2.4
PIER
North Michigan Ave., Alternative 4: Modified AGT Alignment
--.... ,,
N► .Visual intrusion al,, , ·3 Chcs t171J t n1d
Seneca
(J)Jolnt development putenua, oe t,,, een Qf)i~ g fJui!illib~I-JPe r or
Ov,sual intrusion/cong~stl( ,n al nng St. Clair Street
.Visual intrusion at N. Michigan A~ crossing
0.5mi
I\.)
I cr-,
2-7
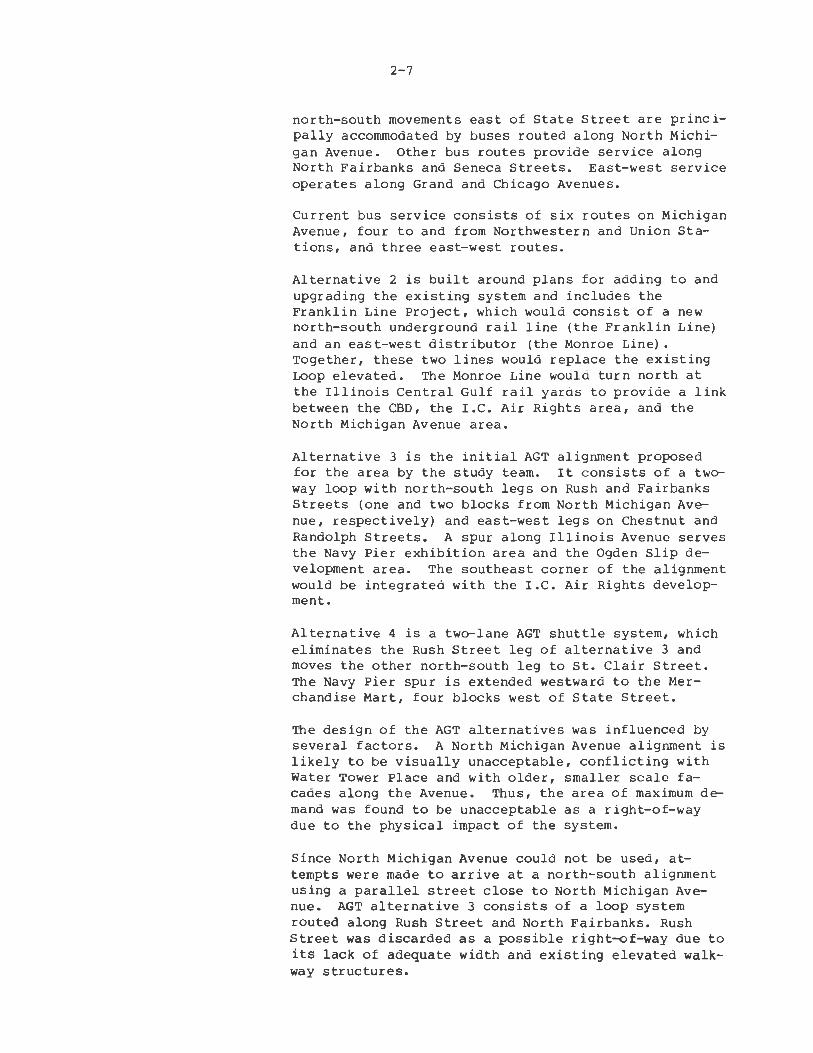
north-south movements east of State Street are principally accommodated by buses routed along North Michigan Avenue. Other bus routes provide service along North Fairbanks and Seneca Streets. East-west service operates along Grand and Chicago Avenues.
Current bus service consists of six routes on Michigan Avenue, four to and from Northwestern and Union Stations, and three east-west routes.
Alternative 2 is built around plans for adding to and upgrading the existing system and includes the Franklin Line Project, which would consist of a new north-south underground rail line (the Franklin Line) and an east-west distributor (the Monroe Line). Together, these two lines would replace the existing Loop elevated. The Monroe Line would turn north at the Illinois Central Gulf rail yards to provide a link between the CBD, the I.C. Air Rights area, and the North Michigan Avenue area.
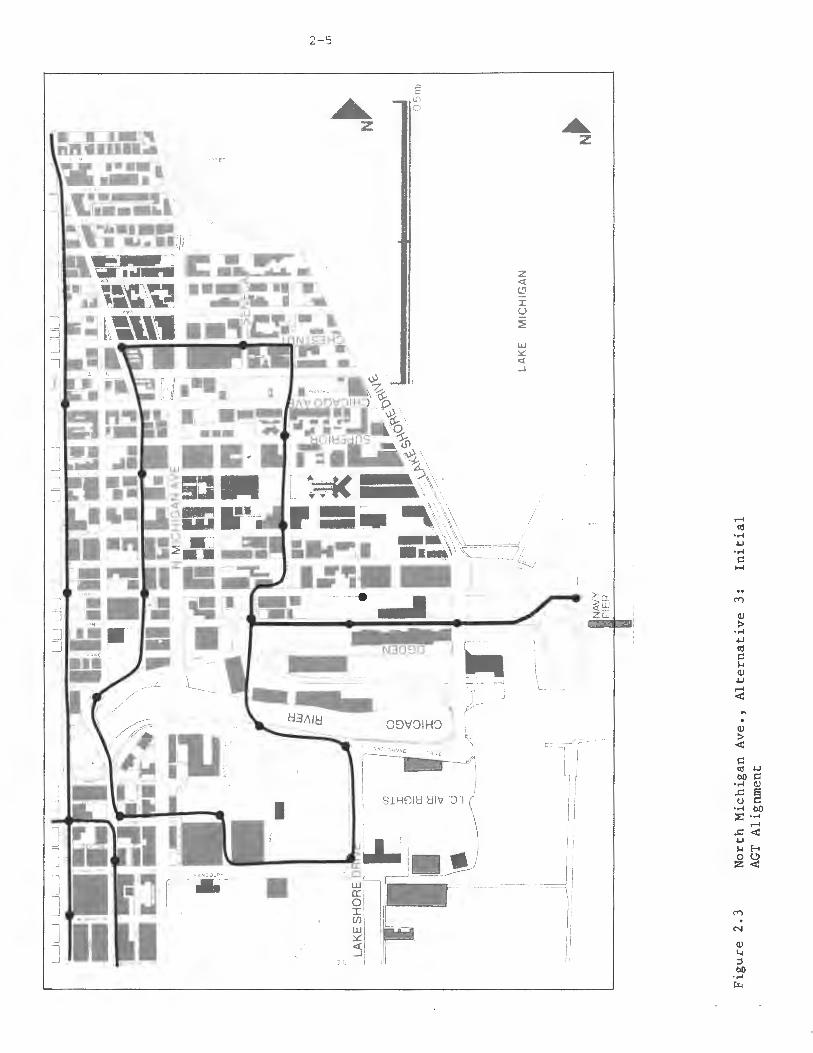
Alternative 3 is the initial AGT alignment proposed for the area by the study team. It consists of a twoway loop with north-south legs on Rush and Fairbanks Streets (one and two blocks from North Michigan Avenue, respectively) and east-west legs on Chestnut and Randolph Streets. A spur along Illinois Avenue serves the Navy Pier exhibition area and the Ogden Slip development area. The southeast corner of the alignment would be integrated with the I.C. Air Rights development.
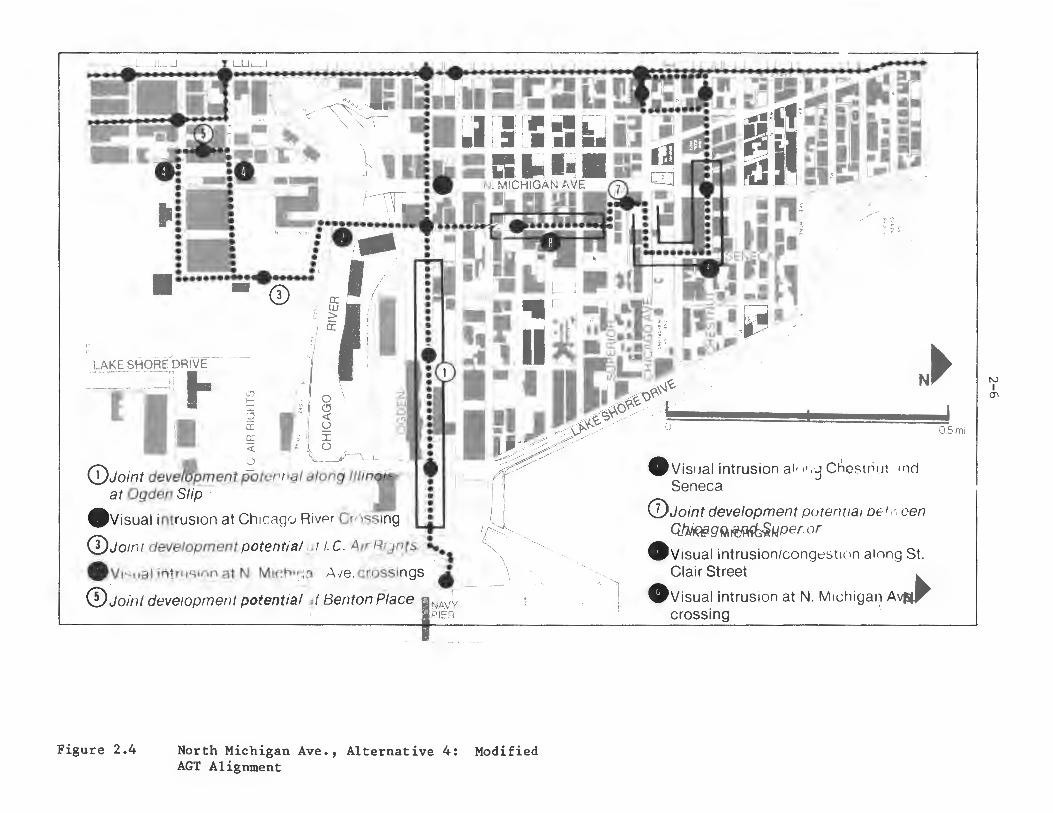
Alternative 4 is a two-lane AGT shuttle system, which eliminates the Rush Street leg of alternative 3 and moves the other north-south leg to St. Clair Street. The Navy Pier spur is extended westward to the Merchandise Mart, four blocks west of State Street.
The design of the AGT alternatives was influenced by several factors. A North Michigan Avenue alignment is likely to be visually unacceptable, conflicting with Water Tower Place and with older, smaller scale facades along the Avenue. Thus, the area of maximum demand was found to be unacceptable as a right-of-way due to the physical impact of the system.
Since North Michigan Avenue could not be used, attempts were made to arrive at a north-south alignment using a parallel street close to North Michigan Avenue. AGT alternative 3 consists of a loop system routed along Rush Street and North Fairbanks. Rush Street was discarded as a possible right-of-way due to its lack of adequate width and existing elevated walkway structures.

2.1.3 DEW\ND AND
COST ISSUES
2-8
Another potential alignment uses Wabash Avenue rather than Rush and St. Clair Streets as the feeder to North Michigan Avenue. However, the Wabash Avenue route is too close to the existing State Street Line.
The St. Clair alignment presents problems similar to those of the Rush Street option, yet to keep the system no more than one block from North Michigan Avenue means utilizing one of these two streets. The final alternative (Fig. 2.4) maintains the St. Clair Street alignment while eliminating the Wabash Avenue segment. The result is a configuration with single lane, one-way loops at either end. In general, City and agency representatives found any north-south alignment undesirable.
The east-west line is retained in the final alternative. The spur to the Navy Pier was ultimately extended to the Merchandise Mart. City and transit agency representatives were receptive to the concept of the east-west link. The Navy Pier extension is envisioned as a development stimulus for the area and is retained in the analysis even though initial volumes may be low.
The I.C. Air Rights area alignment is simplifed from alternative 3 to alternative 4 due to the problems of integrating a fixed guideway system in the multi-level transportation network planned for the development. In addition, it is likely that a system of enclosed walkways will connect much of the development.
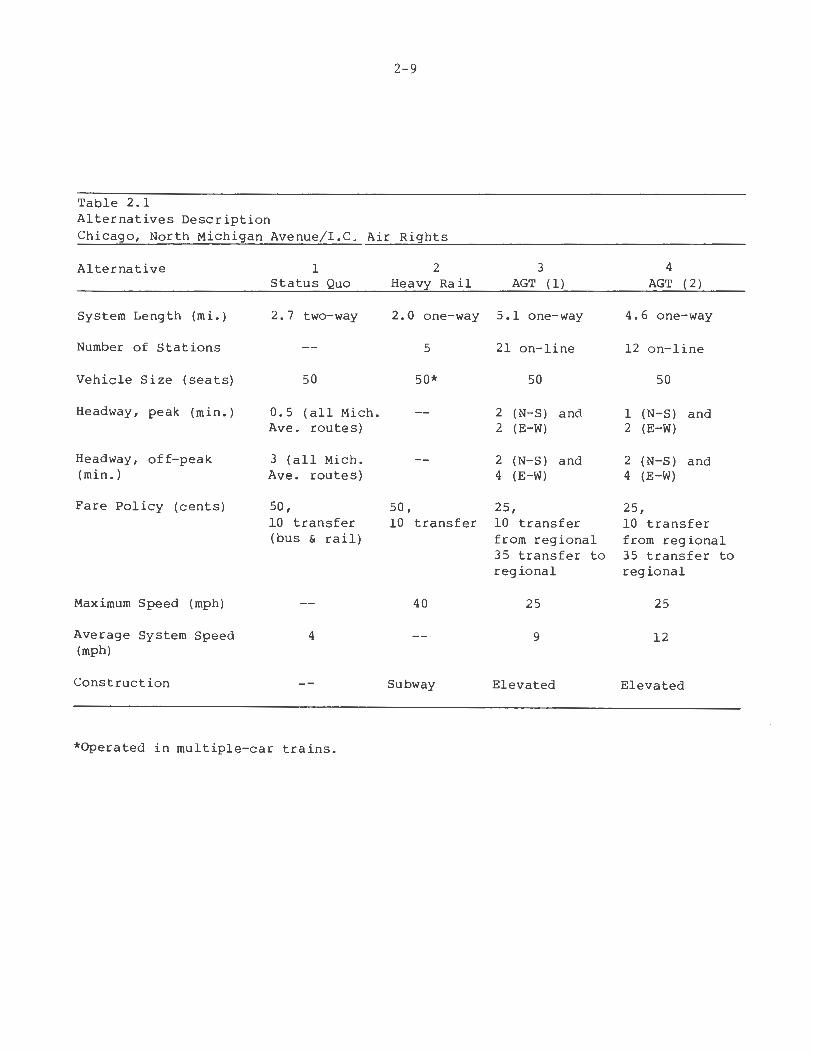
Table 2.1 describes the operating policies of the alternatives. The AGT systems have on-line stations, and all vehicles make all stops. Consideration was given to off-line stations and multiple routes, but they resulted in virtually no increase in patronage. Two independent routes are operated in both the AGT options, one on the north-south links, and another on the east-west spur (continuing to the Loop in alternative 3). A lower fare on the AGT is set than for regional transit because of the shorter trip lengths and expected lower operating costs of AGT.
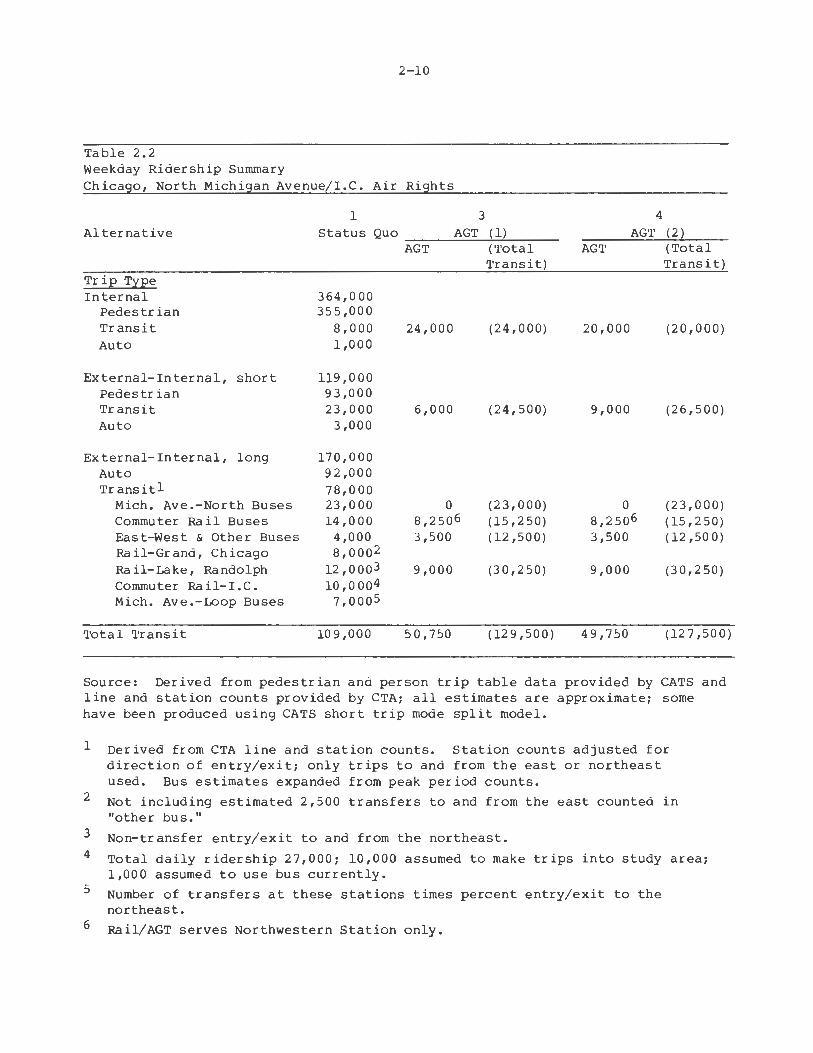
The composition of existing travel within and to and from the area is shown in Table 2.2. Of a total of 653,000 daily trips, 364,000 are internal to the area, 97.5 percent of them being walk trips. Another large component of travel is short (less than a mile long) internal-external trips primarily to the Loop, of which 78 percent are estimated to be walk trips. Finally, 170,000 regional trips, 46 percent by
2-9
Table 2.1 Alternatives Description Chicago, North Michigan Avenue/I.C. ·-~~i~r_R_i~·gLh---'-t~s __________________ _
Alternative
System Length (mi.)
Number of Stations
Vehicle Size (seats)
Headway, peak (min.)
Headway, off-peak (min.)
Fare Policy (cents)
Maximum Speed (mph)
Average System Speed (mph)
Construction
1 Status Quo
2.7 two-way
50
0.5 (all Mich. Ave. routes)
3 (all Mich. Ave. routes)
50, 10 transfer (bus & rail)
4
*Operated in multiple-car trains.
2 Heavy Rail
2.0 one-way
5
50*
50, 10 transfer
40
Subway
3 AGT ( 1)
5.1 one-way
21 on-line
50
2 (N-S) and 2 (E-W)
2 (N-S) and 4 (E-W)
25, 10 transfer from regional 35 transfer regional
25
9
Elevated
to
4 AGT ( 2)
4. 6 one-way
12 on-line
50
1 (N-S) and 2 (E-W)
2 (N-S) and 4 (E-W)
25, 10 transfer from regional 35 transfer to regional
25
12
Elevated
2-10
Table 2.2 Weekday Ridership Summary Chicago, North Michigan Avenue/I.C. Air Rights
Alternative
Trip Type Internal
Pedestrian Transit Auto
External-Internal, short Pedestrian Transit Auto
External-Internal, long Auto Transitl
Mich. Ave.-North Buses Commuter Rail Buses East-West & Other Buses Rail-Gr and, Chicago Rail-Lake, Randolph Commuter Rail-I.C. Mich. Ave.-Loop Buses
Total Transit
1 3 Status Quo ____ A_G_T__,(_1-'-) __ _
364,000 355,000
8,000 1,000
119,000 93,000 23,000
3,000
170,000 92,000 78,000 23,000 14,000
4,000 8,0002
12 ,0003 10,0004 1,ooos
109,000
AGT (Total
24,000
6,000
0 8,2506 3,500
9,000
50,750
Transit)
(24,000)
(24,500)
(23,000) (15,250) (12,500)
(30,250)
(129,500)
4
AGT (2) AGT
20,000
9,000
0 8,2so6 3,500
9,000
49,750
(Total Transit)
(20,000)
(26,500)
(23,000) (15,250) (12,500)
(30,250)
(12 7 ,so O)
Source: Derived from pedestrian and person trip table data provided by CATS and line and station counts provided by CTA; all estimates are approximate; some have been produced using CATS short trip mode split model.
1
2
3
4
5
6
Derived from CTA line and station counts. Station counts adjusted for direction of entry/exit; only trips to and from the east or northeast used. Bus estimates expanded from peak period counts.
Not including estimated 2,500 transfers to and from the east counted in "other bus."
Non-transfer entry/exit to and from the northeast.
Total daily ridership 27,000; 10,000 assumed to make trips into study area; 1,000 assumed to use bus currently.
Number of transfers at these stations times percent entry/exit to the northeast.
Rail/AGT serves Northwestern Station only.

2-11
transit, are made daily. The regional trips consist of riders entering on Michigan Avenue on buses from the north (23,000), buses from Northwestern and Union Stations (14,000), rail stations on the State Street Line on the study area boundary (8,000), east-west buses (4,000), and rail and commuter rail stations in the Loop (approximately 29,000). All these elements of transit ridership have varying distribution needs in the area, and each is treated separately in the demand forecasts.l
AGT alternative 3 has a projected weekday ridership of 50,750, and alternative 4, 49,750. Between 20,000 and 24,000 internal trips are handled by the AGT systems; no local traffic is carried by the Michigan Avenue buses in these alternatives. Estimates of internal ridersip were produced by two different models--a CATS short trip mode split model2 and a frequency/ destination/mode choice model from the DPM Planning Manual. The two models gave the same ridership estimates, although the DPM model showed 16,000 trips diverted from walk and 8,000 induced trips, while the CATS model showed 24,000 diverted trips. Much of the internal ridership increase is due to the fare reduction of AGT (25 cents) over bus (50 cents).
Total transit usage for the study area increases from 109,000 to 127,500 or 129,500, an 18 percent increase, due to the improved (lower cost and faster) transit service. Also, a greater proportion of regional transit users use distribution service than in the status quo alternative. The bus link from Northwestern Station to the study area is replaced by using the Lake Rapid Transit Line (currently with considerable excess capacity) with the AGT system. Transfers from the State Street and the Loop rail lines also use AGT instead of buses for the final leg of their trip.
The distribution of AGT trips on the network varies between the alternatives. In alternative 3, there is an imbalance between the two north-south lines, which
lNo estimates were made for the rail alternative, as several forecasts have already been made. We were unable to derive breakdowns of the rail estimates compatible with our study; thus they are not presented. Both ridership and costs of the rail alternative are considerably higher than the AGT. Ridership is higher because of the much better integration with the existing regional system. Costs are high due to the need for large tunnels and stations.
2chicago Area Transportation Study (CATS), Network Sensitive Mode Choice Models (Draft).
2.1.4 COMMUNITY AND UR.81\N DESIGN IMPACT ISSUES
2-12
increases vehicle requirements. The line along Rush Street carries nearly 8,000 passengers in the peak two hours, while the Fairbanks line carries less than 3,000. East-west spur ridership is low: only 500 trips in a 2-hour peak. In alternative 4, ridership is quite uniform over the north-south line {about 8,000 trips along most of its length), and heavier on the east-west line (about 2,500 trips) .1
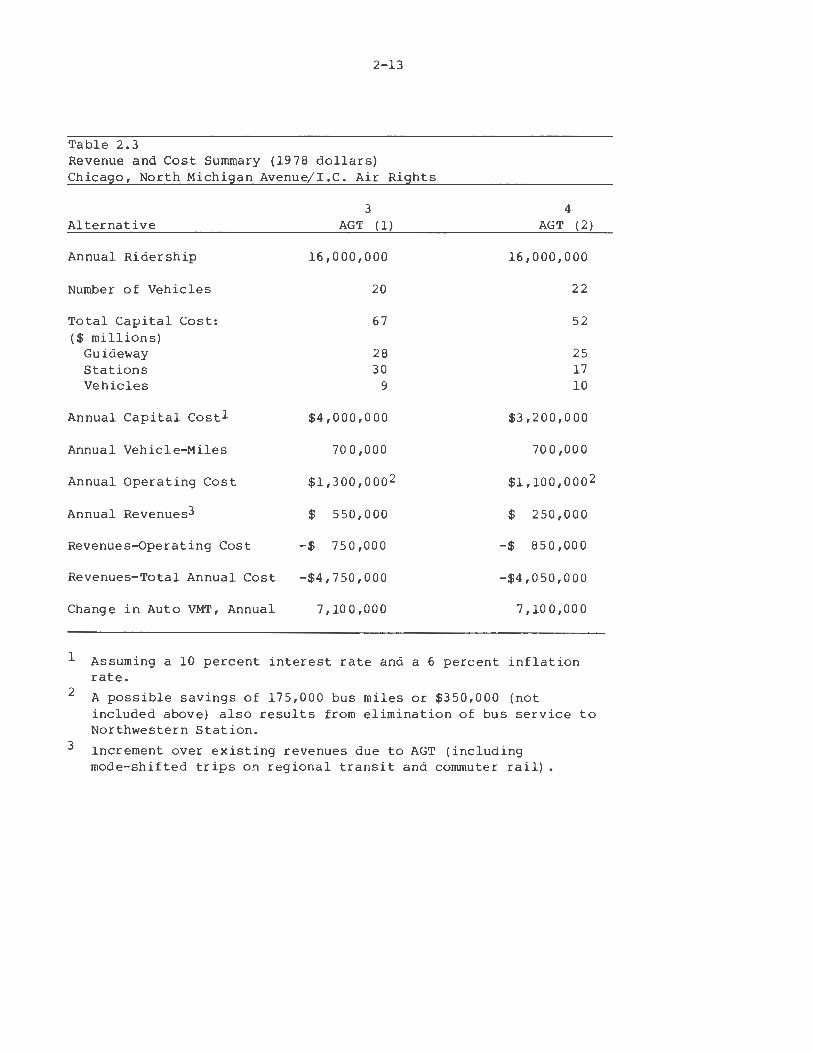
Table 2.3 shows the revenue and cost summary. Revenues shown are the marginal revenues above existing levels; the effects of revenue losses from lowered fares in some markets have been considered. Only two bus routes could reasonably be eliminated because of guideway extensions to the area; this results in an annual savings of $350,000.
AGT alternative 4, the preferred AGT option, solves certain problems of service redundancy and c~rnrnunity impact by eliminating one leg of the system, when conr pared to alternative 3. However, it is still a solution which presents a number of serious problems, many of which are likely to be associated with AGT or any other system requiring an elevated guideway structure in a densely developed urban area. Typical among these problems are the visual incompatibility of the guideway and stations with existing land uses and the potential additional congestion that may occur in the station areas.
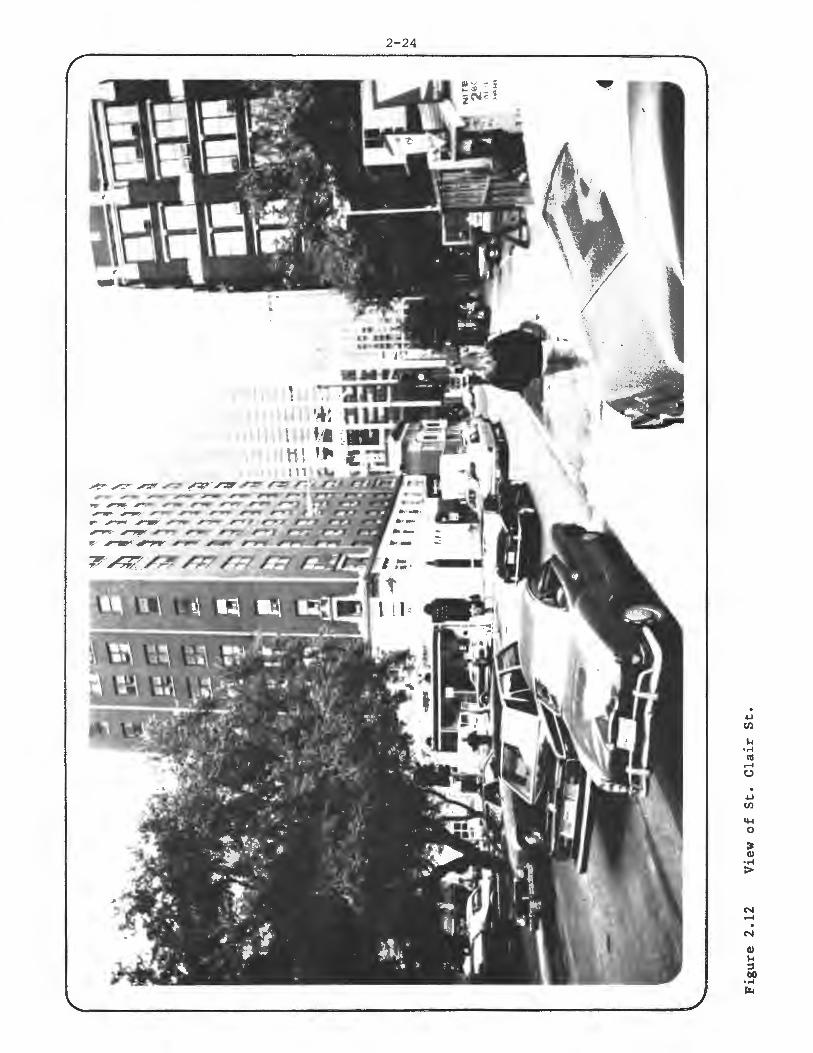
For example, the northern section of St. Clair Street, although wide enough for a center-supported cantilevered guideway, is a narrow, tree-lined, pedestrian scale environment that conflicts in scale with even a small elevated guideway. Vertical circulation to and from the stations may cause congestion at street level for pedestrians and automobiles since parking lanes must be moved in some areas for escalator and elevator space. Apartments above street level may suffer the effects of blocked views and privacy invasion. Visual intrusion and the reduction of natural light levels will be severe all along St. Clair but especially at Superior Street where the system makes an abrupt turn.
One measure to mitigate these impacts might include the elimination of traffic on St. Clair Street. Without traffic, island platform stations could be used with vertical circulation brought down in the center of the street; to maintain traffic would require using
½he west spur demand estimates are approximate, as it is outside the study area for which detailed data were obtained.
2-13
Table 2.3 Revenue and Cost Summary (1978 dollars) Chicago, North Michigan Avenue/I.C. Air Rights
Alternative
Annual Ridership
Number of Vehicles
Total Capital Cost: ($ millions)
Guideway Stations Vehicles
Annual Capital Costl
Annual Vehicle-Miles
Annual Operating Cost
Annual Revenues3
Revenues-Operating Cost
Revenues-Total Annual Cost
Change in Auto VMT, Annual
3
AGT (1)
16,000,000
20
67
28 30
9
$4,000,000
700,000
$1,300,0002
$ 550,000
-$ 750,000
-$4,750,000
7,100,000
4
AGT (2)
16,000,000
22
52
25 17 10
$3,200,000
700,000
$1,100,0002
$ 250,000
-$ 850,000
-$4,050,000
7,100,000
1 Assuming a 10 percent interest rate and a 6 percent inflation rate.
2
3
A possible savings of 175,000 bus miles or $350,000 (not included above) also results from elimination of bus service to Northwestern Station.
Increment over existing revenues due to AGT (including mode-shifted trips on regional transit and commuter rail).
2-14
split platform stations. Split platform stations require double the circulation and platform area, resulting in an approximately 33 percent increase in the width of the guideway, and of course, this enlarged guideway profile reduces natural light levels at grade and increases the potential of visual intrusion on the streetscape. (The alternative to split platform stations on streets where traffic is maintained would be island platform stations with below platform mezzanines. Doing this effectively doubles the height of the guideway and stations.) Other measures might include:
o Establishing second level pedestrian activity where appropriate, possibly relating to the second level system along parts of North Michigan Avenue.
o Using the guideway to serve other functions such as lighting and graphics.
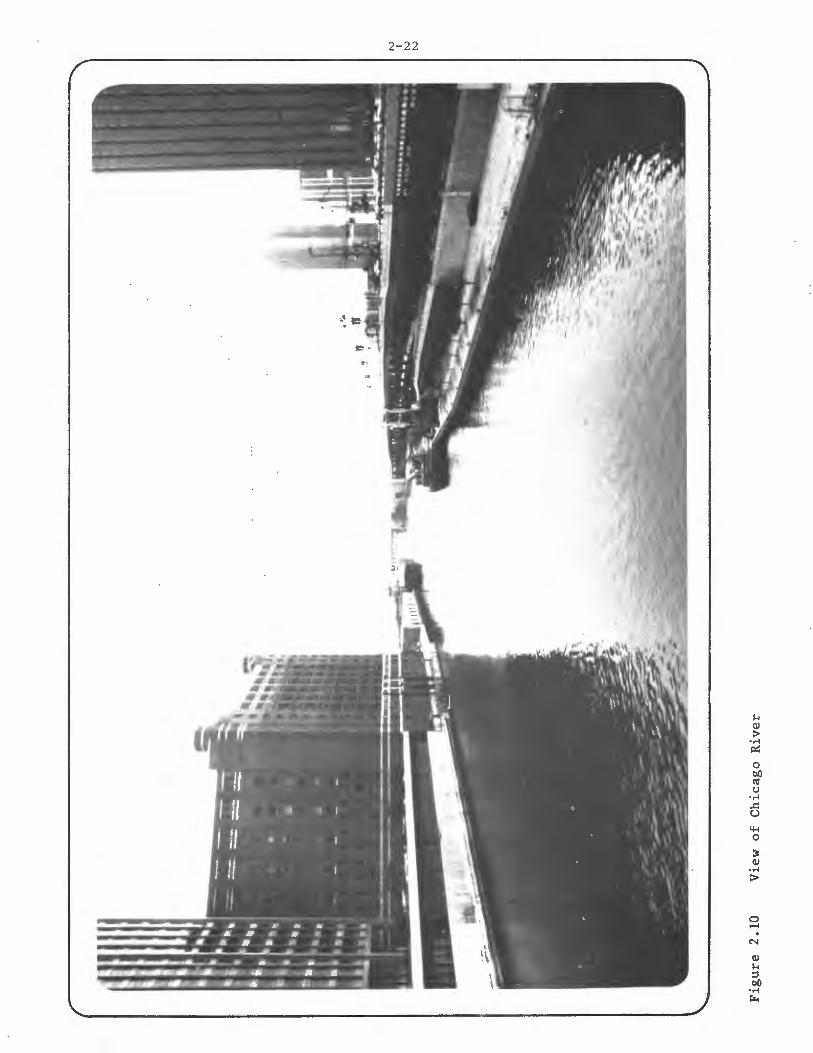
Other areas of probable visual intrusion and community disruption are the river crossing, North Michigan Avenue, Seneca Park, Chestnut Street, and Randolph Street. The AGT system must cross the Chicago River above grade at a height that provides sufficient clearance for ships that use the river (an alternative would be to use a drawbridge). The crossing will slightly obstruct vistas along the river to the lake. Little can be done about this except to keep the structure as small as possible.
A potential visual impact may also occur where the east-west link crosses North Michigan Avenue if the line is elevated. Since a two level street system exists in this area, however, it may be possible for the AGT system to utilize the lower level.
Seneca Park is one of the few areas of open space in the North Michigan Avenue area and is scheduled for redevelopment. The adjacent armory is to be torn down. An elevated structure will negatively affect plans for increased open space, although the impact of an AGT in this area is likely to be less significant than on a crowded urban street.
Chestnut Street, although wider, presents many of the same problems as St. Clair Street. Closing Chestnut to traffic is probably not feasible due to the heavy traffic volumes and prevailing access patterns on the street. The scale of buildings fronting on the street is vertically much greater than St. Clair, including such buildings as the John Hancock Tower. This existing large scale development will help to alleviate the
2-15
visual impact of the AGT. However, the visual quality of Chestnut Street will be adversely affected by the loop at Wabash Avenue.
The Randolph Street area at the south end of the system would experience additional problems where the guideway leaves Garland Court and turns onto Randolph. Garland Court would necessarily be closed to vehicle traffic to accommodate the AGT. Possible joint development on a parcel adjoining Garland Court may allow for a connector between the system and the existing Loop station at Wabash.
Not all the effects of the AGT option are negative. The east-west link to Navy Pier and the Merchandise Mart traverses an underused industrial area along the Ogden Slip to the east and older warehousing areas and surface parking to the west. The potential for joint development in this area is strong, and the introduction of an AGT system might serve as a catalyst for development in an otherwise deteriorating area. Another vacant parcel at Superior and Chicago provides a pass-through for the system behind Water Tower Place and could become a joint development site. A station at this location could become a prominent feature of the development.
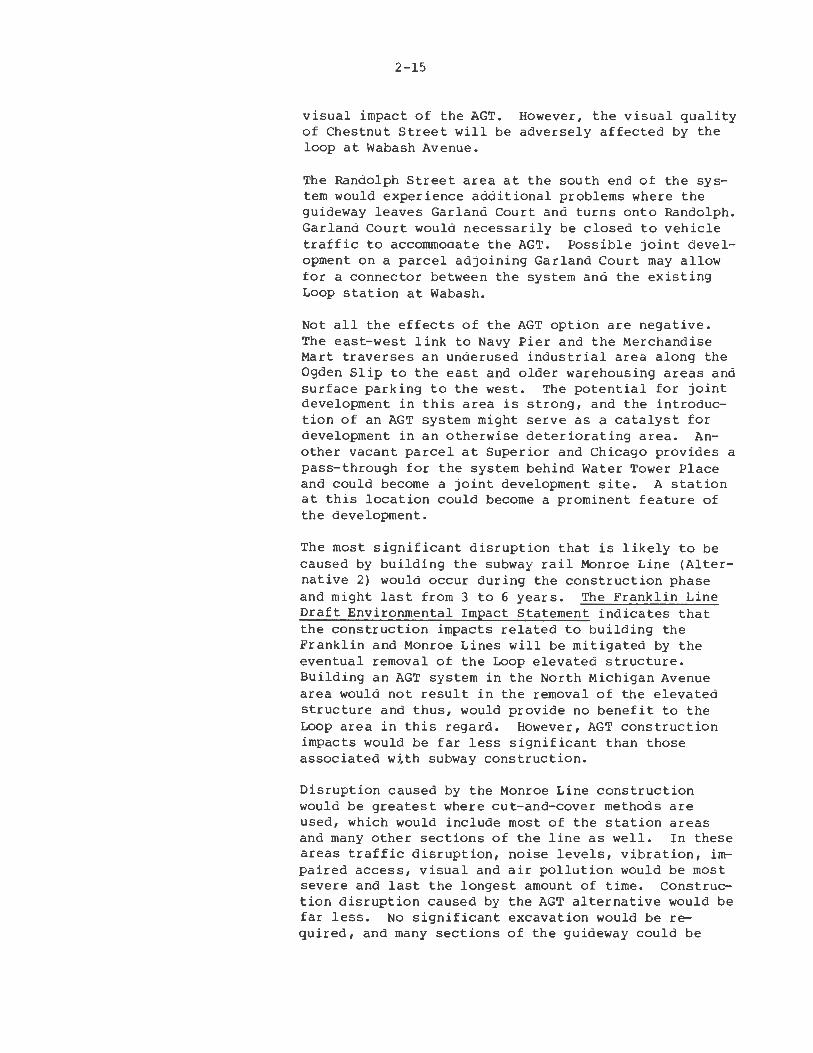
The most significant disruption that is likely to be caused by building the subway rail Monroe Line (Alternative 2) would occur during the construction phase and might last from 3 to 6 years. The Franklin Line Draft Environmental Impact Statement indicates that the construction impacts related to building the Franklin and Monroe Lines will be mitigated by the eventual removal of the Loop elevated structure. Building an AGT system in the North Michigan Avenue area would not result in the removal of the elevated structure and thus, would provide no benefit to the Loop area in this regard. However, AGT construction impacts would be far less significant than those associated with subway construction.
Disruption caused by the Monroe Line construction would be greatest where cut-and-cover methods are used, which would include most of the station areas and many other sections of the line as well. In these areas traffic disruption, noise levels, vibration, impaired access, visual and air pollution would be most severe and last the longest amount of time. Construction disruption caused by the AGT alternative would be far less. No significant excavation would be required, and many sections of the guideway could be
2-16
constructed off-site prior to installation. Construction time for the AGT alternative might be as little as 1-2 years.
Long term noise and vibration impacts are likely to be minimal in either rail or AGT alternatives. Disturbance from the underground rail rapid system would most commonly take the form of noise through ventilation shafts and vibration through ground and structural transmission. Either of these can be minimized through proper design.
According to the Franklin Line Draft Environmental Impact Statement, the construction of the Monroe Line would displace 50 dwelling units with 100 residents and 80 commercial establishments employing 460 people. It is not clear from the impact statement just how much of this displacement would be in the North Michigan Avenue area. Temporary displacement due to construction impacts is likely to be much greater. Displacement resulting from implementation of the AGT alternative would be a function of the degree to which existing buildings are used for station access and resident or business reaction to the visual intrusion of the elevated guideway. If surrounding buildings are not used for station access, displacement resulting from implementing the AGT alternative would be minimal and probably less . than that resulting from construction of the Monroe Line. However, station access may require the elimination of parking lanes where street rights-of-way are narrow. Using existing buildings for station access decreases negative visual effects caused by the system yet requires more displacement. Separating station access from existing buildings requires no displacement, but increases visual intrusion which may result in a local loss of employers, employees, and residents.
The Monroe Line offers clear advantages over the AGT option in terms of long term visual intrusion. After construction, the only sections of the subway line visible at street level will be the station entrances, elevators, emergency exits, and ventilation shafts. Entrances are usually minimal in nature and are easily incorporated with surrounding street furniture. Elevators, emergency exits, and ventilation shafts may use existing buildings or may be part of entrances.
Both the AGT and rail options would complement air rights development over the rail yards. However, the Monroe Line alternative would be more easily inteqrated with current plans. The rail alignment would
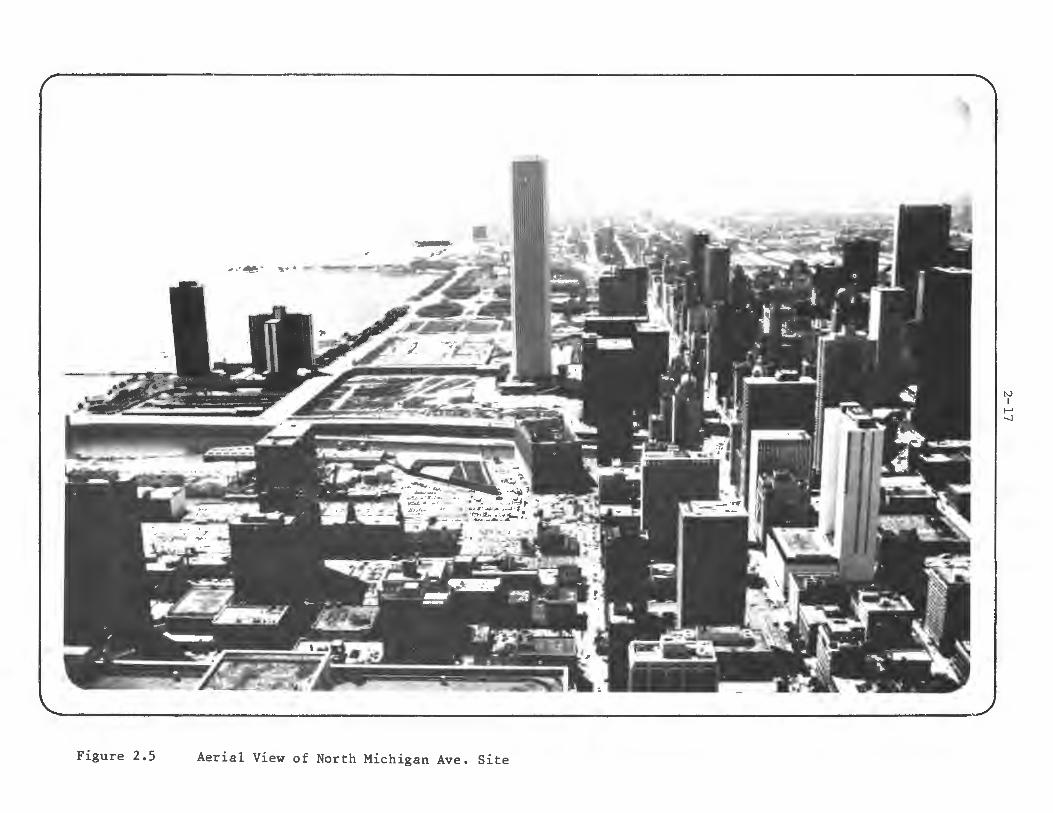
Figure 2.5 Aerial View of North Michigan Ave. Site
N I
I-' -.l
2-18

~-----· --
Figure 2. 7 Perspective Section of Proposed IC Air Rights Development
f\..)
I 1--' I.O
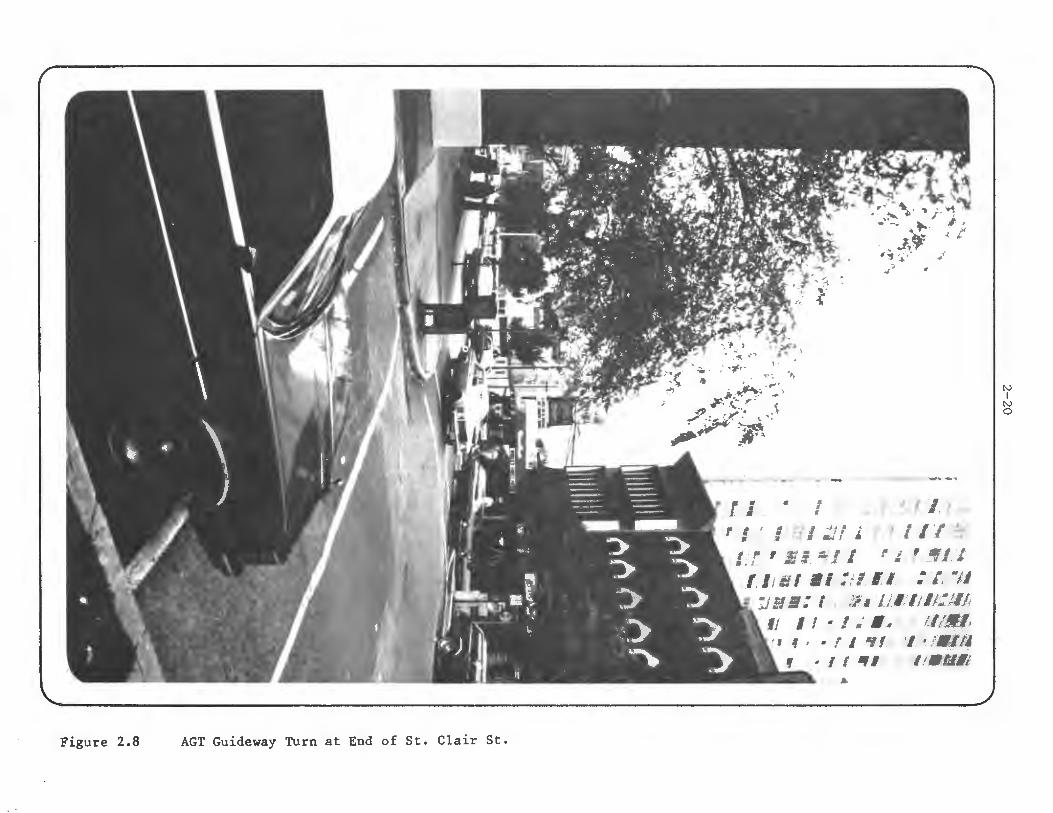
Figure 2.8 AGT Guideway Turn at End of St. Clair St.
,/
.;
·,,
"'" · •.. , - ' "'--'•ii.'''w ..,., •--... -""
f. ,, • # # ' f" -.,, } ~ l "'
I 1 11 l I I -I I "" ' ,. . , ' • f •• •
t .~ 11 !!!d!it#l t • j 4. l iii • r .,;t ; •
:' ,' , ., . f • -1- i-:::i/ ill
'l 1l 11J / Ill;: •· "' ' "fl!//!11!1 • I I '• 'f '/'"" 1
•1
· ;.) l,7 li/6 • , J,., / f.-l lfi!
I I ~ 1 ; •• I l ll/:JI./, ,, f , • , / .,,/ / / /~ ,.,/,
f · I I If l l I I I l.Bli' - ...
N I
N 0
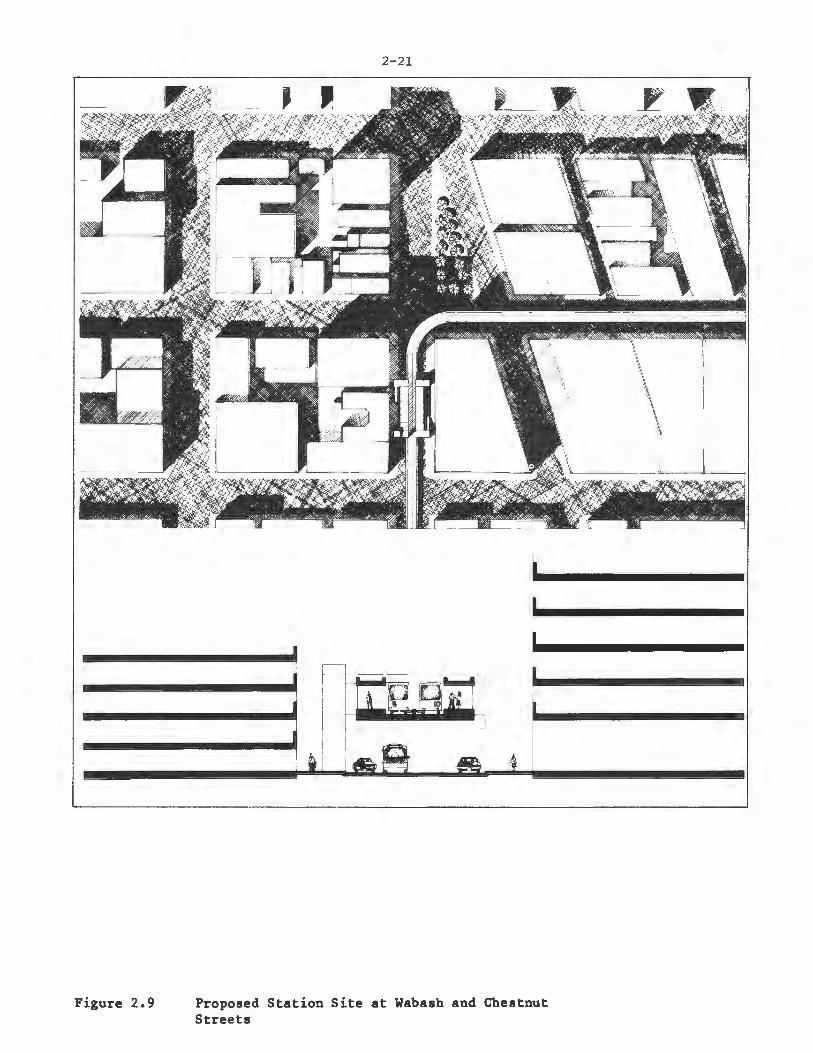
Figure 2.9
2-21
Proposed Station Site at Wabash and Chestnut Streets
2-22

Figure 2.11 View of AGT Guideway Crossing Chicago River
N I
N w
,q
, "11\ L ...-:~ .,,-;;" /'::r" /':Z"" /:V" .r::, /7!1" /":IV r, k .~ - - •·-P ,.,.,..,_,. - .,..., .,,.,=•-= ..,.. ,._ ,,...,,.,,.,,.,_,.._.,..,,.,,,,..,,,.,, ___ ,..,..,,.,,_,__ .,,..,..,..,,,....,,,..,,,,,,,,..,,..,,,..,,..,-,,;, - · /'?flY _,,,,,,, ,-,.,y ,-,,,:,, I!' - ,..,,.,,.. ,.,,.,,, .,,.,,,
2-24
. ~ ti)
~ 0
) Q) -~ >
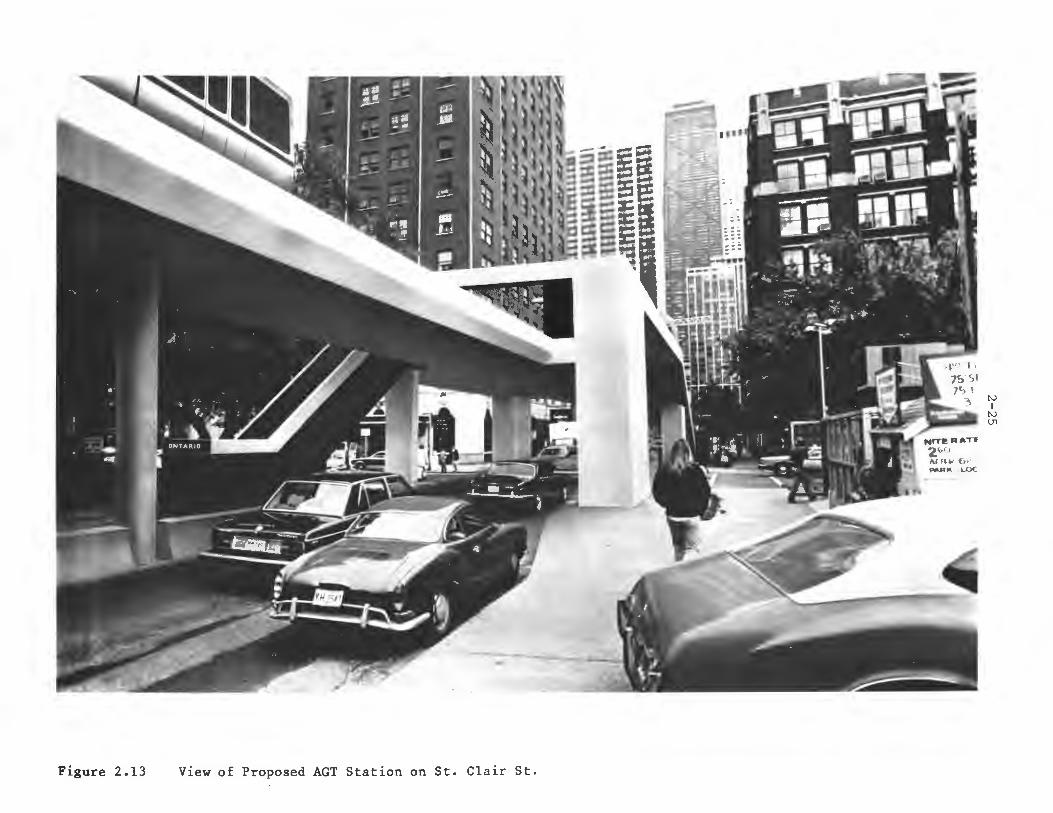
Figure 2.13 View of Proposed AGT Station on St. Clair St.
N I
N V,
2.1.5 INSTITUTIONAL ISSUES
2-26
travel beneath the complex, tunnelling under the Chicago River. An AGT system would probably have to be elevated above the proposed open park. Otherwise, an alignment maintaining traffic separation would have to be devised using one of the lower levels. Such an option would be likely to significantly increase the height of one of the proposed levels and would create design problems where the AGT system changes grade to cross the Chicago River.
The AGT system may or may not offer certain advantages in terms of personal security and the prevention of vandalism. Because the system is elevated, platform areas, entrances, and stairs are all potentially visible to surrounding streets and buildings and, therefore, offer more supervision possibilities than underground systems. Current elevated rail stations in the Loop, however, do experience some problems in security and vandalism. Since AGT vehicles have no operator, in-vehicle personal security may pose at least a perceived, if not real, problem. Both AGT and rail options offer shelter from inclement weather and consequently are somewhat equal in terms of system comfort.
In conclusion, comparing the AGT and rail rapid transit options, the rail option would create major disruption during copstruction, but virtually no long term disruption or visual intrusion. The AGT system would generate modest disruption during construction but would have a long term disruptive and visually intrusive effect. Efforts have been made at this study site to minimize this effect through careful choice of alignment. Harmful effects could be further minimized by insuring that an AGT system is integrated into future development.
2.1.5.1 Setting
Transit planning and operations in the City of Chicago involve a large number of agencies, each having well defined responsibilities. The Chicago Transit Authority (CTA) is the major transit operator in the region and the only public transit operator in the City of Chicago. The City of Chicago holds a majority position on the seven member policy board of the CTA. Four of the members are appointed by the Mayor with the approval of the Governor, and three are appointed by the Governor with the approval of the Mayor. The CTA is responsible for the transit system's management, planning and operations and coordinates closely with the City of Chicago on the area's service needs.

2-27
System construction is managed by the City within the Department of Public Works (DPW) which is responsible for all capital projects for the city. DPW coordinates their activities with the Department of Planning, City and Community Development (DPCCD) which provides direction on physical planning and facilities development.
The agency responsible for the funding and coordination of transit at the regional level is the Regional Transit Authority (Rl'A). Funding decisions by the Rl'A are made on a project rather than a formula basis. Most of those projects strongly favored by the City of Chicago are approved by the Rl'A within the limits of available funding. This in large part reflects the large City of Chicago representation on the Rl'A decision-making board. The RTA Board consists of nine members: four from the City of Chicago, four from the suburban areas and one appointed by the other eight members. A two-thirds vote is required on all decisions.
The Chicago Urban Transportation District (CUTD) is an organization whose responsibilities are specific to the Central Business District. CUTD is a municipal corporation with independent taxing authority which was formed in response to a referendum approved by the area's voters in 1970. Its jurisdiction encompasses the Central Business District which includes the North Michigan Avenue site. CUTD was created for the specific purpose of carrying out the Chicago Central Area Transit Project which is a program consisting of five elements designed to replace the existing elevated structure in the CBD. Two of these elements, the Franklin Line and the Monroe Line subway proposals (considered by the area as one integrated project), have been central to the City's transportation planning efforts since 1968.
Many of the private sector businesses and residents which may be expected to have specific interests in the North Michigan Avenue area are either represented on the CUTD Boara or are indirectly involved through participation in the District's Task Force of Cooperating Agencies.
Also participating in transit planning for this area is the Chicago Area Transportation Study (CATS) which is the state-designated Metropolitan Planning Organization. Like most MPO's, CATS does not have any independent implementation or decision-making authority. The Illinois Department of Transportation (IDOT) is
2-28
indirectly involved in transportation activities primarily through its representation on CATS. IDO'l' had greater involvement in transit financing decisions prior to the formation of the RTA in 1973. Other agencies whose activities affect planning in the Chicago area are the Northeastern Illinois Planning Conr mission and Illinois-Indiana Bi-State Commission. Their functions, however, are not specific to transportation and they have little involvement in projects of a more localized nature.
2.1.5.2 Key Issues
Local representatives felt that an AGT system for sections of the North Michigan Avenue area was possible, depending upon the outcome of other transit projects currently in the final planning stages for this area. Specific problems of visual intrusion and urban design incompatibility might prevent an AGT system from being implemented, however.
Because the Franklin and Monroe Line project is currently the City's highest priority, it was felt that the City officials would be unwilling to seriously consider a North Michigan Avenue AGT until a final determination on this project is made. In that local funding for an AGT system is not likely to be available from traditional sources if the Franklin and Monroe system is built, and the need for an AGT system would also be reduced as a result, the following discussion reflects the local attitudes towards AGT implementation if either the Franklin and Monroe project is not built, or a more limited system is built.
DPCCD and DPW felt that a north/south route presented many problems due to the narrowness of the street used in the alignment. DPCCD representatives also stated that further residential development in the North Michigan Avenue area is a high city priority. To the extent that the residents would object to an elevated guideway system, which was considered likely, an AGT system would not be viewed favorably by City officials.
The area which appeared to be most suited to an AGT system from a visual and urban design standpoint was the east/west alignment from Navy Pier to Merchandise Mart. The primary reason why representatives felt that an AGT system posed fewer visual problems along the east/west alignment was that the development is much more sparse than in the north/south area and in fact many vacant parcels suitable for future development exist, thereby providing opportunities to make an

2-29
AGT system compatible with any new development that might occur.
An issue that was advanced as a potential problem by DPCCD representatives was whether any elevated AGT system could realistically be considered since so much effort has been placed on plans to remove the "el" from the downtown. It was noted by a DPW representative, however, that removing the el is still an unresolved issue and the character of the North Michigan Avenue area, particularly along the east/west segment, is appreciably different from the area encompassed by the el.
Any contribution that an AGT system could make to positively influence economic development in this area was considered to be desirable. Due to the already high level of development along the north/south alignment, only limited new development is anticipated except in the I.C. Air Rights area.
Both DPCCD and DPW representatives noted that unlike the north/south alignment, the potential for an AGT system to support and encourage economic development along the east/west link was positive. The olaer warehousing areas, which are candidate redevelopment sites, underused industrial areas, parking areas and vacant parcels which exist along this alignment may all be developed to better uses and would proviae opportunities for joint development with an AG'I' system. The redevelopment of Navy Pier is currently underway. An AGT system that would connect Navy Pier to the North Michigan Avenue area and to the Loop was reviewed positively.
It was suggested that modifying the proposed AGT alignment so that it better tied into the Loop area and particularly the commuter rail stations on the west side of the CBD would enhance the potential for the system to further economic development objectives in this area.
The existing bus system was not considered to have an impact on economic development. A subway system was viewed to be a positive stimulus and reinforcement to development. However, the more closely spaced stations and more frequent operations of an AGT system were viewed favorably in comparison with a subway system provided that the aesthetic problems cited above could be resolved.
2-30
In reviewing the demand projections for an AGT system, a CTA representative did not feel that any bus services could be eliminated if an AGT system were implEcmented. This is, in fact, a major disadvantage of AGT from CTA's perspective. A more extensive system, similar to the Monroe Line rail proposal, would be viewed more favorably from the operating perspective than the limited systems studied, as it would allow bus cuts. However, AGT capacity might not be sufficient to provide such service. It was also felt to be unlikely that the AGT fare of 25 cents proposed in this study would be implemented; a fare equal to the bus fare of 50 cents is more likely.
With respect to the cost projections and the local ability and willingness to fund an AGT system, the major impediment advanced by DPCCD representatives was the commitment of local CUTD funds to the Franklin and Monroe Line project should that be built. However, the projected $50 to $80 million cost for an AGT system relative to the proposed subway system costs were viewed favorably.
It is possible that some additional Rl'A funds could be requested to fund an AGT project in this area even if the Monroe and Franklin Line was constructed. DPCCD representatives suggested that this may not be feasible, though, due to the resulting disproportionate
I
expenditures for projects in the downtown area and the expense of projects in other areas of the City.
One DPW official felt that the capital costs presented for the AGT alternative might be low based on their department's experience in managing the construction of major capital projects for the City. DFW representatives also expressed concerns over the winter operation of AGT without guideway heating, or the operating costs if the guideway was heated. Another concern was that AGT might not offer any significant advantages over a rail technology, while requiring additional resources to maintain and operate technology. Capital cost was viewed as less of an issue than operating cost by the DEW, with large concerns expressed over potential operating deficits.
Viewing the operating costs for an AGT system, several other points were noted. CTA representatives did not feel that any bus cuts were possible due to the AGT system. Second, CTA representatives expressed an unwillingness to support the AGT operating deficit, which is projected to be near $1,000,000 annually (before federal operating support). CTA representatives
2-31
also stated that assuming responsibility for an AGT system might require considerable additional expense to gear up their agency for AGT operations. To the extent that this adversely affected the availability of funds for bus services, the CTA would be less inclined to favor an AGT system.
Labor issues are not expected to be a problem because no bus reductions are anticipated. All bus routes in the area are through routes which carry passengers into parts of the Loop (CBD) which are not served by the AGT alignment, and could not even be well served by an AGT/rail path. CTA representatives did note, however, that in the event of any bus cuts, 13c issues could arise.
All of the representatives felt that due to the system's location, the problems of personal security would be similar to those currently experienced on the elevated Loop system. These problems are typical of security problems which arise in major downtown areas. A DPW official suggested that if a lower fare was charged for the AGT system than for other transit services in the area, then the opportunities for crime might be increased.
In general, all of the representatives felt that a high level of security must be provided at the AGT stations and on the vehicles. The need was perceived to be greatest during off-peak times when a lower level of activity could be expected. None of the representatives were of the opinion that issues of personal security would impede AGT implementation as long as proper security assurances would be provided.
The institutional responsibilities for an AGT system at this site is likely to follow the established patterns which exist for managing transit activities in the city. In general, an AGT system is compatible with the city's areawide plans except in the residential areas as previously noted. It is likely that the DPW would manage the construction of an AGT project as they would any capital project for the City. The DPCCD would be in charge of system planning.
The CTA, which is the only public transit operator in the City, would be the likely agency to operate the system. Fr om an overall perspective, even though there are many agencies involved in transit activities in the Chicago area, the clear delineation of planning and operating responsibilities among these agencies and the close working relationship that exists between

2.1.6 SUMMARY
2-32
CTA and the City is likely to facilitate implementation in this area.
An AGT system appeared to have more potential in some sections of the study area than others. It was felt that in the more acceptable areas, an AGT alternative could receive serious consideration. The major obstacle to a north/south alignment for an AGT system is that any streets which would be feasible from a service perspective would not be acceptable from the standpoint of visual impacts or urban design compatibility. If an acceptable alignment could be identified, it was felt that the system would have definite service advantages over the existing bus system, compare favorably with a subway system, and it would support the existing economic activity along North Michigan Avenue and vicinity, although it was not expected to serve as a major catalyst for new development since the area is already highly developea.
It was not felt that any real opportunities existed for an AGT system to replace bus services in this area. This minimizes the operating cost advantage of AGT but it also eliminates any labor problems which could otherwise occur. It was felt that the system 1 s capital costs would be acceptable to local officials; however, whether funding would be available is highly dependent on the outcome of other currently planned transit projects for this area.
Issues of personal security were a strong concern but were not considered to be any more severe than those currently experienced on the "el11 and possibly less than those expected on a subway system. It was felt that with adequate security assurances this was not likely to jeopardize AGT implementation.
The AGT alternative which appeared to be most promising for this area was an east/west alignment that connected Navy Pier at least to the North Michigan Avenue area and possibly to the Merchandise Mart or the commuter rail stations. The desirable characteristics of this option from the local perspective were:
o This system would be compatible with the proposed Franklin and Monroe Line project and could connect to it at its proposed termination point.
o 'lbe land uses along this east/west alignment are primarily underused industrial parcels. An AGT system in this area would not be disruptive to residential or collDllercial activities and could serve

2-33
as a catalyst for the area's development and redevelopment.
o The redevelopment of Navy Pier is currently underway under the direction of the City's Public Buildings Commission. The construction of this AGT increment could possible be available from redevelopment project funding.
The key issues surfaced in this site that are likely to hold for other, similar sites are:
o Highly developed areas with mixed land uses including residential are likely to resist elevated structures.
o A transit operator with a commitment to existing technology (other than bus) has little incentive to adopt a new technology.
o A need for improved circulation is likely to be perceived in high density areas.
o Such areas are able to support significantly higher capital costs for a system than smaller activity centers.

2.2 MERRILLVILLE
2.2 .1 SITE CHARACTERISTICS
2.2.2 ALTERNATIVES DESCRIPTION
2-34
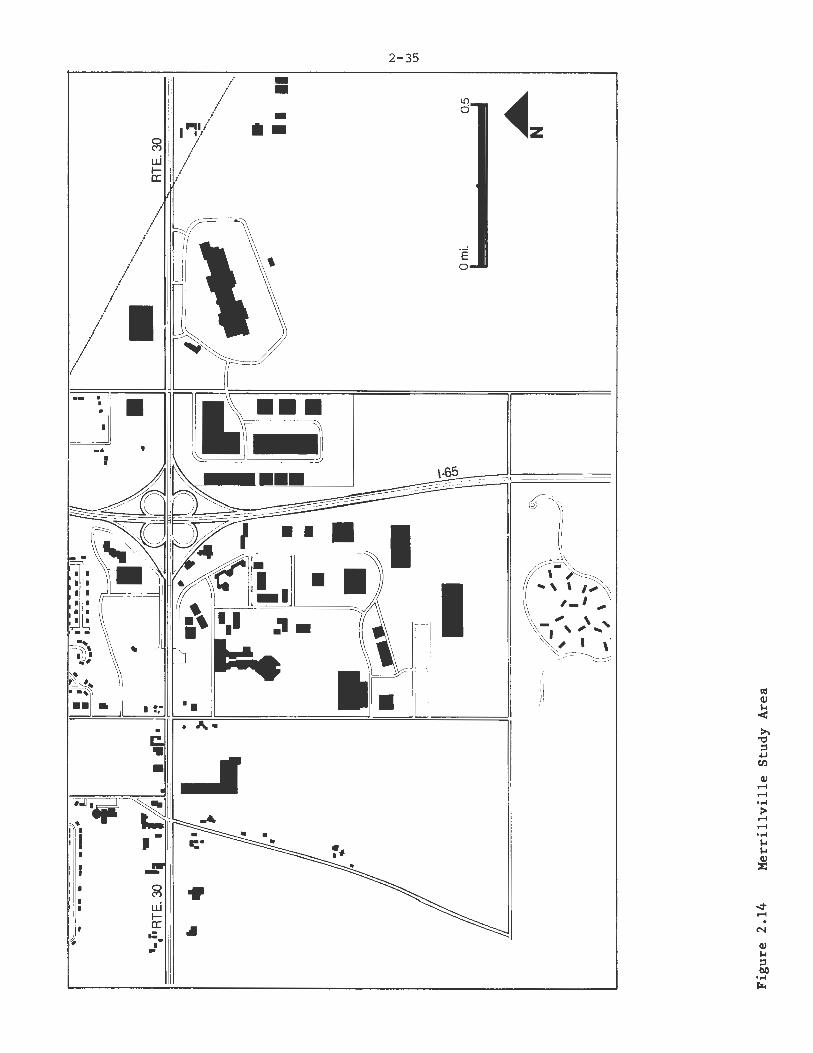
The Merrillville study area is located in northwestern Indiana at the fringe of the Chicag~Gary metropolitan/industrial area and includes hotel and medical uses in addition to the predominant mix of office and retail activity. Merrillville is still in the process of expansion with many areas of proposed development still occupied by agricultural uses. It is projected that, when fully developed, the area will include over six million square feet of retail, office and light industrial space. The complex is centered around the intersection of Interstate 65 and U.S. Highway 30, with development situated in the four quadrants formed by the intersection. Figure 2.14 shows the major elements in the site.
By virtue of its suburban location and makeup of uses the Merrillville site has many similarities to the Oak Brook study area. The critical difference is the stage of development. While Oak Brook has apparently reached full maturity, Merrillville is still developing, and can be viewed as typical of the suburban commercial complex in the early stages of growth. The development pattern is still subject to change, and could be highly influenced by the introduction of a new transit system. Scale of development, image and density are all spmewhat variable.
In the current pattern of growth, buildings tend to be isolated from one another with wide recently landscaped areas surrounding each center. Little or no accommodation is made for pedestrian travel with no direct connection provided between office and retail buildings. The automobile is the only form of transportation used in the complex. The four quadrants of the complex are connected only by the U.S. 30 underpass at the intersection of the two highways, and according to the local planning department traffic congestion has already become a fairly serious problem during busy shopping periods. In contrast to Oak Brook, many noon-hour and mid-day trips are currently made within the complex. Almost all trips are made by auto with little or no pedestrian travel. The major function of a new transit system would be to serve as a circulator between and within each quadrant of the Merrillville complex.
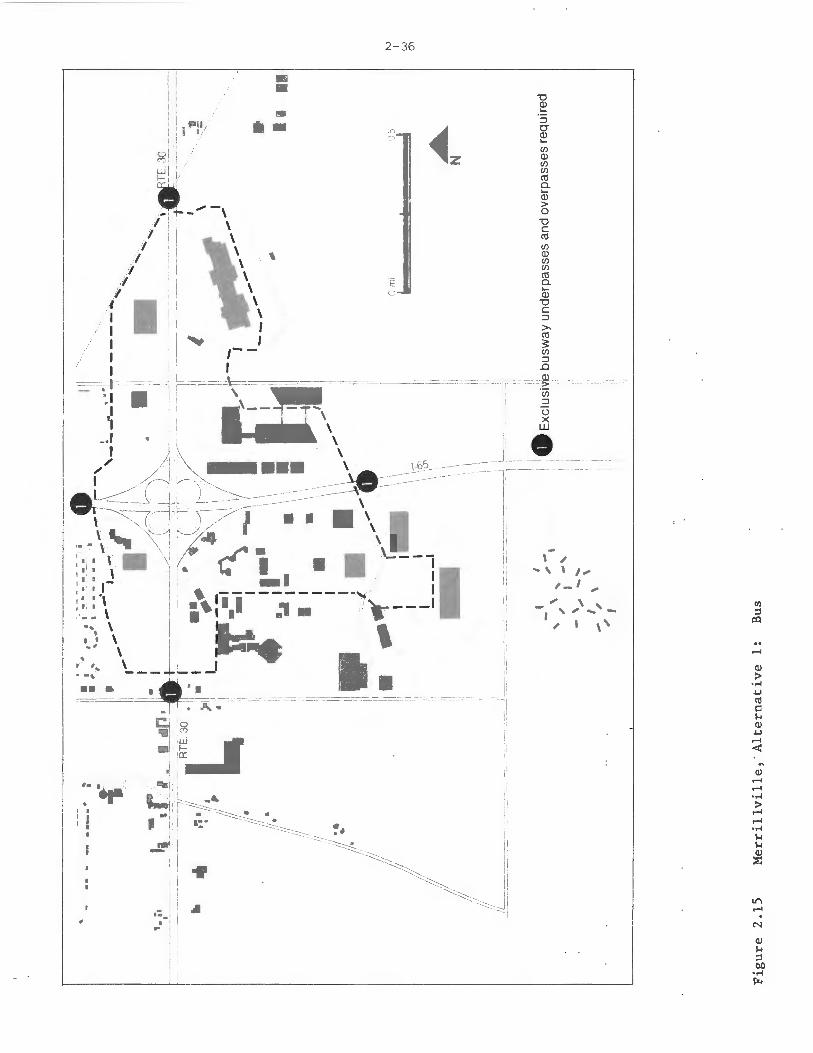
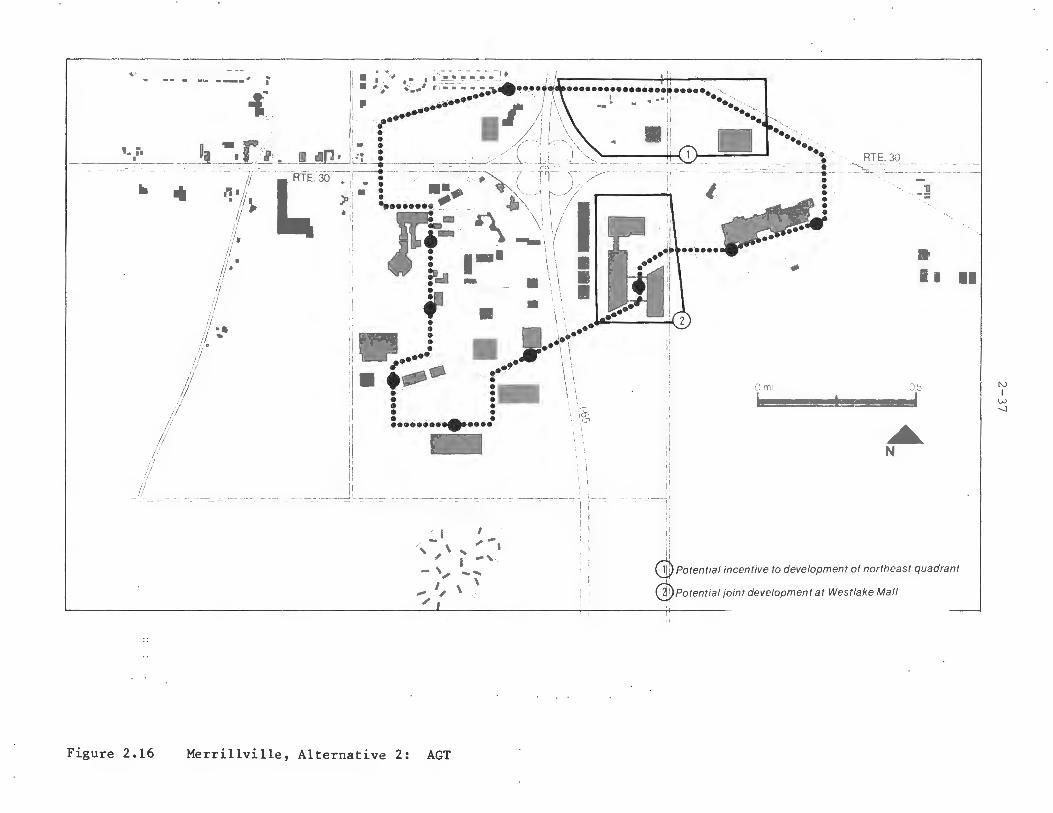
Figures 2.15 and 2.16 show the bus and AGT alternatives which were studied in addition to the status quo. The bus alternative requires the construction of short portions of exclusive roadway, two overpasses over US-30, two underpasses under I-65 and some priority
2-35 ---·-u
7 • ~--- . ,,,•-~ !,~=
-; ~~-------~-~ - -~ : -4 ~,--; I ■ I
i: : I .~ ••I .:, • ~ []
It;]□ I •- I I ' • • Ai. •
• _. • I
~
li ~ - • •
: I -l
g .. I I
u.i I I
I-a: .. , •=. ,-, I ..
®l
.,,. \ ' ' ....... ~ I \ ,
~-=---:::::::::: /
'1 ),
11
i / ---·-
I .,,,,. -, ,_ ,- - \ l
I I \ 1 \
I \\ /I \ ✓ \
I \ if I ,. ~ I
/ I I ...... ,--
1 I I
'
2 - 36
E
- --~-
:! ■ ~ \ ----;] A~-- -'~I-- \-l;{L-- II e{~•EJ~ l. • • ■ \~--, I :·:\. \j t ,;f !.. ·--~ ___ !I I,
Jc___
'. • \ I --- I : : : 1- •._ lj , - .!I • '• ,., •■• 1 I I I I
'._ - \ ... \
I ~ \ '1 ' ··-.,; \ I I
.. \ --l---, ,, --•... .... ■■ ----- - I • - :;.._ ;
·=-1 I .. ..
=
-g ,_ ·s C,
~ (/) Q) (/) (/)
co a. cii > 0 -0 C co (/) Q) (/) (/)
co a. ,_ Q)
-0 C ::::, >, co 3 (/) ::::, .0 Q)_ ~
·en ::::, (.) X w
e
-\ ✓ .. \ \ ,.,,,. ,_ I .,,,.
.,,,. \ ' -'., ... I, I \'
.. ......
If'\ ...... . N
... ----· .. I
{ ■ # /· , __ ,,. , ,....._ - - - - :..••··· ················~ ····· I ■ ; •# ·• I;--;.----------=,. ~ I
I ·••• I ,1 ••
. (........... I I' 11 I -. . ~- I ········
___ '-_l· _ __ 11_ •• i:1-. ■ •n. II~ i --~~ ~[4 ~ -· --- 1 1----•---" ..
f ... ~II --•rj ~·~11111. /
• 1.i , ... 1 ··-· \\ ■ !I • .a - ■ ■
I I • ■
j I ¥1 ■ • \ \ .,.- ii '-. Ji •• I • g 11 ••
/
//• . !11 ~ ;;. ~ ... •··\ · , \· ,1
. ·- ,, I : : ·-j\ : : \ \a,
............... ! 10'
I - \ _,_ - -- - - __ ___,, --- - ______ \ L -
. - - ··-··-·· - - - --- - - -- - - - 7 r-
I 1 -- p ,,
-
m,
RTE. 30=-=--------; ~--
-!
• ••
05
• N
II
, , , , ,,,-, - ' I _, .,, .... ... -- / \ \
(]> Potential incentive to development of northeast quadran t
,, , @Poten tial joint development at Westlake Mall
Figure 2.16 Merrillville, Alternative 2: AGT
N I
w --.J
2 .2 .3 DEMAND AND COST ISSUES
2-38
treatments on roadways shared with or crossed by auto traffic. Mid-size (30 passenger) buses would be used in the service operating at 5 minute headways during the hours that retail stores are open. Stops would consist of simple shelters only.
The AGT alternative would use elevated guideway for its entire length, with 9 stations integrated, if possible, with the buildings being served. Thirty-passenger vehicles would provide service on two minute headways during shopping hours. A suspended technology is used to minimize visual impacts. Both the AGT and the bus system operate in both directions on a two-lane guideway or roadway.
Both systems follow the same general alignment. Starting from the northeast corner, the alignments cross I-65 to the west, serve the hotel/convention center/theater area and then proceed to the Liberty Square area on Broadway before turning south. At this point, several variations on the alignment shown could be considered. All alignments would serve the Century Mall; an alternative alignment would then swing east to the Lincoln Square area before continuing south to the Environ Center. Another possible variation exists at this point to cross Broadway to the west to serve an area of potential development. All alignments would then serve the Methodist Hospital complex, turn east, cross I-65 again, serve Westlake and Southlake Malls and return to the northeast quadrant. Some variations are possible in serving Southlake Mall with one or two stations. The many possible alignments in the southwest quadrant of the site offer both potential in integrating with new development and problems of uncertainty about the most suitable location. There are also strong cost issues associated with the length of guideway that will work to minimize its total length; leaving the loop incomplete at the northeast corner and using a more direct alignment are the obvious options.
Table 2.4 summarizes the basic alternatives.
There are several possible components of demand for an internal circulation system in Merrillville, including induced regional shopping trips due to the enhanced attractiveness of the area, distribution of regional transit trips if service is implemented, internal "noon-hour" trips by workers, and internal trips by shoppers. Distribution from remote parking facilities was not considered, although this is a future option
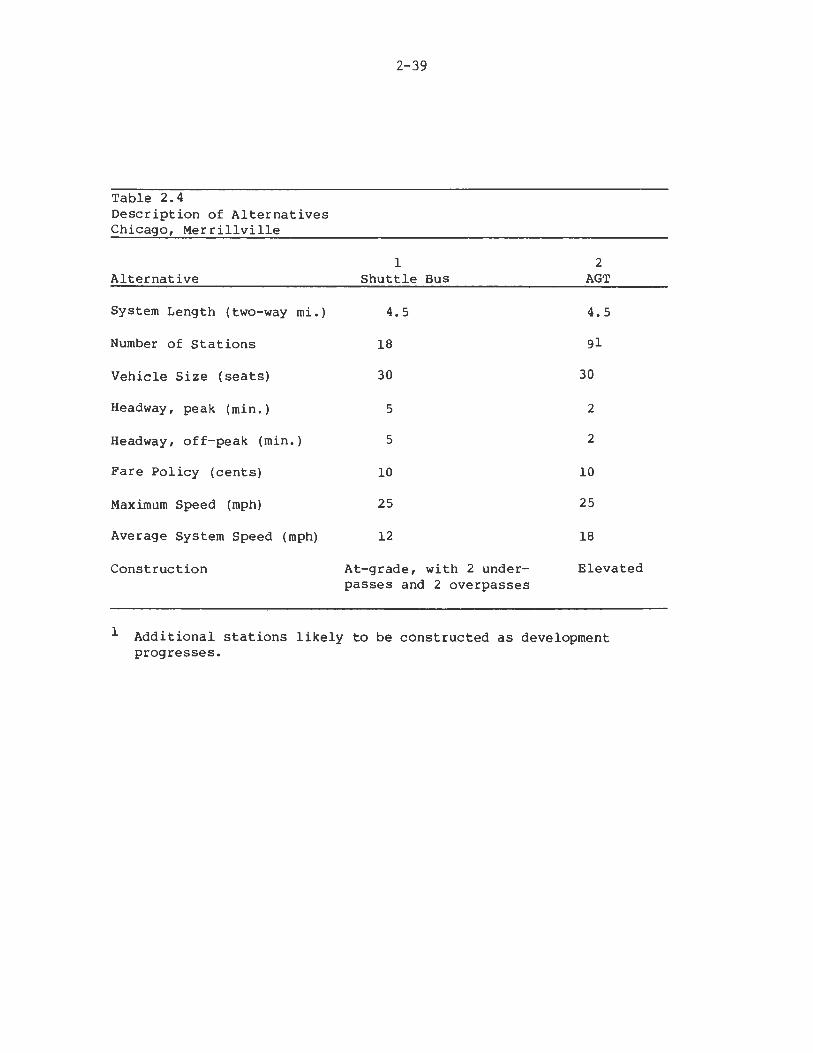
Table 2.4 Description of Alternatives Chicago, Merrillville
2-39
l Alternative Shuttle Bus
System Length (two-way mi.) 4.5
Number of Stations 18
Vehicle Size (seats) 30
Headway, peak (min.) 5
Headway, off-peak (min.) 5
Fare Policy (cents) 10
Maximum Speed (mph) 25
Average System Speed (mph) 12
Construction At-grade, with 2 underpasses and 2 overpasses
2 AGT
4.5
91
30
2
2
10
25
18
Elevated
l Additional stations likely to be constructed as development progresses.
2-40
which allows considerable land use flexibility. Table 2.5 shows background travel demand data for the site, while Table 2.6 summarizes the demand estimates for each alternative under two floor space and development scenarios. The first, with 4.8 million square feet, is based on current plans, while the second, 7.5 million square feet, is a possible long-range scenario.
Two factors about AGT may induce added shopping trips to the area. The first is an increase in "retail density," or the number of opportunities within a certain area or internal access time; AGT, by reducing internal travel times, increases retail density, which in turn is a variable that influences choice of shopping destination. It is included in the demand model applied in Merrillville; AGT is predicted to increase trips by 2.5 percent over the base amount. The second factor by which AGT may increase regional shopping trips is through a reduction in auto congestion around the site. A two minute reduction in average travel time (which corresponds to a 10 minute reduction in peak times) would have a comparable effect to the density factor. The reduced congestion effect was not included in the demand estimates because current projections of volumes and roadway plans indicate that adequate capacity should exist. A bus system is not likely to be perceived as strongly by potential shoppers as an AGT; the retail density effects were thus not included in the bus demand forecast. (Even if they were, the corresponding increase would only be O. 7 percent.)
Distribution of regional transit trips is another potential function of an internal circulation system. A regional transit service to Merrillville composed of 5 express routes operating at 15 minute headways at peak hours was proposed and examined. Each route was assumed to operate for 12 miles--the first eight local and then four miles express to the site. (This assumes that short trips are not amenable to transit, and that few workers live more than 12 miles from the site.) A very rough estimate indicates that 25 percent of Merrillville workers might live within a one-quarter mile walk of one of the routes, and that 10 percent of those might use transit. A SO-cent fare is assumed. Relatively low ridership results, and this would not be a major component of internal transit ridership.
The "noon-hour" worker trip component of demand is estimated using the DPM Planning Models for a shuttle bus and an AGT system. An AGT "image" variable is used, based on Washington subway versus shuttle bus
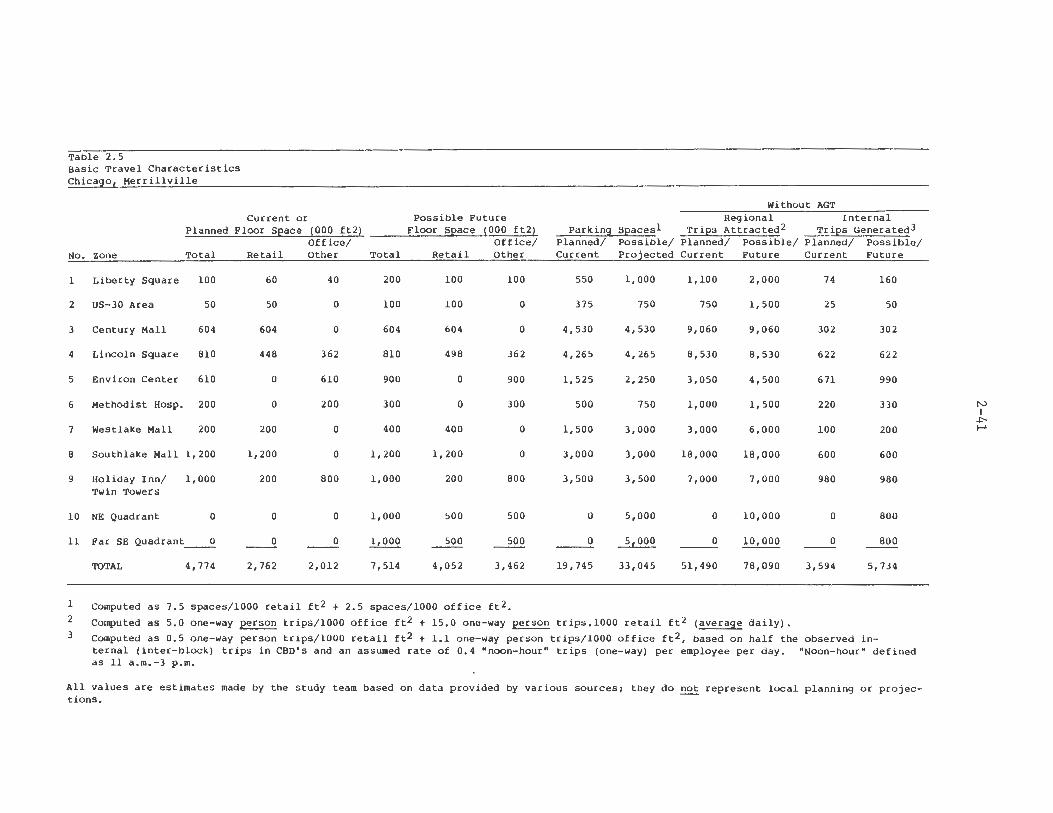
Table 2.5 Basic Travel Characteristics Chicago1 Merrillville
Current or Planned Floor Space (000 ft2)
No. zone Total
1
2
3
4
5
6
7
8
9
Liberty Square
US-30 Area
Century Mall
Lincoln Square
Environ Center
100
50
604
810
610
Methodist Hosp. 200
Westlake Mall 200
Southlake Mall 1,200
Holiday Inn/ Twin Towers
1,000
10 NE Quadrant 0
11 Far SE Quadrant ___ o
TOTAL 4,774
Off ice/ Retail Other
60
50
604
448
0
0
200
1,200
200
0
0
2,762
40
0
0
362
610
200
0
0
800
0
0
2,012
Total
200
100
604
810
900
300
400
1,200
1,000
1,000
1,000
7,514
Possible Future Floor Space (000 ft2)
Retail
100
100
604
498
0
0
400
1,200
200
500
500
4,052
Office/ Other
100
0
0
362
900
300
0
0
800
500
500
3,462
Computed as 7.5 spaces/1000 retail ft2 + 2.5 spaces/1000 office ft2.
Parkin9. Planned/ Current
550
375
4,530
4,265
1,525
500
1,500
3,000
3,500
0
0
19,745
s12.acesl Possible/ Proiected
1,000
750
4,530
4,265
2,250
750
3,000
3,000
3,500
5,000
5,000
33,045
Without AGT Regional Internal
Trips Attracted2 Trips Generated3 Planned/ Possible/ Planned/ Possible/ Current
1,100
750
9,060
8,530
3,050
1,000
3,000
18,000
7,000
0
0
51,490
Future
2,000
1,500
9,060
8,530
4,500
1,500
6,000
18,000
7,000
10,000
10,000
78,090
Current
74
25
302
622
671
220
100
600
980
0
0
3,594
Future
160
50
302
622
990
330
200
600
980
800
800
5,734
1
2
3 Computed as 5.0 one-way person trips/1000 office ft 2 + 15.0 one-way person trips,1000 retail ft2 (average daily).
Computed as 0,5 one-way person trips/1000 retail ft2 + 1.1 one-way person trips/1000 office ft2, based on half the observed internal (inter-block) trips in CBD's and an assumed rate of 0,4 "noon-hour" trips (one-way) per employee per day. "Noon-hour" defined as 11 a.m.-3 p.m.
All values are estimates made by the study team based on data provided by various sources; they do not represent local planning or projections.
N I ~ f--1

2-42
Table 2.6 Daily Ridership Summary Ch . icaqo, Merrillville
1 2 3 Alternative No Internal Transit Shuttle Bus AGT Floor Space (millions, ft2) 4.8 7.5 4.8 7.5 4.8 7.5
Re9 ional Tr i1;2s Work: Total 23,900 37,600 23,900 37,600 23,900 37,600
Auto 23,300 36,600 23,300 36,600 23,300 36,600 Transit! 600 1,000 600 1,000 600 1,000
Shop: Total (all auto) 2 41,400 60,800 41,400 60,800 42,400 62,100
Internal Circulation Workers3: Total 4,800 7,500 8,100 12,800 12,400 19,500
Auto 4,800 7,500 3,800 6,000 2,600 4,100 Tr ans it 0 0 4,300 6,800 9,800 15,400
Shoppers4: Total 1,700 2,500 2,800 4,100 5,200 7,700 Auto 1,700 2,500 1,300 1,900 900 1,300 Transit 0 0 1,500 2,200 4,300 6,400
Daily Internal Transit Ridership 0 0 6,100 9,500 14,400 22,300
Transit Passengers from 12n-lp5 1,400 2,200 1,900 5,100
1
2
3
4
5
Half may use internal circulation, depending on terminus of routes; estimates made using CS work mode choice model assuming 5 express bus routes operating a.m. and p.m. rush hours only at 15 minute headways and a $0.50 fare. Since this ridership is a small part of the total, it was not recomputed for the "no internal transit" case.
Increased attractiveness due to internal transit based on increase in effective retail density (retail employees/number of acres) which affects regional shop destination choice. Increase in density computed as exponentiated utility of internal transit/exponentiated utility of internal auto, with coefficients from internal shop trip model. Computed using DPM Manual internal worker frequency, destination and mode choice model, in pivot point form from a base trip rate of half that found in CBD's. The base trip assumption was roughly validated based on noon-hour traffic data. An "image" variable based on Washington Metro versus minibus shuttle is used with the rail "image" being assumed to hold for AGT. This is the major difference from bus.
Computed using DPM Manual internal shopper model (modified to include trip generation increases) plus new regional shop trips attracted due to the density increase. An AGT image variable is used again.
Based on 30% of internal worker trips and 8% of internal shopper trips.

2.2.4 CX>MMUNITY AND URBAN DESIGN IMPACT ISSUES
2-43
ridership at noon hours; AGT "image" is assumed to be equal to rail's, and this variable accounts for the bulk of the difference between AGT and bus demand estimates. A base noon hour trip rate of half that found in CBD's was assumed and validated approximately on noon traffic flow information on US-30. Changes from this rate as a function of AGT and bus image and service level were then computed as shown.
A similar approach was used for shopper trips, with AGT ridership being composed of new shoppers attracted by the increased density (all of whom would presumably use AGT} plus the change in existing internal shopper travel from the base rate of approximately 2.5 daily internal trips per thousand square feet of retail floor space (again half the corresponding CBD value).
Total daily internal ridership estimates of 6,100 to 9,500 bus trips and 14,400 to 22,300 AGT trips result. Total daily shopping trips increase by 1,000 to 1,300. Some increase in retail sales is expected from this demand increase, but no estimate is made.
Table 2.7 presents a revenue and cost summary. The total capital cost of AGT is approximately $30,000,000. With 7.5 million square feet of floor space at an average cost of $40 per square foot, the total private investment in the site is $300,000,000. Thus, an AGT would add 10 percent or more to the costs of the site, a significant amount. AGT operating costs would be higher than those of bus in total, but would be lower on a per-mile basis. A fare of 10 cents, typical of downtown people mover proposals, is assumed for the analysis. Revenues do not cover either AGT or bus operating costs under either floor space scenario.
Financing options for the AGT or bus systems include the possibility of 80 percent Federal funding for capital costs as well as a variety of private or local mechanisms such as special benefit districts, sales taxes, and others. Operating costs could be met through selected service reductions from the alternatives analyzed, fare increases (although these would reduce ridership and benefits) and possibly the selected introduction of parking fees to cross-subsidize the system. If capital cost issues were not too burdensome, private interests might also choose to fund some of the operating deficit, as is currently being discussed in some downtown applications.
Of the three options for Merrillville, the status quo is the easiest to describe. Continuation of the status quo may eventually result in increased congestion but will probably not entail any significant community disruption outside of the visual intrusion of
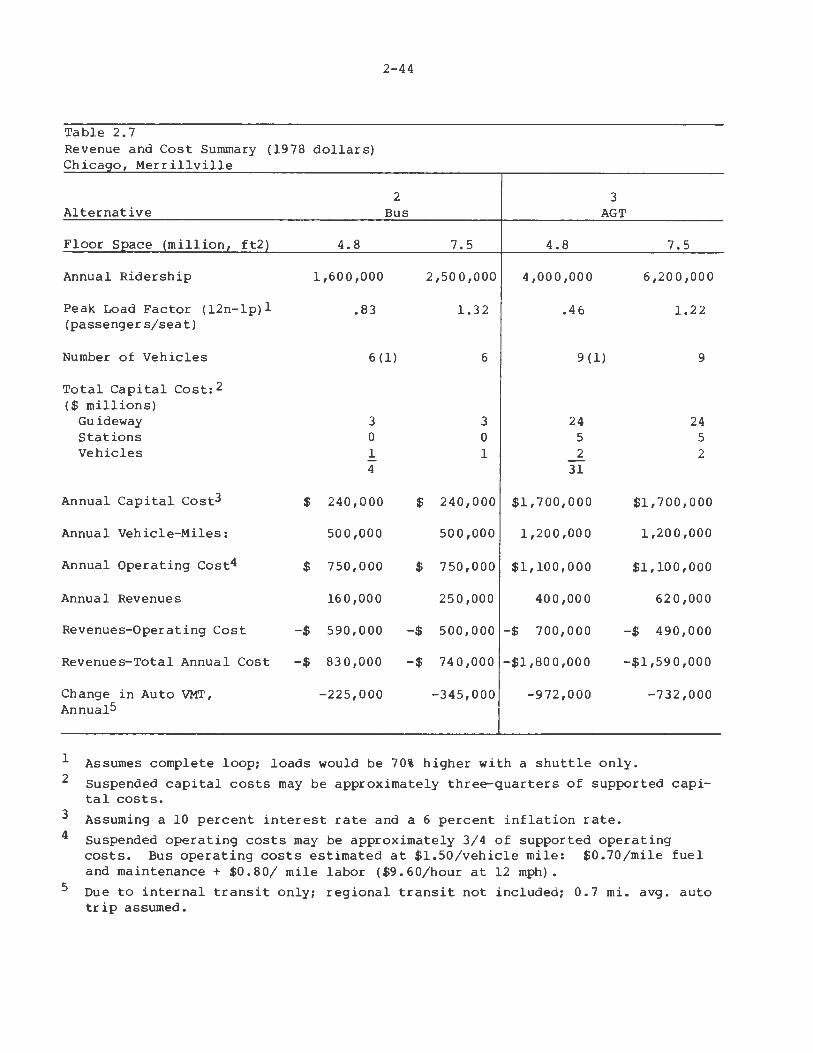
Table 2. 7 Revenue and Cost Summary (1978 dollars) Chicaqo, Merrillville
Alternative
Floor Space (million, ft2)
Annual Ridership
Peak Load Factor (12n-lp)l (passengers/seat)
4.8
1,600,000
.83
2-44
2 Bus
Number of Vehicles 6 ( 1)
Total Capital Cost:2 ( $ millions)
Guideway Stations Vehicles
Annual Capital Cost3
Annual Vehicle-Miles:
Annual Operating Cost4
Annual Revenues
Revenues-Operating Cost
Revenues-Total Annual Cost
Change in Auto VMT, Annuals
$
$
-$
-$
3 0 1 4
240,000 $
500,000
750,000 $
160,000
590,000 -$
830,000 -$
-225,000
7.5
2,500,000
1.32
6
3 0 1
240,000
500,000
750,000
250,000
500,000
740,000
-345,000
4.8
4,000,000
.46
3 AGT
7.5
6,200,000
1.22
9 ( 1) 9
24 24 5 5 2 2
31
$1,700,000 $1,700,000
1,200,000 1,200,000
$1,100,000 $1,100,000
400,000 620,000
-$ 700,000 -$ 490,000
-$1,800,000 -$1,590,000
-972,000 -732,000
1
2 Assumes complete loop; loads would be 70% higher with a shuttle only.
Suspended capital costs may be approximately three-quarters of supported capital costs.
3
4
5
Assuming a 10 percent interest rate and a 6 percent inflation rate.
Suspended operating costs may be approximately 3/4 of supported operating costs. Bus operating costs estimated at $1.50/vehicle mile: $0.70/mile fuel and maintenance+ $0.80/ mile labor ($9.60/hour at 12 mph).
Due to internal transit only; regional transit not included; 0.7 mi. avg. auto trip assumed.

2-45
vehicular traffic, and road and parking construction. Automobile access will probably have to be provided in any case. No other significant impacts are likely to occur.
Turning to AGT and bus, displacement of businesses or other uses aside from agricultural would not be an issue in any of the alternatives. Since the crime rate appears to be low, personal security and vandalism are currently not an issue and are not likely to become so in the foreseeable future. In terms of accessibility, either bus or AGT transit options would improve overall accessibility by offering a greater range of travel choices than currently exists.
In contrast to Oak Brook, bus and AGT options for Merrillville appear to be more evenly balanced in terms of advantages and disadvantages. Both alternatives would require some construction.
The AGT alternative would require the construction of an elevated guideway and stations for the entire system. Thus, while the bus can use existing roadway for some of its route, the AGT cannot. However, where busway is needed, it may require more construction activity than building an equal portion of suspended guideway. This is likely to be the case where overpasses are calle9 for. Large portions of the AGT guideway may be prefabricated. Major construction efforts for the AGT will be the building of stations and foundations. The busway will require grading and paving as well as on site overpass construction.
In terms of dynamic effects the buses are likely to create more noise than the AGT alternative, although the areas between buildings are such that noise may not be as critical an issue as it is in downtown urban areas. However, since ambient noise levels are likely to be less in the suburban environment the noise generated by the bus system may be more noticeable than otherwise expected.
The other key issues associated with AGT and bus options are flexibility and visual intrusion. In general bus systems are usually much more flexible than AGT systems in that they require no fixed guideway. Thus in terms of future development bus systems prer vide advantages of being able to accommodate any departures from earlier planning proposals. This would also be true for AGT, but to a lesser degree. The bus system would require some busway construction, thus predetermining the system to some extent and limiting
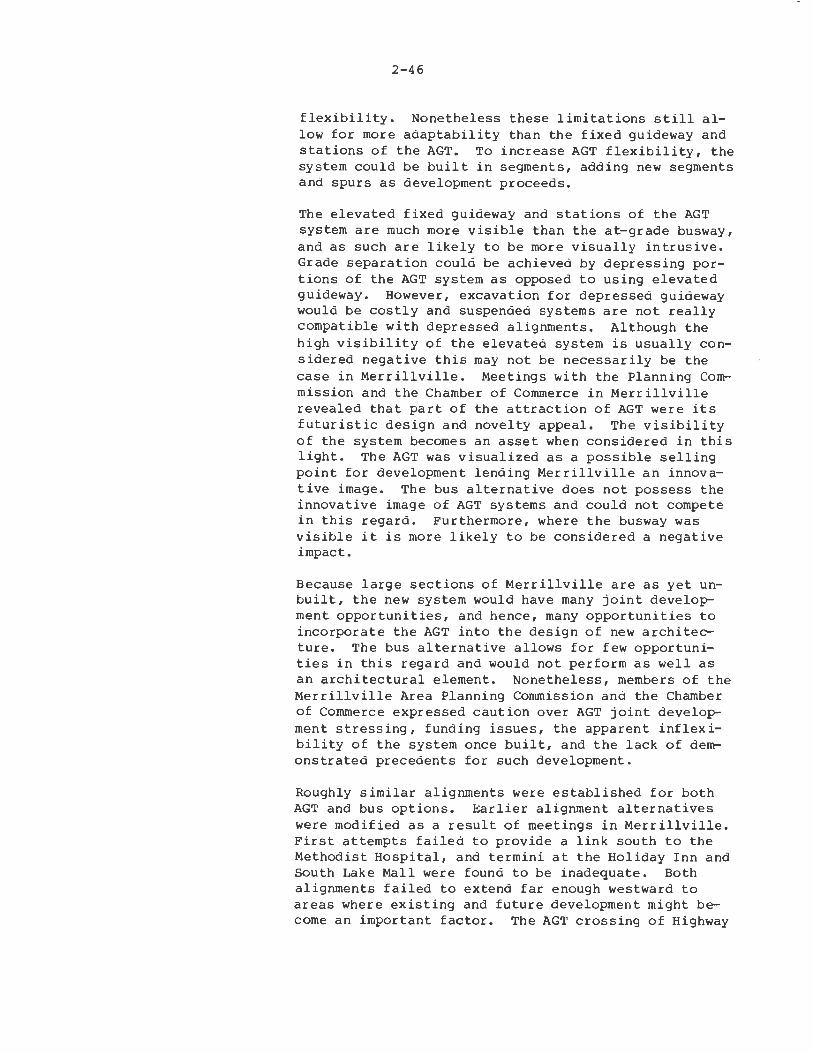
2-46
flexibility. Nonetheless these limitations still allow for more adaptability than the fixed guideway and stations of the AGT. To increase AGT flexibility, the system could be built in segments, adding new segments and spurs as development proceeds.
The elevated fixed guideway and stations of the AGT system are much more visible than the at-grade busway, and as such are likely to be more visually intrusive. Grade separation could be achieved by depressing portions of the AGT system as opposed to using elevated guideway. However, excavation for depressed guideway would be costly and suspended systems are not really compatible with depressed alignments. Although the high visibility of the elevated system is usually considered negative this may not be necessarily be the case in Merrillville. Meetings with the Planning Commission and the Chamber of Commerce in Merrillville revealed that part of the attraction of AGT were its futuristic design and novelty appeal. The visibility of the system becomes an asset when considered in this light. The AGT was visualized as a possible selling point for development lending Merrillville an innovative image. The bus alternative does not possess the innovative image of AGT systems and could not compete in this regard. Furthermore, where the busway was visible it is more likely to be considered a negative impact.
Because large sections of Merrillville are as yet unbuilt, the new system would have many joint develoir ment opportunities, and hence, many opportunities to incorporate the AGT into the design of new architecture. The bus alternative allows for few opportunities in this regard and would not perform as well as an architectural element. Nonetheless, members of the Merrillville Area Planning Commission and the Chamber of Commerce expressed caution over AGT joint develoir ment stressing, funding issues, the apparent inflexibility of the system once built, and the lack of demonstrated precedents for such development.
Roughly similar alignments were established for both AGT and bus options. Earlier alignment alternatives were modified as a result of meetings in Merrillville. First attempts failed to provide a link south to the Methodist Hospital, and termini at the Holiday Inn and South Lake Mall were found to be inadequate. Both alignments failed to extend far enough westward to areas where existing and future development might become an important factor. The AGT crossing of Highway
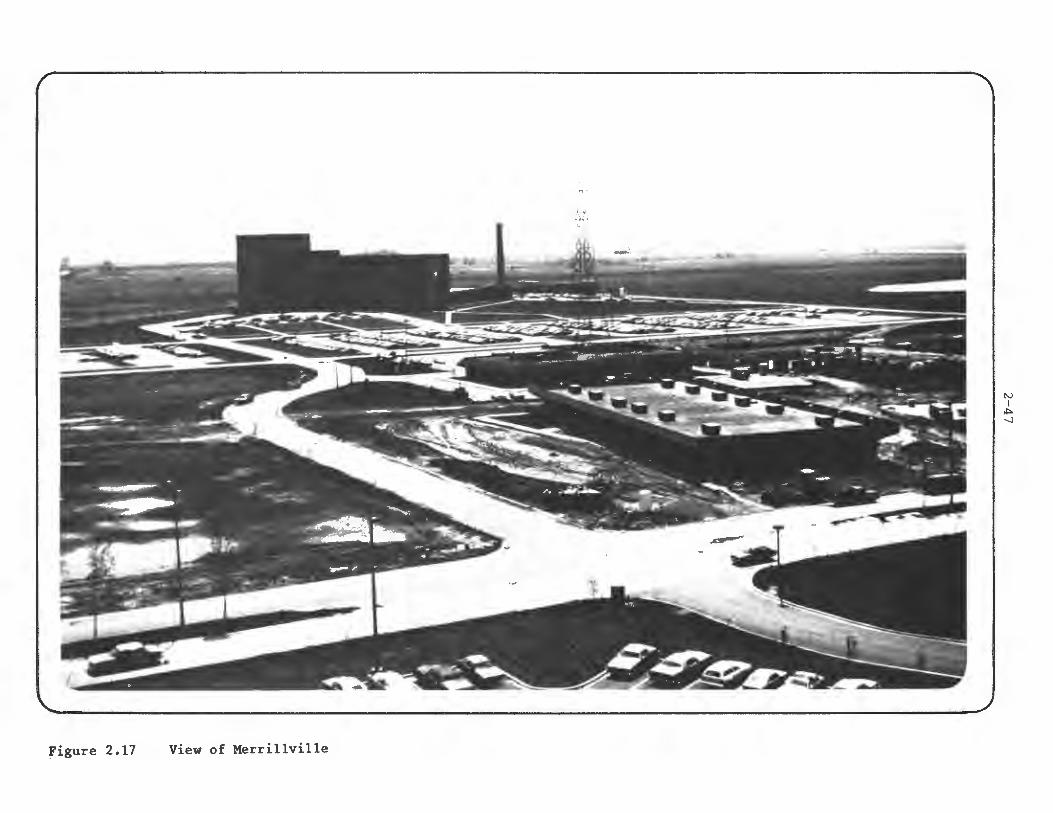
Figure 2.17 View of Merrillville
N I
.i,. --.J
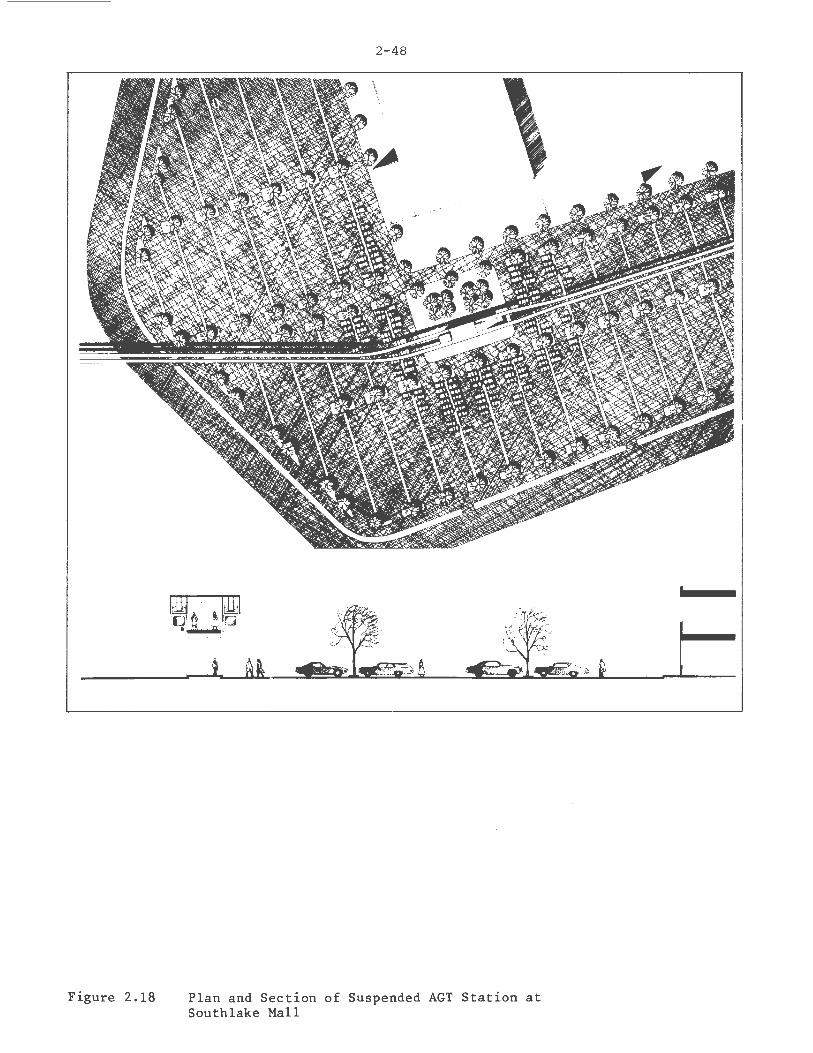
Figure 2 .18
2-48
Plan and Section of Suspended AGT Station at Southlake Mall
2.2.5 INsrITUTIONAL ISSUES
2-49
30 was therefore relocated westward opening the opportunity for a future link down Broadway. The system was extended to traverse the full length of the South Lake Shopping Mall, crossing Highway 30 to complete a loop behind the Holiday Inn. A link to Methodist Hospital was also added.
An additional feature of the final AGT alignment was a more detailed investigation of the possibility for station joint development at Westlake Mall. As illustrated in Figure 2.16, the guideway is incorporated into the shopping mall as an element of an interior glazed galleria. The station platforms and circulation share floor and circulation space with the development complex.
Future development opportunities were seen to exist in the northeast quadrant. Here, the introduction of the AGT might act as a catalyst and a determinant for future growth but at the same time raised questions about whether such a precursor might also limit flexibility or prove to be a deterrent to development in some other way. Caution regarding putting the transit system before the development was expressed on several occasions.
In summary, the Merrillville area appears to make a case for AGT applications in developing suburban areas rather than in areas which are already developed. Because of its novelty appeal the AG'I' was seen to have definite advantages over the bus option in terms of lending an innovative image to the area and encouraging development. Nevertheless, the AGT's lack of flexibility was seen to be a disadvantage in terms of limiting developers options.
2.2.5.l Setting
The Merrillville study site is primarily within the Town of Merrillville with a small portion extending into Ross Township. The town has not been involved in transit planning or operations to date and no public transportation service is available in this area.
The state designated Metropolitan Planning Organization and A-95 review agency which encompasses this area is the Northwestern Indiana Regional Planning Commission (NIRPC). NIRPC serves in an advisory capacity to its member jurisdictions. One of the present study efforts being conducted by NIRPC's Transportation and Development Department is an analysis of the transportation needs for the designated study area.
2-50
Merrillville is within the service area of the Northwest Indiana Regional Transportation Authority (NIRTA), an agency with the authority to coordinate and provide transportation services within Lake County. NIRTA was created by state enabling legislation in 1976, but is not presently operational due to a lack of funding. Lake County is the agency empowered to provide funding for NIRTA through an employer/ employee tax. The one attempt by Lake County officials to gain approval of this tax was unsuccessful. Merrillville could form a public, non-profit public transportation corporation as enabled by state legislation to be funded by the local property tax. This, however, is not presently feasible since the property tax rate and levy is frozen as a result of the State Tax Reform Act of 1973.
State of Indiana transportation activities are carried out within the Department of Highways although the formation of a State Department of Transportation is currently being discussed. It is possible that the required legislation may be considered during this legislative session.
Also having an active interest and involvement in the future planning and development for this site are the private sector developers and employers within the area. Their inteiests are represented in part by the Merrillville Chamber of Commerce which is a townwide organization and by smaller merchant associations comprised of businesses located within the site.
2.2.5.2 Key Issues
All of the local representatives were of the opinion that some form of transit at this site is desirable. Pedestrian activity is restricted due to the layout of the site; this results in either a reliance on the automobile for internal trips or not making the trip at all. Also, dependence on the automobile is currently causing some congestion during peak shopping periods and is expected to become worse as additional development occurs.
City, NIRPC and private sector representatives felt that providing an internal transit system would increase both shopper and worker opportunities. Of the four issues which were most significant--system performance, cost, economic development and urban design compatibility--all of the representatives were in agreement as to the relative difference between AGT and bus.
2-51
Town, NIRPC and private sector representatives felt that the exclusive operations and higher service levels were superior attributes of an AGT system. However, it was felt that a bus system would be preferable to no transit at all.
All of the representatives also felt that an AGT system would be a more positive stimulus to future development than would a bus system. However, the degree to which an AGT system would serve as a catalyst for development or as a positive stimulus to retail activity is unknown. This uncertainty is considered to be a major factor affecting any AGT decision. In particular, it was noted that the amount that the private sector would be willing to invest for an AGT system would depend heavily on the expected economic benefits. Since there is little basis for predicting the benefits, most of the private sector representatives could not suggest what a reasonable investment for an AGT system would be. It was clear, however, that they would not be willing to assume the total financial risk for a $30 million AGT system, but might be willing to consider an investment somewhat less than $10 million.
While a staff representative of the Town Planning Department and an official on the Town Board of Trustees agreed that an AGT would be a more positive stimulus for economic development than a bus system, they did not view this as positively as did the private sector. The town is interested in limiting its future growth and keeping daytime activity in Merrillville at a level that the Town can easily accommodate. 'I'own representatives felt that the presence of a major regional activity center is already beginning to bind the Town by causing traffic congestion during particular times of the day. Future development will further exacerbate this problem. Town representatives were concerned that an AGT system would result in added development pressure at this site. From this perspective, town representatives seemed more inclined to support a bus system, at least initially, since they perceived the impact to be less dramatic and more in line with local objectives.
Most of the private and public sector representatives felt that because a bus system could be modified with less expense and effort than an AGT system, it would be preferable to an AGT system until development patterns were more firmly established. It was desired, however, that the future development be planned to accommodate an AGT system so that this option could be implemented at a later time if desired.
2-52
Of all of the factors affecting the prospects for AGT implementation at this site, the factor which was perceived to most discourage implementation was the extremely high costs of an AGT system relative to a bus system (perhaps $30 million versus $4 million respectively). While the private sector appeared willing to consider some investments for an AGT system, most likely at a future point in time rather than at the present time, they felt that a $30 million investment exceeded reasonable limits, especially since the associated economic benefits are uncertain.
The town is also unable to manage this level of investment and would be less inclined than the private sector to consider any major investment for an AGT system.
From the perspective of financial feasibility, the town is restricted to a bonding limit of 2 percent of assessed valuation or $57 million. In addition, the amount of revenues generated from property taxes is limited due to state legislation in 1973 which froze both the property tax rate and levy statewide. As a result, town representatives noted that there are several municipal services which are of much higher priority than an AGT system within the town, that are presently underfunded.
Both NIRPC and town representatives noted that unless federal support was available for a significant portion of the system, it was unlikely that an AGT system would receive serious consideration. The state has traditionally provided 50 percent of the locally required share on all federally assisted transit projects. It is likely that they would be similarly requested to provide this amount for an AGT system if federal funding were available.
The operating costs for the proposed AGT system are similar to those of the bus system. However, private representatives noted that of the various local options available to subsidize the system operations, the¥ would more appropriately apply to an AGT system than a bus system. For instance, imposing a fare higher than the assumed $.10 seemed to be more acceptable for AGT services than bus services since a higher level of service is being provided. Although one representative felt that a fare as high as $.50 would be reasonable, others felt that this was too high and would discourage people from using the system.

2.2.6 SUMMARY
2-53
While there was no readily identifiable solution for financing the operating deficit for either an AGT or bus system, it was clear that the operating costs were of lesser concern than the capital costs of the system, particularly for the AGT alternative.
Labor issues are not a problem at this site, as there are not transit services currently operating. This situation is typical of many suburban centers which are less likely to have transit services.
From an institutional perspective, the implementation of an AGT system could present more problems than a bus system. The Town does not have any experience in the provision or management of transit. Since no example of urban applications of AGT systems exist, the town would not have the advantage of any operational models as a pattern. In contrast, more experience and assistance is available for the provision of bus services.
A factor complicating the provision of any form of transit at this site if joint public and private participation is required is that little coordination has occurred between these two sectors in recent years. There are indications, however, that steps are currently being taken to improve existing working relationships.
The planning officials felt that its chances of receiving Federal assistance {UMI'A Section 3 funds) for an AGT system were limited. Including AGT in a regional package of transit improvement was thought to be the most viable strategy for maximizing the ability to obtain Federal, state and local funding. However, the institutional framework to achieve this does not currently exist, and it would take considerable effort and time to create it. The option of funding the system totally by the private interests at the site would be much more viable from the institutional perspective, but the projected system costs are too large for this approach to be feasible. A regional transit authority would also be the preferred operator of the system, but again this arrangement would have to be newly established. If the site operates the system, an operating agency must still be created.
It appears that an AGT system may be desired at a future time but that a bus system is more feasible initially. Although most of the representatives agreed that an AGT system could provide a higher level of service, present a more positive aesthetic image and

2-54
probably contribute more to the economic development of this area, there were three factors which significantly impede AGT implementation at this time. They are the high capital costs of the system which the town and private sector representatives are either unwilling or unable to afford, the inflexibility of an AGT system with respect to accommodating future development at this site; and ironically the concern of local officials that the positive features of an AGT system will be contrary to town objectives.
Merrillville is larger and more varied than most suburban centers, and thus represents a site with higherthan-average potential for AGT. There is considerable support for AGT, but cost is the major deterrent. In smaller sites, AGT cost is likely to be even a larger issue. A rough rule of 3-5 percent of the site value is an estimate of the cost which private interests may be able to bear for a circulation system.l It is ironic that site features which make AGT attractive in terms of potential ridership also create a major disincentive, cost, to its adoption. The large physical size of the site, which is to be expected with large parking requirements and multiple developments, is a drawback because it requires a large amount of guideway. But these same site features (especially multiple retail centers) appear to be necessary to generate substant~al flows on a circulation system.
The location of the development around a freeway interchange is typical, and generates difficulties in internal movements which will often motivate consideration of an internal transit system. Performance is not a key issue, though a capacity of 5,000 passengers per hour may be required in such centers. Safety and security, and visual issues will generally pose few problems. Thus, in summary, cost currently appears to be the key barrier to the suburban center AGT market.
!This estimate was stated in discussions with several developers over the course of the study.
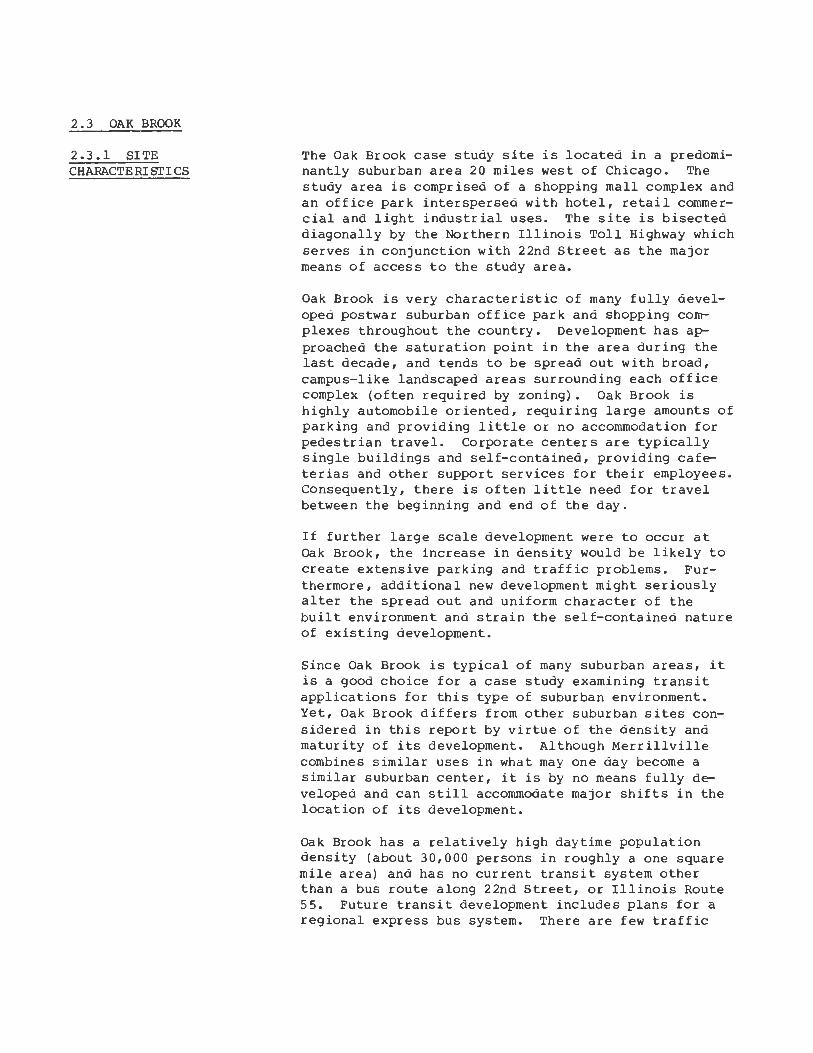
2.3 OAK BROOK
2.3.1 SITE CHARACTERISTICS
The Oak Brook case study site is located in a predominantly suburban area 20 miles west of Chicago. The study area is comprised of a shopping mall complex and an office park interspersed with hotel, retail commercial and light industrial uses. The site is bisected diagonally by the Northern Illinois Toll Highway which serves in conjunction with 22nd Street as the major means of access to the study area.
Oak Brook is very characteristic of many fully developed postwar suburban office park and shopping complexes throughout the country. Development has approached the saturation point in the area during the last decade, and tends to be spread out with broad, campus-like landscaped areas surrounding each office complex (often required by zoning). Oak Brook is highly automobile oriented, requiring large amounts of parking and providing little or no accommodation for pedestrian travel. Corporate centers are typically single buildings and self-contained, providing cafeterias and other support services for their employees. Consequently, there is often little need for travel between the beginning and end of the day.
If further large scale development were to occur at Qak Brook, the increase in density would be likely to create extensive parking and traffic problems. Furthermore, additional new development might seriously alter the spread out and uniform character of the built environment and strain the self-contained nature of existing development.
Since Oak Brook is typical of many suburban areas, it is a good choice for a case study examining transit applications for this type of suburban environment. Yet, Oak Brook differs from other suburban sites considered in this report by virtue of the density and maturity of its development. Although Merrillville combines similar uses in what may one day become a similar suburban center, it is by no means fully developed and can still accommodate major shifts in the location of its development.
Qak Brook has a relatively high daytime population density (about 30,000 persons in roughly a one square mile area) and has no current transit system other than a bus route along 22nd Street, or Illinois Route 55. Future transit development includes plans for a regional express bus system. There are few traffic

2.3.2 ALTERNATIVES DESCRIPTION
2-56
parking problems at present, although parking may become a constraint on the growth of the shopping center, and there may be an eventual need for regional transit or paratransit service to the area. Noon hour and off-peak travel in the area is very limited due to the self-contained nature of existing development. In fact, employers are said to discourage noon hour travel. There is little or no planned new development in the area; thus, no new major attraction centers are anticipated. The crime rate in the Oak Brook area is quite low and security is not considered a significant problem by those contacted during the study.
Figures 2.19 and 2.20 describe the bus and AGT alternatives for the Oak Brook area. Figure 2.19 shows three off-peak bus routes, each operating as a one-way loop on five minute headways during the noon period {11 am - 2 pm). During peak periods, a modifieo service with a single feeder vehicle is operated on routes A and B with a coordinated transfer from regional express services. This operates on approximately 15 minute headways in the peak periods {8-10 am, 4-6 pm). The regional vehicles would operate over a route similar to route c.
The AGT alignment is shown in Figure 2.20. The system operates on a two-way loop with service every three minutes in each direction in the noon-hour period, integrated service with regional transit in the peak period,! and five minute headways during the hours between the peaks and during the noon period. Every other vehicle in each direction would operate over the loop in the eastern half of the system; the other vehicles opP.rate only over the main, western loop.
A ten cent fare is charged for all internal riders; free transfers are available to regional transit us~rs. In fact, an innovative fare policy might be to allow regional transit users free use of the AGT for internal trips as well. The bus service would operate on weekdays only, while the AGT would operate limited service on weekends (and possibly weekday evenings) as well.
Table 2.8 summarizes the two alternatives. Existing transit service consists of two local bus routes, each
lAGT vehicles meet all regional vehicles in the peak because the major flows at that time of day are regional trips. At midday, the major flows are internal and only two regional bus routes operate (at l hour headways); thus coordination is less important then.

SALT CREEK. '-
_, / A,e&C )# . . . .. ■ I ~ ;j_ ~ ____ \...___ ./ ~ .... I . ~ :L2,~I • I ~ , ~-.L
g~ \ l' :~-- .. ~ ·" .... ,,,,... • ■ ~g: t \ 4( :~ I . # .,./• ~ ♦ • .~ • ir 0: J"' ,._
S, c)'f ~ ~ I 1-- --~ ~ .,1/-- • ~ ,,_.J.. •♦;,' 'fl / A # i':' '° .. ~ : fB&C,1<9a COMMERCE • ♦ {:f' "♦, # •• , - I ~ • .. :::) I I~ \. '<' ♦ , ♦ . ♦ er: I ♦ ■ o Irr: -,. '\., ' / .. ■ o I ~----~---J_~&e - ~ --=-f:=2~:..-' -~ _: __ :-_ ■ ______ c:_ ___ 1.: ■ ••
♦. ♦ .. M ■ . I fjT _,. : ILLINOIS ROUTE 55 ,:C
- ~O\? I I GJ NORTHERN \\ _ _\.. .. \ I ii:! I o,
I I-
- - I / ;}_ ■ ■ ~ /----J OR1 Esl vD ____ .,, w
I
-------------' KEN ~ GTON RD
A N
Figure 2.19 Oak Brook, Alternative 1: Bus
I\.)
I l.J1 -.J
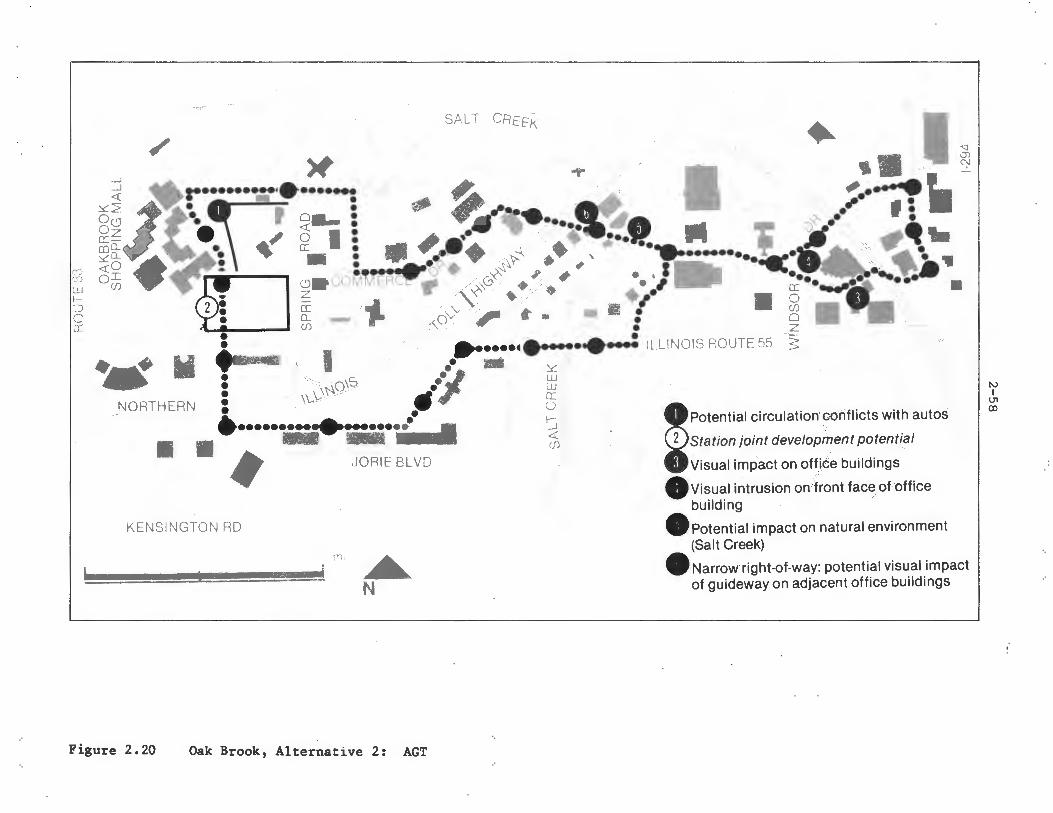
,'-,ALT CRE[K ♦ I 'q'
/ •■' ~ ~ ..... I , ■ ~ , ' ·-·• j <""\--···--·-·•·--·- ,, $, ~ ' . ,. • : <( ~•pc, . .,,. ... .. . 6~ -.. • ~- : ~ ~ ---· '!I• ... 'il . .. 41 ,.. Oz • • • ••lif. .. . ,' Y. • "'c: ~~;•. •' a' I : • '••♦ ~ ♦ , • -...-••• 1.. . .._.~:.'~x ~ . .. mo_#..~~ • ..., • • •~ ';,'i'-- • , I- -.._ .. ,"f>,,, -._'Y'..., ~o ~ ! :~···P \) • x-~ , .,. • ·, ···•-· • -.. • ~ QI LI GaCOM ERC f' ,.,_,0 ♦ ♦ •• • . ■ ~ ....... w (f) • z ~' ♦ / , , Cf)
~ 2: ix .. 0 ~ 't". - ■ : 0 o • ~ - p ,<,_0 ,- • ?;
a: : ••••••••• .. ••...: ILLINOIS ROUTF 55 s ..,_ .., I •• .. ::c:
i w : ' o,s •• LL!
• ~~ - 5 NORTHERN : · • 1--- , .......... ~ ......... I ;t - - --· ~ ■ ■ ~ JORIE BLVD
._ Ill
KENSINGTON RD
n • N
Figure 2.20 Oak Brook, Alternative 2: AGT
!Potential circulation conflicts with autos
Station joint development potential
Visual impact on office buildings
8visual intrusion on 'iront fac~of office building /
-Potential impact on natural environment (Salt Creek)
- Narrow right-of-way: potential visual impact of guideway on adjacent office buildings
I\.)
I l11 CXl
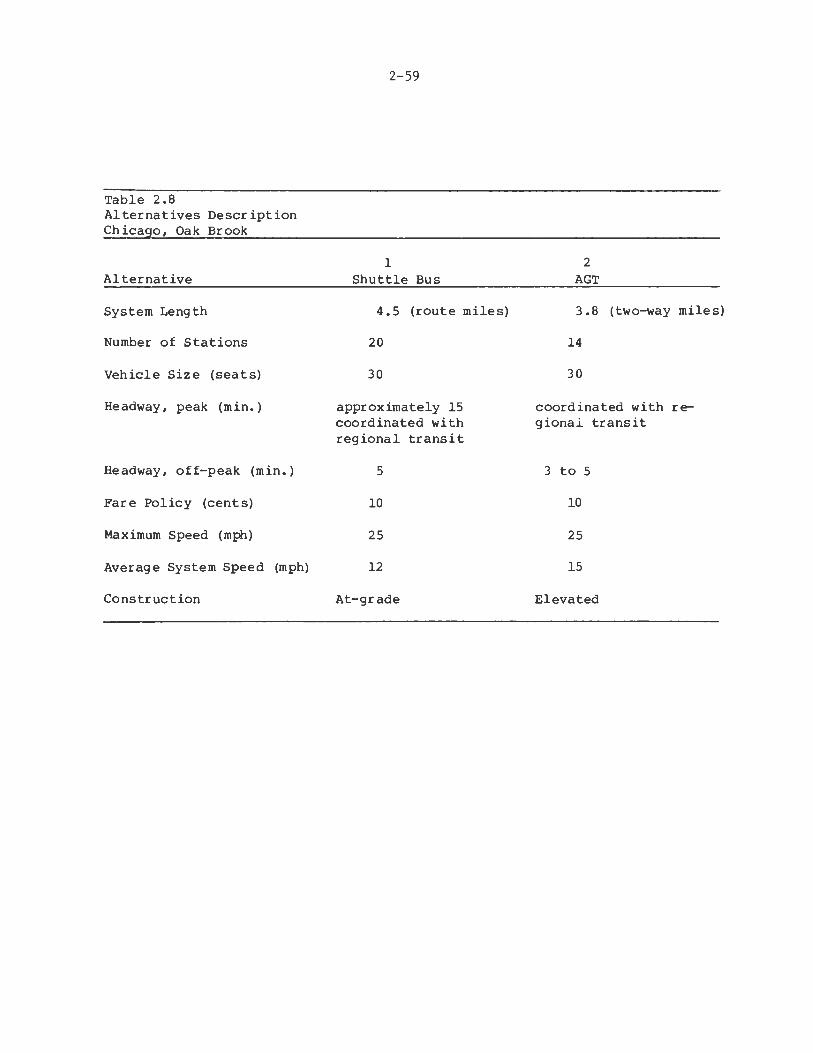
Table 2.8 Alternatives Description Chicago, Oak Brook
Alternative
System Length
Number of Stations
Vehicle Size (seats)
Headway, peak (min.)
Headway, off-peak (min.)
Fare Policy (cents)
Maximum Speed (mph)
Average System Speed {mph)
Construction
2-59
1 Shuttle Bus
4.5 (route miles)
20
30
approximately 15 coordinated with regional transit
5
10
25
12
At-grade
2 AGT
3.8 (two-way miles)
14
30
coordinated with regional transit
3 to 5
10
25
15
Elevated
2.3.3 DEMAND AND COST ISSUES
2-60
operating on one-hour headways on 22nd Street, the spine of the area. Both enter the shopping center to provide service to this major attractor. One of the routes connects with commuter rail service to Chicago.
Three new express bus services to oak Brook are planned for implementation from several surrounding communities. These routes would originate at commuter rail stations and operate express to Oak Brook and Yorktown, a nearby center. Service would be provided in peak periods only, with one or two trips on each route in the morning and afternoon. Another express service from the CTA Lake rapid transit line to Oak Brook may also be implemented in the future.
The number of employees in the study area currently exceeds 15,000, and is projected to reach 19,000 by 1990. The average number of shoppers at the Oakbrook Mall, the only major retail building, is approximately 25,000. Thus, approximately 88,000 regional trips daily to and from the area are expected by 1990.
Projected regional transit ridership of Oak Brook workers is approximately 500 one-way trips daily, representing a 5 percent mode split for the 5,000 workers assumed to have transit available under the bus service proposals outlined in the previous section.1 Detailed routing information for the bus service proposals 'was not available, so the study assumed that the regional buses followed route C along 22nd Street in Figure 2.20. Approximately half the employees are within easy walking distance of 22nd Street; the remainder face walk distances of\ to ~ mile, and would be unlikely to use transit. If AGT or internal bus service were available, we estimate that regional transit ridership could double. Since there are relatively few regional transit vehicles to meet, both AGT and bus should be able to provide coordinated service, which would mean low wait ti~es for passengers. While AGT could have a slight travel time advantage over a bus system, the bus would have a larger number of stops and thus produce shorter walking distances. On balance, there would be little difference between the modes for the distribution of regional transit work trips. The number of regional shopping trips served by transit is very small, since only two local routes on one-hour headways serve the area, but these trips require no internal circulation as the bus routes serve the mall directly.
½his estimate was made by Cambridge Systematics based on revenue and cost projections drawn from the DuPage County Transit Study, April 1978.
2-61
The remaining two categories of potential demand for a circulation system are internal shopper and worker trips. As retail activities are concentrated in the Oakbrook Shopping Center, there would be virtually no use of a circulator for internal shopping trips. Trips within the center can be adequately made by walking. The other potential function of an AGT or shuttle bus for shoppers, providing access from the outer parking areas to the center, also appears to be infeasible, as all distances are short enough that walking would be preferred to using the circulation system with its walking, waiting, and travel time characteristics.
Internal trips by workers in the Oak Brook area during noon and other periods are not encouraged by many of the employers. The maJority of office buildings have restaurants or other eating facilities within them. Also, Oakbrook Shopping Center is the only retail center in the study area, and does not offer the variety of activities available in CBD's or even the Merrillville site. Thus, it is difficult to predict the volume of internal worker trips that would occur at this site, but it appears that it would be considerably lower than the base Merrillville estimate of 0.4 trips per worker per day. If a figure of 0.2 trips per worker per day is used, daily internal worker travel would be near 3,000 trips currently, and about 4,000 trips in 1990. Based on the same analysis as used in Merrillville,l a shuttle bus might attract half the number of internal trips (2,000) as an AGT (4,000). Most of the transit trips would be new trips, with less than 25 percent of the transit rider- ship diverted from auto use. It is assumed that there are few pedestrian trips in the area between build- ings. Table 2.9 summarizes the demand results. The ridership estimates for internal worker transit trips should be regarded as very uncertain; they could be much smaller than the figures shown.
Table 2.10 summarizes the revenue/cost performance of the alternative systems. The AGT system extent produces high capital costs, and the level of operations that seems appropriate for the available travel demand is very low to justify these capital costs. Unit operating costs are also very high due to the limited operations. The bus system appears to be more economically feasible.
lwhich is based on the DPM Planning Manual models, modified for suburban application.
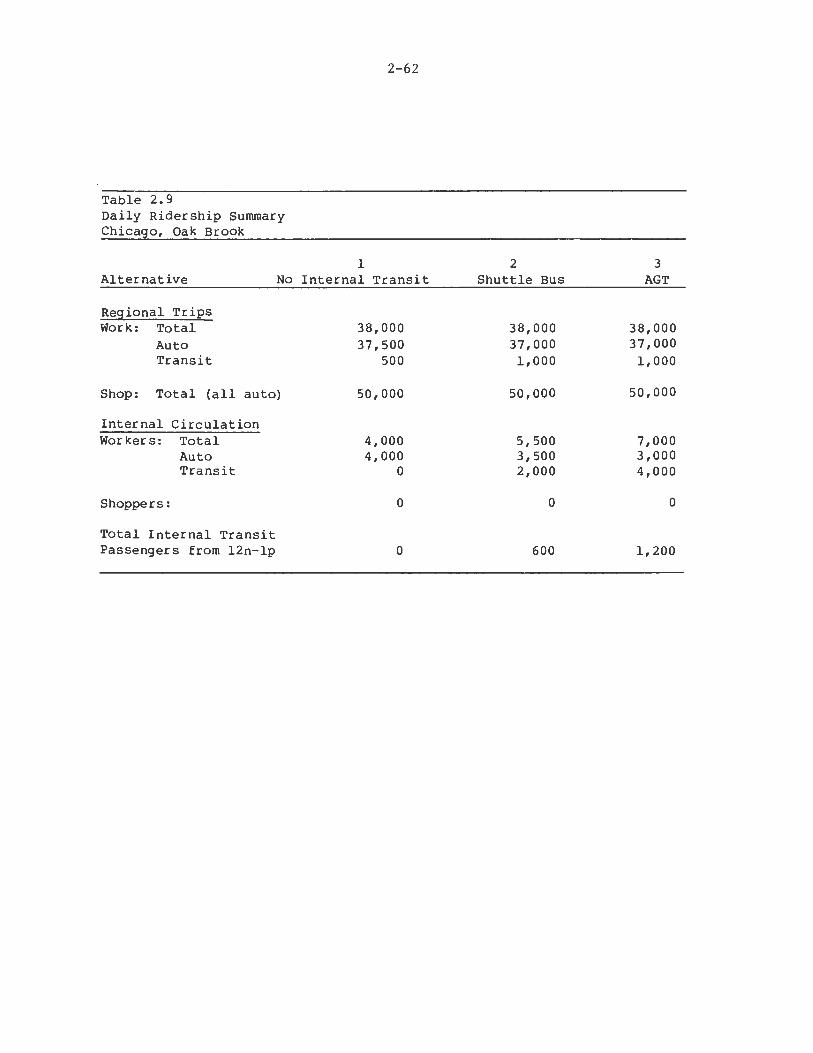
Table 2.9 Daily Ridership Summary Chicago, Oak Brook
2-62
1 Alternative No Internal Transit
Regional Trips Work: Total
Auto Transit
Shop: Total (all auto)
Internal Circulation Workers: Total
Auto Transit
Shoppers:
Total Internal Transit Passengers from 12n-lp
38,000 37,500
500
50,000
4,000 4,000
0
0
0
2 3 Shuttle Bus AGT
38,000 38,000 37,000 37,000 1,000 1,000
50,000 50,000
5,500 7,000 3,500 3,000 2,000 4,000
0 0
600 1,200
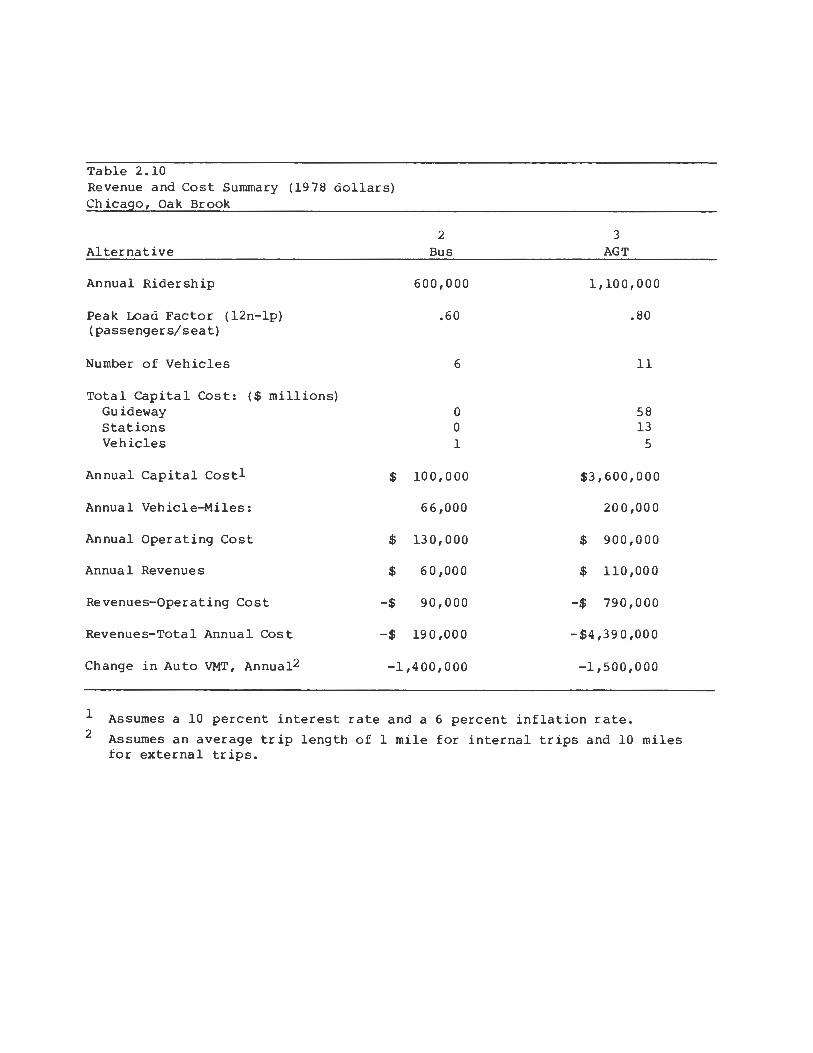
Table 2.10 Revenue and Cost Summary (1978 dollars) Chicago, Oak Brook
Alternative
Annual Ridership
Peak Load Factor (12n-lp) (passengers/seat)
Number of Vehicles
Total Capital Cost: ($ millions) Guideway Stations Vehicles
Annual Capital Costl
Annual Vehicle-Miles:
Annual Operating Cost
Annual Revenues
$
$
$
-$
-$
2 Bus
600,000
.60
6
0 0 1
100,000
66,000
130,000
60,000
90,000
190,000
Revenues-Operating Cost
Revenues-Total Annual Cost
Change in Auto VMT, Annual2 -1,400,000
3 AGT
1,100,000
.80
11
58 13
5
$3,600,000
200,000
$ 900,000
$ 110,000
-$ 790,000
-$4,390,000
-1,500,000
1
2 Assumes a 10 percent interest rate and a 6 percent inflation rate.
Assumes an average trip length of 1 mile for internal trips and 10 miles for external trips.
2.3.4 COMMUNITY AND DESIGN IMPACT ISSUES
2-64
Implementing a bus system would result in far less disruption than building an elevated AGT guideway. The bus system would use the existing road network for its right-of-way. The AGT option would require constructing a separate right-of-way, resulting in one to two years of construction disruption. Although the disruption associated with building a suspended system would be quite minimal--especially in a suburban setting--it would nonetheless mean additional noise, some traffic disruption, and some temporary decrease of the area's visual quality. Disruption would be at its worst in the areas of station construction. Whereas major sections of the guideway can be prefabricated and shipped to the site, the stations are likely to be less standardized and would therefore require more onsite construction time. Furthermore, most station construction would probably be taking place in close proximity to major office buildings. Thus, these buildings and their occupants are most likely to be affected during construction, although neither the bus or AGT options would displace businesses or employees.
Continuation of the status quo will likely mean that pedestrian travel would remain difficult in certain areas. Travel between office and shopping center would be limited. Either upgraded bus service or an AGT system could improve access within the area. Improved bus service allows more flexibility for change in routing than the AGT, and thus more flexibility with regard to any future development that might occur, or with regard to a drop or increase in demand. In terms of other impacts, the noise generated by operating a bus system is likely to be greater than that brought about by an AGT. Beyond this, additional bus traffic, although replacing some automobile traffic, may well add to congestion--particularly at the oakbrook Shopping Mall where all three bus routes loop through the parking area.
Although the AGT option would have the advantage of grade separation, it does so at the price of requiring an elevated, visible structure. There is little question that one of the most serious problems of introducing an AGT system in the Oak Brook area would be the visual intrusion caused by both guideway and stations, as an elevated structure of any sort will constitute a noticeable addition to the oak Brook environment.
2-65
Visibility of the system would be at its maximum near stations. Since stations are typically located near major office buildings, the visual impact of an elevated station adjacent to corporate headquarters is likely to be negative from the perspective of the building occupants. Thus, as in other case studies, the area of most likely demand often proves to be the area of least visual compatibility and acceptability. Since the er ime rate around Oak Brook is low and per-• sonal security and vandalism are not perceived as a significant threat in the area, neither an AGT or a bus system appear to pose potential problems.
AGT systems have been perceived as having the potential to enhance the image of new development through their futuristic appearance and technology, thus giving them an apparent advantage over bus systems. However, there appears to be little opportunity for joint development of this kind at Oak Brook, thereby making it more difficult to find ways of successfully integrating an AGT system into the built environment.
The AGT system, as viewed by local participants in the study, thus presents major problems in terms of visual intrusion and incompatibility with the Oak Brook area. Originally, it seemed important to keep the guideway away from what might be perceived as the corporate "front door"--i.e. the corporate building as viewed from the road. Meetings with the town manager revealed that the corporate "front door" was perceived as interchangeable. The appearance of the building was considered as equally important from parking areas. Thus, routing the AGT system either along the "back" (or through parking areas) was found to be equally undesirable as routing the system along the street or "front".
Areas of major visual intrusion include: the Windsor Drive area, Enterprise Drive, and the York Golf Club. Since no joint development potential could be established, it does not appear possible to design the system into new buildings and minimize the system's visual impact. In fact, because of the suburban nature of the site, the built environment offers little to help ameliorate problems of visual intrusion. Landscaping offers a modest solution; but because the system is elevated, trees and other plantings might never prove adequate to screen the system.
Meetings in Oak Brook revealed a preference for an atgrade alignment of the AGT system. Unless the AGT

"'
.. :i,t-• . • ►
2-66
..
...
.. ' \ . I ..
"
~ 0 0 i...
i:Q
~ C1'
0
i:::
'" Cll bO i:::
'" "Cl ,--I
'" ::, i:Q
Q)
0
'" ~ ~ 0
~
0
~ Q)
'" >
,--I N
N
Q) i... ::, bO
'" rz.
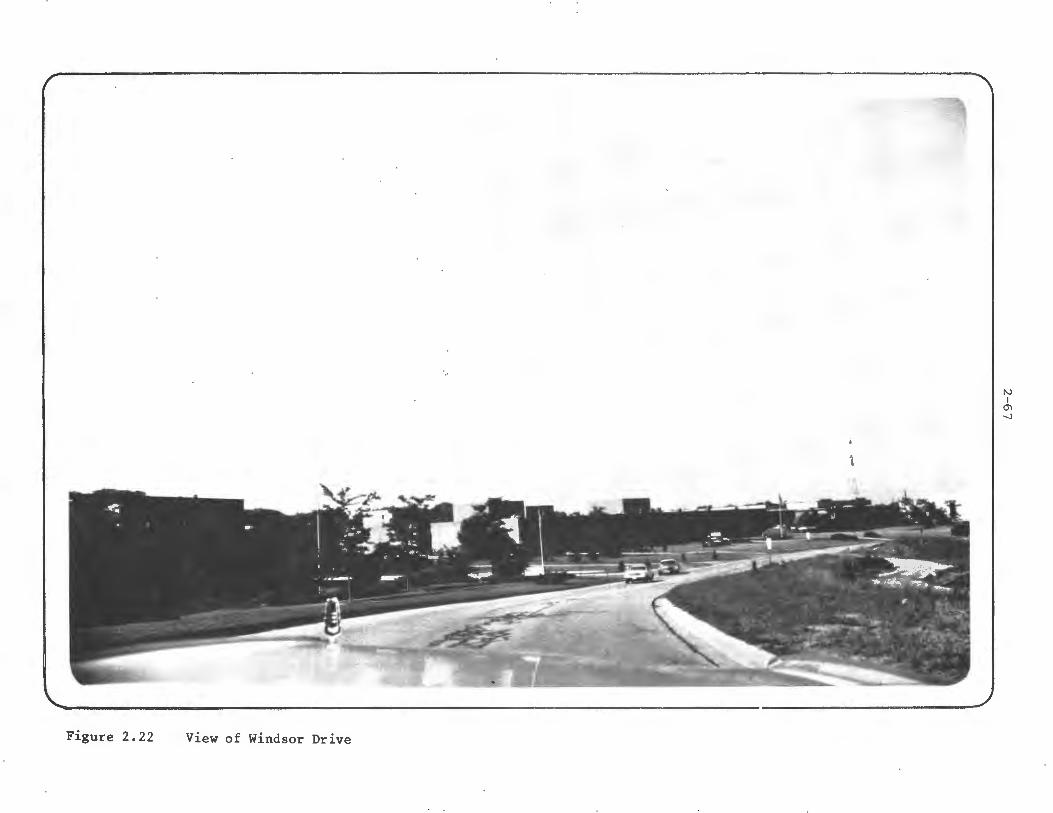
Figure 2.22 View of Windsor Drive
i
t\.)
I O'I -..J

•
Figure 2.23 View of Enterprise Drive
t\.)
I
°' 00
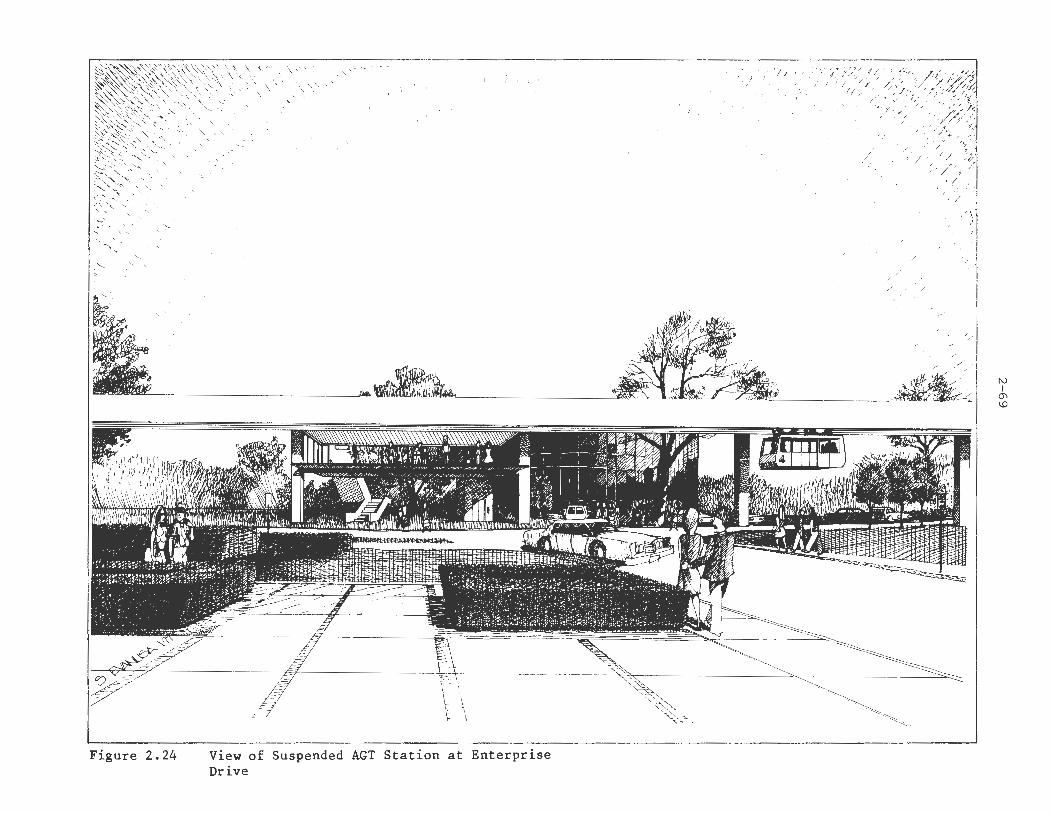
~~~~~~~'~\\\ \ \_ \_ "-."· .\ ~ \ ' '. \ \ \'" ::,~,~~~~~~~~\(.''\~~"" \ \\ '"'-\\\_\:'-' ~\' :-,.\3''-.:~'\." "-'\ '\ .... - \ \ -~ ~' 'y.__':-"'. '½_\ ',, \<. \ \ ' ~ ~'·"~"'--\ ,, ' '--' ' \ ~0.''·"'"' \ _, ' \ \ ' . ' '''' ,:-\, \ "' ' '- ' ~ \,~'-,:> ~ - ,~ \ ',' \' ' -,~~, ~ ' ' ·....: " ' ~~~~ ,-~'>. ', -,, ' ' ' ~~ \'~, ,_\.:_'--.. ' \ ' \ '-
~'-> \ :~ . ..____ '-- ' \ ' '--~~.;--,\<~ '\ ~"-~-·, ',' ' .
S:.."'~ .. ' ' ' "' ' ' ,, ~~-~ ·-..' ,-,, '·, ' '
... ....,_, ' ' ~ .. ' '
' -" ' - ,'-' "
'-.'--"'
'-
' '-
' ' -
\ ' I
' /'I J I
f '1/ '/ ;
'\ \
,,, ,,,, ;,,.'" 4/''I .. ;;r,, , _ '/, '/~--~#. ' I t' I, I // / / l ,. /, / I/ l'j' /7,/,i! < , /,/I~// / . ,p /// '//: cf'/fk, J,, 1,'/ . r ;',,;'" ~ / //;~,-;./1/ -;: .:'{, "
n / ✓ / /,, .• //. 1/.I , ',. -1-'/ ,'. ,,. '>:?I, ,.,1' ,, / I ./; /-" 1/ j/ It)
/ . / /
/
'/ - ' '1_ '/( /• ✓, /;, ,-1 , /,/ I
/ , / ,,(, / , ,' / / I ,I iv//_
I I . , 1/ / I I,., / / f 1/
,. ( ' I /,,'/•
I /' I
/
/ ,:,
/ ,/ / / /
'/ /~ ;: ,.
'; J/'
I
,:.,
~
/ -~/. ,
, _::_
--~-___c__·-..__,__ ~-~~
Figure 2.24 View of Suspended AGT Station at Enterprise Drive
IV I
(J\
"°
2.3.5 INSI'ITUTIONAL ISSUES
2-70
technology could be operated without grade separation from traffic, such a solution appears to be unachievable.
In general, it was felt that the AGT system was not compatible with Oak Brook in its current stage of development. If Oak Brook were only partially developed, then an AGT system might prove more feasible, possibly becoming an integral part of a master plan. However, the general feeling at Oak Brook seems to be that in such a situation the AGT should be depressed and not elevated because of its relationship to the relatively low scale of development. If Oak Brook were to go through another phase of development and increase in density, then an AGT might be feasible, again, forming an integral part of a master plan for future growth.
In terms of current development, it was suggested that an alignment along the tollway be considered. However, it would not be possible to get more than a small part of the system on the tollway and still prervide meaningful service.
Because it requires building an elevated guideway and stations, the AGT option appears unfavorable in comparison with the bus or status quo options. Although it might be expected that the visual intrusion caused by the system would be less in a suburban than in an urban context, this does not appear to always be the case. In certain respects, an AGT system may appear more noticeable and more out of context in a suburban environment. This is more likely to be the case in a community such as Oak Brook where development has almost reached its probable maturity. Although an AGT system, which lends an image to a community, may be perceived as a catalyst to development, such a situation may not be possible when the maximum amount of desired development has occurred and when reaevelopment will not be required within the foreseeable future.
2.3.5.1 Setting
The Village of Oak Brook has a relatively uncomplicated institutional structure, typical of many suburban cities, villages and towns. The town's decision making body consists of eight elected officials, comprised of the Village President, six trustees and the Village Clerk. The Village Manager who is appointed by the President and Board of Trustees is responsible for the various operating departments.

2-71
There is no operating department in Oak Brook that has specific transit responsibilities. The Regional Transportation Authority (RTA, see section 2.1.5) oi;r
erates the existing bus services in Oak Brook, and is the only existing agency which could possibly operate an AGT system. However, RTA contracts for most of its service with other providers, and would need to establish a group within it to operate an AGT system. Rl'A's interest in such an arrangement was not ascertained by the study.
In addition to local planning performed by Oak Brook, many regional planning activities are performed by the DuPage County Regional Planning Commission. This agency provides planning assistance to Oak Brook and the other communities within its jurisdiction based in large part upon information which is developed locally by the individual communities. The Chicago Area Transportation Study (CATS, see section 2.1.5) is the state designated Metropolitan Planning Organization for the area.
Peripheral involvement in local planning and programs occasionally occurs by several state agencies (these agencies are also described in the North Michigan Avenue section).
Representing the private sector at the Oak Brook site are the developers and employers which are involved in the activities of the study area. The Oak Brook Association of Commerce and Industry represents many of the businesses located at this site.
2.3.5.2 Key Issues
Of the issues considered to be most important in influencing an AGT decision at this site, three issues, visual intrusion, cost, and demand levels, were perceived to be major impediments to an AGT deployment. In fact, only in the area of system performance was an AGT system perceived to offer any advantages over either a bus system or the existing situation with no internal circulation services. The implications of the systems in the areas of economic development, personal security, system technology and labor were considered to be of lesser significance and of no real impact to the decision to implement an AGT system, a bus system or to retain the status quo. It should be noted that while an AGT system was not perceived to be suitable at this site, the feasibility and desirability of a bus system was also seriously questioned. However, it appeared that bus service would be favored over AGT if any transit was to be considered.
2-72
An Oak Brook official cited several reasons why very low ridership for an AGT or a bus system could be expected at this site. The use of regional transit to access this site is minimal since only limited transit is available, and neither traffic congestion nor parking is currently a problem.
However, the Oak Brook official was of the opinion that if the employers were to choose between a bus and an AGT system from purely a performance perspective, they would favor AGT. This is attributable to the higher reliability of service. Therefore, there would be a higher likelihood that employees making noon hour or other daytime trips would return within a designated time period.
From a cost perspective, the Oak Brook official did not feel that an investment of perhaps $50 million for an AGT system could be Justified considering the low ridership projections. A capital cost of $1 million for a bus system was considered to be much more reasonable and manageable.
The operating costs of an AGT at this site, with an annual deficit over $500,000, was considered to be virtually unaffordable. The bus service deficit of near $100,000 was possible to support. The Oak Brook official did suggest, however, that it would be important to evaluate peak and off-peak bus services separately since he felt that the revenues obtained during peak hour service might come close to covering operating expenses. It is questionable whether the private sector interest would consider subsidizing even a bus system because of the lack of a perceived need for the system.
Of the three factors discouraging AGT implementation at this site, the most significant impediment appeared to be the incompatibility of an AGT system with the existing development of the area.
The Oak Brook official suggested that if an AGT system had been considered when the master plan for this area was prepared, it might have been possible to integrate this kind of system into the development plans at that time. However, given that this did not occur, it was felt that the image of the existing development would be very much impaired by the presence of an elevated guideway system.
It was noted that the Oak Brook site may be rebuilt to a higher density in approximately twenty years. At

2. 3. 6 SUMMARY
2-73
this time, it may be possible to consider an AGT system but it was very doubtful that such a system would be considered prior to that time, if at all. From a design compatibility perspective, a bus system due to its at-grade operation was seen to have major advantages over an AG'l' system.
Even though most of the development in this area has already occurred, the flexibility of a bus system was also considered to be a desirable attribute.
Neither labor considerations nor issues of personal security were perceived to be factors affecting the selection of either an AGT system or a bus system at this site. No problems were anticipated in either case.
If either a bus or an AGT system were to be implemented at this site, it would require the approval and active participation of the affected private sector interests. Although the Village could assist in the system planning, it is likely that the primary initiative would have to come from the private sector.
DuPage County is within the RTA district and pays sales taxes to support transit; thus, there is some infrastructure in place to support transit. However, the transit prior~ties in the county are the maintenance of commuter rail service to Chicago, and the provision of local bus and paratransit systems within the county. It is unclear whether an AGT would be viewed as consistent with this overall program.
All factors considered, it does not appear that an AGT system is appropriate at this site. Such a system could be given reconsideration in approximately twenty years if the area is rebuilt to a higher density; however, the likelihood of favorable consideration is still questionable. The high costs of an AGT system, the low ridership projection and in particular, the aesthetic incompatibility of the elevated guideway structure with the existing development makes the AGT alternative unattractive. While the bus alternative was perceived to be more acceptable from both a cost and an urban design perspective, it was not evident that a bus system was seriously desired although it was preferred over AGT. Some problems might also occur in the implementation of an AGT system from an institutional perspective.
This site, therefore, came to a radically different conclusion than Merrillville. Two major reasons may

2-74
be given. The first is that there is only a single retail center at the site, the rest being predominantly office space. This set of land uses is unlikely to generate significant internal flows, as the linkages between offices ar! small, and the single retail center does not offer sufficient variety in noon-hour eating and shopping opportunities to maintain large flows. These factors in turn create the impression that there is little need for a system. If there were more retail establishments in the area, there might well be more interest in a system.
The second difference from Merrillville is the age and linear development pattern in Oak Brook. While the tollway in Oak Brook was considered an acceptable AGT alignment, development is too far from it to make this a feasible option. Development in Oak Brook is arrayed linearly along minor streets. In other suburban sites studied, the freeway is a more visible element; development is arrayed more in a matrix than linearly, allowing an AGT to traverse the sides of buildings, thus escaping the front door/back door problem. At these other sites, buildings front on major roads, where increased traffic and visual clutter make AGT seem less intrusive. These issues, in addition to the age of the Oak Brook development and its often low scale, explain the differences from Merrillville.
It is the study team's view that sites with characteristics similar to Oak Brook are a minority of suburban centers, but that some of the visual barriers to AGT implementation encountered at Oak Brook will still be found at sites that are otherwise dissimilar to Oak Brook.

2.4 STATE OF ILLINOIS MEDICAL CENTER
2.4.l SITE CHARACTERISTICS
2-75
The State of Illinois Medical Center is a 15 million square foot complex containing one hundred health care, educational, and research facilities and is lcrcated on the west side of the City of Chicago. The study area consists of 365 acres; the eastern half is heavily developed while the western half still contains much vacant land and deteriorated residential areas. 214 acres of the Center are currently in health-related uses. Also included in the eastern part of the study area is a medium-density residential community with a population of approximately 10,000 people, a large number of whom are students and employees at the Medical Center.
The predominance of a single (health-related) land use and the presence of a substantial and related residential community adjacent to the Medical Center make it characteristic of an urban community within a community. Similar situations can be found in many cities throughout the country, with university and medical complexes most typically forming the framework for this type of an urban environment. Consequently, because of the enclavelike character, transit proposals for the Medical Center area tend to focus on small volume, internal circulators connecting residential and institutional functions and providing the institutions a link to city-wide transit.
Although the majority of institutions are medically related, there is virtually no sharing of facilities among the different institutions in the Center. This situation is common to many medical complexes throughout the United States.
The Medical Center area is generally composed of preWorld War II buildings surrounded by mature landscaping on often narrow streets. Older institutional complexes have, in certain instances, given rise to new additions which have infilled blocks and/or bridged streets in an attempt to consolidate separate sections of the same institition. An example of this is the recent addition to Rush-Presbyterian-St. Luke's Hospital where the new addition bridges Harrison Avenue to join large existing facilities. The addition also envelops a section of the elevated CTA Douglas rail rapid transit line. Certain streets have been closed to traffic, further helping to physically integrate facilities at the Center; Fluornoy Street provides a

2.4.2 ALTERNATIVES · DESCRIPTION
2-76
relevant example. According to the Medical Center Commission, street closing and cross block development is likely to continue as institutions continue to expand and consolidate.
Personal security is also an important issue in the area. By comparison with many other parts of the city, the crime rate is high, with the highest number of incidents occurring along the southern edge of the study area.
Figure 2.25 shows the existing transit service in the Medical Center study area. The Chicago Transit Authority (CTA) operates two rail lines and seven bus routes in the area. In addition, twelve transportation services are operated by the institutions in the Center to meet various needs. Table 2.11 shows their basic characteristics and ridership patterns. Four of the services are demand-responsive while the remainder are fixed routes.
While several AGT alternatives were considered during the study, only the final one is presented in Figure 2.26. Due to relatively low travel demand, a configuration which minimizes total guideway length is inrportant. The crossing of an elevated AGT with the elevated CTA Douglas Line constrains the available alignments as well. An alternate alignment (not shown) serving the northwest corner of the Center could also be used, if proposed development in that area occurs. This alignment would provide better service to yet-to-be-developed areas and would also serve Darnen Station on the CTA's Congress rail rapid transit line.
The characteristics of these two alternatives are summarized in Table 2.12. The AGT would operate at two minute headways in the Medical Center itself and would provide a four minute frequency to the neighborhood east of the Center. The single track loop in the Center would operate in a counter-clockwise direction. The AGT vehicle size most suitable to the site is 30 passengers or less, but the possibility that an AGT system could eventually be extended to the Loop and North Michigan Avenue areas suggests that a compatible system be used.
Two system concepts for AGT were thus examined: a suspended system that is assumed to minimize costs and visual intrusion and has modest operating capabilities, and a larger supported system capable

l.
■ ,
.,,.._ J ~ ~ r.~.~ J. ,,.;._~~~~wJj1i
:la .:i:' -
5m• A !l!!!!!!!!!!!!!!!!!!!!!!!!!!!!!!!!!!!!!t!!!l!!!!!!!!!!!!!!!!!!!!!!!!!f N
'··• EISENHOWER
't EXPRESSWAY -- ,.■~;;-
b 7IIJIII ~,~ ,mr-llll. ~ r-._. f 11 -~ r 'l!"'·-·1, ,z .-..ii•-- -1..........,, . __ _1_ !I ,_1 ---t~ ~ I <( - ·TT r ----rr.- I 16 .. J ....J • Iii WI-. ,J .. ' • .....,
~
'iJS _ _ •1_u: ..... 1v1I-, - 1
"' ~ l_.. r4 ..... ·.,:J-LOI .. . ·•♦ ■ ~ if) . : I ,._ ....... , . l Fr1 I I
- - )"l ·••1 -. iW •
-1/ - I ·
-■-
Figure 2.25 Medical Center, Alternative 1: Status Quo
N I
...J
...J
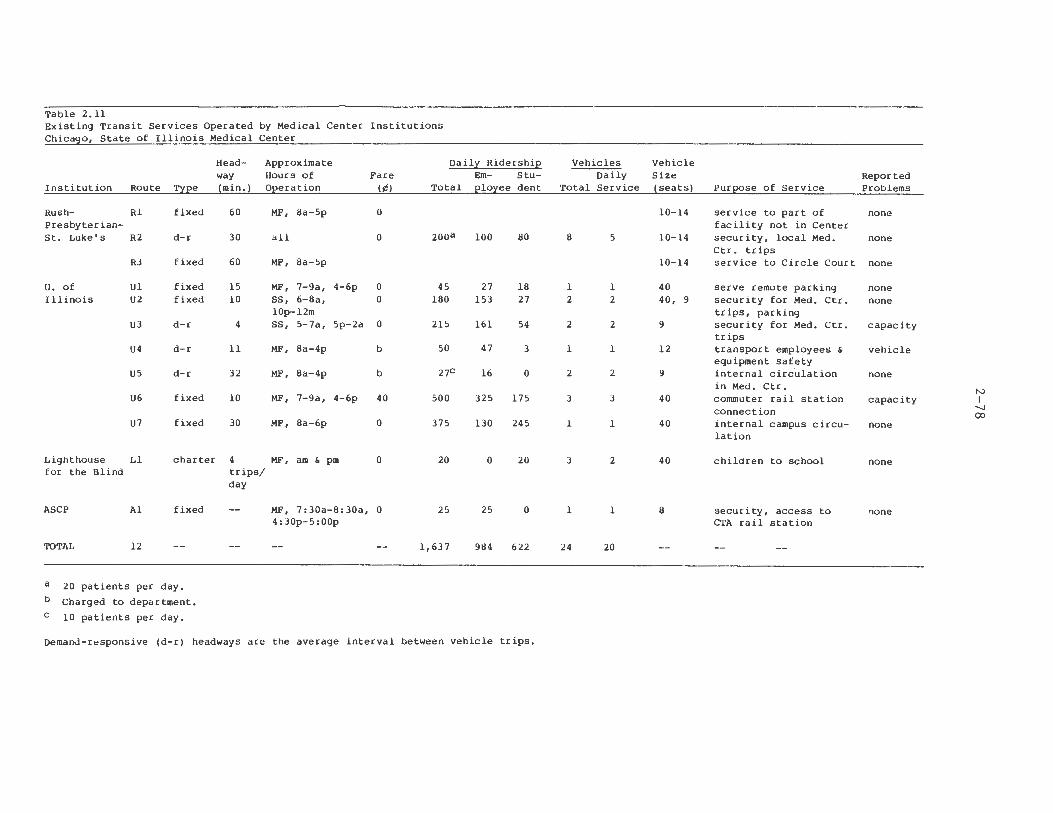
Table 2.11 Existing Transit Services Operated by Medical Center Institutions Chica.9.£L State of Illinois Medical Center
Head- Approximate Oail:i RidershiE Vehicles Vehicle way Hours of Fare Em- Stu- Daily Size Reported
Institution Route T:tEe !min.) 0Eeration !¢! Total Elo:i:ee dent Total Service !seats) PurE>Ose of Service Problems
Rush- Rl fixed 60 MF, Sa-Sp 0 10-14 service to part of none Presbyterian- facility not in Center St. Luke's R2 d-r 30 all 0 200a 100 80 8 5 10-14 security, local Med. none
Ctr. trips R3 fixed 60 MF, Sa-Sp 10-14 service to Circle Court none
u. of Ul fixed 15 MF, 7-9a, 4-6p 0 45 27 18 1 1 40 serve remote parking none Illinois U2 fixed 10 ss, 6-Sa, 0 180 153 27 2 2 40, 9 security for Med. Ctr. none
10p-12m trips, parking U3 d-r 4 ss, 5-7a, 5p-2a 0 215 161 54 2 2 9 security for Med. Ctr. capacity
trips U4 d-r 11 MF, 8a-4p b 50 47 3 1 1 12 transport employees & vehicle
equipment safety us d-r 32 MF, 8a-4p b 27c 16 0 2 2 9 internal circ~lation none
in Med. Ctr. N
U6 fixed 10 MF, 7-9a, 4-6p 40 500 325 175 3 3 40 commuter rail station capacity I connection " co
U7 fixed 30 MF, 8a-6p 0 375 130 245 l l 40 internal campus circu- none lation
Lighthouse Ll charter 4 MF, am & pm 0 20 0 20 3 2 40 children to school none for the Blind trips/
day
ASCP Al fixed -- MF, 7:30a-8:30a, 0 25 25 0 l l 8 security, access to none 4:30p-5:00p CTA rail station
TOTAL 12 -- -- -- -- 1,637 9114 622 24 20
a 20 patients per day. b Charged to department. C 10 patients per day.
DemanJ-responsive (d-r) headways are the average interval between vehicle trips.
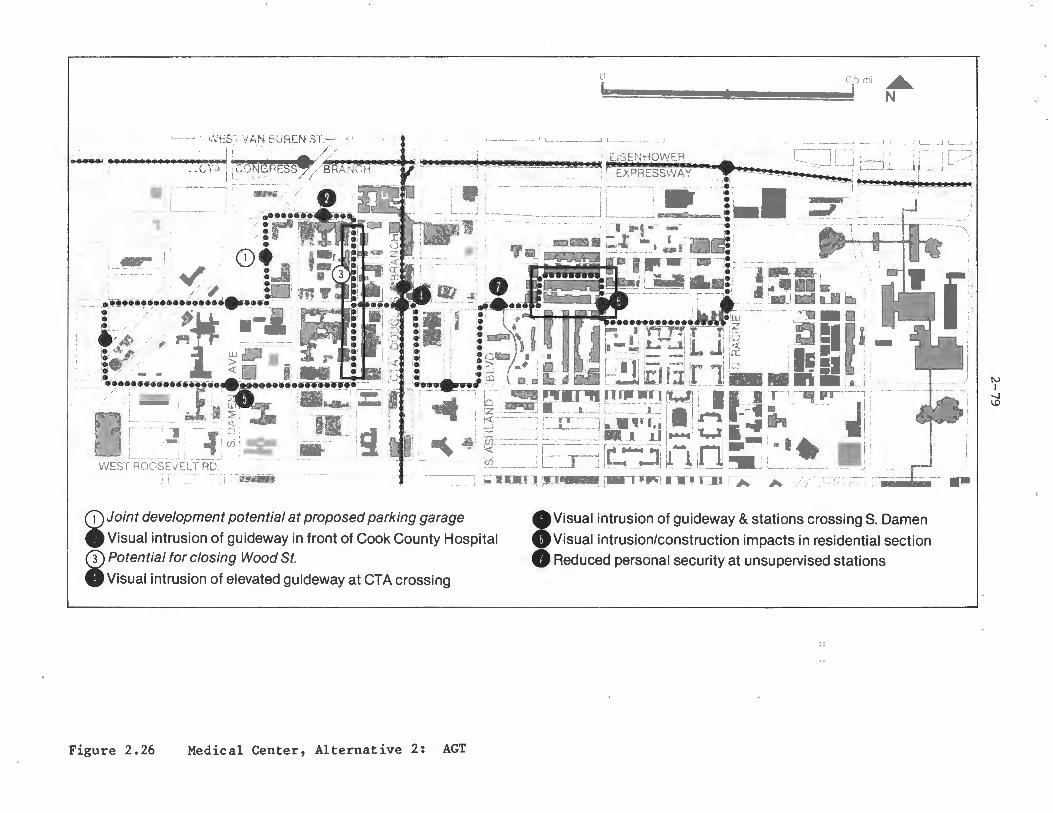
• , .,,..
-I -
_ , J
o:1rn• A N
1.-; --=:- - \ •"'···~ ' _ ,.n'ii.--~..,..., . --·' 1• l 1111111 LIi ~
_. _ - r --.++.f-!+fo!ill-il!lii~ J - -:.]I- ■ I
111 I ·····.·-······~-.·~ l3C- .. ·11 ·I , 1 • 11 rrrn 11 - I' ; , I ll-!j lt....'"'-11 J' ~ _ I -' 1 • 0 11111 1 I ■ -- - - I a: ,; ; !~ -· :• 1.111f11~~ ,, © 1ld ~•-•►-•, L•· =- -11:z ".I ~ h;..--. r,.:.;t'JIJ_. -=.;
1-·11 ~ ~~ ! ~ , __ -
◄ lO _../ ■I~ , 11 ■ ~ w ~
I 'Z-- - __ _J --.. --'----.!·•. L -- - _J J I I ..... --t .. ~- -- f- "T-r-7 , -..-.q-JI ' ,. • j _. ...J l ' • • • - ,. •• y J.... I
.t. ,II, ~ -- L ___ .. -. J - I. JJ ..... I ~ I I ....... ~ -• •~··--- F - t,1o1,t ., - 'n l • -W ■
•(I)__ l _ ___r~J t.;__ :...1! J_ i G __ : ~ _ __ _
'
--- l f- HIITl, !11.1 , [- fTIPlii! 1 ■ •Til i ~ - - A ,' 1 --s--l P
(J)Joint development potential at proposed parking garage
• Visual intrusion of guideway in front of Cook County Hospital G) Potential for closing Wood St.
Gvisual intrusion of elevated guideway at CTA crossing
Figure 2.26 Medical Center, Alternative 2: AGT
I Visual intrusion of guideway & stations crossing S. Darnen
Visual intrusion/construction impacts in residential section
8 Reduced personal security at unsupervised stations
tv I
-.J I.O

2-80
Table 2.12 Alternatives Description Chicago, State of Illinois Medical Center
Alternative
System Length (one-way mi.)
Number of Stations
Vehicle Size (seats)
Headway, peak (min.)
Headway, off-peak (min.)
Fare Policy (cents)
Maximum Speed (mph)
Average System Speed (mph)
Construction
1 Status Quo
9-50
8 (avg.)
12 (avg.)
50 (CTA) 10 transfer (CTA) 0-40 (other)
9-121
2
2
50 10
2
AGT
4.7
12
30 or 50
(Ctr.)/4
(Ctr.)/4
10 transfer transfer
25
14
Elevated
(Residential)
(Residential)
to CTA, from CTA
An 18-hour operating day is assumed; AGT could operate in demand-responsive mode in certain off-peak periods.
1 9 mph within Medical Center; 12 mph beyond it.
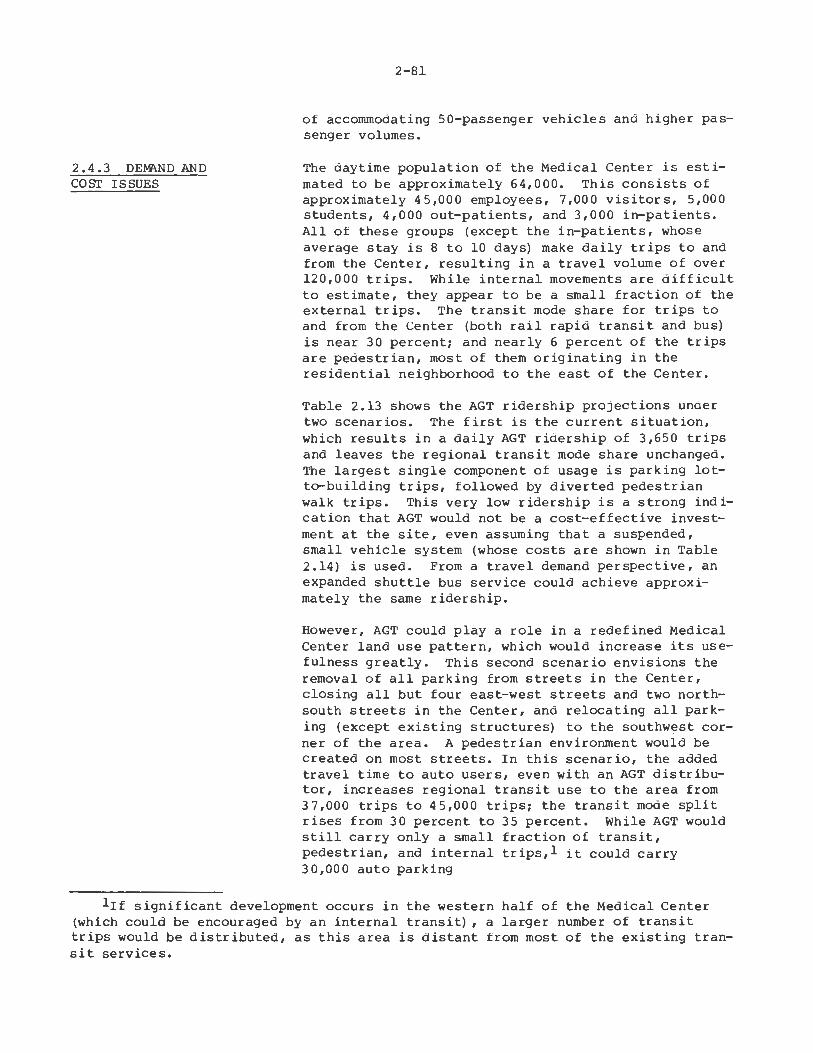
2.4.3 DE1'i\ND AND
COS!' ISSUES
2-81
of accommodating SO-passenger vehicles and higher passenger volumes.
The daytime population of the Medical Center is estimated to be approximately 64,000. This consists of approximately 45,000 employees, 7,000 visitors, 5,000 students, 4,000 out-patients, and 3,000 in-patients. All of these groups (except the in-patients, whose average stay is 8 to 10 days) make daily trips to and from the Center, resulting in a travel volume of over 120,000 trips. While internal movements are difficult to estimate, they appear to be a small fraction of the external trips. The transit mode share for trips to and from the Center (both rail rapid transit and bus) is near 30 percent; and nearly 6 percent of the trips are pedestrian, most of them originating in the residential neighborhood to the east of the Center.
Table 2.13 shows the AGT ridership projections under two scenarios. The first is the current situation, which results in a daily AGT ridership of 3,650 trips and leaves the regional transit mode share unchanged. The largest single component of usage is parking lotter-building trips, followed by diverted pedestrian walk trips. This very low ridership is a strong indication that AGT would not be a cost-effective investment at the site, even assuming that a suspended, small vehicle system (whose costs are shown in Table 2.14) is used. From a travel demand perspective, an expanded shuttle bus service could achieve approximately the same ridership.
However, AGT could play a role in a redefined Medical Center land use pattern, which would increase its usefulness greatly. This second scenario envisions the removal of all parking from streets in the Center, closing all but four east-west streets and two northsouth streets in the Center, and relocating all parking (except existing structures) to the southwest corner of the area. A pedestrian environment would be created on most streets. In this scenario, the added travel time to auto users, even with an AGT distributor, increases regional transit use to the area from 37,000 trips to 45,000 trips; the transit mode split rises from 30 percent to 35 percent. While AGT would still carry only a small fraction of transit, pedestrian, and internal trips,l it could carry 30,000 auto parking
lif significant development occurs in the western half of the Medical Center (which could be encouraged by an internal transit), a larger number of transit trips would be distributed, as this area is distant from most of the existing transit services.

2-82
Table 2.13 Daily Ridership Summary Chicago, State of Illinois Medical Center
AGT AGT Alternative Status Quo Current Parking Restricted Parking
AGT (All AGT (All Transit) Transit)
External-Internal Trips Work 90,000
Auto 57,0003 1,000 ( 1,000) 20,000 (20,000) Pedestrian 8,000 800 ( 800) 800 ( 800) Bus 12,0004 200 (12,000) 300 (15,000) Rapid Transit 13,0005 500 (13,000) 600 (16,000)
Nonworkl 38,000 Auto 26,000 450 450) 10,000 (10,000) Pedestrian Bus 6,000 100 6,000) 100 ( 7,000) Rapid Transit 6,000 200 6,000) 100 ( 7,000)
Internal Trips2 6,000 Pedestrian 5,700 Bus 300 400 400) 400 400)
Total Trips: 134,000 3,650 39,650 32,300 76,200 Trips on Regional Transit: 37,000 37,000 45,000
DPM feeder mode split and internal mode split models used.
1
2 Assumed to have same vehicle mode split as work trips; no pedestrian trips.
Estimated based on 300 pure internal bus trips (derived from Table 3.4 data, and an assumed 95% pedestrian mode split.
3
4
5
Approximately 400 trips use internal bus from parking lot to destination.
CTA routes passing through the Medical Center have peak loads near 4,000 passengers in the peak two hours; over 500 trips are handled on Medical Center routes as well.
Approximately 100 trips use internal bus to or from CTA rail stations; CTA has 12,700 daily passengers at Polk and Medical Center stations.

Table 2 .14 Revenue and Cost Summary (1978 dollars) Chicago, State of Illinois Medical Center
2-83
Status Quo
Alternative
Annual Ridership
Number of Vehicles
Total Capital Cost:2 ( $ millions)
Guideway Stations Vehicles
Annual Capital Cost3
Annual Vehicle-Miles:
Annual Operating Cost
Annual Revenues4
Revenues-Operating Cost
Revenues-Total Annual Cost
Change in Auto VMT, Annuals
AGT
1,200,000
11
20 13
4
$2,100,000
630,000
$ 750,000
$ 120,000
-$ 630,000
-$2,730,000
negligible
Assumes 9 mph average speed.
Equivalent Bus System
1,200,000
171
0 0 2
$ 200,000
630,000
$1,300,000
$ 120,000
-$1, 18 0,,000
-$1,380,000
negligible
Restricted Parking Equivalent
AGT Bus System
10,500,000 10,500,000
11 171
26 0 17 0
5 2
$2,800,000 $ 200,000
630,000 630,000
$1,000,000 $1,300,000
$1,000,000 $1,000,000
0 -$ 300,000
-$2,800,000 -$ 500,000
12,000,000 12,000,000
1
2 Assumed suspended with 30 passenger vehicles in status quo, supported with 50 passenger vehicles in "restricted parking." Suspended capital and operating costs assumed to be 3/4 of supported costs, as discussed in Merrillville site (Table 2.13).
3
4
5
Assumes a 10 percent interest rate and a 6 percent inflation rate.
Based on 10-cent fare for parking and internal ridership; 10-cent transfers to CTA. Based on average auto trip length of 5 miles and 1.2 occupancy.
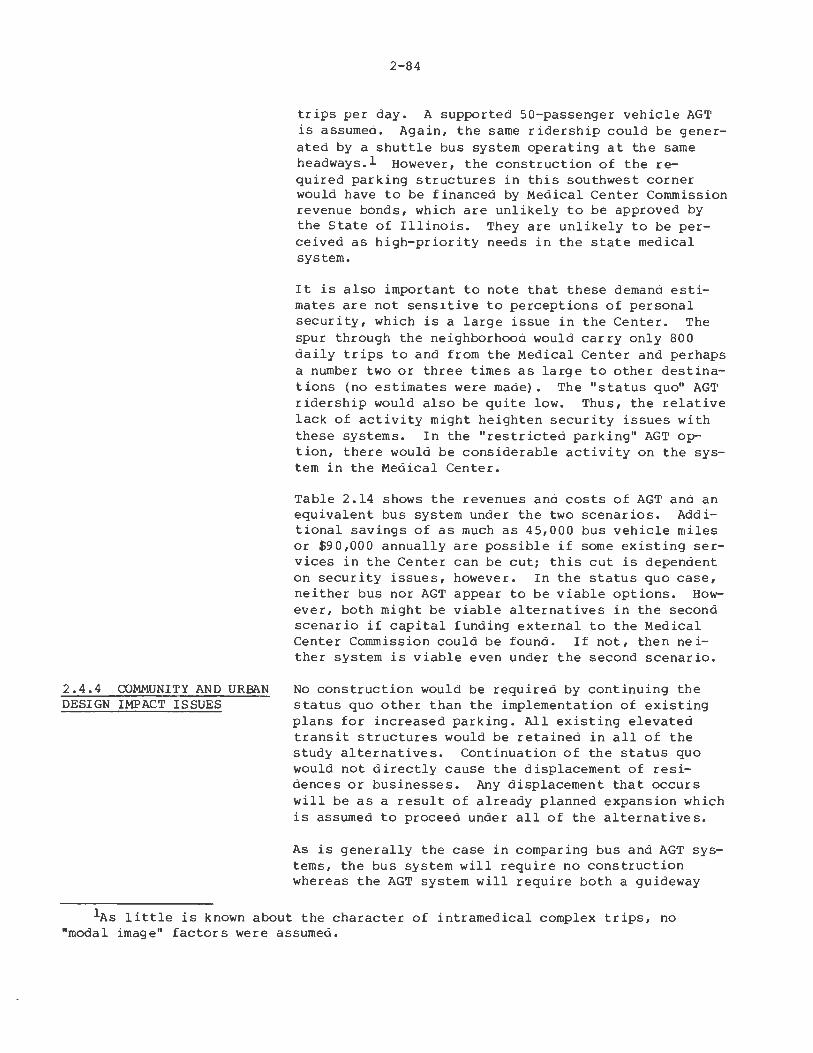
2.4.4 COMMUNITY AND URBAN DESIGN IMPACT ISSUES
2-84
trips per day. A supported SO-passenger vehicle AGT is assumed. Again, the same ridership could be generated by a shuttle bus system operating at the same headways.l However, the construction of the required parking structures in this southwest corner would have to be financed by Medical Center Commission revenue bonds, which are unlikely to be approved by the State of Illinois. They are unlikely to be perceived as high-priority needs in the state medical system.
It is also important to note that these demand estimates are not sensitive to perceptions of personal security, which is a large issue in the Center. The spur through the neighborhooo would carry only 800 daily trips to and from the Medical Center and perhaps a number two or three times as large to other destinations (no estimates were made). The "status quo" AGT ridership would also be quite low. Thus, the relative lack of activity might heighten security issues with these systems. In the "restricted parking" AGT option, there would be considerable activity on the system in the Medical Center.
Table 2.14 shows the revenues and costs of AGT and an equivalent bus system under the two scenarios. Additional savings of as much as 45,000 bus vehicle miles or $90,000 annually are possible if some existing services in the Center can be cut; this cut is dependent on security issues, however. In the status quo case, neither bus nor AGT appear to be viable options. However, both might be viable alternatives in the second scenario if capital funding external to the Medical Center Commission could be found. If not, then neither system is viable even under the second scenario.
No construction would be required by continuing the status quo other than the implementation of existing plans for increased parking. All existing elevated transit structures would be retained in all of the study alternatives. Continuation of the status quo would not directly cause the displacement of residences or businesses. Any displacement that occurs will be as a result of already planned expansion which is assumed to proceed under all of the alternatives.
As is generally the case in comparing bus and AGT systems, the bus system will require no construction whereas the AGT system will require both a guideway
1As little is known about the character of intramedical complex trips, no "modal image" factors were assumed.
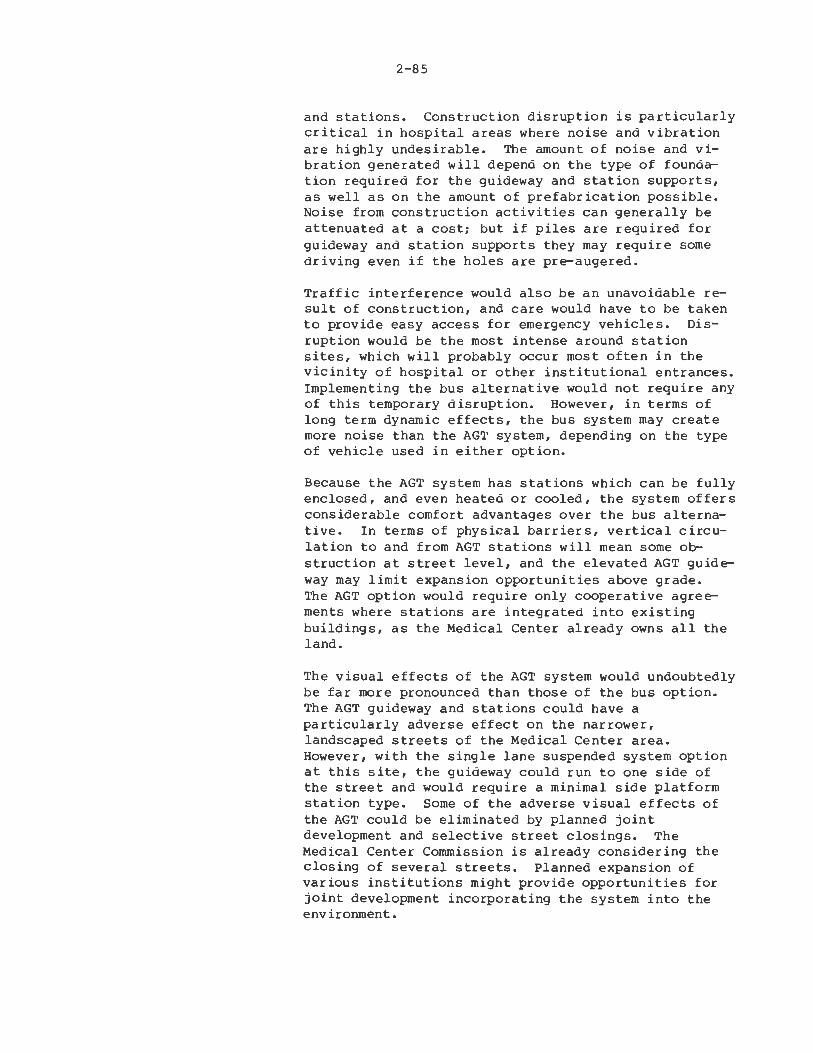
2-85
and stations. Construction disruption is particularly critical in hospital areas where noise and vibration are highly undesirable. The amount of noise and vibration generated will depend on the type of foundation required for the guideway and station supports, as well as on the amount of prefabrication possible. Noise from construction activities can generally be attenuated at a cost; but if piles are required for guideway and station supports they may require some driving even if the holes are pre-augered.
Traffic interference would also be an unavoidable result of construction, and care would have to be taken to provide easy access for emergency vehicles. Disruption would be the most intense around station sites, which will probably occur most often in the vicinity of hospital or other institutional entrances. Implementing the bus alternative would not require any of this temporary disruption. However, in terms of long term dynamic effects, the bus system may create more noise than the AGT system, depending on the type of vehicle used in either option.
Because the AGT system has stations which can be fully enclosed, and even heated or cooled, the system offers considerable comfort advantages over the bus alternative. In terms of physical barriers, vertical circulation to and from AGT stations will mean some obstruction at street level, and the elevated AGT guideway may limit expansion opportunities above grade. The AGT option would require only cooperative agreements where stations are integrated into existing buildings, as the Medical Center already owns all the land.
The visual effects of the AGT system would undoubtedly be far more pronounced than those of the bus option. The AGT guideway and stations could have a particularly adverse effect on the narrower, landscaped streets of the Medical Center area. However, with the single lane suspended system option at this site, the guideway could run to one side of the street and would require a minimal side platform station type. Some of the adverse visual effects of the AGT could be eliminated by planned joint development and selective street closings. The Medical Center Commission is already considering the closing of several streets. Planned expansion of various institutions might provide opportunities for joint development incorporating the system into the environment.
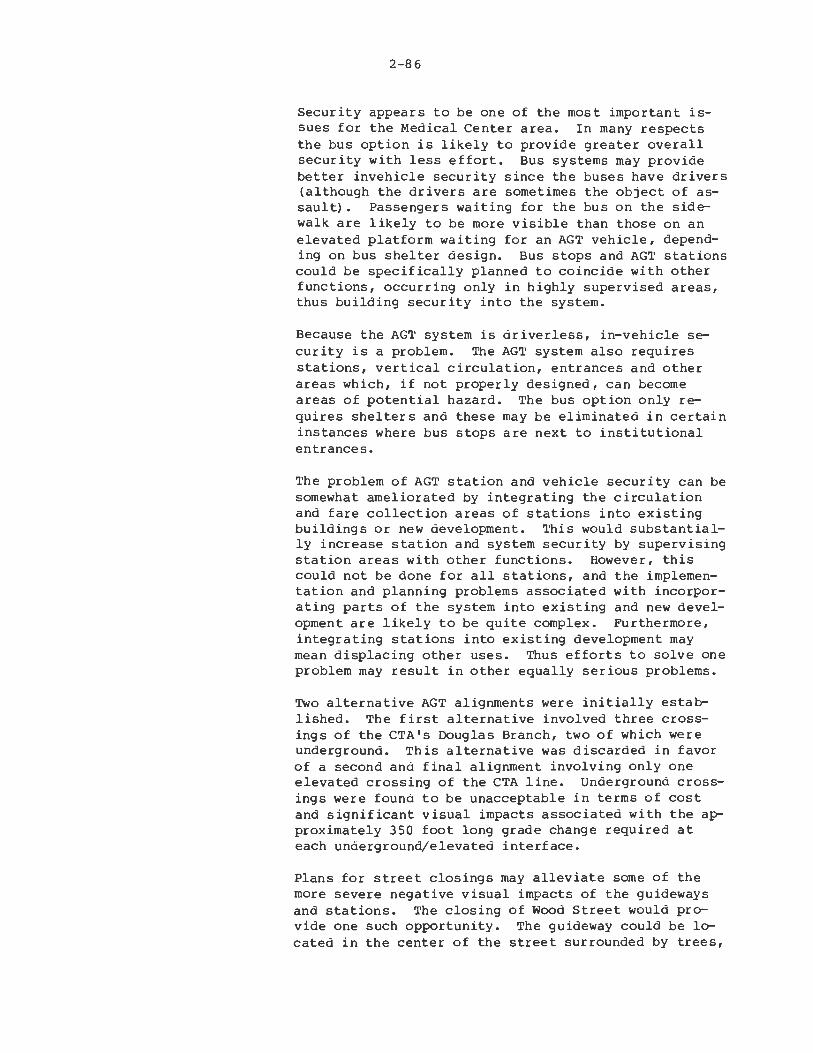
2-86
Security appears to be one of the most important issues for the Medical Center area. In many respects the bus option is likely to provide greater overall security with less effort. Bus systems may provide better invehicle security since the buses have drivers (although the drivers are sometimes the object of assault). Passengers waiting for the bus on the sidewalk are likely to be more visible than those on an elevated platform waiting for an AGT vehicle, depending on bus shelter design. Bus stops and AGT stations could be specifically planned to coincide with other functions, occurring only in highly supervised areas, thus building security into the system.
Because the AGT system is driverless, in-vehicle security is a problem. The AGT system also requires stations, vertical circulation, entrances and other areas which, if not properly designed, can become areas of potential hazard. The bus option only requires shelters and these may be eliminated in certain instances where bus stops are next to institutional entrances.
The problem of AGT station and vehicle security can be somewhat ameliorated by integrating the circulation and fare collection areas of stations into existing buildings or new development. This would substantially increase station and system security by supervising station areas with other functions. However, this could not be done for all stations, and the implementation and planning problems associated with incorporating parts of the system into existing and new development are likely to be quite complex. Furthermore, integrating stations into existing development may mean displacing other uses. Thus efforts to solve one problem may result in other equally serious problems.
Two alternative AGT alignments were initially established. The first alternative involved three crossings of the CTA's Douglas Branch, two of which were underground. This alternative was discarded in favor of a second and final alignment involving only one elevated crossing of the CTA line. Underground crossings were found to be unacceptable in terms of cost and significant visual impacts associated with the approximately 350 foot long grade change required at each underground/elevated interface.
Plans for street closings may alleviate some of the more severe negative visual impacts of the guideways and stations. The closing of Wood Street would provide one such opportunity. The guideway could be located in the center of the street surrounded by trees,
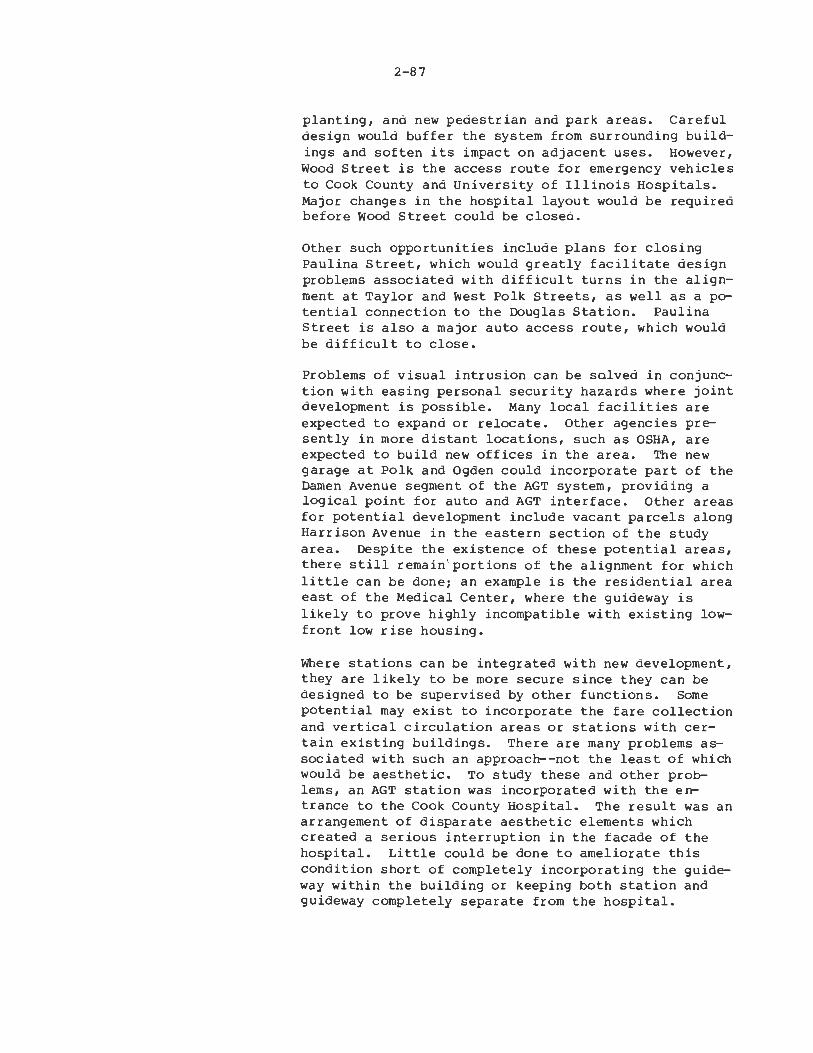
2-87
planting, and new pedestrian and park areas. Careful design would buffer the system from surrounding buildings and soften its impact on adjacent uses. However, Wood Street is the access route for emergency vehicles to Cook County and University of Illinois Hospitals. Major changes in the hospital layout would be required before wood Street could be closea.
Other such opportunities include plans for closing Paulina Street, which would greatly facilitate design problems associated with difficult turns in the alignment at Taylor and West Polk Streets, as well as a p<r tential connection to the Douglas Station. Paulina Street is also a major auto access route, which would be difficult to close.
Problems of visual intrusion can be salved in conjunction with easing personal security hazards where joint development is possible. Many local facilities are expected to expand or relocate. Other agencies presently in more distant locations, such as OSHA, are expected to build new offices in the area. The new garage at Polk and Ogden could incorporate part of the Darnen Avenue segment of the AGT system, providing a logical point for auto and AGT interface. Other areas for potential development include vacant parcels along Harrison Avenue in the eastern section of the study area. Despite the existence of these potential areas, there still remain ' portions of the alignment for which little can be done; an example is the residential area east of the Medical Center, where the guideway is likely to prove highly incompatible with existing lowfront low rise housing.
Where stations can be integrated with new development, they are likely to be more secure since they can be designed to be supervised by other functions. Some potential may exist to incorporate the fare collection and vertical circulation areas or stations with certain existing buildings. There are many problems associated with such an approach--not the least of which would be aesthetic. To study these and other problems, an AGT station was incorporated with the entrance to the Cook County Hospital. The result was an arrangement of disparate aesthetic elements which created a serious interruption in the facade of the hospital. Little could be done to ameliorate this condition short of completely incorporating the guideway within the building or keeping both station and guideway completely separate from the hospital.
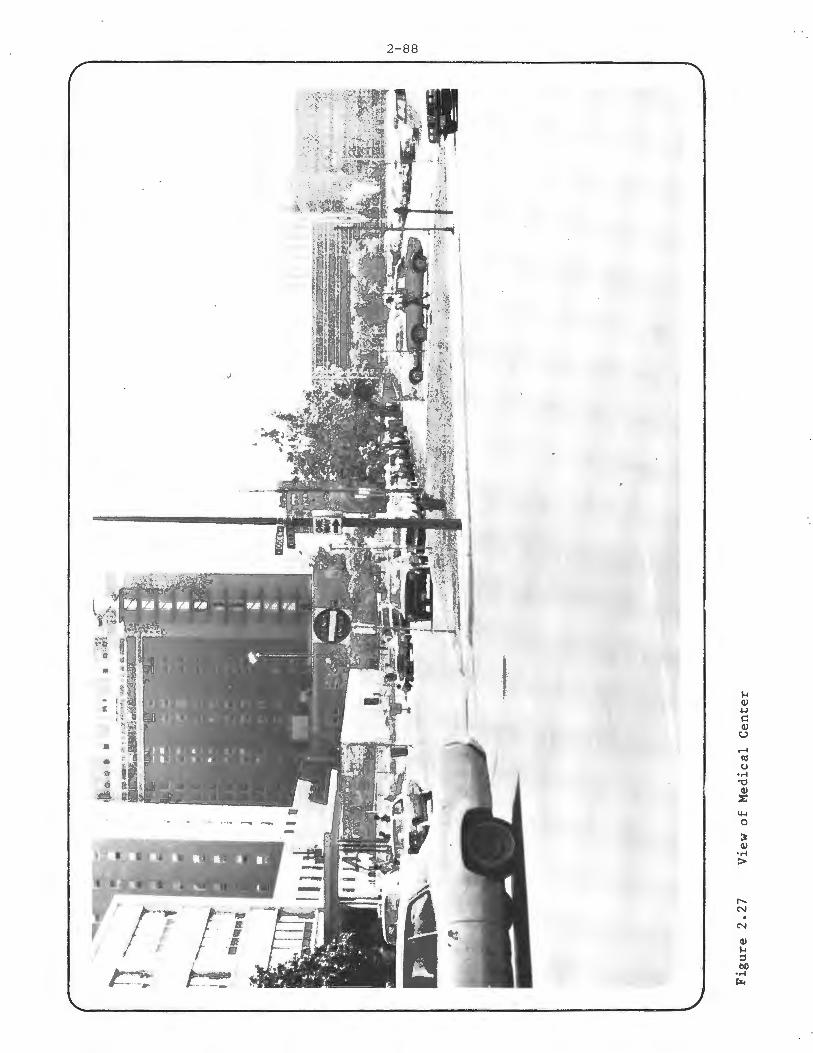
2-88
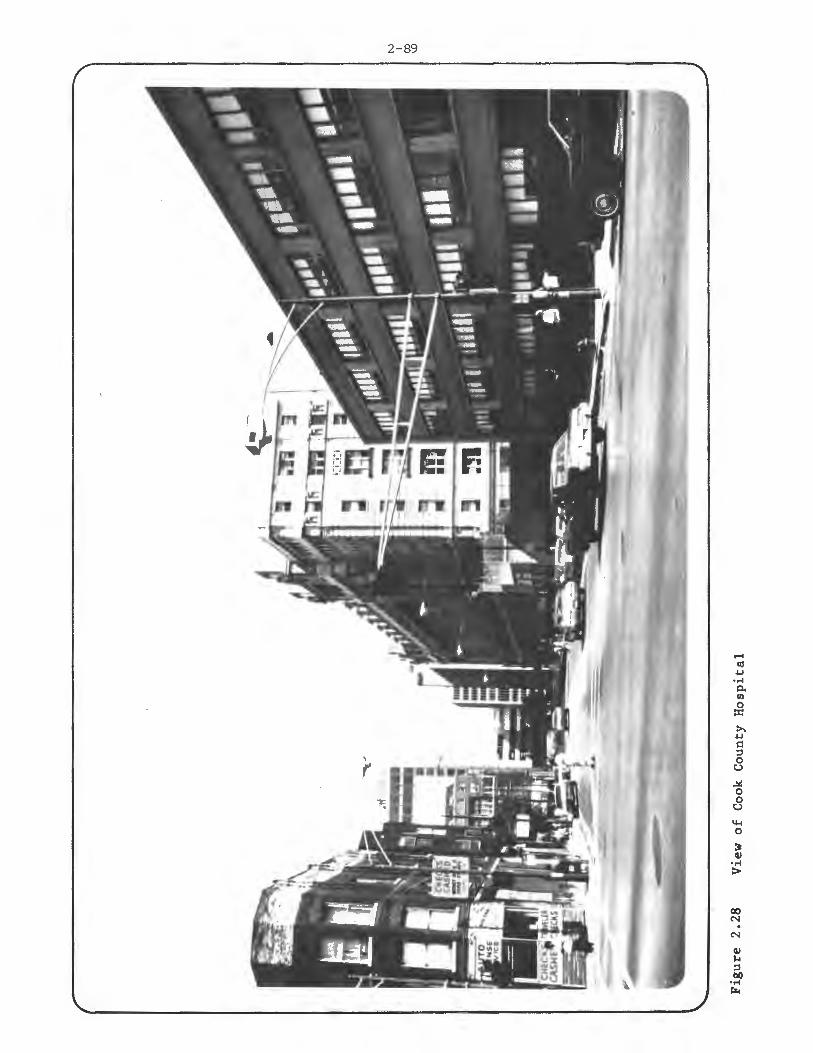
2-89
00 N . N
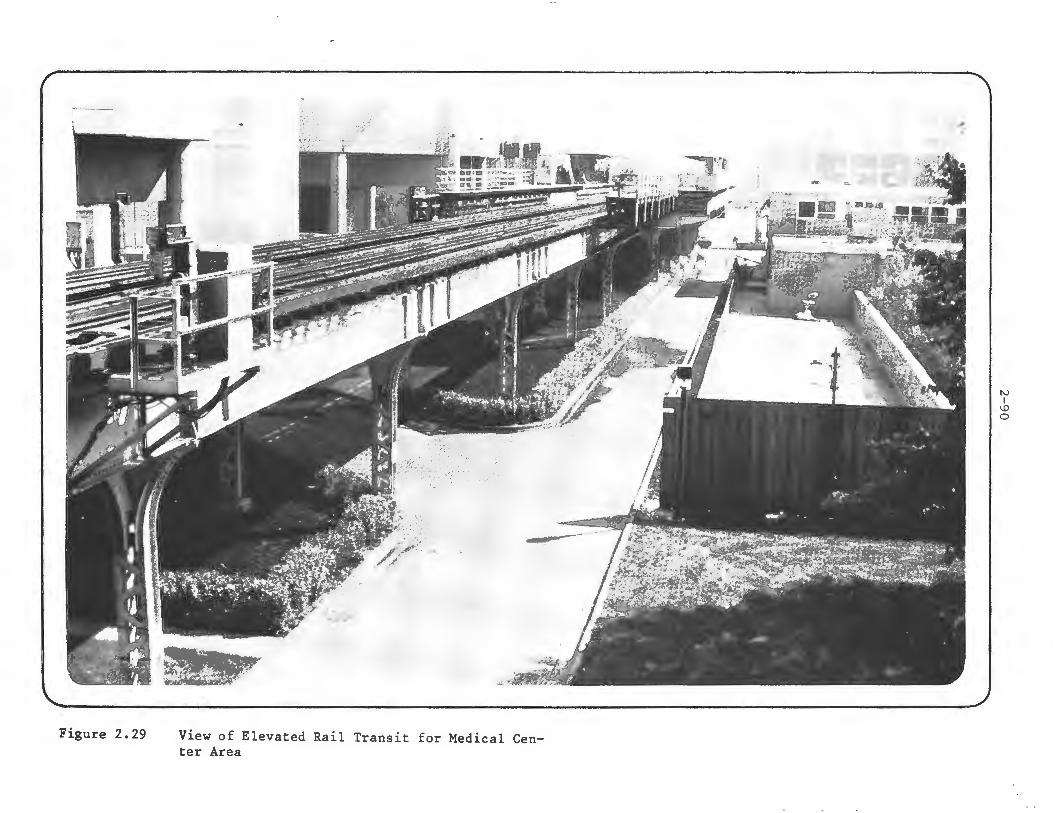
Figure 2.29 View of Elevated Rail Transit for Medical Center Area
N I
\D 0
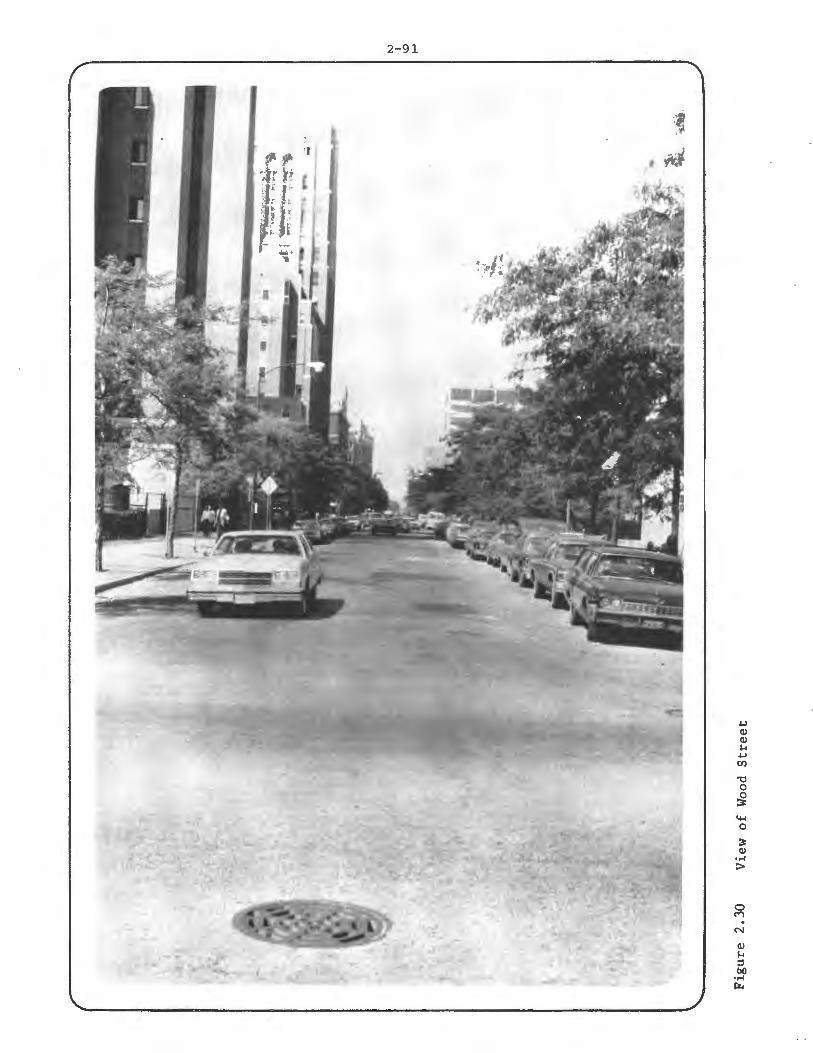
2-91

2-92.
-' :!
- i
/
/;'. / /;'/
,/
/
Figure 2.31 View of Suspended AGT System Along Wood Street
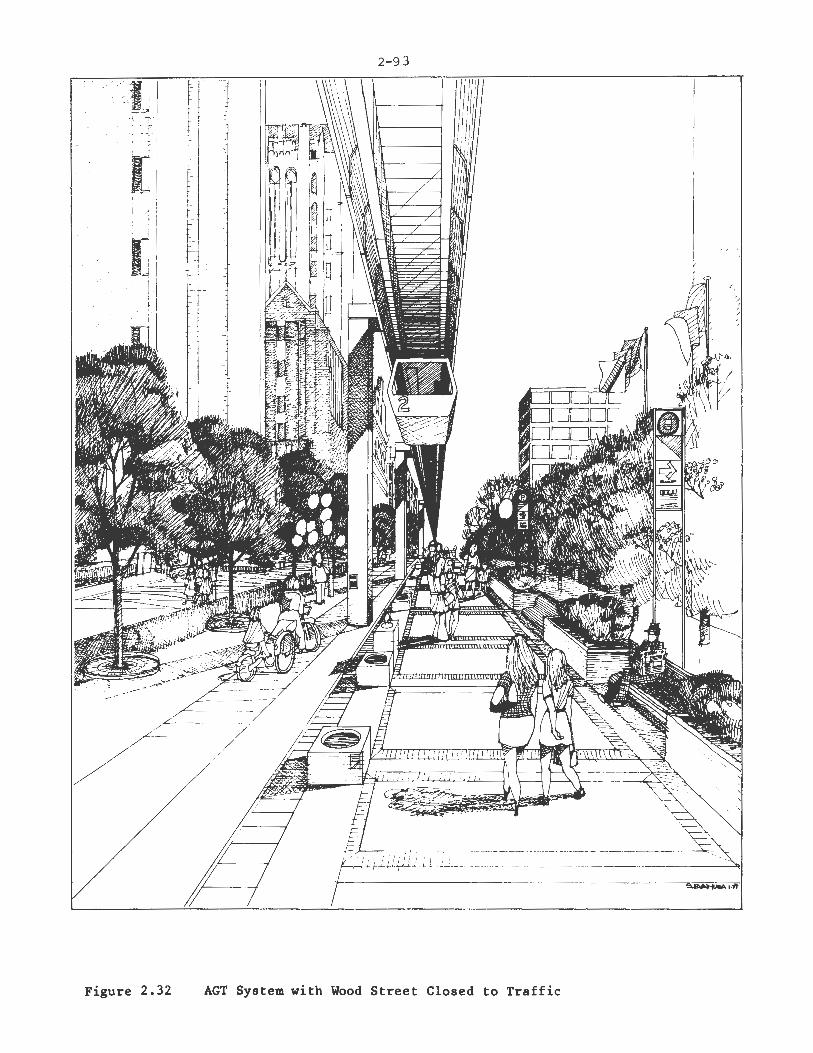
2-93
/1!/i -.
t ~ .
, I
t -
i. l [-
. ' ;
l I ',;
i- 1 /
----
----~-:"'-"- ", ~ -... ' -- --- ~ --: ~ '----
', '
fJ ~! i j+,'Jj ~! i' : __ _ ----- --- ---- ----- - - - -- -- ~ ~,-tr
Figure 2.32 AGT System with Wood Street Closed to Traffic
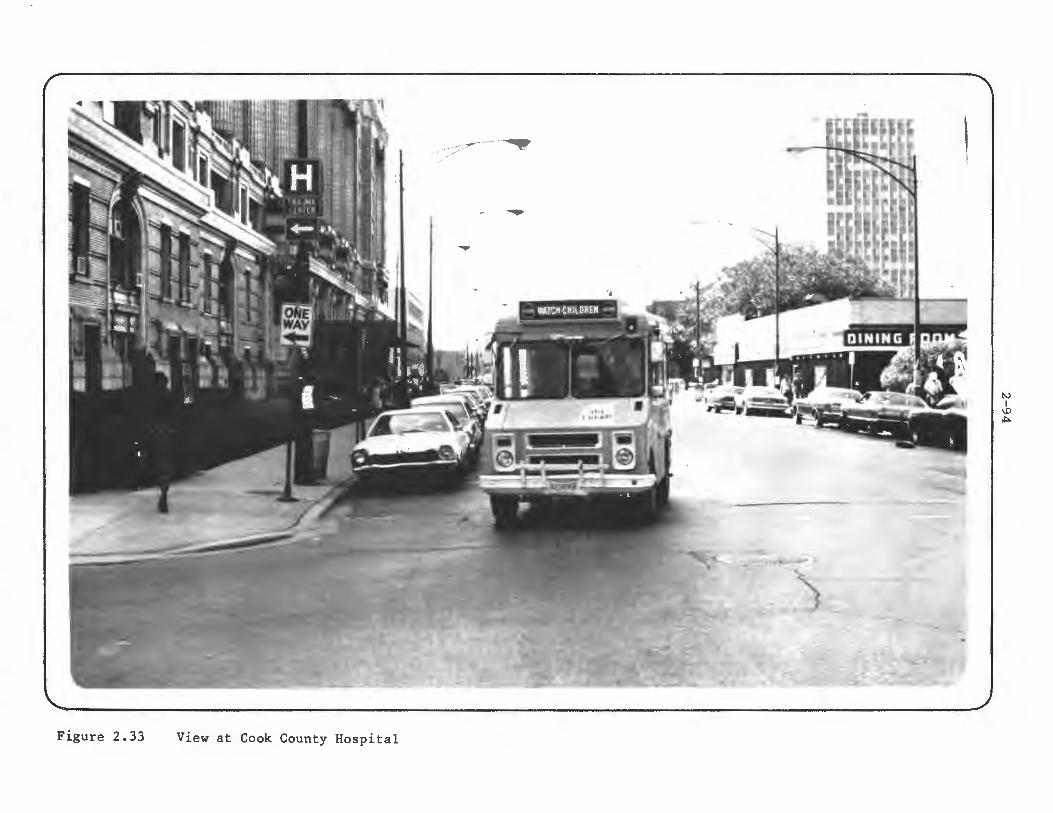
Figure 2.33 View at Cook County Hospital
N I
I.O .i,.
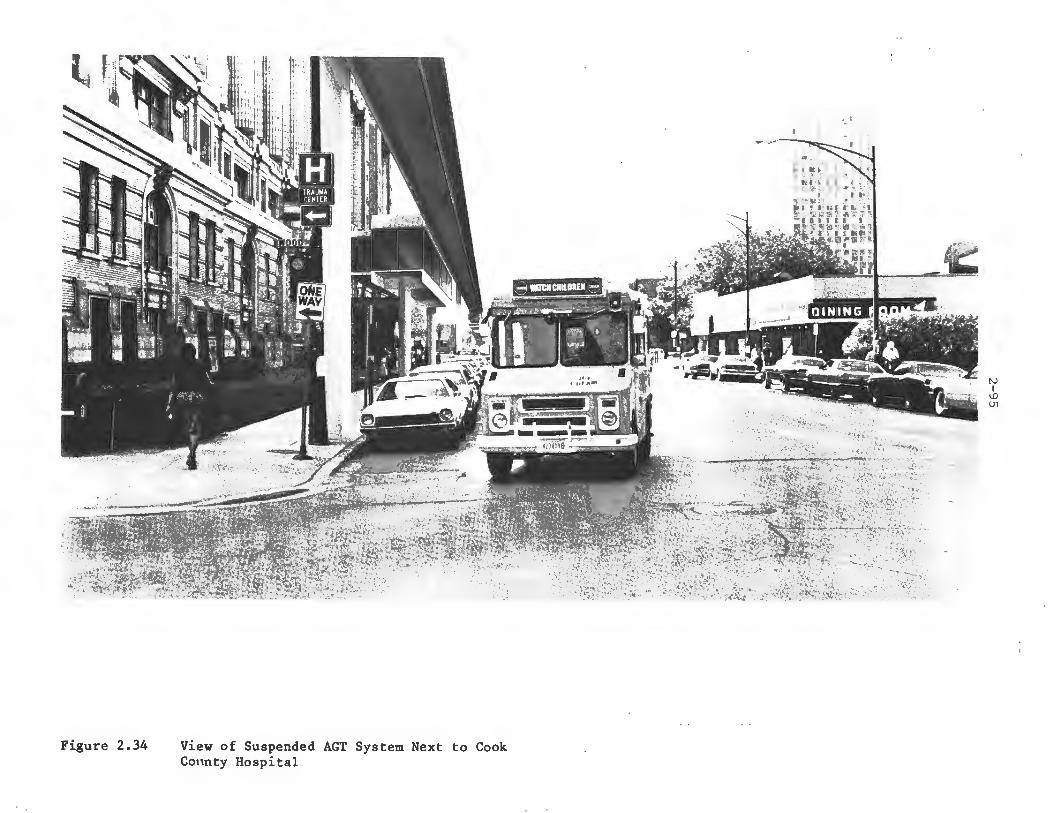
Figure 2.34 View of Suspended AGT System Next to Cook Connty Hospital
' ' i t
N I
\.0 Vl
2.4.5 INsrITUTIONAL ISSUES
2-96
In terms of urban design and community impacts the bus option appears favorable in comparison with AGT. A bus system could probably be designed to provide greater system wide security than the AGT by proper bus stop planning. The visual intrusion caused by the bus system would be very minimal. Although the impact of the AGT system could be mitigatea through street closings, the same could also be said of the bus system. In fact, bus only, pedestrian streets could be designed to be more pleasant environments in the absence of elevated structures.
2.4.5.1 Setting
The same agencies involved in transit planning and operations in the City of Chicago as described in the North Michigan Avenue site would be involved in the Medical Center, though possibly less directly. In addition, there are public and private agencies whose responsibilities are specific to the Medical Center site. These organizations and their respective roles are discussed below:
When the Illinois State Legislature established the Medical Center District in 1941, it concurrently created a seven-member Medical Center Commission to administer the District. The Commission's membership consists of four appointments by the Governor, one member appointed by the Mayor of Chicago, and one member appointed each by the President of the County Boards of Cook County and the Chicago Park District.
The Commission and the City of Chicago Planning Department work closely on site planning and development and in 1970, the Commission officially retained the City's Department of Planning City and Community Development to provide planning services for the District. The Commission assists the City in data collection and analysis for the area. All of the Commission's activities are funded by the State of Illinois.
Of the more than sixty public and private health service institutions within the District, there are four major ones which control many of the smaller facilities. The four primary institutions and their designated status are listed below:
o Rush Presbyterian - St. Luke's Medical Center (Private)
o Cook County Hospital (County) o Veterans Administration (Federal) o University of Illinois; other state facilities
(State)
2-97
The Medical Center institutions operate independent of each other in all respects. The Medical Center Commission is the only entity which specifically serves the common interests of the District.
2.4.5.2 Key Issues
Local representatives cited four issues that would discourage an AGT deployment at this site. They are insufficient system demand, high cost, personal security issues and institutional factors. While it was felt that an AGT system would offer advantages over a bus system in the areas of performance and land use, the strength of these factors was not enough to compensate for the identified problem areas. In the areas of aesthetics and urban design compatibility and labor considerations, the representatives felt that no major problems existed.
The institutions of the Medical Center are operationally virtually independent of each other which results in a low level of trip making between Medical Center buildings by employees, visitors and students. Medical Center and DPCCD representatives felt that the largest demand for an internal circulation system would be trips from the parking garages to the buildings. However, in viewing the projected demand relative to the syste~ costs, they did not feel that an investment of $10 million or more for an AGT system was a practical application of funds at this site.
Medical Center representatives stated that any internal circulation system considered would have to be self supporting if the system responsibility rested with the Medical Center Commission and the affected institutions, according to their charters. All parking garages in the Medical Center must be and are self supporting. Thus, it is not very likely that any of the operating deficits for either the bus or AGT system could be subsidized by the Center or its institutions. If deficits were small, it might be possible to cross-subsidize them from parking revenues, although they appear too large for that approach.
Although the Medical Center Commission's activities are state funded, representatives indicated that state support for an AGT system was extremely unlikely. Recently, the state has even been reluctant to provide the Commission with funds to acquire land which is one of the primary Commission functions. While the Medical Center Commission could possibly issue a bond to build an AGT system, the revenues would have to cover

2-98
expenses and this is not likely under the more probable ridership scenarios.
A DPCCD representative noted that it is also unlikely that the individual institutions would be willing to appropriate any of their federally received Hill Burton funds for an AGT system due to the low priority of an AGT system relative to other medically related needs. Even if they would consider this financing option, it is not clear that Hill Burton funds can legally be committed to AGT purposes.
Although the CTA does not have the final decision making authority with respect to an AGT system for this area, CTA representatives indicated that they would not be willing to take on a deficit operation at this site although they would consider managing the system under contract to the Medical Center Commission. Under the status quo situation, both the bus and AGT systems would operate at annual operating deficits of exceeding $500,000, which are unacceptable. If the street closings and restricted parking could be achieved on a massive scale, then an AGT system could operate in a break even situation while an equivalent bus system would have a deficit of $300,000 annually. However, Medical Center and DPCCD representatives did not feel that street and parking closings of the magnitude required were likely to occur in the near future.
Issues of personal security were considered to be another major factor affecting the feasibility of an AGT system versus a bus system at this site. It was felt that both the absence of vehicle operators and the elevated stations on an AGT system made the perceived, if not the real opportunities for criminal activity on an AGT system greater than on a bus system.
A DPCCD representative did note that issues of personal security were probably more perceived than real. All of the representatives agreed that the personal security issues would not be likely to preclude AGT consideration as long as a high level of security both in the vehicles and in the station areas was provided and was visibly apparent to the riding public.
Medical Center and DPCCD representatives felt that wherever possible, integrating the AGT system into existing buildings would be a positive step in minimizing criminal opportunities. However, it was felt that this would only be possible in limited situations.
2-99
Thus, from an overall security perspective, the Medical Center and DPCCD representatives felt that a bus system would be preferable to an AGT system.
Another factor which was perceived to discourage AGT implementation at this site was the complexity in achieving coordination among the separate institutions. Currently there is very little coordination among the institutions at the Center. As one example, specialized transit services are currently individually provided by four of the Medical Center institutions. Both the Medical Center and DPCCD representatives felt that this situation was representative of the level of cooperation that the institutions desire and that they would prefer to satisfy their needs on an individual basis, rather than in a common way.
If the institutions were in favor of an AGT system and were willing to work cooperatively to implement the system the Medical Center Commission representative was of the opinion that according to the Commission's charter, they would be legally empowered to operate the system.
The DPCCD would provide assistance to the Commission in planning for the system but would have no direct role in the system management or operation.
The two features of an AGT system which were viewed favorably relative to a bus system were the better level of service which an AGT system could provide and the possible positive influence that a fixed guideway system could have on land use patterns and development at the site. There are existing vacant parcels which are available for development. Several of the Medical Center institutions are contemplating expanding their existing facilities and other institutions not presently located at the Medical Center have expressed an interest in relocating there. Medical Center representatives felt that the existence of an AGT system might have a marginally positive influence on the institutions' decisions; however, this was not likely to be a significant factor in their overall decision making process.
The Medical Center and DPCCD representatives identified several areas where the aesthetic and urban design compatibility of an AGT system would pose problems, particularly on the narrower streets and in noise sensitive areas. However, it was felt that these problems could probably be resolved.

2.4.6 SUMMARY
2-100
The CTA did not feel that any labor issues would arise if an AGT system were implemented since no bus cuts were anticipated. If any bus reductions did occur, they would be minimal and the displaced employees could be absorbed into other bus operations.
The high costs of the system, the predicted low ridership under current parking policies, the issues of personal security and the anticipated lack of interest by the Medical Center institutions (due to their independent operating styles) made it apparent that an AGT system was not appropriate at this particular location. Although the performance of an AGT system was viewed favorably relative to a bus system, and it was felt that an AGT system might contribute to economic development at this site, neither of these factors were perceived to outweigh the major problems associated with an AGT implementation. Finally, although some problems were identified with respect to the urban design compatibility of an AGT system with existing development, these problems were considered to be resolvable.
The State of Illinois Medical Center is typical of the majority of such centers. It is composed of many institutions, located in a central city on a relatively small land area, and served by regional transit. There is little circulation between institutions, and little need for distribution from regional transit or parking. Internal transit investments have much lower priority than medical investments and generally must be self-supporting. Streets are often narrow, and many buildings are older, causing some concerns over visual issues. A center city location causes concerns over security issues. Thus, medical centers do not appear to be a promising market for AGT.
The only medical market for AGT appears to be circulation among buildings within a single institution that are too far apart for walking. AGT's role in this area is further limited to new construction, since existing buildings with a circulation need have already constructed walkways. The number of new facilities affiliated with existing ones but removed some distance is expected 'to be fairly low. Thus, the overall hospital/medical market is expected to be small.
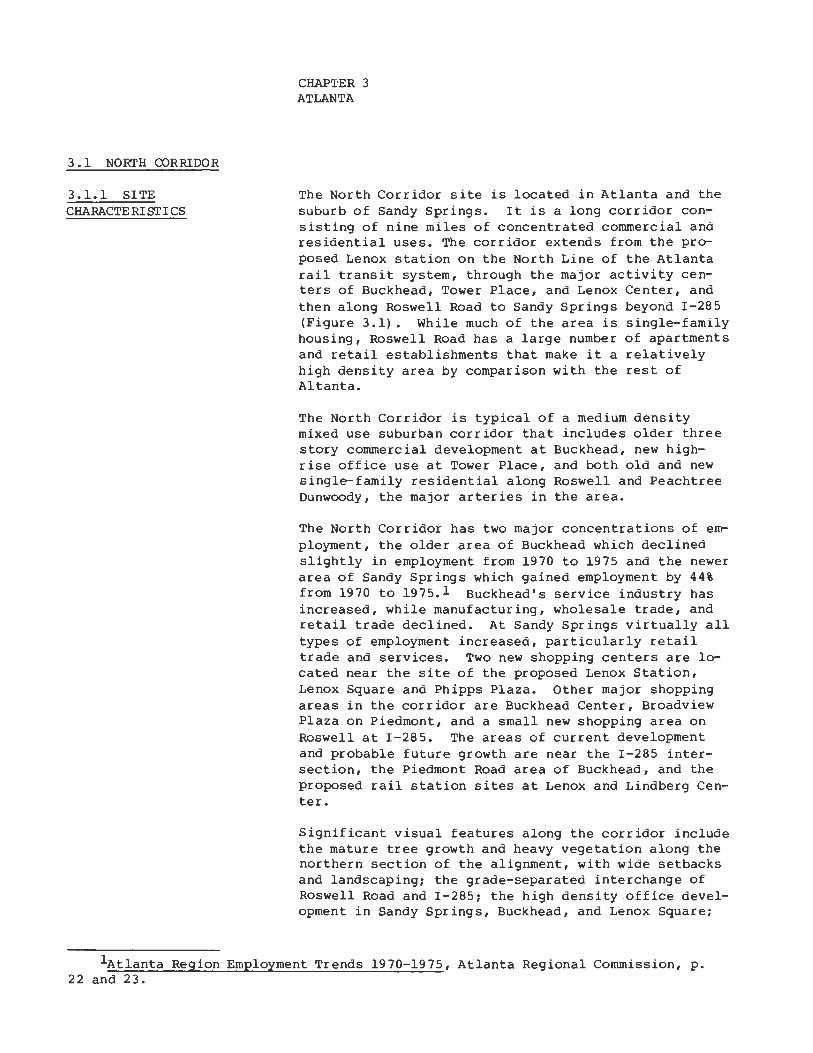
3 .1 NORTH CORRIDOR
3.1.1 SITE CHARACTERISTICS
CHAP'I'ER 3 ATLANTA
The North Corridor site is located in Atlanta and the suburb of Sandy Springs. It is a long corridor consisting of nine miles of concentrated commercial and residential uses. The corridor extends from the proposed Lenox station on the North Line of the Atlanta rail transit system, through the major activity centers of Buckhead, Tower Place, and Lenox Center, and then along Roswell Road to Sandy Springs beyond I-285 (Figure 3.1). While much of the area is single-family housing, Roswell Road has a large number of apartments and retail establishments that make it a relatively high density area by comparison with the rest of Altanta.
The North Corridor is typical of a medium density mixed use suburban corridor that includes older three story commercial development at Buckhead, new highrise office use at Tower Place, and both old and new single-family residential along Roswell and Peachtree Dunwoody, the major arteries in the area.
The North Corridor has two major concentrations of enr ployment, the older area of Buckhead which declined slightly in employment from 1970 to 1975 and the newer area of Sandy Springs which gained employment by 44% from 1970 to 1975.l Buckhead's service industry has increased, while manufacturing, wholesale trade, and retail trade declined. At Sandy Springs virtually all types of employment increased, particularly retail trade and services. Two new shopping centers are located near the site of the proposed Lenox Station, Lenox Square and Phipps Plaza. Other major shopping areas in the corridor are Buckhead Center, Broadview Plaza on Piedmont, and a small new shopping area on Roswell at I-285. The areas of current development and probable future growth are near the I-285 intersection, the Piedmont Road area of Buckhead, and the proposed rail station sites at Lenox and Lindberg Center.
Significant visual features along the corridor include the mature tree growth and heavy vegetation along the northern section of the alignment, with wide setbacks and landscaping; the grade-separated interchange of Roswell Road and I-285; the high density office development in Sandy Springs, Buckhead, and Lenox Square;
1Atlanta Region Employment Trends 1970-1975, Atlanta Regional Commission, p. 22 and 23.
3.1.2 ALTERNATIVES DESCRIPTION
3-2
and the older residential and commercial structures around Buckhead. No significant open space exists along the corridor except for large lot residential areas and a few vacant parcels.
Roswell Road is a four and five lane facility throughout the corridor, offering the most favorable rightof-way opportunities for fixed guideway transit. The other major road in the corridor, Peachtree Dunwoody, is a two lane road in a new single-family home area and presents major problems for any major transportation facility. A possible alignment between these two roads also has been investigated in the course of local planning for a busway facility; however, this right-of-w~y is being encroached upon by new development and thus was not considered in the study.
The existing transit network consists of a bus system as shown on the map in the next section under transit alternatives. The North Line of the rail system will eventually extend to Lenox and Lindberg Center, but not until the late 1980's. The first part of the North Line is under construction. The second part is in design, and the third part, extending to Lindberg Center and Lenox, is in planning.
Figures 3.1 through 3.3 show the primary alternatives considered for the corridor. No status quo alternative was studied, as the regional rail rapid transit system is already under construction. The "improved bus" option is essentially the "do nothing" altern~ tive, given that the rail system is built. Significant bus route revisions are planned to coincide with the implementation of the rail service; however, current routes are shown in the figures for both Atlanta case study corridors. Besides the bus option, AGT and LRT alternatives were also considered. No heavy rail alternative was considered in this analysis, as it would form the third branch from the north-south rail line. This is considered undesirable from an operational standpoint by the Metropolitan Atlanta Rapid Transit Authority (MARTA), the transit operator, since this would make the minimum headway on each branch six minutes.l However, if one of the other two branches on the north-south line were modified or operated with a different technology, the North Corridor could then be considered for heavy rail.
The improved bus service would consist of a pair of routes on Roswell Road, the spine of the corridor, running to the two rail stations (Lindbergh and Lenox)
1Minimum headway on the joint portions of the line is two minutes.
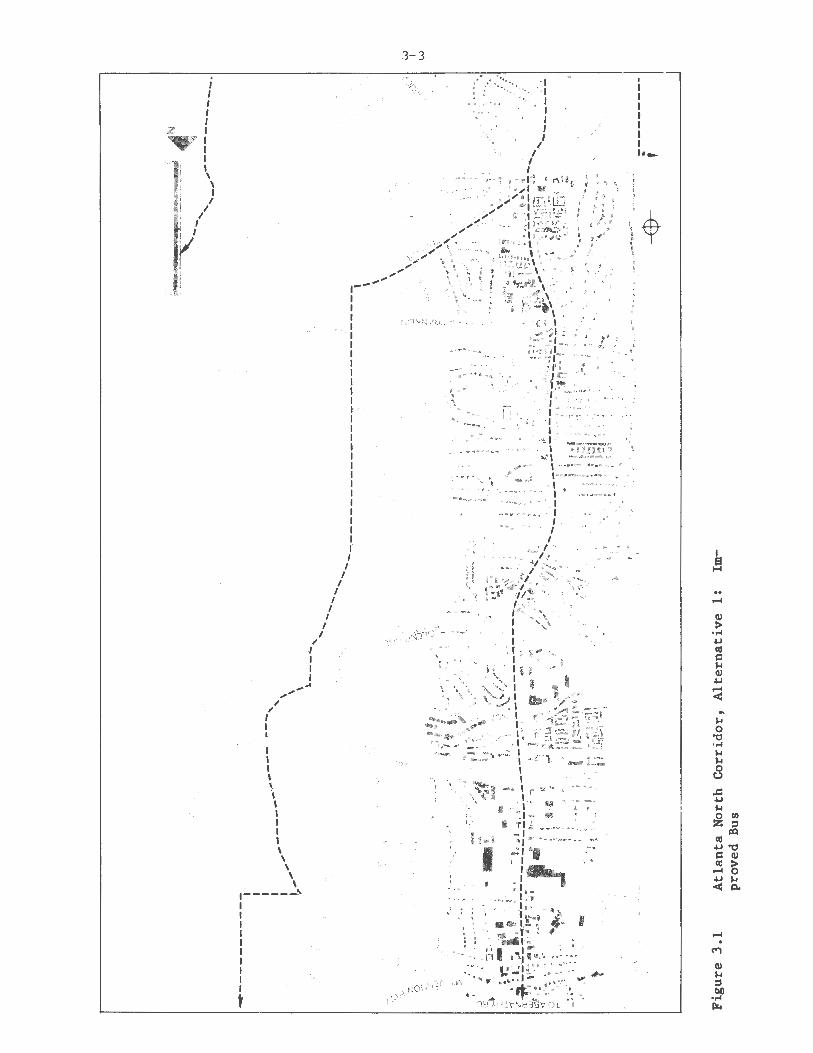
/ I
I I I I I I I I I I \
' I I I
/
/ I I I I ...... .,, ..
/ ,I ,
I I
I I I I
' \ \. I I I I \ \
' \ \ ------'
I I
I I
I I
I I
I I
I
3-3
.. ··. ··.
,,,-' , ... ., _ _. , .................. ,.. ... . I•• . "'• ♦, 1 l ......... ,..,..,,. ,' I
... --..... ....... l.,. ........ "' .......... I •••••• .... , f' •
.......... -. ----.............. ', I : .i I
,. \ . .
' : '
••• .... .,. .... ·,1, I : .. • •·•• • -~ , .,} I " ,, ..
.... "" .... ._ ..... - , J •''"•"· , • I
~
··-
I a 1-1
.-◄
Q)
> ·~ ~ Ill c:: .... Q) ~
.-◄ < .... 0
"'C ·~ .... .... 0 t.)
..c: ~
~
~ Cl)
::, IQ
Ill ~ "'C i:: Q) ell > .-◄ 0 ~ .... < Q..
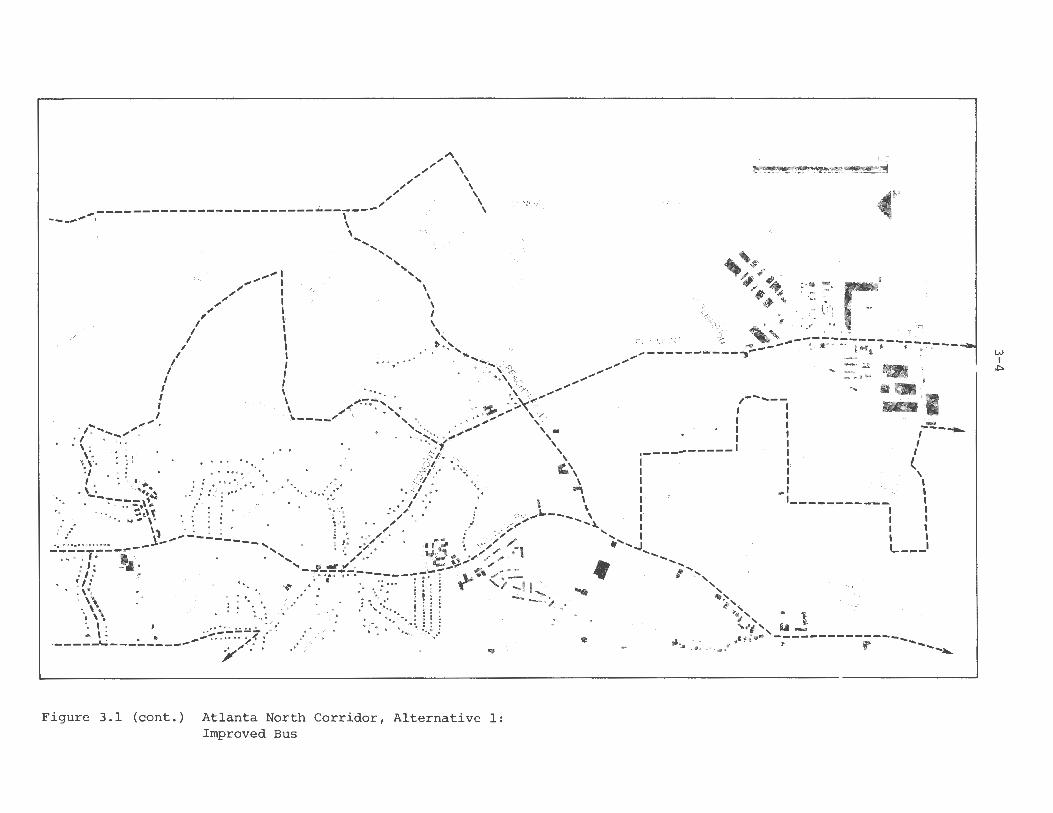
;' --
"' ;' \ ;' \
;' \ ;' \
;' \ ;' \
;';' \
1, rr1
LENOX -----------\------------- ,, ---- ', ___ ,,- ',,,
... , \ ~~# r , . -
◄N
', .,,..,,..- I \ /~ ~ I =.•a,-• ~; ...... ",_. ,,. ~,. ·- :, -., ,.,,, ,. , 0
~
, I I ~---, I \ ------/ I \. ,-• , I > ' •
, I • •• ', ,-
, I • • ',, -O / ,,, __ , I • •• •• • •• \ ,;, ,- , , I • • • , " , I
' I • ',',,, / I , I ••>'S'o' I
PIEDMONT
♦ : .:· r l I uNosrnoH .. , ✓ ; •• , CENTER _ . ~ , , __ .:_-_ :.,· __ ~---;--_":'.--- '
,~ ... --:.■•• •. 11111 I .. - ' --<<ic
0_,;, o" '1,
-:.a ' ::-:. ..
' - ·. :.:: I -----
, I • ••• w. , , ct • I I --, .·,, \ I
I I r- .•• , . :•• ,- , • ____ _ I I / • ', . • ,' \ ----) \ ____ , '<• ... ~- ', i
I • • • •• •. , , \ I I , , # \ I . ~,. ' ~, ,, • b L ••••• I I
- , ' 1· · •• . ""' r • , ---- • <3' •• • \ , • • 0 ' • •• • I • \ . • . . . •. . .., • " ' • • • I \ I , . . • . ••••• • ••· •·• • , • L -,, \ I
•. • ' .; • • • •• •··•• • I • • • 00 .,,. ... .._~ I " . . . ... . .. .. ...•. . . . - ' /
...
' I I
( \ I I I I I
'
. . . . . . . . . . .. . . . ,., ,, •I • • •. •.;'- : ; :,r ' •·• .;, , • , •. .I "''' • '.J,, I • \'••,> •· :. • ' : • • , ' 070 ,-' / ...... .._, I • · • • • ✓ • • • . , . -----=,•• . ' . . , .. .,, '.~ ,,. . I • I . ' ··.. . .... -· " . : • .. ·.-, . • ';;, ./ , , . 'II' ' ,
_ • .,. ·.: . : \,. .,.. 'i::: t~- , -·- •"-, 'l --------, . / .. -- ~A-- . • \ .• •· ,, ' • -- • .,., ,/ 11 .._ •.- •
,- . ',, • - .II-·------~,. ! .. - ...... • i,,,........ u - ---------................ . ··········::.- - -- - ,..~,, ·· ·. ·: ... ; : : , - -. ,, .· . , ------ r ··-----,;- I :• • . •• ... . 'I" • _..,, • . ~. .. ..... ,, . . ..
. . : • : -- • • . . : .· ; \•.:.. ! ; ' : . • .•.•. ···•· :, . . •. ·'" ,. : . . . .. . " ' ' . . ' " • • • • • • • • • • •••• , !. ' ' . ' \ . . ' ' / • . . .. :·. .,. . ,. . . ,, . \ : . / ·. \ \ ····.:.:.:.:.: - ,. .. / . I \ • I ••_.-,, •• :,{ ! •• f •. I : • _ _._. ... • ,, .' • • • J.:: ___ ~_ .... __ ')I' ' ·----
I I , ____ ,
Figure 3.1 (cont.) Atlanta North Corridor, Alternative 1: Improved Bus
w I
.i:,.
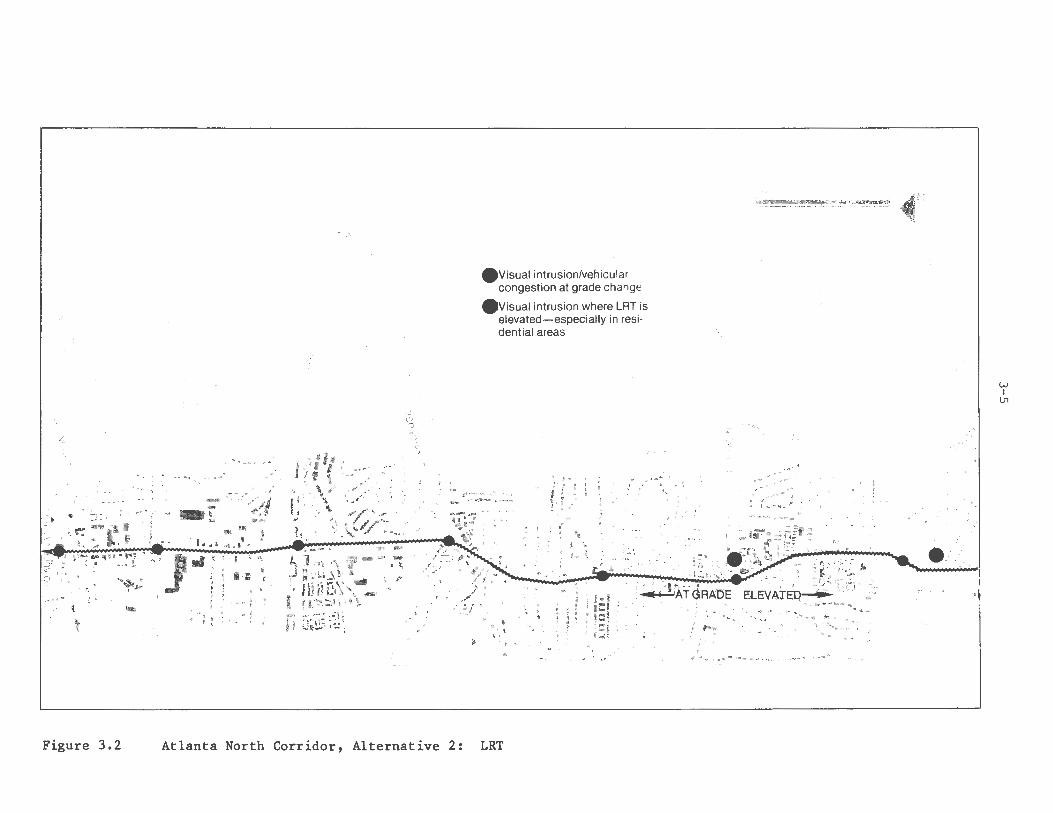
"(,
·~--z. C z. C: ~ ... ; 7
'-· -:e
.. ! __ ..... ,. _.,,,,, ..... .. ----- -·'
, ,.
.{
·,
.Visual intrusion/ve;hicular congestion at grade change
evisual intrusion where LAT is elevated-especially in residential areas
~ ~ C) ~ 0 ~
n
o-,,.., ~ z
6 :? ...... '/ 1 -s ' ~ •. ---:----·. ·. ... . . • ,,, • , , • ,,• • I • ••f' •••• • I, • • ' I _, I I : • .• •• • I 1 • • • r ~ / ,, \ • l 1 > .,, ,. I \ \ ,
~ \0
• • •• , • ' I I I ' I ' • • , • ' • ' ' I .w.... j • • ' • • ,, ' •• , l • • - • • I ' \ t I • •' ♦ t O , , I ' \ ,/// : .: t I .,;._ ,--._•-• t : • ~ ,' : : ! : : : • ♦ t •"- j I • .. . . . : . . \, : ,: . ". , . ~ - - ' : ,• ' '' . .- : . : . ····-···· ___ .. .,, ... ,,. " - .--~-~,,, 1"-' '- ••• '•; • • •--•••·•• • •• ! l ' •* • •
' -··- ' , ,I. I'· \ .,,., .. _ ✓ ,, :l II I •• ' ••• ··-··· - ~. ,,,_,; 'r,I' . _, ... , , • 9 , • i.._ ... -- •• - - !. - , ·, ,, t ,//: __ , ""..._f l : :
;::. tl ,;J - ' • I . : • • I I I /.' .. .. ... • • ! :
I ,; r: -., ... , - • ' J ••· •• - • - - • 11.t..,~.""' r ~ ,• . -,;·,-c::, :, . ~ • ' ' • "' • • • • • • .. ··-: - - - -- ., • " - -- --- .. . • ' , r.~, --z' •
1
·,,,. ·., ••• , .. - ,,_, •"\ 1l"/1~1P •\ // _. ~'/;,,.., ' ....... , '-,•--·~·, .. , -·G· : 'l"<r- . ~~ ,.,, ;A;.~--iiL- - .:
.. , . f 1
, ... ••" ' ... , Ml ■ ,, • • • • ' . . T R.A:uc . OLD'!r.>• .._~ ~,:,,: • .. ,L ~•• ■:• ,.JU.),_.\; #'• ', ..... ,. -:,: 1::i· ...•• , .......... ,~◄-- . • - -- . • . • .• ~,• - • , . . • • I• . . • • ' . : ••• • • • •. ~ :··~ '• ·:: '~. :, : " ·: fll}J ,!,~ ,, ..,, . • ,,,/1,' I : •. ; • : 1 ,=1• ·:: ··,· · .. ! ! .• ,-. f ~ - ... ,, '•,.-~ :- ~- .... ~ .. -.,.,~ .. - •• v ' • , ' , ,,. 1 • • , \ • ,. ~ I 1 ,I I l.. 4 • • • ~ · ... ._ ~ ....... # ~- . ~ .... , , . . . r '• ... -:., '. - . ., . . . : . . . .. .. . : ·, : . , ..... . .. , . ._
. , · \;., \!··•« ~--, ,'! - •, .. lllllc1-::.,;, '• •., ... , ··-·.• .• ,. • •• • ., -c-~!1\i • , •, ·.,_,.,,, .... -.,., •';•- -.i • : ' : '. I , 'I tl,L, ,_' • • • • : . • •• ' ' / ' ----··-· -----·-· . . . .. .. •, .- .,,, ,. -········---( , .. ·:·:·-1•,.···~.•-·-~ ... .. .
-
\
Figure 3.2 Atlanta North Corridor, Alternative 2: LRT
◄N
... . ··· . .. •·
':<,,§?" ~\"-
..... '•• .. .. · . ·_,..-:::/ . . .
I .~
w I
u,
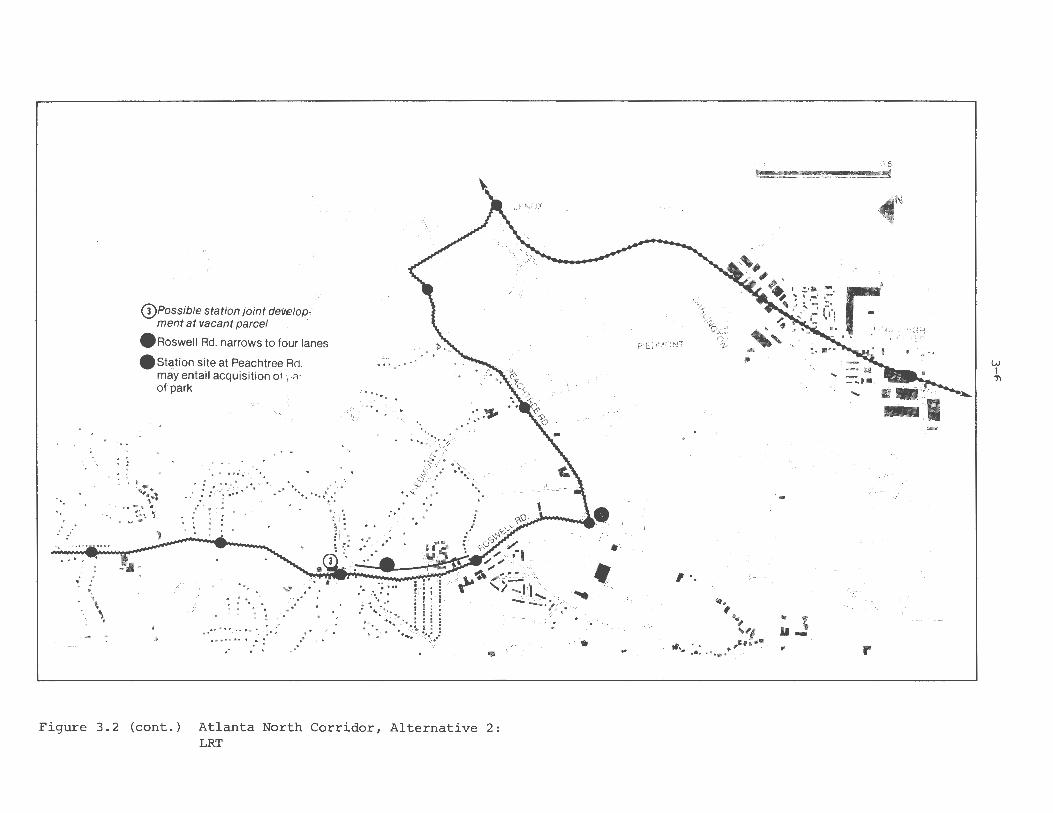
·· .. • ., ..
: .··· ·······••. . . . .
~ :
\ I \
(j)Possible station joint develop/ ment at vacant parcel
/
.Roswell Rd. narrows to four lanes
estation site at Peachtree Rd. may entail acquisition ot ,.;i, otpark
I ' ·~ '~~-i .. -:., ~ ... \ ,. . .. -
•
.. .. ... .,. :~//:.::::., ~- ;·~~.'.•,,:::t
. .
. . . . ..
.. ··:: ::: :: :·,: }; ; .: . . :/. . .· . . /,
..
_/
··~ : ,.• . .:~. :·_:::,~/
• 1-...'.1." r1: .\,_ ~ .. :: .· .-.~
Q. ... ··~ !:!I-' • • • • • Q , • • • .>; . .
LENOX
:\._,
/'
'-;:
.. / .
f/ • ... . ~<v"" , 1 ~ ~-~ 00Cj ,;,
;;.,,, •:• ' • ,,;,·•. j, i\ ... ---\"\ . • . . . .. . . : ,....- ._ \.,. ; ,. ,, " • ..... i: i : ·' I"'" ' '1"- , '\, , ,;.: : .. , .. . , . : -1 I \ .'/ i ♦- •~\"•, i l:: _ , :"--,.',/ ..... "
:;,/'.~::\.U) ~;f: /;· ;'°'•
•
Figure 3.2 (cont.) Atlanta North Corridor, Alternative 2: LRT
..
-
PIEDMONT
om, 05
◄N /,,
-1/'
,,~ ""#;
' ~.-.. -~-0 ~''.I-· "V~ ~ ~ • ·- ·- • -~ t !" I.-, ''¼ . ,I'_ .:. i .... , - .
" O_..,;:; • • ! • - • ~ ~'" • ••. _u, oernoe • "-. • • ■•· CENTER JI • I • • . .
... ....
, • • J . " /
, •..
\ .. ' # '' .. '-., ' ...,,
.•. ···-·· ,,., ... - l, 11-•
,,.-,
r
~
w I
"'
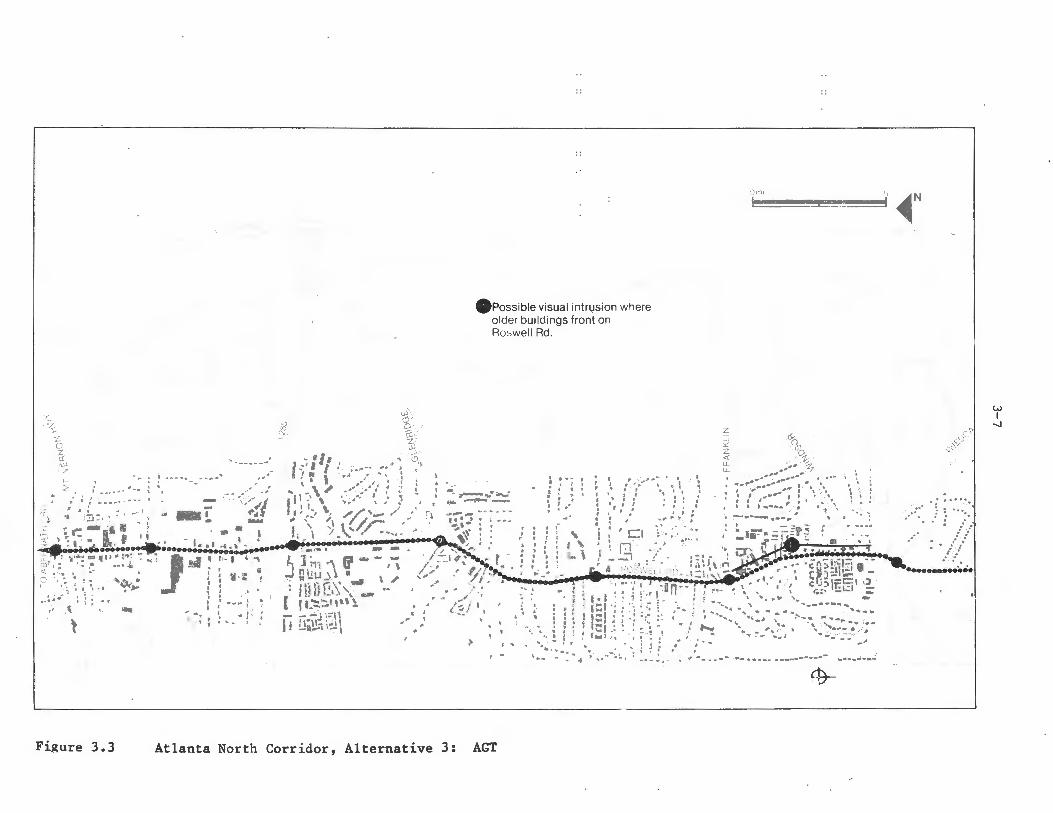
)n'\I
.Possible visual intrusion where older buildings front on Ro::,well Rd .
':_7 ). :}
"' '-2..
;; 'le z )'. .... ----- _ .. ,
;; _, I "I cl,,
- • , f .... ,,.,-'. ~ I:'•' I '~ ..... ~, "', ~ i
• • , I I • •
• ,,, '• ' •' ,', 4 ., I I ----.•-. ·--···- ··•· , . \ \" .•',•,·' ~ . .... -->- • • • : : • -• •• "'p :, ' \.••• ' ,' ;' ,' I - ... •••••• •, ,' ·" ·• ' , ,-ft I I I \ 1/.:,. ,. • r, ••• • • ' • •·· - ... - , ... - ;' - .. ... ..
t ,.,. •.,. .,w I - #_,1 I' ,,,J ~ /.r: /f ~• ,• ,
0
• • •• I _,, , '\ .,. ,, • c:: 1 .;__ .:, ··', .. -- - I ' ) \.'~ -.--- . , ~~:; X • .:.t -• • • • I I \ • ,., ' ,,..► - •, ■ : · • • • •··,, .. •••• - - · ,
1 .t.. ., .. ~ r ~ r : r: I' f " - I « • · - , __ ' - - -- • • •
:;; ' ':. I": •• Ir, ••. .......:.~••••~•.•~ j ] ;., . .-.. f - ' \ /;,,_; .' ~///~ .. ~ . ........ ~J .. 4 .,. • 11 . \ ; 'j' J , • r•,~.:;_ .:, ... .., . • , • • • guu_;., ·.. \ ; ' .• • >-· ro' . : ' • .• ••• .. • l ~ I·: ' · 1· tj Ii~, • ' • .," / ' -, ... ,. •-•-• , .. l!,.i.;,_\_ , '·/• :;> ·,,;_ ' ':,.. ~Joo 1 : ' • r u-:::-.::.1 ,o - : ' <.:: " • / ", : - ' i ,' -• • ; : - - :. J ;;II ,• i
•• • • - , • ' • • • t •,·u- ,.11 ~ ,, .( • : : : , - • , 1
t !..n..-i -1 t > I '
Figure 3.3 Atlanta North Corridor, Alternative 3: AGT
! ! ·: t l '- I 1 'f , ... t , . . I J • .. ~·
' I '.-' ' ' ' ' r ' I ' • ' r
. I ' : : :, . I t I
• • • I .. . -.. '
. I..\ . ' ' .- . . • .
' . :
. •• r ,;,,-' .,. .... • I Jt r , " ,t ., ' • ' 1
' \ f ' ., ' ' '
' t I f • I. f •
! I ' I ► • I '' .. .' . : ; ~· r • : ~ ..... _.., : • ' . 'Cl
.. .. I • ' 1 ·•-'
'. l Q~~ . , ...... .. -..::,
I • I ;
z ...J L z <( I u.
'
°c) '-'" ~ ':'., ___ ... , -~7
... .,, ... # ... ,. .... -'"""" * ~ ; ... • • .,. .......... ,,,,., :· \>" ♦\ 1 I ,,,.•r"" t ) t • t II I , I •" ~
\ \ ' .
• ' • ---.. : 1 ' f - ............... --
... ";
;
. ., -... "" . • '.. • vnw -c , • • ' ,' 1 c .,:,,h:1-=---11 ,!_ ' .. \ r.:,, - - ..
\. '• -- , .. . . • '. l • ... ... . : } • .. ., ',
-,. I l' ~ ! t
... , .. .... . I •=I: l l::1 .: , fw:. ,, . ~.,= ·'
.. ! l:
,;.. .. ; . ::"'•• .. , '\ ....... -·--·--- ... ._,.,. -,. ' .. ,.,, '" .. ,.> \ .... _. ~ ......... ... It I ...... ., , , .. \ '\, .... .,,. .. I ; ... ~ .... -........... , .... _ . .. . ~ . -. \' , ......
\ .... - - .. , .... _ ... - .... .," ~· ~ ... , --
t ., ...................................... ... .. -·-----..
$-
r ◄N
... .. . · . .. ··
0' .,,<c,,0
-,.,
.....
w I
-..J
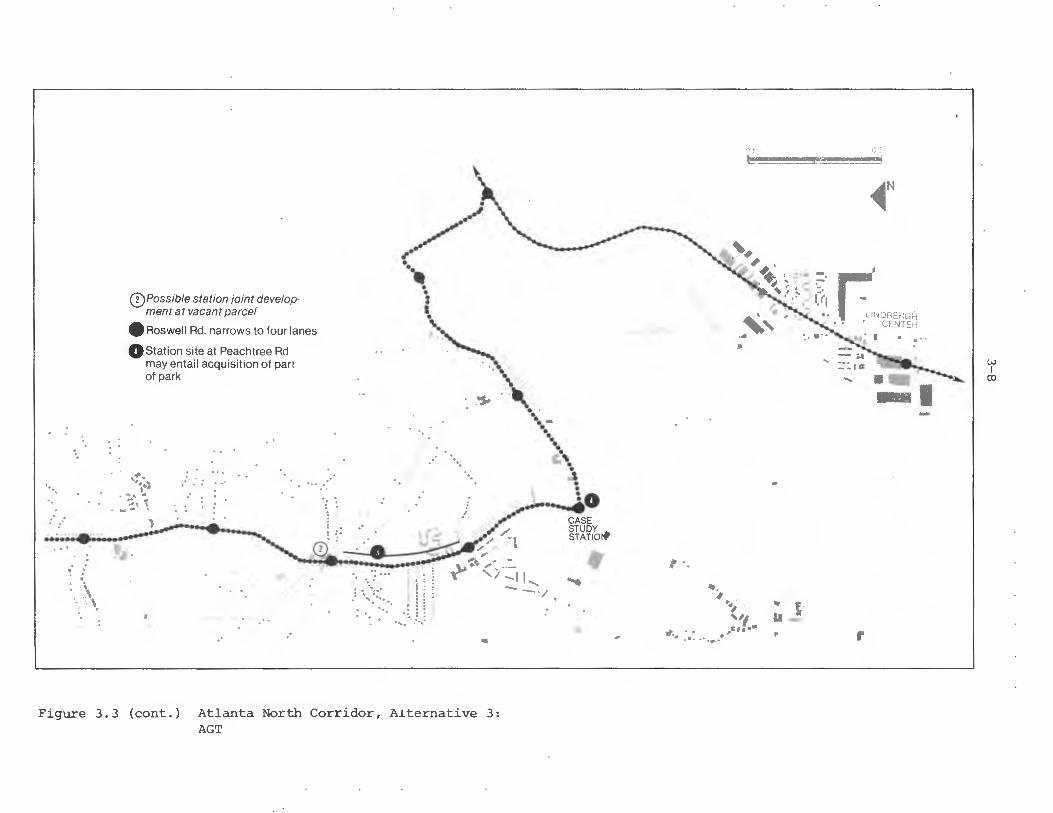
' ...
. . '\
I \
(j)Possible station joint development at vacant parcel
• Roswell Rd. narrows to four lanes
Ostation site at Peachtree Rd may entail acquisition of part of park
• ',flt._. ';~l
. -:,., ~ ... ~' 1_
....
•••••a
. ... ·
~
.,,. .. .; , ....... ....
• • a I • ,._
~ . . .. \
:· ... ~ ..... ·· .. -
··• .•. c:, ... ,•
•-:::" ♦
,.,,i: .. ••
.... . . ..... ..
•
Figure 3.3 (cont.) Atlanta North Corridor, Alternative 3: AGT
•
V'""f,.;
, ·.
'i
••
~# , ,,, ' ~ ~ :.•• -~ , ' .. -· :--· .... ' t. - -j
;-.:. ' .. ,-' (1'1 ' ,. ~ ,, ,,_ ..
JI
....
~ . ., "' l ''I . &,,. LI -
"'•4 ... ..... ·-·
◄N
8
....
r
. .
I " w I
(X)
3-9
at the southern boundary of the corridor. These routes would operate with some express service, each at four minute headways. Five additional routes on parallel streets in the corriaors would operate local service to the rail stations at twenty minute headways. No major capital investment is proposed in this alternative. Some limited priority treatment at key intersections is assumed. Average speeds are assumed to be 16 mph for express buses (including the local portion of the route) and 12 mph for local routes. These are slightly slower than current speeds in the corridor, which are 19 mph and 16 mph respectively. Added development by 1990 and increased route loadings are assumed to decrease travel speeds in the area.l
The LRT alternative alignment is shown in Figure 3.2. Connecting with the rail line at Lenox, it serves the three activity centers of Lenox Square, Tower Place, and Buckhead before turning north on Roswell Road to serve the remainder of the corridor. The system is elevated in the southern half of the corridor and optionally elevated or at-grade in the northern half where more right-of-way is available. There is a travel time/cost tradeoff in making this choice, as outlined later. Four minute headways are operated. The average speed on the elevated section is 27 mph, the same as AGT, while in the at-grade section it is 20 mph, allowing for grade crossing delays.
The AGT alternative is shown in Figure 3.3. It consists of the same alignment as the LRT line, and an optional second leg in the southern part of the corridor. As discussed in the following section, this optional line does not appear to be cost effective. The system is entirely elevated; it operates on two minute headways with an average speed of 27 mph. A summary of all the system alternatives is shown in Table 3.1.
The original AGT alternative provided circulation in the activity centers and rail station area along multiple routes covering high density areas. Based on the demand analysis and discussions with local representatives, the AGT alternative was modified to eliminate the Piedmont Road segment. Thus, the Buckhead area is served directly along Roswell and Peachtree and linked to the proposed Lenox Square MARTA station.
lLocal planners commented that our assumptions for improved service, which project speeds lower than current speeds, are very conservative. This is probably true, which means that bus performance is understated. In most urban corridors, however, these bus speeds would be realistic.
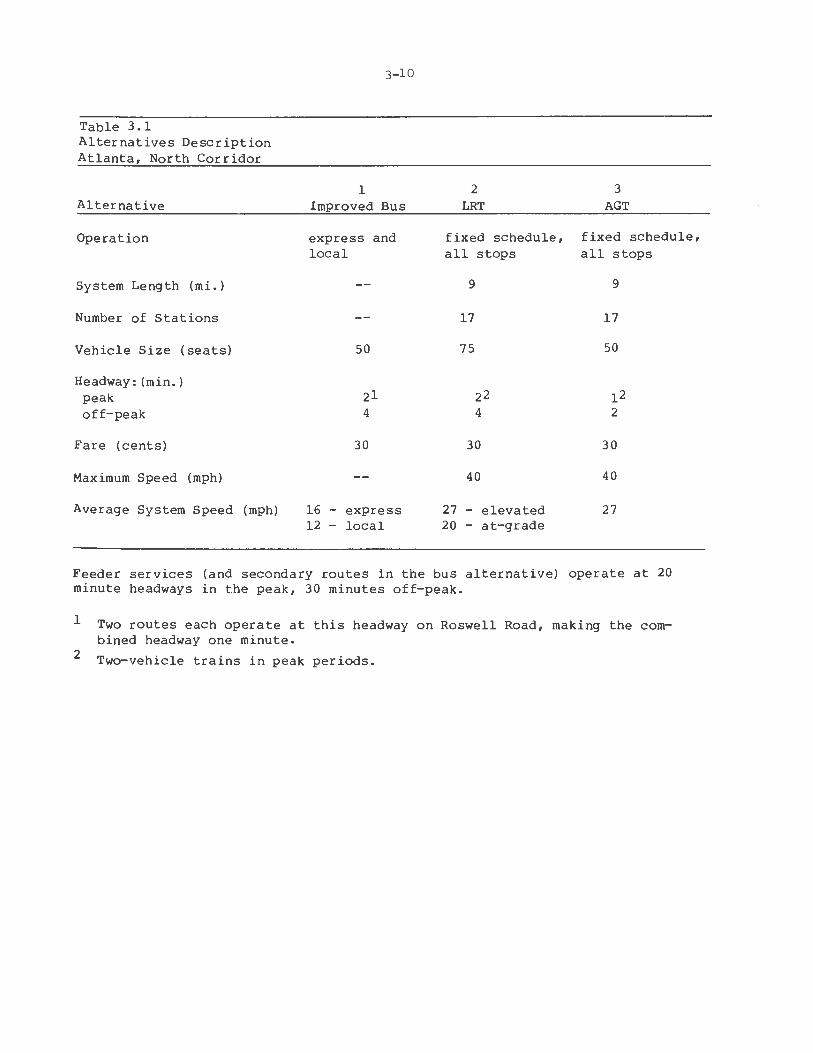
Table 3.1 Alternatives Description Atlanta, North Corridor
Alternative
Operation
System Length (mi.)
Number of Stations
Vehicle Size (seats)
Headway: (min.) peak off-peak
Fare (cents)
Maximum Speed (mph)
Average System Speed (mph)
3-10
l Improved Bus
express and local
50
30
16 - express 12 - local
2 LRT
fixed schedule, all stops
9
17
75
22 4
30
40
27 - elevated 20 - at-grade
3
AGT
fixed schedule, all stops
9
17
50
12 2
30
40
27
Feeder services (and secondary routes in the bus alternative) operate at 20 minute headways in the peak, 30 minutes off-peak.
1
2
Two routes each operate at this headway on Roswell Road, making the combined headway one minute.
Two-vehicle trains in peak periods.

3.1.3 DEMAND AND COST ISSUES
3.1.4 COMMUNITY AND URBAN DESIGN IMPACT ISSUES
3-11
The second link to MARTA at Lindberg Center and the loop around Buckhead provided by Piedmont Road were eliminated.
Table 3.2 shows the predicted modal volumes using the sketch planning technique described in Appendix A and local Atlanta mode choice models and trip tables. The bulk of the ridership increase from the status quo to the target year of 1990 is due to the construction of the rail system to the CBD and the rest of the region. All of the modes in the corridor are used primarily as feeders to the rail line; half the corridor's transit ridership is trips bound for the CBD. The level of service differences between the modes consist of several minutes difference in travel time (there is a maximum difference of 15 minutes between bus and AGT for the longest corridor trip) and smaller differences in wait time (half versus one minute). Thus, the resulting variations in demand are somewhat limitea.
Table 3.3 shows the revenues and costs of the alternatives. The AGT system is projected to have lower capital and operating costs than a light rail system, but its total annual costs are still significantly higher than a bus system.
The bus alternative would have the least effect on the corridor's physical and community character. This alternative would involve no construction disruption, no permanent physical barriers, no displacement of business or residents, slightly improved accessibility, no visual intrusion, minimal effect on development potentials, and advantages for passenger personal security.
The LRT alternative, which includes both at-grade and elevated segments, would have disruptive impacts on the community because of both the permanent at-grade track interference with residential drives and commercial frontages, the possible right-of-way widenings, and the permanent guideway of the elevated segments. Visual intrusion would be a severe problem along elevated segments, although opportunities for joint development could lessen these impacts. Traffic congestion along the grade level segments of the LRT system would be a much more significant problem than for the elevated AGT system, and probably even more than the bus.
The AGT alternative would also have some negative inrpacts on the corridor's physical and community character. Construction of AGT guideway, as well as grade level track and roadbed for a LRT system, would have

Table 3.2 Weekday Transit Ridership Atlanta, North Corridor
Alternative 2 Status Quo
Daily Ridership: Peakl Total 15,000
Annual Ridership: 4,500,000
Transit Mode Share: CBD Non-CBD
Access Used to Transit Walk Feeder Auto
Peak Period Load Factor (passengers/seats)
3-12
1 Improved Bus
9,000 23,000
7,000,000
25 4
33 39 28
1.00
1
2 Peak periods are 7-9 a.m. and 4-6 p.m.
1977; all other systems' ridership in 1990.
2 3 LRT AGT
11,000 12,000 28,000 30,000
8,500,000 9,000,000
31 33 5 6
33 33 36 36 31 31
1.10 • 90
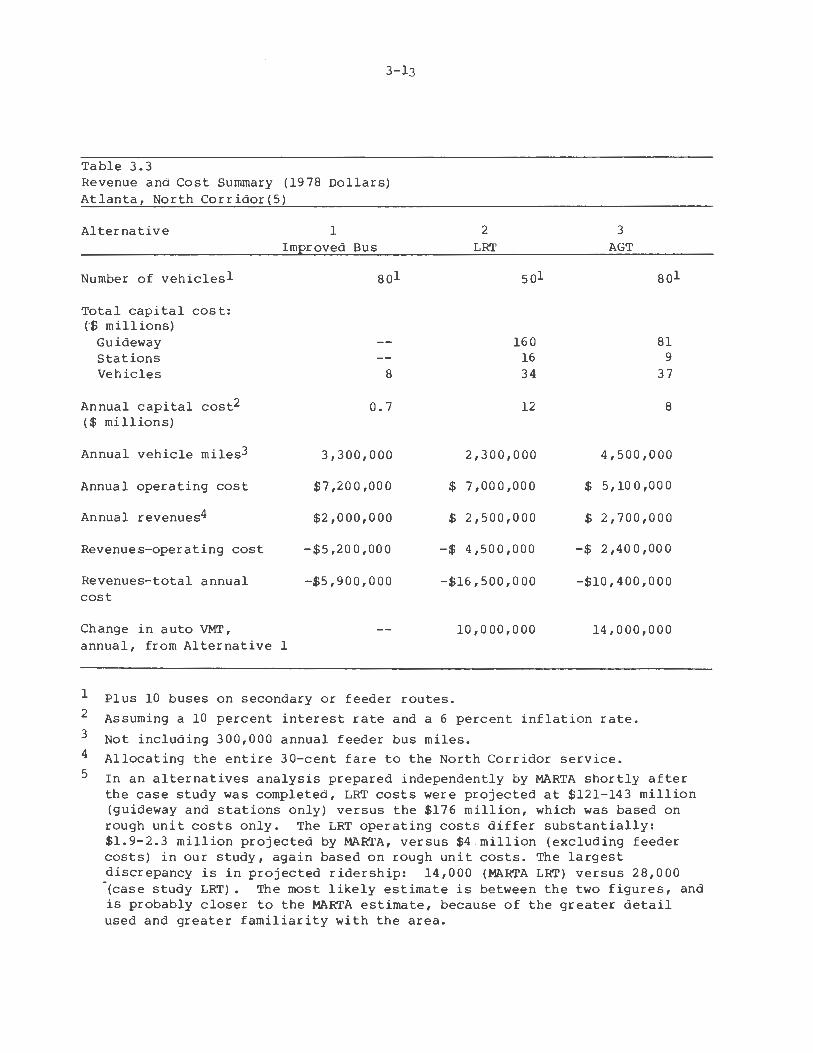
3-13
Table 3.3 Revenue and Cost Summary (1978 Dollars) Atlanta, North Corridor(S)
Alternative
Number of vehiclesl
Total capital cost: c-s millions)
Guideway Stations Vehicles
Annual capital cost2 ( $ millions)
Annual vehicle miles3
Annual operating cost
Annual revenues4
Revenues-operating cost
Revenues-total annual cost
1 Improved Bus
sol
8
0.7
3,300,000
$7,200,000
$2,000,000
-$5,200,000
-$5,900,000
Change in auto VMT, annual, from Alternative l
$
$
-$
2
LRT
sol
160 16 34
12
2,300,000
7,000,000
2,500,000
4,500,000
-$16,500,000
10,000,000
Plus 10 buses on secondary or feeder routes.
$
$
-$
3
AGT
sol
81 9
37
8
4,500,000
5,100,000
2,700,000
2,400,000
-$10,400,000
14,000,000
1
2
3
4
5
Assuming a 10 percent interest rate and a 6 percent inflation rate.
Not including 300,000 annual feeder bus miles. Allocating the entire 30-cent fare to the North Corridor service.
In an alternatives analysis prepared independently by MARTA shortly after the case study was completed, LRT costs were projected at $121-143 million (guideway and stations only) versus the $176 million, which was based on rough unit costs only. The LRT operating costs differ substantially: $1.9-2.3 million projected by MARTA, versus $4 million (excluding feeder costs) in our study, again based on rough unit costs. The largest discrepancy is in projected ridership: 14,000 (W>.RTA LRT) versus 28,000 ·cease study LRT). The most likely estimate is between the two figures, and is probably closer to the MARTA estimate, because of the greater detail used and greater familiarity with the area.

3-14
significant disruptive effects. Construction for elevated LRT and AGT requires foundation work and pile driving, with possibly greater disruption for LRT guideway construction because of the greater mass and smaller spacing of support systems. AGT guideway construction also can be expedited by prefabrication. Construction of LRT track and roadbed at-grade requires extensive grading, paving, trackwork and possibly road widening. The precise difference in construction time and intensity of development between AGT and LRT would depend on local conditions and the system types being considered. In general, the construction required for AGT or elevated LRT means both temporary and permanent physical barriers; temporary and permanent displacement for construction in station areas; and more visual intrusions from the guideway and stations relative to bus. With the elevated LRI' and AGT, joint development would help to mitigate the visual intrusion impacts. Personal security would be more of a problem with AGT because of its unmanned and elevated character than with the at-grade segments of the LRI' system and the bus. However, the suburban character of most of the corridor and comments from local planners suggest that personal security would not be a major problem for any alternative.
All of the alternatives would increase accessibility, with LRT and AGT providing the most efficient service. The guideways for LRI' and AGT would not affect pedestrian accessibility, except at certain stations located in the center of the road where proper signalling would be required. The five lanes of Roswell Road are already a barrier to pedestrian access both north-south and east-west.
The disruptive impacts of an AGT system on the community around Roswell Road would not be as great as in some other suburban or urban sites because the corridor is quite broad. The road is already a major physical barrier and psychological divider for autos and pedestrians moving east-west, and for pedestrians moving north-south. An elevated structure in the road right-of-way would not divide the corridor significantly more, and in fact could help to improve the limited pedestrian amenities along the north-south corridor. However, construction disruption would be concentrated on the major north-south route, making it difficult to reroute traffic and creating hazards for residents in the area. The temporary disruption might also eliminate marginal businesses along the corridor,

3-15
although wide setbacks make it unlikely that any businesses or residences would be permanently displaced for the guideway or stations.
The restriction of left turns on Roswell Road due to an elevated AGT could pose some problems. Also, a Georgia DOT requirement that eight feet of clearance be provided between a column and the edge of the nearest traffic lane would require additional right-ofway, especially at stations, which will generally be in the most developed areas.
The AGT system would cause several types of visual intrusion. The stations would be the most significant cause of visual intrusion particularly near residential intersections. The small scale of the residential and commercial structures along most of the north corridor would contrast sharply with the elevated guideway and stations. However, the mature landscaping along the corridor could provide some visual cover to the guideway and the stations. Some phone lines and aerial utilities could be integrated into the guideway, although no high tension lines could be integrated due to their need for 30'-35' clearance in all directions. Local transportation planners evaluated the guideway as unattractive when comparing its permanent structure to the at-grade LRT or bus. They also predicted that local acceptance and support could be polarized between the residents who would be against the guide~ay and the businessmen who would support any form of capital improvement, including a guideway. However, it may be equally likely residents would support the system and businessmen oppose it if it were considered a substitute for a busway or expressway. Businessmen along the AGT or LRT line might well oppose the system because of traffic impacts.
New development already is occuring in the triangular area formed by Piedmont Road, Roswell Road and Peachtree Street. Potential for more new development in connection with an AGT system might develop north of Piedmont Road along Roswell Road at AGT station locations, particularly near Sandy Springs and I-285.
According to local planners, personal security would not be a major concern along this corridor,l in contrast to some of the downtown locations of MARTA where security is a problem. The new MARTA system
1Local planners are not unanimous on this point, however. Some feel it is a serious concern, and that a significant security force would be required.
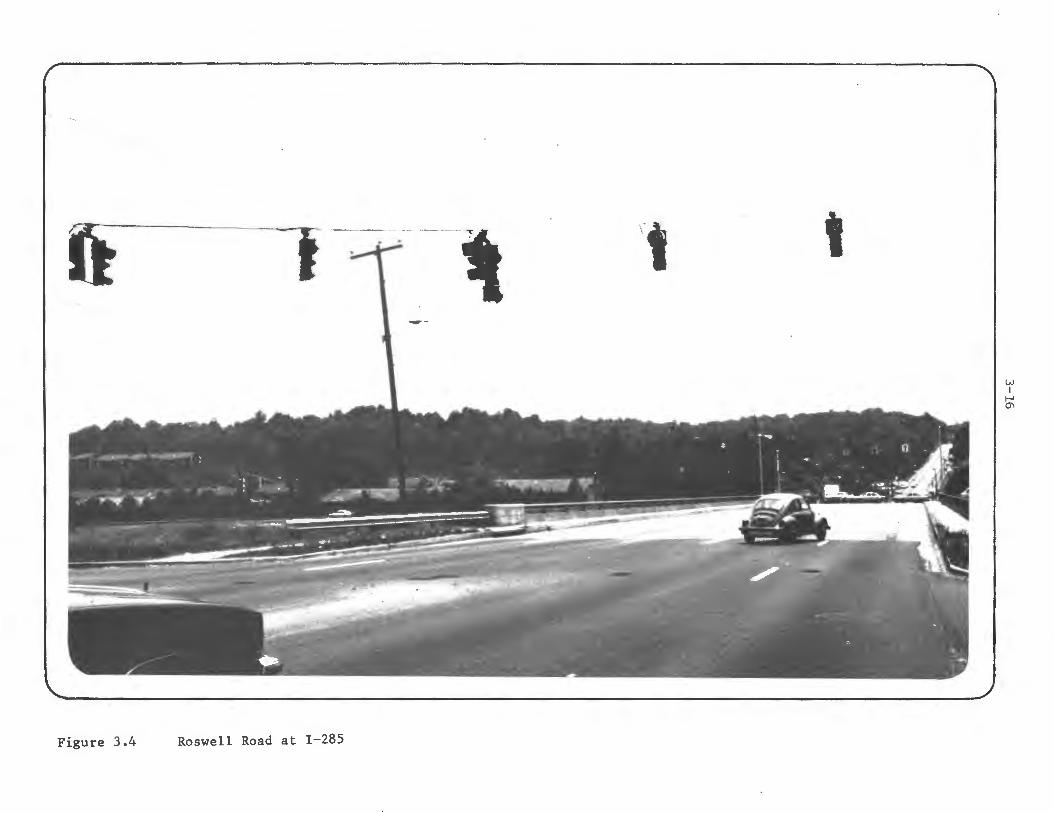
it t
Figure 3.4 Roswell Road at I-285
-\ ---
w I
r-' O'I
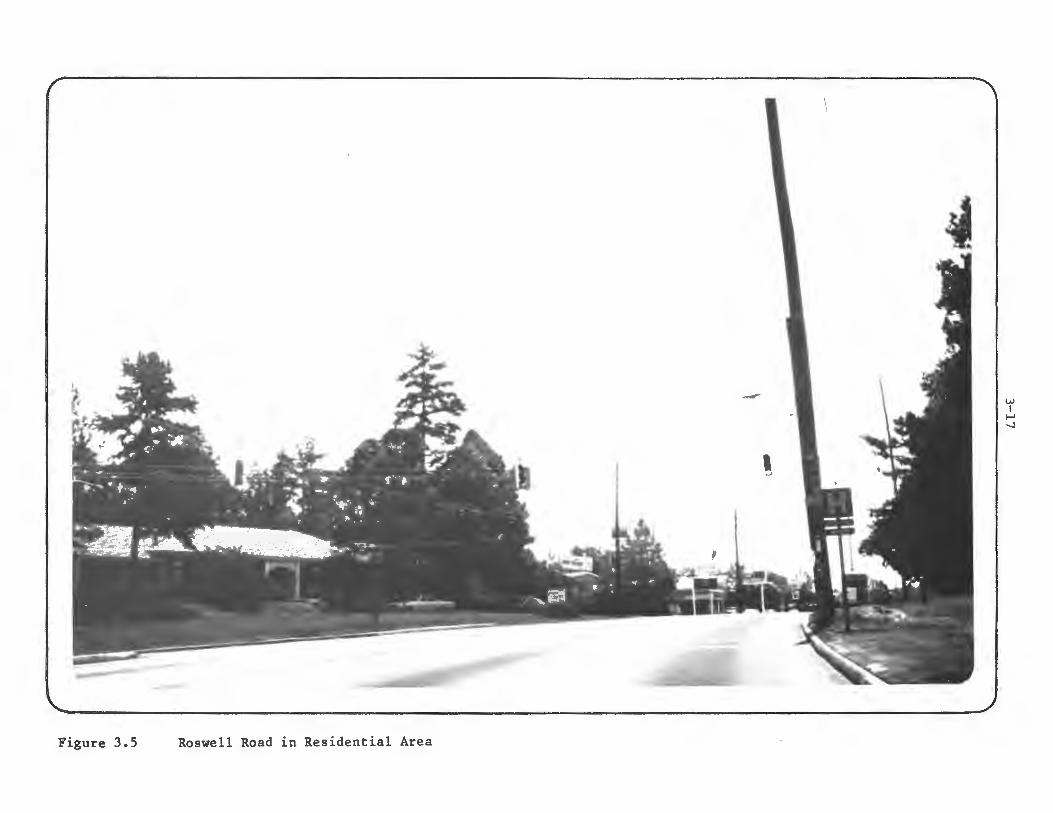
Figure 3.5 Roswell Road in Residential Area
~
w I
I-' -..J
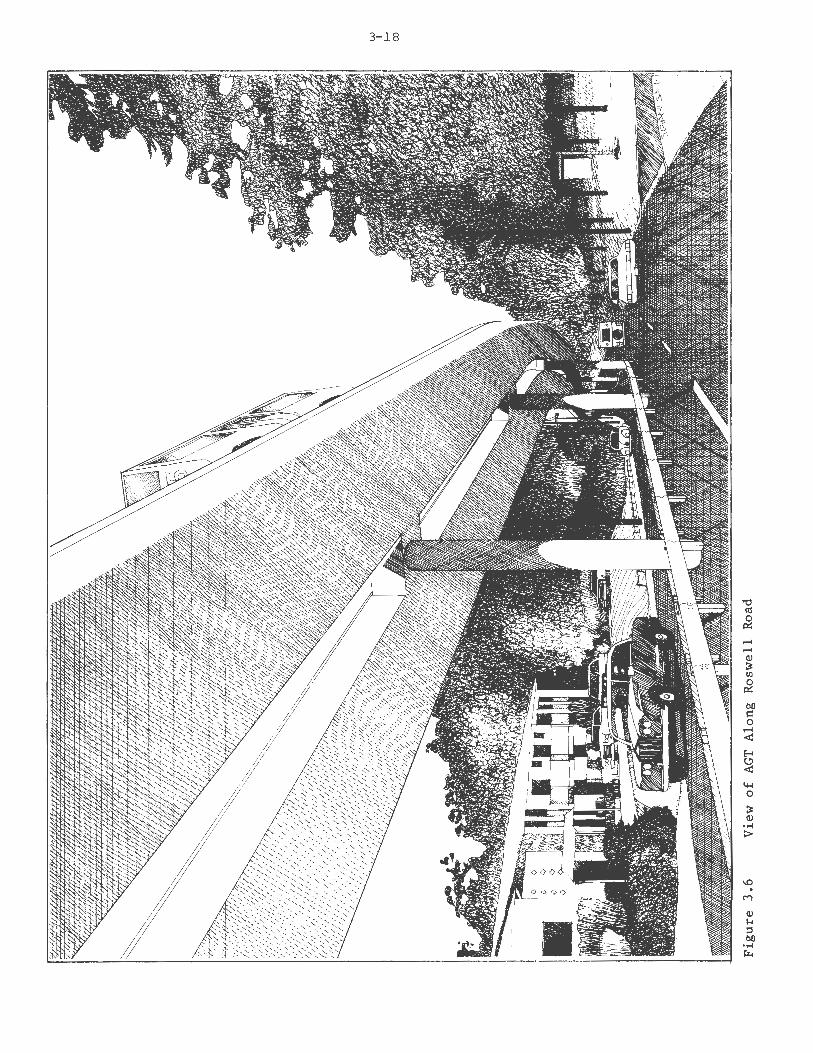
3-18
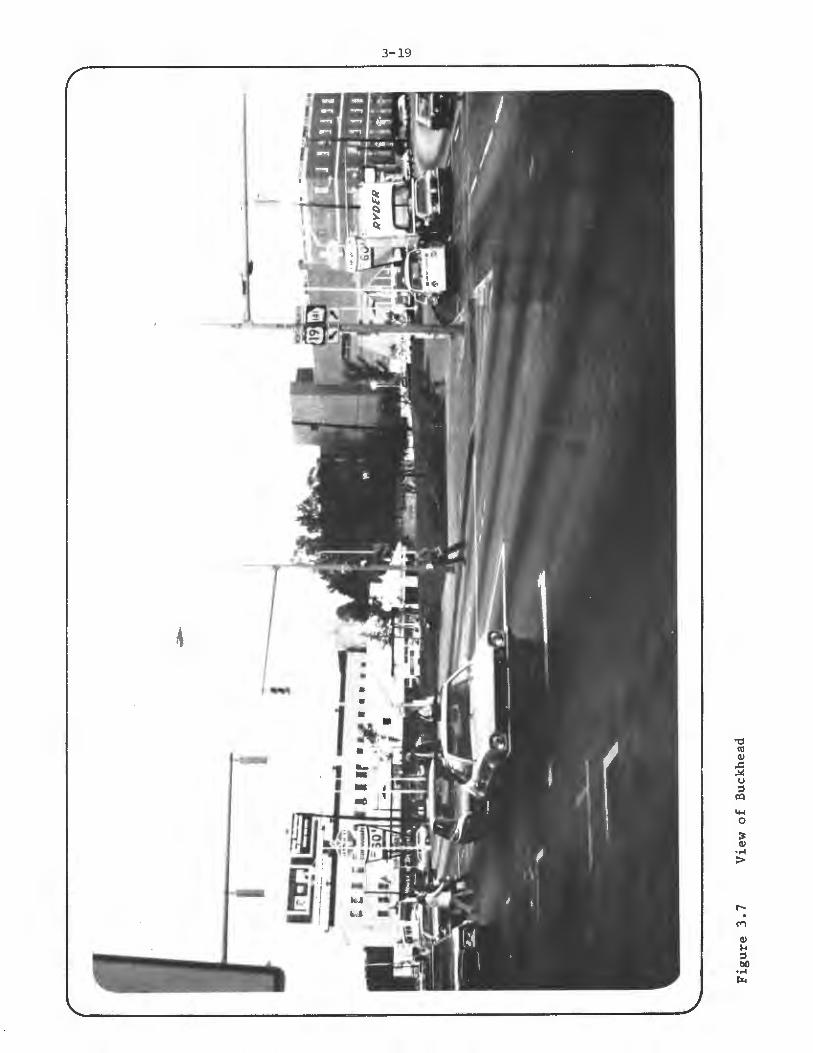
3-19
,-... .
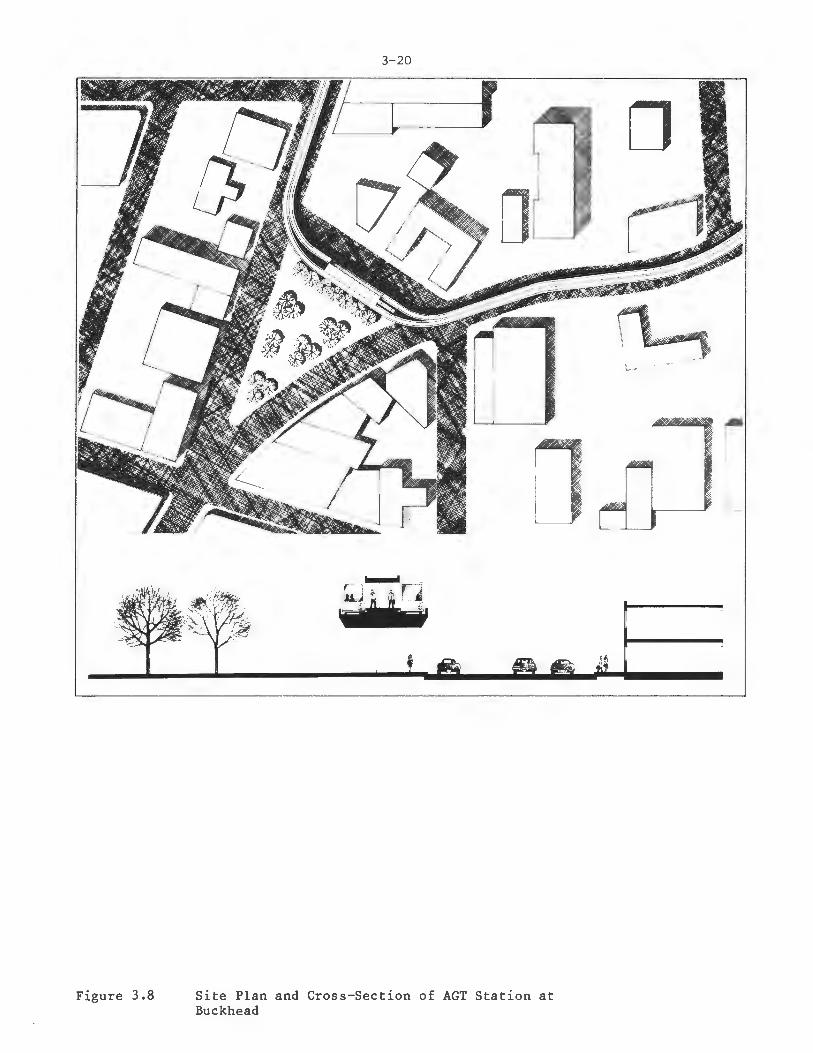
Figure 3.8 Site Plan and Buckhead
3-20
l r
of AGT Station at Cross-Section
□
r I
I
L
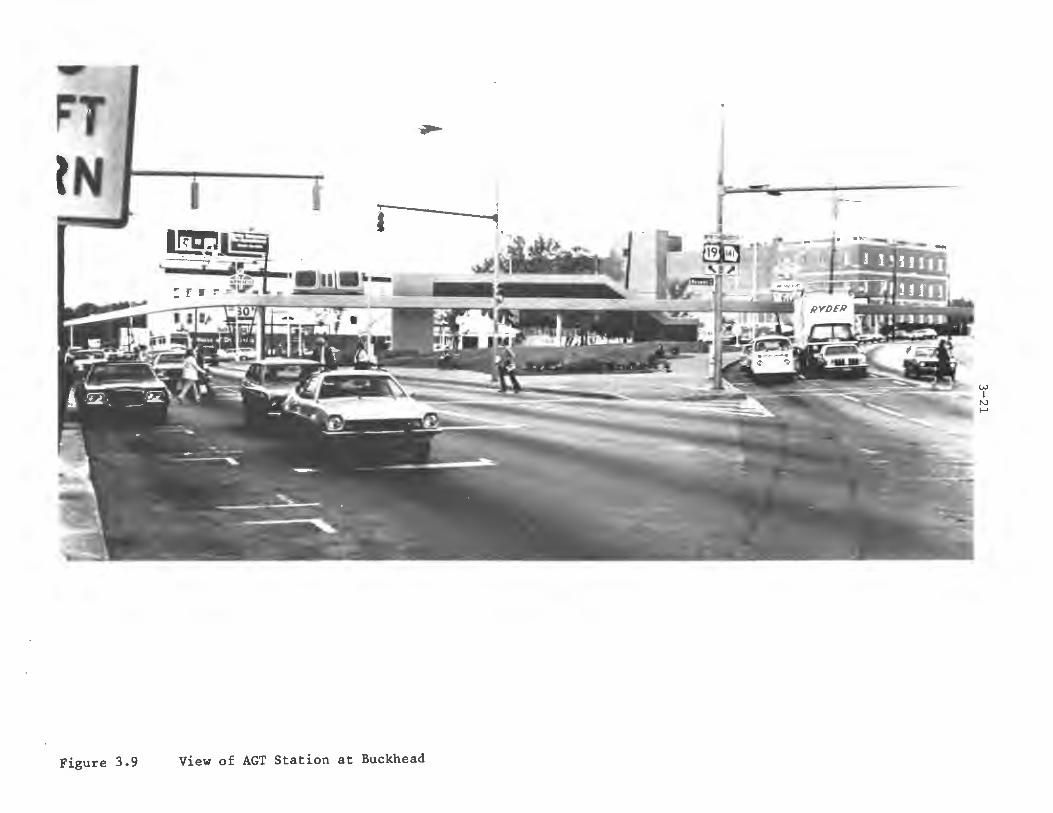
,.,,,...
Figure 3.9 View of AGT Station at Buckhead

3.1.5 INSTITUTIONAL ISSUES
3-22
will have unattended stations, thus paving the way for community acceptance of AGT's unmanned vehicles.
In conclusion, the AGT alternative may cause only limited physical disruption in this corridor. However, the residential community may have strong objections to a permanent guideway. These objections will likely be concerned with visual intrusion, even though the existing corridor nature of the alignment, the mature landscaping, and the guideway design make visual intrusion less dramatic than in other similar medium density suburban areas.
3.1.5.1 Setting
The Atlanta Regional Commission (ARC), created in 1971, is the official planning agency for almost all state and federal programs carried out in the seven county area, including continuing, cooperative, and comprehensive transportation planning. ARC is the single agency through which consensus is developed among the Atlanta Region's local governments regarding regional or multi-jurisdictional policy matters. The Commission consists of 31 members--16 elected public officials from counties and cities and 15 citizens-each of whom has an equal voice in decisions. Georgia DOT and MARTA (see below) are not represented on the Commission itself but participate in technical and policy aspects of the planning process through membership on ARC subcommittees.
The Metropolitan Atlanta Rapid Transit Authority (MARTA) is the major provider of public transportation service in the region. MARTA currently operates bus service in Fulton and DeKalb Counties and is constructing the first segments of a regional rail transit system. MARTA also operates park/ride lots for transit patrons in outlying areas and is responsible for transit service improvements and patron conveniences such as bus shelters. MARTA is a key participant in the planning, evaluation and implementation of transit measures.
The Georgia Department of Transportation (GDOT) is responsible for the construction, operation, improvement, and maintenance of highways throughout the state. GDOT also works with local jurisdictions to program and fund local projects supported by Federal or state dollars. GDOT and several local governments monitor traffic volumes on major highway facilities through regular traffic counting programs. These

3-2 3
data, and information on highway project implementation, are reflected in the Atlanta Region's transportation planning process and models, which can be used to forecast travel patterns and conditions. As the implementing agency for most major highway capital and operations improvements, GDOT will play an important role in the development, selection and implementation of transportation projects.
Local governments have responsibilities for the planning and implementation of a variety of projects such as traffic signalization, intersection improvements, parking policies, and pedestrian facilities. They will participate both through ARC and individually in the planning, evaluation and implementation of projects in their jurisdictions. A task force of traffic engineers from local governments is being established to work through ARC in identifying 2nd coordinating traffic improvement projects. The local jurisdictions involved in the North Corridor are the City of Atlanta for the southern section, and Fulton County.
3.1.5.2 Key Issues
A transit link for the North Corridor was under consideration by MARTA at a sketch planning level simultaneously with the performance of this case study. There is considerable interest in this corridor because it was originally to be served by a busway in the median of Georgia Route 400, which has been delayed in construction and may very possibly not be built at all. Thus, a substitute alignment and perhaps technology was considered. When one is adopted (through a full alternatives analysis process) it will presumably become a portion of the core MARTA system.l It would thus be considered for funding by UMI'A after the North rail line reaches Lenox Station, which will not occur for several years. The North Line is currently under construction to North Avenue (just north of the CBD) and is under design to Arts Center Station (one mile further north); the next segment, Arts Center to Lenox, is not yet in final design although some preliminary design is being done.
Several reactions were relevant to the AGT alternative. Several officials observed that there was relatively little difference in the performance of AGT and
lThe analysis, completed by MARTA (as part of the Atlanta Regional Transportation Planning Program) after completion of this case study,recornrnends an independent busway in the parkway corridor rather than LRT on Roswell Road, in spite of potential right-of-way difficulties.
3-2.4
LRT, and less difference than expected between the guideway modes and bus. This is due to a large number of North Corridor trips being destined for the CBD; all these trips use the rail line for much of their length, and its high level of service tends to equalize the overall service level provided through the North Corridor modes. AGT's performance was not regarded as sufficiently better than alternative modes to be an incentive to take the risk of using the new technology.
There were some doubts expressed that AGT's capital costs in the corridor would be as low as estimated in this study; several local participants felt that AGT and LRT capital costs would be very similar.!
The relatively good speeds of the existing bus service, 16 to 19 mph, also make it difficult for a guideway mode, either rail or AGT, to attract a substantially greater ridership than bus.
AGT's operating cost was the lowest of all the modes studied, but the uncertainty over its achievability diminishes its influence in the overall decision process. AGT's performance level was felt to be adequate, though not very different from LRT.
Visual and noise issues may be very important in some parts of the corridor, particularly in the denser parts near Buckhead and Lenox. There has been some local opposition to routing buses on Weluca Road in this area to bypass congestion on Roswell and Piedmont Roads; this may be an indication of opposition in similar nearby areas to a transit guideway and particularly to transit stations in these residential areas. While AGT's guideway size and noise levels are likely to be more acceptable than LRT's, they may not be acceptable to the neighborhood. Some severe alignment problems exist for all alternatives in portions of the area, which may not be easily resolved.
Economic development is not expected to be a major objective of .a North Corridor system except in a few areas. Some joint development should be possible with either LRI' or AGT. Safety and security issues are not expected to pose serious problems in this corridor, either.
lThe study's cost methodology, using unit costs for the different modes drawn from various sources, was not able to really address this question.
3 .1. 6 SUMMARY
3-25
The institutional arrangements in this corridor would be the same as those for the remainder of the MARTA system. MARTA, ARC, and GDOT have established a coordinated approach to transportation planning that would be used in this corridor with few problems. Extensive coordination would be required between the City of Atlanta and suburban Fulton County.
Labor protection issues may not be serious for an AGT system in view of MARTA'S steady expansion of transit service and the present employees operating buses in the corridor could probably be absorbed into feeder service and other expansions.
The participants in this corridor case study appear to have a "wait-and-see" attitude toward AGT. AGT would have to be shown to be clearly superior to other modes at least in the cost aspect to warrant serious consideration. The regional priority is to complete the core rail system, after which this corridor may well be considered for guideway transit if funding is available.
3.2 SOUTHEAST CORRIDOR
3.2.1 SITE CHARACTERISTICS
3-26
The Southeast Corridor is a medium density suburban area with single family, apartment and retail uses. It is one of the most densely populated corridors in the Atlanta region, generating a high volume of trips. The corridor focuses on Decatur, a community directly east of Atlanta, and potential transit alignments follow Candler Road and Columbia Drive. Although development is less dense than in the North Corridor, there are two major shopping centers--at the intersections of Columbia Drive and Memorial Drive and at I-20, as well as a number of large apartment complexes along Columbia Drive. Preliminary analysis indicated that Columbia Drive is the most appropriate alignment for major transit improvements in the area, since Candler Road is lower density and more residential in character. Columbia Drive is a predominately four lane commercial arterial with wide setbacks from Memorial Drive to I-20. From Memorial Drive to Decatur, Columbia Road narrows to a two lane arterial, largely residential in character.
The Southeast Corridor, like the North Corridor, is a typical medium density, partially developed suburban residential and commercial corridor. The Southeast Corridor will soon have access to the MARI'A station under construction in Decatur, unlike the north corridor where the Lenox Square station is not scheduled for completion until the late 1980's. The MARTA station and rail right-of-way are below grade in Decatur because local residents strongly objected to construction of an elevated guideway or station in their downtown area or through residential neighborhoods. Since an elevated AGT system is likely to encounter the same strong oppositions, the AGT Columbia Road alignment is below grade.
The Southeast Corridor has a significantly lower enr ployment density than the North Corridor. Like the older Buckhead area, the city of Decatur has increased employment only slightly from 1970 to 1975. The study of Atlanta's regional employment trends, which highlighted Buckhead and Sandy Springs in the North Corridor, does not show any portion of the Southeast Corridor, including Decatur, as a major employment activity center in 1975. The two shopping centers are the focus of commercial activity; strip development is much more limited in scope than in the North Corridor. General economic growth has been slow in the area, despite efforts by DeKalb County to encourage business and industry.
3.2.2 ALTERNATIVES DESCRIPTION
3.2.3 DEMAND AND COST ISSUES
3-27
Significant visual features along the Columbia Drive alignment in the Southeast Corridor are similar to those in the North Corridor, with mature tree growth, heavy vegetation, and wide setbacks, particularly north of Memorial Drive. Other important visual features are the two shopping centers and the grade separated interchange at I-20. No significant open space exists along the corridor except for large lot residential areas and a few vacant parcels.
The existing transit network consists of a bus system as shown in the next section, Alternatives Description. The East Line of MARTA opened to the Decatur Station and beyond to Avondale in July, 1979.
The same three basic alternatives are studied as in the North Corridor--bus, LRT and AGT. The systems are shown in Figures 3.10 through 3.12. Table 3.4 describes their major characteristics. Each of the systems follows Columbia Drive south from Decatur, a regional center served by the MARTA rail system. The AGT and LRT systems immediately enter a subway section for approximately 2.5 miles and then operate elevated for the remaining 3 miles of the line. There are 10 stations on the line, which ends at I-20 where a large park-ride lot could be located. The AGT system operates at one minute headways while the LRT operates at two minute headways in the peak, each with two-car trains. The bus service operates two routes on the spine of the corridor, each at two minute headways. This service is assumed to replace much of the existing transit service in the area, which is oriented east-west. Four secondary or feeder bus routes would also operate at 20 minute headways between corridor points and Decatur.
Table 3.5 shows the ridership estimates for the three alternative modes in the corridor. The ridership levels are only slightly lower than those of the North Corridor. While the spine of the North Corridor is higher density than the spine of the Southeast Corridor, the overall density of the Southeast area is higher. A much larger fraction of Southeast riders use feeder (57%) than North riders (about 35%), and relatively few use park-ride or kiss-ride. LRT and AGT service levels differ only by one-half minute of wait time, and thus their ridership levels are equal. The bus travel time for a long corridor trip can be up to 18 minutes longer than a LRT or AGT trip; thus its ridership is significantly lower.
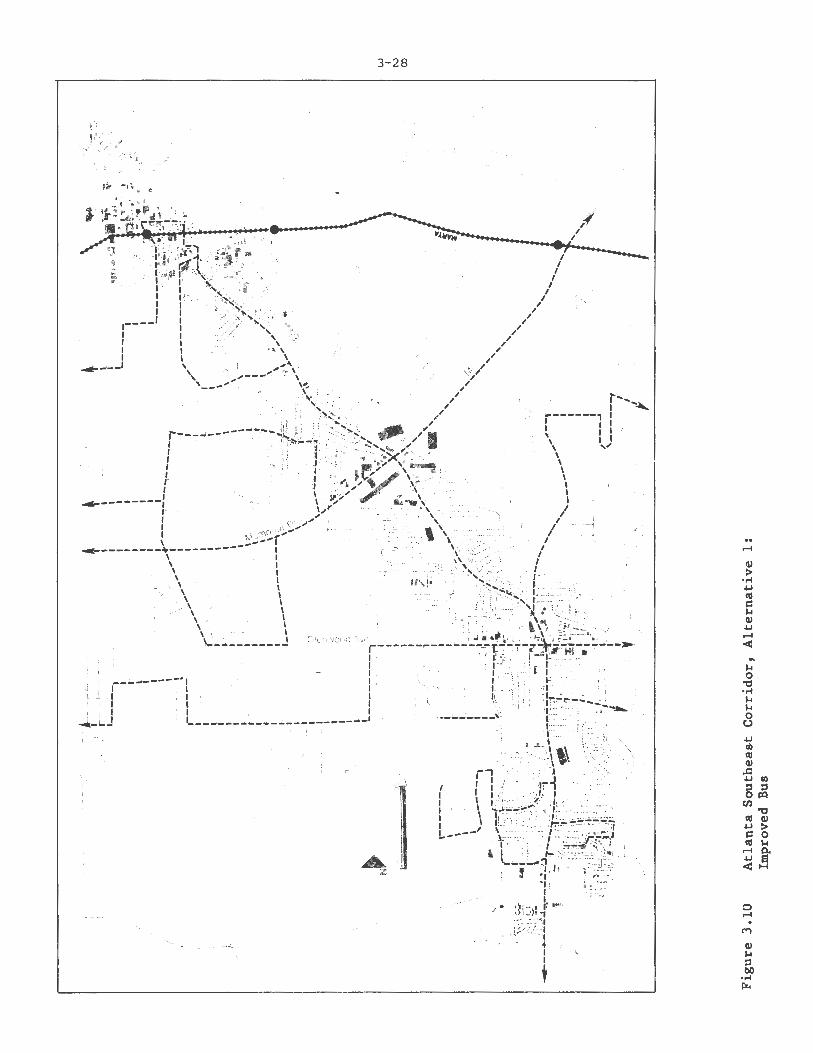
3-28
, I 'J
' ' 1
--.
I
'-I
L
.. ..... QI >
•.-1 ~ <II ~ M QI ~ ..... < .. M 0
"d •.-1 M M 0
C.)
~ ell <II QI .c ~ Cl)
::I ::, 0 l:Q
Cl) "d cu QI
~ > ~ 0 CU M
A z
..... p. ~ s <H
0 .....
~---<""I
QI M ::, bO
•.-1 ~
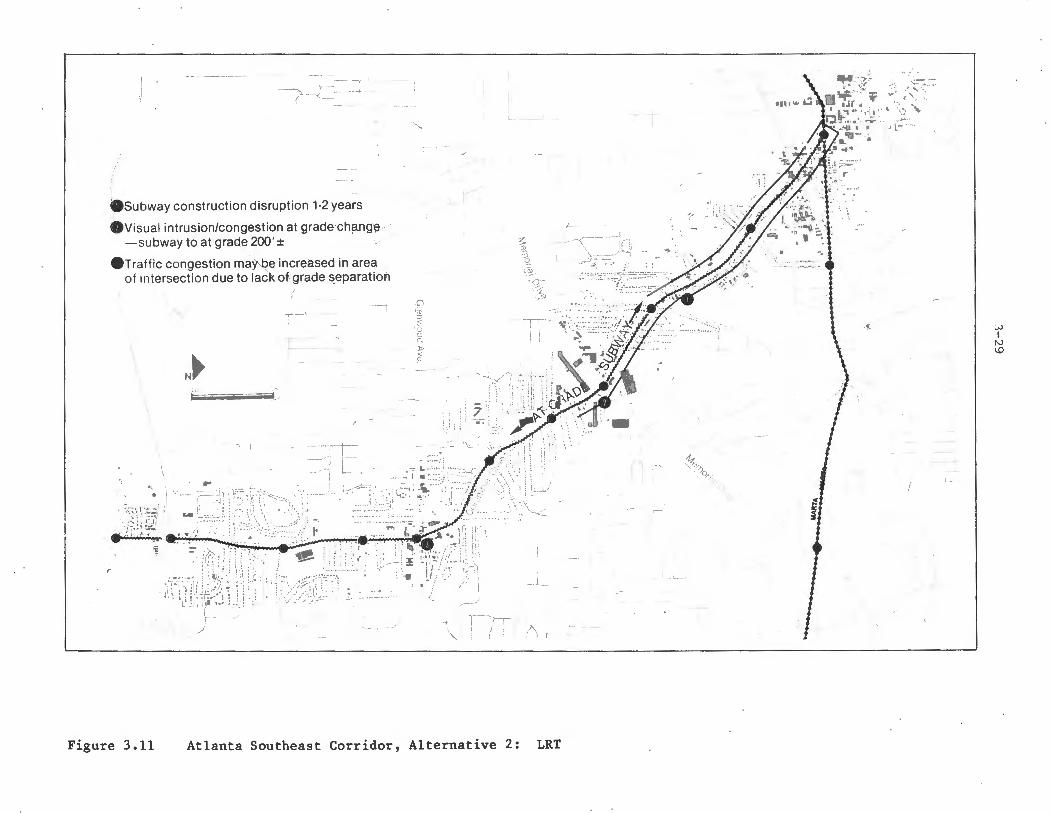
! I
' ·'(
8Subway construction disruption 1-2 years
evisual intrusion/congestion at grade ch13-ng'~ -subway to at gra~e 200 ' ±
eTraffic congestion ma~~e increased in area of intersection due to lack of grade s_eparation
'· ,.. •..
N►
C)
~ !f 3 C
1 /;
7 .. : +--~ .i .. :\. I • ··•-. <:f'-\·.' .. Jr__ /
/it'-'"•• : : ····· :~:=, ·- ~, >~J[? -• h •;
, " "
Figure 3.11 Atlanta Southeast Corridor, Alternative 2: LRT
7
"' ·-~----
.... %,_ '!,
~~-/.•.>.,. / -':~
•4 ·-., ·• ,-· ' •· l , ·· .. /,./' / I.. .
0~
... •· •I,;• .... ;_ 'i•.
• -. f . . . • ····•--: .
f
·«
.,~-::.:-.... '' ' \~• ' J'l"'
:,J I
Iv I.O
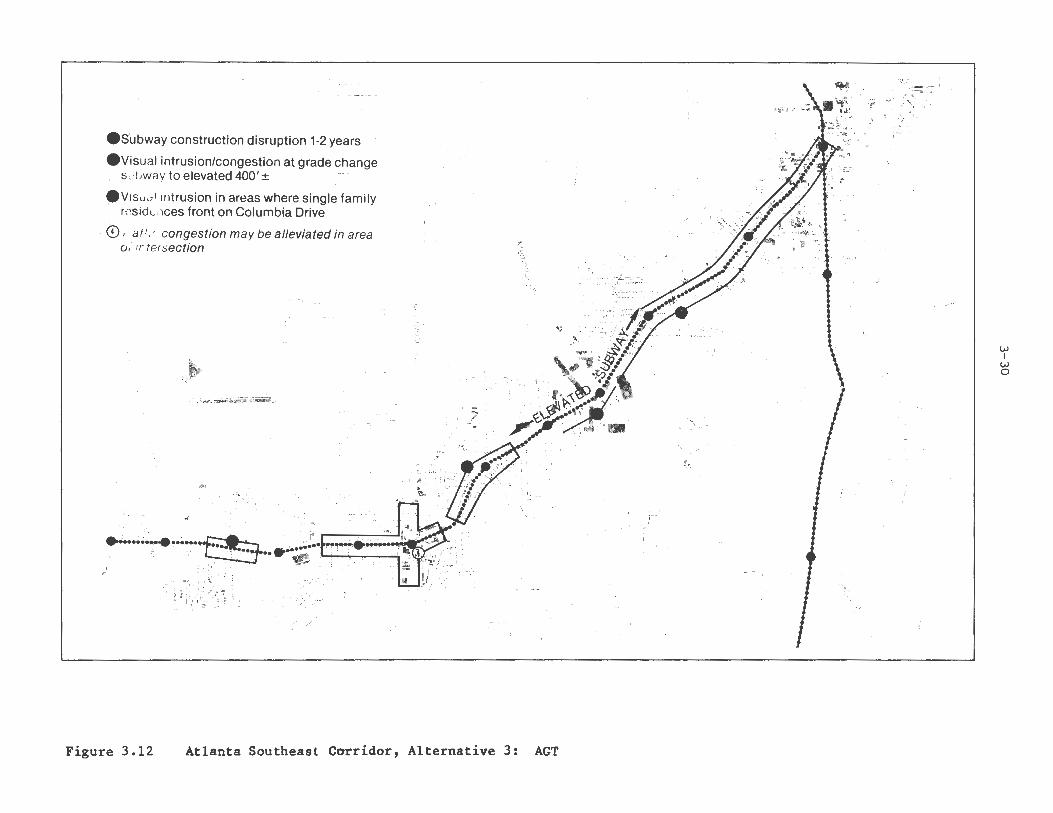
f
<
esubway construction disruption 1-2 years
evisual intrusion/congestion at grade change 1 s -. ,t, wa y to elevated 400 ' ±
evisu.; 1 intrusion in areas where single family rt>sidt.. .ices front on Columbia Drive
© , a11.- congestion may be alleviated in area-o: Ir tersection ,.
r '
1·
N►
.. r. . •
i:<,y,~·.
Gl (:, :;:)
~~ 9 c;_ ,, $
... ···-.:
.,/
i:: __ .'fi. . .... ,,
:J.ill~;:!,;,11:/~}U:; ; ~~1 /
' /
1
~
\ 'T
-~ ·(l ~ ,~J
r -. ,-L...
r
(\ r
Figure 3.12 Atlanta Southeast COTridor, Alternative 3: AGT
,L
\ ---1,•
___ :;-::-.,_ .. }1 ;•, .. • .
-·· ..... --~~.-:..~":!:\~_: ..
1 I
,..1, .. ....,,
-
'l
·····••····· '•
\ '\ "\, "
~ ">.>o.,
7/0 ;,'/,.'.,·c,
,·,
/
\
~--_;( ..... ~:~..:: ~ ••~ ¥ v• ;,~ ~~v
,■ tJ(. . .... I l '"11 .. '1· • •. .. \:.• " )r '
'!I": ...... .-;.· ,,, .. ,, .. -"4 I IJ .-.• •
. ......
,'I,
\.
"l""'" ..
I
w I
w 0
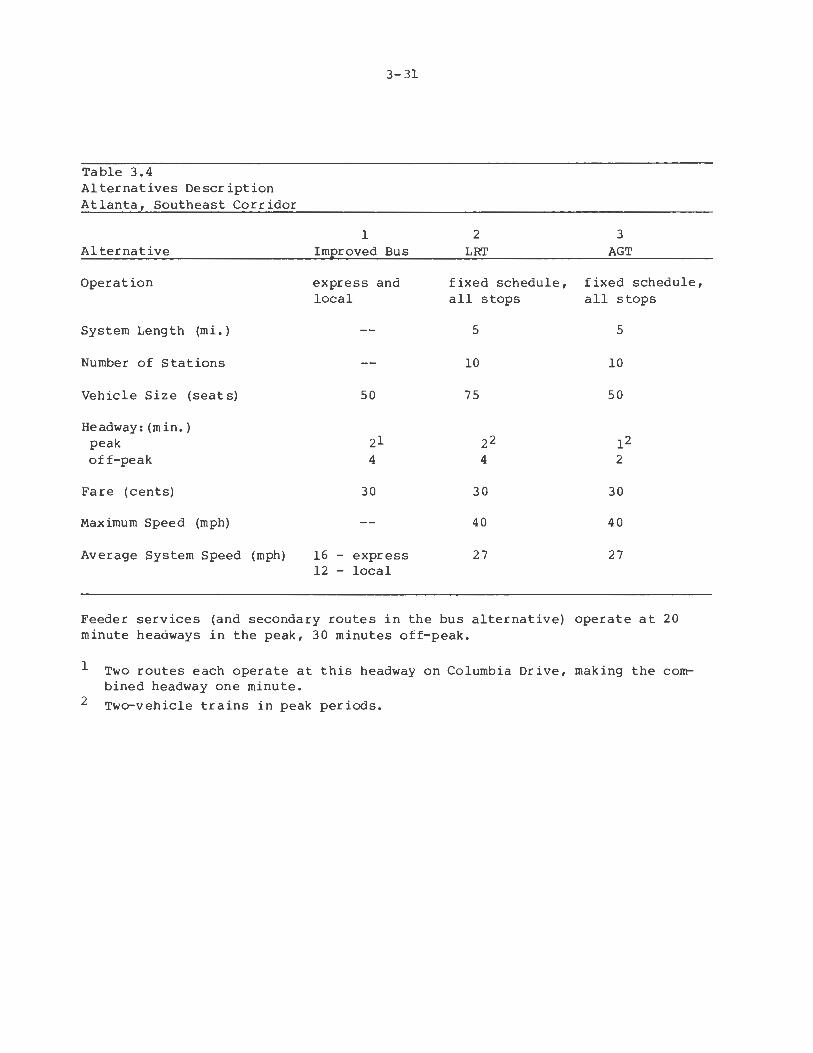
Table 3.4 Alternatives Description Atlanta, Southeast Corridor
Alternative
Operation
System Length (mi.)
Number of Stations
Vehicle Size (seats)
Headway: (min.) peak off-peak
Fare (cents)
Maximum Speed (mph)
Average System Speed (mph)
3-31
1 Improved Bus
express and local
50
30
16 - express 12 - local
2 3
LRT AGT
fixed schedule, fixed schedule, all stops all stops
5 5
10 10
75 50
22 12 4 2
30 30
40 40
27 27
Feeder services (and secondary routes in the bus alternative) operate at 20 minute headways in the peak, 30 minutes off-peak.
1
2
Two routes each operate at this headway on Columbia Drive, making the combined headway one minute. Two-vehicle trains in peak periods.
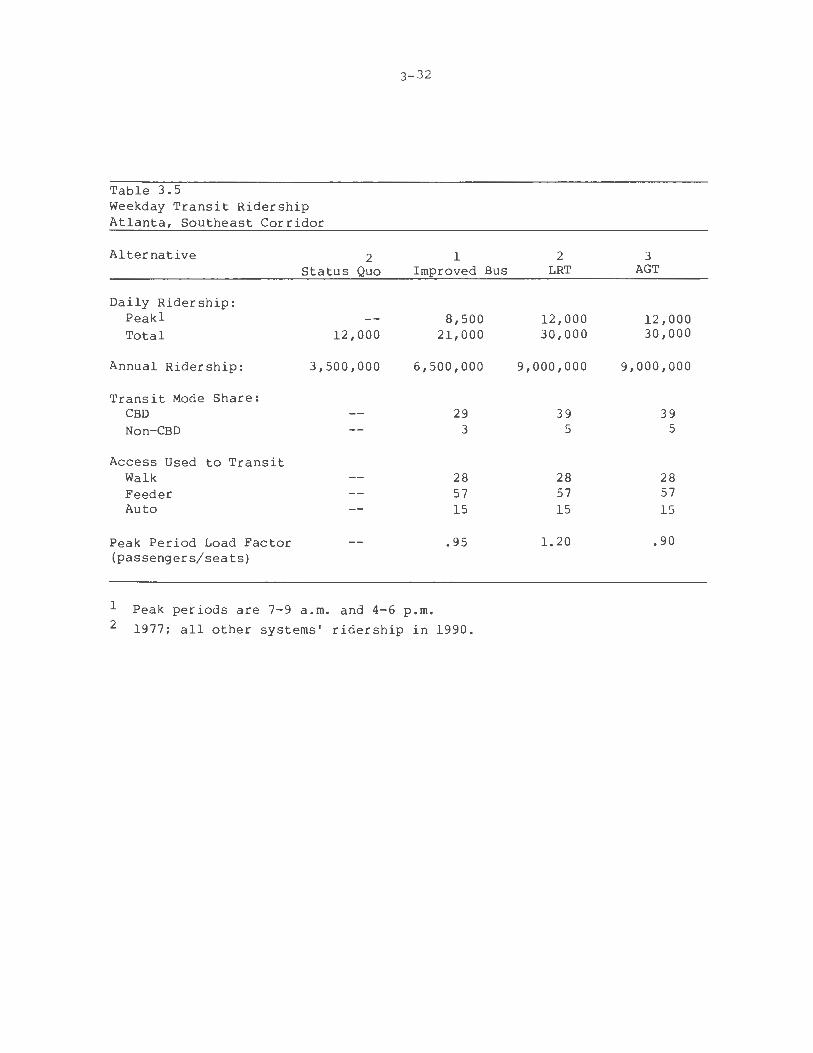
Table 3.5 Weekday Transit Ridership Atlanta, Southeast Corridor
Alternative 2 Status Quo
Daily Ridership: Peakl
Total 12,000
Annual Ridership: 3,500,000
Transit Mode Share: CBD Non-CBD
Access Used to Transit Walk Feeder Auto
Peak Period Load Factor (passengers/seats)
3-32
1 Improved
8,500 21,000
6,500,000
29 3
28 57 15
.95
1
2 Peak periods are 7-9 a.m. and 4-6 p.m.
1977; all other systems' ridership in 1990.
2 3 Bus LRT AGT
12,000 12,000 30,000 30,000
9,000,000 9,000,000
39 39 5 5
28 28 57 57 15 15
1.20 .90
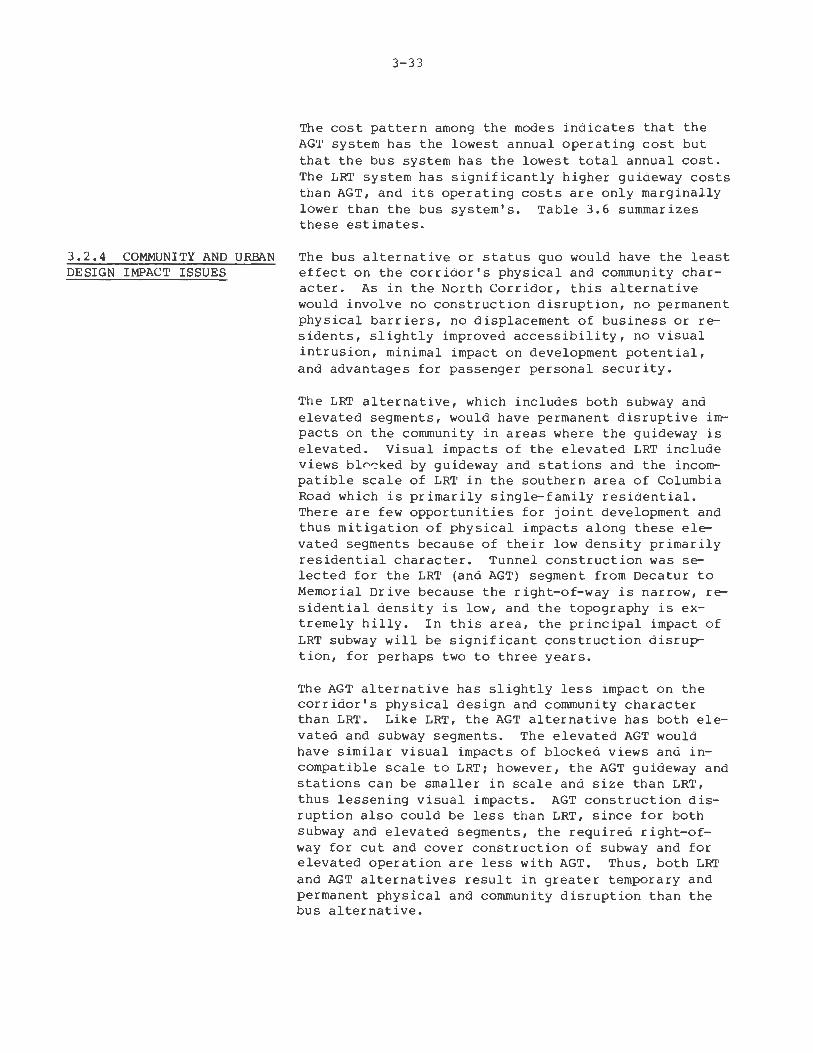
3.2.4 COMMUNITY AND URBAN DESIGN IMPACT ISSUES
3-3 3
The cost pattern among the modes indicates that the AGT system has the lowest annual operating cost but that the bus system has the lowest total annual cost. The LRT system has significantly higher guideway costs than AGT, and its operating costs are only marginally lower than the bus system's. Table 3.6 summarizes these estimates.
The bus alternative or status quo would have the least effect on the corridor's physical and community character. As in the North Corridor, this alternative would involve no construction disruption, no permanent physical barriers, no displacement of business or residents, slightly improved accessibility, no visual intrusion, minimal impact on development potential, and advantages for passenger personal security.
The LRT alternative, which includes both subway and elevated segments, would have permanent disruptive impacts on the community in areas where the guideway is elevated. Visual impacts of the elevated LRT include views blr~ked by guideway and stations and the incompatible scale of LRT in the southern area of Columbia Road which is primarily single-family residential. There are few opportunities for joint development and thus mitigation of physical impacts along these elevated segments because of their low density primarily residential character. Tunnel construction was selected for the LRT (and AGT) segment from Decatur to Memorial Drive because the right-of-way is narrow, residential density is low, and the topography is extremely hilly. In this area, the principal impact of LRT subway will be significant construction disruption, for perhaps two to three years.
The AGT alternative has slightly less impact on the corridor's physical design and community character than LRT. Like LRT, the AGT alternative has both elevated and subway segments. The elevated AGT would have similar visual impacts of blocked views and incompatible scale to LRT; however, the AGT guideway and stations can be smaller in scale and size than LRT, thus lessening visual impacts. AGT construction disruption also could be less than LRT, since for both subway and elevated segments, the requireo right-ofway for cut and cover construction of subway and for elevated operation are less with AGT. Thus, both LRT and AGT alternatives result in greater temporary and permanent physical and community disruption than the bus alternative.
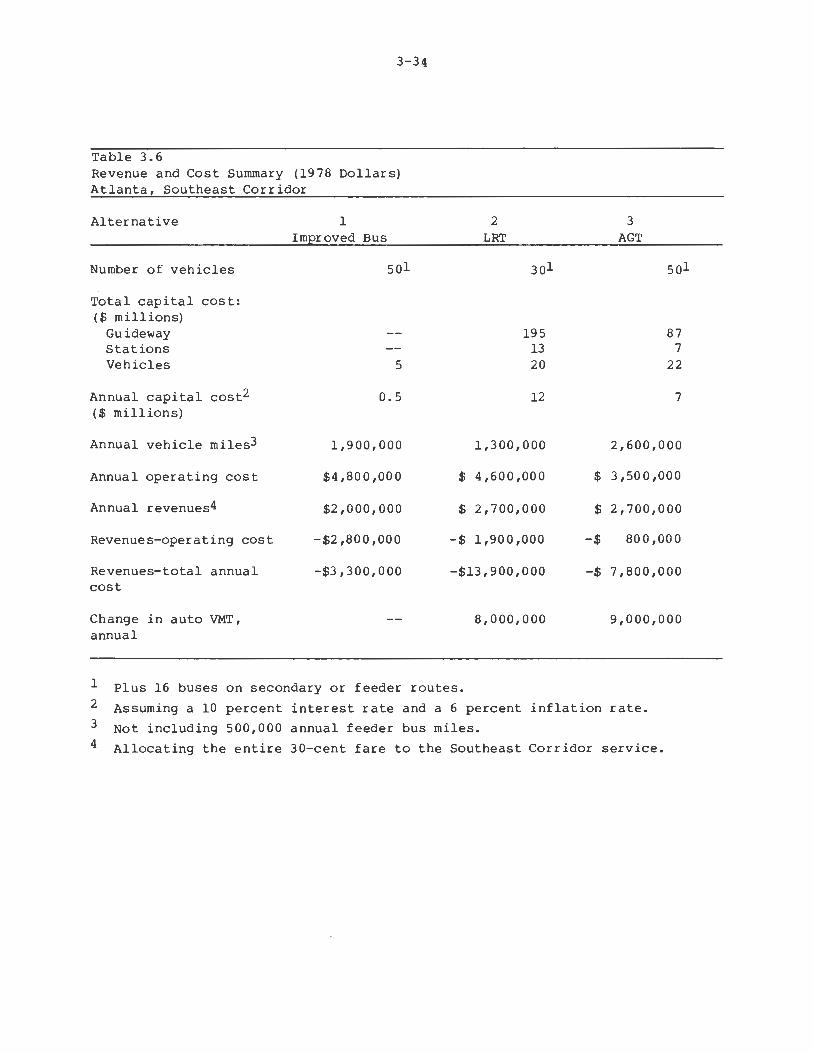
3-34
Table 3.6 Revenue and Cost Summary (1978 Dollars) Atlanta, Southeast Corridor
Alternative
Number of vehicles
Total capital cost: ( ~ millions)
Guideway Stations Vehicles
Annual capital cost2
( $ millions)
Annual vehicle miles3
Annual operating cost
Annual revenues4
Revenues-operating cost
Revenues-total annual cost
Change in auto VMT, annual
1 Improved Bus
soi
5
0.5
1,900,000
$4,800,000
$2,000,000
-$2 ,800 ,000
-$3,300,000
$
$
-$
2
LRT
195 13 20
12
1,300,000
4,600,000
2,700,000
1,900,000
-$13,900,000
8,000,000
Plus 16 buses on secondary or feeder routes.
$
$
-$
-$
3
AGT
sol
87 7
22
7
2,600,000
3,500,000
2,700,000
800,000
7,800,000
9,000,000
1
2
3
4
Assuming a 10 percent interest rate and a 6 percent inflation rate.
Not including 500,000 annual feeder bus miles.
Allocating the entire 30-cent fare to the Southeast Corridor service.
3-35
Personal security would be more of a problem with AGT because of its both unmanned and elevated character, than with the manned though elevated LRT or the bus. The suburban character of most of the corridor and comments from local planners suggest that personal security would not be a major problem for any transit alternative, although it is more of a concern in Atlanta's Southeast Corridor than along the North Corridor.
All of the alternatives would increase accessibility; AGT would provide the highest level of service. The guideways for LRT and AGT would not change pedestrian accessibility along the southern part of the corridor where the low density makes auto access vital. However, provisions for pedestrian signalization from elevated stations located at the center line would be required. Near Decatur, the subway alignment for LRT and AGT would mitigate impacts on the pedestrian activity along this two lane area of Columbia Road.
The disruptive impacts of AGT on the community around Columbia Road would not be as great as in other suburban or urban sites because of the existing wide corridor nature of southern Columbia Road. The road already is a major physical and psychological barrier for autos and pedestrians moving east-west, and for pedestrians moving north-south.
An elevated structure in the southern part of Columbia Road ROW would not divide the corridor significantly more, and in fact could help to increase the limited pedestrian activity along the north-south corridor. However, some auto traffic congestion may result at major intersections. Also if island stations are used pedestrian crossing is more difficult, whereas split platform stations allow pedestrian access down either side but increase station size significantly, by 33%.
The temporary construction disruption could close out already marginal businesses along the corridor, although wide setbacks make it unlikely that any businesses or residences would be permanently displaced for the guideway or for stations. Some single-family residences could also be displaced by commercial uses. However, disruption from subway cut-and-cover construction along the northern part of the corridor could lower property values of residential areas and even cause displacement.
AGT would cause several types of visual intrusion on the Southeast Corridor. The stations would be the

1..,.. .. : f . • :.,,
" f i ...
,,
-
Figure 3.13 . View of Columbia Road at Memorial Drive
--.- "' .:
r ... ~ ~
e ~~
w I
w (J'\
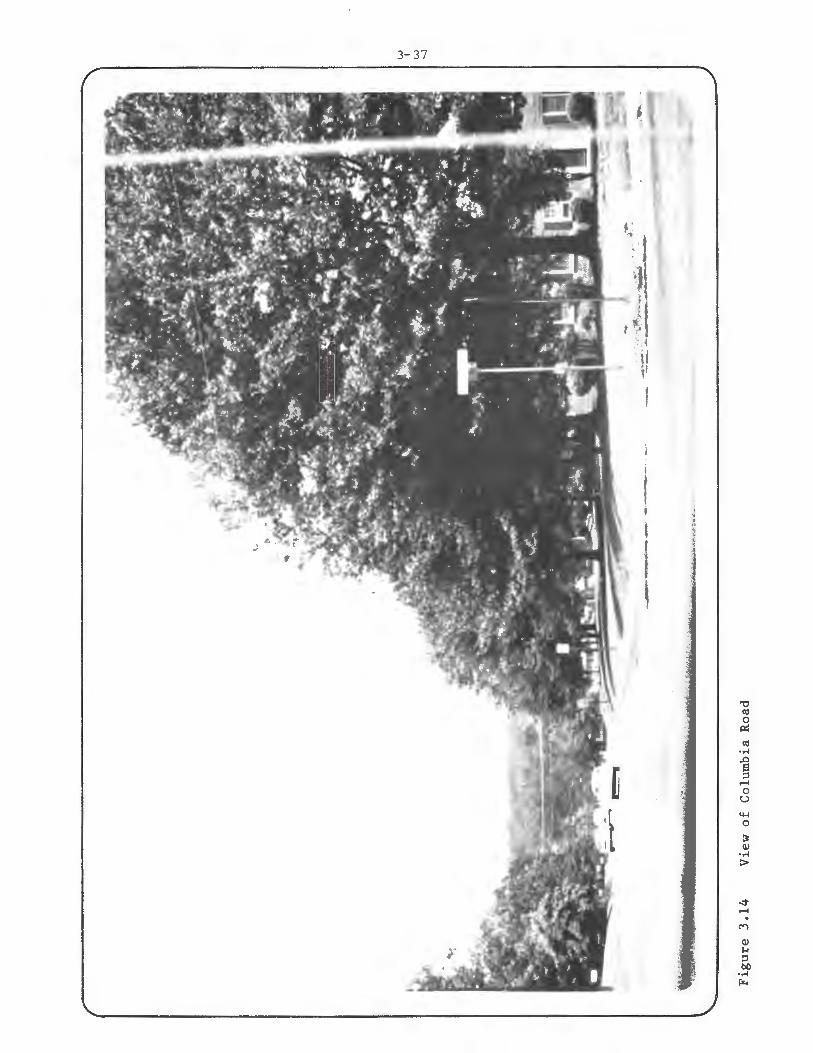
3- 37
u !
I
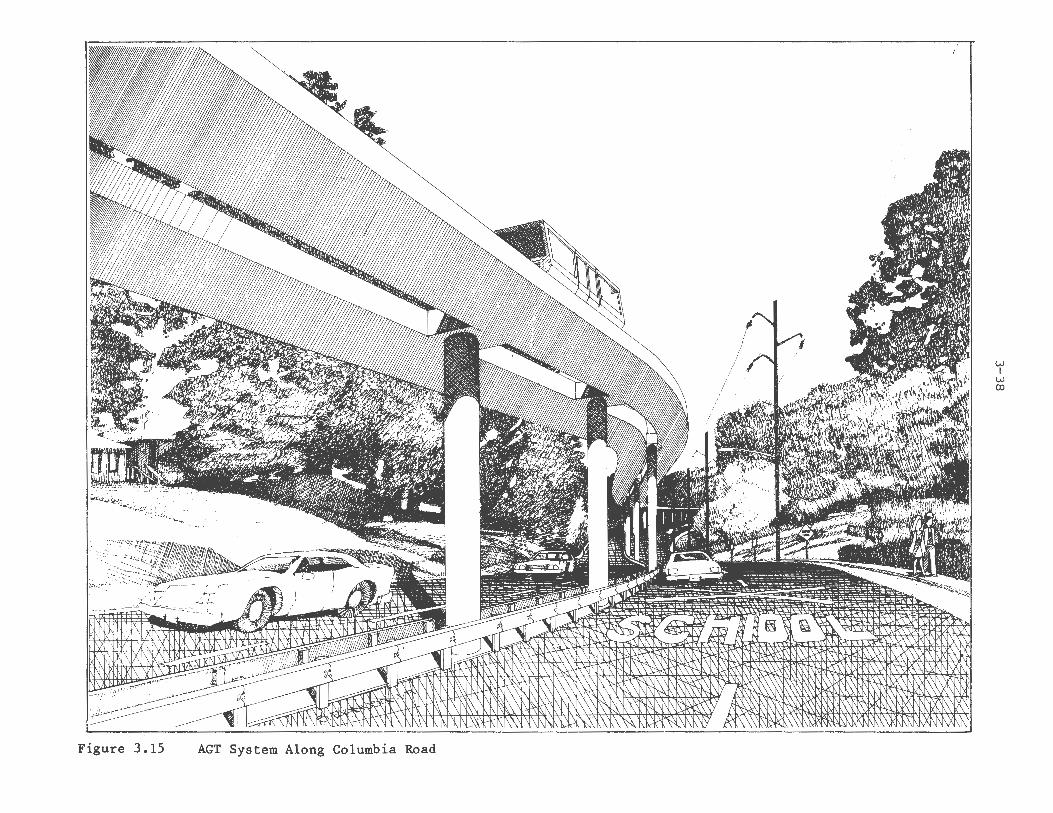
Figure 3.15 AGT System Along Columbia Road
w I
w co

3.2.5 INSTITUTIONAL ISSUES
3-39
most significant cause of visual intrusion particularly near residential intersections. The small scale of the residential and commercial structures along most of the Southeast Corridor would contrast sharply with the elevated guideway and stations. At the two shopping centers, the guideway could be integrated into future expansion and be less of contrast than in the , residential area. In addition, the natural landscaping along the corridor could provide some visual cover to the guideway and the stations. Local transportation planners evaluated the guideway as unattractive. They also predicted that local acceptance and support could be polarized between the residents who would be against the guideway and the businessmen who would support any form of capital improvement, including a guideway.
Recent development has occurred near the I-20/Columbia Road interchange. However, the potential for new development appears to be lower in this corridor than in the North Corridor for several reasons. Employment has not grown recently in this corridor nor in Decatur. Also, the new MARTA station at Decatur, which would tie into an AGT system, is located in the older, mostly developed area of the corridor.
In conclusion, the AGT alternative will cause limited physical disruption in this corridor community. In addition, the residential community may have strong objections to an elevated guideway. These objections may be primarily visual intrusion concerns, even though the existing corridor nature of the alignment, the mature landscaping, and the guideway design make visual intrusions less dramatic than with LRT or in other similar medium density non-corridor suburban areas.
The agencies involved in the Southeast Corridor are the same as in the North Corridor, except that the local government involved would be Dekalb County. No portion of the Southeast Corridor alignment is within the City of Atlanta.
Many of the reactions to the Alternatives were similar to the reactions in the North Corridor. The motivation of remaining alternatives is similar to both cases, as the busway included in the original MARTA plan may not be built. The Southeast Corridor has no current guideway planning effort, unlike the North Corridor, and a new busway or alternate mode may follow several widely dispersed alignments.
3 • 2 • 6 SUMMARY
3-40
One factor that differs in the Southeast Corridor from the North Corridor is that stimulating economic development is a major local objective. A guideway transit system would be viewed more favorably in this corridor if it could be shown to have significant development and employment benefits. An economic development program is currently being planned for this area.
Another difference is that right-of-way is more restricted in this corridor and visual issues are likely to be a greater problem. In one critical section of Columbia Drive, where the road is only two lanes, the topography is hilly, and the character of the area is heavily wooded and visually attractive, it was felt that any guideway alternative would be unacceptable at or above ground. AGT did not offer a significant enough advantage to allow its construction above grade where LRT could not be built. In this neighborhood, even the routing of buses along Columbia Drive has caused concerns over noise, vibration, and other issues.
Personal security will be a greater issue in this area than in the North Corridor, and public reaction to a fully automated system is unknown.
The priority of this corridor for regional transit can be expected to be fairly low, as the East-West MARTA line has been completed, and provides service to portions of the area. Effort is likely to focus on the North-South line for the near future. AGT's costs and performance do not appear to be sufficiently more attractive than LRT in this corridor to alter the regional priorities. If AGT total costs were not much greater than those of a bus system, its performance level would be well suited to medium-volume corridors and it might be a viable option. However, this does not appear to be the case.
Neither AGT nor any other system is likely to be implemented in the Southeast Corridor for some time. This particular corridor was used as a test of AGT in a relatively secondary corridor. If it were viable, this would be an indication that incremental development of an areawide AGT system would be feasible. However, AGT's performance, when considering some of the uncertainties about it, was not felt to be sufficiently better than competing alternatives to argue that it could be viable in such corridors than alternative guideway modes. While there is some technical data indicating that AGT offers some performance advantages, this evidence does not appear to be strong enough to obtain local political support.
4. 1 STEMMON S AND NORTH CENTRAL CORRIDORS
4 .1.1 SITE CHARACTERISTICS
CHAPTER 4 DALLAS
The Stemmons and North Central corridors are two of the major transportation corridors connecting the Dallas Central Business District (CBD) with the northwestern and northern parts of the region, respectively. Both corridors are served by major limited-access highways, the Stemmons Freeway (I-35E) and the North Central Expressway (U.S. 75).
The section of the Stemmons corridor examined in this study is roughly bounded by Maple Avenue to the northeast, the western edge of the CBD to the southeast, ana Mockingbird Lane to the northwest. Overall, the study area is approximately 4 1/2 miles long and 1-2 1/2 miles wide. While the age and type of development varies dramatically, the corridor can generally be described as older, fully developed, and urban in character.
The principal land uses in the corridor study area are commercial and institutional, but large areas are also devoted to transportation and industrial uses. In addition, the northeastern tier of the study area is a predominantly middle income residential area. The density of development is generally low in the resid•;ntial areas and moderate to high in the commercial/ institutional area, especially in the vicinity of the Market Center and the medical center complex. However, even in the more densely developed areas, buildings or centers are typically surrounded by large parking lots.
The major activity center in the corridor is the Market Center, a six building, 135 acre wholesale merchandise mart that will shortly contain more than seven million square feet of space. It is the principal activity center served by the various transportation alternatives. In addition, four major hospitals make up a large medical complex to the north and west of the Market Center. Also in the vicinity of the Market Center complex are a number of hotels with over 2,000 rooms.
4-2
'!he corridor has two distinctive characteristics setting it apart from other urban corridors in which transit alternatives might be considered. First, development in the corridor tends to be one-sided. The natural barrier created by the Trinity River Greenbelt Park has generally led to development north of the Stemmons Freeway. Second, the rights-of-way in the corridor, both the Stemmons Freeway and the railroad rights-of-way, are large and generally free of the space constraints found in some urban corridors.
The North Central corriaor study area, which is framed around the North Central Expressway, is generally bounded by Walnut Hill Lane to the north, Skillman and Fair Oaks Streets to the east, the CBD to the south, and Hillcrest and Abbott Avenues and Turtle Creek Boulevard to the west. This constitutes an area roughly three miles wide and six miles long. '!he area encompasses many uses--commercial, institutional, and residential--and can be characterized as a mature, fully developed urban corridor.
The predominant land use in the corridor is multi- and single-family residential. In mix it ranges from low income apartment complexes just north of the CBD to expensive single-family homes in the communities of Highland Park and University Park.
A second major land use in the area is retail commercial activity. A major focus of this activity is the North Park area at the intersection of the North Central Expressway and Loop 12. However, major arterials such as Mockingbird and Lovers Lanes and Greenville and Hillcrest Avenues contain large strips of commercial development.
Major activity centers in the study area include the North Park shopping and office center development and the Southern Methodist University campus. The North Park area alone has nearly 1 1/2 million square feet of office space and, when fully developed, will have over 2 million square feet of retail commercial space. An additional 1 1/2 million square feet of office space is located along the North Central Expressway between Haskell Avenue and the North Park area.
Development density in the North Central corriaor ranges from medium to high. Like the Stemmons corridor, even the more highly developed areas have been
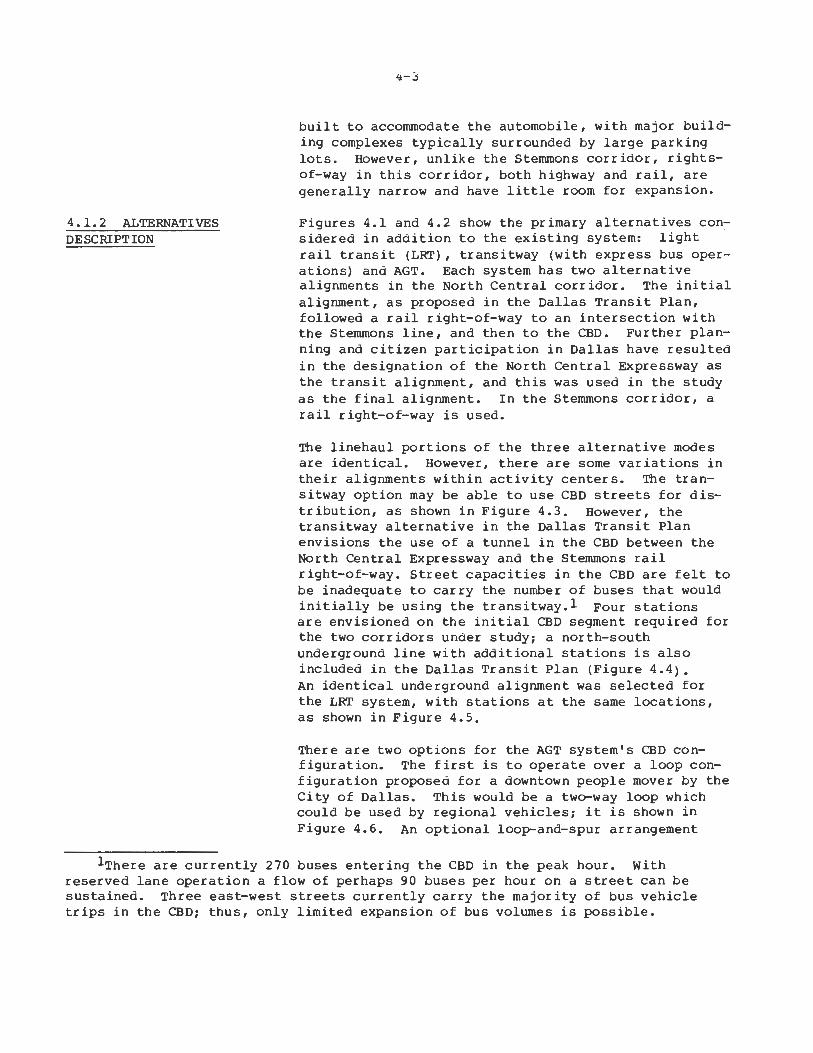
4.1.2 ALTERNATIVES DESCRIPTION
built to accommodate the automobile, with major building complexes typically surrounded by large parking lots. However, unlike the Stemmons corridor, rightsof-way in this corridor, both highway and rail, are generally narrow and have little room for expansion.
Figures 4.1 and 4.2 show the primary alternatives considered in addition to the existing system: light ' rail transit (LRT), transitway (with express bus operations) and AGT. Each system has two alternative alignments in the North Central corridor. The initial alignment, as proposed in the Dallas Transit Plan, followed a rail right-of-way to an intersection with the Stemmons line, and then to the CBD. Further planning and citizen participation in Dallas have resulted in the designation of the North Central Expressway as the transit alignment, and this was used in the study as the final alignment. In the Stemmons corridor, a rail right-of-way is used.
The linehaul portions of the three alternative modes are identical. However, there are some variations in their alignments within activity centers. The transitway option may be able to use CBD streets for distribution, as shown in Figure 4.3. However, the transitway alternative in the Dallas Transit Plan envisions the use of a tunnel in the CBD between the North Central Expressway and the Stemmons rail right-of-way. Street capacities in the CBD are felt to be inadequate to carry the number of buses that would initially be using the transitway.l Four stations are envisioned on the initial CBD segment required for the two corridors under study; a north-south underground line with additional stations is also included in the Dallas Transit Plan (Figure 4.4). An identical underground alignment was selected for the LRT system, with stations at the same locations, as shown in Figure 4.5.
There are two options for the AGT system's CBD configuration. The first is to operate over a loop configuration proposed for a downtown people mover by the City of Dallas. This would be a two-way loop which could be used by regional vehicles; it is shown in Figure 4.6. An optional loop-and-spur arrangement
1There are currently 270 buses entering the CBD in the peak hour. With reserved lane operation a flow of perhaps 90 buses per hour on a street can be sustained. Three east-west streets currently carry the majority of bus vehicle trips in the CBD; thus, only limited expansion of bus volumes is possible.
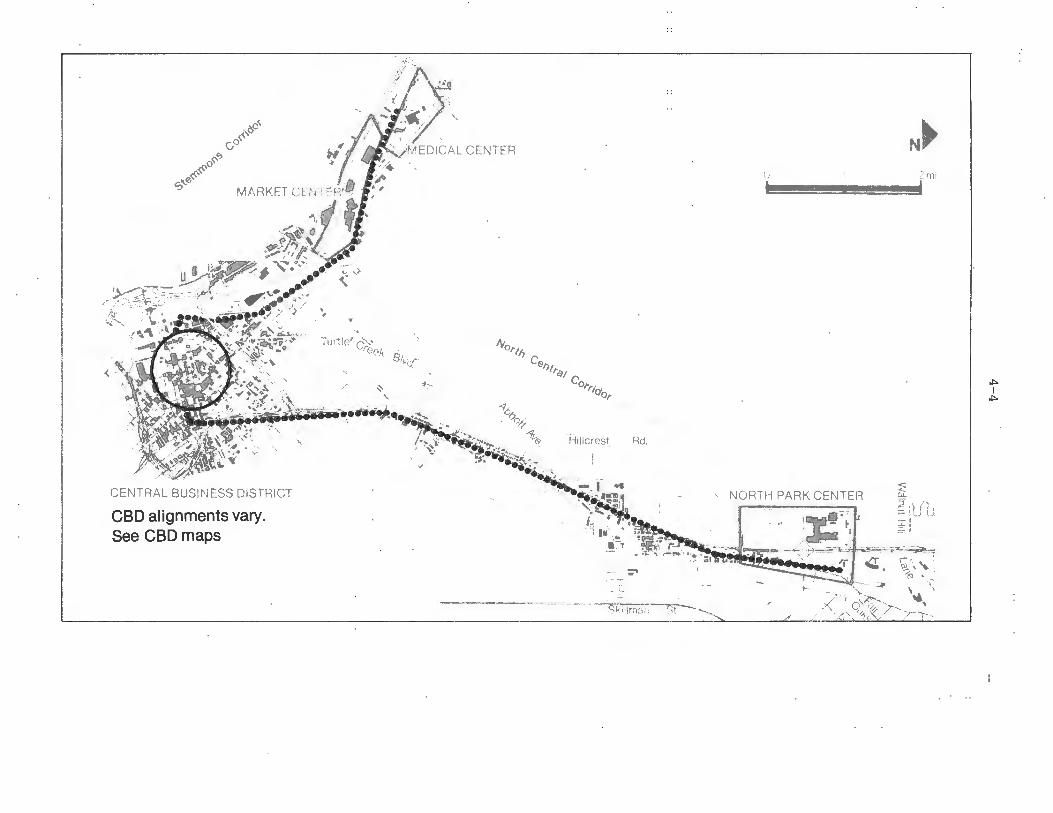
/
tP" ),, ... cP
<;, ~o'-'
e:;''l,<$'
CENTRAL BUSINESS DISTRICT
CBD alignments vary. See CBD maps
. , ;~ "" '(
.. Turtlo' IVo,.1/J
Ce,, ·,t,.i'J/ C
o,.,.icto,.
' Rd
';" ;-~-+
:t -------------~cc 'sJ"-- N
C
NORTH PARK CENTER i 5 s. :E
N► rn1
.i:,. I
.i:,.
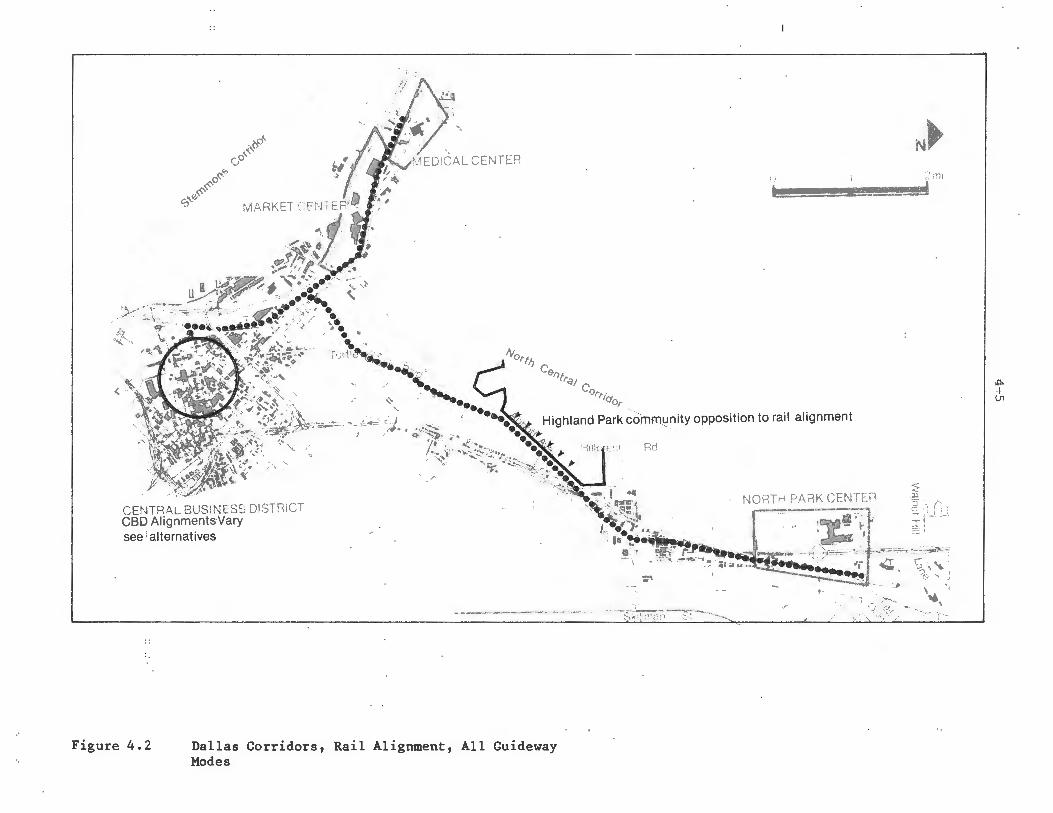
-tP' ........ ~
,P ..,, ~o~
e:,'-e,~
"I.
'A•: -t1-t~~ · _._ • .. ~ ,,,:. ~ ?'I,' .. ~ -~~- .. ~ ~;,: -..}
£ ,.. • *"
~~-- -k. ' . ·.• .. ~ .. ~· .. ;.•• .. ~-.;,-~ .•· ... :--""-:::::_ - ., . ~ ... ,/;,~ , . . ,,~ \ . - -....... ;1 - _ .... ~ :-' / •• • >,.... .. -- ,~ _..., ...... \ , ___ ~ . ..
',
· ~ 4illlllr-.i:,,~:~~-.. ,~:.-- Turtl~~-• 1..~ ·:-, •, . ~ - ... . '"~•·· . , ' . ,. --.. - ~ ' ' ··"' ,:;,, .. • ., .,.,,.,, . . -.;._ . ·~-. ,,,,... ').~--- ---. ..
N► 2m,
Aiorti) C
e/Jtru; C
Orr;<lor ~ . .. . ., . ··-~ : \-- ., . . . ' , ~ . , .. . . .
# ....... t ... ~ ··, . ·.1 .... •• ' -•• -;: , 'l- - •,, ➔• , ••• .,,.,,__ ••• , ••
,,. > I l'J•' ••.l""·-·.:;;;........ . / , ·1. .;'II!~. • <·4
.. ....,., •• ~ ' •• .,,,__ , \,•··••,S ..... ,.. . • ,. • n'.,,., _ • ..,,. • ·s., ',. -~·-••
Highland Park community opposition to rail alignment
est Rd -.:A>-•»'-, ....... ··.-~--¥• ,.,. • ... .. , ... _. ___ ... __ , ... I "-"---- r;, ' . ¾ -.,. I •
. ~--· ·,•·.. • • ' ~ ~ ''-'ffl1 , ' •4 , . ... ·-~.;i. ~:,t - ~->. ·. .. f .. .. :w,- . ,.._
CENTRAL BUSINESS DISTRICT NORTH PARK CENTER
,,;: ;t: 5 s
CBD Alignments Vary see i alternatives
Figure 4.2 Dallas Corridors, Rail Alignment, All Guideway Modes
·1 I• -~••~ ?!~~~~i.-. ~· • ~i.:·, .
';"I
- -· S°'k1llma0
...,.. , :::'!-:' :::: ' -Jc~
4 '8-,'-. • ;..i~ ~ ~
..:.., \ '1
,. " ?' f \~. '
OQ,-~ -~r-:f, ./
.p. -I u,
LC)
C)
=
//' .j • .,,
' ' ' ' ,, '
• ~ '
-=:I
4-6
• z " ' ."
,, .♦
• ' \
#~
~ '•
"
. ,·
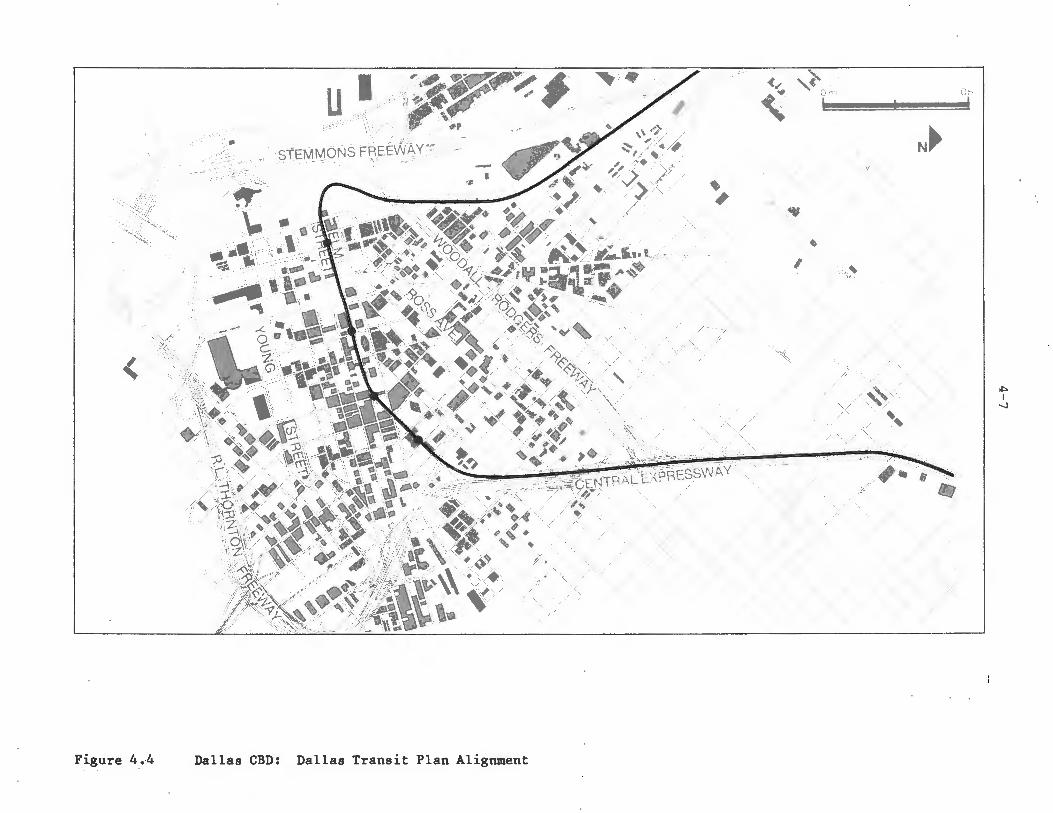
''-', '/ ~~::\~.
U I ' ... :.~~~.-.~ ~ ·:·,~-~, .,,~ / \ ,
' *' . "
-.•, ~~ ,,,,> '"fr . - • "', 1 ~ ; . • ~~ 3/-.).
• C ~-.~ ----- ~~ ,
.. STEMMONS FREEWAY - .~ _. ... (. >
~· . ~ #
\.
.. ' ·' ~"' , .. ~ • ll ....... ; .. ~~ • ·• , • , '
--· ' ' ,f ,.,.-, _...,. ~~ .... , ., 'II .. '. ·- g,-~1 ~~ ti,,~; .,_; .• #' ,'" /
·- .•. ,~.- Q.. -~• , , . • I I•" _;~r1..♦ .,. ,oo , ,..~, , ~~- •· - .. . , ., •• </. .. t• ~. ,--· ~ , 1111\ • . • • ~ ' ;., , • <(~.,, ... • :::L",_.:---■ l. , -•,
· · , - #-.'<,u· < "l /. ..-~ .. ~/'~ '< ,'·,: :, .. ,~,: .w. · ~;i,<l'~· ~,.-s>o~!t.. •!♦
... <~
l '. · C. _., \,·&•" z•'Z / ~Q.V~~ · -~~ 'T > -;. 0 • , .... _, .~, T
11.}, G> .......... " · ·~·~~~ . ~ '", ·,~&✓ .. ~,
/, ,'s'':,_... fA.'J- .,,_Jj• .,. • •~ ... ~f ,,<::,. ~-.'-:,"' ,· .' • - .. ~ • • ~~· .. . ~ • " A\ ' ~ "• ·. •• • ♦ <f . ..,Y♦.; " V's ~ ,: ' . . .. . . "' ~ / .,,,, ) ♦,. ~, ~ Lei ) \;!l1 _,.,:J ~ ........ "~ ~ /' ' ~·~-'~ ... ,_ .... f .. ~~/~ )-'\
,1' ~· ~ .. i ;.?- ,~, h-'-~~ ~ +j ... ~--. ,, '\
/(
•<' 0.. -\9\<f' ,.'ii,-. • ~; ' " L ;• •
?'
A~-~/ >""1~" ~f\ ·,lfii'!•' / • :',;~/ ♦ ~. ~-
-r>"'-~ ' ~' . "'-"' '• ' • .. ' , ... ' ,. ' . '~-.a~"!':• ~~ ,~ ~':' J·i• · !/.,, ,, ~ _. >• : ' /1•-n \ ...... ✓ '♦ J ... ,"<:M'· ,,. ••• ' / • ' ' , ,.,., ' / ♦ ~ ,--~ . =· . . •' z,1~4'~\ ·' ~-• •\ .,;. · ... ,':',,:r .. ·, ~ - -?,i •' ";&.~\«•·• ,t;' ~ ~ ,_' ,· )'""Q.~TRAL EXPRESSWAY ·
,l':z.~1/~~-✓• ~, . - ~ ' j!.)1 . ~~,~·~ \ ~✓ ;~-: V}/ ,'9> ' 7. ,, ·'• ' • ~~ / ,.,
;, ,<sf ' \ ~ ,,.~ " .. f ~ '( , - ,, • ,. •&-;/ · r' ,-,,{/(f '"'t' V ,._ • ' ' '
k,··~~,tit~·: tl"~,, :~;. ~>, / \ -~,,. ,"< ~ , , % Jf;p,.• .. ....f . "~ ' /~~ ' ~ <•,,\ ,. •. . " ✓ ' >
/
Figure 4 .4 Dallas CBD: Dallas Transit Plan Alignment
/ ~ ,} ~~ '·"" . ' ""'
N► /X',
~
♦
I -~ "
/ <sf(
//
I ! ' /
~ < ~~
"· -,. . l-,I~- .•
' /
"- ~ '
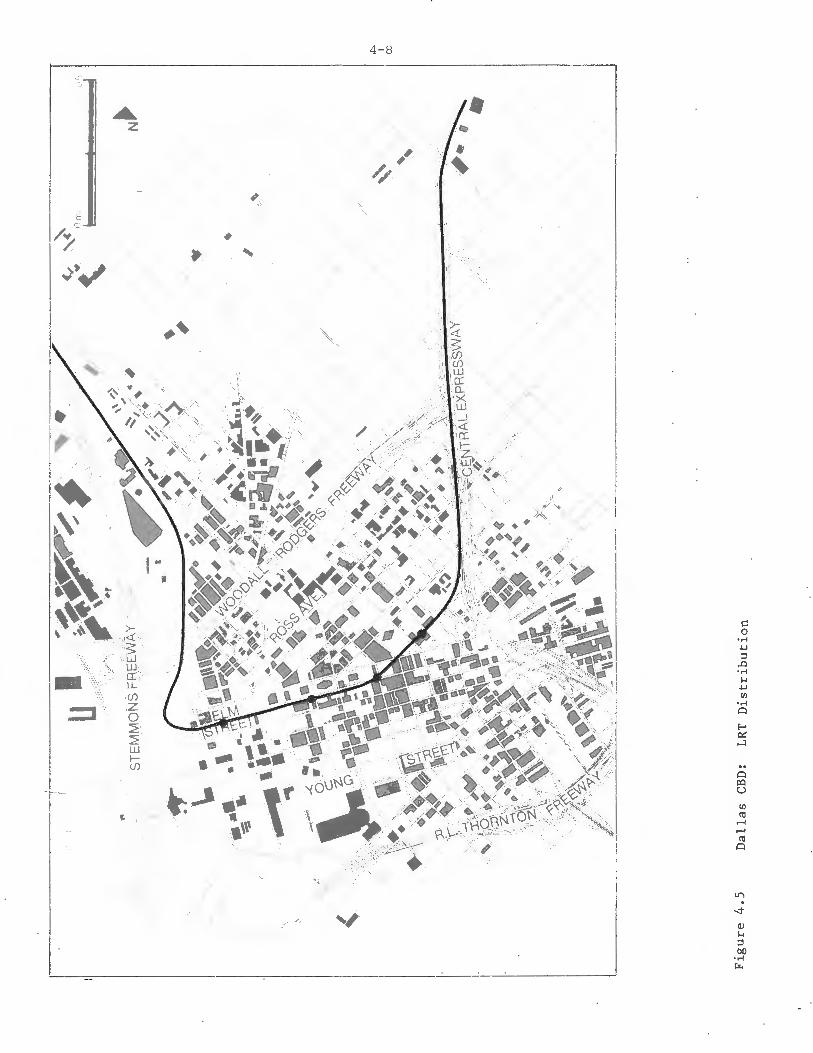
-::I
A z
•
,
♦
'
4-8
,,
' / ' / '
.. Cl i:o u
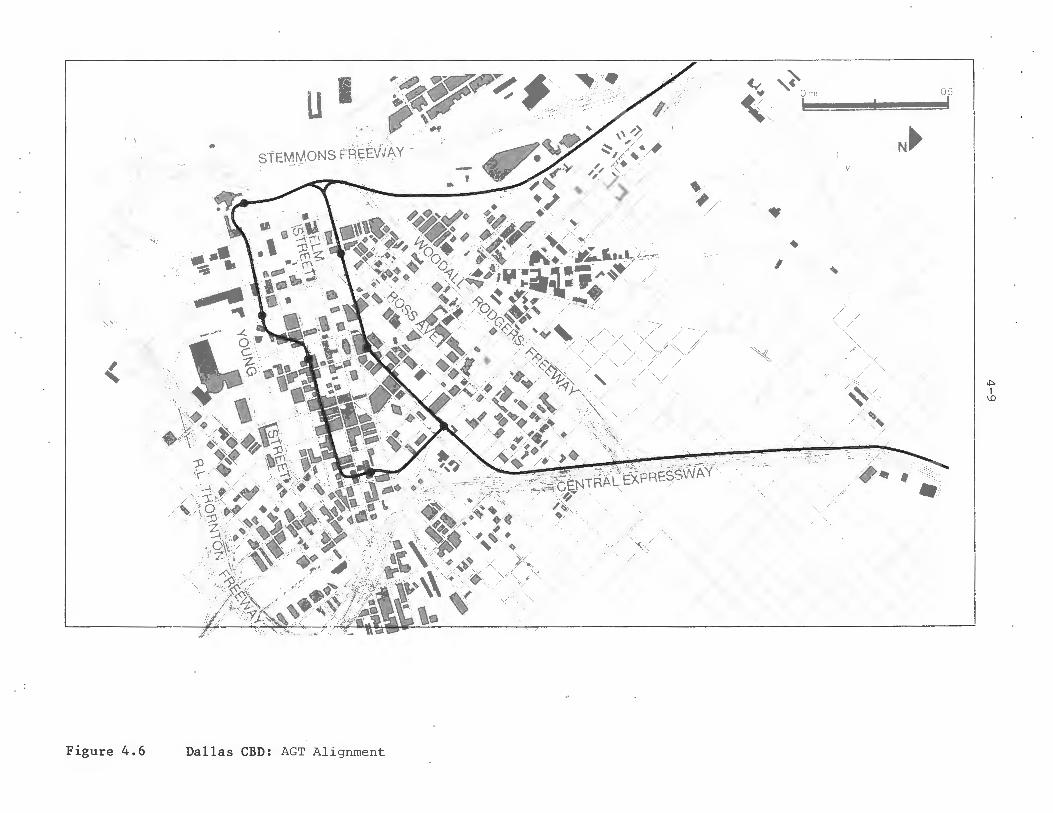
'
< '_,/
:/<'-.::
Figure 4.6
u 1 _ ,~~-;,: I" - STEMMONS FREEWAY - -- - ~' - . .;
Dallas CBD: AGT Alignment
~ /#
/""- /
v
,/
/
} ~ " \;'11
~ N►
V
'(
,k •
/
♦
I . ~
'
'<<.. ./
✓
/ .'. /
;
/ ❖
~~ '.
/
/ <'•t··~ ,_ •
,,,. . "'.
,I:> I
\0
4.1.3 DEMAND AND COST ISSUES
4-10
(shown in Figure 4.7) was also worked out to provide additional service to the northern portion of the CBD.
In the North Park area, which defines the end of the North Central corridor guideway as considered by this study (the Dallas Transit Plan shows a guideway
extending to the LBJ Freeway), both minibus and AGT circulation systems are considered for each corridor mode. Both an AGT circulator integrated with a regional AGT system and a separate AGT circulator were considered for the linehaul AGT alternative. Finally, in the Market Center complex at the end of the Stem-mens guideway (again shorter than that of the Dallas Transit Plan), the AGT alignment was brought into the complex, while the LRT and transitway remain on the rail right-of-way adjacent to the Market Center.
Table 4.1 outlines the major service and operating characteristics of the alternative modes. Each system has approximately one station per mile outside the CBD; the AGT (using the loop alignment) has seven CBD stations, while the LRT system has four stations, and the transitway (using the at-grade CBD option) has one. The system lengths vary only due to variations in CBD alignment. AGT and bus vehicles are assumed to have 50 seats, while the LRT vehicles is assumed to be the U.S. Standard Light Rail Vehicle holding 75 seated passengers. Headways typical of each mode and appropriate to the corridor volumes are set.
Table 4.2 shows the predicted modal volumes using the sketch planning technique described in Appendix A and local Dallas mode choice models and trip tables. There is little variation among the modes, and also there was little difference between the rail and expressway alignments in the North Central corridor. Non-CBD ridership is predicted to rise significantly due to the greater connectivity -of a guideway/feeder network as opposed to the strictly radial status quo network. Whether this effect would actually occur cannot be stated with certainty, however.
Ridership is heavily dependent on feeder service; little ridership comes from park-ride patrons beyond the ends of the guideways and their attendant feeder service. However, expanded feeder service would increase ridership substantially from these areas.
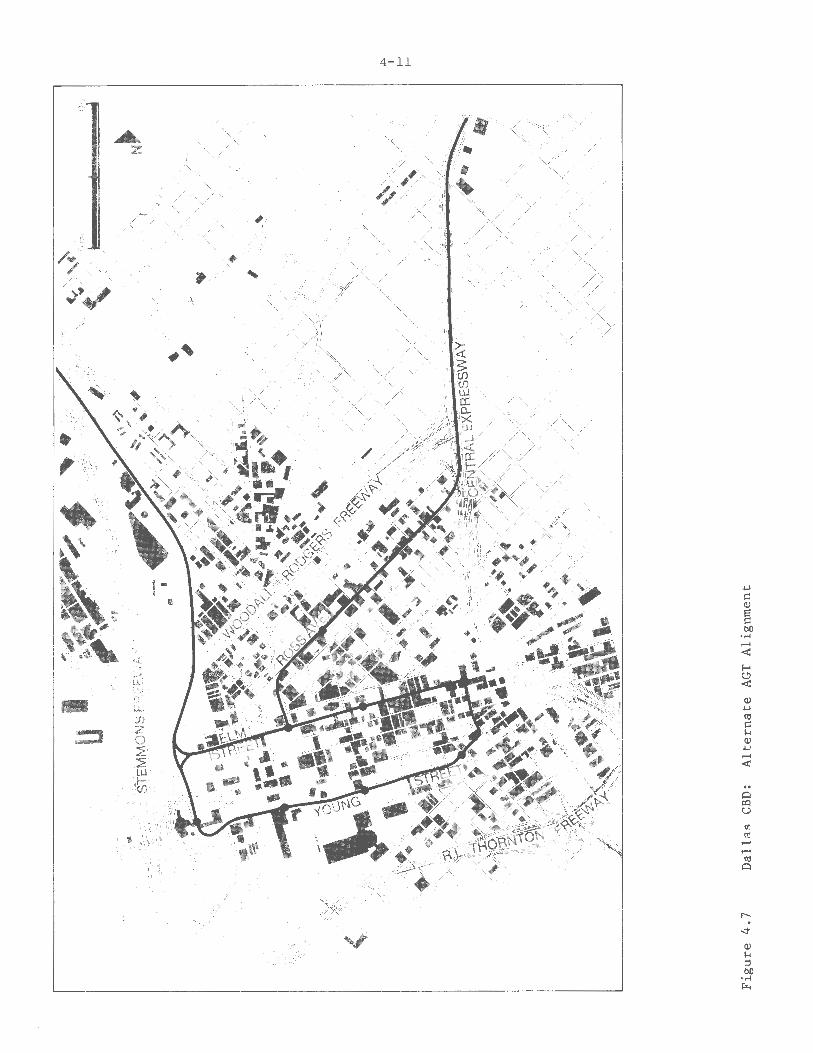
A z
•
4-11
.. 0 J:Q u
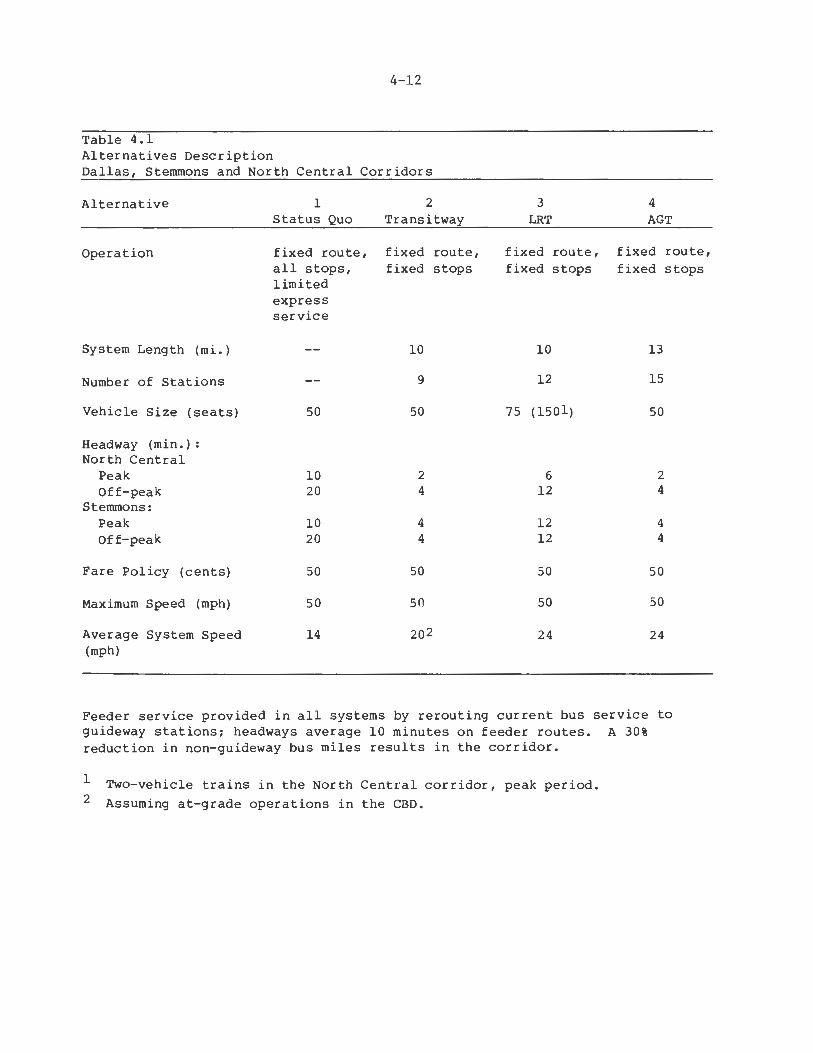
4-12
Table 4.1 Alternatives Description Dallas, Stemmons and North Central Corridors
Alternative 1 2 3 4 Status Quo Transitway LRT AGT
Operation fixed route, fixed route, fixed route, fixed route, all stops, fixed stops fixed stops fixed stops limited express service
System Length (mi.) 10 10 13
Number of Stations 9 12 15
Vehicle Size (seats) 50 50 75 (1501) 50
Headway (min.): North Central
Peak 10 2 6 2 Off-peak 20 4 12 4
Stemmons: Peak 10 4 12 4
Off-peak 20 4 12 4
Fare Policy (cents) 50 50 50 50
Maximum Speed (mph) 50 50 50 50
Average System Speed 14 202 24 24 (mph)
Feeder service provided in all systems by rerouting current bus service to guideway stations; headways average 10 minutes on feeder routes. A 30% reduction in non-guideway bus miles results in the corridor.
1
2 Two-vehicle trains in the North Central corridor, peak period. Assuming at-grade operations in the CBD.
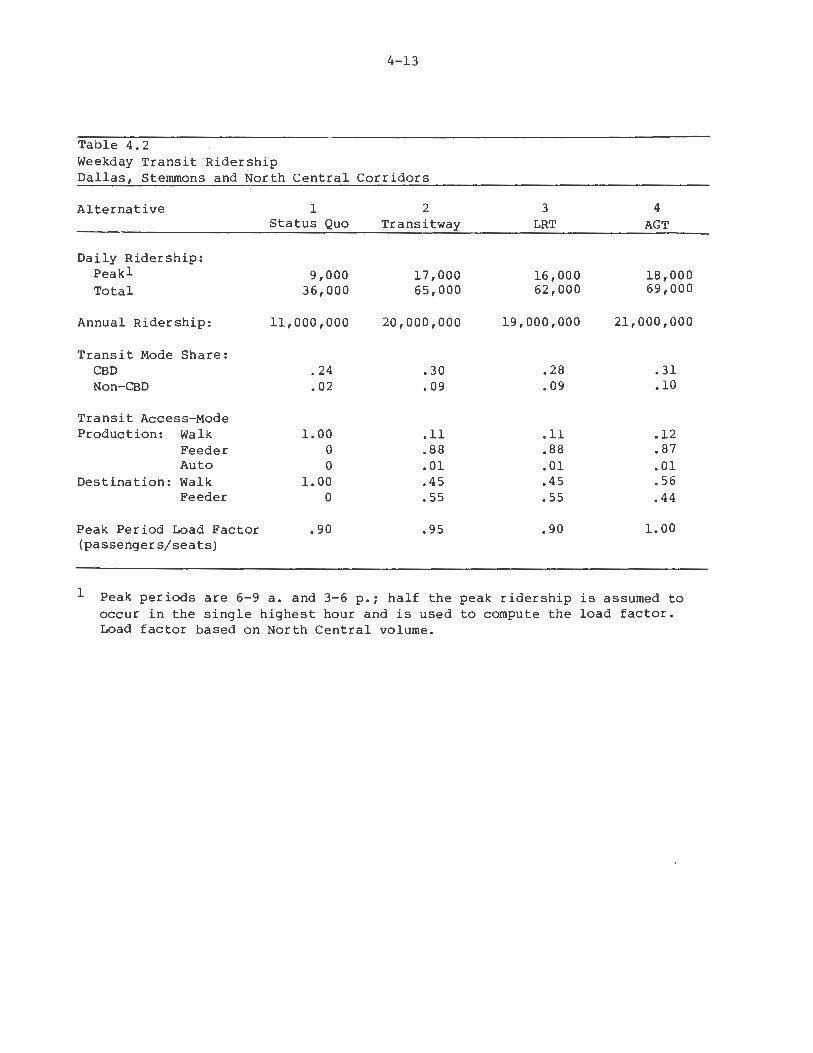
4-13
Table 4.2 Weekday Transit Ridership Dallas, Stemmons and North Central Corridors
Alternative
Daily Ridership: Peakl Total
Annual Ridership:
Transit Mode Share: CBD Non-CBD
Transit Access-Mode Production: Walk
Feeder Auto
Destination: Walk Feeder
Peak Period Load Factor (passengers/seats)
l Status Quo
9 , 000 36,000
11,000,000
• 24 .02
1.00 0 0
1.00 0
.90
2 Transitway
17,000 65,000
20,000,000
.30
. 09
.11
.88
.01
.45
.55
.95
3 LRT
16,000 62,000
19,000,000
.28
.09
.11
.88
.01
.45
.55
.90
4 AGT
18,000 69,000
21,000,000
.31
.10
.12
.87
.01
.56
.44
1.00
l Peak periods are 6-9 a. and 3-6 p.; half the peak ridership is assumed to occur in the single highest hour and is used to compute the load factor. Load factor based on North Central volume.
4.1.4 COMMUNITY AND URBAN DESIGN IMPACT ISSUES
4-14
Figure 4.8 shows the network passenger loads for the LRT system; the other modes are very similar. The peak volume actually occurs outside the CBD, as the area north of the CBD is a major trip generator and attractor. About 4,000 peak period trips in the North Central corridor remain on local bus services that operate into the CBD directly. The Stemmons ridership , is relatively low, though it would be double that shown on weeks in which there were "markets" at the Market Center. None of these demand estimates include intra-CBD or activity center travel, which are discussed in following sections.
Table 4.3 summarizes the revenues and costs of the systems in 1978 dollars. AGT shows a modest operating and capital cost advantage over the other guideway modes.
The principal community and urban design issues in the corridors concern disruption/displacement, visual intrusion of a guideway structure, and joint development potential. However, the significance of these issues varies substantially between the corridors.
4.1.4.1 Stemmons Corridor
In general, the physical character of the Stemmons corridor tends to minimize the disruptive or intrusive effects of all the alternatives. A combination of very broad and open transportation rights-of-way and the lack of environmentally sensitive receptors, such as housing, aid in reducing the visual effect of elevated guideways.
The status quo alternative will have a minimal effect on the physical and community character of the study area.
The effects of guideway alternatives on the physical or community character of the study area would not be substantially greater than those associated with the status quo. The most significant effects of a fixed guideway alternative would be the increased congestion of local streets (in particular, Medical Center Drive) at the terminus of the line adjacent to the Medical Center Complex. Negative visual effects of an elevated guideway in the proposed alignment would be negligible due to the open character of much of the right-of-way and the large scale of the buildings in the Market Center that are adjacent to the guideway.

Figure 4.8 Dallas Corridors: Network Volumes
CBD
.i::,. I
f-' lJl
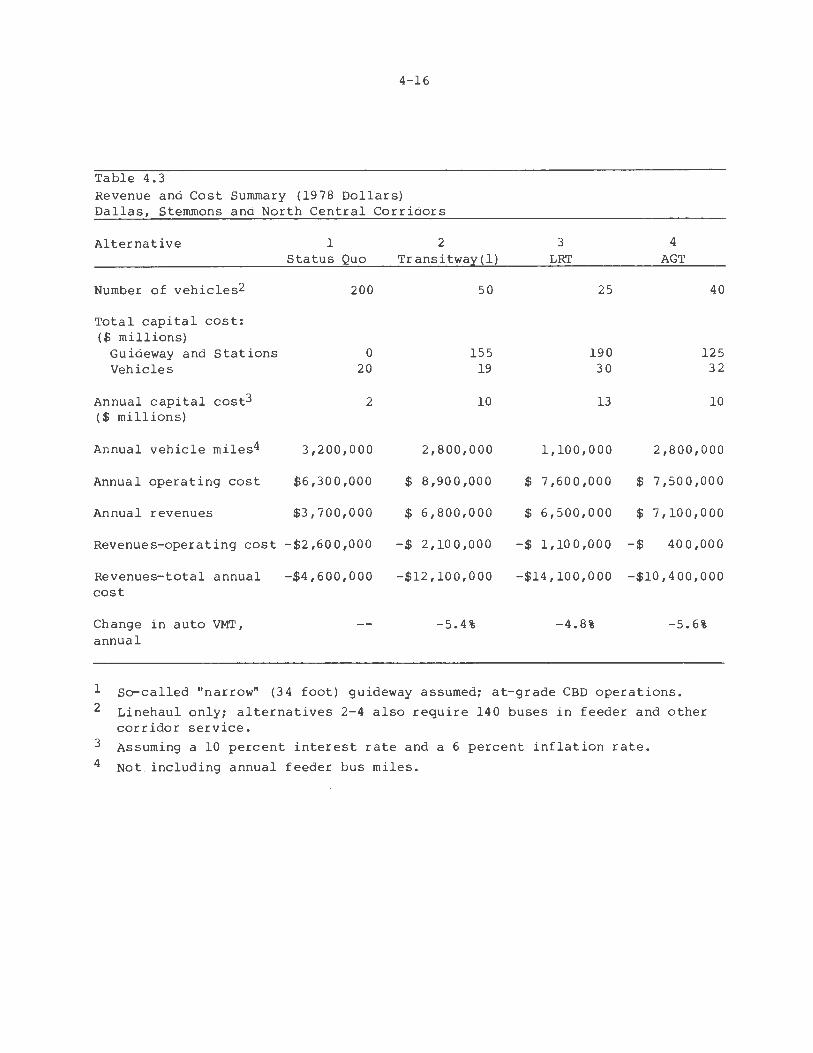
4-16
Table 4.3 Revenue and Cost Summary (1978 Dollars) Dallas, Stemmons and North Central Corridors
Alternative 1 2 Status Quo Transitwa;x:(l)
Number of vehicles2 200 50
Total capital cost: (li millions)
Guideway and Stations 0 155 Vehicles 20 19
Annual capital cost3 2 10 ( $ millions)
Annual vehicle miles4 3,200,000 2,800,000
Annual operating cost $6,300,000 $ 8,900,000
Annual revenues $3,700,000 $ 6,800,000
Revenues-operating cost -$2 ,60 0 ,000 -$ 2,100,000
3 4 LRT AGT
25 40
190 125 30 32
13 10
1,100,000 2,800,000
$ 7,600,000 $ 7,500,000
$ 6,500,000 $ 7,100,000
-$ 1,100,000 -$ 400,000
Revenues-total annual -$4,600,000 -$12,100,000 -$14,100,000 -$10,400,000 cost
Change in auto VMT, -5.4% -4.8% -5.6% annual
1
2
3
4
So-called "narrow" (34 foot) guideway assumed; at-grade CBD operations.
Linehaul only; alternatives 2-4 also require 140 buses in feeder and other corridor service. Assuming a 10 percent interest rate and a 6 percent inflation rate.
Not including annual feeder bus miles.

4-17
The AGT alternative alignment, like that of the transitway and LRT alternatives, is located on the railroad right-of-way in the corridor. That alignment minimizes the potential visual effects of the guideway, as well as the disruptive influences of construction and pedestrian and vehicular congestion in the station areas.
However, by locating the guideway transit stations in railroad rights-of-way, they are less accessible to the major activity centers such as the Market Center and Medical Center Complex than a bus system. Since the guideway passes through many isolated areas along the corridor, the user may feel less secure on an AGT system than on a manned system.
The AGT system may well present opportunities for joint development in the corridor, especially in the Market Center area. Land now required for parking might be used for expansion of the Center in conjunction with new stations. The other systems (especially LRT) are less flexible and attractive in this sort of application.
4.1.4.2 North Central Corridor
The four alternatives examined in the North Central corridor--the status quo, transitway, LRT, and AGT-have measurably different effects on the physical and community character of the study area. The status quo alternative results in no direct physical change in the character of the area. Indirectly, however, it contributes to increased traffic congestion on both the North Central Expressway and major arterials. This increased congestion will ultimately tend to lessen the visual quality and character of the area, especially the major arterials.
The transitway, LRT, and AGT guideways will have essentially the same visual effects when the guideway profile is elevated, as it is for much of the corridor. Since the guideway is located in the expressway right-of-way, the principal visual effect of the guideway will occur at locations where the guideway/ stations will block vistas on intersecting streets such as University Boulevard, Mockingbird Lane, and Haskell Avenue. In this southern section of the alignment, the elevated guideway may be visually incompatible with a multi-family residential complex in the vicinity of the Hall Street intersection with the expressway.

4-18
A significant difference in the effect of the three fixed guideway alternatives south of Mockingbird Lane is in the area of personal security. Since a transit system user's perception of security is linked, in part, to the presence of other people and activities and significant sections of the alignment between Mockingbird Lane and Byron tend to be isolated from activity during the evening hours, an unmanned system, such as the AGT alternative, may present more security problems than the transitway or LRT system alternatives. All alternatives may present some concerns, however.
The effects of all the fixed guideway alternatives on development are likely to be similar. Much of the North Central Expressway alignment, especially south of Mockingbird Lane, is already developed. However, significant development opportunities still exist at key intersections such as Haskell and Henderson Avenues. AGT and LRT, due to their lower noise and emissions and better overall image, may spur joint development more than transitway.
At the point where the transitway, LRT, and AGT alignments leave the North Central Expressway and follow the railroad right-ofway, the visual effects of the three alternatives will vary. Both the transitway and AGT guideways are elevated along this right-of-way and will affect vistas and the visual character of major arterials such as Mockingbird and Lovers Lane and University and Yale Boulevards. Both Mockingbird and Lovers Lanes appear to be likely station locations as well, and the lack of undeveloped land at these locations makes access-related congestion (principally vehicular) a significant effect of these systems. The LRT system is likely to pose similar congestion problems, but will have a less significant visual effect on the area due to its grade level profile.
Another significant visual effect of all the fixed guideways on the rail right-of-way occurs between Daniels and Caruth Haven Lane. The rail right-of-way (which is approximately 40-50 feet in width) is particularly close to small scale commercial development along Greenville Avenue and the frontage road of the North Central Expressway. The visual effect of this proximity, especially for the elevated busway and AGT guideways, is one of a very tight fit and incompatible scale relationship between the guideway and existing development. The grade level LRT system appears to be the more visually compatible with the alternative in this area.
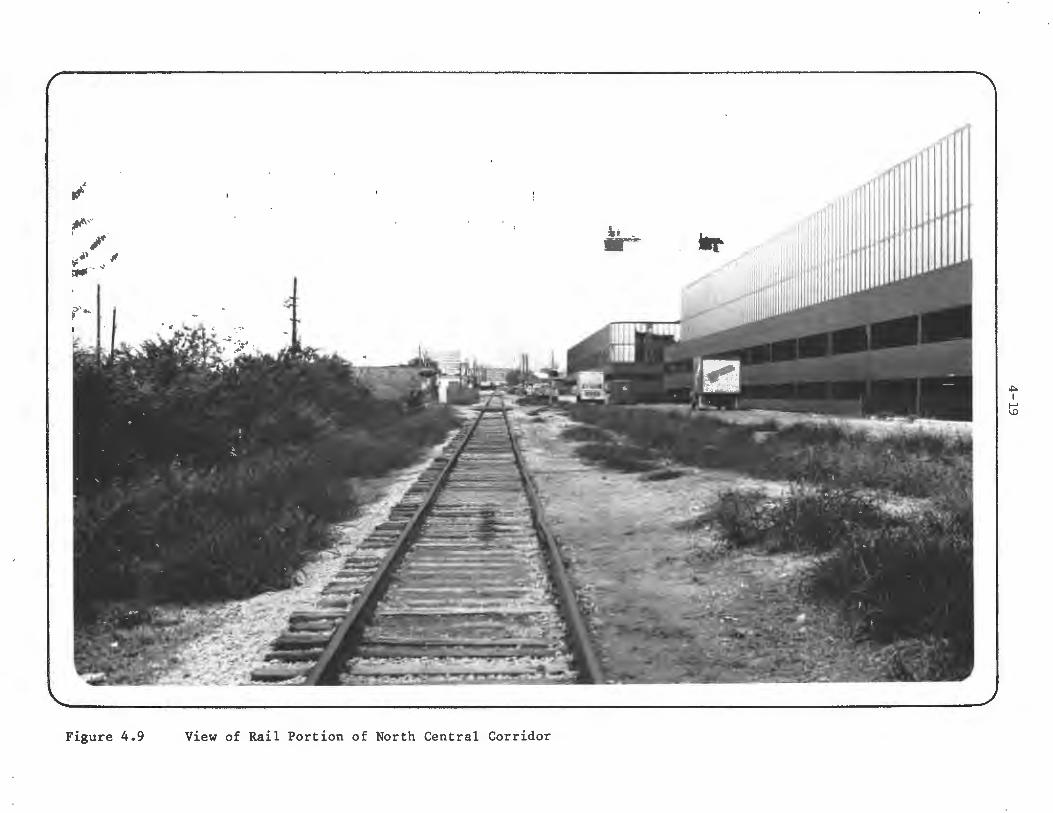
,,: {ii!,''' • ,~ ~•' " t.'fll" -. ,,
r'"·
Figure 4.9 View of Rail Portion of North Central Corridor
. -IU _
Ir"""'
,.,. I
f-' \.D

Figure 4.10
-,..._. ~
;. •
j • ,.
View of North Central Expressway
REPV8UC '-ATIOftA
~ I
I\.)
0
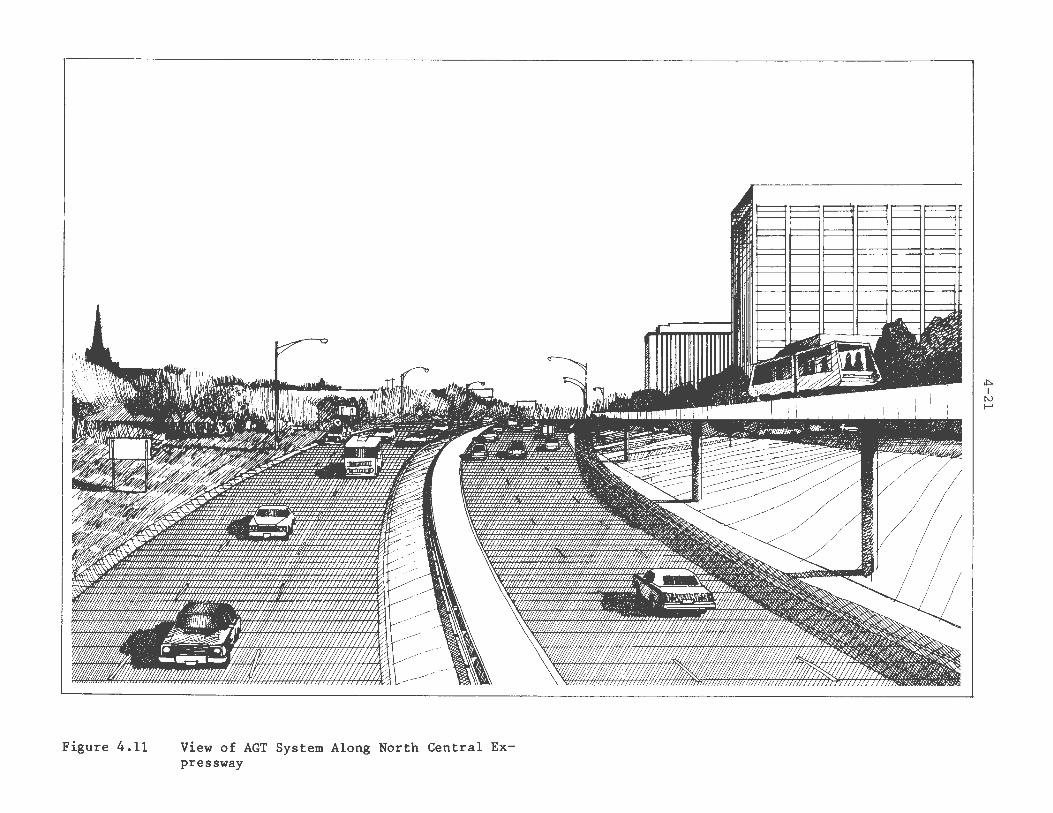
Figure 4.11 View of AGT System Along North Central Expressway
.i,. I
tv I--'
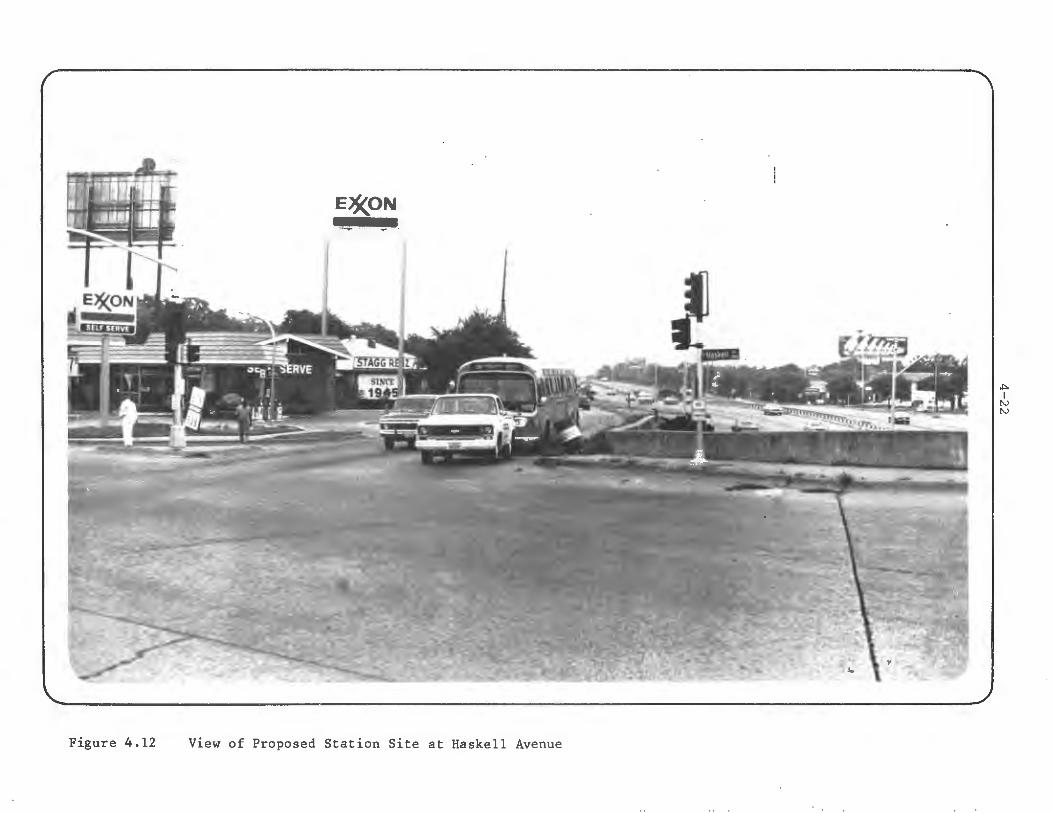
E)f(ON ...... ~~/
Figure 4 .12 View of Proposed Station Site at Haskell Avenue
,i::,. I
I\.) I\.)
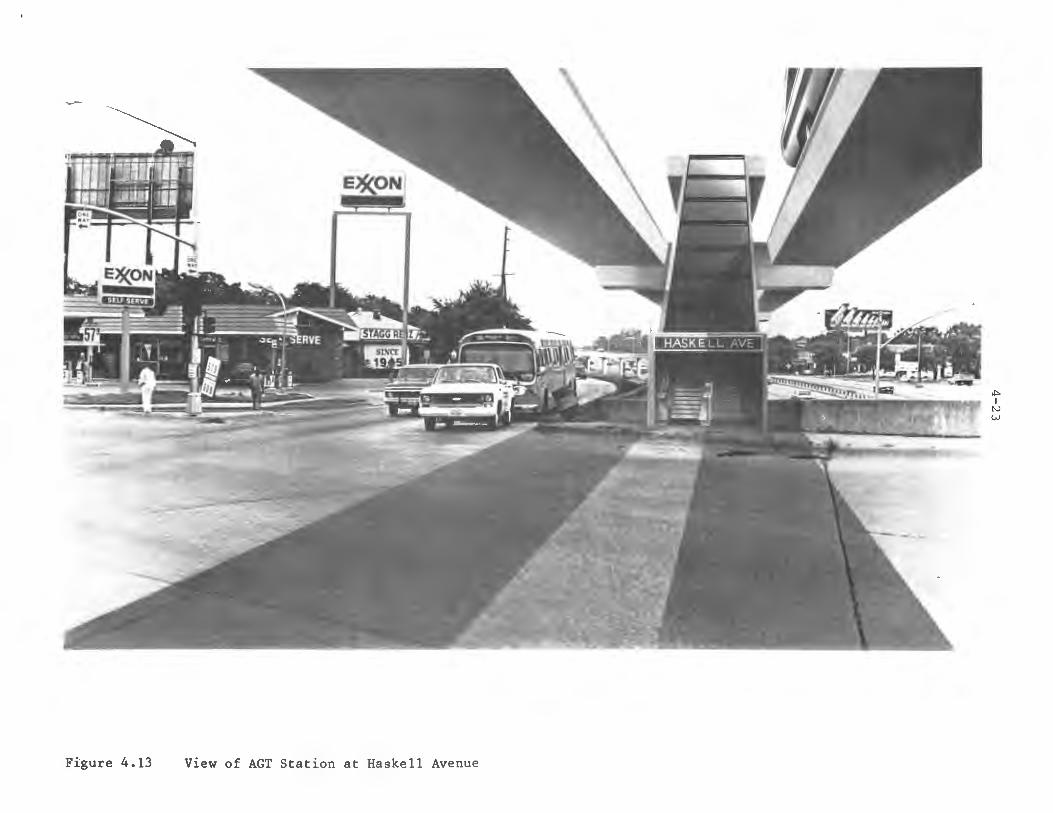
'eXl'oN'
Figure 4.13 View of AGT Station at Haskell Avenue
""' I tv w
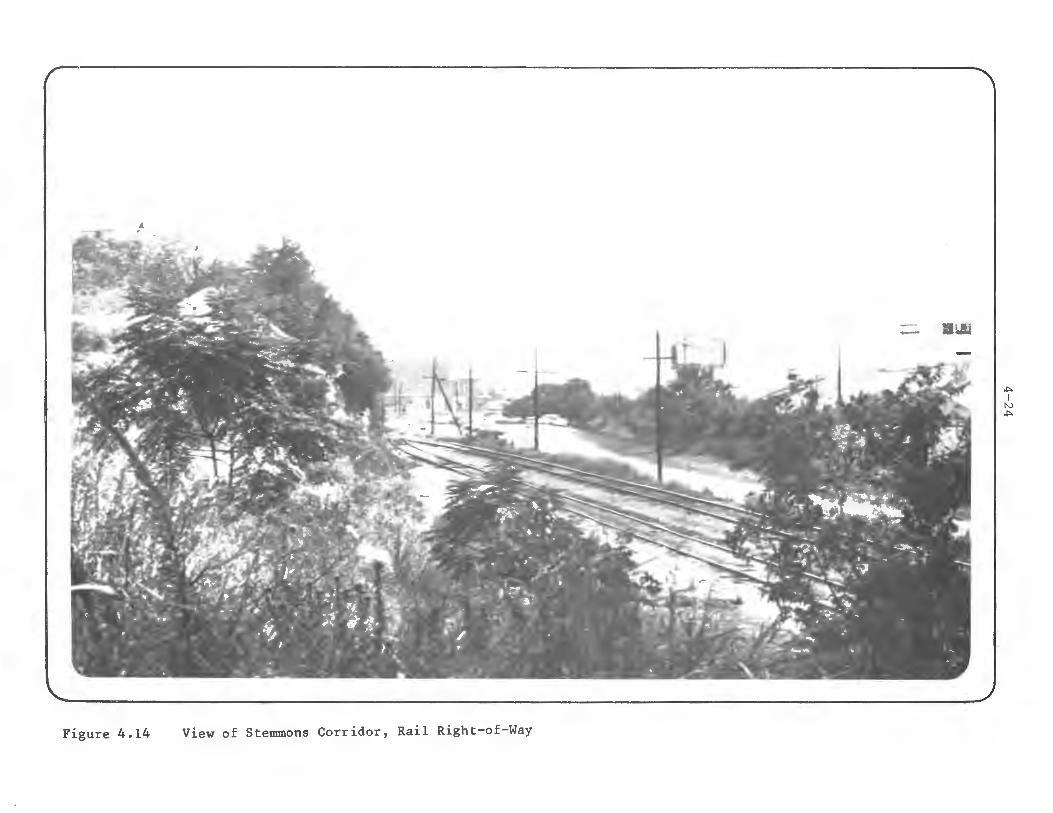
Figure 4.14 View of Stemmons Corridor, Rail Right-of-Way
""' I N
""'
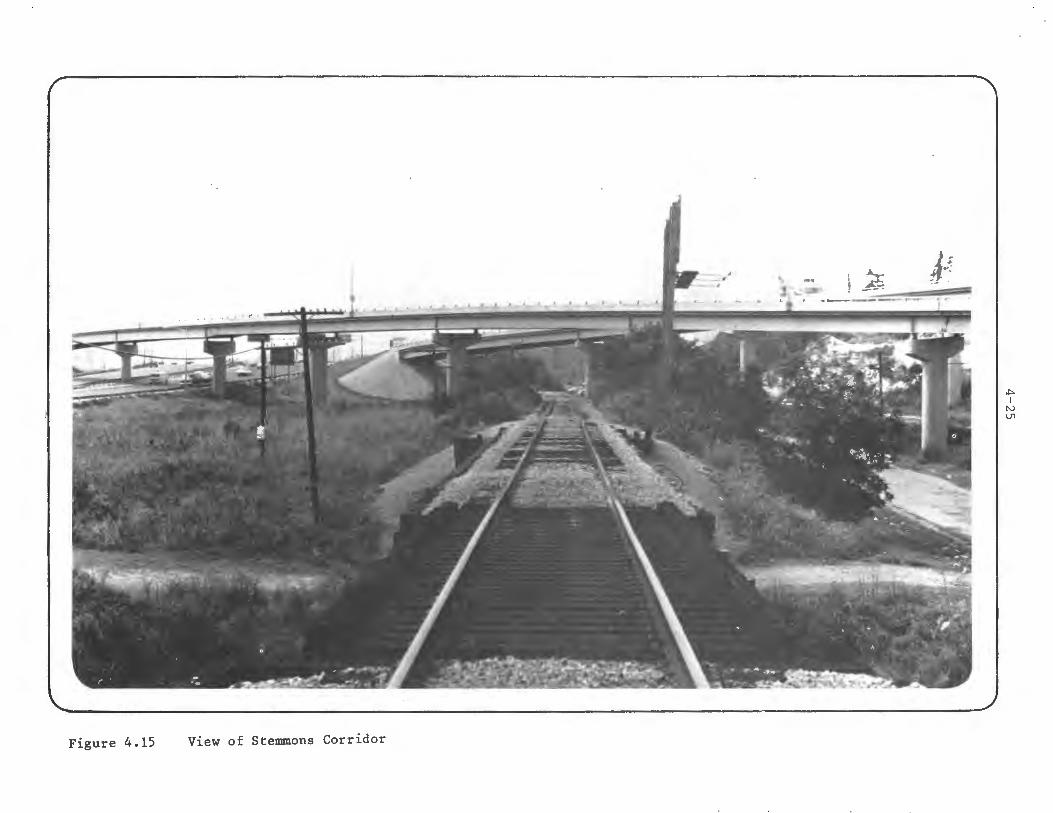
..
Figure 4.15 View of Ste1IDnons Corridor
~
.i,, I
N lJ1
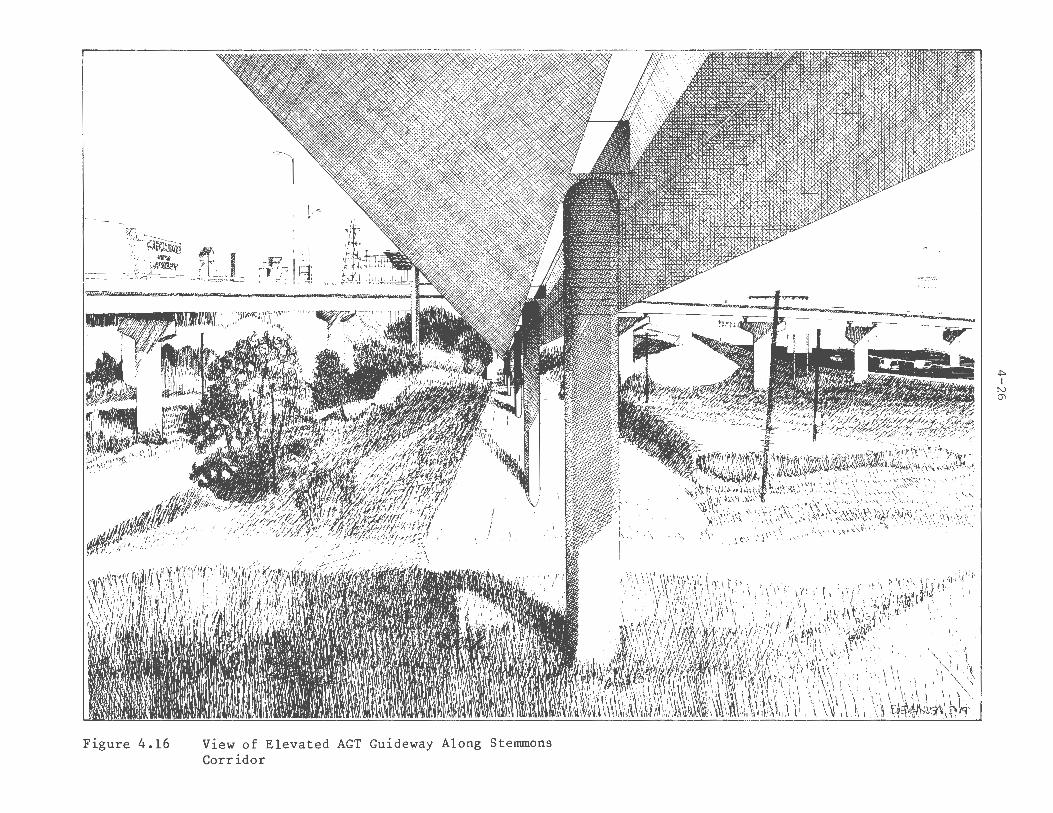
~
Figure 4.16
. l ~' l View.of E 1 e vat e d A . · ··-"" ,..,nm 11\l!Ll~\l]IJ 11!.:!~\\8\i\'i\~\ \ !,ti'} )\I I \ ';, \ \\ \ \ ' 1
~'\~: •:·~ '., i i '. ' ~{' emmons ' 11 , , • . , Corridor GT Gu1.deway Along St \,,\1\ill,.\-'il ,,1 \ \~ \\\\ I ' I \l\h \
~ I
N O"I
4.1.5 INSTITUTIONAL ISSUES
4-27
The AGT alternative (and other elevated guideway alternatives) is most acceptable in terms of its effects on the physical and community character of the North Central corridor between Lemmon Avenue and its entry to the rail right-of-way. In this portion of the alignment, the visual effects of the guideway are minimal, although the cost of contructing an elevated guideway in the expressway right-of-way will be substantial.
The AGT system will create a number of joint development opportunities throughout the corridor. Noticeable among these are undeveloped land in the vicinity of Haskell Avenue, redevelopment potentials north of Lovers Lane that span the right-of-way between the expressway frontage road and Greenville Avenue and a linkage to Southern Methodist University at Mockingbird Lane. The previously noted visual effects of the guideway and station in the vicinity of Lovers Lane could, in fact, be mitigated through joint development.
As indicated earlier, the other major effect of the AGT system will occur in the area of personal security. The security problem would probably be least significant in the northern part of the alignment where the system would be more visible to existing activity centers. It is more likely to be perceived as a problem in the expressway alignment where the system is more isolated from activity centers and local neighborhood surveillance.
4.1.5.1 Setting
Transportation responsibilities within the North Central and Stemmons corridors are shared by municipal, regional, and state agencies. The study portions of these two corridors are within the City of Dallas. The Office of Transportation Programs is the unit within the City which is responsible for coordinating all of the transit-related activities performed by the various city departments. This Office is responsible to the City Manager who is an official appointed by the publically elected City Council. In addition to providing internal coordination, the Office of Transportation Programs serves as the city's liaison with other agencies performing related transportation activities. The City of Dallas is the designated recipient for UMI'A Section 5 funds for the entire Dallas area.

4-28
Public transit service in the City of Dallas is provided by the Dallas Transit System (DTS) which is a city owned crganization. The management board of DTS consists of citizens appointed by the Dallas City Council. All decisions made by the DTS Board must be approved by the City Council before they can be implemented. The City of Dallas provides the local share of the DTS' operating deficit, subject to a maximum deficit constraint imposed by the Council.
There is no regional transit agency currently in existence; however, the creation of a Regional 'l'ransportation Authority (RTA) to serve the Dallas-Fort Worth area has been proposed. The enabling legislation to create an RTA for this area was passed by the Texas Legislature during the 1979 session and will be presented to local voters for their decision in 1980. The RTA would be funded by a "limited" sales tax that would apply to all residents of those cities included in the RTA service area.l If the RTA were established, it has been proposed that DTS operations be taken over by the RTA so that this would no longer be a city responsibility or financial obligation.
In addition to providing the authorization for RTA enabling legislation, the state has several other prominent roles in local transportation activities. The state Department of Highways and Public Transportation has responsibility for all state highway projects and improvements which includes both the North Central Expressway and the Stemmons Freeway. Legally, this Department can undertake projects not using Federal funds on their facilities without the concurrence of the affected local jurisdiction. However, as a practical matter, this is not likely to occur for state projects within the City of Dallas boundaries since extensive local cooperation is likely to be required.
The state also provides the major portion of the local funding required on all UMl'A grant awards under the Section 3 Capital Grants Program. Of the 20 percent required local share, the state provides 65 percent (contingent upon a firm commitment from the federal government) and the localities provide the remaining 35 percent. It is through bonding authorizations that the City of Dallas would generate its share.
lA "limited" sales tax excludes necessity items (e.g., food, housing and medicine) and does not apply to items subject to special sales taxes (e.g., gasoline, automobiles, tobacco products).
4-29
The agency responsible for all regional transportation activities is the North Central Texas Council of Governments (NCTCOG). NCTCOG is the state designated Metropolitan Planning Organization for the Dallas/Fort
Worth urbanized area. It is also the A-95 review agency and the designated recipient for UMI'A Section 9 planning funds. NCTCOG assumes a much larger role in regional transportation planning activities than is typical of most MPO's in the country. The Regional Transportation Council (RI'C) of NCTCOG is the committee responsible for all transportation policy decisions within the agency. The council consists of 21 members, most of whom are elected officials from the member jurisdiction within NCTCOG. The RI'C is assisted by three technical transportation committees which are made up of agency staff.
4.1.5.2 Key Issues
The city and private sector representatives had similar opinions about those issues affecting AGT imple-mentatin and in particular about the factors affecting the choice between AGT, LRT or transitway. Local representatives did not identify any factors that would preclude the implementation of AGT.
In general, it was felt that any of the transit alternatives considered would be desirable and no strong preference for any one particular alternative emerged. It was noted that the AGT alternative performed better with respect to certain issues such as economic development potential and cost. However, the favorable attributes in these areas had to be compared to those areas where AGT did not rate as favorably as the other alternatives. In particular, it was noted that the visual impacts and urban design compatibility of any elevated system would be likely to present problems in some areas. Also, issues of personal security were significant. While this applied to all of the alternatives, it was of slightly more concern for the AGT alternative. These issues are further discussed below.
The city representatives stated that the need for transit service in the North Central and Sternrnons corridors has been documented by recent regional studies.l
½wo such studies are the Total Transportation Plan for the North Central Texas Region for 1990 and the Dallas Area Transit Plan.
4-30
Consistent with the recommendations of these studies, the City Council adopted the transitway (transit facilities with exclusive rights-of-way) concept for the region in May, 1978. This concept received the endorsement of the City's voters when they approved a bond issue of $4.9 million to construct a transitway in the North Central Expressway Corridor as the first stage of regional transitway development. Based on projected transit demand estimates, the North Central Corridor is the corridor of highest priority for transit implementation.
The Stemmons Corridor is not currently proposed as the second corridor for transit development since the projected need is less than that in at least one other corridor. However, city representatives noted that this decision could be influenced by the willingness of the private sector to initiate new development projects in the corridor that could be served by the transit system. In particular, the opportunities and willingness of the private sector to engage in joint development projects with the City was viewed as a major factor influencing the City's selection of a second corridor for transit implementation. Representatives from the Market Center did express a strong interest in having the Stemmons Corridor receive priority consideration and appeared willingly to work with the City to have this occur.
From the perspective of the ability of the systems to accommodate the projected demand, the City representatives felt that each of the systems could serve the need adequately. The only possible exception would occur in the CBD component of the regional system if either a bus or LRT system was chosen and cost considerations necessitated at grade rather than an underground alignment. Even if adequate capacity did exist, they noted that the affected merchants would be likely to oppose such a strategy based on their opposition to an earlier Main Street transit mall proposal. Whether other east/west streets would be an acceptable alternative would depend on both merchant reaction and the effect that using streets farther away from the core areas of the CBD would have on system ridership. If an underground alignment is not feasible in the CBD, the AGT alternative was perceived to have the greatest potential in this area.
In viewing the demands projected for each of the systems, both City and Dallas Chamber of Commerce representatives suggested that the peak hour 1990 ridership
4-31
projections appeared to be low for each of the alternatives. This is due mostly to the short length of guideways considered in this study, as opposed to more extensive systems studied locally. If in fact higher ridership during peak hours could be expected, this could exacerbate the problems for the at-grade solution of regional trips through the CBD.
Another issue related to the performance and level of service provided by each of the systems, was the capability of the regional system to serve the major activity centers along the corridor. If separate internal circulation systems are planned at either North Park or the Market Center, maximum integration between the two systems was considered to be desirable according to both city and the affected private sector representatives.
It was felt that the transit alternative that can best provide regional services and also provide direct services to or within the activity centers is the AGT system. The LRT alternative, because it is not flexible enough to provide activity center service, and the busway, because of its massive (34 foot wide) guideway, are not compatible with the scale of activity center development and were not viewed as favorably.
City representatives did not feel that actually routing the regional system into the activity centers except along the periphery was a good idea. They felt that it would reduce the level of service for those passengers not having an activity center destination and could suggest too much effort being directed towards a specific segment of the corridor at the expense of overall regional considerations. This was acceptable to North Park representatives since they desired that their system be operated independently of regional operations. It was still felt, though, that a sharing of facilities common to both systems such as parking facilities and stations was desirable.
The Market Center representative, in contrast to the North park representatives, expressed an interest in being more directly served by the regional system. He noted that if the regional system was routed along the rail right-of-way along the edge of the Market Center, then because of the distances between the rail ROW and specific areas of the market Center the regional system would not provide adequate services to several
4-32
areas in the Center. If the regional system were diverted from the rail right-of-way in this area (which it appeared that the City representatives might consider due to the minimal disruption that would occur to the overall regional level of service), it was the opinion of both City and Market Center representatives that the AGT alternative would be most feasible for this. It was not felt that either the LRT or transitway alternatives would provide a high enough level of service for the Market Center area, and the visual impacts were considered to be more severe.
In general, city representatives stated that with respect to serving activity centers by the regional system, the objective would be to provide as high a level of service as possible without sacrificing regional services. This objective is consistent with adopted regional plans to develop a multinucleated area with suburban nodes of multipurpose centers.
The potential for any of the transit alternatives to encourage further development along these corridors was viewed positively by the city representatives. The city would welcome new development to broaden their tax base. However, it was not felt that any of the alternatives had a large advantage in this regard. Since the AGT alternative was preferred by the North Park and Market Center representatives, this may suggest that it is most likely to encourage development.
Several opportunities for joint development were identified by the City and North Park, Market Center, and CBD representatives for each of their respective areas. The major opportunities in both the North Park and Market Center areas were the joint development of stations and parking areas that could serve both regional and activity center needs. One idea which was viewed very favorably by all concerned was the potential for the private sector to substitute peripheral parking for on-site parking. Internal transit services could then bring the fringe area parkers to their destination.
The idea of a parking substitution program would require a change in the existing city development codes. City representatives. appeared willing to consider the concept.

4-33
One parking related issue that was identified as a potential problem in the North Park area was the tendency for regional park and ride transit riders to occupy North Park parking spaces if not enough new spaces were provided by the city. This was not of concern at the Market Center.
City representatives felt the portion of the regional system which traverses the CBD connecting the Stemmons and North Central corridors could benefit existing businesses. However, they also were of the opinion that an elevated alignment would be unacceptable to the merchants in this area cue to its adverse visual impacts. The private sector representatives (although not from the affected area) agreed that major opposition to an AGT system along the major east/west streets through the CBD would preclude this alignment, at least initially.
From an aesthetic standpoint, it was felt that any system which traveled through the heart of the CBD could not be elevated and most likely could not be atgrade due to capacity and congestion problems. The two alternatives considered were a subway through the CBD or, if an elevated system were desired, then routing the system along the northern border of the CBD was perceived to be most feasible. Both the City and representative developers felt that an elevated system in this area could satisfy the regional needs of the system, would have the greatest opportunities for integration with the substantial new development that is both occurring and projected, and could provide an economic stimulus to this rapidly developing area.
One private developer who owns a significant amount of property in the northeastern area of the CBD was very receptive to this proposal. He was unable, however, to state which transit alternative would be preferable until he was more aware of the visual and economic impacts of each of the systems. The other private representatives and the city representatives felt that the more slender guideway of an AGT system relative to either LRT or transitway would have the greatest potential for integration with the development in this area.
While it was recognized that this northern alignment skirted the existing concentration of CBD activities, city and private representatives felt that it could
4-34
still adequately serve as the regional leg of a CBD system and would avoid the many problems of attempting to make an elevated system compatible with the existing development, which was perceived to be extremely difficult.
They also felt that any system must be built in stages. The regional system outlined above was considered to be a desirable framework to which future increments could be added in the CBD. The city representatives felt that the northern alignment would test the potential for future expansion into the CBD. If it proved to support and enhance the economic activity in that area, then it was felt that the merchants and developers in other parts of the CBD would be receptive to expanding the system to their areas. All of the local representatives agreed that demonstrated experience on a limited, uncontroversial first segment would be the best method for gaining the acceptance of other CBD interests.
Visual problems were also perceived to be a major issue in the North Central Corridor. The problem was considered most severe in the southern segment of the corridor nearest to the CBD, where the heaviest residential concentration exists. Residents of the area had opposed locating the transitway in the rail rightof-way and desired that it be located along the expressway where it wduld be further removed from the residential areas. The citizens' bonding approval was conditional upon locating the system along the expressway if at all feasible. The City Council passed a resolution which supported the citizens' requests. In this southern segment therefore, any system built would be located within the expressway. '!be city representatives were of the opinion that the visual effects of an AGT, bus or LRT system would be similar.
In the northern part of the corridor, the current proposed routing is to locate the system within the rail right-of-way. Because of the elevated guideways that would be required for the AGT and perhaps the other systems, the visual impacts are perceived to be more severe than for a system which can operate at-grade. However, because the residential development in this area is not as intense as in the southern segment, this is not considered to be a major problem. (From the standpoint of serving the greatest number of people, the City prefers to locate the system in the rail right-of-way rather than along the expressway whenever possible.)

4-3 5
There is currently a proposal by the State Department of Highways and Public Transportation to doubledeck the North Central Expressway with one lane reserved in each direction for a transitway. If this were constructed, city representatives acknowledged that the massive nature of this construction would minimize in a relative sense the visual impacts of an elevated system along the doubledecked portion of the expressway.
The visual impacts of an elevated guideway system in the Sternmons Corridor was considered to be much less of an issue than in either the CBD or the North Central Corridor. This reflects the fact that the rail right-of-way in which the system would be located is large and open and with only minor exceptions, is located away from any sensitive areas.
Potential problems associated with an AGT system were also identified in the area of personal security. The major problem areas were in and around the CBD, and those areas along the corridors which were more isolated from major activity, most notably along the Sternmons Corridor. The problems were considered to be most severe in the evening hours after the daytime population left the CBD, and when much less activity could be expected along the system.
It was noted by city representatives that security problems existed for either AGT, LRT or transitway, however, due to the unmanned nature of an AGT system, at least the perceived risks were considered to be greater for AGT. City representatives did not feel that this issue would adversely affect AGT consideration as long as adequate security provisions were planned for the system. Both technological aids and security personnel would be required.
In other respects, local officials felt that the AGT technology was compatible with the region's long range plans. City representatives noted that the bus transitway currently being considered for the North Central Corridor is designed to be upgraded to accommodate other technologies as may be appropriate. In light of this, the representatives were very receptive to the consideration of an AGT system for the future, if not the initial segment of the transitway system.
Private sector representatives felt that particularly in the CBD area, merchants and developers might have
4-36
reservations about this system because of an unfamiliarly with the AGT technology. The lack of any examples of AGT deployments in urban environments was considered to be an obstacle to alleviating this concern. One strategy that might be acceptable, which is consistent with the city's plans, would be to begin construction of the system in the northern part of the North Central Corridor and build towards the CBD. In this way, the segment to the CBD would be operational prior to actual construction in the CBD.
There are no labor problems that are expected to occur as a result of AGT implementation. The planned regional service in these corridors significantly upgrades existing transit services rather than substitutes for these services. Although some bus routes may be rerouted to other areas, no overall bus reductions are likely.
The City representatives noted that the Dallas Transit System which is the only public transit operator in Dallas would be the logical agency to operate a regional AGT system in conjunction with their bus operations. They would also operate either the LRT or transitway should one of those systems be implemented. (If DTS were taken over by a regional transportation authority, then this authority would probably assume the operating responsibility.)
Other institutional issues which relate to the planning for the selected system are likely to positively affect the choices of system implementation. The close working relationship between the City and NCTCOG will facilitate planning efforts. In addition, the City also works in close cooperation with the private sector. City decisions reflect a strong sensitivity to private sector interests. Opportunities for joint development projects between the City and the private sector are viewed very favorably by both sectors.
City representatives felt that, in general, the capital costs for the proposed system were reasonable and were within the range that the City could fund as long as the traditional 13 percent state contribution and 80 percent federal contribution was available. It was noted that the one area where costs might present a problem was in the CBD if either the transitway or LRT system were selected and required subway construction.
4-37
An AGT system was considered to have cost advantages over either of the other systems: $157 million for an AGT versus $174 million for a transitway (which would be higher if at-grade distribution was not possible in the CBD) and $220 million for an LRT system. In addition, since it was felt by city, North Park and Market Center representatives that the opportunities for joint development would be somewhat more favorable if a regional AGT system were implemented, this could further reduce the costs which the City would have to incur.
It was noted that the state's contribution of 65 percent of the required 20 percent local share was a significant factor affecting the financial feasibility of any of the selected systems, as were plans to build the system on an incremental basis, thereby spreading out the costs over a longer period of time.
Another factor was cited by city representatives which could have a significant effect on the city's share of the system's costs. The proposed plans to doubledeck the North Central Expressway with the inclusion of a transitway is a state project. The state would finance the entire doubledecking including a major portion of the transitway. $150 million will be committed by the state to this project over the next twenty years if it is implemented. Since the current transitway plans are for a bus system, it is not known how receptive the state would be to an AGT system. However, if the state did assume a major portion of the system's costs in the North Central corridor, then it is possible that the local funds could be redirected to both the remaining part of the North Central Corridor and to another corridor, possibly the Stemmons Corridor, as funding permits.
On the other hand, it was acknowledged by city representatives that such a large state commitment by the state to this one project could have implications for the continued ability of the state to contribute 65 percent of the locally required 20 percent share to match UMl'A Section 3 grants on other transit projects.
In terms of each of the systems' operating costs, it was felt that in view of the projected revenues and the federal assistance that could be expected through the UMl'A s~ction 5 program, that these costs did not
4.1.6 SUMMARY
4-38
present a problem. The operating deficits for either AGT, LRT or transitway were projected to be comparable to the deficit of the status quo alternative. The AGT alternative due to its most favorable ratio of revenues to operating costs and revenues to total costs was considered to have a slight cost advantage according to city representatives.
In summary, an AGT system has a reasonable chance of being considered as the regional system although it does not have any major advantages over either LRT or transitway. The region's highest priority is in providing some form of high level transit service in the designated corridors and the preference for one specific technology is perceived to be of lesser importance.
4.2 CENTRAL BUSINESS DISTRICT
4 .2 .1 SITE CHARACTE RI STI CS
4-39
The Dallas Central Business District (CBD) is defined, in the broadest sense, by a freeway loop that encompasses over 900 acres. However, the most highly developed and active part of the CBD--which stretches along an east-west axis formed by Main and Elm Streets and a north-south axis defined by Akard Street--covers an area of about 200 acres. The CBD is shown in Figures 4.4-4.7, as well as in Figures 4.18 and 4.20.
Land use in the CBD is similar to that in many of the country's large, newer cities. Density of development raises dramatically within the area; principal uses are office, retail, and governmental; residential development is minimal; much of the development has occurred within the last twenty years; and the street system is quite regular in layout and generous in right-of-way width.
Clearly, office buildings are the dominant activity in the Dallas CBD. over 20 million square feet of space are located in the area, an increase of more than 33 percent since 1970. Employment in the CBD, most of it office related, is 120,000. While office space is located throughout the CBD, it is generally concentrated in an area bounded by Griffin Street on the west, Pacific Avenue and Federal Street on the north, Harwood Street on the east, and Jackson Street on the south.
A second major activity in the CBD is government related. Municipal activities, notably City Hall and the new library now under construction, anchor the south section of the CBD. County facilities--both existing and planned--are a major land use in the western part of the CBD. Augmenting this public sector activity are the Dallas Memorial Auditorium and Convention Center near City Hall and an expanding El Centro Community College in the western part of the CBD. Convention activity brings an estimated 560,000 people per year to the CBD.
Supporting those basic activities are major retail and hotel facilities. The CBD contains over 3 1/2 million square feet of retail space and by 1980 will have over 5,000 hotel rooms.
Residential development is currently minimal in CBD, although work is now underway on the first residential complex at the east end of the CBD.
the major
This

4.2.2 ALTERNATIVES DESCRIPTION
4-40
and future residential development is key to making the CBD a 24 hour a day environment. Currently, the CBD is very active on weekdays during the daytime, but like many other cities, becomes deserted during the evening hours.
Much of the future development of the CBD is aimed at increasing night life in the area. Various alternatives for the development of a major cultural center or area in the northern part of the CBD are now being considered. The area is witnessing the beginning of building conversion activity (from vacancies and warehousing to restaurants and small retail shops) at the fringe of the CBD. Finally, there are a number of proposals under consideration for the construction of medium to large scale mixed use facilities that may attract people to an urban center living style. Much of the new development appears to focus on the northwestern and northeastern areas of the CBD.
A number of expressways provide excellent accessibility to the CBD. The distribution system to the CBD is also good. Streets are generally wide and have sufficient capacity to handle the distribution function. However, streets in some of the older sections of the downtown--such as Jackson and Wood Streets and sections of Akard and Envay Streets--are quite narrow and pose elevated guideway construction problems similar to those encountered in older, more densely developed eastern cities.
Figures 4.4 through 4.7 depict the guideway alignments examined in the CBD for the transitway, LRT, and AGT systems. Operating strategies, and provisions for intra-CBD travel are discussed in this section. All demand and cost estimates presented assume that the CBD system is "self-standing" and not integrated with a regional system. The demand for an integrated regional system would at least be the sum of the separate regional and internal trips.
The first important issue is whether at-grade CBD distribution for buses using initial transitways in the North Central and Stemmons corridors is feasible. Several options are possible. Given that adequate capacity does not appear to exist on major east-west streets currently used for transit, other parallel streetsl may be used. The drawback is that walk
lsuch as Young and Pacific, and possibly Griffin and Harwood if some routes are reoriented north-south.
4-41
distances to the core are increased, perhaps to an unacceptable level, as 79 percent of current riders report walking two blocks or less to the service. A second alternative is the use of a transitway tunnel for buses. There are problems with ventilation, station areas, construction of a larger tunnel than needed by a later evolutionary mode, and cost. A third alternative is the use of a DPM for a portion of the CBD distribution, with a fraction of buses (either transitway or non-transitway) terminating at a fringe DPM station; the issues related to this option are discussed below.
The LRT alternative has only a tunnel option. There is insufficient street space to accommodate the operation of a system incompatible with buses; thus an LRT/transit mall option is not fully analyzed.
There are three AGT alternatives for the CBD. The first is a single twerway elevated loop based on the Dallas DPM application. All regional and CBD vehicles would operate over this loop. The second is a modification of the elevated loop alignment which also includes a spur to the northern portion of the CBD which is an important development area. This spur would form the link to the North Central corridor if a regional AGT system were deployed; again all regional and CBD vehicles would operate over the loop. A third option is the use of the underground transitway or LR!' alignment for regional AGT vehicles, while retaining the CBD loop strictly for internal AGT circulation services.
Operation of all modal alternatives is simple, with the possible exception of the AGT systems in which regional routes use the downtown loop guideway. An operating concept for this is shown in Figure 4.17. The regional routes operate in different directions to equalize service. The directions were chosen so that the interchange required could be constructed at the beginning of the Sternmons line where right-of-way is available; a very simple track structure is used at the junction of the North Central line where there is little space. A loop service operates in both directions as well. During peak periods, regional vehicles operate every two to four minutes in each corridor, and loop vehicles operate on four minute headways. During off-peak periods, regional service is reduced, and loop service is increased to every 2 minutes to serve the flow pattern more effectively. The average speed in the CBD is near 15 mph.

Stemmons North Central
/
a. Regional and CBD Routes
Figure 4.17 Dallas CBD: AGT Operating Strategy
Loop (2-Way)
b. CBD Route with North Spur
North Spur
North Spur vehicles either operate the loop counterclockwise only, or only shuttle on the spur, requiring a transfer at the junction station.
~ I ~ N
4.2.3 DEW\ND AND cosr ISSUES
lEast-west route only.
4-43
The systems {LRT and bus) using the transitway alignment {Figure 4.4) are assumed to have a shuttle bus service on two CBD routes, one east-west and one north-south, each operating at six minute headways and an average speed of 6 mph.
This section will discuss intra-CBD travel issues first and then turn to some of the regional transit CBD alignment questions. Table 4.4 shows the results of applying the DPM Planning Manual models to the Dallas CBD. The first column shows the validation results which matched an internal daily pedestrian trip total of 100,000 and a shuttle bus ridership of approximately 2,700.1 The DPM models required only a slight (10 percent) downward adjustment of trip-making rates to replicate the Dallas data, and the distribution and mode choice predictions were quite close to the observed patterns.2
Shuttle bus and AGT ridership {for the Figure 4.7 alignment, which produces the maximum ridership) for 1990 are shown in the second and third columns. The 1990 land use and employment projections used are believed to be too high, with only 170,000 to 190,000 employees expected in the CBD. Ridership estimates should be scaled down proportionally to reflect this; the actual estimates probably correspond to the year 1995 or 2000.3 AGT ridership is approximately three times that of the shuttle bus. Internal worker trips are a large market for AGT, which induces extra trips relative to bus and encourages longer trips as well. Workers are also not as sensitive to travel time and cost as non-workers in the CBD, so they are more amenable to transit use. Non-workers are a relatively small proportion of CBD travelers, and also make little use of internal transit. Their high time sensitivity {especially walk time) makes them difficult to attract to AGT or bus.
2As pedestrian peaking data does not exist separately for workers and non-workers, a single expansion factor derived from Dallas data was used for both. This results in a slight overstatement of worker trips and a slight understatement of nonworker trips.
3It was not possible to scale down the estimates, since they were at a 49-zone level with wide variations in growth between zones.
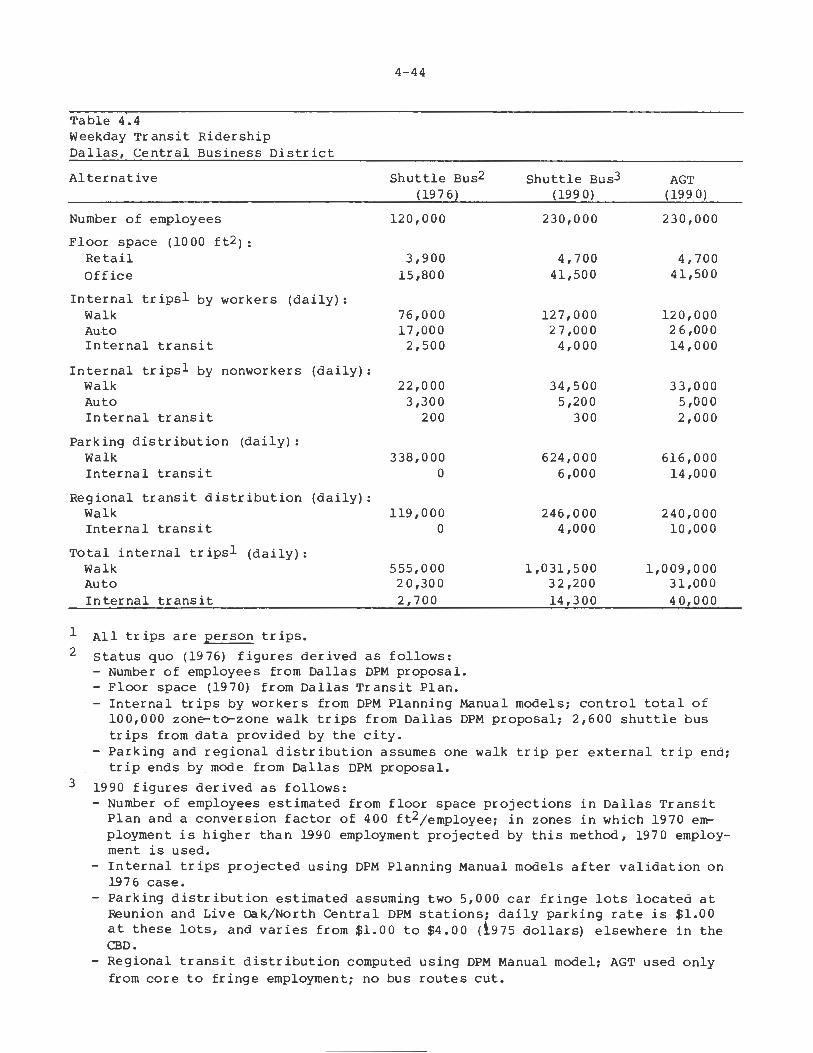
4-44
Table 4 .4 Weekday Transit Ridership Dallas, Central Business District
Alternative Shuttle Bus2 (197 6)
Shuttle Bus3 AGT (199 0) (199 0)
Number of employees
Floor space (1000 ft2):
120,000 230,000 230,000
Retail Office
3,900 15,800
4,700 41,500
4,700 41, so 0
Internal tripsl by workers (daily): Walk Au-to Internal transit
76,000 17,000
2,500
127,000 27,000
4,000
120,000 26,000 14,000
Internal tripsl by nonworkers (daily): Walk Auto Internal transit
22,000 3,300
200
34,500 5,200
300
33,000 5,000 2,000
Parking distribution (daily): Walk Internal transit
338,000 0
624,000 616,000 6,000 14,000
Regional transit distribution (daily): Walk Internal transit
119,000 0
246,000 240,000 4,000 10,000
Total internal tripsl (daily):
1
2
3
Walk Auto Internal transit
All trips are person trips.
555,000 20,300 2,700
status quo (1976) figures derived as follows: - Number of employees from Dallas DPM proposal. - Floor space (1970) from Dallas Transit Plan.
1,031,500 1,009,000 32,200 31,000 14,300 40,000
- Internal trips by workers from DPM Planning Manual models; control total of 100,000 zone-to-zone walk trips from Dallas DPM proposal; 2,600 shuttle bus trips from data provided by the city. Parking and regional distribution assumes one walk trip per external trip end; trip ends by mode from Dallas DPM proposal.
1990 figures derived as follows: - Number of employees estimated from floor space projections in Dallas Transit
Plan and a conversion factor of 400 ft2/employee; in zones in which 1970 employment is higher than 1990 employment projected by this method, 1970 employment is used. Internal trips projected using DPM Planning Manual models after validation on 1976 case.
- Parking distribution estimated assuming two 5,000 car fringe lots located at Reunion and Live oak/North Central DPM stations; daily parking rate is $1.00 at these lots, and varies from $1.00 to $4.00 (i975 dollars) elsewhere in the CBD.
- Regional transit distribution computed using DPM Manual model; AGT used only from core to fringe employment; no bus routes cut.
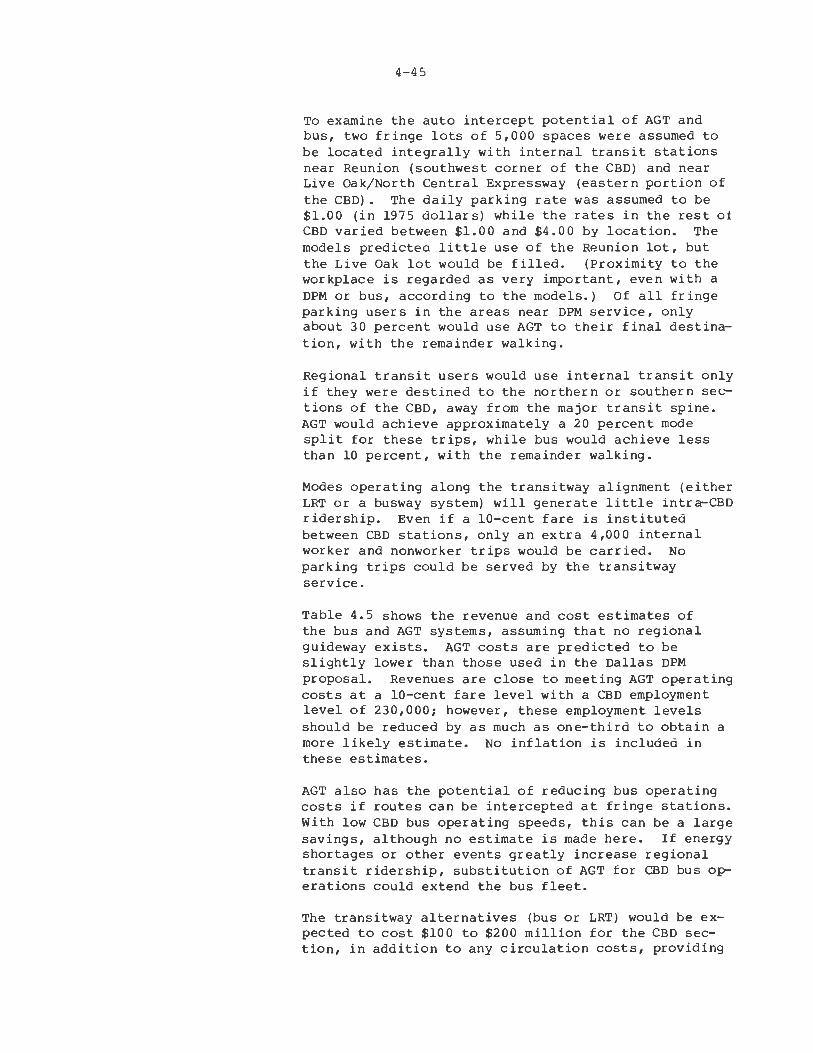
4-45
To examine the auto intercept potential of AGT and bus, two fringe lots of 5,000 spaces were assumed to be located integrally with internal transit stations near Reunion (southwest corner of the CBD) and near Live Oak/North Central Expressway (eastern portion of the CBD). The daily parking rate was assumed to be $1.00 (in 1975 dollars) while the rates in the rest of CBD varied between $1.00 and $4.00 by location. The models predicted little use of the RP.union lot, but the Live Oak lot would be filled. (Proximity to the workplace is regarded as very important, even with a DPM or bus, according to the models.) Of all fringe parking users in the areas near DPM service, only about 30 percent would use AGT to their final destination, with the remainder walking.
Regional transit users would use internal transit only if they were destined to the northern or southern sections of the CBD, away from the major transit spine. AGT would achieve approximately a 20 percent mode split for these trips, while bus would achieve less than 10 percent, with the remainder walking.
Modes operating along the transitway alignment (either LRT or a busway system) will generate little intra-CBD ridership. Even if a 10-cent fare is instituted between CBD stations, only an extra 4,000 internal worker and nonworker trips would be carried. No parking trips could be served by the transitway service.
Table 4.5 shows the revenue and cost estimates of the bus and AGT systems, assuming that no regional guideway exists. AGT costs are predicted to be slightly lower than those used in the Dallas DPM proposal. Revenues are close to meeting AGT operating costs at a 10-cent fare level with a CBD employment level of 230,000; however, these employment levels should be reduced by as much as one-third to obtain a more likely estimate. No inflation is included in these estimates.
AGT also has the potential of reducing bus operating costs if routes can be intercepted at fringe stations. With low CBD bus operating speeds, this can be a large savings, although no estimate is made here. If energy shortages or other events greatly increase regional transit ridership, substitution of AGT for CBD bus operations could extend the bus fleet.
The transitway alternatives (bus or LRT) would be expected to cost $100 to $200 million for the CBD section, in addition to any circulation costs, providing
4-46
Table 4.5 Revenue and Cost Summary (1978 dollars) Dallas, Central Business District
Alternative
Number of routes
Route length (mi.), two-way
Number of vehicles
Vehicle size (seats)
Peak period vehicle load factor (passengers/seats)
Total capital cost($ millions): Guideway Stations Vehicles
Annual capital costl
Annual vehicle-miles
Annual operating cost
Annual revenues3
Revenues-operating cost
Revenues-total annual cost
Shuttle Bus
2
2.6
10
50
1.00
0 0
l
$100,000
200,000
$500,0002
$300,Q00
-$200 ,000
-$300,000
AGT (with
3
2.7
14
50
1.00
30 11
7
North
$2 I 800 ,o 00
600,000
$1,000,000
$ 930,000
-$ 70,000
-$2,870,000
Change in CBD auto VMI', annual 200,000
Spur)
AGT assumed to be operating without a regional system; loop routes (one in each direction) operate at 2 minute headways with the North Spur also operating at a 2 minute headway as a shuttle only.
AGT and shuttle bus assumed to operate 12 hours per day, 310 days/year. If AGT operated longer hours, ridership and costs would be greater.
LRT would carry 4,000 internal CBD trips at a 10 cent fare, producing $12,000 in annual revenues at little incremental cost over that of regional service.
l
2
3
Assuming a 10 percent interest rate and a 6 percent inflation rate.
CBD per-mile cost assumed to be $2.50, or 50% greater than the system average.
10-cent fare, free transfer for regional transit users.
4.2.4 COMMUNITY AND URBAN DESIGN IMPACT ISSUES
4- 47
less coverage of the CBD but also with much less potential visual intrusion. AGT capacity on the CBD loop, with two-car trains of 50 passenger vehicles and one minute headways is 12,000 passengers per hour in both directions. While this is not sufficient if a full regional transit system is implemented, it appears from the corridor demand estimates that it is adequate for the initial corridors.
The transitway, LRT, and AGT system alternatives present distinctly different opportunities and problems in the CBD. Shuttle bus impacts are not discussed separately because they are expected to be minor.
The visual effects of the system are likely to be most significant for the AGT alternative due to its elevated guideway and stations. A current lack of CBD residential development mitigates some of these iITr pacts, compared to the Chicago North Michigan Avenue s i te.
Disruption of existing activities is either temporary or long term in duration and typically takes one of two forms--actual displacement of a building or activity or a modification in the way an activity occurs at the result of the new facility. In the CBD, all three alternatives are likely to cause significant disruptions to existing activities. As currently planned, none of the alternatives should result in any displacement of businesses, although further refinement of the alternatives might ultimately lead to minimal displacement for maintenance facilities, the develoi;rment of efficient vehicle turning radii , etc. The duration of generally similar construction impacts would be about the same for all three alternatives.
The user's perceived security on the three systems is also likely to vary. Since night time activity is currently uniformly low throughout the CBD, the entire area is likely to be perceived at about the same level of security. Three factors that will alter percei;rtions of security from system to system are the presence of an operator on the vehicle, proximity to street activity and ability to quickly exit to the street.
The three systems are all likely to influence future development patterns of the CBD to some degree. The AGT system, because it is the most far ranging in scope, will probably have the greatest positive effect on development and creates the most significant joint development opportunities throughout the CBD. The
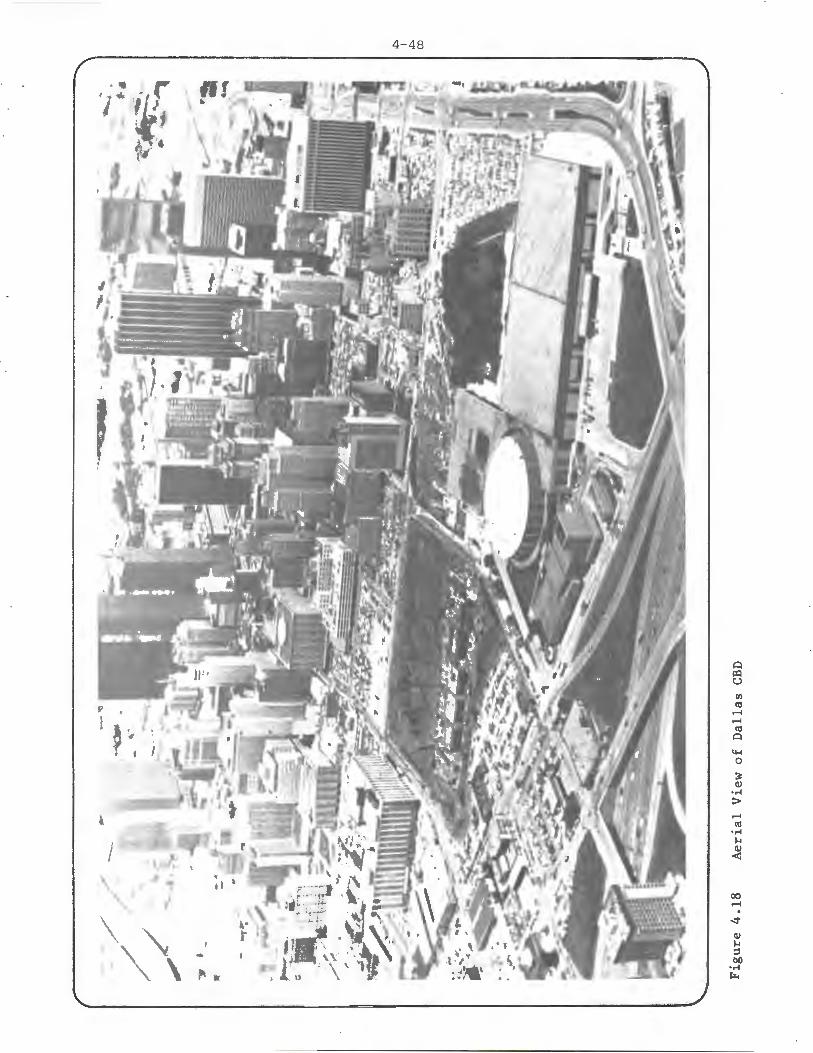
4-48
0 i:Q u Ill <II ..... ..... <II
0
~
0
:J Q)
•.-I
> .....
<II • .-I M Q)
<
• 00 ..... . ~
', ~ Q) M
~ .. ::,
• j, \ bO
"' " Ill
• .-I
' i::.

4-49
'
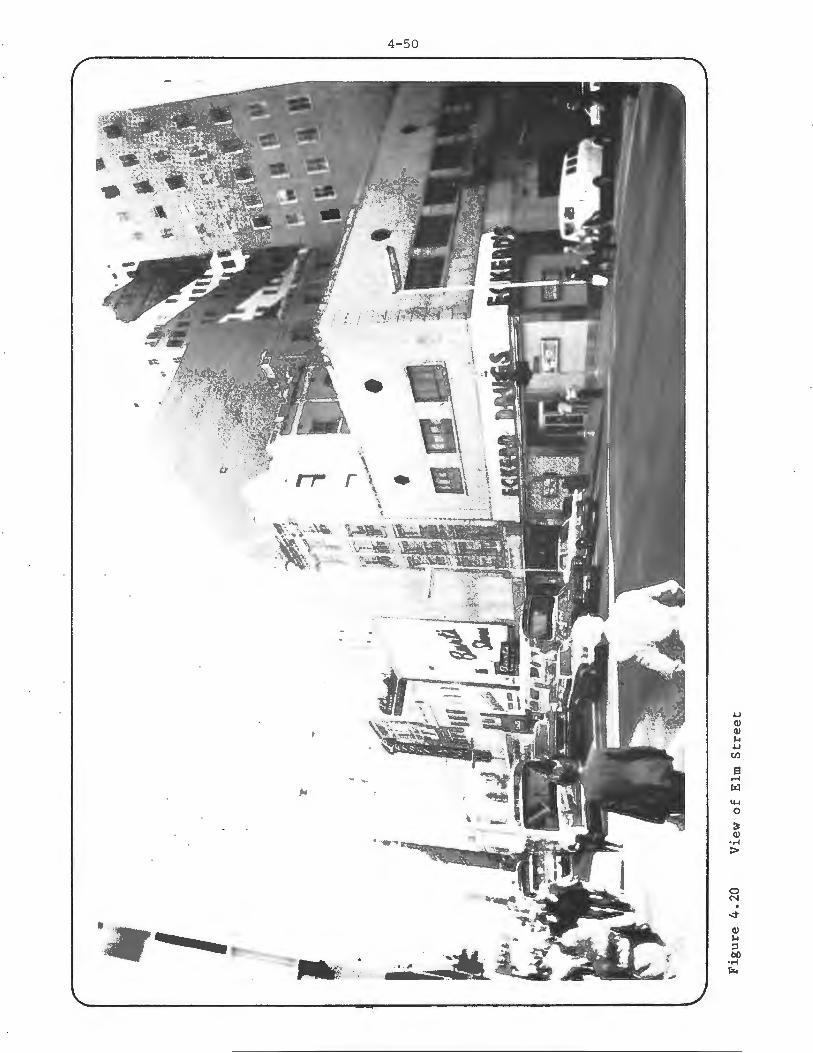
Ii -~ -~' ~
- a
4-50
0 N .

I> / /
~< /;
~
1_
1,
n ,-
i A . .t "' -" I~~ ~f;::.~ ~ I,~~ -., i> 1~:~ ~ '. ~) ~1Ti
: 1! :;::, •
,-
~ --
A~: -~-1-= r ': ~~ H ,1 r, i"r, Cc_lf
---!/--,L
(j I• p:.,1;..., I
k J I ~I , I
1 t. '
,]
Figure 4. 21 View of Elevated Elm Street
~ / r;
. i (V /
- □,--, _ , u
>1'> I
V1 I-'
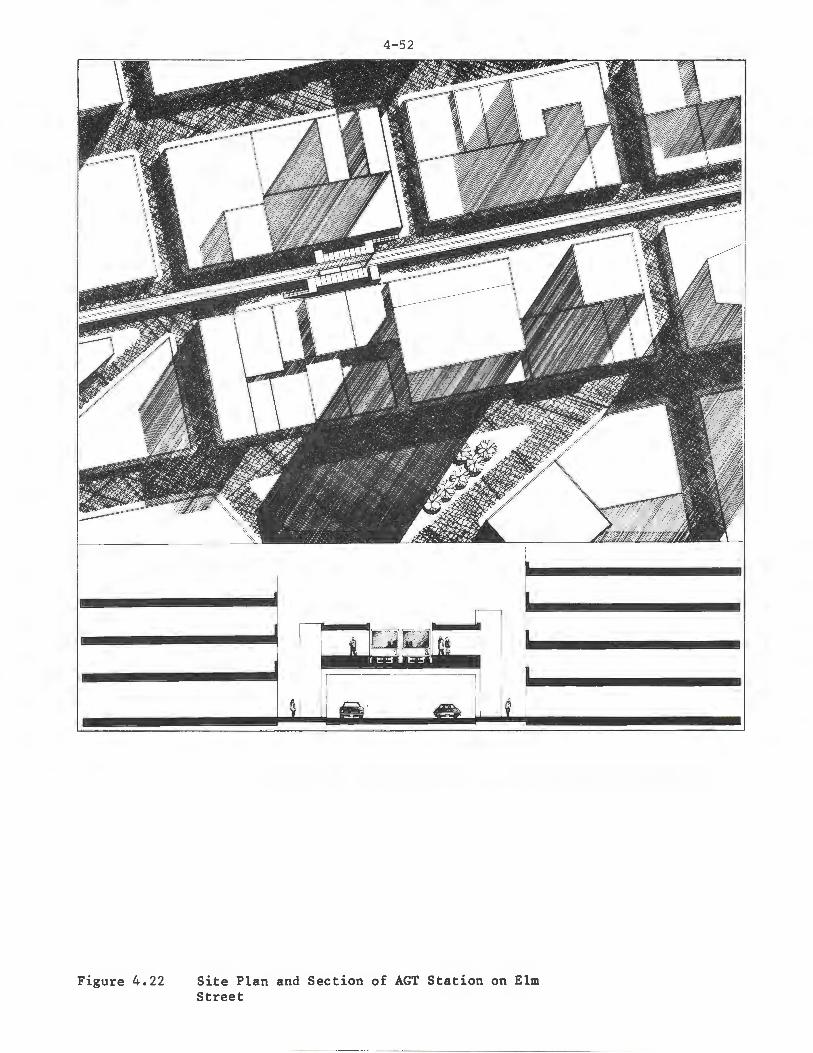
Figure 4.22
4-52
Site Plan and Section of AGT Station on Elm Street
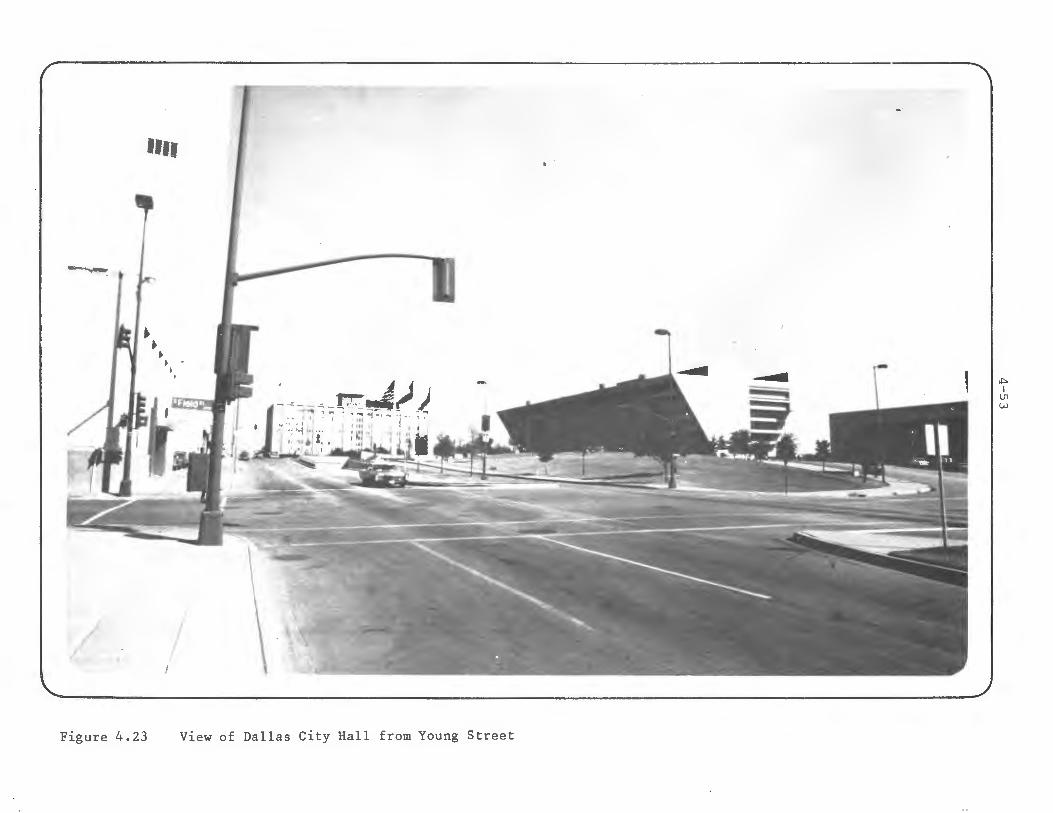
1111
I I I
Figure 4.23 View of Dallas City Hall from Young Street
.i,. I
Vl w
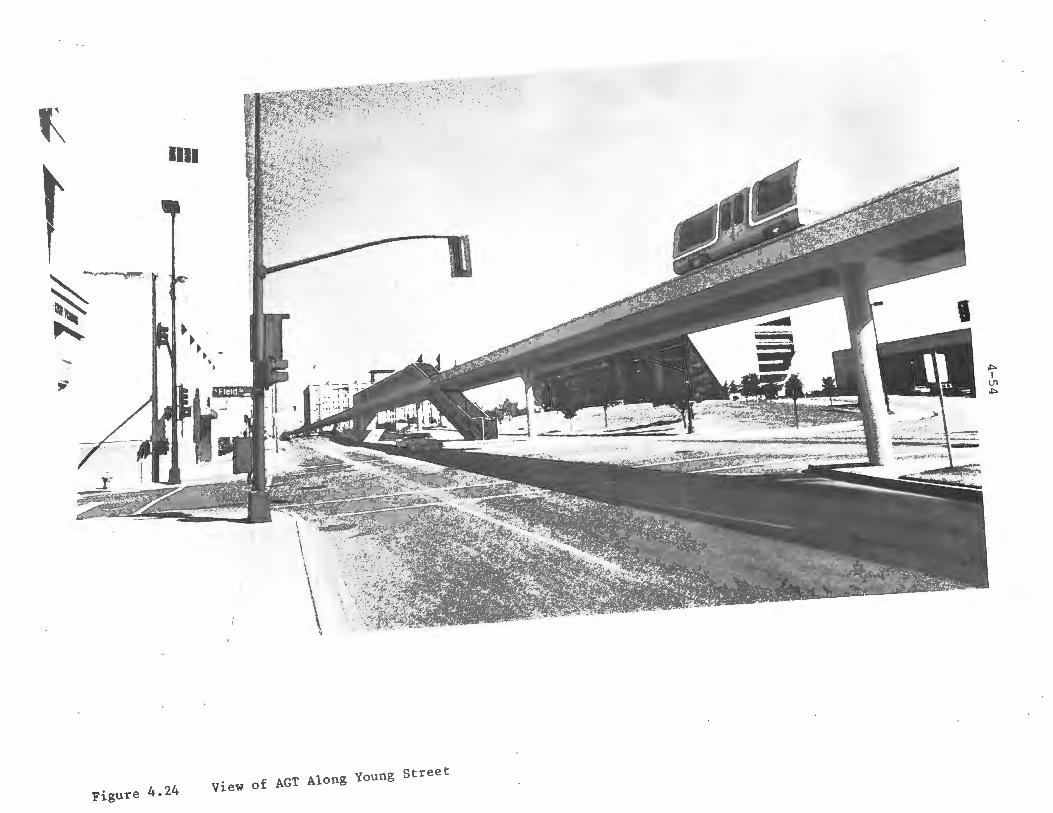
t IOI
t ~ ~ ' ;:
Figure 4.24 View of AGT Along Young Street
~ I
\Jl ~
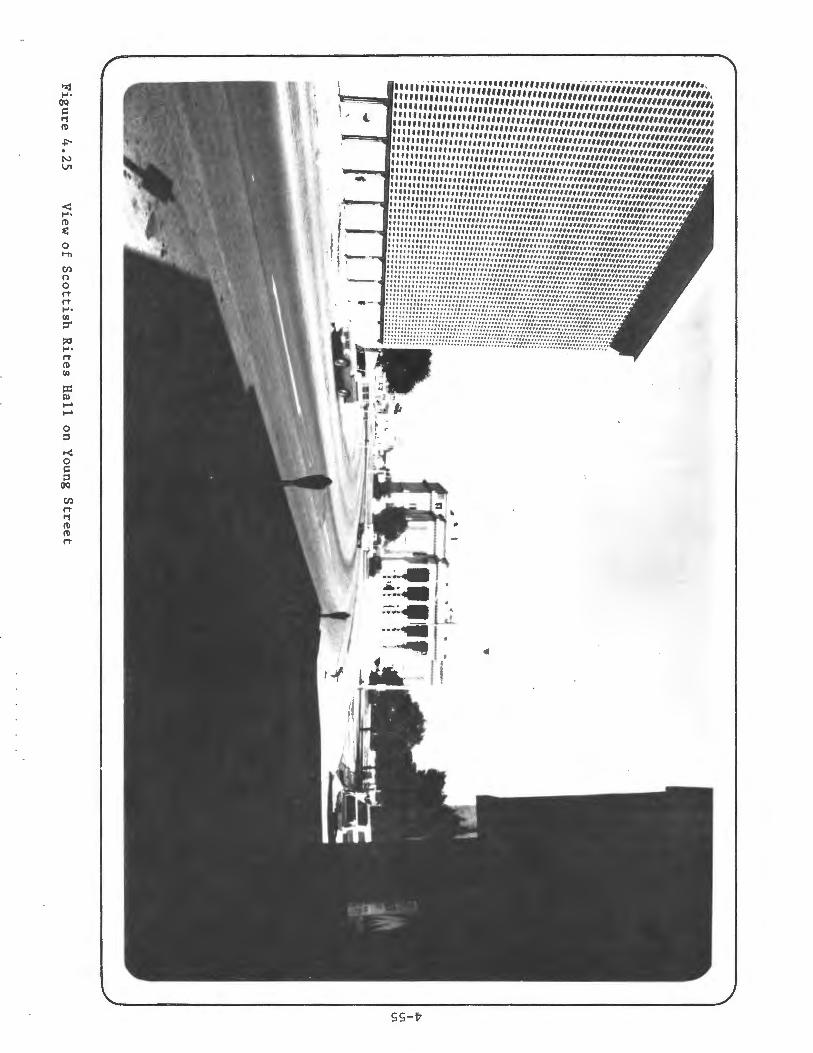
"z:I .... (IQ
C I 11 i :It'- \ii (1)
~ . N \J1
< .... (1)
~
0 H'I
C/)
0 0 rt rt .... C/l ::l"
~ I-'• rt (1) C/l
:x: Ill ...... ...... 0 p
,< 0 C p
(IQ
C/)
rt 11 (1) Cl) rt
' ,. '
··· ·• •••••••~~•¥#llfl#I•~ ··· ···················•11,,,,,,,,,,,,,,,,,,,,,,,,,,,,,,,,. ,,,,,,,,,,,,,,,,,,,,,,,,,,,,,,,,,,,,,,,,,,,,,,,,,,,,,,,,,,,,,,,, ,,,,,,,,,,,,,,,,,,,,,,,,,,,,,,,,,,,,,,,,,,,,,,,,,,,,,,,,,,,,,,,,, ,,,,,,,,,,,,,,,,,,,,,,,,,,,,,,,,,,,,,,,,,,,,,,,,,,,,,,,,,,,,,,,,,, I I I I I I I It I I I I I I I I fl If fl ff ff f lfllllllllllllllllllllllllltllllllllll, I I I I I It I U I I If I I If ff ff f If ff f tlf lllllllllllllllllllllllltlllltltlU1' I I I I I I I I If f I ff ff f ff If ff fl ff f fllflfff llllllllllllllllllllllllllllUI" , , , , If ff I I I If ff ff ff,,,, ff ff ff f ff llU1111,,,,,,,,,,,,,,,,,,,,,,,,,,,,,, I I I I I I I If I I I I If I If ff If f Ill I fl Ill llfllllllfllllt(Uflllllfllllflllllllll ''' '' '' ,,,,, ,,,,,,.,,,.,,,,,,,,,,,,,,,,,,,,,,,,,,,,,,,,,,,,,,,,,,,,,,,,, I I I I I I I I I I I I I I I I llf fl flf flff ff ff ll#ff fllltf#fllllUllttflUIIIIUUUll'.j 1' I I I I I I I I II I I I I I fl flflff fl fllllfltlllllllltltltf#lllltttUUllttltUtU,
'a '""' z , 11111 I fl II I 111 lllllfff lfl•1111111tt1f .. llfff#ffff#lt1tt,Ullt,U111111,.. 11 II I I I I I I I fl I I 111111111 .. , .... llfftlll .. fllllttltttf11tUUt1tlUIUU'-' I I I I 11 I ti ti I I I I .. ........................... lltlttl .. #flllttrtflllllt,r'-' , , , , , , , 111 tt,,,,, """' u,u,,uuuu,,,,,,,,,,,,,,,,,,,,,,,,,,,,,,,,IJ
~• '4::::: ::: :: : : : : : ::::::::::,•.•.•.•:,•:.•::.•.•.•,•,•.•.•.•,•,•,'.',W:.~~~~~~~~~~~~~~~~~~~~" , •,,,,, ,u,,,,,, "'"',,,, ,u,u11u111uu11,,,,,,,,,,,,,u,,,n,,,,,,~ I I I I I I I I It I If f U ff ffff ff ff ff f fflfffffflf fffflff#fffffffffffffffffffff#f ''.'' 14'' .. '' .. """" ............... ,,,,,,,,,,,,,,,,,,,,,,,,,,,,,,,,, ~ '4:::::::::::::::::::::: :: : : ::::::::.w:.·.·::,.,·:.•,•,.,.,.,,,.,.,.,.,,.,.,.,.,.~~,.~~~~~~~~ I If t f t t t ft f It t t I t t t t ft tit I I If ffffffffft fffffffftfffffffffffffffffffffff~ It ft f It t t t t t ft U t ft f ttU tit •••••·•••••••••ttfffftffffffffffffffffffffff t t ff t t ff t I I It I If Ifft II t ft It ff I ffff fffl f I I lftt••····••tffffffffffffffftff I I It t I I It If I It I I I I I I flltt fltt••·····•• t ttffflftffft#•·····•ftffftftffft
I I: ::: ::::::::::: 11::::: ,': ,•:: :::,•:::,•::,•::::::::::::::, .. ~•.~',',~',',~',~~~~~~• : : ........ : : : : : : : : : : : : : : : :: ::::::::::::::::::::::::::: ................................. . : : : : : : : : : : .. : : : : : : : : : : :::: :::::::::::::::::::::::::::::: ............................. . : : : : ii!!!!:!::::::::::::!:·:·.: !H.~•:•:~~•:•:~~•:::•:❖:•:•:❖:•:•:•:•:•:-::•:-::f:?:: .. ~~~~.,.
- --- "! ! !t tf ff ff f!!!!!!!!!!:10/~:~\~?/}~:~/1/::::::}{t?%.\IJ? , •... · ······
l .- M
I ... -J ' > - ,. i • ,, '.::11 , ,
I I t,t; J ,, I
/.:~ · 'li, 4
"'
..
SS-17
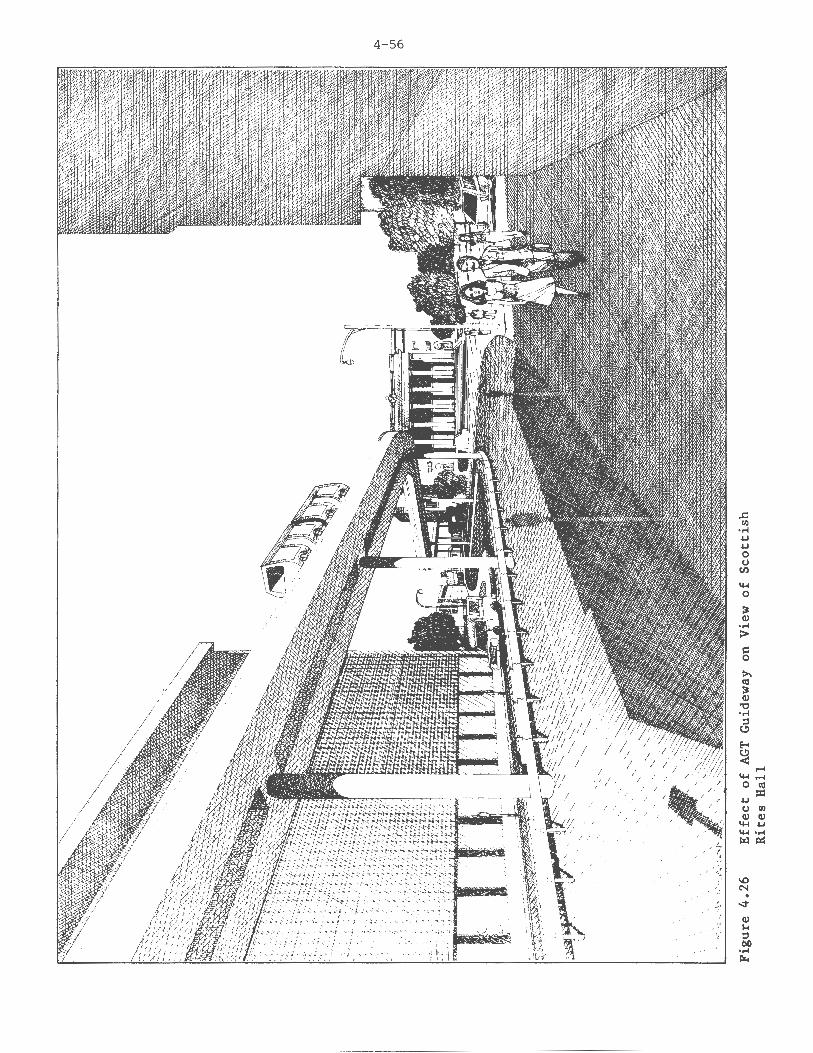
4-56
I I I
I
.c: Cl) ..... ~ ~ 0 0
ti)
~ 0
) Q) ..... > i::: 0
>. !IS ) Q)
'tl ..... s E-<
~ ~,-4
0~ ~ ::c: 0 (IJ Q) Q) ~~ ~ ..... t.:i ~
4.2.5 INSTITUTIONAL ISSUES
4-57
transitway and LRT systems would have a pronounced effect on the image of, and future development along, Main Street. However, the development benefit would not be felt in many parts of the CBD.
The AGT system, as presented in the final alternative (Figure 4.7), still poses some problems of visual intrusion related to the elevated guideway and stations. The visual effects of the system are most significant along Elm Street, a relatively narrow right-of-way with low, medium, and high rise buildings fronting along both sides of the street. The canyon effect that can occur under these conditions is most apparent between Ervay and Griffin Streets. A second area of visual concern is on the Young Street alignment in front of City Hall and further to the east in the vicinity of the Scottish Rites Temple. While the rightof-way is quite broad in this area (well over 100 feet), the guideway and stations will block vistas of major public buildings--the new City Hall and Library now under construction--and the Temple. Other sections of the alignment are located on broad rights-ofway and away from environmentally sensitive areas or structures and do not appear to pose significant visual compatibility problems.
The AGT system would probably have the broadest and most far-reaching effect on development patterns in the CBD of the three alternatives examined. At a nu11r ber of AGT stations, joint development opportunities were identified in conversations with local officials. Among these are the development of air rights just north of Reunion Plaza, incorporation into the new bus terminal near Union Station, development in conjunction with a new office/hotel complex at the east end of the CBD on Pearl Street, incorporation into emerging cultural center proposals on Ross Avenue, and integration into a planned city building at the intersection of Elm and Lamar Streets. The number and diversity of these potential developments illustrates one of the attractive features of the AGT system. This joint development potential also keys on one of the most effective means of deploying an AGT syste11r-by integrating it into new development.
4.2.5.1 Setting
The public sector agencies involved in CBD planning and policy making as it relates to transportation are described in the section discussing the corridor institutional setting. In addition to these public
4-58
agencies, downtown interests are represented by four major organizations. The most influential of these is the Dallas Citizens Council which is composed of the chief executives of most of the largest businesses in Dallas. Their membership and activities are not specific to the CBD. The Chamber of Commerce whose activities are also not specific to the CBD is another major organization. Similar in scope to the Chamber of Commerce is the Greater Dallas Planning Council. This organization has not been as active as the Ch~nr ber in the past. Finally, concentrating on Central Business District issues is the Central Business District Association. Many corporations ar representated in more than one of the above mentioned organizations.
The private and public sectors work closely together in Dallas. In particular, the private sector has a major influence on the specific activities pursued by the City in the CBD. The involvement of the private sector in the consideration of the various transit proposals is of primary importance to the prospects for eventual and smooth implementation.
4.2.5.2 Key Issues
The City and private sector representatives agreed that the provision of transit circulation and distribution services in the CBD is very important. This need will be compounded as development continues in the CBD {a major city objective) and as a regional transitway is built {as currently anticipated) bringing more transit riders downtown. However, the preferred form of transit and its staging is an issue currently being analyzed by city representatives.
An AGT system is one alternative under consideration and was seriously discussed in conjunction with UMl'A's DPM demonstration program, to which the City of Dallas submitted an application. The issues with regard to AGT or shuttle bus which seemed to be of primary inr portance to city and private sector representatives in assessing the trade-offs for downtown transit internal circulator services include the following: whether the CBD system should be separate or a component of the regional system; the feasibility of at-grade transit operations; the visual and urban design compatibility issues associated with an elevated guideway system; the contribution of the system to economic development; the security implications of the systems {particularly during the evening hours); and the costs of the alternatives. Labor issues are not a concern
4-59
at this site. Also, good institutional relationships among the city and private sector are likely to facilitate the implementation of any system selected.
An AGT system is considered to be preferable to a bus system for downtown circulation in several respects: it would provide a higher level of service and it would be more likely to positively contribute to economic development particularly in developing areas of the CBD. However, the major obstacle to AGT implementation which is avoided by a bus system is the visual intrusion of an elevated guideway and the incompatibility of the guideway with much of the existing development. The other issues, even the issues of system cost, were considered to be less significant in the overall decision making process.
Due to the exclusive operation of an AGT system, both City and private sector representatives felt that an AGT system could provide a higher level of service than a shuttle bus system. Representatives agreed with the demand projections that in part due to the better performance of an AGT system, and in part due to the attractiveness of AGT services, a significantly higher ridership could be anticipated on an AGT versus a bus system (40,000 versus 14,300 respectively on a daily basis).
If an AGT system were used for internal circulation in the CBD, it was felt that the system should be separate from the regional system or at least built after the regional framework already existed. The primary reason for this is that a regional line particularly in the northern part of the CBD might be feasible, but it is not clear that a more expansive network penetrating the core areas of the CBD would be acceptable at this time, as discussed earlier. Elevated LRT and transitway regional alternatives would be even less compatible due to their more massive guideways and larger station requirements. Representatives felt that from an aesthetic perspective, buses would present the fewest problems in the older, more densely developed areas of the CBD, at least at this point of time.
It was felt that opportunities to integrate an AGT system with new development, particularly in the northeastern area of the CBD were promising. One major developer from this area appeared quite receptive to an elevated system to tie into the new development in this area.
4.2.6 SUMW\RY
4-60
Economic development is a primary objective of city officials and the private sector. It was not felt that a bus system would have any significant effect on economic activity. However, an AGT system was considered to have potential to both enhance existing activities and serve as a catalyst for newly developing areas.
The degree to which an AGT system would enhance econermic activity in the CBD is unknown. Although at least one major developer felt that he would be willing to contribute to the costs of some elevated guideway system, he expressed a desire to have more information about the expected economic benefits associated with an AGT system as a guide to a reasonable level of investment.
The capital and operating costs of an AGT system were considered to be within reason and of a range that the city would be willing to consider at the proper time. The projected costs are similar to the costs developed by the City of Dallas when they prepared their DPM proposal.
It is likely that an AGT system would be funded through a combination of bonding and a sharing of expenses with the private sector on designated elements of the system, most notably station areas. If an Rl'A were created, other options such as the limited sales tax might also be considered.
Issues of personal security were of concern for both the AGT and bus systems although it was felt that the AGT system presented additional security problems over the bus system. The problems were considered to be most troublesome in the evening hours when activity in the CBD is low.
In summary, an AGT system is one alternative which lercal and private sector representatives appear willing to consider for internal CBD transit. It does not appear, however, that an extensive AGT circulator system could be built, at least initially due to major problems of aesthetic and urban design incompatibility in the core areas of the CBD. It was felt that a small increment along the northern part of the CBD which could also be the CBD element of the regional system could be compatible with major new development in this area both visually and from an economic development perspective. The system could then be expanded to other areas of the CBD, depending upon these initial experiences.

4-61
The costs of an AGT system appeared to be within an acceptable range, particularly since some cost sharing with the private sector could be expected. Issues of personal security were of concern for all transit alternatives, though of slightly greater concern for AGT. It was felt, however, that these issues could be addressed and would not impede an AGT implementation.
4. 3 NORTH PARK ACTIVITY CENTER
4.3.l SITE CHARACTERISTICS
Two major, cut very different types, of Dallas activity centers are examined as discrete sites in which an AGT or other transportation system might operate. The North Park complex is approximately six miles north of the CBD; the Market Center, discussed in Section 4.4, is located just over two miles to the north and west of the CBD.
North Park is a maJor regional center in the Dallas region and, in many respects, is typical of the large suburban centers that have developed in major metropolitan areas across the country during the past twenty years. For the purpose of this study, the North Park activity center (which takes its name from the North Park Shopping Center) is defined by Park Lane on the north, Greenville Avenue on the east, Southwestern Boulevard on the south, and Boedeker on the west.
North Park is served by two major highways, the North Central Expressway (bisecting the area on the northsouth axis) and Northwest Highway or Loop 12 (bisecting the area on the east-west axis). Vehicle access to all four quadrants of the study area is good, but access beween quadrants is difficult.
Three major uses are found in the area--retail shopping, office, and recreation/entertainment. The earliest and still predominant activity is retail shopping, with most of this activity centering on the l 1/2 million square foot North Park Shopping Center. The Center has an extraordinary drawing power of as many as 100,000 trips on peak days. In addition, both the general layout and design of the center are of extremely high quality. Additional retail space, approximately 35,000 square feet, is located in the North Park East development in the northeast quadrant of the study area.
Office space is a second major trip generator to the area. Nearly l 1/2 million square feet of space is located in the area, two-thirds of that in the Campbell Center development in the southeast quadrant.
A final major activity in the North Park area is the recreation/entertainment facilities. Racquetball
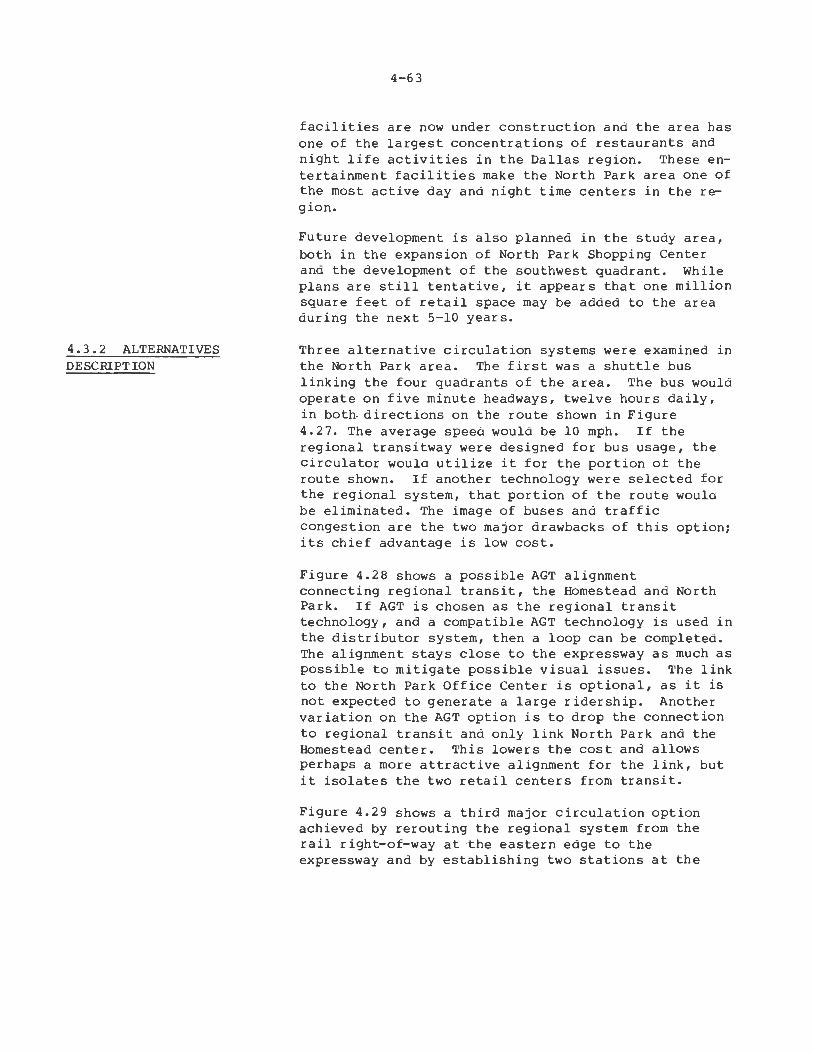
4.3.2 ALTERNATIVES DESCRIPTION
4-63
facilities are now under construction and the area has one of the largest concentrations of restaurants and night life activities in the Dallas region. These entertainment facilities make the North Park area one of the most active day and night time centers in the region.
Future development is also planned in the study area, both in the expansion of North Park Shopping Center and the development of the southwest quadrant. While plans are still tentative, it appears that one million square feet of retail space may be added to the area during the next 5-10 years.
Three alternative circulation systems were examined in the North Park area. The first was a shuttle bus linking the four quadrants of the area. The bus would operate on five minute headways, twelve hours daily, in both- directions on the route shown in Figure 4.27. The average speed would be 10 mph. If the regional transitway were designed for bus usage, the circulator would utilize it for the portion of the route shown. If another technology were selected for the regional system, that portion of the route would be eliminated. The image of buses and traffic congestion are the two major drawbacks of this option; its chief advantage is low cost.
Figure 4.28 shows a possible AGT alignment connecting regional transit, the Homestead and North Park. If AGT is chosen as the regional transit technology, and a compatible AGT technology is used in the distributor system, then a loop can be completed. The alignment stays close to the expressway as much as possible to mitigate possible visual issues. The link to the North Park Office Center is optional, as it is not expected to generate a large ridership. Another variation on the AGT option is to drop the connection to regional transit and only link North Park and the Homestead center. This lowers the cost and allows perhaps a more attractive alignment for the link, but it isolates the two retail centers from transit.
Figure 4.29 shows a third major circulation option achieved by rerouting the regional system from the rail right-of-way at the eastern edge to the expressway and by establishing two stations at the
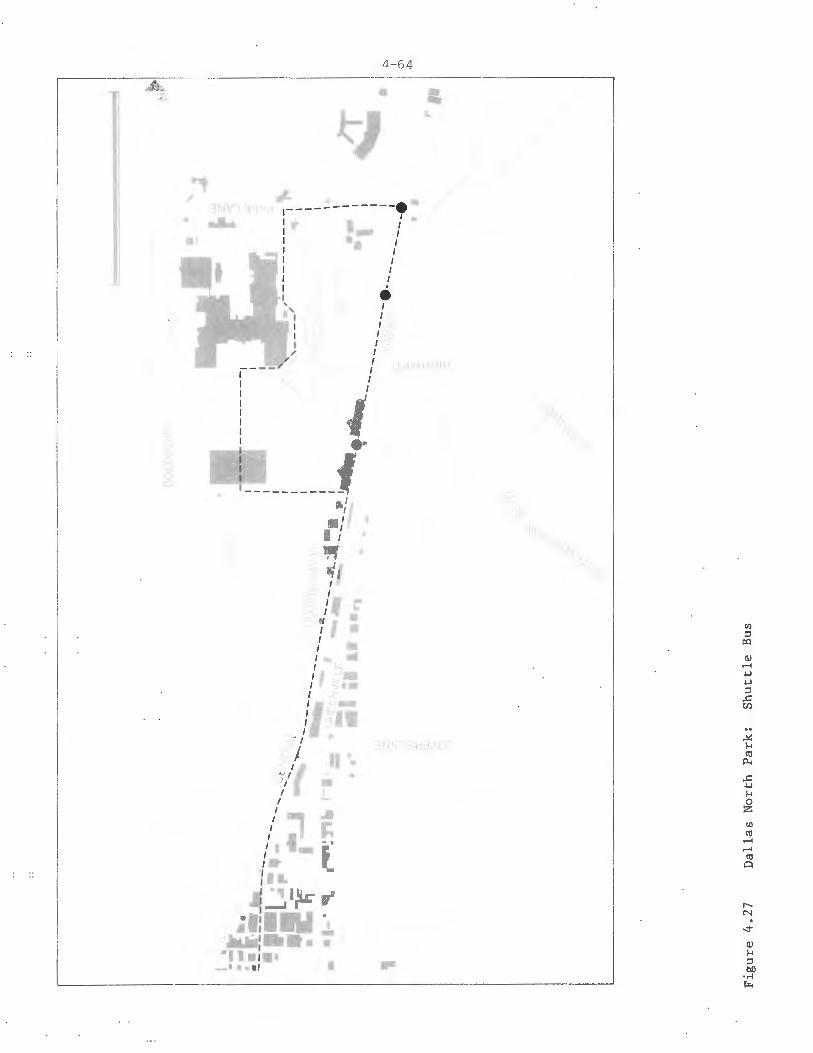
A. z
4-6 4
• • I.
., / ~ -------· ,----- I
~ :t I / I 118 / 111 I / I / I /
I f I • I, I
' I I / I / I /
) I
/ / 1 \;,/' t )I ____ / I
I / I /
: / I ! : { I • l I I J
I / + ___________ , • I
I • I I I I
I 1 I I I I I I I I I I I I I I I I I I ,.
,
-.. II II
• 111111 -•• I
I I
I I II ~.
I I
I I
I I I I I I I I
I
.J'/Lr r .1:1111111 j. , .lilil.ri: • • •
•11 ■ I I -· ... , I
•
"./ '-;d 1 'l
\ ' < ,
r-N

I ~, ·--- .. :.■ .. ..
'! l•L••"-~llf .. r...1 -·•-· ' ..... ~,, .. I
,-.. _ -••• w z :5 J' er '-'·· ~
')
Si")f DEf/f.:Jl
f (PRESSWA ye . . ·••· "I ',;1" E 1'W11 L [ lllrjji - • ...
•• ii II ■■ r1 • ~ . -
t\.---J'v · ~
$ ·' !ZJ
-<:-if .t-:_
0--0 Cj
ii,\,'> H·i
. 0" ~';;-0
.. &, b"
/~
Figure 4.28 Dallas North Park: AGT Alignment 1
'\;,J! f•
,· '
c;TnEE
,-. \11 j r ,
.... '..J ~·~
L a: < n.
~ , , _ _QP_!i~n2_I __ -, ....
>· < s I l'.)
I
,t
\ \
\ ,\he I
~
I ....
\•1 I I
•~ I
N►
4. r fl
'-'
"/ ~
~ I
(j\ u,
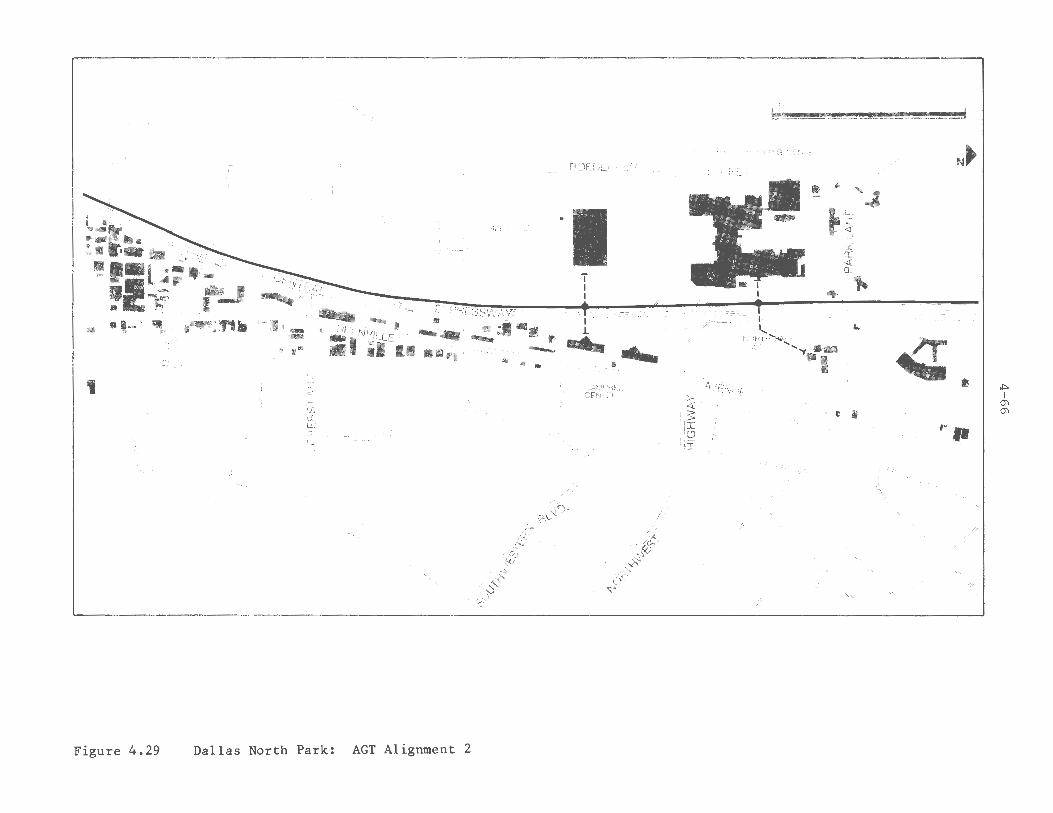
I , ,, --- -·-r. ' ..it.)~1fs ~ f:: >'\D
"• ••·· 'r .. .... -·' - -- -
• ■ 1•·L • • ,:. - --c~Mrt/~, _ _ EXPRCsswA Y_ -- I .::!" •...1 .....,.. , -- - - • - • :1•■ • 1 1; I . -■ , Gt?EENViLLE .:::.::
......_ -- I --- -- --• . ,-;711, I 'a •, a II Hr, • • • ·•- 1111. • •• 1111 •
I
1/
w z i:5 (j) a: w ,>.,.. 0 _j
•·~"·
,-..H
NOHTH FAHi<. SHOPPING C[t\TEH
•
BOEDECKER
T I ~ ·
l \ _✓ .... .....
·•
. /-,,· /
/
• CAMPBLL.1. CENTER :>-
<(
Js 1 I
<:2 ·I
STREET
■ • '.J
~~
1-
·~ a:
a:~
: &.
N0R~"1-.I(!~ ·-FAS 1 "I ••
AVENUE
1/
f i /!
• •
-o\..-'j\)· /,'
/'/ /·/ ;f
,, ,; 1-,,
Figure 4.29 Dallas North Park:
i: ~
tJ .. s ' ·-<' ,j§
/ 00
AGT Alignment 2
:-- (j /,i~ d:- ~
; ~o / /
""· ,, "'-::-,... ,,
N►
4 • ,. ..
·, '-...'-.. ,,
,, ,; ,, {
},"-,; ,,
/ ,v, ,, ,.;
J. ,,
..,. I
(j\ (j\
4.3.3 DEMAND AND COST ISSUES
4-67
site. An additional link using AGT or moving belt technology could also be introduced between Homestead and North Park. If the regional system were an attractive, high-frequency mode such as AGT, the optional link might not be necessary, as the walk or moving belt distance to and from the regional system is short. Either special turnback loops or spurs could be built at the two stations to allow shuttle operation, or a third guideway lane could be built on which a vehicle or train could shuttle. The distance is short enough that two minute headways could be achieved, even on a single track shuttle with a single vehicle. If the regional system was used, fares could be validated by merchants, or automated fare collection could allow free rides between the two stations, perhaps billing the cost to the centers.
An AGT, whether operating on regional or internal rights-of-way, is assumed to operate every two minutes without fare. The average speed would approach 20 mph. Table 4.6 summarizes the North Park alternatives.
Table 4.7 shows the North Park results of applying DPM Manual models, adjusted for non-CBD conditions as much as possible through validation at the Merrillville, Indiana case study site. However, the linkage between the North Park and Homestead areas has some unique characteristics that are beyond the scope of the models. Thus a trip rate between the two center~ of 3.45 trips per 1,000 retail square feet plus 1.15 trips per 1,000 office square feet is assumed. This is double the internal zone-to-zone CBD shopper trip rate, and corresponds roughly to 10 percent of total shoppers at North Park and the Homestead visiting the other center. The internal non-worker trip estimates shown in the table may be scaled relative to this base assumption if desired. Similarly, an internal zone-to-zone worker "noon-hour" trip rate of 0.4 trips/worker was assumed, based on the Merrillville study. The worker travel projections can also be scaled relative to this base. Regional guideway transit, if implemented in the North Central corridor, is assumed to capture about 5 percent of all trips to the North Park area: this is assumed to be relatively insensitive to the type of distributor service at the site, although it is strongly dependent on its existence.

4-68
Table 4.6 Alternatives Description Dallas, North Park
Regional AGT Alternative Shuttle Bus AGT (Without (Add One
Extensions) Guideway Lane)
System Length (mi.) 2.5 0.6 0.3
Number of Stations 0 3 2
Vehicle Size (seats) 301 302 303
Headway (min.) 5 2 2
Fare (cents) 0 0 0
Maximum Speed (mph) 25 25 25
Average Speed (mph) 10 20 20
1 Required in peak for distribution of regional trips if guideway transit implemented; otherwise 15-passenger vehicles are adequate.
2
3 Required for both peak and noon travel volume.
Required for noon travel volume.

4-69
Table 4.7 Daily Ridership Summary Dallas, North Park
Alternative Shuttle Bus AGT (Without Extensions)
Regional AGT (Add One Guideway Lane)
Internal trips by workers (daily): Auto Internal transit
3,000 600
2,900 1,000
2,700 1,800
Internal trips by nonworkers (daily):
Auto Internal transit
9,700 1,200
7,500 3,400
6,300 4,600
Regional transit distributionl Work 500
4,200 500
4,200 not required not required Nonwork
Peak load factor (passengers/seats) .90 1.00 1.00
1 Assumes all transit users walk to North Park East and Campbell Center in all cases; shuttle bus and AGT circulator serve transit trips to North Park and Homestead; regional AGT has no transit distribution function required for any destination.
Source: DPM Manual Models. Land use and employment assumptions are:
North Park Homestead North Park East Campbell Center
1,600,000 ft2 retail 300,000 ft2 retail, 100,000 ft2 office
1,600 employees 1,000 employees
Regional trip ends to area assumed roughly equally distributed from all four directions; 40 nonwork trips/1000 ft2 retail and 5 work trips/1000 total ft2 assumed. 400 ft2/employee assumed for floor area/employment conversions. Base worker "noon-hour" trip rate of 0.4 one-way trips/worker/day assumed, based on Merrillville site. Internal nonworker trip rate of 5.45 one-way trips/1000 retail ft2 and 1.15/1000 office ft2 assumed between North Park and Homestead. These are double the Dallas CBD rates and assume that approximately 10% of all shoppers would visit both malls. A 5% regional transit mode split is assumed, based on corridor analysis.
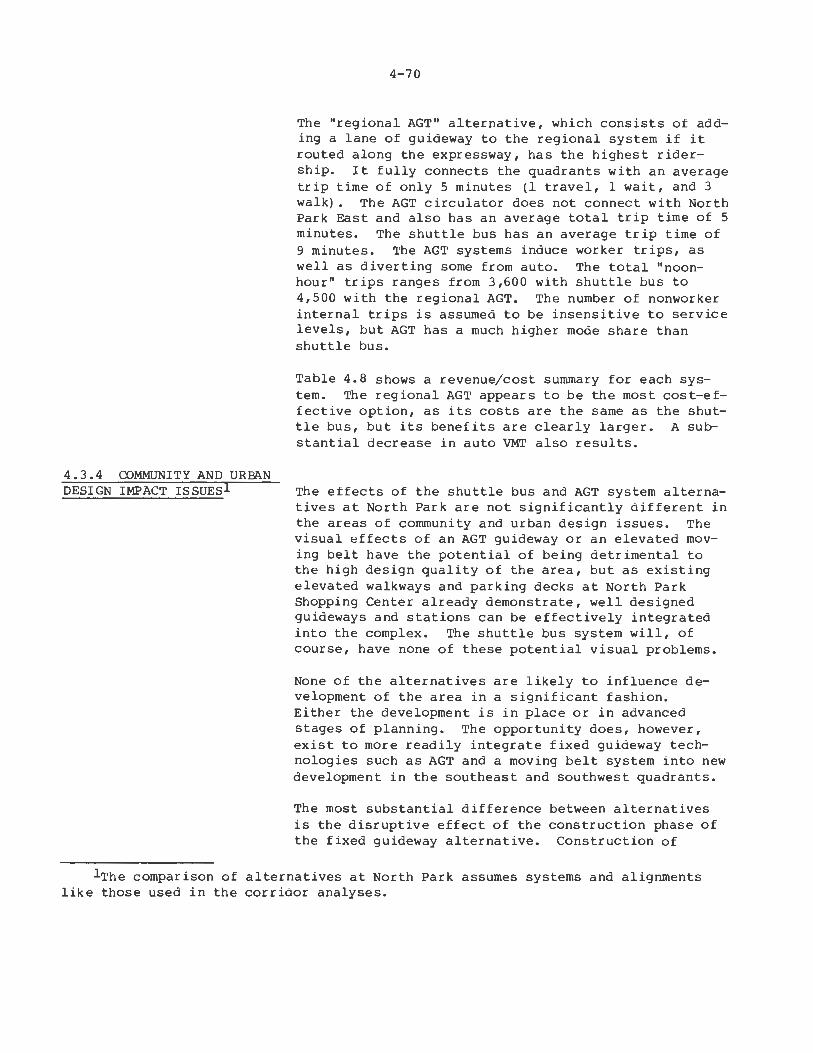
4.3.4 COMMUNITY AND UR.BAN DESIGN IMPACT ISSUES!
4-70
The "regional AGT" alternative, which consists of adding a lane of guideway to the regional system if it routed along the expressway, has the highest ridership. It fully connects the quadrants with an average trip time of only 5 minutes (l travel, 1 wait, and 3 walk). The AGT circulator does not connect with North Park East and also has an average total trip time of 5 minutes. The shuttle bus has an average trip time of 9 minutes. The AGT systems induce worker trips, as well as diverting some from auto. The total "noonhour" trips ranges from 3,600 with shuttle bus to 4,500 with the regional AGT. The number of nonworker internal trips is assumed to be insensitive to service levels, but AGT has a much higher mode share than shuttle bus.
Table 4.8 shows a revenue/cost summary for each system. The regional AGT appears to be the most cost-effective option, as its costs are the same as the shuttle bus, but its benefits are clearly larger. A substantial decrease in auto VMT also results.
The effects of the shuttle bus and AGT system alternatives at North Park are not significantly different in the areas of community and urban design issues. The visual effects of an AGT guideway or an elevated moving belt have the potential of being detrimental to the high design quality of the area, but as existing elevated walkways and parking decks at North Park Shopping Center already demonstrate, well designed guideways and stations can be effectively integrated into the complex. The shuttle bus system will, of course, have none of these potential visual problems.
None of the alternatives are likely to influence development of the area in a significant fashion. Either the development is in place or in advanced stages of planning. The opportunity does, however, exist to more readily integrate fixed guideway technologies such as AGT and a moving belt system into new development in the southeast and southwest quadrants.
The most substantial difference between alternatives is the disruptive effect of the construction phase of the fixed guideway alternative. Construction of
lThe comparison of alternatives at North Park assumes systems and alignments like those used in the corridor analyses.
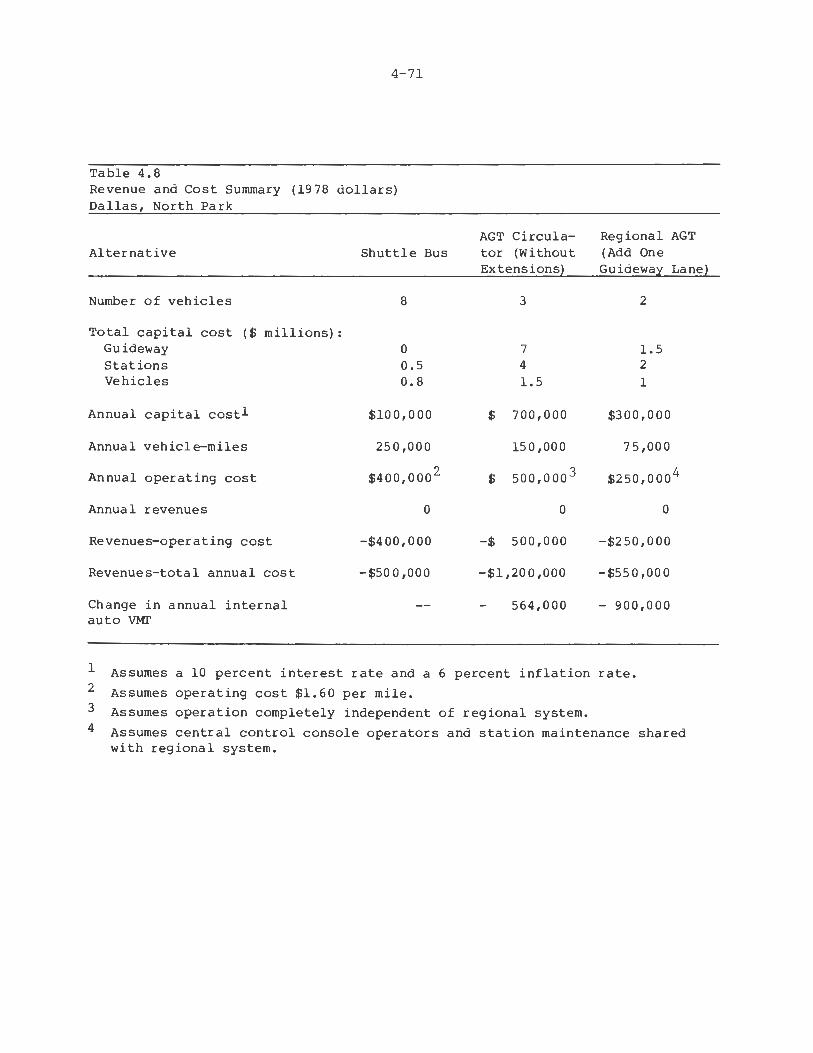
4-71
Table 4.8 Revenue and Cost Summary (1978 dollars) Dallas, North Park
Alternative Shuttle Bus
Number of vehicles 8
Total capital cost ($ millions): Guideway 0 Stations 0.5 Vehicles 0.8
Annual capital costl $100,000
Annual vehicle-miles 250,000
AGT Circula- Regional AGT tor (Without (Add One Extensions) Guideway Lane)
3 2
7 1.5 4 2 1.5 1
$ 700,000 $300,000
150,000 75,000
Annual operating cost $4 00, 0 00 2 $ 500,000 3 $250 ,000 4
Annual revenues 0 0 0
Revenues-operating cost -$400,000 -$ 500,000 -$250,000
Revenues-total annual cost -$50 0 ,000 -$1,200,000 -$550,000
Change in annual internal 564,000 - 900,000 auto VMI'
1
2
3
4
Assumes a 10 percent interest rate and a 6 percent inflation rate.
Assumes operating cost $1.60 per mile. Assumes operation completely independent of regional system.
Assumes central control console operators and station maintenance shared with regional system.
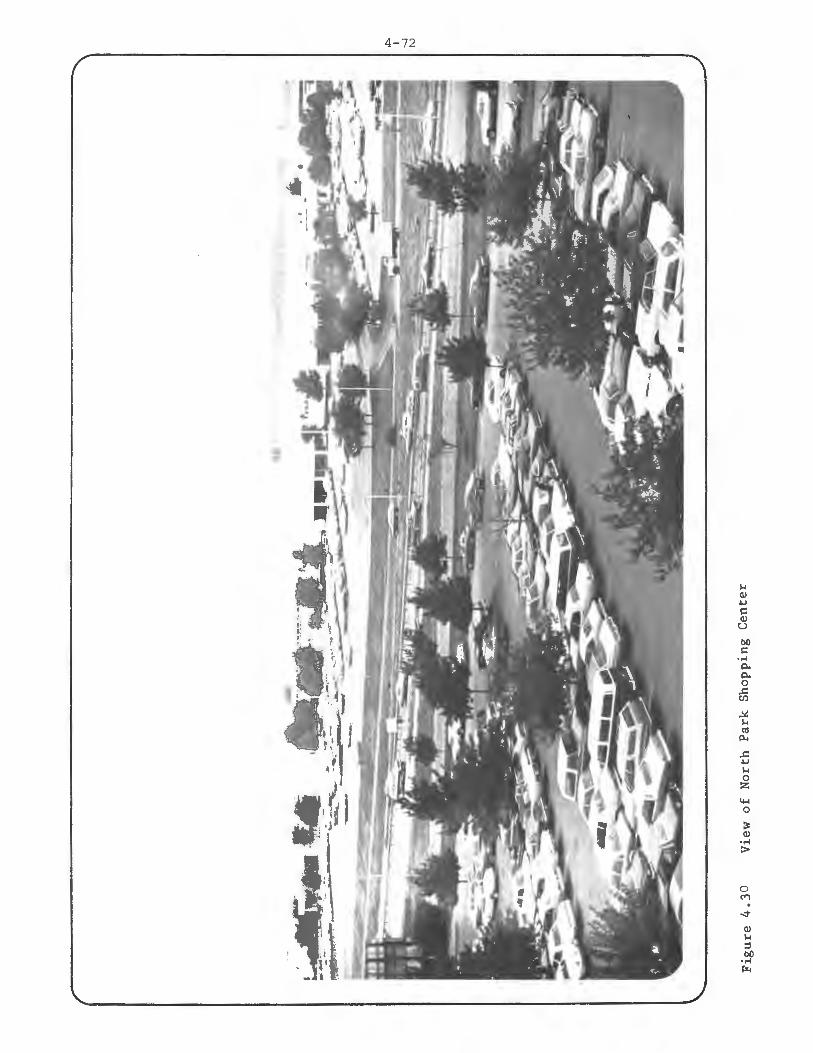
4-72
44 0
. --t
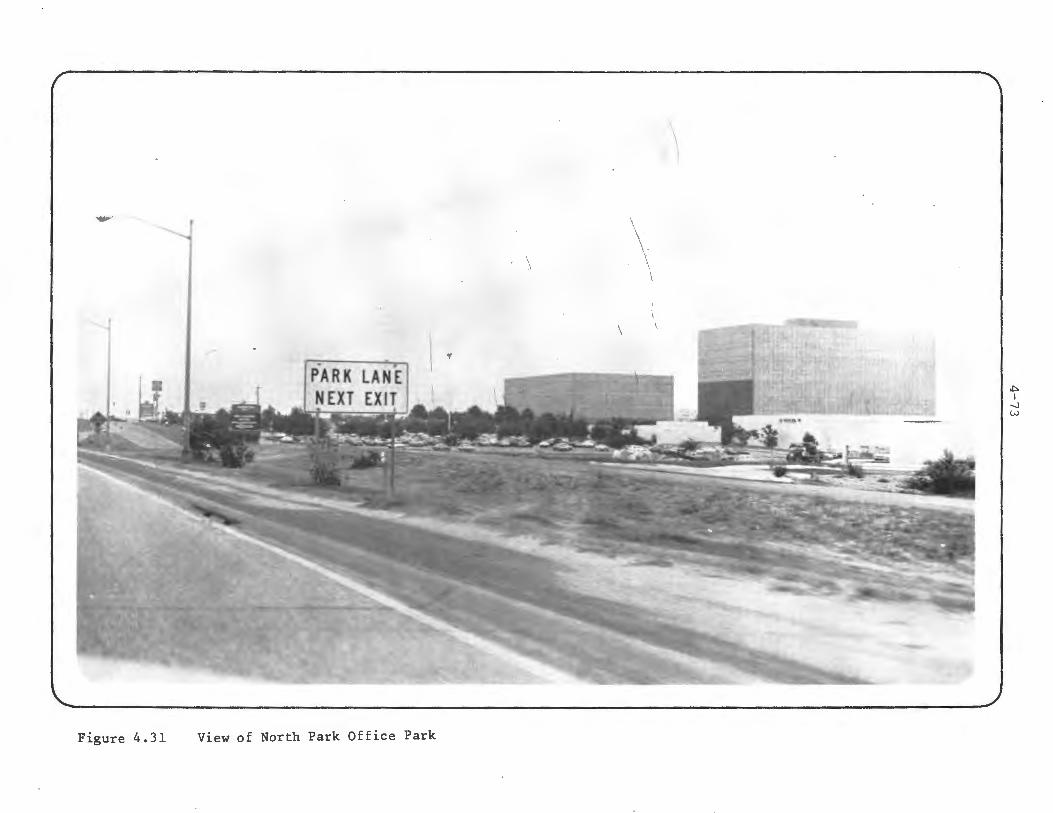
...
. J
.. PARK LANE NEXT EXIT
Figure 4.31 View of North Park Office Park
\ I
\ I.
~ -
,i::, I
-.J w
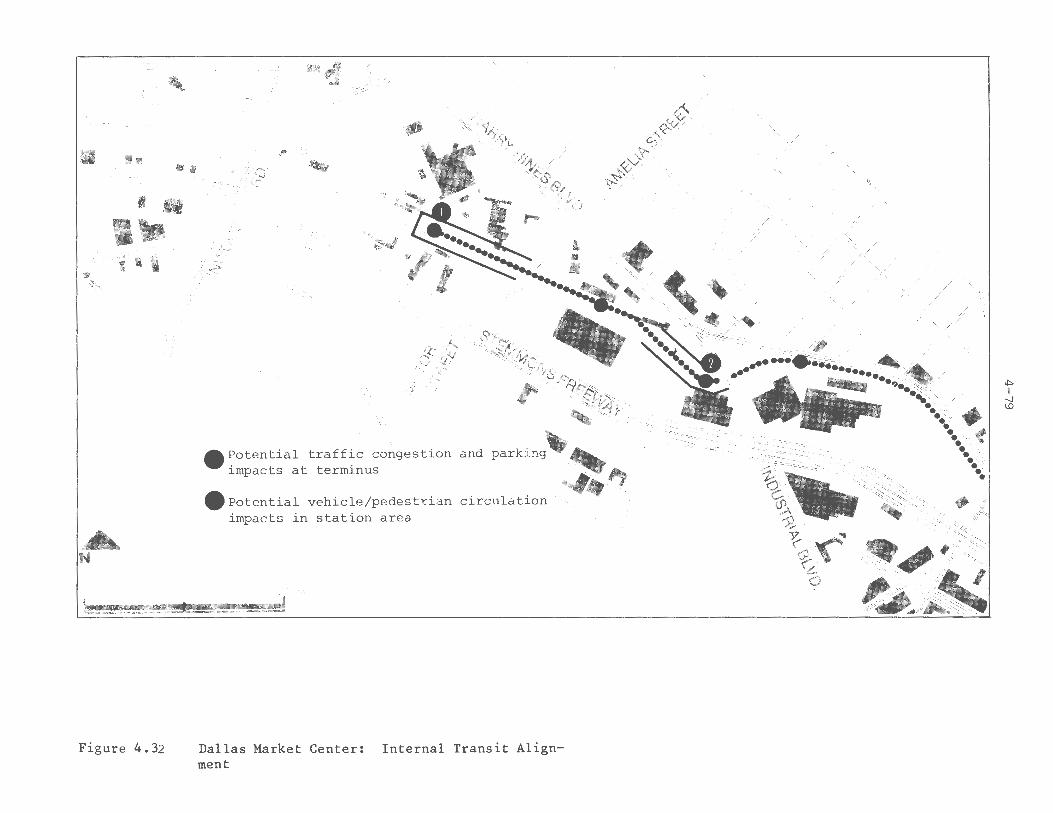
/
■ ••
.. -~
~ '
•• --
.J -~ l::// , "':J d'o/~v .,-• ;.::--:....--- ,_
■ ,.
I _,;f:::J' --,J;/((f:
/
'-
I • ,-; i.l_ •
1111 • f• I ~
B p -~
..._,
'"-;_
'
''-
"
.·,
9:-'' 0 ty
t ~ ~VJ
• ~otential traff~c congestion impacts at terminus
• Potential vehicle/pedestcian circulation impacts in station area.
~ ~~ f....«:- ~
0 1/ ""--$ ~ -~
~y ~ . / '"" //
~,;( '-"'-,, /r~ "~ / --~
. "' "" / "'· •. / . / "' /"-~"'/ ~j/ / "·
/"" ·//~( __ /. A ;' /" "" / . . . "' ,,, /(/_ )":< __ . /.// .. ·/"'<· /~'-v/ ),-/ .· / /'-. /
/ / / / ·. / )· / ~ / / /"' / '~--~ •----- A/ /-· // ~/ : y: _/ ,~';;, / . / / / ,✓ .•• "-~-~,;. .. . /# .. / / . / /;\
•• ~' < ,cc_-. .. _ j /4' /4 • ..,. ' · ··"-"-•""'-'c_C,.,; ( ·'-"" 'I._/· " ..... •••······ .,,.., ~ / •• ,\.... --- •••. ''1:-:,-,;, _· -/
-...:-::: \ .. - :"""'11111111 ~ ... -0, ~ /
-.Jr - - --~ \'-./. ♦ .,~ .... • '~-·•\"-· • ·:: .. ~ - - ·-~%~,
,;;;{i~\:,:.ifS'2;:,,,, ·-~~ ~\•~ ·,,-.,;'-.,',¾,..~- '· \J' '°'._Cc~,~-(~ ..& I;
~~ , __ "~, ~ ' ~ ~ >-'•~-,.,,. "' ~-- ·•,:::~:t~~~(_ ,?;:, " .,,_ .. ,___,, -y: \ "" • ~ vt:< .. "----S: (" <··, ... ,f:',,,i'" <i>'("' ~~~,, I 't, ~~lc''l4 • A . ·""-~~. N , ✓- ~, •····
OS m1 r)
Figure 4. 32 Dallas Market Center: ment
Internal Transit Align-
.i,. I ~ U)
4.4.3 DEW\ND AND COST
4-80
to use the regional guideway if the regional technology is AGT, or to add a third lane to the guideway to be operated as a bidirectional Market Center shuttle. A further variation would be to keep the regional AGT system on the rail right-of-way and have only the single-track shuttle serve the Market Center, retaining joint stations with the regional system at both ends of the shuttle route.
On-site shuttle bus service using up to ten SO-passenger vehicles chartered from the Dallas Transit System is currently operated, in addition to other charter buses operating from area hotels to the Market Center. This service could be replaced only by one of the AGT systems outlined above. Regional bus or LRT service on the rail right-of-way would not provide sufficiently frequent or proximate service to the Market Center to eliminate the shuttle service. It was felt to be infeasible to divert LRT or regional buses to serve the Center, as their value in shuttle service would be limited and the costs high.
The AGT shuttle is thus the only alternative considered to the bus service. AGT operating characteristics would be identical to those of the North Park shuttle. 'Iwo minute headways, a 20 mph average speed, and no fare would be the major system characteristics. The system length would be between 2000 and 3500 feet, depending on exact alignment and station locations. A midpoint bypass would be required to allow opposing trains to pass each other, as a single train could not make the round trip in sufficient time to maintain two minute headways.
ISSUES Table 4.9 shows a summary of Market Center results. While the causes generating the travel in the Market Center are different than in North Park, many of the same conclusions hold. The AGT shuttle based on some cost-sharing with the regional system appears to be the most effective guideway option, but in this setting the shuttle bus service has a considerably lower total cost. Very low system mileage (due to the short distances involved) contributes to a high AGT per-mile operating cost.
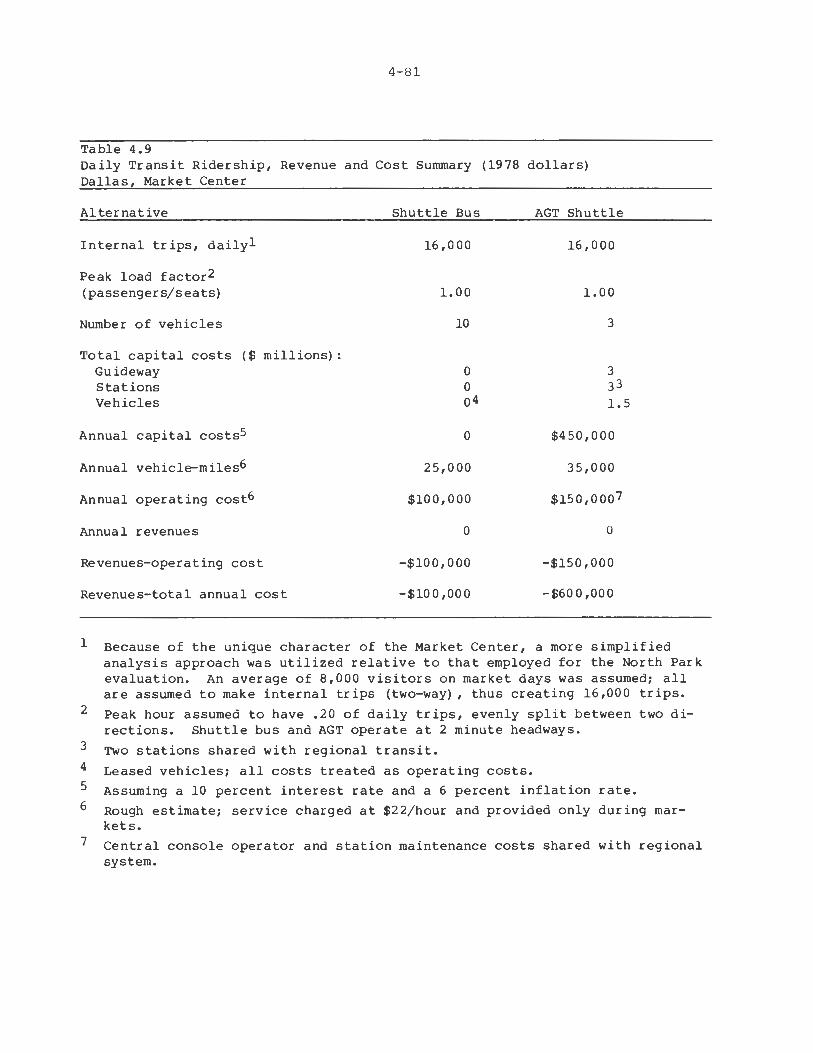
4-81
Table 4.9 Daily Transit Ridership, Revenue and Cost Summary (1978 dollars) Dallas, Market Center
Alternative
Internal trips, dailyl
Peak load factor2 (passengers/seats)
Number of vehicles
Total capital costs ($millions): Guideway Stations Vehicles
Annual capital costs5
Annual vehicle-miles6
Annual operating cost6
Annual revenues
Revenues-operating cost
Revenues-total annual cost
Shuttle Bus
16,000
1.00
10
0
0 o4
0
25,000
$100,000
0
-$100,000
-$100,000
AGT Shuttle
16,000
1.00
3
3 33 1.5
$450,000
35,000
$150,ooo7
0
-$150,000
-$60 0 ,000
1 Because of the unique character of the Market Center, a more simplified analysis approach was utilized relative to that employed for the North Park evaluation. An average of 8,000 visitors on market days was assumed; all are assumed to make internal trips (two-way), thus creating 16,000 trips.
2
3
4
5
6
7
Peak hour assumed to have .20 of daily trips, evenly split between two directions. Shuttle bus and AGT operate at 2 minute headways.
Two stations shared with regional transit.
Leased vehicles; all costs treated as operating costs. Assuming a 10 percent interest rate and a 6 percent inflation rate. Rough estimate; service charged at $22/hour and provided only during markets. Central console operator and station maintenance costs shared with regional system.
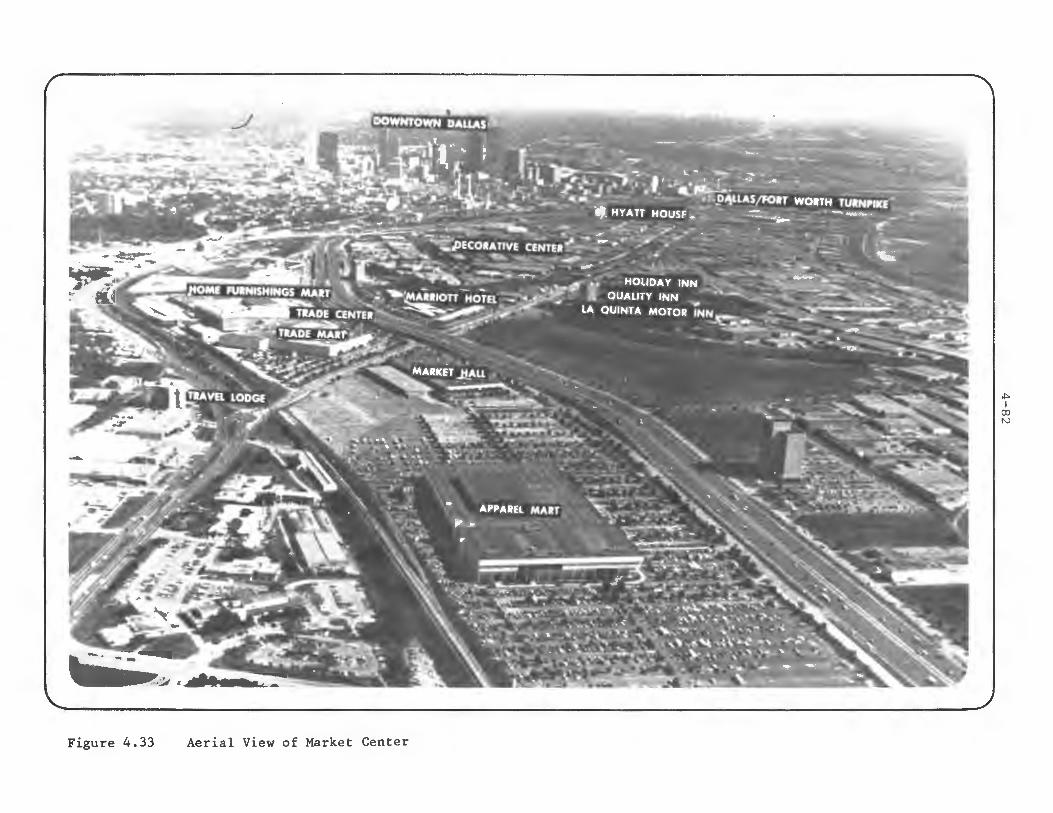
Figure 4.33 Aerial View of Market Center
,I>,. I
0) N
4.4.4 COMMUNITY AND URBAN DESIGN IMPACT ISSUESl
4.4.5 INSTITUTIONAL ISSUES
4-83
The effects of the shuttle bus and AGT alternatives are essentially the same except in the area of personal security. The visual effects of both at-grade and elevated systems in the Market Center setting are insignificant. The systems are also not likely to influence the location of development in this special setting, but rather respond to the specific travel requirements within the Center. Disruption of existing activities will, of course, be greater with the construction of an AGT alternative, but even with this alternative the disruption should be limited to the construction phase.
The AGT alternative at the Market Center appears to have few of the visual and disruptive effects that are common to the more densely developed and older urban environments, such as the Dallas CBD or the inner city sites in Chicago. Unlike North Park, personal security may pose problems similar to those found at older more urban locations. A major conclusion that can be drawn from the analysis of the two Dallas activity center locations is that, in terms of community and urban design issues, AGT systems can more readily be integrated into a less densely developed or still-developing site.
4.4.5.1 Setting
The Market Center is a privately owned and operated establishment under a single ownership. If the transit services within the Market Center were privately operated then no public involvement would be required. However, if the services were a component of the regional network, then the public sector agencies discussed in the corridor institutional setting section would also be involved.
4.4.5.2 Key Issues
An AGT system to serve the Market Center appeared to have definite possibilities according to a Market Center official. Either a regional AGT system that was routed through the Center for this segment of the line, or a separate AGT shuttle, linked to the regional system were acceptable. Neither LRT nor transitway were acceptable alternatives within the Market
1As in the discussion of North Park, systems and alignments are assumed similar to those used in t he corridor analyses.
4-84
Center due to a lower level of service, higher cost and larger guideways. Surface bus, which is currently provided, was not considered to be as effective as AGT due to its interference with auto and pedestrian activity.
An AGT system was considered to provide the level of service required to serve the projected demand. It was felt to be aesthetically compatible with the existing Market Center buildings and was even considered as an enhancement to these buildings. The technology was acceptable although a non-automated guideway system might have been slightly preferred due to the perceived lower complexity in manual operations.
A major problem associated with an AGT system was its cost, although the Market Center representatives felt that the $7 million investment would be manageable and feasible under certain circumstances. Another problem involved issues of personal security since the crime rate in the Market Center area is high. However, it was felt that this problem could be resolved.
The Market Center representative cited a definite need for transit services that could bring people from hotels in the vicinity to the Market Center. Of particular importance was a connection between the Market Center system and the CBD since many Market Center trips either have an origin or destination in the CBD.
Currently, buses leased from the DTS adequately serve the Market Center demand, but the representatives felt that as the Market Center expands a higher performance system will be required.
The representative noted that personal security concerns in the Market Center area were similar to those in the CBD and were attributable to the Market Center's proximity to the downtown. While the representative felt that an AGT system due to its unmanned feature would pose more problems than a shuttle bus, he did not feel that these factors were insurmountable. A high level of surveillance and security both on the vehicles and in the station areas would substantially ameliorate crime problems. Currently the Market Center has a thirty member security force which could provide some security assistance for an AGT system.
4 • 4 • 6 SUMMARY
4-85
The cost of an AGT system was the single most important factor impeding an AGT deployment at this site. During early meetings, the representatives felt that the costs were unaffordable and that maximum reliance on a regional system would be required. During the final meeting, the representatives, in viewing the costs further, felt that an investment of between $400,000-$600,000 annually for an AGT system might be manageable. One representative cited several factors which would determine the cost-effectiveness of such an investment. First, the system would have to be linked to the regional system which would have to connect to the CBD. Second, he felt that the joint development of stations serving the regional and shuttle system was essential both from a cost and a service perspective. The City representatives welcomed this opportunity and noted that a commitment from the Market Center officials would affect their decision on the staging of the regional system to favor the Stemmons Corridor as the second priority corridor. Third, the Market Center representatives felt that if future or existing parking spaces could be reduced as a result of an AGT system then this would be an important factor in the investment worthiness of an AGT system. Parking construction costs are currently $2400 per space.
In summary, an AGT system was viewed positively at the Market Center. Its exclusive operations, high level of service and positive aesthetic image were all viewed very favorably and were considered to be important features which a bus system could not provide. An AGT system was expected to complement and enhance existing and planned economic activity and development, although it was not clear whether the system would serve as a catalyst for new development.
Issues of personal security are a concern in this area and would be of particular concern on an unmanned system. However, a high level of security, both personnel and equipment, in the stations and on the vehicles would ameliorate this problem.
The costs of an AGT system were considered to be marginally affordable but worthy of consideration if the "proper" system could be implemented. This system would have to connect to the CBD by way of the regional system. To the extent that a non-automated system was less costly, simpler to operate, and posed fewer security problems, such a system would be preferred, but its operations would have to be grade-separated.
A.l BASIC APPROACH
APPENDIX A TRANSIT SKETCH PLANNING PROCEDURE
This technique was developed primarily as a sketch planning model for transit systems analysis and design; the highway system is treated at a very general level.l The procedure links together a series of computer and manual calculations into an analysis methodology similar to that used in detailed urban transportation planning models, but introduces a number of features which significantly reduce time and cost requirements while maintaining a relatively high level of accuracy.
Given a set of analysis year trip tables, the procedure predicts mode shares for a representative sample of origin and destination (O/D) pairs, and then expands these to all O/D pairs to obtain transit and auto flows for the entire area. These transit flows are then assigned to a simplified transit network. Manual worksheets can be used in the steps for which less detail is needed or which involve calculations for the limited number of sampled O/D pairs; a computer is used in those steps which involve extensive calculations for all O/D pairs. This worksheet/computer combination minimizes much of the time and expense associated with an "all computer" approach, while eliminating much of the tedium that can be associated with sketch planning procedures.
This procedure has been applied in studies of a wide range of transit alternatives in several urban areas. In a transit study for the City of Regina, Saskatchewan, Canada, for example, about 30 transit system designs ranging from fixed-route buses to detailed personal rapid transit networks were examined in less than five person-weeks of an analyst's time.2,3 The procedure also has been applied
lcambridge Systematics, Inc., Dual Mode Planning Case Study, Final Report, Volume 3, prepared for the us Department of Transportation, 1977.
2,N.D. Lea and Associates, Ltd., Transportation Policy and Transit Improvement Study for the City of Regina, Final Report, Volume 2, prepared for the City of Regina, 1977.
3cambridge Systematics, Inc., Transportation Air Quality Analysis-Sketch Planning Methods, "Volume II Case Studies," prepared for the US Environmental Protection Agency, Washington, DC, December, 1979.

A.2 CALCULATION PROCEDURE
A-2
in Mexico City in an evaluation of several regional transit alternatives. It is suited for Phase I of UMTA's transit alternatives analysis process.
Figure A.l shows the sequence of steps used in applying the model system. Initially, a zonal system is developed by combining existing traffic zones to form a maximum of 100 analysis zones. Then, a series of transit alternatives are formulated. The characteristics of each alternative are specified in system description log sheets, which include information such as headways, fares, station spacing, vehicle size, etc. In addition, a simple transit network, representing only network structure and link speeds, is coded, using a highway (non-line-oriented) network building program (UTPS program HR) .1
The next step is selection of zone pairs which are representative of the types of transit service available in the urban area. Typically, the zone pair sample size ranges from 6 to 30. Because detailed demand analysis is performed only for these representative zone pairs, the sampling concept is one of the major efficiencies of this procedure. Each zone pair is divided into six "market segments" (or groups) based on the group's mode of access to transit (walk, auto, feeder) at both origin and destination (e.g., walk/walk, walk/feeder, feeder/walk, etc.). Transit service levels then are developed manually for each market segment, using the transit network (or a system map) and the system description log sheets. Similarly, auto service levels are developed manually. In this case, though, one service level is used for all market segments for a particular zone pair.
With service levels developed for each representative zone pair, user-supplied demand models (e.g., work and non-work mode choice models) are applied manually to obtain mode shares of work and non-work trips for each market segment within each representative zone pair. Assuming 18 zone pairs have been selected, this requires 2 trip types X 6 market shares X 18 zone pairs, or 216 calculations. At this point it is possible to introduce further market segmentation based on socioeconomic characteristics (i.e., auto ownership level, income, etc.). The increase in accuracy resulting from this finer market segmentation, of course, is obtained at the expense of additional calculations. However, the computation of
lus Department of Transportation, urban Mass Transportation Administration, UTPS Reference Manual, Washington, DC.
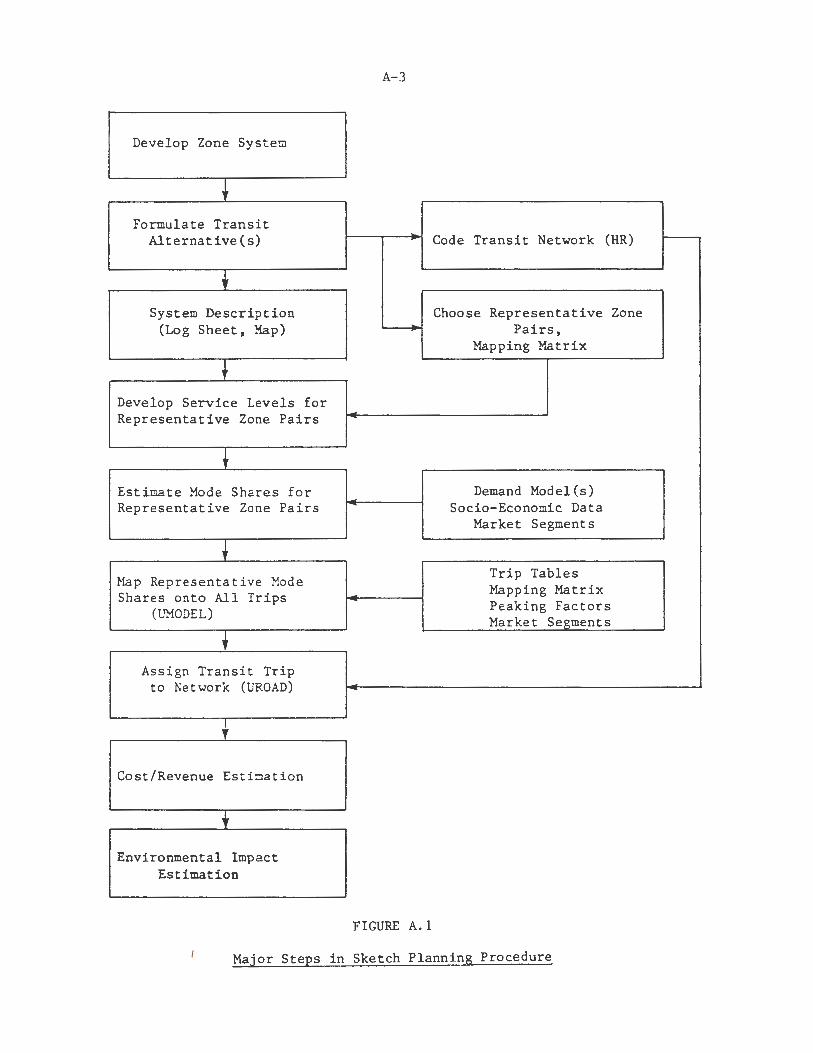
A-3
Develop Zone Syster:.i
+ Formulate Transit
Alternative(s) - Code Transit Network (HR) --t
System Description Choose Representative Zone (Log Sheet, Map) Pairs,
Mapping Matrix
t Develop Service Levels for Representative Zone Pairs ~
t Estimate Xode Shares for Demand Model(s)
-Representative Zone Pairs Socio-Economic Data
Market Segments
+ Map Representative Mode
Trip Tables
Shares onto All Trips ..; Mapping Matrix
(UMODEL) Peaking Factors Market Segments
• Assign Transit Trip
to Network (UROAD) -
t
Cost/Revenue Estioation
' Environmental Impact Estimation
FIGURE A.1
Major Steps in Sketch Planning Procedure
A-4
the demand models for these segments typically is quite easy, especially if a programmable calculator is available.
Next, these representative mode shares a r e mapped into all origin/destination pairs using a user-coded version of the UTPS program UMODEL. The input data required in this step are peak and off-peak person-trip tables, a "mapping" matrix relating each 0/D pair in the system to its corresponding representative 0/D pair, and, for each zone, an estimate of the proportion of total trips for each market segment. The outputs of UMODEL are transit and auto trip tables for peak (work) and off-peak (non-work) periods. These transit trip tables then are assigned to the simplified transit network using the UTPS program UROAD. Finally, a series of worksheets is completed to obtain estimates of transit operating and capital costs, and changes in auto emissions and fuel consumption.
* U.S.G . P.0. 727-720/1302-1684

S.C.R.T .0. LIBRARY
TA 1207 .A53 v.2 058 l 4
An Analysis of the U.S. market for automated
S CRTD LIBRARY 425 SOUTH MAIN
LOS ANGELES, CA. 90013

DEPARTMENT OF TRANSPORTATION URBAN MASS TRANSPORTATION ADMINISTRATION
WASHINGTON, O.C. 20590
OFFICIAL BUSINESS
S.C.R.T .D. LIBRARY
"""""'"' "" [~J URBAN MA SS TRAN SPORTATION AOMI NISTRATION
DOT 511 U.S.MAJL