Embed Size (px)
Citation preview

2018
Value Chain Analysis in District Charsadda Market and Employment Project (MEP)
Khalid Khan Khatki - Value Chain Consultant

i | P a g e
TABLE OF CONTENTS
LIST OF TABLES ........................................................................................................................... IV
LIST OF FIGURES ........................................................................................................................... V
ACRONYMS ................................................................................................................................. VI
ACKNOWLEDGEMENT ................................................................................................................ VII
EXECUTIVE SUMMARY .............................................................................................................. VIII
CONTEXT ..................................................................................................................................... 1
PURPOSE AND OBJECTIVE OF THE STUDY ...................................................................................... 1
STUDY OBJECTIVE ............................................................................................................................ 1
SCOPE OF STUDY .............................................................................................................................. 2
STUDY OUTPUT ............................................................................................................................... 2
METHODOLOGY AND APPROACH ................................................................................................. 3
STEP – 1: PRIORITIZATION OF VALUE CHAINS/SUB SECTORS ....................................................................... 3
STEP – 2: MAPPING AND DETAILED ANALYSIS OF SELECTED VALUE CHAINS .................................................... 3
STEP – 3: STRENGTH, WEAKNESSES, OPPORTUNITIES AND THREAT ANALYSIS (SWOT) ..................................... 4
STEP – 4: VALIDATION WORKSHOP ....................................................................................................... 4
LIMITATIONS OF THE STUDY ......................................................................................................... 4
VALUE CHAIN PRIORITIZATION ..................................................................................................... 6
APPROACH ..................................................................................................................................... 6
STRAWBERRY VALUE CHAIN ......................................................................................................... 9
OVERVIEW OF STRAWBERRY SUB-SECTOR .............................................................................................. 9
VALUE CHAIN FUNCTIONS ................................................................................................................ 10
INPUT SUPPLY ........................................................................................................................................... 10
PRODUCTION/POST-HARVEST MANAGEMENT ............................................................................................... 12
MARKETING.............................................................................................................................................. 14
PROCESSING ............................................................................................................................................. 15
CONSUMPTION ......................................................................................................................................... 16
ii | P a g e
VALUE CHAIN OPERATORS ............................................................................................................... 17
INPUT PROVIDERS ...................................................................................................................................... 17
PRODUCERS/FARMERS ............................................................................................................................... 17
MARKET FUNCTIONARIES ............................................................................................................................ 18
ENABLING ENVIRONMENT ................................................................................................................ 18
VC FACILITATORS ...................................................................................................................................... 18
VALUE CHAIN REGULATORS ......................................................................................................................... 20
Value Chain Governance/Integration 22 VALUE CHAIN MAP OF STRAWBERRY CROP (CHARSADDA) ....................................................................... 24
ECONOMIC ANALYSIS – STRAWBERRY VALUE CHAIN ............................................................................... 25
PROFITABILITY MARGINS ............................................................................................................................ 25
DISTRIBUTION OF VALUE ADDITION AND GROSS MARGINS ............................................................................... 28
EMPLOYMENT GENERATION ........................................................................................................................ 28
INEFFICIENCIES AND DISTORTIONS ................................................................................................................ 30
SWOT ANALYSIS – STRAWBERRY ...................................................................................................... 32
ROAD MAP – VALUE CHAIN DEVELOPMENT IN STRAWBERRY .................................................................... 34
RUNNER STAGE ......................................................................................................................................... 34
PRODUCTION STAGE .................................................................................................................................. 34
MARKETING.............................................................................................................................................. 34
VALUE CHAIN GOVERNANCE/TRANSPARENCY ................................................................................................ 35
TOMATO VALUE CHAIN .............................................................................................................. 36
OVERVIEW OF TOMATO SUB-SECTOR .................................................................................................. 36
VALUE CHAIN FUNCTIONS ................................................................................................................ 38
INPUT SUPPLY; .......................................................................................................................................... 38
PRODUCTION/POST-HARVEST HANDING: ...................................................................................................... 38
MARKETING.............................................................................................................................................. 41
VALUE CHAIN OPERATORS ............................................................................................................... 43
INPUT SUPPLIERS ....................................................................................................................................... 43
PRODUCTION/POST-HARVEST MANAGEMENT................................................................................................. 43
MARKETING.............................................................................................................................................. 44
ENABLING ENVIRONMENT ................................................................................................................ 44
VALUE CHAIN FACILITATORS ........................................................................................................................ 44
VALUE CHAIN REGULATORS ......................................................................................................................... 45
VALUE CHAIN INTEGRATION/GOVERNANCE ................................................................................................... 45
TOMATO VALUE CHAIN MAP (CHARSADDA) ......................................................................................... 47
ECONOMIC ANALYSIS – TOMATO VALUE CHAIN..................................................................................... 48
PROFITABILITY ANALYSIS ............................................................................................................................. 48
DISTRIBUTION OF VALUE ADDITION AND GROSS MARGINS: .............................................................................. 49
EMPLOYMENT GENERATION ........................................................................................................................ 50
DISTORTIONS AND INEFFICIENCIES ................................................................................................................ 52
SWOT ANALYSIS – TOMATO ............................................................................................................ 53
ROAD MAP – VALUE CHAIN DEVELOPMENT OF TOMATO ......................................................................... 54
ANNEX I: TERMS OF REFERENCE ......................................................................................................... 55

iii | P a g e
ANNEX II: CHECKLIST FOR FGDS/KEY INFORMANT INTERVIEWS ................................................................. 58
ANNEX III: OVERVIEW OF STRAWBERRY PRODUCTION IN PUNJAB .............................................................. 60
ANNEX IV: KEY CONTACT LIST ........................................................................................................... 62

iv | P a g e
List of Tables
Table 1: Finding of Prioritization Exercise in District Charsadda .......................................................... 7
Table 2: Seasonal Calendar of Strawberry Crop .................................................................................. 14
Table 3: Taxation Rates on Agriculture Land/Income (acre/annum) ................................................. 21
Table 4: Budget of Strawberry Crop in KPK (Sarkee) and Punjab (Sharaqpur) .................................. 26
Table 5: Comparing Farm Efficiency of Sarkee and Punjab (1 acre) ................................................... 27
Table 6: Breakeven Point Calculation for Strawberry in KPK and Punjab (1 acre) ............................ 28
Table 7: Gross Margins and Value Additions in Strawberry Crop (per kg of strawberry turnover) .. 28
Table 8: Calculation of Labor Intensity in Strawberry Cultivation ...................................................... 29
Table 9: Project New Job Opportunities with MEP Support ............................................................... 30
Table 10: Inefficiencies and Distortions in Strawberry Production Cycle (1 acre) ............................. 31
Table 11: SWOT Analysis of Strawberry Crop ..................................................................................... 32
Table 12: Supply Patterns of Tomato in Pakistan ............................................................................... 37
Table 13: Seasonal Calendar of Autumn Tomato Production............................................................. 39
Table 14: Seasonal Calendar of Vertical Tomato Production ............................................................. 40
Table 15: Seasonal Calendar of Surface Tomato ................................................................................. 41
Table 16: Tomato Budgets in Autumn, Vertical and Surface Tomato (Charsadda – 1 acre).............. 48
Table 17: Breakeven Point Calculation for Different Tomato Cultures in Charsadda (1 acre) .......... 49
Table 18: Gross Margins and Value Added by Value Chain Players (per kg tomato turnover) ......... 50
Table 19: Distribution of Labor in Tomato VC Functions (1 acre) ....................................................... 51
Table 20: Projected New Labor Opportunities of Conversion from Ground to Vertical Tomato
Production ............................................................................................................................................ 51
Table 21: Distortions and Inefficiencies in Tomato Value Chain (1 acre) ........................................... 53
Table 22: SWOT Analysis of Tomato Crop ........................................................................................... 53

v | P a g e
List of Figures
Figure 1: Prioritization Criteria for Value Chain Selection .................................................................... 6
Figure 2: Prioritization of Fruits and Vegetables, Agribusiness Support Fund, 2012 ........................... 8
Figure 3: Global Production of Strawberry (FAOSTAT) ......................................................................... 9
Figure 4: Strawberry Runner Production ............................................................................................. 10
Figure 5: Input Dealer in Sarkee .......................................................................................................... 12
Figure 6: Ready to harvest Strawberry, the surface contact of fruit with soil devalues quality
(Courtesy: ASF, PHRA 2012) ................................................................................................................. 12
Figure 7: Some Processed Products of Strawberry in Super Market .................................................. 16
Figure 8: Value Chain Integration in Strawberry ................................................................................. 22
Figure 9: Some Examples of Farmer Group Interaction on WhatsApp in Punjab .............................. 23
Figure 10: Well Managed Mulched Strawberry Field in Punjab ......................................................... 25
Figure 11: Improved Technologies in Punjab: Consumer Packaging; Tunnel + Drip Irrigation;
Strawberry Runners in Peat moss Trays .............................................................................................. 35
Figure 12: Provincial Tomato Shares and Their Respective Production Potential ........................... 36
Figure 14: Vegetable Production in KPK (2015-16) ............................................................................. 37
Figure 15: Area and Production of Major Vegetable in KPK ............................................................... 37
Figure 16: Field Based Ripening Heaps of Tomato .............................................................................. 39
Figure 17: Tomato in Tangi Market Offered for Auction .................................................................... 42
Figure 19: Private Company Banner of Pest Management ................................................................. 45
Figure 18: Value Chain Integration in Tomato Crop ............................................................................ 46
Figure 20: Farmer Using Hand Made Cultivator for Hoeing ............................................................... 50
Figure 21: Post-harvest Losses of Tomato ........................................................................................... 52
vi | P a g e
ACRONYMS
ADP Annual Development Plan
AED Agriculture Extension Department
ASF Agribusiness Support Fund
CRS Crop Reporting Service
CMP Crop Maximization Project
EDT Enterprise Development Training
FEG Farmer Enterprise Group
FSC Farm Service Centre
FSC&RD Federal Seed Certification and Registration Department
FFS Farmer Field School
FBS Farmer Business School
GM Gross Margin
KG Kilogram
KPK Khyber Pakhtunkhwa
PRA Participatory Rural Appraisal
PKR Pakistan Rupees
RMA Rapid Market Appraisal
ROI Return on investment
SRSP Sarhad Rural Support Programme
MEP Market and Employment Project
MIS Market Information System
MT Metric Tons
VC Value Chain
VCD Value Chain Development
vii | P a g e
ACKNOWLEDGEMENT
Value Chain Analysis in district Charsadda is commissioned by Market and Employment Project of Helvetas Swiss Intercooperation. The assessment was made possible through the active support, facilitation and continuous guidance of MEP Management and their focal Points, Mr. Fayaz Ahmed (Value Chain Specialist) and Mr. Kaleemullah Shinwari (Field Coordinator) during field work. I need to express my sincere gratitude to Mr. Liaquat Ali (District Director Agriculture) for his overall facilitation and support, Mr. Mohammad Idress (Subject Matter Specialist, Charsadda), Mr. Rafiq Jan (Field Assistant, Sarkee) for their dedication and continuous facilitation throughout field work. The cooperation of all stakeholders consulted during field work was commendable in providing every possible detail for assessment parameters in a candid manner.

viii | P a g e
EXECUTIVE SUMMARY
Market and Employment Project (MEP) is Dutch Funded (Ministry of Foreign Affairs) project implemented by Helvetas Swiss Intercooperation in District Charsadda with the specific goal to create sustainable income generating and livelihoods opportunities leading to jobs, income and more resilient communities. Market and Employment Project (MEP) has commissioned a value chain study to identify the most feasible value chains and devise a comprehensive strategy for the value chain development in the short, medium and long term in district Charsadda.
The methodology used for value chain analysis was interactive and drawn from the participatory tools of Participatory Rural Appraisal. Primary data collection through focus group discussion and key informant interviews, and triangulation with authentic secondary research was used as an approach for value chain analysis. Prioritization of agriculture sub-sectors, mapping and detailed analysis of selected value chains, SWOT analysis for value chain development and validation workshops were important steps in the exercise. Total of 8 focus groups discussions have been held with different stakeholders and more than 35 key informants have been contacted and interviewed for the subject value chain analysis in Charsadda, Peshawar, Swat, Lahore and Sheikhupura (Sharaqpur) areas.
Prioritization exercise was held with key stakeholders of agriculture sectors in district Charsadda, drawing representative of agriculture line departments, private sector, and progressive farming communities from all 3 Tehsils of district Charsadda. The approach for prioritization exercise was adopted from the earlier experience of Helvetas in Sindh, Pakistan. The parameters were primarily based on market orientation, employment generation, and important cross cutting themes. Fruits, Vegetables, Wheat, Sugarcane and Maize were presented for ranking exercise, keeping in view the economic significance of these crops in district Charsadda. Strawberry and tomato were selected for detailed value chain analysis. Commercialization, profitability margins, shift toward intensive farming practices, and land fragmentation were some of the reason identified for shifting tendency towards high value crops in fruits and vegetable groups.
The enabling environment is facilitated through range of line departments, farm service centers and private sector institutions. The role of private sector is more vibrant in transfer of technologies, extensive outreach and technical advisory services. Dedicated extension material is not available for either vegetable and fruit crop from credible institution in district Charsadda, some barely available extension leaflets and brochures are available through private companies but merely promoting their own products. However, the facilitation is mostly products oriented, which induced pest resistance, impact crop efficiency and also pose environmental hazards. The regulatory framework is well defined through proper legislations but implementation mechanisms are rather weak to check sub-standards crop inputs. Strong advocacy with Agriculture Ministry, capacity building of department representatives and awareness among farming communities is required to improve accountability, check and balance, and sustainable public private networking in agriculture crop sector.
Strawberries (Fragaria x ananasa Duch.)
was introduced in Charsadda in 1994-95. The economic return of strawberry crop is 4 times higher than sugarcane and 9 times higher than wheat crop in district Charsadda which helped rapid conversion towards strawberry cultivation.
Strawberry is being cultivated exclusively from propagative material (runner) in its entire history in Pakistan. TOPS, CORONA and SCHINDLER are few successful varieties in Strawberry crop; however, SCHINDLER is the only strawberry cultivar these days. Runners are procured exclusively from Swat and Upper Dir areas, where more than 500 million runners have been channeled to Sindh, Punjab and KPK areas in 2017. Both strawberry plant and fruit are succulent and susceptible to number of insect pests during production stages. The crop

ix | P a g e
suffered significant losses during rainy season, and inappropriate post production handling. Mites become a major pest problem in strawberry crop due to favorable climatic conditions and increased pest resistance. Lack of knowledge provides opening for pesticide/fertilizer adulteration, subsequently provide basis for the use in-efficient and sub-standard chemicals.
Intensive management practices and high cost of investment limits farm size of strawberry. The usual practice is 1-acre average in Charsadda where research confirmed 0.68 acres of farm size is optimum for strawberry cultivation.
An un-conventional market place in Sarkee is the major marketing venue for strawberry. The same market is linking Inter-market trade with far flung district of KPK and Punjab. The farm gate marketing option is more preferred by farming community for price premium, save marketing charges, loading/unloading, and time efficient. The retail function of strawberry expands rapidly in recent years owing to increased consumption of strawberry; however, the potential consumption growth is constrained due to health concerns related with extensive usage of chemicals.
The budget demonstrates that strawberry crop in Charsadda returns a lucrative gross margin of PKR 455,900 (52%) per acre of land and the rate of return on investment is 107%. The profitability of strawberry in Charsadda is slightly higher than Punjab (46% gross margin), owing to differences in some major cost heads (for instance, higher seed rate, the marketing cost and distant markets). Comparative analysis did point out lapses in farm efficiency of district Charsadda, where farmers can enhance profitability margins with improved practices, especially mulching of crop to save labor cost. It is estimated that strawberry production in Charsadda alone generated 149,000 man-days in a single crop cycle. Shortage of labor is a growing concern at all levels of strawberry production. The feasibility of mechanization and innovation need to be tested from different experiences to subside pressure on growing labor needs.
Tomato (Solanum lycopersicum) is a major vegetable crop in Pakistan both in terms of areas sown and production capacity in the country. Sindh is the major producer of tomato in Pakistan, followed by KPK, Baluchistan and Punjab. The seasonal calendar is evenly distributed all across Pakistan, where the supply during September – December is relatively tight which provide opening for tomato import from India, Afghanistan and Iran. Tomato production is leading crop among all vegetable produced in KPK (23% area and production). Charsadda is ranked 3rd for tomato production in the province, and has grown under diverse cultural practices in the district. Rabi crop (Spring-Summer) is more prominent in Tehsil Charsadda and Shabqadar, while kharif crop (Autumn-Winter) in grown exclusively in the frost free zones of Tehsil Tangi.
The Autumn Crop is practiced mainly on the strips stretched along Mohmand Agency toward Malakand on a rainfed area, approximately on around 1000 acres. Vertical Gardening is more common in Tehsil Tangi and Charsadda (Harichand, Sarkee, Mandani, Gulabad are main Union Councils in Tehsil Tangi) on an area of 1000-1200 acres in Charsadda. Surface tomato is more common in Tehsil Shabqadar on an area of around 100 acres, using traditional production technologies. The seasonal calendar of tomato Rabi crop is started in January, the crop lasts in May-June under traditional practices, while extends till August under vertical cultivation. The autumn crop cycle is in between August and January.
Tangi and Dargai vegetable markets are specialized in tomato autumn crop while Harichand, Swat and Timergara markets are prime options for vertically produced tomato. Tomato production from Shabqadar is traded in Shabqadar and Peshawar vegetable markets. The packaging materials used in all production patterns is traditional and tends to have un-necessary crop losses during harvesting and marketing cycles. High rate of price fluctuations in tomato crop induced discouraging tendency among tomato growers during last 3-4 cropping cycles.

x | P a g e
Vegetable export is more emphasized on bitter gourd, peas, brinjal, cucumber, fresh beans and carrot from the same production clusters. Tomato is not a preferred crop, not only because of perishability but also not complying with the consumer preference of Middle East (prefer round tomatoes). Production capacity of improved hybrid seeds is not attained largely due to non-compliance of technical recommendations and structural limitations inherent in the farming system (technical capacities, quality of agro-chemicals, irrigation issues, and in-efficient post-harvest management).
Analysis revealed that winter crop performs the best among all cropping patterns of tomato in district Charsadda, it offers high gross margin (68%) and minimize the risk associated with least production capital required for tomato production. The Return on Investment (ROI) is much higher for autumn crop (212%) than vertical (32%) and ground tomatoes (17%) in 2016-17. The vertical gardening though high investment rate and extensive production, offered risky gross margin (24%) for tomato growers in 2017. Likewise, the performance of surface tomato is not outstanding during last 3-4 years, the least gross margin of 15% during last cropping season resulted in further reduction of tomato cropping area in 2018.
Though there are some valid limitations of current research due to data biasedness, paucity of time and resources, analysis framework and purposive sampling techniques, and the scope of improvement should not be overruled with further detailed and thematic research. However, the consultation process did highlight certain important recommendations for value chain development interventions in both studied value chains. The interventions related to enabling environment and service delivery will not only benefit the studied crops and its subsequent expansion, the spill over will also have positive impact on other high value crops in the region.
The value chain development recommendations are summarized herewith for improved decision making and drawing road maps for value chain development strategies. Interventions on part of regulatory framework and service delivery of public/private institutions will foster the overall enabling environment for agriculture development in the area. Crop specific recommendations are also listed separately for targeted interventions. Similarly, areas of further detailed research are also mentioned separately for future consideration. It is forecasted that MEP value chain development strategies in these 2 crops will generate additional 115,490 (both strawberry and tomato) direct/in-direct employment opportunities in district Charsadda.
Value Chain Domains
Projected Outcomes Output Level Interventions
Value Chain Regulators
- Improving check and balance
- Awareness and advocacy campaigns
- Improve decision making on high value crops
- Facilitating practical SOPs for Agriculture Policy, Pesticide/fertilizer/seed acts,
- Orientation sessions on regulatory framework,
- Capacity building of AED, FSC, Agriculture Research
- Action plans for high value crops - Mapping un-conventional crops, and
advocating targeted strategies for the expansion of such niche crops (value chain studies, technical feasibilities, Crop Reporting Service etc)
xi | P a g e
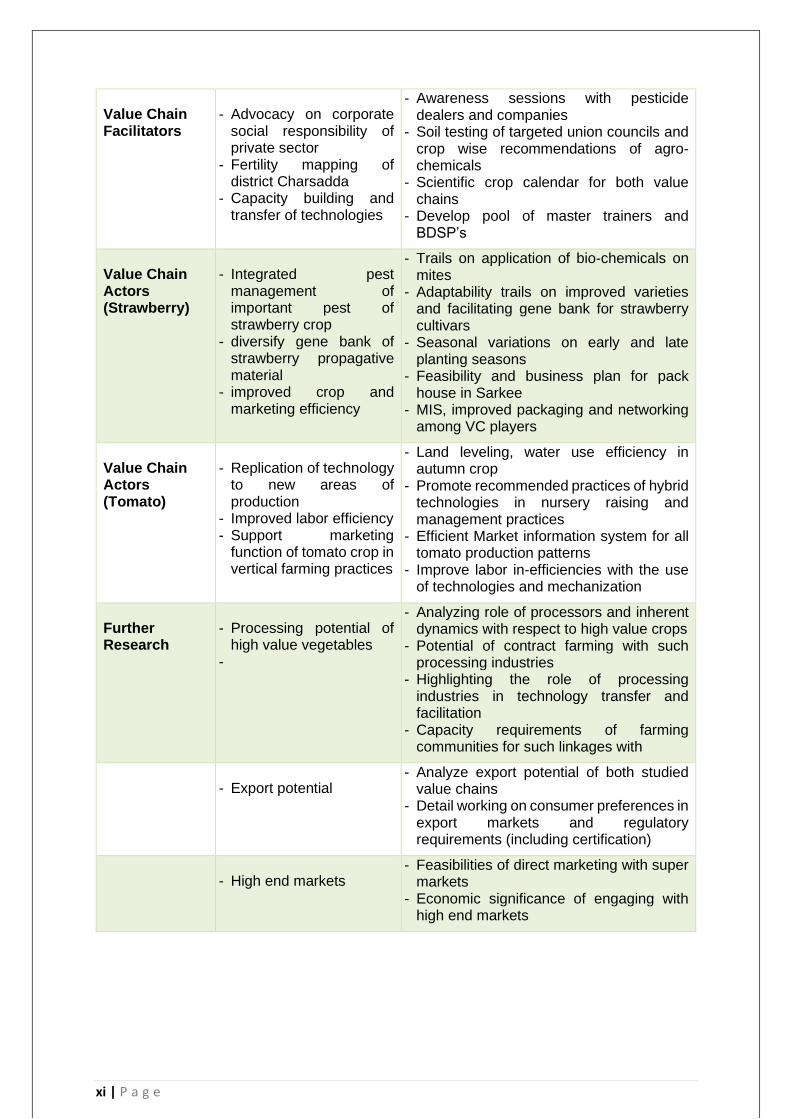
Value Chain Facilitators
- Advocacy on corporate social responsibility of private sector
- Fertility mapping of district Charsadda
- Capacity building and transfer of technologies
- Awareness sessions with pesticide dealers and companies
- Soil testing of targeted union councils and crop wise recommendations of agro-chemicals
- Scientific crop calendar for both value chains
- Develop pool of master trainers and BDSP’s
Value Chain Actors (Strawberry)
- Integrated pest management of important pest of strawberry crop
- diversify gene bank of strawberry propagative material
- improved crop and marketing efficiency
- Trails on application of bio-chemicals on mites
- Adaptability trails on improved varieties and facilitating gene bank for strawberry cultivars
- Seasonal variations on early and late planting seasons
- Feasibility and business plan for pack house in Sarkee
- MIS, improved packaging and networking among VC players
Value Chain Actors (Tomato)
- Replication of technology to new areas of production
- Improved labor efficiency - Support marketing
function of tomato crop in vertical farming practices
- Land leveling, water use efficiency in autumn crop
- Promote recommended practices of hybrid technologies in nursery raising and management practices
- Efficient Market information system for all tomato production patterns
- Improve labor in-efficiencies with the use of technologies and mechanization
Further Research
- Processing potential of high value vegetables
-
- Analyzing role of processors and inherent dynamics with respect to high value crops
- Potential of contract farming with such processing industries
- Highlighting the role of processing industries in technology transfer and facilitation
- Capacity requirements of farming communities for such linkages with
- Export potential - Analyze export potential of both studied
value chains - Detail working on consumer preferences in
export markets and regulatory requirements (including certification)
- High end markets - Feasibilities of direct marketing with super
markets - Economic significance of engaging with
high end markets

CHAPTER 1 - BACKGROUND
1 | V a l u e C h a i n A n a l y s i s i n D i s t r i c t C h a r s a d d a
CONTEXT
Market and Employment Project (MEP) is Dutch Government (Ministry of Foreign Affairs) project implemented by Helvetas Swiss Intercooperation in District Charsadda with the specific goal of creating sustainable income generation and livelihoods opportunities leading to jobs, income and more resilient communities. The project intends to develop strategies that could help in creating more job opportunities for the people in services sector as well as in the commodity sector like agriculture, livestock etc.
PURPOSE AND OBJECTIVE OF THE STUDY
Market and Employment Project (MEP) has commissioned a value chain study to identify the most feasible value chains and devise a comprehensive strategy for the value chain development in the short, medium and long term in district Charsadda.
The study intends to identify the agriculture based value chains and prioritize these value chains based on the set criteria provided by the project for further exploration. The research is supposed to gain a comprehensive and deeper understanding of the existing status of the value chains and identify areas of improvement for high economic returns for the value chain players. The scope of work involved prioritization of the value chains, detail value chain analysis and market research and based on the field findings develop workable implementation strategy for identified value chains keeping in view the context of the area.
Study Objective
The overall objective of the study is to conduct a detailed value chain analysis of selected sub-sectors in order to:
- Identify most suitable agriculture value chains/sub-sectors in district Charsadda, taking into consideration potential replacement of imported supply by local production;
- Conduct detail assessment for the top 2 prioritized sub sectors/value chains keeping in view its market potential, employment generation, extended outreach and align with the scope of commissioned project in the target location;
- Identify handy skills, capacities and inputs that each sub-sector requires for up-gradation;
- Identify and analyze potential business areas, commercial status, value addition possibilities, gaps and intervention points for the identified sub-sectors;
- Identify strengths, weaknesses, opportunities and threats (SWOT) of the identified commodities/products/services, and draw a road map of strengthening identified value chains;
- Identify main constraints faced by the existing producers in each of the value chain and suggest possible solutions;
- Identify the main trends and drivers for enabling environment in each sub-sector.

CHAPTER 1 - BACKGROUND
2 | V a l u e C h a i n A n a l y s i s i n D i s t r i c t C h a r s a d d a
Scope of Study
The scope of the study included key market for agriculture products (current and potential) produced in various parts of the district Charsadda; tracing and tracking national markets, regional consolidation centers and local aggregation points for agriculture produced in the selected district. Study in the domestic markets was undertaken by conducting key informants’ interviews, and focus group discussions with market players in commodity chains. Whilst the study TORs also deliberated on the potential role of women in the target district, emphasis will be given to those potential sector and value chains which engage women as key entrepreneurs and provide potential to improve their skills for income optimization and creating an enabling environment to improve women empowerment in the studied value chains.
Study Output
The proposed assignment was required to conduct a comprehensive value chain analysis of potential sub-sectors in district Charsadda; by employing appropriate approach and methodology, inter-alia review of credible secondary data (published) and relevant past studies of the same nature. The findings are supposed to support the targeted groups of the MEP to explore the inherent potential among the farming and non-farming communities of district Charsadda to improve their well-being and economic return. The report will help the project to introduce skills that will help small farmers and entrepreneurs to engage in profitable small businesses, improve and diversify their livelihoods and contribute to improved household resilience through better response to the local market demand. The analysis will facilitate the development of appropriate design of interventions with community involvement and utilization of a market oriented approach. It will enable the project to work with individual farmers and groups to improve their existing market access strategies. The study findings will bridge the gap between the target group and the market by exploring market opportunities and ways to address market constraints and obstacles for the mutual benefits of all players in the respective sub-sectors. It is expected that a market assessment and value chain study report will enable the Project to develop a comprehensive value chain development program for the project target group in district Charsadda to transform agribusinesses paying dividends to disadvantaged communities and ultimately leading to economic growth and stability in the area.

CHAPTER 2 – METHODOLOGY
3 | V a l u e C h a i n A n a l y s i s i n D i s t r i c t C h a r s a d d a
METHODOLOGY AND APPROACH
“Making Value Chain Work Better for the Poor” is considered an appropriate model for value chain analysis in the context of developing countries. Guiding principles from the same model was used during said assessment using standard indicators and parameters as found appropriate for the context and further discussion with project personnel. Both primary and secondary sources, vis-a-vis appropriate quantitative and qualitative tools are used in the methodological approach. The primary research was emphasized on interactive and consultative PRA tools of focus group discussions and key informant interviews while secondary research took guidance from published research of credible sources in district Charsadda. Qualitative and quantitative parameters were built upon perception and institutional knowledge of representative stakeholders during field research. Information collected during FGD and KIIs will lead to subsequent analysis like agro-ecological zoning, supply trends, activity calendar, price fluctuation, profitability analysis, employment generation, market positioning and mapping of value chain players and functions.
The step wise approach and pattern of the analysis followed as mentioned below;
Step – 1: Prioritization of Value Chains/Sub sectors
The scoping and prioritization of value chains was done in two steps i.e. stock taking of the existing data collected through market analysis and participatory prioritization exercise with representatives of on farm communities, consultation with respective field staff, key public and private sector institutions. The criterion was adopted from the previous similar work of Helvetas Swiss Intercooperation, and coherent with the scope of Market and Employment Project. Major factors important for inclusion in the prioritization will emerge from the three pillars of sustainable development i.e. social, economic and environmental. The important consideration in prioritization was mutual agreement on relative weightage to each indicator and subsequent scoring on the same for different sub-sectors. The outcome was presented in the form of grid analysis of the potential areas.
Paucity of time and resources was limiting the detailed value chain analysis to 2 sub-sectors at this point in time; however, the long listing of potential areas from prioritization exercise will be kept for later consideration and detailed analysis by MEP.
Step – 2: Mapping and Detailed Analysis of Selected Value Chains
The start and end points of the value chain are usually determined to be input supply and consumption respectively. The allocated time and resources was efficiently utilized between these two ends for analysis and draw valid recommendations for MEP to introduce programmatic interventions in the project targeted locations of district Charsadda. Mapping of the prioritized and selected value chains was undertaken in detail wherein key stakeholders were visited, including value chain players, facilitators and influencers for selected sub-sectors from start to end. This was done in a detailed consultative process using interactive techniques of focus group discussions and individual key informants’ interviews as found appropriate. All issues and gaps were discussed and documented in a structured manner. For effectively conducting the FGDs, a framework/checklist was developed and used for gathering information from the participants at all levels. Within the chain analysis, efforts will be made to identify the next stakeholder through referral methods for both backward and forward actors in the chain. Mapping exercise captured all relevant information that pertain to value chain functions, activities, actors and relationships, service providers as well as enablers. Mapping will also be used to identify key opportunities and critical constraints.

CHAPTER 2 – METHODOLOGY
4 | V a l u e C h a i n A n a l y s i s i n D i s t r i c t C h a r s a d d a
Both quantitative and qualitative analysis of the value chains were carried out that include analysis of the volumes of supplies of each chain, number of actors involved from start to the end, creation of employment at each node, an estimated job creation and enterprises in the support function level, market margins and profitability, and inefficiencies and distortions identified in respective value chain. The analysis captured inefficiencies in the chain and estimated pre/post-harvest losses that could be avoided. In addition, an overall assessment of the competitiveness was also undertaken, benchmarking and tapping unexplored niches in the local and regional markets.
The study was based on purposive sampling of actors involved and relevant to the various areas of the value chains. The approach was mainly explorative and key informants drawn for different levels of analysis were based on their relevance, collaboration, institutional knowledge, referral, and credibility. The study approach in the field was probing and case building for each operator and looking at the chains from the perspective of the private sector. Though the sampling frame was purpose, 2-3 players were approached at each value chain function to make sure cross checks, validate and triangulate information for valid analysis and better precision.
The initial scope of work was designed for district Charsadda only, however the identification of Strawberry for detailed analysis compelled to include runner production cycle in Swat as well as strawberry production in Lahore and Sheikhupura for comparative analysis for technology innovations and benchmarking.
Total of 8 focus groups discussions have been held with different stakeholders and more than 35 key informants have been contacted and interviewed for the subject value chain analysis in Charsadda, Peshawar, Swat, Lahore and Sharaqpur areas.
Step – 3: Strength, Weaknesses, Opportunities and Threat Analysis (SWOT)
The key findings and analysis patterns were structured in a SWOT analysis and ascertain implications of each weakness and threat with respect to the opportunities. Prioritization of constraints were undertaken in order to identify the most relevant and to address critical constraints in order to achieve competitiveness in the selected businesses. The SWOT analysis was further translated in stipulating road-maps for selected value chains. The recommendations were in line with the organization strategy as per regular consultation with project focal points and detailed debriefing session after field work.
Step – 4: Validation workshop
A one-day validation workshop was organized with key stakeholders of selected and analyzed value chains in district Charsadda at the end of field survey. Preliminary analysis was shared with the group of 40 participant stakeholders, not only to validate the findings of field work for discrepancies, the proposed framework of value chain development was also being authenticated with much pragmatic inputs from stake-holding groups. Representatives of Agriculture Extension Department, Agriculture Research, Water Management, input provides, companies representatives, and progressive farmers participated in the consultation workshop. The analysis was updated and more inputs were integrated in devising road maps of value chain development of strawberry and tomato sub-sectors in district Charsadda.
LIMITATIONS OF THE STUDY
The study design was crafted in accordance with standard methodology for value chain assessment exercise, duly customized with the TOR requirement of the study. The methodology calls for covering representative operators in each function of the value chains

CHAPTER 2 – METHODOLOGY
5 | V a l u e C h a i n A n a l y s i s i n D i s t r i c t C h a r s a d d a
as well as key informants having relevance to the service delivery and enabling environment aspects. The study approach in the field was probing and case building for each operator and looking at the chains from the perspective of the private sector, contextual with poverty reduction and efficient management of resources.
The research findings are in line with the aspirations of MEP project, however certain valid limitations are attached with the nature of analysis and data collection tools. The use of purposive sampling methodology over systematic sampling technique may have induced research biasedness of respondents and analyst. Probing and cross validation through reaching value chain players at different layers helped in overcoming individual biasedness, however the confidence level on analyzed thematic areas could be improved with repeated consultation and supporting research exercise. Moreover, price analysis is a stand-alone domain of marketing research; price inconsistencies, and dramatic fluctuations in the marketing patterns of fruits/vegetables coupled with lack of documented data in the country make it challenging for pragmatic farm budgets and efficiency analysis. Best possible estimates are used in quantitative analysis for this study, however, a robust market information system is required for informed and improved decision making about the studied value chains.
Certain aspects of the value chains were asking for further detailed and thematic research, especially the areas of processing and export potential having an extended scope and was not possible to be analyzed in the stipulated timeframe. Moreover, in-situ analysis of strawberry marketing chain as well as vertical and ground tomato markets would provide a chance to consulting more diverse market players and direct observation would augment the collected information. The benchmarking and comparative analysis with

CHAPTER 3 - PRIORITIZATION
6 | V a l u e C h a i n A n a l y s i s i n D i s t r i c t C h a r s a d d a
VALUE CHAIN PRIORITIZATION
With support and due facilitation of district Agriculture Extension Department, a prioritization
exercise was organized with key stakeholders in district Charsadda. The exercise was the first
step towards detailed value chain assessment and intended to identify the most potential sub-
sectors for detailed analysis. The exercise was held with the key informant group, identified
together with Agriculture Extension department from the important stakeholders of agriculture
sector in district Charsadda.
Approach
Participation: The exercise was held with representative stakeholders from agriculture line
departments (Agriculture Extension, Water Management, Soil Conservation and Testing
laboratories, Crop Reporting Service), farm service centers, progressive farmers, and inputs
suppliers. Stakeholders from all 3 Tehsils of district Charsadda were invited to have a
balanced geographic representation and to raise inputs for important cultivated crops in
different pockets.
Criteria: The prioritization criteria was adopted from the earlier experience of MEP1, whereas
respective importance was given to market oriented factors while also considering specific
vulnerabilities of poor involvement, gender consideration and impact on environment. Eight
factors along with their respective weightage are listed here;
Figure 1: Prioritization Criteria for Value Chain Selection
Mechanism: The prioritization exercise was initiated with the brainstorming session on the
status of agriculture sector in district Charsadda, pinpointing the strategic strengths of farming
practices and the broader socio-economic realities faced by the rural communities of district
Charsadda. Five crops or/and crop groups have been selected for detailed prioritization on
1 Rapid Value Chain Assessment in Sindh, Helvetas Swiss Intercooperation, March 2016

CHAPTER 3 - PRIORITIZATION
7 | V a l u e C h a i n A n a l y s i s i n D i s t r i c t C h a r s a d d a
the basis of their economic significance, commercial aspects and relevance for overall
livelihood patterns in district Charsadda. The selected crops were;
- Vegetables (Tomato, Bitter Gourd, Tinda Gourd);
- Fruits (Strawberry, Honey Dew Melon, Plum);
- Wheat;
- Maize;
- Sugar Cane;
Participants were encouraged to assign values to each crop on these factors during discussion
and consensus building. Fruit and vegetable groups have been scored the highest ranking
followed by wheat, sugar cane and maize. Commercialization, profitability margins, shift
toward intensive farming practices, and land fragmentation were some of the reason identified
for shifting tendency towards high value crops in fruits and vegetable groups.
Table 1: Finding of Prioritization Exercise in District Charsadda
Though fruits and vegetables identified were having equal significance, however after further
elaboration and due validation with Agriculture Extension Department and some key
informants, tomato and strawberry was selected for detailed value chain analysis and
stipulating road map for the project engagement in district Charsadda. The remaining identified
fruits and vegetables will be given due consideration in the later phases of the Market and
Employment Project.
The output of the prioritization exercise is not unique, and evidence base is available that
these crops have been emphasized in the recent past of such development interventions.
Participatory Rapid Horticulture Appraisal (PRHA2), conducted by Agribusiness Support Fund
(ASF) in 2012 in an effort to draw a baseline for their agribusiness project identified the same
priority sub-sectors for development interventions in Peshawar Valley. Their criteria of
prioritization were drawn from the same approach of market orientation, and considering
important aspect of engaging small holders and women. They have identified peach, citrus,
strawberry, apple, melon, apricot, potato, tomato and onion as most potential sub-sector for
Peshawar Region. The overall ranking of fruits and vegetables under PRHA is given under.
2 http://pdf.usaid.gov/pdf_docs/PA00JQRJ.pdf
Score Weighted
scoreScore
Weighted
scoreScore
Weighted
scoreScore
Weighted
scoreScore
Weighted
score
Market Access 2 5 10 4 8 3 6 4 8 5 10
Volume 2 3 6 4 8 5 10 3 6 4 8
Income Generation 3 4 12 2 6 3 9 5 15 3 9
Employment Created 3 5 15 3 9 2 6 4 12 2 6
Market Demand 3 5 15 2 6 2 6 5 15 3 9
Poor Involvement 2 5 10 3 6 4 8 3 6 2 4
Women Involvement 2 1 2 2 4 1 2 2 4 3 6
Envrionment 2 0 0 2 4 4 8 1 2 4 8
Aggregate Weighted Score 70 22 51 24 55 27 68 26 60
Factors Weightage
Vegetables
(Tomato, Bitter
Gourd)
Maize Sugar CaneFruits (Strawberry,
Honey Dew melon)Wheat

CHAPTER 3 - PRIORITIZATION
8 | V a l u e C h a i n A n a l y s i s i n D i s t r i c t C h a r s a d d a
Figure 2: Prioritization of Fruits and Vegetables, Agribusiness Support Fund, 2012

CHAPTER 4 – STRAWBERRY
9 | V a l u e C h a i n A n a l y s i s i n D i s t r i c t C h a r s a d d a
STRAWBERRY VALUE CHAIN
Overview of Strawberry Sub-Sector
Strawberries (Fragaria x ananasa Duch.), originally grown in northern parts of Europe and
were also found in different parts of Russia, Chile and United States. Strawberries are also
thought to have been cultivated in ancient Rome in large scale for medicinal purposes. During
the 13th century, France also cultivated strawberries for its medicinal purpose. The roots, fruits
and leaves of Alpine strawberry were widely used in these countries to make medicine that
were used to cure digestive problems and skin diseases. Strawberries are known for its unique
taste and flavor, nutritionally low in calories, rich in vitamin C, potassium, folic acid, fiber, and
vitamin B63 (Allah Dad Khan, CMPII 2014). Strawberry is cultivated widely across the globe
and FAOSTAT reported strawberry cultivation from 77 countries as of 2016, however this
milestone might be higher due to non-reporting of strawberry crop from remaining countries
(Pakistan is an example!).
Over the last two decades, strawberries
have experienced one of the highest rates
of consumption growth of all fruit and
vegetables across the globe4. The growth
in strawberry production is recorded 23%
during last 5 years and is being
continuously growing with every passing
year5. Strawberry grown on an area of
402,338 ha globally and the production
exceed 9 million tonnes in 2016. China,
USA, Mexico, Egypt, and Turkey are five
leading producers of Strawberry crop,
these leading countries contributes 72% of
global production.
Strawberry has been introduced by Rafhan Foods as a crop in Swat during the period of 1979-
80 for flavoring their different products. When the quantities exceeded the company
requirement, they helped in linking the surplus crop to different 5 star hotels in Pakistan. The
Pioneer Progressive farmer is still alive and yet dedicated in introducing new varieties of
strawberries from his own networks and knowhow.
Strawberry Crop started in Charsadda in 1994-95, introduced by a progressive farmer from
Swat. It was fetching good price those days (PKR 18 per kg), encouraged other farmers to
replicate strawberry as a crop in the area. Strawberry cultivation is reported extensively in 4
adjacent union councils of Charsadda (Sarkee Titara, Utmanzai, Tarangzai, Behlola). It
3 Khan AD (2016) Straw Berry Cultivation in Charsadda A District Of Cmp-II In NWFP By Allah Dad Khan Agriculture Extension
And Ghulam Nabi Agriculture Research Tarnab Peshawar. Adv Plants Agric Res 4(3): 00142. DOI: 10.15406/apar.2016.04.00142
4 http://www.freshplaza.com/article/159848/OVERVIEW-GLOBAL-STRAWBERRY-MARKET (visited on 27 January 2018)
5 http://www.fao.org/faostat/en/#data/QC ((visited on 27 January 2018)
7,3
90
,08
8
7,8
86
,51
9
8,1
58
,70
3
8,7
52
,16
7
9,1
26
,33
7
0
2000000
4000000
6000000
8000000
10000000
2012 2013 2014 2015 2016
Pro
du
ctio
n (
Ton
ne
s)
Figure 3: Global Production of Strawberry (FAOSTAT)

CHAPTER 4 – STRAWBERRY
10 | V a l u e C h a i n A n a l y s i s i n D i s t r i c t C h a r s a d d a
replaced sugar beet, sugar cane, wheat and maize in this particular belt. Afridi et al (2009)6
informed that the economic return of strawberry crop is four times higher than sugarcane and
9 times higher than wheat crop in district Charsadda. Strawberry is yet considered an un-
conventional crop in Pakistan, despite its significant expansion throughout the country and
overwhelming economic significance. Economic valuation of strawberry crop in different value
chain functions estimated to be surpassing 12 billion rupees in a single cropping year
(estimates based on value generated in 2016-17), generating hundred and thousands of
employment opportunities for farming families.
Strawberry provide impetus for high value vegetable culture in district Charsadda during 2001-
02; agriculture laborers trained on off-season vegetable production (tunnel farming, vertical
gardening, hybrid technology) promoted the tendency of leasing land for commercial
vegetable production in Charsadda; strawberry was the preference crop of those farmers,
followed by other seasonal vegetables like tomato, bitter gourd, tinda gourd, long gourd and
honey dew melon.
Value Chain Functions
Input Supply
Strawberry is being cultivated exclusively from propagative material (runner) in its entire
history in Pakistan. TOPS, CORONA and SCHINDLER are few successful varieties in
Strawberry crop, however the performance of Schindler is regarded best in comparison to
other varieties due to its higher production capacity, fruit weight, adaptability to diverse agro-
climatic zones and shelf life. CORONA was shallow inside (reduced weight) while TOPS was
not considered good for shelf life, hence become obsolete with the passage of time. Schindler
was introduced in 1998-1999 and is being the sole source of strawberry cultivation these days.
Varietal introduction is not scientific and through proper adaptability trials, the pioneer
progressive farmer (Kazim Bacha) in Swat asks mutual friends visiting different countries to
bring few seedlings of new varieties for
adaptability. The farmer introduced 2 varieties
(“Communeral” and “Sacoa”) two years ago for
adaptability trials and replication; he is planning to
introduce it this year onwards for marketing.
Agriculture Research Station Mingora maintained
a gene bank of Strawberry cultivars but
unfortunately the progeny has been lost due to
closure of research station in 2008-10. Research
officials from the same station have visited
Australia in 2015, and brought back few seedlings
of a variety (they have given the name “Australian
Mark” themselves) for adaptability trials. The runners are distributed among few progressive
farmers last year, however farmers were not satisfied with its performance and high
susceptibility to intense heat.
6 “Cost and Revenue Analysis of Strawberry Production in the Sub-Tropical Areas of NWFP, Pakistan”, Ghulam Sadiq Afridi, M.
Ishaq and Sarfaraz Ahmed 2009; Pakistan Journal of life and social sciences (2009), 7(1):59-65
Figure 4: Strawberry Runner Production

CHAPTER 4 – STRAWBERRY
11 | V a l u e C h a i n A n a l y s i s i n D i s t r i c t C h a r s a d d a
Runner prices are increased gradually and rather un-predictable supply and demand pattern
was witnessed in previous years (last year runners were short due higher demand in Punjab
i.e. prices jumped to Rs. 5). Sometime farmers have losses due to unavailability of runners
and sometimes runner farmers have losses due to lack of demand.
Runners are produced in the month of March – April, onion is practiced as a major inter-crop
in strawberry (Peas, fresh beans are other intercropping option), onion is harvested in the
month of May, and runners are being re-directed to the main bed (3 feet) for onward growth
and runners’ production.
Mites - considered one of the major pest problems in strawberry crop - do attack runner crop
during the month of May – June in swat but controlled with good miticides and management
practices (power sprayers), climatic factors also favor management practices in Swat and the
control is rather manageable over there.
A healthy plant produces 5-50 runners in its life cycle, however initial 15-20 runners are
considered good in vigor (runners produced till the month of June-July) and has good
production capacity while runners produced during August – September are rather weak and
impotent, tend to have high chances of failure in transplantation and production stage.
High profitability margin compel more farmers toward runner production and rapid shifting
tendency is noticed among farmers of upper swat and Dir areas. One acre of land produces
960,000 runners; each runner cost 0.6-0.7 Re for its entire life cycle and fetches more than 1
Re (average price this year was 1.4 per runner, however it varies between Re 1.2 and 3 per
runner; occasionally it was sold for Rs. 5 per runner last year due to shortage towards end
season. Consultations and triangulation confirms that more than 500 million runners were
channeled to Punjab, Sindh and Khyber Pakhtunkhwa this current season (it is believed that
around 1 billion runners will be available for marketing in the coming year).
The lease rate grows rapidly upward due to the same boom; the yearly rate was between
150,000 – 200,000 Rupees for an acre of land this season. Labor becomes expensive and not
available in strawberry extraction time (Rs. 12000/100,000 plants); usually farmers need to
extract more 300,000 plants on daily basis to subside demand. Contracted labor in Swat, while
women/children in Dir area are responsible for runners’ extraction from their fields in the
months of October-November. Runners quality from Swat has issues i.e. # of transplants in a
pack is not uniform, contain infertile runners, and mother plants. Runners from Upper Dir is
considered much better than Swat, runner growth is vigorous which result in better production
capacity, new land and high altitude to ensure chilling requirement of strawberry are few
important identified factors for this good quality.
Swat farmers fetch fruit and runners from the same plant, however farmer perceptions
revealed that plants not used for strawberry production has produced good quality runners.
Farmers of Charsadda are price conscious, and looking for cheaply available runners in
Swat/Dir, while Punjab/Sindh traders look for quality runners (vigorous growth), thus farmers
are willing to struck deals with Punjab and Sindh on priority basis and provided least quality
runners to farmers in Charsadda.

CHAPTER 4 – STRAWBERRY
12 | V a l u e C h a i n A n a l y s i s i n D i s t r i c t C h a r s a d d a
Apart from propagative material, local dealers are
providing range to remaining inputs like pesticides,
fertilizers and utensils in the production clusters.
Focused group discussion reveals that 70% farmers
are aware of pesticide usage from their previous
experience while 30% depend on the advice of input
providers. Lack of knowledge provides opening for
pesticide/fertilizer adulteration, subsequently
provide basis for the use in-efficient and sub-
standard chemicals. Majority of farmers (more than
90%) deals in credit for these agro-chemicals. The
risk associated with provided credit is another major
hurdle of not using good reputed pesticides; multinational products are available on cash only,
while generic products are available on credit to secure their market share. The institutional
capacity to maintain a robust check and balance is rather weak; hence quality of inputs
remains an issue of great concern.
Production/Post-Harvest Management
The production function encircles activities like land
preparation, transplantation, weeding, irrigation,
application of agro-chemicals, harvesting, and post-
harvest management. Crop rotation is practiced and
eventually desired in the strawberry management
cycle; extensive use of agro-chemicals has good
effects on succeeding crop.
Intensive management practices and high cost of
investment (PKR 50,000 seed money!) not allowing
to plan more than 2 acres of strawberry, the average
farm size of strawberry is reported between 2 kanal
and 2 acres of land each year while the usual practice
is 1-acre average in Charsadda. The practice is
realistic and is not much deviating from scientific
recommendation of 0.68 acres of strawberry as optimum farm size and realizing net revenue
from the crop (Afridi et al 2009).
Strawberry is a six-month crop, and crop cycle starts with procurement of runners in the month
of October, following land preparation. Sowing dates changed recently from November to the
month of October (farmer own testing on seasonal variation), though some farmers succeeded
in maintain a vigorous crop from early October plantation however mortality rate of seedling is
higher (heat factor) in early October plantation in district Charsadda. Majority of farmers are
reluctant to transplant early due to economic losses and managing runners for re-
transplantation. It offers prospects for further research trials on seasonal variation (early/late
cropping pattern) in district Charsadda. Strawberry is often inter-cropped with sugar cane in
Charsadda; extensive use of nutrients believed to have a better impact on sugar cane
production after the strawberry management cycle completed in late May. The same piece of
land is used for Kharif maize and fodder crops in the period between June-October. Wheat is
the preferred Rabi crop during November if land is not occupied by sugar cane. The crop
Figure 6: Ready to harvest Strawberry, the surface contact of fruit with soil devalues quality (Courtesy: ASF, PHRA 2012)
Figure 5: Input Dealer in Sarkee

CHAPTER 4 – STRAWBERRY
13 | V a l u e C h a i n A n a l y s i s i n D i s t r i c t C h a r s a d d a
rotation is believed to be a must-to-do practice in the case of strawberry. The choice of other
crops allows to maintain this healthy balance of crop rotation in 3 years’ cycle.
Farmers in Charsadda procured runners themselves from Swat and Dir rather in an inefficient
manner; 50-60% farmers visited Swat/Dir themselves while the remaining depend on
collective purchase and/or depending on traders for providing runners on farm gate for nominal
margins (recent development). Runner dealers bargain in cash only due to high demand and
payment issues with farmers; only few farmers deal on credit basis depending on mutual trust
and credibility.
Jute bags are used for transportation of Runners (contain 26,000-27,000 plants per 40 kg
bag); cleaning of runners and cutting of leaves is done at household level by children and
women. Transplantation period varies between October (early) and mid-November. Month of
December and January is dedicated exclusively to extensive hoeing cycles; it requires 7
hoeing cycles in these 2 months with intermittent irrigation and application of agro-chemicals.
Weedicides are not favored within strawberry crop therefore weeds are removed through
extensive hoeing cycles; this is rather in-efficient practice and incur extra cost of production.
Management practices in strawberry cultivation are rather static in Charsadda production belt;
farmers are learning management steps from each other however the mode of transformation
is not uniform and standard. Farmers even used pesticides and fertilizers without
understanding the fertility requirements of the crop in different soil. However, this learning and
doing did brought improvement in production capacity with the passage of time; production
capacity was 15-20 fruits per plant 20 years ago, improved to 30 fruits per plant 10 years ago,
while current production capacity is 50-60 fruits per plant with increased awareness and plant
growth regulators (humic acid, micronutrients application, increased fertilizer dosage and
range of pesticide application).
Strawberry is a water intensive crop; it need approximately 25 irrigation cycles in entire crop
production phase. Farmers tend to irrigate their strawberry field on every 3rd day during picking
season. However, research authenticates that 4-day interval might be good for fresh fruit
consumption, while irrigation interval of 10 days is appropriate for retaining quality during
storage and/or distant marketing. (Ijaz Akhtar and Abdur Rab, 20157).
Picking/harvesting starts from late January to early February (limited quantity), while peak
production harvested during mid-February to April continuously and diminished during the
month of May (production end till May 20 maximum). Harvesting was performed mainly
through school children, paying Rs 100 per day and also gave some strawberries for eating.
Though the practice is not efficient for post-harvest handling, the inexperience and
mishandling of such perishable crop by children resulted in 15-20% post-harvest losses.
MITES is the major crop problem in production stages, creates resistance towards extensive
use of pesticides (sprayed every 3rd day with miticide). Other common pest are nematodes,
cutworms, aphids and diseases like ‘damping-off’ is more common in Strawberry; attack of
wild boar was common in few areas but manageable with regular watch and ward.
7 “Effect of Irrigation Intervals on the Quality and Storage Performance of Strawberry Fruit”, Ijaz Akhter and Abdur Rab; The Journal of Animal & Plant Sciences, 25(3): 2015, Page: 669-678
CHAPTER 4 – STRAWBERRY
14 | V a l u e C h a i n A n a l y s i s i n D i s t r i c t C h a r s a d d a
MITES attack mostly in the month of March; an epidemic was witnessed in 2004-05 incurred
extensive losses to Strawberry crop in Charsadda. Mites has complicated life cycle and
nurturing overlapping generations (eggs, nymph, and adults at the same time), broad
spectrum pesticide might break the mites’ complex life cycle but it need further research trails.
Strawberry is prone to excessive rains during February – March; losses in rainy season are
40-50% of standing crop and also stressed production for the coming week to ten days’ period.
Complete failure of crop was recorded in 2006-07 due to hailstorm and extensive rainfall. No
protective measures are taken during rainy season, though the use of walk-in tunnels coupled
with weather forecast might save the crop from extensive damages during rainy season.
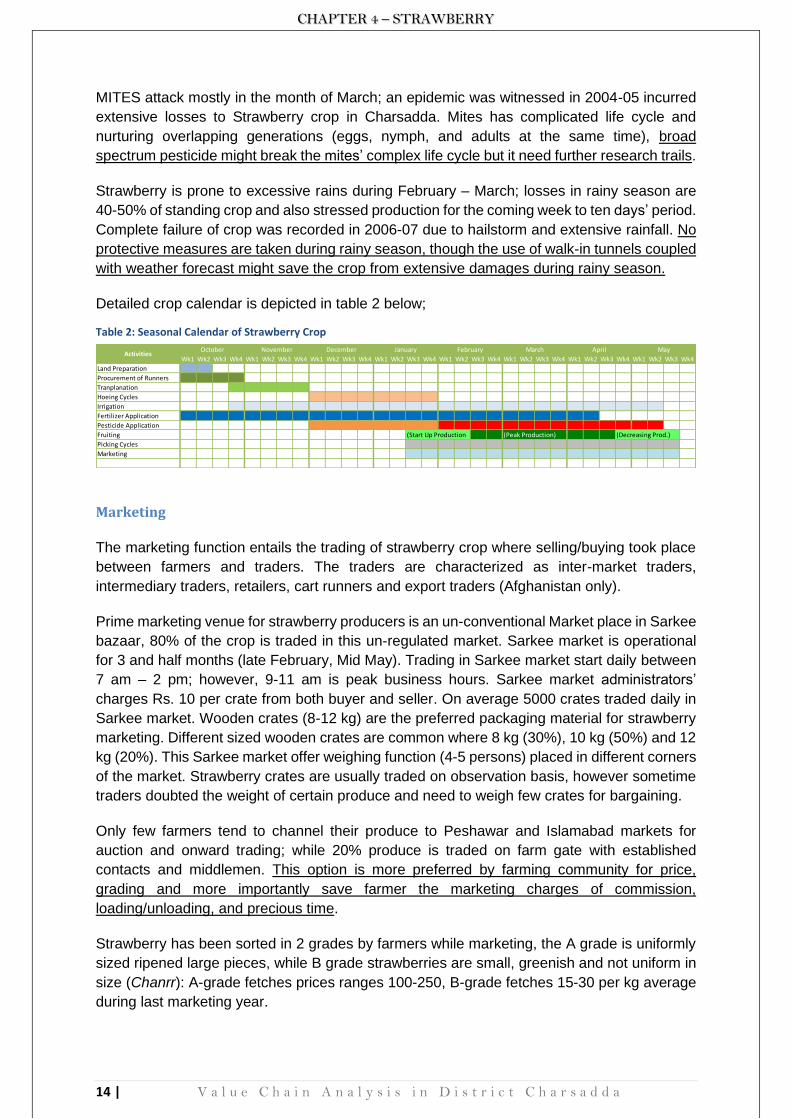
Detailed crop calendar is depicted in table 2 below;
Table 2: Seasonal Calendar of Strawberry Crop
Marketing
The marketing function entails the trading of strawberry crop where selling/buying took place
between farmers and traders. The traders are characterized as inter-market traders,
intermediary traders, retailers, cart runners and export traders (Afghanistan only).
Prime marketing venue for strawberry producers is an un-conventional Market place in Sarkee
bazaar, 80% of the crop is traded in this un-regulated market. Sarkee market is operational
for 3 and half months (late February, Mid May). Trading in Sarkee market start daily between
7 am – 2 pm; however, 9-11 am is peak business hours. Sarkee market administrators’
charges Rs. 10 per crate from both buyer and seller. On average 5000 crates traded daily in
Sarkee market. Wooden crates (8-12 kg) are the preferred packaging material for strawberry
marketing. Different sized wooden crates are common where 8 kg (30%), 10 kg (50%) and 12
kg (20%). This Sarkee market offer weighing function (4-5 persons) placed in different corners
of the market. Strawberry crates are usually traded on observation basis, however sometime
traders doubted the weight of certain produce and need to weigh few crates for bargaining.
Only few farmers tend to channel their produce to Peshawar and Islamabad markets for
auction and onward trading; while 20% produce is traded on farm gate with established
contacts and middlemen. This option is more preferred by farming community for price,
grading and more importantly save farmer the marketing charges of commission,
loading/unloading, and precious time.
Strawberry has been sorted in 2 grades by farmers while marketing, the A grade is uniformly
sized ripened large pieces, while B grade strawberries are small, greenish and not uniform in
size (Chanrr): A-grade fetches prices ranges 100-250, B-grade fetches 15-30 per kg average
during last marketing year.
Wk1 Wk2 Wk3 Wk4 Wk1 Wk2 Wk3 Wk4 Wk1 Wk2 Wk3 Wk4 Wk1 Wk2 Wk3 Wk4 Wk1 Wk2 Wk3 Wk4 Wk1 Wk2 Wk3 Wk4 Wk1 Wk2 Wk3 Wk4 Wk1 Wk2 Wk3 Wk4
Land Preparation
Procurement of Runners
Tranplanation
Hoeing Cycles
Irrigation
Fertilizer Application
Pesticide Application
Fruiting (Start Up Production (Peak Production) (Decreasing Prod.)
Picking Cycles
Marketing
November December January FebruaryActivities
March April MayOctober

CHAPTER 4 – STRAWBERRY
15 | V a l u e C h a i n A n a l y s i s i n D i s t r i c t C h a r s a d d a
Some farmers (5-6% approximately) are compelled to sold their produce at flowering stage,
the crop need to be taken care onwards by the traders with their own labor and management.
Some farmers tried to link their produce with high end markets and companies but the
experiment wasn’t successful because of un-clean strawberry produce (Key Informant).
Following the lucrative business of Sarkee strawberry market, at least 2 efforts have been
made by other business minded people to offer alternate market place for strawberry
marketing but couldn’t succeeded, as both farmers and traders don’t want to come out of their
comfort zone. A modern Pack house was built by ASF (USAID) in year 2014-15 with an idea
to offer improved packing/grading facilities, and linkages with high end markets; the facility is
yet to be operationalized to date as it is distantly located from the main market hub and also
have management issues.
Runners Marketing: There is no proper market for runners in Swat and Dir region; farmers,
middlemen and inter-provincial traders bargain with runner farmers directly in their farms and
rural hubs. The concept of farmer-cum-traders is expanding every year, where farmers not
only bargain for their own runner crop but also cut deals with other small and needy farmers
by offering some advance 2-3 months earlier than runners marketing. Exact estimates are not
available but it is believed that Swat produces more than 500 million runners this year; (350
million plus to Punjab, 100 million plus to Sindh, 50 million plus to Mardan and Charsadda);
Dir produces approximately 50-60 million runners this year; Runners marketing starts in
August-September each year; good prices and high demand compel farmers to convert more
land to strawberry runners, almost 1 billion plants are projected to be produced next year.
Inter-market traders channel strawberry to Peshawar, Islamabad, Lahore and other parts of
KP and Punjab; they used their own linkages for such trading, keeping some nominal
percentages of profit share (10-20 rupees’ margin after incurring expense).
Traders from Afghanistan has a positive effect on market prices, they not only purchase larger
quantities but also offer good prices. However, closure of Trade route to Afghanistan was a
major impediment in 2017, owing to stressed security relations between armed forces at both
end. This Closure has significant impact on market prices of fruits and vegetables in Pakistan
(especially on the products of KPK), more than half of vegetable export value is linked with
Afghanistan (52%), has a value of 91 million dollars8.
Processing
Range of products is available in the markets which are flavored/blended with strawberry
essence. Few renowned national companies are Mitchells, Rafhan Foods, TOPS, Salmans,
Shezan, Crispo, National Foods, Fauji Fresh-n- Freeze, while Lacnor and Kelloggs
(International) products are available on shelves. Jam, Jelly, Berry Crunch, Corn Flakes,
custard, frozen strawberry, topping, Juice (nectar), Syrup, and Squashes are strawberry
products range witnessed during supermarket visit (METRO). Pakistan is also importing frozen
strawberry from Mexico and USA i.e. in FY 2014-15 imported 8,540 kg with worth 1,766,000
PKR9. Frozen strawberry cost Rs 425/kg from a national company while imported quality of
the same product (Belgium) cost Rs 400/500 gm. Tarnab farm also purchase strawberry when
8 http://www.tdap.gov.pk/tdap-statistics.php 9 Ibid

CHAPTER 4 – STRAWBERRY
16 | V a l u e C h a i n A n a l y s i s i n D i s t r i c t C h a r s a d d a
price is lower than Rs 50 per kg (mostly B-grade quality) for processing in products like Jams
and Juices, they haven’t made products in 2017 due to higher prices of strawberry.
Though processing has been advocated as viable alternate option in fruits and vegetable,
especially keeping in view the risk associated with ups and down of market price. However,
processing industry prefers low grades and cheap prices traditionally, and often fulfills their
demand in peak production season. Artificial essence is more preferred option for these
industries, when it comes to strawberry products. The trend offer little prospect to farming
communities, however information lag demand for detailed research/feasibility on how
processing industry could be explored for the benefits of small holders. Moreover, further
analysis of respective market shares of processing industries in total supply of strawberry
produce, mapping of these units, and estimation of overall seasonal demand will further
elaborate their economic significance in networking and contract farming options with small
holders.
Figure 7: Some Processed Products of Strawberry in Super Market
Consumption
The consumption of strawberry is becoming more popular owing to its unique taste and flavor, and more passion towards culinary and dietary diversity. Major produce is dispose-off as fresh consumption while the flavor/essence is transforming to various processed foods is ever increasing for local production and imported stuff.
Extensive usage of pesticides induces bad reputation to strawberry fruit, health conscious consumers are reluctant due to health concerns related with extensive usage of chemicals. The market demand might be much higher if integrated management practices are promoted to minimize adulteration of agro-chemicals. Strawberry is considered an expensive fruit, and customers can pay extra premium for such value addition (integrated control/least pesticide usage). Even at the final retail sale, cart-runners spray “Potash Alum” on strawberry fruits to maintain shine and retain shelf life; 1 gm/liter is recommended dosage for this product but vendors apply much higher quantities and induce health hazards. Ijaz Akhtar and Abdul Rab in 201410 recommended that calcium gluconate at 1.5% concentration is an effective treatment to retain the quality and extend the shelf life (up to 10 days) of strawberry fruit.
10“Influence of Calcium Sources and Concentration on the Storage Performance of Strawberry Fruit”, Ijaz Akhtar and Abdur
Rab 2014, Journal of Agricultural Science and Technology B 4 (2014) 661-673

CHAPTER 4 – STRAWBERRY
17 | V a l u e C h a i n A n a l y s i s i n D i s t r i c t C h a r s a d d a
Value Chain Operators
Input Providers
There are 7 main agro-chemical providers in the respective area of production (cover almost
50% of needs) while remaining farmers are linked with input providers in Charsadda and
Sardheri markets.
Pesticide usage was increased after the introduction of hybrid technology in the period 1998-
2000; the technology induced the expansion of pesticide/fertilizer dealing shops to production
clusters extensively. Approximately 120+ pesticides firms are registered with Agriculture
Extension Directorate in the Province, majority of these firms are active in district Charsadda
as well (7-8 are multinational while the remaining are generic national companies). Almost 12-
15 different types of chemicals are used time to time on strawberry crop, while DAP, Urea,
Ammonium Sulphate and micro-nutrients are being used in fertilizer category. Pesticide and
micro-nutrient budget cost 19,000-24,000 Rs per 0.5 acre of land on average in each crop
cycle. Farmers do point that there is no dedicated pesticide for strawberry crop, however most
pesticides are registered on main crops and effective in strawberry problems (though dosage
need to be checked for strawberry crop with further research).
More than 30 main agents (with numerous small dealers) are involved in channeling runners
each year; farmers turned dealers are increasing with every passing year. Demand for
runners’ production is not predictable each year; either strawberry farmers or runner producers
contract losses due to this imbalance. Market Information System for an organized forecast of
expected crop each year will impact the business positively. Runner production business in
on boom in Malakand Division, concentrated in Lower and Upper Swat, Upper Dir, and
reportedly introduced in Bajaur Agency this year.
Producers/Farmers
High investment rate and intensive cultural practices didn’t allow cultivating strawberry on
large scale farms, hence number of small farmers is high in strawberry business (owing less
than 5 acres of land); where majority stands with owner cum tenant (50%), 10% are
sharecroppers, while 40% farmers leased land for strawberry cultivation. Though official
estimates are not available from Crop Reporting Service (still considered as a non-traditional
crop), it is believed that strawberry is planted on more than 700 acres of land in Charsadda11.
Likewise, exact number of strawberry farmers is not confirmed, however discussion with
farming communities, agriculture extension department and triangulation with area under
strawberry cultivation affirmed that there are 500 farming families (more or less) cultivating
strawberry in district Charsadda. Extensive management practices induced hundred and
thousands of labor opportunities within strawberry cycle.
Strawberry crop generate livelihood opportunities at 2 levels for farming families i.e. runner
production and fruit production. Runner production is increasing with every passing year and
offering lucrative financial returns. In the current season it is believed that an area of 500-550
acres was under strawberry runner production in Swat and Dir belt, providing livelihood to
11 Field Survey

CHAPTER 4 – STRAWBERRY
18 | V a l u e C h a i n A n a l y s i s i n D i s t r i c t C h a r s a d d a
more than 400 farming families in both regions. Runners come from lower swat initially (Ogdo
– Takhtaband in Mingora), however Runner production is transformed to Upper Swat valley
i.e. Fatehpur, Durushkhela, Khwazakhela due to high altitudes and lower summer
temperature). While Upper Dir has started runner’s production 4-5 years ago, concentrated in
few villages of Tehsil Varri in Upper Dir (Nek Dara, Bashana, Surgul, Varri). It was informed
that some traders introduced strawberry for runner production in Bajaur Agency (20,000
plants, but no further information is available in this regard); it offer a significant potential for
MEP to introduce new varieties in Bajaur for adaptability trials (as one of the Project area).
Market Functionaries
Strawberry market in Sarkee became a renowned business hub for market functionaries
during February-May each year. Some 200-250 traders are regularly present in Sarkee market
on average in peak season; 50-60 are main dealers among this group, 10-12 local traders
while the rest are outsiders. The volume of large dealer’s trade is 1000-1200 kg on daily basis.
There are 4 main dealers providing wooden crates in Sarkee Market. On average, there are
around 100 seasonal laborers performing loading/unloading function in the Sarkee strawberry
market on daily basis.
Peshawar is considered as a feeder market for strawberry crop, the 3 renowned commission
agents in Peshawar (Lahori, Ghantaghar area) auction daily between 3-5pm for retailers and
inter-market traders. Inter-market trade is linked with districts of Bannu, Kohat, Kabul,
Peshawar, Abbottabad, Swat, Timergara, and Rawalpindi. Traders usually take different price
ranges from their networks in different market and decide on which market to target on daily
basis; some traders do take orders from retailers regularly and supply on daily basis in different
urban centers.
The retail function of strawberry expands rapidly in recent years; it is not only available on fruit
retail shops (both small and large), strawberry on carts (wooden and Suzuki) could be found
on numerous places in main cities and highway junctures, as well as found separate stalls in
super markets for loose weight and consumer packaging (mostly half kilogram packs).
Enabling Environment
VC Facilitators
Agriculture sector is being facilitated by a network of government institutions in district
Charsadda. Agriculture Extension, Soil Conservation, Water Management, Agriculture
Research and Crop Reporting Service (CRS) have functional outreach in Charsadda while
seed certification is being regulated through Federal Seed Certification and Registration
Department (FSC&RD).
Agriculture Extension Department (AED) has the most extensive interaction and coverage
among farming communities, they have representatives (at-least 2 staff) in all 49 union
councils of the district. An Agriculture Officer is designated in each Tehsil, while 3 Subject
Matter Specialist (SMS) are positioned at District Headquarter. Agriculture Extension has been
allocated Rs. 460 Million in financial year 2017-18 for providing implements/machinery to small
farmers, improving seed production capacity, and supporting women farmers in kitchen
gardening and value addition activities in the province. AED is implementing regular ADP

CHAPTER 4 – STRAWBERRY
19 | V a l u e C h a i n A n a l y s i s i n D i s t r i c t C h a r s a d d a
programmes in the district; Fermenter system and installation of high tunnels for
demonstration purposes, however Fermenter system was not considered successful as BIO-
AAB was not readily available in the market; Department is foreseeing another important
project of small machinery pool (inter-cultivator, solar sprayers, drone sprayers, tunnel
machinery, seed drills, planter and small harvesting machines etc.) to strengthening service
delivery of FSC.
AED also has the leverage of institutional oversight of Farm Service Center (FSC) in the
District. The concept of FSC was piloted in 1995 on two locations as public private partnership
for agricultural outreach and development, the FSC at Dhakki Amirabad was one of those two
sites. The FSC was given legal status in 2014 when FSC act was formally endorsed by
Constituent Assembly. Model Farm has representatives of AED, water management,
Agriculture Research and Livestock department. Farmers’ registration in Charsadda has
reached to the mark of 12,989 as of November 2017, and the coverage is increasing with
every passing year. FSC Dhakki has been playing a vibrant role in providing certified seed
and fertilizers on cheaper rates and also helped registered growers in maize marketing.
Each FSC is dealing in 15-20 km radius, and is one of the limiting factors in linking distant
farmers; FSC also deals in cash which is not preferred among farmers as input suppliers in
the market do credit on yearly basis. Though the farmers are least concerned about prices in
credit circle, however the rates are charged higher (in some cases more than double) for seed,
pesticides and fertilizers.
Capacity of AED field based staff and FSC management committee is another important
bottleneck for visualizing the concept of efficient service delivery in Charsadda, though JICA
funded project (2015-17) supported capacity building sessions for the staff of AED (80 AO and
200 Field Assistants) in NARC, however this need to be organized on regular basis.
FSC could be supported with quality pesticides/fertilizers for Strawberry crop on pilot basis,
using the “Pakistan Tobacco Company” Model for Tobacco Crop; PTC was facing the issue
of pesticide residues in Tobacco products, hence they provide quality seeds and pesticides
on credit to their registered growers through FMC, and it was deducted from their final
payment. It will help functionalize the redundant “Pack House” in Sarkee area for offering
advisory services, quality inputs and marketing potential.
District water management department is also supporting farming community with water use
efficiency technologies and rehabilitation of irrigation infrastructure. Drip irrigation, land
leveling initiatives and solar tube wells have been recently introduced in the district to create
enabling environment for water use efficiency.
Agriculture Research Station in Charsadda was inaugurated in 2012 in Mandani area by
the then Agriculture Minister and department allotted 120 acres of land. The objective was
being changing with passage of time; though the station is currently seeking action research
on the issues of high value vegetables in the region. The construction work was completed in
2016 and regular positions are sanctioned in the financial year 2017; however, the station still
need vigorous attention and support from Research Directorate for allocation of resources and
functionalize research activities (full fledge research staff, soil testing laboratory, and
machinery pool etc).

CHAPTER 4 – STRAWBERRY
20 | V a l u e C h a i n A n a l y s i s i n D i s t r i c t C h a r s a d d a
Currently no development project is active in agriculture sector in the district. ASF (USAID),
CMP-II, are two mega projects in the recent past, though both projects failed to achieve
desired objectives due to funding issues and closures before stipulated timeframe. Flood 2010
brought number of early recovery and rehabilitation projects, but the scope was much on
distribution of inputs or rehabilitation of damage infrastructure. SRSP has an active presence
in Charsadda, their NRM activities are limited to few selected areas with limited scale and
scope of interventions; they have partnered with ASF for the formation of 23 FEGs in District
Charsadda (Sarkee) in the strawberry belt during 2013-14; Enterprise Development Trainings
(EDT) and Technical Trainings on pre/post crop harvest management has been imparted to
FEGs. However, further follow ups were not maintained due to early project closure of ASF.
Apart from the functional presence of range of facilitators, extension material and technical
advisories are almost negligible for strawberry crop. Technical support services are either
delivered through field days of pesticides/fertilizer companies are primarily emphasizing on
the promotion of their company products, while advisory services are rested with pesticide
dealers which again are business oriented.
Value Chain Regulators
The Provincial Ministry of Agriculture, Livestock and Fisheries is striving to regulate the policy
framework for agriculture sector in the province. Agriculture policy was enacted in the year
2014, as an outcome of 18th amendment and 10 years’ strategic directions are drawn for
commercializing agriculture sector in the province. Government of Khyber Pakhtunkhwa
allocated 16,000 Million Rupees (apart from regular ADP schemes) under Integrated
Development Strategy (2014-18). The objective is to promote commercialization in agriculture
sector by fostering crop productivity/income, water use efficiency and identification of
progressive markets for agriculture produce.
Activities of AED have a regulatory cover in the province and statues like Pesticides Act
(2007), Fertilizer Act (1997) and Seed Act (2015) help them to maintain a regulatory check on
quality of agriculture inputs in the province; Agriculture Officer acting as Inspectors are
monitoring quality of agricultural inputs through district administration and local government
ordinance;
Land tax, agriculture income tax, Usher, local rate, and abyana are important levied taxes on
farming and collected by District Revenue Departments. The rates have been adjusted as per
land holding, and revised every year in the provincial finance bill. Recovery rate is reasonable
for levied taxes in district Charsadda, and recovery targets are met more than 90% every year
as the revenue department has strong presence through patwari’s in respective union
councils. The rates for agriculture income tax is estimated using standard calculation for
different crops, however these estimations are kept nominal and representing lower bounds
of real revenue generated from these crops.
Taxation schedule is depicted in the following table 3;

CHAPTER 4 – STRAWBERRY
21 | V a l u e C h a i n A n a l y s i s i n D i s t r i c t C h a r s a d d a
Table 3: Taxation Rates on Agriculture Land/Income (acre/annum)12
Tax heads Applicability Tax Rate
Land Tax - Not Exceeding 5 acres
- 5 – 12.5 acres
- Exceeding 12.5 acres
- Orchards (Fixed)
- Exempted
- PKR 225
- PKR 340
- PKR 900
Agriculture Income Tax
Income:
- 400,000-550,000 - 550,000-750,000
- 750,000-950,000
- 950,000-1,100,000
- > than 1,100,000
- 5% of amount exceeding 400,000 - Rs 7500, plus 7.5% on amount exceeding
550,000 - Rs 22,500, plus 10% on amount
exceeding 750,000
- Rs 42,500, plus 15% on amount exceeding 950,000
- Rs 65,000, plus 17.5% on amount exceeding 1,100,000
Local Rate cultivated land Rs 2 per acre
Usher Agriculture production - 10% on rain-fed - 20% on irrigated
Abyana Irrigated land Lift Irrigation:
- Rs 600/acre (cash crops) - Rs 500/acre (cereal crops)
Canal Irrigation:
- Rs 300/acre (cash crops) - Rs 250/acre (cereal crops)
The seed act of 1976 was amended in 201413, to facilitate and acknowledge to role of private
sector companies in developing improved seed varieties and genetic material in different
agricultural crops. Private seed companies are brought under formal racket of Federal Seed
Certification and Registration Department, and the cumbersome processes are delineated for
seed producing/multiplying companies. The check and balance system is also strengthened
in the said amendment i.e. Provincial Agriculture Extension is given the power to check the
quality of seed inputs along with fertilizer and pesticides; the amended bill also enhances
12 Provincial Finance Bill, 2017-18, District Revenue Department, Charsadda 13 Seed Amendment Act 2014, Enacted in 2015

CHAPTER 4 – STRAWBERRY
22 | V a l u e C h a i n A n a l y s i s i n D i s t r i c t C h a r s a d d a
penalties for effective deterrence against sale of sub-standard seed/propagative material in
the market.
Though Seed Act is supposed to have positive impact on seed/propagative material sector,
however certain level of confusion was emerged with the stance of provincial governments
that seed registration should also become provincial subject. However, the idea was
regressively opposed within the private sector (as per consultation with FSC&RD the issue is
largely resolved to its original proposition).
Value Chain Governance/Integration
The value chain operators of strawberry are loosely integrated through informal relationships
and contacts. There is no farmer or trader association at either level in strawberry crop cycle,
some efforts by previous projects have been put in practice but vanished after project period.
Agribusiness Support Fund (ASF) formed 23 Farmer Enterprise Groups in 2014 among
strawberry farmers in Sarkee but the project span was curtailed pre-maturely due to funding
issues with no real progress in terms of integration and association building.
This lack of integration and association at either level of strawberry cycle creates conflict
among the stakeholders which negatively affect the sub-sector performance; functional
association at different level (runner production, strawberry production, and marketing) will
indeed helpful for conflict resolution.
Figure 8: Value Chain Integration in Strawberry
Such associations provide valid fora for exchanging information, transformation of
technologies and promote collective thinking among respective members. For instance, an
informal WhatsApp group in Punjab provides a useful interaction platform for strawberry
growers since 2016. Farmers are helping each other by posting their problems in crop
management, sharing new technologies, progress on seasonal variation, packaging and
market/price related information for the benefit of each other’s.

CHAPTER 4 – STRAWBERRY
23 | V a l u e C h a i n A n a l y s i s i n D i s t r i c t C h a r s a d d a
Figure 9: Some Examples of Farmer Group Interaction on WhatsApp in Punjab

CHAPTER 4 – STRAWBERRY
24 | V a l u e C h a i n A n a l y s i s i n D i s t r i c t C h a r s a d d a
Value Chain Map of Strawberry Crop (Charsadda)
Consumers
Production
Marketing
Input Supply
Retailing Procurement/purchase, Storage, Grading/sorting, Retail sale
Inter Market linkages Transportation Packing/Grading Weighing Export
Land Preparation Sowing/Plantation Fertilizer application Pesticides application Irrigation Weeding Picking and Packing Packing
Seeding Producers Agro-chemicals (Fert., Pesticides, etc.) Farmyard Manure Tools/Equipment’s
Agr
icu
ltu
re E
xten
sio
n/F
arm
Ser
vice
C
entr
e/W
ater
Man
agem
ent
Dep
artm
ent
AR
I Sw
at M
inis
try o
f A
griculture
, Liv
esto
ck a
nd F
isheries; R
evenue
Depart
me
nt
Seedling from Swat and Dir Runner Farmers
Pesticides/Agro-chemicals Shops
Tools and equipment
Strawberry market in
Sarkee
Retail Shops at urban centers
Farmers/farming community
Agr
o-C
hem
ical
s C
om
pan
ies
Peshawar market (Lahori
and Ghantaghar)
Islamabad/Lahore Markets Afghanistan
Cart Runners
Suzuki Cart

CHAPTER 4 – STRAWBERRY
25 | V a l u e C h a i n A n a l y s i s i n D i s t r i c t C h a r s a d d a
Economic Analysis – Strawberry Value Chain
Profitability Margins
Small and Medium Enterprise Development Authority (SMEDA - Sindh Chapter) provided
prefeasibility study on Strawberry cultivation in 201514, to understand economics of strawberry
cultivation and encourage decision making among potential strawberry farmers in Sindh
Province. The study estimated 65% IRR and 2 years as potential payback period for
strawberry cultivation (inclusive of capital fixed cost in the crop budget as well).
Though it provides useful ground for decision making on strawberry crop, however detailed
budget of strawberry crop was calculated with a key informant farmer of strawberry crop for
updating this decision making in the context of Charsadda production cluster. The rates are
based on the expense sheet of 2016-17 for generating costs and revenue for strawberry. The
budget helped to see expense heads in production, post-harvest and marketing stages
respectively.
Strawberry cultivation in Punjab was studied as benchmark and considered as model farming
for the crop, owing to technological advancement and improved farm efficiency. There are
different layers of strawberry cultivation practices in Punjab (tunnel farming, drip irrigation,
large corporate farms, and cultivation in controlled environment etc), however the crop budget
was adopted from a middle range farm which is more representative of strawberry cultivation
in Punjab to present comparative analysis in a more pragmatic manner. (A brief situational
analysis of strawberry cultivation in Punjab is presented in annexure III).
The budget demonstrates that strawberry crop in Charsadda returns a lucrative gross margin
of PKR 455,900 (52%) per acre of land and the rate of return on investment is 107%. The
profitability of strawberry in Charsadda is slightly higher than Punjab (47% gross margin),
owing to some cost heads charge differently in these production clusters (for instance market
is located 30-35 km away from production areas, marketing cost is higher in Punjab, runner
cost is different and sowing rate is higher in Punjab etc).
However, the comparative analysis did
point out lapses in farm efficiency of district
Charsadda, where farmers can enhance
profitability levels capitalizing on the
experiences of farming practices in Punjab.
For instance, convert to mulching can save
PKR 39,000 in terms of labor for hoeing
(adjusted with extra cost of mulching), and
saving another PKR 16,000 in terms of
nutrient application etc. The use of
mulching will bring extra premiums for
cleanliness and quality attributes in
marketing. A rare example of failed venture with a high end market was observed from
Charsadda was primarily due to cleanliness issue.
14 https://www.smeda.org/
Figure 10: Well Managed Mulched Strawberry Field in Punjab

CHAPTER 4 – STRAWBERRY
26 | V a l u e C h a i n A n a l y s i s i n D i s t r i c t C h a r s a d d a
It is believed that in both provinces the optimum level of nutrient application is not being worked
out on scientific lines. The risk of nutrient adulteration could be mitigated with proper soil
testing and application of required dosages. Moreover, the use of drip irrigation not only helps
water use efficiency, but also increases the efficiency of nutrition application four-fold15.
Detailed budget is presented in Table 4 for analysis;
Table 4: Budget of Strawberry Crop in KPK (Sarkee) and Punjab (Sharaqpur)
The farm efficiency of strawberry production in Sarkee and Punjab has been highlighted in the
table 5 below, where Sarkee farmers could potentially increase their farm efficiency during
production cycle. Significant savings could be actualized through using mulching technique
which save labor, while nutrient application and use of pesticide also highlights an opening for
further research on optimum usage. The gross margins in Sarkee are higher than Punjab
primarily due to efficient post production and marketing cost. The market is much nearer in
Charsadda as compared to Sharaqpur where markets are located at a far flung distances.
15 http://ofwm.agripunjab.gov.pk/system/files/Strawberry.pdf
Unit Quantity/# Price Total (PKR) Quantity/# Price Total (PKR)
Total Sale Revenue Kg 11000 80 880,000 12,000 80 960,000
Less cost of production -
Land Preparation Tractor Hour 11 900 9,900 10 1,000 10,000
Labour -
Ridge Making Mandays 8 500 4,000 6 500 3,000
Transplantion Mandays 18 500 9,000 20 300 6,000
Hoeing Cycles Mandays 160 500 80,000 80 300 24,000
Irrigation Mandays 25 300 7,500 20 300 6,000
Watch and Ward Months 3 4000 12,000 3 5,000 15,000
Input Cost -
Seed Seedling 50,000 1.4 70,000 55,000 2 110,000
DAP Bag 4 3200 12,800 1 3,200 3,200
Urea Bag 6 1400 8,400 2 1,400 2,800
Ammonium Sulphate Bag - 3 2,000 6,000
SOP Bag - 2 5,000 10,000
Pesticides Lumpsum 1 44000 44,000 1 30,000 30,000
FYM Trolley 2 6000 12,000 1 5,000 5,000
Micronutrients Lumpsum 1 6000 6,000 1 10,000 10,000
Plastic for Mulching Lumpsum - 1 17,000 17,000
Land Lease 1 acre 0.5 50000 25,000 0.5 50,000 25,000
300,600 283,000
Post Production -
Packing material Kg 11,000 2.5 27,500 12,000 5 60,000
Picking/Packing Mandays 90 600 54,000 90 300 27,000
Transportation Kg 11,000 1 11,000 12,000 4 48,000
Commission - Market Rent Rs 11,000 1.00 11,000 960,000 0.07 67,200
103,500 202,200
Miscellaneous Lumpsum 1 20,000 20,000 1 20,000 20,000
424,100 505,200
Gross Margin (1 Acre) 455,900 454,800
Gross Margin (%) 52% 47%
Return on Investment (ROI) 107% 90%
KP - Sarkee (1 acre) Punjab - Sharaqpur (1 acre)
Sub Total - Production Cost
Sub Total - Post Production Cost
Total Cost (Production + Post Producton + Miscellaneous)
Parameters
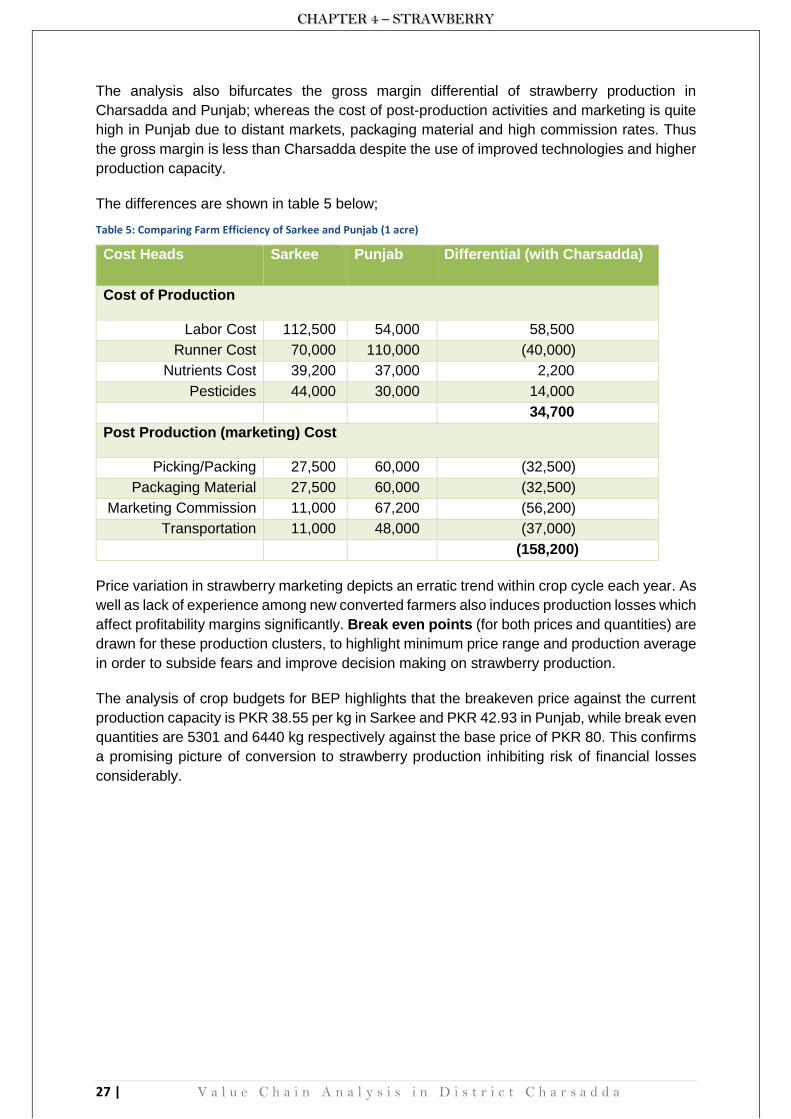
CHAPTER 4 – STRAWBERRY
27 | V a l u e C h a i n A n a l y s i s i n D i s t r i c t C h a r s a d d a
The analysis also bifurcates the gross margin differential of strawberry production in
Charsadda and Punjab; whereas the cost of post-production activities and marketing is quite
high in Punjab due to distant markets, packaging material and high commission rates. Thus
the gross margin is less than Charsadda despite the use of improved technologies and higher
production capacity.
The differences are shown in table 5 below;
Table 5: Comparing Farm Efficiency of Sarkee and Punjab (1 acre)
Cost Heads Sarkee Punjab Differential (with Charsadda)
Cost of Production
Labor Cost 112,500 54,000 58,500
Runner Cost 70,000 110,000 (40,000)
Nutrients Cost 39,200 37,000 2,200
Pesticides 44,000 30,000 14,000
34,700
Post Production (marketing) Cost
Picking/Packing 27,500 60,000 (32,500)
Packaging Material 27,500 60,000 (32,500)
Marketing Commission 11,000 67,200 (56,200)
Transportation 11,000 48,000 (37,000)
(158,200)
Price variation in strawberry marketing depicts an erratic trend within crop cycle each year. As
well as lack of experience among new converted farmers also induces production losses which
affect profitability margins significantly. Break even points (for both prices and quantities) are
drawn for these production clusters, to highlight minimum price range and production average
in order to subside fears and improve decision making on strawberry production.
The analysis of crop budgets for BEP highlights that the breakeven price against the current
production capacity is PKR 38.55 per kg in Sarkee and PKR 42.93 in Punjab, while break even
quantities are 5301 and 6440 kg respectively against the base price of PKR 80. This confirms
a promising picture of conversion to strawberry production inhibiting risk of financial losses
considerably.

CHAPTER 4 – STRAWBERRY
28 | V a l u e C h a i n A n a l y s i s i n D i s t r i c t C h a r s a d d a
Table 6: Breakeven Point Calculation for Strawberry in KPK and Punjab (1 acre)
Economic Parameters Charsadda (Sarkee)
Punjab (Sharaqpur)
Breakeven Price (Rs.)16 38.55 42.93
Breakeven Quantity (Kg)17 5,301 6,440
Gross Margin (%) 52% 47%
Return on Investment (ROI)18 - % 107% 90%
Distribution of Value Addition and Gross Margins
Strawberry value chain generate gross margins for value chain operators according to their
respective value addition through the process. The analysis shows that strawberry farmers
are fetching the most benefit out of strawberry crop cycle (52% GM), followed by retail function
(16% GM). The value addition throughout the cycle depicts the same pattern however the gap
between value addition is rather close as compared to gross margins. Strawberry is rather a
new crop, and farming communities are better positioned to reap significant benefits from the
cycle. Likewise, retailers are also benefited from the premium crop as price control structures
are rather weak in the marketing of fruits and vegetables. Detailed gross margins and value
addition of different value chain operators are mentioned below;
Table 7: Gross Margins and Value Additions in Strawberry Crop (per kg of strawberry turnover)
VC Actors Sale Price (PKR)
Input cost (PKR)
Other Cost (PKR)
Total Cost (PKR)
Gross Margin (PKR)
Value added (PKR)
Gross Margin (%)
Value Added (%)
Farmer 80.00 27.33 11.23 38.55 41.45 52.67 51.81 37.62
Wholesaler 95.00 80.00 4.00 84.00 11.00 15.00 11.58 10.71
Inter-market Trader
110.00 95.00 5.00 100.00 10.00 15.00 9.09 10.71
Retailer 140.00 110.00 8.00 118.00 22.00 30.00 15.71 21.43
Employment Generation
The extensive management practices in strawberry production create significant employment
opportunities for both skilled and unskilled laborers throughout the chain. Regular family labor
and permanent jobs in the trading cycle is difficult to capture for all levels of engagement,
however seasonal man-days have been calculated to emphasize the importance and
livelihood opportunities created during strawberry production cycle.
16 Breakeven Point (price) = Total Cost of Production (Rs)
Total Production (kg) 17 Breakeven Point (Quantity) = Total Cost of Production (Rs.)
Price (Rs/Kg) 18 Return on Investment (%) = Gross Margin Total cost of Production

CHAPTER 4 – STRAWBERRY
29 | V a l u e C h a i n A n a l y s i s i n D i s t r i c t C h a r s a d d a
It is estimated that strawberry production in Charsadda alone generated 149,800 man-days in
a single crop cycle, while the same production produces 99,750 labor days in trading cycle.
Runner production is another labor intensive operation; the entire runner production
(estimated 500 million runners in 2017) entails 96,720 man-days in production and extraction.
Some other specialized heads like transportation has not been accounted as the mode is not
uniform and difficult to separate share for strawberry crop.
The vulnerable groups (youth, women and disable groups) were part of the overall labor force
and contributed according to their capacity and outreach. For instance, youth were equally
utilized as part of routine crop management cycle, primarily during weeding, picking, packing,
loading and unloading activities, while the role of women was noticed at the runner extraction
stage (Upper Dir only), cleaning of runners before transplantation in district Charsadda and
significant labor force in Punjab. The market in Sarkee generate number of economic
opportunities in the marketing season of strawberry from February to May. Likewise, as
informed by the key informant, a disable person in Sarkee market provide weighing facility
during season.
Table 8: Calculation of Labor Intensity in Strawberry Cultivation
Type of Jobs Man-days (per acre)
Percent Share
Description
Runner Production
(Swat)
96,720 28
186 man-days per acre times 520 acres = 96,720 man-
days
Strawberry Production (Charsadda)
149,800 43 214 man-days per acre times
700 acres =149,800
Post Production and Marketing (Charsadda)
99,750 29
▪ Picking (90 man-days per acre times 700 acres) = 63,000
▪ Market (100 labor per day times 105 market days*) = 10,500
▪ Trading/transportation (250 labor per day times 105 market days)=26,250
Total 346,270 100
*market days refer to the functional working days of the market – market remain operational for 105 days
Shortage of labor is a growing concern at all levels of strawberry production, and considered
one of the important hindrance in future expansion of sub-sector. The feasibility of
mechanization and innovation need to be tested from different experiences to subside
pressure on growing labor needs and facilitate advancement in the introduction of strawberry
crop to new areas.
It is argued that the MEP targeted interventions in strawberry crop cycle will trigger additional
direct/in-direct employment opportunities in the target district. The expansion in crop area of
strawberry during the period 2000-2017 reach 700 acres with self-help initiatives. Informed

CHAPTER 4 – STRAWBERRY
30 | V a l u e C h a i n A n a l y s i s i n D i s t r i c t C h a r s a d d a
estimates and discussion with key informant highlights the growth rate as 122 acres in every
3-year cycle. Using the same basis of projected increase in strawberry area is 772 acres
without MEP support, however this increase is expected 2 fold by the end of project life.
Management and marketing of strawberry crop generate 840 employment opportunities on 1
acre of land (table 8), similarly the progressive enabling environment with MEP support
activities will trigger 2-fold increase in strawberry expansion in the coming 3 years’ cycle. Thus,
it is speculated that MEP support will generate additional 81,090 new direct/in-direct jobs in
different value chain functions. Major share of these jobs are created inside Charsadda (98%)
while the impact will be spilled over to runner production area for additional strawberry
expansion due to MEP support (7 more acres for runners’ production will be required for
planting 122 acres’ strawberry in Charsadda). As highlighted previously, this expansion will
certainly reach out project target groups of small holders, women entrepreneurs and disable
person as per their capacity and strengths.
Table 9: Projected New Job Opportunities with MEP Support
Description Unit Value
Labor Man-days generated from 1 acre of strawberry cultivation
Labor Man-days 665
Speculated increase in Strawberry area per 3 years cycle
Acres 122
Projected Increase in Strawberry area due to MEP interventions
Acres 122
Projected jobs created with MEP Interventions in upcoming 3-years period
Labor Man-days 81,090
(Production Function = 27,410)
(Post Prod./Marketing = 53,680)
Projected new jobs in Charsadda
Labor Man-days 79,788
Projected new Jobs outside Charsadda (Swat/Dir/Bajaur)
Labor Man-days 1,302 mostly in runners production
Inefficiencies and Distortions
There are certain inefficiencies and distortions recorded during analysis (primary and
secondary data) of strawberry value chain. These inefficiencies are noticed as lost production
capacity, pre/post-harvest losses, labor in-efficiency, fertilizer adulteration and lost premiums
of marketing with high end markets. These in-efficiencies are not easy to overcome, but do

CHAPTER 4 – STRAWBERRY
31 | V a l u e C h a i n A n a l y s i s i n D i s t r i c t C h a r s a d d a
provide scope of improvement with targeted interventions. These inefficiencies cost PKR 1.2
million in total on an acre of strawberry production.
The current production level of strawberry in Charsadda (11,000 kg/acre) is far below the
international market leaders of strawberry (USA is 21,545 kg, Spain 19,000 kg and Egypt
18,000 kg per acre of land19). The losses in yield potential implies that strawberry farmers in
Charsadda lost value of PKR 843,600 when comparing yield potential of Charsadda with USA.
Though the benchmark capacity is not easy to overcome in short run, however varietal
improvement and technological innovations can help to minimize this capacity difference with
concerted efforts.
The pre/post-harvest losses emanate during rainy season, crop losses to insect pests, and
using unskilled laborer during picking. The 20% harvest losses compromised economic value
of PKR 176,000 per acre of strawberry crop. Some nominal level of losses is obvious and
uncontrollable; however, it should not be exceeding certain acceptable limit.
Similarly comparing the use of technologies between Charsadda and Punjab highlighted the
labor inefficiency (108%) could be avoided with the use of plastic mulching in strawberry crop.
Difference in yield emanates from multiple factors; however, fertilizer application could be
optimized with proper soil mapping and management practices.
Likewise, dependency on single marketing channel also cost the lost premiums of dealing with
high end markets. Interaction with METRO Lahore confirms that they offer at least PKR 10
premium on per kg of Strawberry to contracted farmers. Taking this into account revealed that
farmers are losing 13% extra value (equivalent PKR 110,000) of this lost opportunity.
Similarly, the fertilizer expense of Charsadda is higher (24%) than Punjab on the same piece
of land with resultant decreased production (see budget in table 4). The reason might be agro-
climatic conditions, however proper fertility mapping would certainly educate on nutrient
requirement and efficient dosage of fertilizer application.
The analysis presents an exaggerated outlook of inefficiencies and distortions during
strawberry cultivation, however this provide insights for development planners to highlight
scope of improvement and ways to optimize farm efficiency and benchmarking for growth.
The inefficiencies are listed in the table below;
Table 10: Inefficiencies and Distortions in Strawberry Production Cycle (1 acre)
Inefficiencies and Distortions
Percent Losses/Gap
Lost Value (PKR/Acre)
Benchmark20
Potential Yield Loss 95% 843,600 Comparison with Global production level (kg)
19 Ibid pg. 9 20 The benchmark of global yield potential is drawn from FAOSTAT, while the remaining parameters are calculated from field
survey results
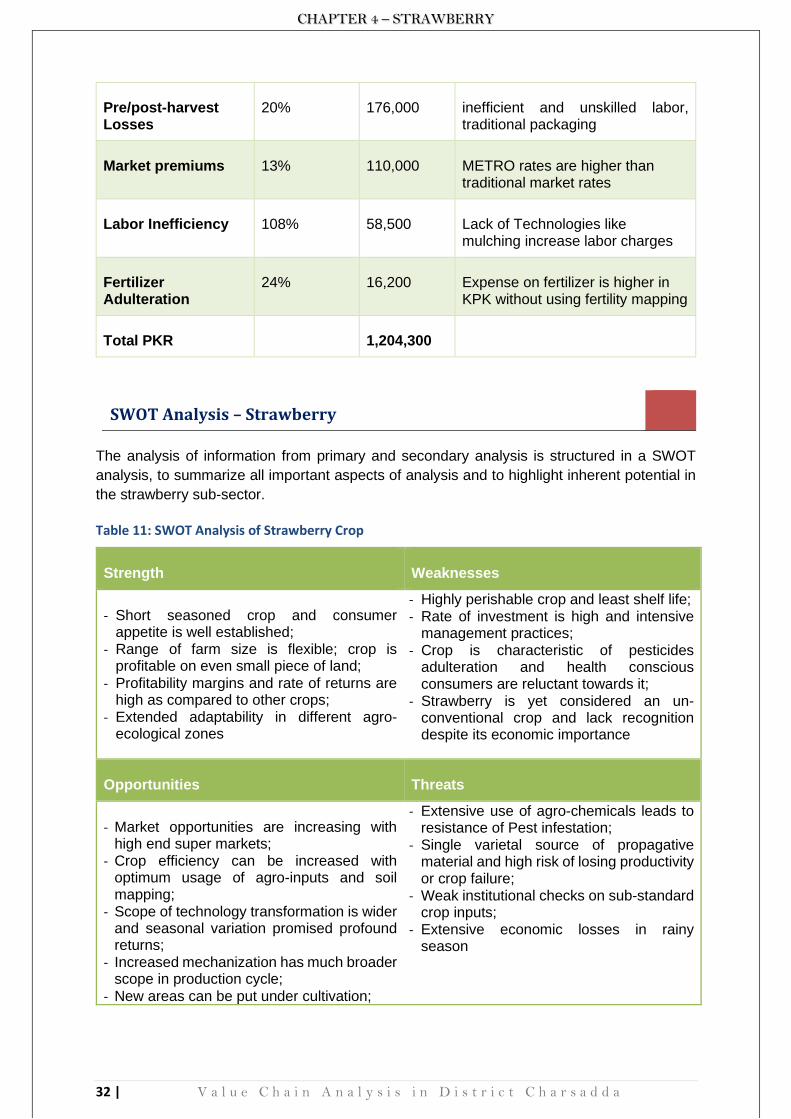
CHAPTER 4 – STRAWBERRY
32 | V a l u e C h a i n A n a l y s i s i n D i s t r i c t C h a r s a d d a
Pre/post-harvest Losses
20% 176,000 inefficient and unskilled labor, traditional packaging
Market premiums 13% 110,000 METRO rates are higher than traditional market rates
Labor Inefficiency 108% 58,500 Lack of Technologies like mulching increase labor charges
Fertilizer Adulteration
24% 16,200 Expense on fertilizer is higher in KPK without using fertility mapping
Total PKR 1,204,300
SWOT Analysis – Strawberry
The analysis of information from primary and secondary analysis is structured in a SWOT
analysis, to summarize all important aspects of analysis and to highlight inherent potential in
the strawberry sub-sector.
Table 11: SWOT Analysis of Strawberry Crop
Strength Weaknesses
- Short seasoned crop and consumer appetite is well established;
- Range of farm size is flexible; crop is profitable on even small piece of land;
- Profitability margins and rate of returns are high as compared to other crops;
- Extended adaptability in different agro-ecological zones
- Highly perishable crop and least shelf life; - Rate of investment is high and intensive
management practices; - Crop is characteristic of pesticides
adulteration and health conscious consumers are reluctant towards it;
- Strawberry is yet considered an un-conventional crop and lack recognition despite its economic importance
Opportunities Threats
- Market opportunities are increasing with high end super markets;
- Crop efficiency can be increased with optimum usage of agro-inputs and soil mapping;
- Scope of technology transformation is wider and seasonal variation promised profound returns;
- Increased mechanization has much broader scope in production cycle;
- New areas can be put under cultivation;
- Extensive use of agro-chemicals leads to resistance of Pest infestation;
- Single varietal source of propagative material and high risk of losing productivity or crop failure;
- Weak institutional checks on sub-standard crop inputs;
- Extensive economic losses in rainy season

CHAPTER 4 – STRAWBERRY
33 | V a l u e C h a i n A n a l y s i s i n D i s t r i c t C h a r s a d d a
- The institution of FSC has potential entity for quality inputs provision on competitive prices

CHAPTER 4 – STRAWBERRY
34 | V a l u e C h a i n A n a l y s i s i n D i s t r i c t C h a r s a d d a
Road Map – Value Chain Development in Strawberry
Runner Stage
➢ Varietal introduction (quality, seasonal adaptability, production capacity, shelf life,
averting risk of crop failure) – genetic material
➢ Technology for runner extraction and mechanical calculation of runner (as Labor is
expensive and malpractices fetch bad name for runner farmers)
Production Stage
➢ Optimum management calendar in the form of a crop manual (pictorial) for easy to use
and best management practices
➢ Integrated control of mites (bio-pesticides), seasonal variation, (plasticulture) – trials;
➢ Cost-benefit analysis of seasonal variation to adjust and provide different/best feasible
timings for strawberry cycle;
▪ Early transplanting has high mortality rate, need re-transplantation and more input
intensive; on the other side it fetches early produce and possibly getting higher
prices
▪ Adoptability in different control environment (shade effect) may help in seasonal
variation
➢ Activities like mulching and high tunnels could be test for efficiency and improved
results; mulching is must for ensuring crop quality at picking stage while tunnel is
required for saving crop from extreme frost and total damage during rainy season
(preventive measure)
➢ Soil mapping for gauging soil fertility levels and advice on the optimum use of fertilizers
and micro-nutrients (union council level mapping of soil fertility)
➢ Composting and Fermenter system as improving efficiency of FYM (FYM is not
preferred manure to be used in strawberry cultivation, provide medium for micro-
organism growth however scientific treatment of fresh FYM (mulching and urea
application) may have better efficacy and promote sustainable agriculture practices;
➢ Strengthening capacity building and developing pool of master trainer (consultation
and advice) for standardizing cultural practices and state of art technologies;
➢ Farmer field school and farmer business schools could be replicated in the project area
for better organization and technology transfer
➢ Exchange visits for progressive farmers to model farming sites in Punjab, to facilitate
learning and technology transfer.
Marketing
➢ Feasibility and business plan to functionalize Pack House; packaging and processing
might be options for further detail analysis;
➢ Exploration of new market venues for packed and graded strawberry in Peshawar
(AVON, Hyper Mall, etc.) and Islamabad
➢ Rich institutional base of MEP (Helvetas Intercooperation) on improved marketing,
MIS, and improved packaging could potentially be piloted in the target location;
➢ Strengthening market association will have better results for market integration and
transparency.

CHAPTER 4 – STRAWBERRY
35 | V a l u e C h a i n A n a l y s i s i n D i s t r i c t C h a r s a d d a
Figure 11: Improved Technologies in Punjab: Consumer Packaging; Tunnel + Drip Irrigation; Strawberry Runners in Peat moss Trays
Value Chain Governance/Transparency
➢ Integration and association building is critically required for conflict resolution and
setting smooth terms of trade, in all level of strawberry production cycle. Successful
models from previous development projects of Helvetas Intercooperation could be
replicated in the project location

CHAPTER 5 – TOMATO
36 | V a l u e C h a i n A n a l y s i s i n D i s t r i c t C h a r s a d d a
TOMATO VALUE CHAIN
Overview of Tomato Sub-Sector
Tomato is one of the major vegetable crop in Pakistan, grown extensively in all four provinces
to fulfill the growing nationwide demand across the country. Tomato is an important culinary
item for daily use among all societies in the country, as well as tomato products like ketchup,
paste, slurry and toping has been increased considerably with the fast food industry.
Tomato is grown on an area of 60,671 hectares of land, producing an annual production of
566,043 tonnes throughout the year in the country21. Sindh is the major producer of tomato in
Pakistan, followed by KPK, Baluchistan and Punjab, however the production capacity in
Punjab (12.78 tonnes/ha) is the highest among all production areas. KPK and Baluchistan
produces in both Rabi and Kharif season, while Sindh and Punjab has production in Rabi
season only.
Figure 12: Provincial Tomato Shares and Their Respective Production Potential
Tomato has overlapping season and is stretched throughout the year. Below is the seasonal
spread of tomato across the country, included injection from neighboring countries to subside
national demand22.
21 Statistical Year Book, 2014-15, Pakistan Bureau of Statistics 22 Rapid Market Appraisal, Agriculture & Marketing Consultants’ Services (AMCONS), Livelihood Programme Hindukush (LPH), FATA Region, 2014
12% 22
% 45%
21%17
%
23%
36%
25%
0%
20%
40%
60%
80%
100%
Punjab KPK Sindh Balochistan
Tomato Shares in Pakistan (%)
Production Area 0.00 5.00 10.00 15.00
Punjab
KPK
Sindh
Balochistan
Pakistan
12.78
9.63
7.41
11.13
9.33
Production Potential (Tonnes/Ha)

CHAPTER 5 – TOMATO
37 | V a l u e C h a i n A n a l y s i s i n D i s t r i c t C h a r s a d d a
Table 12: Supply Patterns of Tomato in Pakistan
Similarly, tomato is grown widely in 16 out of 24 districts in Khyber Pakhtunkhwa, mainly in
Peshawar valley, Malakand and Hazara Division, and grown in the fertile belt of Southern
Districts as well. Tomato production is
leading (23%) among all vegetable produced
in the province, both in terms of area and
production23.
Charsadda is 3rd largest district in the
province in terms of area and production of
tomato. It has grown on an area of 11,051
hectares in 2015-16 growing season; 70%
grown in Kharif planting season while
remaining 30% in Rabi. It has range of
multiple growing seasons and come under
diverse cropping pattern. Vegetable boom in early 2000 bring technological improvements in
tomato crop with high yielding varieties, vertical farming, and tunnel technology (seasonal
variation); tomato growing is transformed on vertical farming in Tehsil Charsadda and Tangi.
Figure 14: Area and Production of Major Vegetable in KPK
Despite this huge production capacity, Pakistan is not self-sufficient in tomato production.
Limited supply from national production during the period of September to November creates
market niches for imports from India, Afghanistan and Iran. Moreover, tomato prices also
skyrocketed in these months (surpass Rs. 200 per kg during October 2017), stretching the
purchasing power of middle income group. This provide prospect to increase production area
or production capacity of those pockets where tomato is grown during late summer and early
autumn production reaches.
23 Crop Statistics of Khyber Pakhtunkhwa, 2015-16, Crop Reporting Service, Ministry of Agriculture
Production Areas January February March April May June July August September October November December
Afghanistan
India (Season 1)
India (Season 2)
Swat/Dir
Peshawar/Mardan/Mansehra
Tangi/Dargai
Sindh
Punjab
Baluchistan/S Waziristan
Swat5060, (46%)
Charsadda848, (8%)
KPK Tomato Area (Ha)
Swat, 52,285 (46%)
Charsadda7,730 (7%)
Tomato Production (tonnes)
Turnip, 21%
Tomato, 23%
Others, 20%
Turnip
Carrot
Spinach
Tomato
CauliFlower
Figure 13: Vegetable Production in KPK (2015-16)

CHAPTER 5 – TOMATO
38 | V a l u e C h a i n A n a l y s i s i n D i s t r i c t C h a r s a d d a
Value Chain Functions
Input Supply;
The input supply function caters with the provision of seeds, pesticides, fertilizers, implements,
packaging material, and specialized inputs for vertical gardening (like nets and wires). Tomato
is completely converted to hybrid technology with increasing influence of private sector.
Though there are numerous private companies providing hybrid seeds, however the seed of
few companies are more popular among farming communities. Syngenta introduced a specific
variety for vertical gardening (“Sahel”), which was famous to date for its significant production
capacity. The firm organized number of field trips to their research farm in Akora Khattak, to
capacitate farmers on technology transfer. Other varieties like “Super Red” (Akora Seed),
“Anna” (Seminis) and “Four Seasons” (WealAg-Welcon) also have a leading market share in
vertical gardening. Similarly, Syngenta- 1359 and 1057, Mehran, Red Hero and Four Seasons
are the leading varieties of autumn crop. Four Seasons variety is becoming more popular due
production capacity, disease tolerant, solid skin (high shelf life) and wider adaptability in
different agro-ecological zones. All hybrid seeds are imported from different countries as
regulatory authorities hadn’t insist with private sector on transfer of hybrid technology in
Pakistan.
Hybrid seed is expansive and quantity in grams cost thousands of rupees (Sahel = Rs
2800/1000 seeds; Anna = Rs 5500/3000 seeds; Super Red = Rs 2000/1800 seeds; Four
Seasons = Rs 1800/3000 seeds). Price fluctuation of tomato crop as well as high cost of hybrid
seed compelled farmers to think about investment on reliable seeds and other inputs. The
culture of extracting seeds from hybrid tomato is becoming more common during last 4-5 years
(“Glassy”) and traders used to sell it on Rs. 1500/100 gm of seeds (ten time cheaper than
registered hybrid varieties). The production capacity and germination rate of company
provided hybrid is not being realized by farmers and they couldn’t notice the difference in
germination and lost production potential.
Production/Post-harvest Handing:
The production function rest with farmers’/farming communities, encircling tasks like land
preparation, sowing, management practices, irrigation, post-harvest handing and marketing of
tomato crop.
District Charsadda has 3 different cultivating patterns for tomato crop. Rabi crop (Spring-
Summer) is more prominent in Tehsil Charsadda and Shabqadar, while Kharif crop (Autumn-
Winter) in grown exclusively in the frost free zones of Tehsil Tangi. Spring crop is more
dominant while frost free belt of Tehsil Tangi is known for its tomato crop in autumn.
Autumn Crop has been started 30 years ago; adopted from Swat/Dargai and practiced mainly
on the strips stretched along Mohmand Agency toward Malakand. The area is Rain-fed (only
20% come under canal irrigation) with mountainous terrain, however the attraction of frost free
zone and overwhelming returns of tomato crop compel farmers to invest on land leveling, and
tube-well irrigation. Two small dams have been built on surface run-off, one such structure is
irrigating catchment area while the other one is non-functional because of farmers’ conflict.
Land holdings are small in this belt with majority of owners have land rights of 2 acres (50%),
5-7 acres group constitute 25% growers while large owners are cultivating 15 acres of land

CHAPTER 5 – TOMATO
39 | V a l u e C h a i n A n a l y s i s i n D i s t r i c t C h a r s a d d a
(25%). Crop Reporting Service (CRS) reported tomato area in Rabi planting season as 92
hectares only, however field research confirm the area is much higher and reaching the mark
of 1000 acres in this belt. Nursery is raised in the
month of late August - September, transplanted in
October, picking starts in the first half of November
and production continues till end of December
(January production come from field based ripening
heaps of tomato). Cold waves didn’t allow tomato
maturity after mid-November and farmers tend to
store tomato at field level ripening heaps and
marketing onwards; this farm level storage is
adopted from Swat some 6-7 years ago. Onion,
wheat, and sugarcane are other important crops of
this belt. Some low lying areas have mild frost in this
region, which compel farmers to uproot tomato plants in towards the end of November (one
month picking) and prepare land for wheat cultivation. Disease outbreak is not common in
autumn tomato because of unfavorable weather conditions, and solid skin tomato which has
a much longer shelf life. Farmers do apply pesticides for some minor issues like cutworms,
root rot, stem rot and damping-off in initial stages etc.
Price hike of fuel and extensive load-shedding were not favoring tomato expansion in the
target area; installation of solar tube-wells is gaining popularity in the target area, though the
cost of installation is high (PKR 600,000 for 2 inches’ water pumping).
Table 13: Seasonal Calendar of Autumn Tomato Production
Vertical Tomato Production was introduced by a progressive farmer in Sardheri (2007-08),
the same was replicated in Harichand in 2011-12. accurate cropped area is not known,
however approximation of key informants suggest that vertical tomato might be in the range
of 1000-1200 acres in Charsadda (Harichand, Sarkee, Mandani, Gulabad are main Union
Councils in Tehsil Tangi). The technology is intensive and farmer can hardly manage a crop
of 1-3 acres of vertical tomato; skilled laborer preferred to lease land for tomato farming rather
than sharecropping while majority of this culture is practiced by owner cum tenant (50%). The
nursery is raised in the first week of January; it takes 25 days in nursery for further
transplantation; but this activity is delayed due to closure of canal system; canal system is
closed for 40 days officially for cleaning but this opening is delayed every year further due to
administrative issues; it was open on 20th February last year while 2016 was worse year when
canals were re-opened on 27th March after farmer demonstrations.
Wk1 Wk2 Wk3 Wk4 Wk1 Wk2 Wk3 Wk4 Wk1 Wk2 Wk3 Wk4 Wk1 Wk2 Wk3 Wk4 Wk1 Wk2 Wk3 Wk4 Wk1 Wk2 Wk3 Wk4
Land Preparation
Nursery Raising
Tranplanation
Hoeing Cycles
Irrigation
Fertilizer Application
Pesticide Application
Fruiting
Picking Cycles
Marketing (Ripening heaps)(Fresh)
October November DecemberAugust September January
Autumn Crop of Tomato in Charsadda
Activities
Figure 15: Field Based Ripening Heaps of Tomato

CHAPTER 5 – TOMATO
40 | V a l u e C h a i n A n a l y s i s i n D i s t r i c t C h a r s a d d a
This delay in opening canal system has negatively affected vegetable farmers at large and
resulting in demonstrations and road blockages. Farmer tend to use their own techniques for
preserving moisture content (plasticulture – till 1st week of March), used tube well irrigation
and/or manual but hectic application of water through pots. Tomato is a water intensive crop
and it require 12 irrigation cycles in entire cropping season. Extreme cold/frost is not good for
this crop; a virus attack is more prevalent during cold season. ASF introduced high tunnel
technology to provide controlled environment in year 2014 but the intervention was not
successful due to lack of management capacity and technical knowledge. Leaf miner,
fruit/white fly, aphids, nematodes and cutworms are more common insects while blight, stem
rot, root rot, black shake and downy mildew are common diseases of tomato in summer.
Mulching was practiced last year by few farmers but couldn’t give desired results (land was
not leveled properly). Fruiting starts from mid-April and continue till end of August; produced
need to be picked on every 3rd day in peak production season. On average, 60 pickings are
possible from tomato crop in vertical production technology.
Export companies do pilot high value cherry tomatoes last year, however the result was not
positive (production and adaptability issues). The export is more emphasized on bitter gourd,
long gourd, peas, brinjal, cucumber, fresh beans and carrot, while tomato is not a preferred
crop, not only because of perishability but also not complying with the consumer preference
of Middle East (prefer round tomatoes). The export option is more profitable for farming
community (no commission, no packing cost, extra premium of 10-20 Rs per kg).
Export of fruits and vegetable has been record low during last 5 years due to higher
competition in the export market; export volume has been shrinking (13%) from 67,864 million
rupees in 2014-15 to 59,241 million rupees in two years period24.
Production capacity is not actualized largely due to non-compliance of technical
recommendations; Syngenta claim 75,000 kg production capacity for Sahel variety per acre
of land while farmers hardly reap 45,000-50,000 kg of tomato per acre.
Farmers tend to use open field for nursery raising where mortality is higher (30%) and
subjected to soil borne pathogens and weeds which affect the vigor of transplants and
affecting production capacity.
Table 14: Seasonal Calendar of Vertical Tomato Production
24 (http://www.pbs.gov.pk/sites/default/files//tables/14.2.pdf)
Wk1 Wk2 Wk3 Wk4 Wk1 Wk2 Wk3 Wk4 Wk1 Wk2 Wk3 Wk4 Wk1 Wk2 Wk3 Wk4 Wk1 Wk2 Wk3 Wk4 Wk1 Wk2 Wk3 Wk4 Wk1 Wk2 Wk3 Wk4 Wk1 Wk2 Wk3 Wk4
Land Preparation
Nursery
Tranplanation
installation of Nets
Hoeing Cycles
Irrigation
Fertilizer Application
Pesticide Application
Picking Cycles
Marketing
(Decreasing Prod.)(Peak Production Period)
JulyJune
Vertical Gardening of tomato in Charsadda
AugustJanuary FebruaryActivities March April May
(Limited Prod.)

CHAPTER 5 – TOMATO
41 | V a l u e C h a i n A n a l y s i s i n D i s t r i c t C h a r s a d d a
Surface Tomato Production: Tehsil Shabqadar is considered the most remote and least
development in terms of development indicators. The society is conservative and engaged in
traditional clutches. Though farming is the main livelihood pattern, however the level of
decision making is still conservative about traditional crops. Wheat, maize and sugarcane are
the mainstream crops, while new technological innovations about high value vegetable are
still missing. Vegetable farming is limited to certain pockets in peri-urban areas of Shabqadar
municipality. Exact estimates are not available; however, it is believed that more than 2000
acres of land is under different seasonal vegetables (tomato, turnip, carrot, radish, cucumber,
brinjal, spinach and cauliflower etc.). The share of tomato was higher few years back (35-40%)
but it received major setback in recent years due to dwindling market prices and lower
profitability margins. Surface tomato is practiced in summer/spring season where nursery is
raised between last week of December and middle of January, while transplanting is made
between middle of February until March in these localities. Picking starts in mid-March and
continue till end of May and early June in some cases. The produce is linked with local
vegetable market in Shabqadar in plastic shoppers or marketed on roadsides.
Table 15: Seasonal Calendar of Surface Tomato
Marketing
The marketing function entails the trading, grading/re-packing, auctioning, and transportation.
Marketing venues vary as per cropping pattern and production technology. Tangi and Dargai
vegetable markets are specialized in tomato autumn crop; farmers are evenly distributed
between these 2 markets depending on proximity and established linkages with market
functionaries. Tomato from vertical gardening is traded in Harichand, Swat and Timergara
markets. Tomato production from Shabqadar is traded in Shabqadar and Peshawar vegetable
markets.
Harichand Vegetable Market was established in 1996 by traders. Market was shifted to its
current location (improved infrastructure) in 2015 which is being leased by commission agents
themselves. Mid December to mid-February is considered slack period for the market while
the transaction reached to its peak in March-August season when 500-600 tonnes of
fruits/vegetables are exchanged daily in peak operating season. The market is specialized in
bitter gourd, cucumber, tomato, peas, potato, garlic, water melon and honey dew melon.
Auction started in the afternoon (3 pm) and continues until 7 pm in the evening.
Tomato marketing started in late April and continues through early August. 400-500 tonnes of
tomato are traded daily in the market. Tomato is outgoing to markets in all along Pakistan,
Wk1 Wk2 Wk3 Wk4 Wk1 Wk2 Wk3 Wk4 Wk1 Wk2 Wk3 Wk4 Wk1 Wk2 Wk3 Wk4 Wk1 Wk2 Wk3 Wk4
Land Preparation
Nursery
Tranplanation
installation of Nets
Hoeing Cycles
Irrigation
Fertilizer Application
Pesticide Application
Picking Cycles
Marketing
(Start) (Peak Production) (Decreasing)
May
Surface Tomato Productin in Shabqadar, Charsadda
Activities January February March April

CHAPTER 5 – TOMATO
42 | V a l u e C h a i n A n a l y s i s i n D i s t r i c t C h a r s a d d a
while farmers in Harichand, Skhakot, Shergarh, Sarkee, Shakoor, Behram Dheri are linked
with this market.
Commission is charged at the rate of 7.5% from farmers, while Rs 10 per crate is deducted
from buyers. Most of the farmers are picking tomato crop themselves and brought it to market
while an exceptional category also sell crop in flowering stage (hardly 5-6%).
Main market venues for vertical tomato are channeled to Harichand, Mardan, Peshawar,
Timergara, Mingora and Chitral; the share of Timergara/Mingora is high as compared to other
markets (50%);
Wooden crates of 8 kg, plaster crates of 15-25 kg, and shoppers of 8-12 kg are more common
for tomato crop in Harichand Market; though post-harvest losses are high in plastic shoppers
(more than 20%) and is not preferable for distant travelling.
Tomato prices were not good in 2017; average price was Rs 16 per kg while maximum price
was Rs 35 per kg with lowest recorded was Rs 5-8 per kg in peak production days. Focus
group discussion with tomato farmers rectify that last 3 production years were contracting
financial losses for tomato growers.
Tangi Vegetable Market was established 30 years ago, and offering loading/un-loading,
auction, transportation, and re-packing services to farmers. Onion (May-June) and tomato
(November-February) are the main crops of Tangi market, while peas and cucumber are also
traded in the market. Tomato is mostly coming from Prang Ghar area, and Tangi Tehsil
(tomato belt). The market is inter-linked with Bannu, Kohat, Nowshera, Peshawar, Swabi,
Swat, Batkhela, Abbottabad, Mansehra, Islamabad and Lahore. More than 500,000 kg of
tomato is traded daily in peak operating season. 4-5 different grades of tomato auctioned daily,
depending on quality of crops and area.
Figure 16: Tomato in Tangi Market Offered for Auction
Used Ghee Canister (carrying 8-12 kg tomato) is the usual packaging material used in autumn
crops. The cheap price and re-usability for three years are the main reasons of using of ghee

CHAPTER 5 – TOMATO
43 | V a l u e C h a i n A n a l y s i s i n D i s t r i c t C h a r s a d d a
canisters. The produce is repacked in wooden and plastic crates to inter-market trading; re-
packing cost Rs 15 per 25 kg of crate. Plastic crate of 27-28 kg used for long distance travel
(Abbottabad, Mansehra, Bannu).
Commission agents deduct 6.5% commission (negotiable) from farmers while Rs 10 per crate
from buyers; 80% farmers secured credit from commission agents for crop inputs. Large
commission agents deal with 120-150 farmers while small agents do business with 8-10
farmers mostly
Union of commission agent is present in the market but it failed to comply it main
responsibilities i.e. agreement on uniform commission rate, conflict resolution among market
functionaries and farmers.
October rate of tomato was significantly high this year (reach-up 155 per kg), while it stays
between 60-100 Rs per kg throughout November and early December. It is believed that trade
embargo with India has positively impacted tomato trade this year (ban was imposed in
September 2017 without any prior indication, though the policy was said to be supporting local
farmers, however strained political relations with India is the prime cause25. Pakistan imported
190,451 MT of tomato from India in 2014-15 fiscal year26.
Value Chain Operators
Input Suppliers
There are 19 pesticide/seed providers and 11 fertilizer dealers in the premises of tomato belt
(Harichand, Mandani, Dhakki, AmirAbad). Tangi market has 12 main pesticides/seeds
dealers, while 6 are dealing with fertilizers while there are 15 main dealers of pesticides, seeds
and fertilizers in Shabqadar bazaar.
Vegetable boom at the beginning of 21st century encouraged the rapid expansion of agro-
chemical shops in district Charsadda. These shops are found in every small town and rural
hubs of district Charsadda for the facilitation of farmers. These dealers provide pesticides,
fertilizers (plus micro-nutrients), farm implements, and material like plastic and vegetable
nets/wires for vertical gardening. The private sector is flourishing in agriculture sector; there
are more than 120+ firms doing business in the province by providing range of agro-chemicals.
However, quality remains an issue of these provided inputs owing to the weak regulatory
check of state institutions.
Production/Post-harvest management
The exact number of farmers engaged in tomato production is not ascertained, however
estimation combined with information provided by key informant confirmed that approximately
700 farming families are cultivating vertical tomato, 450-550 families are growing autumn
tomato while 150 plus families are producing surface tomato in district Charsadda. There was
a growing tendency towards tomato production owing to huge production potential and
rewarding tomato prices few years back. However, the trend is static or decreasing in recent
25 https://tribune.com.pk/story/1516169/not-importing-tomatoes-india-good-decision/ 26 Ibid Pg. 34

CHAPTER 5 – TOMATO
44 | V a l u e C h a i n A n a l y s i s i n D i s t r i c t C h a r s a d d a
years, largely because of price inconsistencies in local markets and higher margins in other
high value vegetables.
Tomato is one of the regular crop in vegetable market, being supplied throughout the year to
markets in Pakistan, supply patterns are spread to different agro-ecological zones of the
country; however, the period between September and November are considered more
rewarding for tomato growers owing to reduced supply from local production and dependency
on imports from Afghanistan, Iran and India.
Historical published data confirms that yields are tomato yields are low in KPK as compared
to other provinces. The same has been noted from the yield differential of seed companies
claims and actual yields recorded at field level. The recorded yields are least for Farmers are
not realizing the potential yields Syngenta is claiming more than 70,000 kg per acre for Sahel
variety while farmers are barely getting 40,000 kg from an acre. Wheal-Ag is claiming 15,000
– 17,000 kg per acre for its “Four Seasons” variety whereas farmers are hardly getting 10,000
kg from an acre of land.
Marketing
There are 12 functional commission agents in Harichand Market while inter-market traders,
wholesalers and seasonal labor (loading/un-loading/packing) collectively provide
opportunities for more than 250 persons on daily basis. Tangi market has 35 main commission
agents on regular basis, 55-60 wholesalers, 50+ inter-market traders and more than 300 daily
wage laborers are permanently available in the market. The retail function is not easy to
quantify, as the number of vegetable retailers (shops, wooden carts, mechanized carts and
road side vendors) grow manifolds during last 7-8 years’ period. On average, 10-12 vegetable
retailers are functional in every small town and rural centers. The number reached hundreds
to thousands in small to large cities.
There are 12-15 export companies are linked with Harichand market; exporting vegetables
(bitter gourd, cucumber, peas) to Middle East Markets. Pakistan started sea shipment of
vegetables (tomato, brinjal, cucumber, carrot, okra, long melon) to UAE for the first time in
February 2017 which will considerably reduce transportation cost (from Rs 80 per kg to Rs 5
per kg).
Enabling Environment
The enabling environment remains the same as was presented in strawberry value chain.
Both strawberry and tomato are receiving the same treatment from private sector and
government institutions. The facilitation role is largely
Value Chain Facilitators
The service provision within the tomato value chain has gaps notably in terms of technical
assistance on improved practices, farm mechanization, soil mapping and judicious use of
agro-chemicals. Farm service centers and agriculture extension department has grass root
presence in tomato production clusters, however the potential is not yet capitalized due to
weak institutional and practical arrangements. Technical advisory services rest with the input
dealers of private sector, who are facilitating this service gap with their limited knowledge and

CHAPTER 5 – TOMATO
45 | V a l u e C h a i n A n a l y s i s i n D i s t r i c t C h a r s a d d a
understanding. The gaps identified in the service delivery could possibly be addressed with
the strengthening of respective farm service centers by imparting specialized capacity and
increasing the access of farming community towards these institutional establishments
through proper advocacy campaigns.
Dedicated extension material is not available for either
vegetable and fruit crop from credible institution in district
Charsadda, some barely available extension leaflets and
brochures are available through private companies but
merely promoting their own products. The banking
network is well established in district Charsadda, majority
of these banks offer agriculture loans but farmers are
reluctant to reach these formal networks and/or lacking
capacity to avail such facilities. They prefer the expansive
credit facility with market functionaries or input dealers,
which are rather easy to materialize but with increased
(inherent) interest rate or service charges.
Here is an example of such display by a private firm portraying the use of chemicals for
different insect pest issues, not hinting any easy to use measure from integrated management
techniques.
Value Chain Regulators
Likewise, the role of Value Chain Regulators is largely constrained with weaknesses inherited
in the check and balance framework, despite the fact that progress on legal frameworks (Seed
Act, Pesticide Act, Fertilizer Act, Agriculture Policy) to provide institutional cover is very well
defined. Strict monitoring of the seed market by FSCRD and AED is an important area which
can safeguard interest of farmers.
Horticulture sector in Khyber Pakhtunkhwa has been rapidly evolving on commercial lines in
the recent past and attracted large investments from private sector. However, institutional
check and balance on the quality of inputs (seeds, pesticides and fertilizers etc) is rather weak
and adulteration of chemicals not only affects the productivity of crops, the adverse impact on
environment is also eminent. Strong advocacy and control measures are required to check
the “Glassy” hybrid seed of tomato, the risk of crop failure is increased manifolds with this sub-
standard culture. Tomato produced in KPK has an important contribution in national supply
lines, any inconsistency will induce significant shortages in the production channel and
subsequently disturb the consumption pattern.
Value chain based interest groups can help advocate policy reforms and stringent measures
on quality of imported inputs and safe use of agro-chemicals among the farming communities.
Agriculture research should embark on action oriented research and outreach facilities should
be tailored for a smooth transformation of latest, state of art technologies to improve
production and increase efficiency of farm outputs.
Value Chain Integration/Governance
Lack of association and weak integration is the characteristic feature of tomato value chain in
district Charsadda. Both horizontal and vertical integrations are loose network bonds, merely
Figure 17: Private Company Banner of Pest Management

CHAPTER 5 – TOMATO
46 | V a l u e C h a i n A n a l y s i s i n D i s t r i c t C h a r s a d d a
on the basis of temporary contacts. The only formal associations are identified in markets of
Tangi and Harichand, however these associations are largely dysfunctional due to lack of
interest and failure to uphold it desired functions of fixing commission rates and resolving
conflicts among traders and farmers.
Figure 18: Value Chain Integration in Tomato Crop
The figure above depicts integration among the chain operators however these are mostly
informal relationships. The chain as a whole is highly fragmented and lack functional
integration. Intra-functional integration can be improved by formation and strengthening of
interest groups. Interest groups may include nursery growers’ association, producers’
association and marketing agents’ association. There is need to develop a strategic framework
for the association and their capacity building to work towards a common objective.
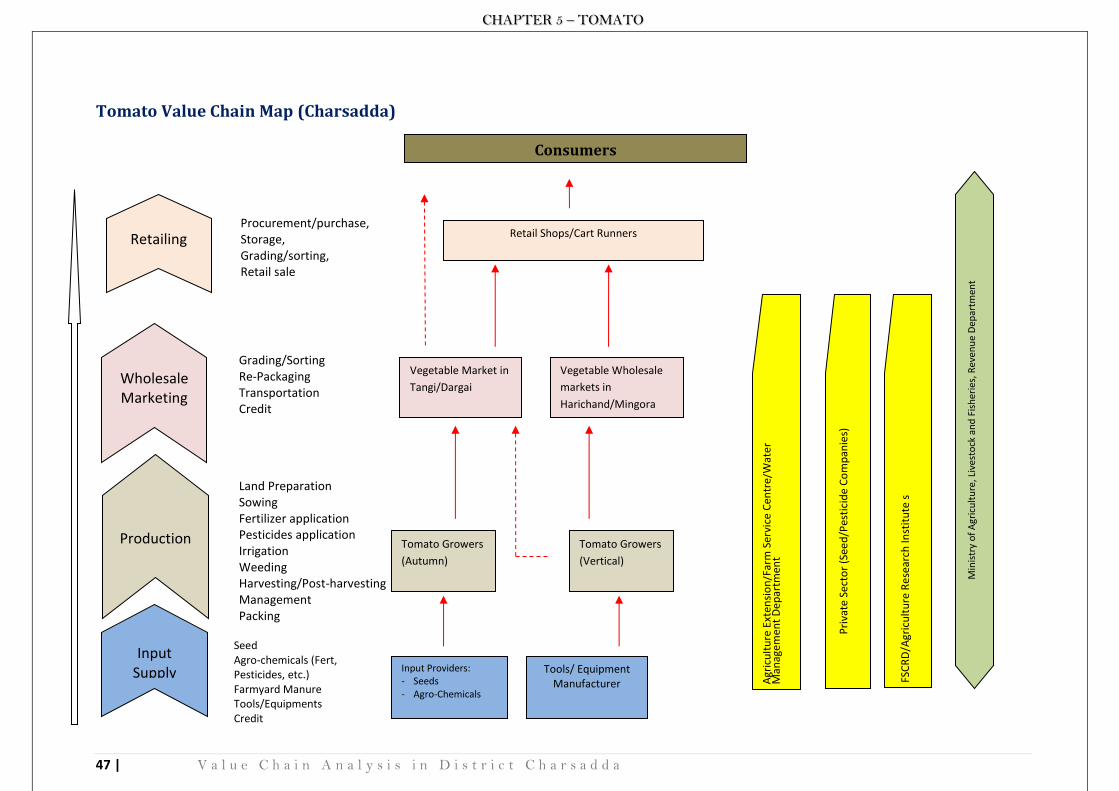
CHAPTER 5 – TOMATO
47 | V a l u e C h a i n A n a l y s i s i n D i s t r i c t C h a r s a d d a
Tomato Value Chain Map (Charsadda)
Consumers
Production
Wholesale Marketing
Input Supply
Retailing Procurement/purchase, Storage, Grading/sorting, Retail sale
Grading/Sorting Re-Packaging Transportation Credit
Land Preparation Sowing Fertilizer application Pesticides application Irrigation Weeding Harvesting/Post-harvesting Management Packing Seed
Agro-chemicals (Fert, Pesticides, etc.) Farmyard Manure Tools/Equipments Credit
Agr
icu
ltu
re E
xten
sio
n/F
arm
Ser
vice
Cen
tre/
Wat
er
Man
agem
en
t D
ep
artm
ent
FSC
RD
/Agr
icu
ltu
re R
ese
arch
Inst
itu
te s
Min
istr
y o
f A
gric
ult
ure
, Liv
esto
ck a
nd
Fis
her
ies,
Rev
enu
e D
epar
tmen
t
Input Providers: - Seeds - Agro-Chemicals
Tools/ Equipment Manufacturer
Retail Shops/Cart Runners
Tomato Growers
(Vertical)
Pri
vate
Sec
tor
(See
d/P
esti
cid
e C
om
pan
ies)
Vegetable Market in
Tangi/Dargai
Vegetable Wholesale
markets in
Harichand/Mingora
Tomato Growers
(Autumn)

CHAPTER 5 – TOMATO
48 | V a l u e C h a i n A n a l y s i s i n D i s t r i c t C h a r s a d d a
Economic Analysis – Tomato Value Chain
Profitability Analysis
The crop budgets have been prepared and analyzed for all three cropping patterns of tomato
in Charsadda. The intent was to identify different cost heads in tomato production, analyzing
its efficiency and provide cross comparative of different cropping patterns for gross margins
and risk associated with price fluctuations.
The budgets were drawn during focus group discussions and representative of general trend
production in these different farming clusters. The prices are adopted from the production
cycle of 2016-17 for ease of reference. Detailed crop budgets of tomato production are
presented below;
Table 16: Tomato Budgets in Autumn, Vertical and Surface Tomato (Charsadda – 1 acre)
Analysis revealed that winter crop performs the best among all cropping patterns of tomato in
district Charsadda, it offers high gross margin (67%) and minimize the risk associated with
least production capital required for tomato production. The vertical gardening though involves
handsome investment rate, intensive labor engagement and higher opportunity cost, offered
risky gross margin (24%) for tomato growers in 2017. Though the price range used for margin
calculation has been accounted on an upper bound of average price; high rate of fluctuation
and lower bound of average seasonal price contract losses for tomato farmers as was reported
during last 3 years. Likewise, the performance of surface tomato is not outstanding during last
Quantity/# Price Total (PKR) Quantity/# Price (avg) Total (PKR) Quantity/# Price Total (PKR)
Total Sale Revenue Kg 10,000 68 680,000 40,000 25 1,000,000 11,000 18 198,000
Less cost of production - - - - - -
Land Preparation Tractor Hour 8 900 7,200 6 900 5,400 4 900 3,600
Field preparation (ridge making)Mandays 8 500 4,000 8 500 4,000 6 500 3,000
Nursery Development Mandays 2 500 1,000 2 500 1,000 2 500 1,000
Seed Gram 76 180 13,680 2 12,000 24,000 70 180 12,600
Transplanting Mandays 12 500 6,000 12 300 3,600 6 500 3,000
Irrigation Cycle 20 408 8,157 24 350 8,400 12 300 3,600
DAP Bag 2 3,200 6,400 4 3,200 12,800 2 3,200 6,400
Urea Bag 2 1,400 2,800 2 1,400 2,800 2 1,400 2,800
Nitro Phas (NP)/NPK Bag 2 2,600 5,200 6 3,300 19,800 2 2,600 5,200
SOP Bag - - 2 5,000 10,000 - -
Micronutrients Lumpsum 1 12,000 12,000 2 3,000 6,000 1 4,000 4,000
Pesticides Lumpsum 1 16,000 16,000 1 100,000 100,000 1 12,000 12,000
FYM Trolley 1 14,000 14,000 1 14,000 14,000 1 14,000 14,000
Net/Wire/Wooden Slabs Lumpsum - - 1 52,000 52,000 - -
Management practices Mandays 20 500 10,000 34 500 17,000 20 500 10,000
Land Lease 1 acre 1 20,000 20,000 1 60,000 60,000 1 25,000 25,000
126,437 340,800 106,200
Harvesting Mandays 50 500 25,000 360 500 180,000 50 500 25,000
Packing material
Winter =Tin Canister -
10 kg -reusable
Summer Avg/Year 1 1,000 1,000 40,000 3 100,000 11,000 0.5 5,500
Transportation Kg 10,000 2 20,000 40,000 1 40,000 11,000 1 11,000
Unloading kg 10,000 1 10,000 40,000 1 20,000 11,000 1 11,000
Commission % 680,000 0.065 44,200 1,000,000 0.075 75,000 198,000 0.075 14,850
100,200 415,000 67,350
Total Cost 226,637 755,800 173,550
Gross Margin (1 Acre) 453,363 244,200 24,450
Gross Margin (%) 67% 24% 12%
Parameters Unit
Autumn Tomato - Abazai
Sub Total - Production Cost
Sub Total - Post Production Cost
Ground Tomato - ShabqadarVertical Tomato - Harichand

CHAPTER 5 – TOMATO
49 | V a l u e C h a i n A n a l y s i s i n D i s t r i c t C h a r s a d d a
3-4 years, the least gross margin of 12% during last cropping season resulted in further
reduction of tomato cropping area in 2018.
Similarly, Breakeven Points (price and quantity) are calculated for all three cropping patterns
to inform decision making about tomato cultivation in Charsadda. Average seasonal price and
current production capacities have been used for drawing conclusions about breakeven
points.
Analysis in table below depicts that breakeven prices27 are PKR 23, 19 and 16, and breakeven
quantities28 are 3,333, 30,232, and 9,642 kg respectively for autumn, vertical gardening, and
field tomato.
Table 17: Breakeven Point Calculation for Different Tomato Cultures in Charsadda (1 acre)
The Return on Investment (ROI) is much higher for autumn crop (200%) than vertical (32%)
and ground tomatoes (14%). Vertical management practices were believed to be having high
profitability margins, as was the case four years ago with significant turnover. However,
dwindling tomato prices, soaring cost of production and significant influx of tomato imports
impact the profitability of tomato negatively in recent years. Farming communities still opting
for the expansive vertical farming with a ray of hope to improve prices of tomato in the peak
production season of June-July period.
The need of improving tomato crop efficiency is critical, crop expense could be made more
efficient with the optimum use of agro-chemicals and good management practices, while the
production capacity of tomato crop in all three cropping patterns could be enhanced by
promoting recommended practices of seed companies.
Distribution of Value Addition and Gross Margins:
The value margins of value chain players were calculated in tomato to identify the stronger
and weaker players in the respective value chain cycle. The margins were calculated for
vertical tomato and autumn crop separately to highlight if the value chain players are
performing differently in their respective chains.
The results pinpoint that tomato farmers in both production patterns are the earning the
maximum gross margins as well as add value to tomato production cycle followed by retail
27 Ibid Pg. 27 28 Ibid Pg. 27
Parameters Autumn Tomato
Vertical Tomato
Ground Tomato
Breakeven Price (PKR) 22.66 18.90 15.8
Breakeven Quantity (Kg) 3,333 30,232 9,642
Gross Margin (%) 68% 24% 12%
Return on Investment (ROI) - % 200% 32% 14%

CHAPTER 5 – TOMATO
50 | V a l u e C h a i n A n a l y s i s i n D i s t r i c t C h a r s a d d a
function. However, gross margins and value added of vertical tomato production is being fairly
distributed among value chain players while farmers in autumn crop appeared to be in a
stronger position than other players. The reason might be the limited production and its high
value in the market. Detailed margins and value addition are illustrated in the table 14;
Table 18: Gross Margins and Value Added by Value Chain Players (per kg tomato turnover)
Value Margins - Vertical Tomato
VC Actor Sale Price (PKR)
Input cost (PKR)
Other Cost (PKR)
Total Cost (PKR)
Gross Margin (PKR)
Value added (PKR)
Gross Margin %
Value Added (%)
Farmer 25.00
8.55
10.38
18.92
6.08
16.46
24.32
27.43
Wholesaler 35.00
25.00
2.00
27.00
8.00
10.00
22.86
16.67
Inter-market Trader
45.00
35.00
5.00
40.00
5.00
10.00
11.11
16.67
Retailer 60.00
45.00
8.00
53.00
7.00
15.00
11.67
25.00
Value Margins - Autumn Tomato
Farmer 68.00
11.64
10.02
21.66
46.34
56.36
68.14
51.23
Wholesaler 80.00
68.00
3.00
71.00
9.00
12.00
11.25
10.91
Inter-market Trader
90.00
80.00
5.00
85.00
5.00
10.00
5.56
9.09
Retailer 110.00
90.00
7.00
97.00
13.00
20.00
11.82
18.18
Employment Generation
Tomato is a labor intensive crop and generates significant number of labor man-days during
production and post production phases. Likewise, strawberry, the exact number of family labor
and permanent jobs is not readily available from credible sources, however labor man-days
have been calculated from the production cycle of autumn and vertical gardening practices to
highlight the importance of employment generation within this high value crop and
benchmarking for improved production technologies.
It is estimated that vertical gardening generates
570,000 labor man-days during tomato production and
post production activities in district Charsadda, and
88,000 man-days during autumn tomato crop. The
highest share of labor man-days in vertical gardening
are recorded in post-harvest management where
extensive production need to be taken care off, while
autumn crop engages more labor in production
function owing to difficult terrain for production.
Increasing shortage of skilled laborers is of significant
concern in both management patterns and labor Figure 19: Farmer Using Hand Made Cultivator for Hoeing

CHAPTER 5 – TOMATO
51 | V a l u e C h a i n A n a l y s i s i n D i s t r i c t C h a r s a d d a
efficiency need improvement either through skill enhancement or with promoting
mechanization.
The picture above is taken during Punjab visit where simple but state of art thinking improve
labor efficiency with this local made hoeing tool.
Table 19: Distribution of Labor in Tomato VC Functions (1 acre)
VC Functions
Vertical Tomato Autumn Tomato
Man-days (1 acre)
Percent Share
Description Man-days (1 acre)
Percent Share
Description
Management practices
220,000 19% Nursery, transplanting, hoeing, irrigation
66,000 38% Nursery, transplanting, hoeing, irrigation
Post-harvest management
720,000 63% Picking, packing Loading
50,000 28% Picking, packing Loading
Trading 200,000 18% Trading, unloading, transportation
60,000 34% Trading, loading transportation
Total 1,140,000 100
176,000 100
The MEP support is projecting to create conducive environment for improving efficiency of
tomato production in Charsadda and ultimately have a positive impact on direct/in-direct
employment generation in tomato value chain functions. The expansion of improved
technologies like vertical gardening to areas like shabqadar will improve employment capacity
manifolds. Vertical gardening generates at least 440 man-days from one acre of tomato
production while ground tomato generate 96 job opportunities from 1 acre of production. MEP
has a greater chance of converting at least 100 acres of land in shabqadar on vertical farming
tomato to generate additional 34,400 additional jobs.
Table 20: Projected New Labor Opportunities of Conversion from Ground to Vertical Tomato Production
Description Unit Value
Labor requirement in the vertical gardening of tomato
Labor man-days
440
Labor requirement in ground tomato production
Labor man-days
96
Conversion of ground tomato to vertical farming with MEP support
Acres 100

CHAPTER 5 – TOMATO
52 | V a l u e C h a i n A n a l y s i s i n D i s t r i c t C h a r s a d d a
Project increased labor opportunities in Shabqadar
Labor man-days
34,400
(Production function = 3400)
(Post Prod./marketing function = 31,000)
Distortions and Inefficiencies
Distortions and inefficiencies have been analyzed to identify lost economic value in tomato
value chain for autumn and vertical gardening. Primary data was available for potential yield
loss, pre/post-harvest losses and labor inefficiency from representative farming practices in
district Charsadda.
The analysis identified lost value of PKR 937,000 in tomato vertical gardening and PKR
629,600 in autumn tomato production for an acre of land. The seed companies’ claim of
potential yields is realized in control environment which is difficult to attain such high standards
of production during field conditions. However, this imply opening for concerted efforts to adopt
scientific approaches in minimizing this gap between potential and actual yields. For instance,
seed companies recommended producing nursery in trays using hydroponics technology to
maintain plant vigor and germination rate but farmer tend to produce nurseries in open field
which impact seedling vigor and production capacity.
Similarly, the overall magnitude of post-harvest
losses reaches up to 35%, comprised 20-25% at
the farm level, 5% at the wholesale level, 5% at
the retail level respectively. The most important
reasons were poor harvesting methods,
improper ripening places in the heaps, poor
grading/mix grading, low-quality packaging
materials and poor transportation infrastructure.
This imply a strong need of further research on
improved post-harvest capacity, improved
packaging and encouraging varieties which has
a longer shelf life and improved resistance
towards insect pests.
The labor inefficiency comes across tomato production cycle with complete dependence on
labor intensive technologies. Mulching has tested results to improve labor efficiency and
effective weed control; however, this culture is not yet penetrated in the production cycles of
district Charsadda, which is not only stretching the limited labor pool but also not very helpful
for crop efficiency.
The inefficiencies and distortions are listed in the Table below;
Figure 20: Post-harvest Losses of Tomato

CHAPTER 5 – TOMATO
53 | V a l u e C h a i n A n a l y s i s i n D i s t r i c t C h a r s a d d a
Table 21: Distortions and Inefficiencies in Tomato Value Chain (1 acre)
Inefficiencies and Distortions
Vertical Gardening Autumn Crop Benchmark29
Percent Losses
Lost Value (PKR/Acre)
Percent Losses
Lost Value (PKR/Acre)
Yield Loss (potential)
75% 660,000 70% 476,000 Company Standard
Pre/post-harvest Losses
25% 220,000 20% 136,000 Local
Labor Inefficiency 20% 57,000 20% 17,600 Technology trade off (mulching)
Total 937,000 629,600
SWOT Analysis – Tomato
The SWOT analysis is presented here, based on the information gathered from primary and
secondary sources during field research. The SWOT provides subjective analysis of any
particular sub-sector, capitalizing on strengths and opportunities while keeping in view the
weakness and threats inherent in the system and processes.
Table 22: SWOT Analysis of Tomato Crop
Strength Weaknesses
- Diverse plantation pattern and advance technological improvements available;
- Vital food ingredient for every HH; - High profitability margins when market
price remain stable
- Highly perishable crop and least shelf life;
- Rate of investment is high and risky, - Intensive management practices; - Water intensive crop and prone to
insect pest attacks
Opportunities Threats
- Market opportunities could be capitalized with efficient MIS;
- Crop efficiency can be improved – either reducing input cost or increasing production capacity;
- Technological improvement (mulching, nursery raising in hydroponics culture);
- Capacity building on standard management practices
- Price fluctuation discourage production pattern;
- Malpractices in input provision; - Lack of association impact level of
trust between VC players
29 Data adopted from Field Survey

CHAPTER 5 – TOMATO
54 | V a l u e C h a i n A n a l y s i s i n D i s t r i c t C h a r s a d d a
Road Map – Value Chain Development of Tomato
➢ Land leveling, water retention structures, rain water harvesting structures are required
in autumn crop area for bringing new area under cultivation; scarcity of water in the
autumn production cluster demands further research on water use efficiency/drip
irrigation for this high value crop;
➢ Developing and maintaining a pool of master trainers (either in Agriculture Extension,
registered growers of farm service center or private sector) to improve service delivery
of extension and outreach activities; capacity building sessions, exchange visits and
promoting networks with formal/informal institutions will definitely add value to the
service delivery mechanism;
➢ Development and distribution of crop manual and topical extension material on good
agricultural practices and recommended technologies of tomato crop will create a
positive impact on the learning capacities of farming communities;
➢ Strengthening the capacity of Agriculture Research Station in Charsadda for regular
fertility mapping of production belt in the district, and highlight optimum dosages of
fertilizers and micro-nutrients for enhancing profitability and farm efficiency; the
practice will positively impact the choice of high value crops and new technological
innovations. For instance, salad production is a new concept in district Charsadda,
only few progressive farmers have taken a start in the district however the scale and
coverage could be encouraged further but with improved decision making.
➢ Promote the use soil less medium and tray culture (Peat moss/hydroponics) for tomato
nursery raising to ensure compliance with the recommended practices of hybrid seed
companies;
➢ Organizing Farmer Field Schools (FFS) and Farmer Business Schools (FBS) to
promote Good Agriculture Practices and efficient post-harvest management has tested
success rate for development interventions and capacity transfer on recommended
techniques; this could be successfully replicated in district Charsadda;
➢ Capacity building and awareness on the use of sub-standard hybrid seeds (trials on
economics of sub-standard “Glassy” hybrid seeds of tomato); Value chain based
interest groups can help advocate policy reforms and stringent measures on quality of
imported inputs and safe use of agro-chemicals among the farming communities.
➢ Market information System on selected marketing venues for updating information on
market situation and prices, and promoting the culture of collective marketing for
realizing economies of scale;
➢ Strong advocacy campaigns with ministry of Agriculture and Irrigation for the timely
opening of canal system that farming activities in this critical time period is not affected.
➢ Labor inefficiencies could be improved with the use of simple technologies like mulching and introducing pool of small machineries.
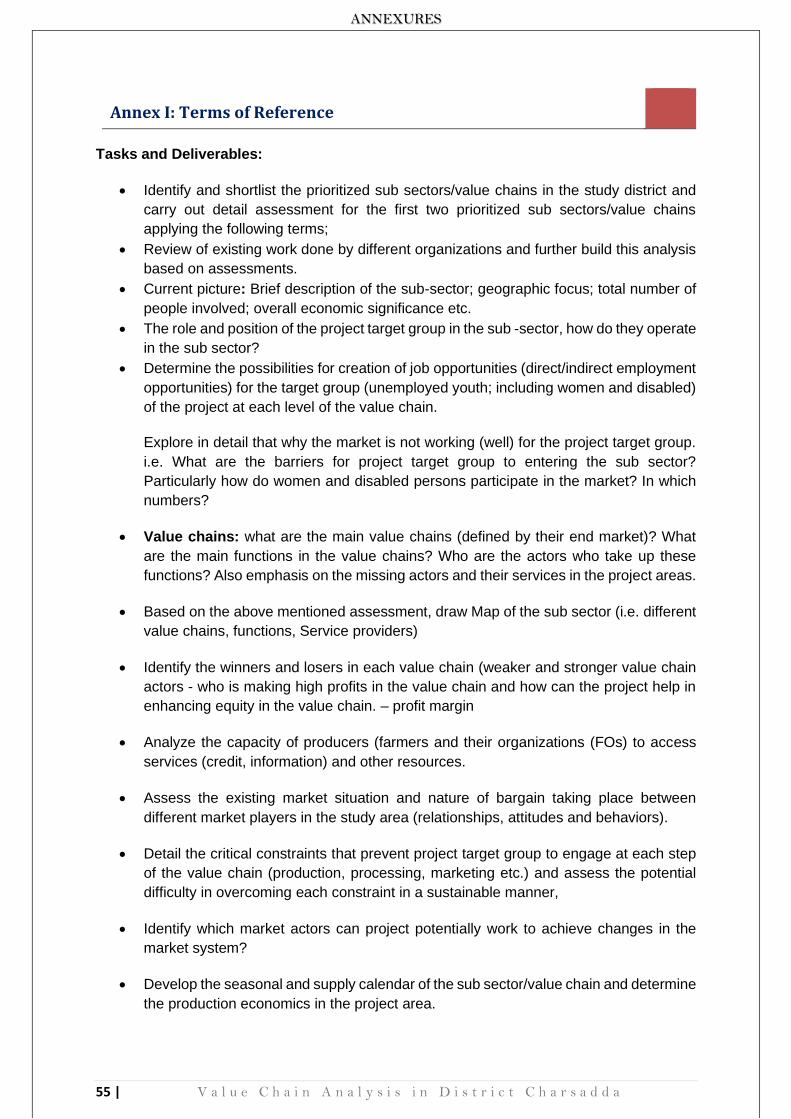
ANNEXURES
55 | V a l u e C h a i n A n a l y s i s i n D i s t r i c t C h a r s a d d a
Annex I: Terms of Reference
Tasks and Deliverables:
• Identify and shortlist the prioritized sub sectors/value chains in the study district and
carry out detail assessment for the first two prioritized sub sectors/value chains
applying the following terms;
• Review of existing work done by different organizations and further build this analysis
based on assessments.
• Current picture: Brief description of the sub-sector; geographic focus; total number of
people involved; overall economic significance etc.
• The role and position of the project target group in the sub -sector, how do they operate
in the sub sector?
• Determine the possibilities for creation of job opportunities (direct/indirect employment
opportunities) for the target group (unemployed youth; including women and disabled)
of the project at each level of the value chain.
Explore in detail that why the market is not working (well) for the project target group.
i.e. What are the barriers for project target group to entering the sub sector?
Particularly how do women and disabled persons participate in the market? In which
numbers?
• Value chains: what are the main value chains (defined by their end market)? What
are the main functions in the value chains? Who are the actors who take up these
functions? Also emphasis on the missing actors and their services in the project areas.
• Based on the above mentioned assessment, draw Map of the sub sector (i.e. different
value chains, functions, Service providers)
• Identify the winners and losers in each value chain (weaker and stronger value chain
actors - who is making high profits in the value chain and how can the project help in
enhancing equity in the value chain. – profit margin
• Analyze the capacity of producers (farmers and their organizations (FOs) to access
services (credit, information) and other resources.
• Assess the existing market situation and nature of bargain taking place between
different market players in the study area (relationships, attitudes and behaviors).
• Detail the critical constraints that prevent project target group to engage at each step
of the value chain (production, processing, marketing etc.) and assess the potential
difficulty in overcoming each constraint in a sustainable manner,
• Identify which market actors can project potentially work to achieve changes in the
market system?
• Develop the seasonal and supply calendar of the sub sector/value chain and determine
the production economics in the project area.

ANNEXURES
56 | V a l u e C h a i n A n a l y s i s i n D i s t r i c t C h a r s a d d a
• Support Services: which support services are available to value chain actors? How
well these support services perform? Do the project target groups benefit from the
services? Which ones and how?
• Assess the resources, skills and capacities of the weaker player of the value chain
(smallholder farmers, small scale producers/artisans etc.) related to technology
adaptation, procurement of inputs and production of the product (tomato, strawberry
etc.)
• Rules and regulations: Which rules impact the sub sector? Government legislation?
Informal rules? Private sector standards etc.?
• What are the governance issues of the sub sector that may require private / public
sector dialogue?
• Assess the state of institutions capacity, technology, service providers, policies, and
other production conditions that influence the performance of the value chain players
either positively or negatively,
• Develop detailed recommendations, specific value chain interventions, on how to
“upgrade” the selected value chains and maximize its impact for the project target
group, keeping in view the sustainability and outreach of the proposed interventions.
Swat/Dir (Runner providers and Swat Research Station);
• Analyzing backward and forward linkages of runner producers with research
institutions and strawberry farmers;
• Varietal developments of strawberry crop and scope of improvement in production
technologies;
• Assessment of critical constraints prevailing in the production of runners and its
impact on the production of strawberry in Charsadda
• Assess the malpractices practiced by the runner’s suppliers as reported by the
farmers in Charsadda and its impact on the overall business (both runner producers
and strawberry producers)
• Assess the possibility of linkages development with processing industry in Swat for
both strawberry and tomato.
• Analyze the outreach of Research Station Swat to other areas of KP
Comparative Analysis of the Model Farming (practiced in Lahore/Sheikhupura) with
Charsadda Farmers practices:
• Detailed analysis of production technology of strawberry crop in Lahore and
Sheikhupura;
• Stipulating farm budget and profitability margins of strawberry model farms and
conduct comparative analysis with strawberry farming in Charsadda;
• Tracking model farms of strawberry crop in these regions of Lahore and
Sheikhupura, and analyzing production/marketing cycle of such farms;
• Lesson learnt from new technologies practiced in strawberry production and seeking
ways of collaboration between progressive farmers in these two distinct regions;

ANNEXURES
57 | V a l u e C h a i n A n a l y s i s i n D i s t r i c t C h a r s a d d a
Project Locations: - Assessment will take place in the targeted locations; District Charsadda
Report:
The Consultant will produce a report (no more than 50 pages) in hard and soft form along with
relevant photographs, annexes, in Microsoft Word using Arial font 11. The report should
include:
− Basic Information (sector, share of concerned value chain in overall economy,
importance etc.)
− Executive Summary
− Introduction/Background of the concerned value chain
− Study methodology
− Findings in accordance with the tasks and deliverables as mentioned above
− Recommendations
− Annexes – Methodology tools, Study schedule, List of persons/ stakeholders
interviewed and sites visited, Documents consulted etc.
Consultant will submit technical and financial proposal for the value chain study along with the work plan.

ANNEXURES
58 | V a l u e C h a i n A n a l y s i s i n D i s t r i c t C h a r s a d d a
Annex II: Checklist for FGDs/Key Informant Interviews
1. Major pockets/areas of production in Charsadda (for clustering):
2. Map of Charsadda district (for showing production areas) and its connectivity with
major markets;
3. Key local markets (Charsadda + Peshawar + Islamabad + Mardan);
4. Total area and production of Strawberries in Pakistan (by province);
5. Demographics of the district;
• Population and its growth trend;
• number of administrative divisions (tehsils/towns/villages);
• Number of people living below poverty line as per the official figures;
• Average life expectancy;
• Average income per household;
• Major occupations (subsectors in the project area);
• Average income of the households involved in different sectors of businesses
etc.;
6. History and comparative advantage of the area? What are the agro-
ecological/demographic advantages?
7. Average farm size;
8. Number of producers (farmers, micro entrepreneurs, households, SMEs) involved;
9. Total number of people involved including women and poor and out of this how many
are self-employed, how many work for others;
10. Average size of investment per enterprise/household;
11. Average income from the business per household/business;
12. Size of businesses and their numbers throughout the value chain (i.e. input suppliers,
producers, processors, traders and sales outlets);
13. Process flow chart of the business (showing production flow how product moves
through the input, production, processing to consumption level);
14. Cropping cycle
15. Detailed economics of production and marketing in the flow diagram from farm to
market;
16. Description of the major markets. Who buys from farmers/producers, where are they
sold;

ANNEXURES
59 | V a l u e C h a i n A n a l y s i s i n D i s t r i c t C h a r s a d d a
17. Description of the competitors for the business (specific to that location);
18. Current policies/incentives from the government to promote this value chain;
19. Presence of stakeholders and their roles: common interest groups such as business
association, cooperative, self-help group etc. and their role in chain governance;
20. List of government ministry and departments responsible to support/facilitate the VC
and their roles/functions and status of services;
21. Sources of finance/credit, mark up and constraints;
22. Existing service providers in the project location and what kind of services are they
providing (both private as well as public sector);
23. Potential impacts (outreach, employment generation and income earning);
24. Listing of key constraints and opportunities in the form of SWOT;
25. Paired ranking of the constraints for prioritization;
26. Quantification of losses/wastes and distortions – absolute or percent (poor pre and
post-harvest management, transit losses, absence of cold storages, absence of
processing facilities, high costs – fuel, lack of improvements etc.);
Check List for Market Assessments
1. Total number of agents dealing in horticulture commodities;
2. Status of the market (private, public/ regulated, non-regulated);
3. No. and types of market agents dealing in Strawberry;
4. Approximate quantity (per annum) dealt;
5. Trends in supply;
6. Important local markets that are supplied by this market (inter-market trade);
7. Important local markets that send supplies to this market;
8. Preferred varieties in domestic and export trades and for processing;
9. Existing pack sizes and packaging types;
10. Pricing mechanisms;
11. Market charges and costs (market entry, commission etc.);
12. Market channels and pricing structure;
13. Infrastructure and facilities (cold storage, holding sheds, auction sheds, parking,
weighing bridges, water supply, sanitation, electricity etc.);
14. Institutional services; and,
15. Marketing constraints and opportunities for domestic and export trades.

ANNEXURES
60 | V a l u e C h a i n A n a l y s i s i n D i s t r i c t C h a r s a d d a
Annex III: Overview of Strawberry Production in Punjab
- Sheikhupura, Multan, Lahore, Qusoor, Narowal are prominent production belt in
Punjab;
- Season varies slightly in Punjab, slight earlier than KP and later than Sindh (Sukkur,
Khairpur, Matiari) crop;
- Sharaqpur in Sheikhupura is the main production belt; 20-25 km distant from Lahore
- Wheat, potato and peas area is converted to Strawberry production;
- Corporate farming is increasing rapidly in Punjab with new market opportunities like
METRO and HYPER STAR; though large business group own such initiatives with
large scale investments on technology intensive farming of high value crops, it open
venues for technology innovation and improved practices
- Market options are wide for strawberry crop in Punjab; main fruit and vegetable market
(Badami Bagh), Kana Mandi, Multan Chungi, Singpur Mandi; it provides leverage to
strawberry farmers with open options and flexibility of marketing
- Improved technologies like mulching (more than 95% of cropped area), drip irrigation,
plasticulture, and vertical/pot farming (4-5 farms) is being practiced as improved
technologies in strawberry cultivation.
- Drip irrigation
o help to reduce mortality in late September transplanting i.e. mortality is 10-12%
in drip irrigation as compared to 30-35% in flood irrigation conditions;
o reduces the cost of fertilizer 2-3 times and help maintain water use efficiency
o weed control is much efficient in drip irrigation
o cost 100,000 per acre of land;
o Punjab On-farm Water Management Department is supporting installation of
drip technology to maximize water use efficiency since 2012 (60:40 share), the
technology is replicated rapidly among strawberry farmers owing to its positive
impact on growth as well as reducing cost of production30
- Mulching
o Weed control, cost of labor is reduced
o Improve quality of produce at harvest stage, fetch higher price at marketing
stage
o Black mulch cost 17000 per acre (8000 for plastic, 9000 for installation labor)
o Bakshi et al (2014)31 informed that the use of black polythene mulch improve
the overall quality and performance of strawberry crop by reducing weed
population, increasing plant height, plant spread, number of leaves per plant,
number of flowers per plant, number of fruits per plant, number of achenes/fruit
and fruit weight, hence highly recommended practice in strawberry crop.
- Tunnel farming
o Though tunnel farming is not a usual practice in strawberry cultivation, but few
progressive farmers installed high tunnels to fetch early maturity/production as
well as prevent from frost and rain damages
30 http://ofwm.agripunjab.gov.pk/system/files/Strawberry.pdf 31 “Growth, yield and quality of strawberry (Fragaria x ananassa Duch.) cv. Chandler as influenced by various mulching materials”, Parshant Bakshi*, Deep Ji Bhat, V. K. Wali, Akash Sharma and Mudasir Iqbal 2014; African Journal of Agricultural Research, Vol. 9(7), pp. 701-706, 13 February, 2014

ANNEXURES
61 | V a l u e C h a i n A n a l y s i s i n D i s t r i c t C h a r s a d d a
o Cost: 270 kg of plastic required for 1 acre of land; 250 T-iron beams are
required costing 300 per beam
o It is not a permanent structure and can be easily part away on a day notice
- Green House Technology (Controlled Shed)
o Labor efficient technology, with controlled environment (optimum temperature,
humidity, balanced application of nutrients, pest control); hydroponics with
imported peat stuff, cooling pads, drip fertigation, fogger/fans;
o Cherry tomato, paprika (red/yellow), strawberry crop
o Strawberry cultivation in 4 steps vertical farming
o Extended production cycles of paprika (10 months), cherry tomato (8 months),
strawberry (5 months)
o Strawberry cycle: August (nursery purchase), September 15 (nursery transfer),
November 15 (Fruiting starts), May 20 (Production)
▪ No major disease/pest outbreak
▪ Production capacity was higher per plant (half kg per plant, which is
almost double than conventional farming)
▪ Good quality crop (only 20% small fruits), 500 kg good quality packs
(half kg pack) supplied to METRO Cash & Carry and presented on
shelves without any further processing
▪ 150,000 plants of strawberry on 6 kanal of land (0.75 acre)
- Crop expense is touching Rs. 300,000 per acre of land; largely due to extensive
expenditure on fertilizer and micro-nutrients (8-10 different type of micro-nutrients have
been sprayed on strawberry crop without knowing the efficacy and actual requirement
- Extension services are weak in Punjab also, farmers depend mostly on the advice of
input providers and word-of-mouth communication from interacting farmers; “GALOR”
is one such example of plant regulator, sprayed on strawberry for early
flowering/fruiting but restricting production capacity of strawberry plant;
- The firm has moved a step further and ordered seedlings from abroad (costing Rs 35
per plant), the variety will be planted in the month of March and will continue producing
strawberries until October/November to reap maximum benefit from off-season
cultivar;
- Social media has an impact on strawberry farming, a Facebook group was registered for interaction but idle these days; however, an active WhatsApp group was initiated in early 2016 and caught the attention of 125 members to date, provide useful information sharing platform where strawberry farmers interacted frequently on daily basis for sharing experiences, issues faced and seek advice on possible remedial measures

ANNEXURES
62 | V a l u e C h a i n A n a l y s i s i n D i s t r i c t C h a r s a d d a
Annex IV: Key Contact List
S.No Name Designation Contact Number Location
1 Liaquat Ali District Director Agriculture
091-9220117-118 Charsadda
2 Muhammad Idress Subject Matter Specialist
0346 9029622 Charsadda
3 Rafiq Jan Field Assistant 0303 8420235 Sarkee
4 Arshad Ali Field Assistant 0345 8801706 Tangi
5 Jahanzeb Khan Key Informant - Strawberry
0300 5801940 Sarkee
6 Israr Khan Key Informant - Strawberry
0300 5776696 Sarkee
7 Hakim Khan Key Informant - ASF Islamabad
8 Ghulam Farooq Regional Manager WELCON/WheaAg
0344 4472038 Peshawar
9 Mohammad Bilal Input Supplier 0343 3048203 Sarkee
10 Zia Ur Rehman Key Informant – Salad Production
0301 5951728 Sarkee
11 Khaista Gulab Key Informant – Tomato
0315 5940356 Abazai
12 Haji Akbar Key Informant – Tomato
0345 9120516 Harichand
13 Azam Khan Key Informant – Tomato
0344 5356564 Harichand
14 Mukarram Sher Key Informant – Tomato
0301 8805585 Kirra (Bar Behram Dheri)

ANNEXURES
63 | V a l u e C h a i n A n a l y s i s i n D i s t r i c t C h a r s a d d a
15 Miraj Shah Key Informant – Strawberry Dealer
0301 2152442 Sarkee
16 Wajid Ali Key Informant – Strawberry Dealer
0305 9447052 Sarkee
17 Akbar Ali President Tangi Market
0300 5954390 Tangi
18 Shah Khalid Commision Agent 0321 9320838 Tangi
19 Nasr Ali Khan Commision Agent 0345 8195347 Tangi
20 Daud Jan Input Dealer 0345 9393178 Tangi
21 Sami Ur Rehman Input Dealer 0301 8886903 Amir Abad
22 Aminullah Input Dealer 0300-9339132 Charsadda
23 Shams ur Rehman Key Informant – Tomato
0342 8901525 Sro Korona - Abazai
24 Alamgir Key Informant – Tomato
0345 8391551 Abazai
25 Dr Arsalan Food Technologist 0314 9602556 Tarnab Farm
26 Dr Ijaz Akhtar Agriculture Research Directorate
0300 5844945 Peshawar
27 Kazim Bacha Key Informant – runner Producer
0302 5790420 Mingora
28 Abdul Sattar Key Informant – runner Producer
0300 5740269 Mingora
29 Ajmal Khan Key Informant – runner Producer
0301 8523270 Mingora
30 Liaquat Khan Key Informant – runner Trader
0346 9459073
0303 8502167
Fatehpur
31 Saeed Ur Rehman Input Provider 0348 8978508 Fatehpur
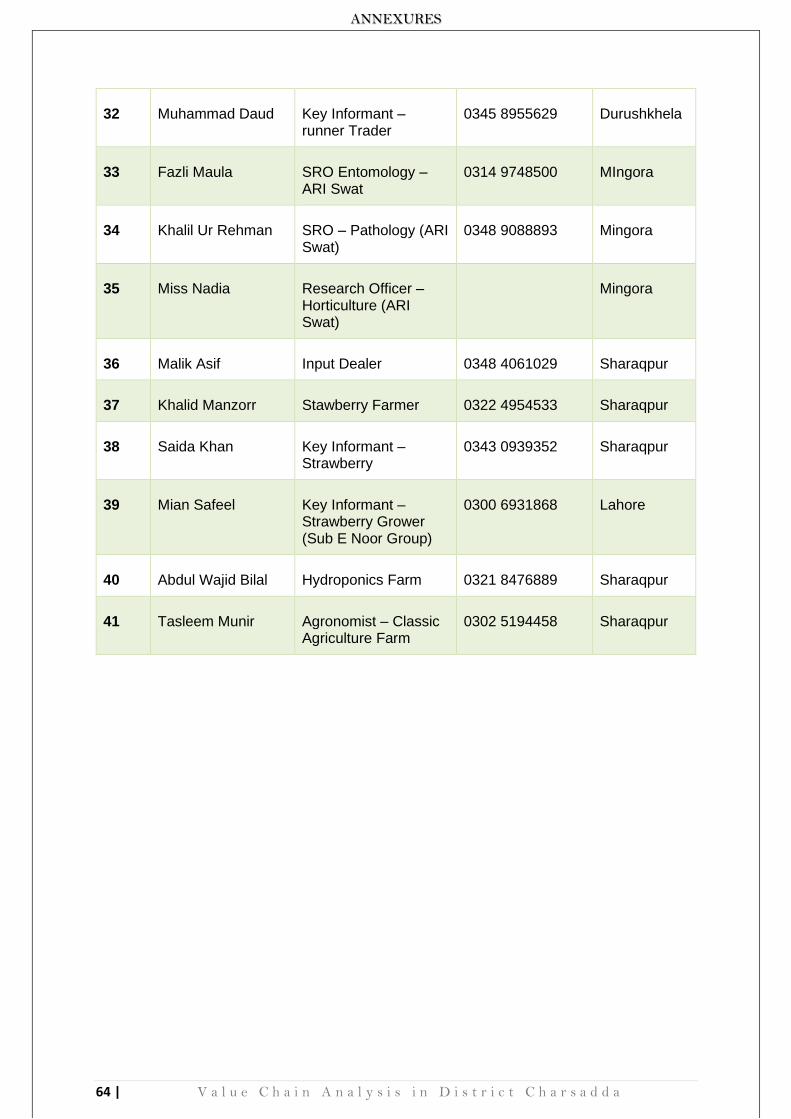
ANNEXURES
64 | V a l u e C h a i n A n a l y s i s i n D i s t r i c t C h a r s a d d a
32 Muhammad Daud Key Informant – runner Trader
0345 8955629 Durushkhela
33 Fazli Maula SRO Entomology – ARI Swat
0314 9748500 MIngora
34 Khalil Ur Rehman SRO – Pathology (ARI Swat)
0348 9088893 Mingora
35 Miss Nadia Research Officer – Horticulture (ARI Swat)
Mingora
36 Malik Asif Input Dealer 0348 4061029 Sharaqpur
37 Khalid Manzorr Stawberry Farmer 0322 4954533 Sharaqpur
38 Saida Khan Key Informant – Strawberry
0343 0939352 Sharaqpur
39 Mian Safeel Key Informant – Strawberry Grower (Sub E Noor Group)
0300 6931868 Lahore
40 Abdul Wajid Bilal Hydroponics Farm 0321 8476889 Sharaqpur
41 Tasleem Munir Agronomist – Classic Agriculture Farm
0302 5194458 Sharaqpur