Embed Size (px)
Citation preview

© 2016 First Data Corporation. All Rights Reserved.
2018 Third QuarterFinancial ResultsOctober 29, 2018
V18

© 2018 First Data Corporation. All Rights Reserved.
▪ Statements in this presentation regarding First Data Corporation’s business which are not historical facts are“forward-looking statements.” All forward-looking statements are inherently uncertain as they are based onvarious expectations and assumptions concerning future events and they are subject to numerous knownand unknown risks and uncertainties which could cause actual events or results to differ materially fromthose projected. Please refer to the Company’s meaningful cautionary statements contained in the appendixof this presentation for more information regarding risks and uncertainties.
▪ Reconciliation to Non-GAAP measures and description of usefulness are provided in the Appendix of thispresentation or as part of our Financial Results Press Release accompanying this presentation which can befound at investor.firstdata.com.
▪ Consolidated results, segment revenue and segment EBITDA reflect New Reporting Standards, includingthe modified retrospective application of ASC 606 (the New Revenue Standards). See Form 8-K filed onApril 16, 2018, for full description of the New Reporting Standards and their impact on 2017 results.
▪ Organic constant currency growth (“Organic CC growth”) is defined as reported growth adjusted for thefollowing: (1) excludes the impacts of year-over-year currency rate changes in the current period; (2)excludes the results of significant divestitures in the prior year period; (3) includes the results of significantacquisitions in the prior year period; and (4) is adjusted to retrospectively apply the New ReportingStandards to the prior year period.
▪ All growth percentages and margin comparisons are year-over-year unless otherwise stated; percentagesand subtotals are subject to rounding.
2
Safe Harbor
2018 THIRD QUARTER FINANCIAL RESULTS

© 2018 First Data Corporation. All Rights Reserved.
See Appendix for reconciliations to the comparable GAAP measures. (1) Non-GAAP growth rate – Adjusted to retrospectively apply ASC 606 to the prior year period, providing aconsistent basis of accounting to both periods. (2) GAAP growth rate – Reflects the modified retrospective application of ASC 606 (the New Revenue Standards).
Q3.18 HighlightsSolid Financial Performance
▪ Q3.18 segment revenue +3%(1) or +5% on an organicconstant currency basis (+4%(2) on a reported GAAP basis)
▪ Q3.18 segment EBITDA +5%(1) or +7% on an organicconstant currency basis (+4%(2) on a reported GAAP basis)
▪ Q3.18 Adjusted diluted EPS of $0.35, includes $0.02unfavorable foreign exchange
▪ Q3.18 free cash flow of $444 million
▪ Organic constant currency revenue and EBITDA growth guidance unchanged
▪ EPS guidance revised primarily for the impact of recent adverse FX movement and, to a lesser extent, divestitures
Executing on Key Initiatives▪ Clover expanding and investing in value-added services and software▪ Gaining market share in ISV▪ JV's making progress on digital enrollment ▪ International and enterprise momentum continues
Other Important Developments▪ Divestiture proceeds of approximately $550 million from the sale of two non-core businesses in Q3.2018▪ Net debt declined $855 million in Q3.18; $1,438 million YTD▪ Recently completed refinancing will drive approximately $90 million interest cost savings in 2019
3
▪ YTD.18 segment revenue +8%(1) or +6% on an organicconstant currency basis (+9%(2) on reported GAAP basis)
▪ YTD.18 segment EBITDA +9%(1) or +8% on an organicconstant currency basis (+9%(2) on reported GAAP basis)
▪ YTD.18 Adjusted diluted EPS of $1.04
▪ YTD.18 free cash flow of $1,190 million
2018 THIRD QUARTER FINANCIAL RESULTS

© 2018 First Data Corporation. All Rights Reserved.
Total Segment EBITDA New Reporting Standards ($M)(1)
Total Segment RevenueNew Reporting Standards ($M)(1)
Q3.17 Q4.17 Q1.18 Q2.18 Q3.18
37.3%
39.3%
35.1%
38.7%
37.8%
$780$844
$730
$864$815
Q3.17 Q4.17 Q1.18 Q2.18 Q3.18
$2,093 $2,147 $2,080$2,234 $2,158
Q3.18 Summary Financial Results▪ Total segment revenue of $2,158 million, +3%(1) or +5% on an
organic constant currency basis
▪ Adjusted diluted EPS of $0.35▪ Adjusted net income of $340 million▪ Unfavorable foreign currency impact of $0.02 on adjusted
diluted EPS
▪ Total segment EBITDA of $815 million, +5%(1), or +7% on anorganic constant currency basis
▪ Total segment EBITDA margin(2) of 37.8%, +50 bps(1) or+60bps on an organic constant currency basis
▪ Free cash flow of $444 million
▪ Net Debt declined by $855 million Segment EBITDA Margin(2)
4 2018 THIRD QUARTER FINANCIAL RESULTS
See slide 17 for reconciliation of consolidated revenue to total segment revenue, slide 18 for reconciliation of net income to total segment EBITDA, slide 19 for reconciliation of net incometo adjusted net income and slide 20 for quarterly reconciliations of cash flow from operations to free cash flow. (1) Segment Revenue, Segment EBITDA, and Segment EBITDA marginreflect the New Reporting Standards as if applied to both periods (2) Total segment EBITDA margin defined as total segment EBITDA divided by total segment revenue.

© 2018 First Data Corporation. All Rights Reserved.
Q3.18 Financial Overview
Figures shown with New Reporting Standards applied in both periods (1)Reported
GAAP ASC 605 in 2017 and
ASC 606 in 2018Constant Currency (CC)
Reported Reported Organic
Q3.18 Q3.17 % B/(W)(2) % B/(W)(2) % B/(W)(2) % B/(W)(2)
Total Segment Revenue $2,158 $2,093 3% 5% 5% 4%GBS 1,384 1,301 7% 13% 6%GFS 407 410 (1%) (1%) 6%NSS 367 382 (4%) (2%)
Total Segment EBITDA $815 $780 5% 8% 7% 4%GBS 503 463 8% 16% 10%GFS 161 175 (8%) 6% (2%)NSS 195 184 6% 6%Corporate (44) (42) (5%)
Total Segment EBITDA Margin 37.8% 37.3% 50 bps 60 bpsGBS 36.3% 35.6% 80 bps 110 bpsGFS 39.6% 42.7% (310) bps (370) bpsNSS 53.1% 48.2% 500 bps 410 bps
Adjusted Net Income $340 $376 (9%)Adjusted Diluted EPS $0.35 $0.40 (13%)
5 2018 THIRD QUARTER FINANCIAL RESULTS
See slide 17 for reconciliation of consolidated revenue to total segment revenue and slide 18 for reconciliation of net income to total segment EBITDA (1) Segment Revenue, Segment EBITDA, and Segment EBITDA margin reflect the New Reporting Standards as if applied to both periods(2) “B” means results in 2018 periods are better than results in 2017 periods “(W)” means results are worse.

© 2018 First Data Corporation. All Rights Reserved.
YTD.18 Financial Overview
6 2018 THIRD QUARTER FINANCIAL RESULTS
Figures shown with New Reporting Standards applied in both periods (1)Reported
GAAP ASC 605 in 2017 and
ASC 606 in 2018Constant Currency (CC)
Reported Reported Organic
2018 2017 % B/(W)(2) % B/(W)(2) % B/(W)(2) % B/(W)(2)
Total Segment Revenue $6,472 $6,021 8 % 8% 6 % 9%GBS 4,151 3,720 12 % 7 %GFS 1,221 1,205 1 % 3 %NSS 1,100 1,096 — % 2 %
Total Segment EBITDA $2,409 $2,207 9 % 10% 8 % 9%GBS 1,481 1,317 12 % 10 %GFS 503 498 1 % 4 %NSS 563 520 8 % 8 %Corporate (138) (128) (8%)
Total Segment EBITDA Margin 37.2% 36.7% 60 bps 90 bpsGBS 35.7% 35.4% 30 bps 90 bpsGFS 41.2% 41.3% (10) bps (10) bpsNSS 51.2% 47.4% 370 bps 280 bps
Adjusted Net Income $990 $1,008 (2%)Adjusted Diluted EPS $1.04 $1.07 (4%)
See slide 17 for reconciliation of consolidated revenue to total segment revenue and slide 18 for reconciliation of net income to total segment EBITDA (1) Segment Revenue, Segment EBITDA, and Segment EBITDA margin reflect the New Reporting Standards as if applied to both periods(2) “B” means results in 2018 periods are better than results in 2017 periods “(W)” means results are worse.

© 2018 First Data Corporation. All Rights Reserved.
Segment EBITDA New Reporting Standards ($M)(1)
Q3.17 Q4.17 Q1.18 Q2.18 Q3.18
35.6%
36.7%
32.9%
37.5%
36.3%
$463$493
$434
$544$503
Segment RevenueNew Reporting Standards ($M)(1)
Q3.17 Q4.17 Q1.18 Q2.18 Q3.18
$1,301 $1,344 $1,318$1,449 $1,384
Q3.18 Global Business Solutions Segment revenue of $1,384 million, +7%(1) or +6% on anorganic constant currency basis
Key Messages:
Strong growth driven by continued strength across all regions
North America revenue +7%, or +4% on an organic constantcurrency basis, driven by Partner Solutions and Direct; JVchannel declined modestly, expect gradual recovery
International revenue +5% or +17% on an organic constantcurrency basis; strong growth in all regions
Segment EBITDA of $503 million, +8%(1) or +10% on anorganic constant currency basis
Segment EBITDA Margin
7 2018 THIRD QUARTER FINANCIAL RESULTS
(1) Segment Revenue, Segment EBITDA, and Segment EBITDA margin reflect the New Reporting Standards as if applied to all periods.

© 2018 First Data Corporation. All Rights Reserved.
YTD.18Q3.18
GBS Revenue By Region & North America Transaction Growth
SegmentRevenue
OrganicCC Growth
YoY$M %
GBS NA $1,079 4%
GBS EMEA $180 8%
GBS LATAM $76 37%
GBS APAC $49 13%
GBS Segment $1,384 6%
▪ Healthy revenue growth in all regions including North America
▪ Transaction growth acceleration primarily driven by Partner Solutions and Direct channels
Transaction Growth – GBS NA
9%
6%
3%
0%
Q3.17 Q4.17 Q1.18 Q2.18 Q3.18
5%
6% 6%
8%
9%
8 2018 THIRD QUARTER FINANCIAL RESULTS
SegmentRevenue
OrganicCC Growth
YoY$M %
$3,227 4%
$528 6%
$249 45%
$147 16%
$4,151 7%

© 2018 First Data Corporation. All Rights Reserved.
Segment Revenue New Reporting Standards ($M)(1)
Q3.17 Q4.17 Q1.18 Q2.18 Q3.18
$410 $411 $400 $414 $407
Segment EBITDA New Reporting Standards ($M)(1)
Q3.17 Q4.17 Q1.18 Q2.18 Q3.18
42.7%
44.0%
41.5%
42.5%
39.6%
$175 $181$166
$176$161
Q3.18 Global Financial SolutionsSegment revenue of $407 million, -1%(1) or +6% on anorganic constant currency basis
Key Messages:
Notable improvement in revenue driven by ramp of new deals
North America revenue -1%, or +4% on an organic constantcurrency basis driven by strong new business, partly offset byimpact from recent renewals
International revenue flat, or +9% on an organic constantcurrency basis; strong organic growth in APAC and LATAM
Segment EBITDA decline primarily driven by increased costsassociated with ramping new deals
Segment EBITDA of $161 million, -8%(1) or -2% on anorganic constant currency basis
Segment EBITDA Margin
9 2018 THIRD QUARTER FINANCIAL RESULTS
(1) Segment Revenue, Segment EBITDA, and Segment EBITDA margin reflect the New Reporting Standards as if applied to all periods.

© 2018 First Data Corporation. All Rights Reserved.
YTD.18Q3.18
GFS Revenue By Region & Accounts on File Growth
SegmentRevenue
OrganicCC Growth
YoY$M %
GFS NA $233 4%
GFS EMEA $114 1%
GFS LATAM $33 23%
GFS APAC $27 30%
GFS Segment $407 6%
▪ Revenue growth in North America driven by enterprise wins and student loan processing ramp
▪ Healthy growth in LATAM & APAC
9%
6%
3%
0%
Q3.17 Q4.17 Q1.18 Q2.18 Q3.18
7% 7%
6%
7%
8%
Accounts on File Growth – GFSGlobal1
10 2018 THIRD QUARTER FINANCIAL RESULTS
SegmentRevenue
OrganicCC Growth
YoY$M %
$694 0%
$343 4%
$100 7%
$84 31%
$1,221 3%
(1) Accounts on File Growth excludes the impact of new education loan processing accounts.

© 2018 First Data Corporation. All Rights Reserved.
Segment EBITDA New Reporting Standards($M)(1)
Segment Revenue New Reporting Standards ($M)(1)
Q3.17 Q4.17 Q1.18 Q2.18 Q3.18
$382 $392$362 $371 $367
Q3.17 Q4.17 Q1.18 Q2.18 Q3.18
48.2%
53.3%
48.3%
52.0%53.1%
$184$209
$175$193 $195
Q3.18 Network & Security SolutionsSegment revenue of $367 million, -4%(1) or -2% on anorganic constant currency basis
Key Messages:
Revenue growth negatively impacted by the non-renewal of alow-margin plastics contract
EFT Network saw mid-single digit revenue growth; goodgrowth in STAR
Continued strong margin expansion driven by improvingrevenue mix and focused management of fixed costs
Segment EBITDA of $195 million, +6%(1) on both a reportedand organic constant currency basis
Segment EBITDA Margin
11 2018 THIRD QUARTER FINANCIAL RESULTS
(1) Segment Revenue, Segment EBITDA, and Segment EBITDA margin reflect the New Reporting Standards as if applied to all periods.

© 2018 First Data Corporation. All Rights Reserved.
Free Cash Flow
▪ Healthy Free Cash Flow of $444M – YoY increase driven by operating performance and favorable conclusion of a prior periodtax-related matter
Third Quarter Year-to-Date
Free Cash Flow ($M) 2018 2017 $ Change 2018 2017 $ Change
Total Segment EBITDA(1) $815 $780 $35 $2,409 $2,207 $202
Cash Interest Payments (237) (215) (22) (689) (668) (21)
Cash Taxes 8 (45) 53 (60) (108) 48
Capital Expenditures (162) (134) (28) (452) (390) (62)
Working Capital Change (13) (31) 18 (67) 3 (70)
Dividends Received from Unconsolidated Affiliates(2) 36 42 (6) 70 62 8
Net Impact from Consolidated Affiliates(3) (23) (33) 10 (52) (58) 6
Items Excluded from Total Segment EBITDA/Other(4) 20 6 14 31 31 0
Free Cash Flow(5) $444 $370 $74 $1,190 $1,079 $111
Memo: Cash Flow from Operations $671 $581 $90 $1,809 $1,582 $227
12 2018 THIRD QUARTER FINANCIAL RESULTS
(1) Segment EBITDA reflects the New Reporting Standards as if applied to all periods (2) Distributions received from affiliate partners less earnings from unconsolidated affiliates. (3)Distributions paid to minority partners less net income attributable to non-controlling interest. (4) Primarily non-operating addbacks such as severance, retention, litigation, deal costs, and 3rdparty debt fees. (5) See slide 20 for reconciliation of cash flow from operations to free cash flow. The Company defines free cash flow as cash flow from operations less capital expenditures,and less distributions to minority interests and other (includes cash impact from maturities of net investment hedges).

© 2018 First Data Corporation. All Rights Reserved.
Capital Structure – Debt Reduction Year-to-Date
(1) Gross debt shown at par value and excludes outstanding settlement lines of credit. See slide 21 for reconciliation of total borrowings to gross debt. (2) Net debt defined as grossdebt, as defined in footnote 1, less cash and cash equivalents. (3) Defined as trailing twelve months total segment EBITDA proforma for full year trailing net impact of majoracquisitions and divestitures in the quarter the transaction was consummated and adjusted retrospectively for the adoption of the New Reporting Standards.
$ Million (at Par)As of 9/30/18
Par ValueAs of 6/30/18
Par ValueAs of 12/31/17
Par Value
9/30/18 vs
6/30/18
9/30/18 vs
12/31/17
Revolver ($1,250M) $— $— $272 $— ($272)
A/R Securitization 124 565 600 (441) (476)
Capital Leases/Other 342 364 405 (22) (63)
Term Loans 8,608 8,943 9,132 (335) (524)
1st Lien Bonds 3,110 3,110 3,110 — —
2nd Lien Bonds 2,200 2,200 2,200 — —
Unsecured 3,400 3,400 3,400 — —
Gross Debt(1) $17,784 $18,582 $19,119 ($798) ($1,335)
Cash $601 $544 $498 $57 $103
Net Debt(2) $17,183 $18,038 $18,621 ($855) ($1,438)
Memo: TTM Segment EBITDA(3) $3,219 $3,236 $3,104 ($17) $115
Memo: Total Borrowings $17,755 $18,617 $19,198 ($862) ($1,443)
▪ Net debt decreased$855M from 6.30.2018and decreased $1.4Bfrom 12.31.2017, drivenby FCF generation andproceeds fromdivestitures
13 2018 THIRD QUARTER FINANCIAL RESULTS

© 2018 First Data Corporation. All Rights Reserved.
Capital Structure – October Updates
• Raised new $6.0B credit facility, rate of L+150 basis points, maturing 2023
• Closed October 26th 2018, with two stage draw
14 2018 THIRD QUARTER FINANCIAL RESULTS
• Proceeds were used to refinance existing revolver and term loan A at closing, andwill be used to refinance other indebtedness at a later date
• New borrowings at significantly lower costs
• Estimated interest cost savings of ~$90M in 2019
• Eliminates all major debt maturities until 2022
Transaction
Purpose
Benefits

© 2018 First Data Corporation. All Rights Reserved.
2018 Full Year Guidance Revision▪ Organic constant currency revenue and EBITDA growth guidance unchanged
▪ Reported constant currency revenue and EBITDA growth guidance revised strictly for impact of divestitures completed inQ3.18
▪ EPS guidance revised primarily for the impact of recent adverse FX movement and, to a lesser extent, divestitures
Guidance for growth rates holds foreign exchange rates constant versus the year-ago comparable period ("constant currency"), and applies the New Reporting Standards to the referenceyear ago period. See slide 26 for reconciliation of the comparable GAAP metric to the non-GAAP equivalent.
Previous Guidance New Guidance Commentary
Segment Revenue Growth
Organic (at Constant Currency) 5 - 6% 5 - 6% Unchanged
Reported (at Constant Currency) 7 - 8% 6.3 - 7.3% Divestiture impact
Segment EBITDA Growth
Organic (at Constant Currency) 6.5 - 8.5% 6.5 - 8.5% Unchanged
Reported (at Constant Currency) 8 - 10% 7.6 - 9.6% Divestiture impact
Adjusted EPS
Assumes a mid-20's effective tax rate $1.42 - 1.47 $1.38 - 1.40
Estimated adverse y/y impactfrom FX changes on reportedEBITDA of ~$60M in H2.18
(flat in H1.18)
Divestiture Impact
Free Cash Flow $1.4B+ $1.4B+ Unchanged
2018 THIRD QUARTER FINANCIAL RESULTS15

© 2018 First Data Corporation. All Rights Reserved.
Appendix
16 2018 THIRD QUARTER FINANCIAL RESULTS
© 2018 First Data Corporation. All Rights Reserved.
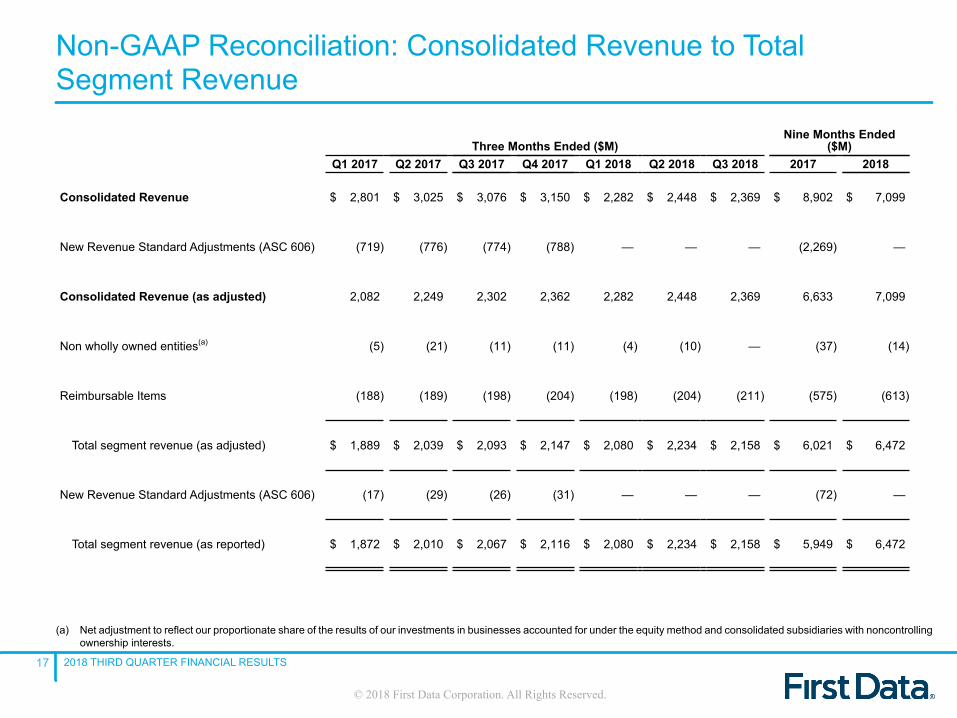
Non-GAAP Reconciliation: Consolidated Revenue to TotalSegment Revenue
Three Months Ended ($M)Nine Months Ended
($M)Q1 2017 Q2 2017 Q3 2017 Q4 2017 Q1 2018 Q2 2018 Q3 2018 2017 2018
Consolidated Revenue $ 2,801 $ 3,025 $ 3,076 $ 3,150 $ 2,282 $ 2,448 $ 2,369 $ 8,902 $ 7,099
New Revenue Standard Adjustments (ASC 606) (719) (776) (774) (788) — — — (2,269) —
Consolidated Revenue (as adjusted) 2,082 2,249 2,302 2,362 2,282 2,448 2,369 6,633 7,099
Non wholly owned entities(a) (5) (21) (11) (11) (4) (10) — (37) (14)
Reimbursable Items (188) (189) (198) (204) (198) (204) (211) (575) (613)
Total segment revenue (as adjusted) $ 1,889 $ 2,039 $ 2,093 $ 2,147 $ 2,080 $ 2,234 $ 2,158 $ 6,021 $ 6,472
New Revenue Standard Adjustments (ASC 606) (17) (29) (26) (31) — — — (72) —
Total segment revenue (as reported) $ 1,872 $ 2,010 $ 2,067 $ 2,116 $ 2,080 $ 2,234 $ 2,158 $ 5,949 $ 6,472
(a) Net adjustment to reflect our proportionate share of the results of our investments in businesses accounted for under the equity method and consolidated subsidiaries with noncontrollingownership interests.
17 2018 THIRD QUARTER FINANCIAL RESULTS

© 2018 First Data Corporation. All Rights Reserved.
Non-GAAP Reconciliation: Net Income to Total Segment EBITDAThree Months Ended ($M) Nine Months Ended
($M)Q1 2017 Q2 2017 Q3 2017 Q4 2017 Q1 2018 Q2 2018 Q3 2018 2017 2018
Net income attributable to First Data Corporation $ 36 $ 185 $ 296 $ 948 $ 101 $ 341 $ 401 $ 517 $ 843
New Revenue Standard Adjustments (ASC 606) (3) 5 1 2 — — — 3 —
Net income attributable to First Data Corporation (asadjusted)
33 190 297 950 101 341 401 520 843
Depreciation and amortization change (2) (2) (2) (2) — — — (6) —
Acquisition - related earnouts change (3) (2) (5) (2) — — — (10) —
Pension Change (1) (2) (1) (2) — — — (4) —
Non wholly owned entities(a) (6) (6) (9) (9) (18) (4) (7) (21) (29)
Depreciation and amortization 228 237 248 259 250 255 248 713 753
Interest expense, net 234 238 234 231 233 234 231 706 698
Loss on debt extinguishment 56 15 1 8 — 1 2 72 3
Other items(b) 26 33 61 12 63 15 (173) 120 (95)
Income tax expense (benefit) 12 28 (106) (663) 27 (37) 54 (66) 44
Stock-based compensation 65 56 62 62 74 59 59 183 192
Total segment EBITDA (as adjusted) $ 642 $ 785 $ 780 $ 844 $ 730 $ 864 $ 815 $ 2,207 $ 2,409
New Revenue Standard Adjustments (ASC 606) 8 (1) 6 2 — — — 13 —
Total segment EBITDA (as reported) $ 650 $ 784 $ 786 $ 846 $ 730 $ 864 $ 815 $ 2,220 $ 2,409
18
(a) Net adjustment to reflect our proportionate share of the results of our investments in businesses accounted for under the equity method and consolidated subsidiaries with noncontrollingownership interests.
(b) Restructuring, non-normal course litigation and regulatory settlements, debt issuance expenses, deal and deal integration costs, "Other income (expense)" as presented in the unauditedconsolidated statements of operations, which includes divestitures, derivative gains (losses), non-operating foreign currency gains (losses), and other, as applicable to the periodspresented.
2018 THIRD QUARTER FINANCIAL RESULTS

© 2018 First Data Corporation. All Rights Reserved.
Non-GAAP Reconciliation: Net Income to Adj. Net Income
Three Months Ended ($M)Nine Months Ended
($M)
Q1 2017 Q2 2017 Q3 2017 Q4 2017 Q1 2018 Q2 2018 Q3 2018 2017 2018
Net income attributable to First Data Corporation $ 36 $ 185 $ 296 $ 948 $ 101 $ 341 $ 401 $ 517 $ 843Adjustments:Stock-based compensation 65 56 62 62 74 59 59 183 192Loss on debt extinguishment 56 15 1 8 — 1 2 72 3Amortization of acquisition intangibles(a) 91 90 102 104 101 100 98 283 299Deferred financing costs(a) 4 4 4 4 5 4 4 12 13
Other(b) 23 31 61 12 63 15 (173) 115 (95)
Non wholly-owned entities — 6 (3) (3) (11) 2 — 3 (9)
Income tax on above items and discrete tax items(c)(d)(e) (17) (13) (147) (707) (54) (151) (51) (177) (256)Adjusted net income $ 258 $ 374 $ 376 $ 428 $ 279 $ 371 $ 340 $ 1,008 $ 990
19
(a) Represents amortization of intangibles established in connection with the 2007 merger and acquisitions we have made since 2007, excluding the percentage of our consolidatedamortization of acquisition intangibles related to non-wholly owned consolidated alliances equal to the portion of such alliances owned by our alliance partners. This line also includesamortization related to deferred financing costs of $4 million and $5 million for the three months ended September 30, 2018 and 2017, respectively, and $13 million and $13 million forthe nine months ended September 30, 2018 and 2017, respectively.
(b) See "Other operating expense, net" and "Other income (expense)" in our unaudited consolidated statements of income in Part I of this form 10-Q.(c) Prior to January 1, 2018, we excluded the impact of all discrete tax items from Adjusted Net Income and Diluted Adjusted Net Income per Share. We will no longer exclude certain discrete
items which were deemed to be recurring in nature. We retrospectively adjusted the prior period results presented in these unaudited consolidated financial statements.(d) We exclude from Adjusted net income certain discrete tax item, such as tax law changes, tax impact of mergers and acquisitions, valuation allowance releases, and tax reserves related
to issues that arose before KKR acquired the Company within a quarter.(e) The tax effect of the adjustments between our GAAP and adjusted results takes into account the tax treatment and related tax rate(s) that apply to each adjustment in the applicable tax
jurisdiction(s). Generally, this results in a tax impact at the U.S. effective tax rate for certain adjustments, including the majority of amortization of intangible assets, deferred financingcosts, stock compensation, and loss on debt extinguishment; whereas the tax impact of other adjustments, including restructuring expense, depends on whether the amounts aredeductible in the respective tax jurisdictions and the applicable effective tax rate(s) in those jurisdictions.
2018 THIRD QUARTER FINANCIAL RESULTS

© 2018 First Data Corporation. All Rights Reserved.
Non-GAAP Reconciliation: Cash Flow from Operations to FreeCash Flow
Three Months Ended ($M)Nine Months Ended
($M)
Q1 2017 Q2 2017 Q3 2017 Q4 2017 Q1 2018 Q2 2018 Q3 2018 2017 2018
Cash provided byoperating activities $ 421 $ 580 $ 581 $ 465 $ 534 $ 604 $ 671 $ 1,582 $ 1,809
Capital expenditures (117) (139) (134) (128) (139) (151) (162) (390) (452)
Distribution and dividends paid to noncontrollinginterests and redeemable noncontrolling interest andother(a) (43) 7 (77) (57) (27) (75) (65) (113) (167)
Free cash flow $ 261 $ 448 $ 370 $ 280 $ 368 $ 378 $ 444 $ 1,079 $ 1,190
(a) The three and nine months ended September 30, 2017 includes $0million, $90 million, $43 million, and $43 million, respectively, of cash receieved upon maturity of net investmenthedges, which is reflected within "investing activities" on the Consolidated Statements of Cash Flows.
20
(a) The three months ended March 31, 2018 and June 30, 2017, include $26 million and $90 million, respectively, of cash received upon maturity of net investment hedges, which isreflected within "investing activities" on the Consolidated Statements of Cash Flows.
2018 THIRD QUARTER FINANCIAL RESULTS

© 2018 First Data Corporation. All Rights Reserved.
Non-GAAP Reconciliation: Total Borrowings to Net Debt
September 30, 2018 June 30, 2018 March 31, 2018 December 31, 2017
Total Long-term borrowings $ 16,949 $ 17,717 $ 17,908 $ 17,927
Total Short-term and current portion of long-term borrowings 806 900 1,104 1,271
Total borrowings 17,755 18,617 19,012 19,198
Unamortized discount and unamortized deferred financing costs 105 112 120 126
Total borrowings at par 17,860 18,729 19,132 19,324
Less: Settlement lines of credit and other arrangements 76 147 164 205
Gross debt 17,784 18,582 18,968 19,119
Less: Cash and cash equivalents 601 544 586 498
Net debt $ 17,183 $ 18,038 $ 18,382 $ 18,621
(a) September 30, 2017 trailing twelve months total segment EBITDA reflects the last twelve months of EBITDA generated by CardConnect
21 2018 THIRD QUARTER FINANCIAL RESULTS

© 2018 First Data Corporation. All Rights Reserved.
(a) “B” means results in 2018 are better than results in 2017 “(W)” means results are worse.(b) “Acquisitions/Divestitures includes the following 2017 activity: the acquisitions of CardConnect and BluePay in GBS North America; the formation of a digital banking JV in NSS (treated as a 50% digital banking
revenue divestiture), and the divestitures of the GFS Baltics and Remitco businesses.
Non-GAAP Reconciliation: Adjustment to Organic ConstantCurrency Growth
Three months ended September 30, Nine months ended September 30,2018 2017 % B/(W)(a) 2018 2017 % B/(W)(a)
Reported FDC segment revenue $ 2,158 $ 2,067 4% $ 6,472 $ 5,949 9%New revenue standard adjustments (ASC 606) — 26 — 72
FDC segment revenue (comparable accounting) 2,158 2,093 3% 6,472 6,021 8%Currency impact 45 — 19 —
FDC CC adjusted segment revenue 2,203 2,093 5% 6,491 6,021 8%Acquisitions/Divestitures(b) — 10 — 129
Organic CC FDC segment revenue growth $ 2,203 $ 2,103 5% $ 6,491 $ 6,150 6%
Reported GBS segment revenue $ 1,384 $ 1,256 10% $ 4,151 $ 3,601 15%New revenue standard adjustments (ASC 606) — 45 — 119
GBS segment revenue (comparable accounting) 1,384 1,301 7% 4,151 3,720 12%Currency impact 36 — 25 —Acquisitions/Divestitures(b) — 35 — 180
Organic CC GBS segment revenue growth $ 1,420 $ 1,336 6% $ 4,176 $ 3,900 7%
Reported GBS NA segment revenue $ 1,079 $ 973 11% $ 3,227 $ 2,818 15%New revenue standard adjustments (ASC 606) — 35 — 95
GBS NA segment revenue (comparable accounting) 1,079 1,008 7% 3,227 2,913 11%Currency impact 2 — — —Acquisitions/Divestitures(b) — 35 — 180
Organic CC GBS NA segment revenue growth $ 1,081 $ 1,043 4% $ 3,227 $ 3,093 4%
Reported GBS EMEA segment revenue $ 180 $ 167 8% $ 528 $ 463 14%New revenue standard adjustments (ASC 606) — 2 — 5
GBS EMEA segment revenue (comparable accounting) 180 169 7% 528 468 13%Currency impact 1 — (33) —Acquisitions/Divestitures(b) — — — —
Organic CC GBS EMEA segment revenue growth $ 181 $ 169 8% $ 495 $ 468 6%
Reported GBS APAC segment revenue $ 49 $ 44 12% $ 147 $ 125 18%New revenue standard adjustments (ASC 606) — 1 — 1
GBS APAC segment revenue (comparable accounting) 49 45 10% 147 126 17%Currency impact 1 — (2) —Acquisitions/Divestitures(b) — — — —
Organic CC GBS APAC segment revenue growth $ 50 $ 45 13% $ 145 $ 126 16%
(a) “B” means results in 2017 are better than results in 2016 “(W)” means results are worse.(b) 2016 Australian ATM divestiture revenue, expense, EBITDA shown in constant currency rates.(c) "Acquisitions/Divestitures" includes both the CardConnect acquisition and Australian ATM divestiture. Australia ATM divestiture is excluded from GBS APAC adjustments. GBS NA is adjusted to reflect
CardConnects results for the comparable periods in 2016.
22 2018 THIRD QUARTER FINANCIAL RESULTS

© 2018 First Data Corporation. All Rights Reserved.
Non-GAAP Reconciliation: Adjustment to Organic ConstantCurrency Growth
Three months ended September 30, Nine months ended September 30,2018 2017 % B/(W)(a) 2018 2017 % B/(W)(a)
Reported GBS LATAM segment revenue $ 76 $ 72 7% $ 249 $ 195 28%New revenue standard adjustments (ASC 606) — 7 — 18
GBS LATAM segment revenue (comparable accounting) 76 79 (2)% 249 213 17%Currency impact 32 — 60 —Acquisitions/Divestitures(b) — — — —
Organic CC GBS LATAM segment revenue growth $ 108 $ 79 37% $ 309 $ 213 45%
Reported GFS segment revenue $ 407 $ 416 (2)% $ 1,221 $ 1,211 1%New revenue standard adjustments (ASC 606) — (6) — (6)
GFS segment revenue (comparable accounting) 407 410 (1)% 1,221 1,205 1%Currency impact 9 — (6) —Acquisitions/Divestitures(b) — (18) — (30)
Organic CC GFS segment revenue growth $ 416 $ 392 6% $ 1,215 $ 1,175 3%
Reported GFS NA segment revenue $ 233 $ 238 (2)% $ 694 $ 707 (2)%New revenue standard adjustments (ASC 606) — (2) — (2)
GFS NA segment revenue (comparable accounting) 233 236 (1)% 694 705 (1)%Currency impact — — — —Acquisitions/Divestitures(b) — (11) — (11)
Organic CC GFS NA segment revenue growth $ 233 $ 225 4% $ 694 $ 694 —%
Reported GFS EMEA segment revenue $ 114 $ 121 (6)% $ 343 $ 332 3%New revenue standard adjustments (ASC 606) — (1) — (1)
GFS EMEA segment revenue (comparable accounting) 114 120 (5)% 343 331 4%Currency impact 1 — (19) —Acquisitions/Divestitures(b) — (7) — (19)
Organic CC GFS EMEA segment revenue growth $ 115 $ 113 1% $ 324 $ 312 4%
Reported GFS APAC segment revenue $ 27 $ 24 9% $ 84 $ 72 16%New revenue standard adjustments (ASC 606) — (3) — (9)
GFS APAC segment revenue (comparable accounting) 27 21 23% 84 63 32%Currency impact 2 — — —Acquisitions/Divestitures(b) — — — —
Organic CC GFS APAC segment revenue growth $ 29 $ 21 30% $ 84 $ 63 31%
23 2018 THIRD QUARTER FINANCIAL RESULTS
(a) “B” means results in 2018 are better than results in 2017 “(W)” means results are worse.(b) “Acquisitions/Divestitures includes the following 2017 activity: the acquisitions of CardConnect and BluePay in GBS North America; the formation of a digital banking JV in NSS (treated as a 50% digital banking
revenue divestiture), and the divestitures of the GFS Baltics and Remitco businesses.

© 2018 First Data Corporation. All Rights Reserved.
Non-GAAP Reconciliation: Adjustment to Organic ConstantCurrency Growth
Three months ended September 30, Nine months ended September 30,2018 2017 % B/(W)(a) 2018 2017 % B/(W)(a)
Reported GFS LATAM segment revenue $ 33 $ 33 2% $ 100 $ 100 1%New revenue standard adjustments (ASC 606) — — — 6
GFS LATAM segment revenue (comparable accounting) 33 33 2% 100 106 (5)%Currency impact 6 — 13 —Acquisitions/Divestitures(b) — — — —
Organic CC GFS LATAM segment revenue growth $ 39 $ 33 23% $ 113 $ 106 7%
Reported NSS segment revenue $ 367 $ 395 (7)% $ 1,100 $ 1,137 (3)%New revenue standard adjustments (ASC 606) — (13) — (41)
NSS segment revenue (comparable accounting) 367 382 (4)% 1,100 1,096 —%Currency impact — — — —Acquisitions/Divestitures(b) — (7) — (21)
Organic CC NSS segment revenue growth $ 367 $ 375 (2)% $ 1,100 $ 1,075 2%
24 2018 THIRD QUARTER FINANCIAL RESULTS
(a) “B” means results in 2018 are better than results in 2017 “(W)” means results are worse.(b) “Acquisitions/Divestitures includes the following 2017 activity: the acquisitions of CardConnect and BluePay in GBS North America; the formation of a digital banking JV in NSS (treated as a 50% digital banking
revenue divestiture), and the divestitures of the GFS Baltics and Remitco businesses.

© 2018 First Data Corporation. All Rights Reserved.
2018 THIRD QUARTER FINANCIAL RESULTS25
Non-GAAP Reconciliation: Adjustment to Organic ConstantCurrency Growth
Three months ended September 30, Nine months ended September 30,2018 2017 % B/(W)(a) 2018 2017 % B/(W)(a)
Reported FDC segment EBITDA $ 815 $ 786 4% $ 2,409 $ 2,220 9%New revenue standard adjustments (ASC 606) — (6) — (13)
FDC segment EBITDA (comparable accounting) 815 780 5% 2,409 2,207 9%Currency impact 23 — 25 —
FDC CC adjusted segment EBITDA 838 780 8% 2,434 2,207 10%Acquisitions/Divestitures(b) — 8 — 43
Organic CC FDC segment EBITDA growth $ 838 $ 788 7% $ 2,434 $ 2,250 8%
Reported GBS segment EBITDA $ 503 $ 465 8% $ 1,481 $ 1,330 11%New revenue standard adjustments (ASC 606) — (2) — (13)
GBS segment EBITDA (comparable accounting) 503 463 8% 1,481 1,317 12%Currency impact 18 — 22 —Acquisitions/Divestitures(b) — 12 — 51
Organic CC GBS segment EBITDA growth $ 521 $ 475 10% $ 1,503 $ 1,368 10%
Reported GFS segment EBITDA $ 161 $ 179 (10)% $ 503 $ 498 1%
New revenue standard adjustments (ASC 606) — (4) — —
GFS segment EBITDA (comparable accounting) 161 175 (8)% 503 498 1%
Currency impact 5 — 3 —
Acquisitions/Divestitures(b) — (4) — (8)
Organic CC GFS segment EBITDA growth $ 166 $ 171 (2)% $ 506 $ 490 4%
Reported NSS EBITDA $ 195 $ 184 6% $ 563 $ 520 8%
New revenue standard adjustments (ASC 606) — — — —
NSS segment EBITDA (comparable accounting) 195 184 6% 563 520 8%
Currency impact — — — —
Acquisitions/Divestitures(b) — — — —
Organic CC NSS segment EBITDA growth $ 195 $ 184 6% $ 563 $ 520 8%
(a) “B” means results in 2018 are better than results in 2017 “(W)” means results are worse.(b) “Acquisitions/Divestitures includes the following 2017 activity: the acquisitions of CardConnect and BluePay in GBS North America; the formation of a digital banking JV in NSS (treated as a 50% digital banking
revenue divestiture), and the divestitures of the GFS Baltics and Remitco businesses.

© 2018 First Data Corporation. All Rights Reserved.
Consolidated Revenue to Total Segment Revenue
FY 2018 vs. FY 2017Consolidated revenue (at reported rates) 2018 atASC 606 vs. 2017 at ASC 605 ~(20%)
Adjustments:
+Non wholly owned entities
+Reimbursable postage and other
+ASC 606 Adjustments
+Currency Impact
Memo: Total segment revenue (at constantcurrency) ~6.3-7.3%
(1) Reflects a significant increase in tax expense in 2018 primarily driven by the Q4 2017 release of a valuation allowance against deferred tax assets associated with the U.S. federal NOL. The reversal of thevaluation allowance resulted in a significant non-cash tax benefit in Q4 2017 and the recording of a normalized book tax rate in 2018.
(2) Includes non wholly owned entities adjustment, loss on debt extinguishment, as well as other items. (3) Includes loss on debt extinguishment, gain/loss on divestitures, restructuring, impairment, litigation and other, as well as the impact of tax expense/(benefit) of the adjusted items (4) Includes capital expenditures and distributions to minority interest and other.
Net Income to Total Segment EBITDA
FY 2018 vs. FY 2017Net income attributable to FDC(1) 2018 at ASC 606vs. 2017 at ASC 605 ~(30%) - (40%)
Adjustments+Depreciation and amortization+Interest expense, net+Income tax expense+Stock-based compensation+ASC 606 Adjustments+Other(2)
+Currency ImpactMemo: total segment EBITDA (at constantcurrency) ~7.6-9.6%
Net Income to Adj. Net IncomeFY 2018
Net income attributable to FDC (1) $0.98-1.00
Adjustments (note: adjustments represent positivebalances)
+Stock-based compensation
+Amortization of acquisition intangibles anddeferred financing cost
+ASC 606 Adjustments
+Other(3)
Adjusted Net Income $1.38-1.40
Cash Flow From Operations to Free Cash FlowFY 2018
Cash (used in) / provided by operating activities $2.1B+
+Adjustments(4)
Free cash flow (use)/source $1.4B+
Non-GAAP Reconciliations: 2018 Guidance
26 2018 THIRD QUARTER FINANCIAL RESULTS

© 2018 First Data Corporation. All Rights Reserved.
Notice to Investors, Prospective Investors & the Investment Community;Cautionary Information Regarding Forward-Looking Statements
Certain matters we discuss in our public statements may constitute forward-looking statements. You can identify forward-looking statements because they
contain words such as “believes,” “expects,” “may,” “will,” “should,” “seeks,” “intends,” “plans,” “estimates,” or “anticipates” or similar expressions which concern
our strategy, plans, projections or intentions. Examples of forward-looking statements include, but are not limited to, all statements we make relating to revenue,
earnings before net interest expense, income taxes, depreciation, and amortization (EBITDA), earnings, margins, growth rates, and other financial results for
future periods. By their nature, forward-looking statements speak only as of the date they are made; are not statements of historical fact or guarantees of future
performance; and are subject to risks, uncertainties, assumptions or changes in circumstances that are difficult to predict or quantify. Actual results could differ
materially and adversely from our forward-looking statements due to a variety of factors, including the following: (1) adverse impacts from global economic,
political, and other conditions affecting trends in consumer, business, and government spending; (2) our ability to anticipate and respond to changing industry
trends, including technological changes and increasing competition; (3) our ability to successfully renew existing client contracts on favorable terms and obtain
new clients; (4) our ability to prevent a material breach of security of any of our systems; (5) our ability to implement and improve processing systems to provide
new products, improve functionality, and increase efficiencies; (6) the successful management of our merchant alliance program which involves several alliances
not under our sole control and each of which acts independently of the others; (7) our successful management of credit and fraud risks in our business units and
merchant alliances, particularly in the context of eCommerce and mobile markets; (8) consolidation among financial institution clients or other client groups that
impacts our client relationships; (9) our ability to use our net operating losses without restriction to offset income for US tax purposes; (10) our ability to improve
our profitability and maintain flexibility in our capital resources through the implementation of cost savings initiatives; (11) the acquisition or disposition of material
business or assets; (12) our ability to successfully value and integrate acquired businesses; (13) our high degree of leverage; (14) adverse impacts from
currency exchange rates or currency controls imposed by any government or otherwise; (15) changes in the interest rate environment that increase interest on
our borrowings or the interest rate at which we can refinance our borrowings; (16) the impact of new or changes in current laws, regulations, credit card
association rules, or other industry standards; and (17) new lawsuits, investigations, or proceedings, or changes to our potential exposure in connection with
pending lawsuits, investigations or proceedings, and various other factors set forth in our Annual Report on Form 10-K for the period ended December 31, 2017,
including but not limited to, Item 1 - Business, Item 1A - Risk Factors, and Item 7 - Management’s Discussion and Analysis of Financial Condition and Results of
Operations. Except as required by law, we do not intend to revise or update any forward-looking statement as a result of new information, future developments
or otherwise.
27 2018 THIRD QUARTER FINANCIAL RESULTS


![Updates on Financial Results for March 31, 2016 (Segment) [Company Update]](https://img.dokumen.tips/doc/110x75/577c7b341a28abe054978cb9/updates-on-financial-results-for-march-31-2016-segment-company-update.jpg)