Embed Size (px)
Citation preview


2018 State of the Line Guide
Page 2
© Copyright 2018 NCCI Holdings, Inc. All Rights Reserved.
2018 STATE OF THE LINE GUIDE—INTRODUCTION NCCI’s annual State of the Line presentation provides an exclusive review of trends, cost drivers, and significant developments shaping the workers compensation industry. This Guide provides a slide-by-slide examination of the key takeaways, data sources, and formulas underlying the State of the Line presentation.
As you review the information contained in this Guide, it may be useful to keep in mind the following market indicators and trends that were highlighted in NCCI’s 2018 State of the Line presentation:
• The workers compensation 2017 calendar year combined ratio for private carriers was 89%. This is the fourth consecutive year the workers compensation line of business has posted an underwriting gain.
• The overall reserve position for private carriers improved in 2017. NCCI estimates the year-end 2017 reserve position to be a $1 billion deficiency—down from $5 billion in 2016.
• Average lost-time claim frequency across NCCI states declined by 6% in 2017, on a preliminary basis. A similar percentage decline was observed in 2016.
• In NCCI states, the preliminary 2017 average indemnity and medical lost-time accident year claim severities both increased by 4% relative to their corresponding 2016 values.
• The workers compensation Residual Market Pool premium volume declined to approximately $1B during 2017, while the average residual market share remained stable at 8%.
We hope you find the 2018 State of the Line Guide both a beneficial and informative resource.
Select this icon to return to the Table of Contents
Select this icon to view the slide’s background information and data sources
Select this icon to view the slide’s underlying data
Select this icon to return to the applicable slide
Hyperlink Click to go to the definitions and/or formulas located in the Appendix

2018 State of the Line Guide
Page 3
© Copyright 2018 NCCI Holdings, Inc. All Rights Reserved.
2018 STATE OF THE LINE GUIDE—TABLE OF CONTENTS
Property/Casualty (P/C) Results
• Slide 1: P/C Industry Net Written Premium Growth
• Slide 2: P/C Industry Net Combined Ratio
• Slide 3: Impact of Catastrophes on P/C Losses
• Slide 4: P/C Industry Net Combined Ratio (by Year)
• Slide 5: P/C Industry Investment Gain Ratio
• Slide 6: P/C Industry Bond Embedded Yield and New Money Yield
• Slide 7: P/C Industry After-Tax Return on Surplus
• Slide 8: P/C Industry Premium-to-Surplus Ratio
Workers Compensation (WC) Premium
• Slide 9: WC Net Written Premium
• Slide 10: Proportion of Total WC Premium Ceded
• Slide 11: WC Residual Market Premium
• Slide 12: WC Residual Market—Changes in Premium vs. Average Policy Size
• Slide 13: WC Residual Market Premium by Size of Risk
• Slide 14: WC Residual Market Share
• Slide 15: Top Five Residual Market Class Codes
• Slide 16: WC Direct Written Premium Change—2017
• Slide 17: WC Direct Written Premium Change by Component
• Slide 18: Increases in Payroll Continue to Drive Changes in Premium
• Slide 19: WC Approved Changes in Bureau Premium Level
• Slide 20: Most Recent Changes in Bureau Premium Level
• Slide 21: WC Impact of Discounting on Premium
• Slide 22: WC Impact of Discounting on Premium by Component
• Slide 23: WC Pricing—Market Index Survey
• Slide 24: WC Pricing—Market Index Survey (History)
Workers Compensation Results
• Slide 25: WC Combined Ratio—Underwriting Gain Achieved
• Slide 26: WC Combined Ratio by Component
• Slide 27: WC LAE-to-Loss Ratio—Net Incurred LAE to Incurred Losses
• Slide 28: WC Residual Market Combined Ratio
• Slide 29: WC Investment Gain on Insurance Transactions
• Slide 30: WC Pretax Operating Gain
• Slide 31: Social Security Disability Insurance and Workers Compensation
Workers Compensation Accident Year Results and Reserve Estimates
• Slide 32: WC Net Combined Ratios—Calendar Year vs. Accident Year As Reported
• Slide 33: WC Net Combined Ratios—NCCI’s Accident Year Selections vs. As Reported
• Slide 34: WC Net Loss and LAE Ratios—NCCI’s Accident Year Selections vs. As Reported
• Slide 35: WC Net Loss and LAE Reserve Deficiencies
• Slide 36: Emergence of Reported WC Net Loss and LAE Ratios

2018 State of the Line Guide
Page 4
© Copyright 2018 NCCI Holdings, Inc. All Rights Reserved.
2018 STATE OF THE LINE GUIDE—TABLE OF CONTENTS
Workers Compensation Loss Drivers
• Slide 37: WC Lost-Time Claim Frequency
• Slide 38: WC Lost-Time Claim Frequency (by State)
• Slide 39: NCCI and BLS Measures of Lost-Time Claim Frequency
• Slide 40: Distribution of Lost-Time Claims by Size
• Slide 41: Changes in Lost-Time Claims by Size
• Slide 42: Indemnity Data Call (IDC)
• Slide 43: WC Average Indemnity Claim Severity
• Slide 44: WC Average Indemnity Claim Severity (and Wage Inflation)
• Slide 45: Relative Growth Rates—Indemnity Severity vs. Wage Inflation
• Slide 46: WC Average Indemnity Claim Severity (by State)
• Slide 47: WC Average Medical Lost-Time Claim Severity
• Slide 48: WC Average Medical Lost-Time Claim Severity (and Price Inflation)
• Slide 49: Relative Growth Rates–Medical Severity vs. Price Inflation
• Slide 50: WC Average Medical Lost-Time Claim Severity (by State)
• Slide 51: Utilization of Opioids
Background and Data Sources
Data Tables
Appendices
• A: Definitions
• B: Formulas

2018 State of the Line Guide
Page 5
© Copyright 2018 NCCI Holdings, Inc. All Rights Reserved.
AIS201830th Anniversary© Copyright 2018 NCCI Holdings, Inc. All Rights Reserved.
Line of Business 2016 ($B) 2017p ($B) % Change From 2016
Personal Auto 207.4 221.9
Homeowners 80.6 82.2
Other Liability (Incl. Product Liability) 47.9 50.1
Workers Compensation 40.1 39.8
Commercial Multiple Peril 33.8 34.1
Fire & Allied Lines (Incl. EQ) 26.3 26.4
Commercial Auto 28.3 30.6
All Other Lines 63.7 67.0
Total P/C Industry 528.0 552.1 4.6
5.2
8.1
0.4
0.9
-0.7
4.6
2.0
7.0
P/C Industry Net Written Premium GrowthPrivate Carriers
p Preliminary Source: NAIC’s Annual Statement data for individual carriers prior to consolidation of affiliated carriers
Key Takeaways
• Total P/C net written premium for private carriers increased by 4.6% to just over $552 billion in 2017 • Almost half the total net written premium comes from the personal and commercial auto lines, and they were the standouts in premium
growth for 2017 • Workers compensation is the only line of business that had a decrease in net written premium in 2017

2018 State of the Line Guide
Page 6
© Copyright 2018 NCCI Holdings, Inc. All Rights Reserved.
AIS201830th Anniversary© Copyright 2018 NCCI Holdings, Inc. All Rights Reserved.
Line of Business 2016 (%) 2017p (%) Difference From 2016
Personal Auto 106 103
Homeowners 93 107
Other Liability (Incl. Product Liability) 111 101
Workers Compensation 94 89
Commercial Multiple Peril 102 108
Fire & Allied Lines (Incl. EQ) 90 124
Commercial Auto 111 111
All Other Lines 87 98
Total P/C Industry 101 104 3
11
0
34
6
-5
-10
14
-3
P/C Industry Net Combined RatioPrivate Carriers
p Preliminary Source: NAIC’s Annual Statement data for individual carriers prior to consolidation of affiliated carriers
Key Takeaways
• The total P/C industry’s combined ratio increased three points to 104% in 2017 • Despite record losses from Hurricane Harvey, the personal auto combined ratio improved as a result of the increase in premium along
with improved fraud detection and usage-based insurance • The workers compensation combined ratio for 2017 is 89%, which is the lowest seen in NCCI’s records • Homeowners, fire & allied lines, and all other lines saw notable deterioration in their combined ratios, with fire & allied lines up by 34
points

2018 State of the Line Guide
Page 7
© Copyright 2018 NCCI Holdings, Inc. All Rights Reserved.
AIS201830th Anniversary© Copyright 2018 NCCI Holdings, Inc. All Rights Reserved.
Impact of Catastrophes on P/C Losses
Source: Willis Re Summary of Natural Cat Events 2017
Major hurricanes had a combined impact on insured losses of $56B
Wildfires destroyed structures, homes, and buildings, resulting in over $11B in losses
Several tornado, hail, wind, and flood events produced up to $11B in insured losses
Key Takeaways
• In 2017, three Category 4 hurricanes—Harvey, Irma, and Maria—made landfall in the United States, causing over $50 billion in insured losses
• Wildfires, tornados, hail, wind, and flood events resulted in over $20 billion in additional insured losses

2018 State of the Line Guide
Page 8
© Copyright 2018 NCCI Holdings, Inc. All Rights Reserved.
AIS201830th Anniversary© Copyright 2018 NCCI Holdings, Inc. All Rights Reserved.
P/C Industry Net Combined RatioPrivate Carriers
p PreliminarySources: 1997–2007 and 2012–2017p NAIC’s Annual Statement data; 2008–2011 ISO
116
92
104
97 98 99 00 01 02 03 04 05 06 07 08 09 10 11 12 13 14 15 16 17p
Calendar Year
Average (1997–2016): 102
Percent
Key Takeaways
• Looking at the long-term history of the industry combined ratios, the underwriting cycle ebbs and flows around the break-even combined ratio of 100%
• The 2017 combined ratio of 104% is slightly worse than the long-term average of 102% • The worst combined ratio over this period (116%) occurred in 2001 and included the impact of the 9/11 terrorist attacks; the best was
92% at the end of the hard market that followed

2018 State of the Line Guide
Page 9
© Copyright 2018 NCCI Holdings, Inc. All Rights Reserved.
AIS201830th Anniversary© Copyright 2018 NCCI Holdings, Inc. All Rights Reserved.
P/C Industry Investment Gain RatioPrivate Carriers
p PreliminarySources: 1997–2007 and 2013–2017p NAIC’s Annual Statement data; 2008–2012 ISO
Net Realized Capital Gains to Net Earned Premium
Net Investment Income to Net Earned Premium
Percent
10.4
12
5
10
15
20
25
97 98 99 00 01 02 03 04 05 06 07 08 09 10 11 12 13 14 15 16 17p
Calendar Year
4% lower
Key Takeaway
• The net investment income ratio remained stable at 9% in 2017, while the net realized capital gains ratio increased, due primarily to the gain on sale of common stocks

2018 State of the Line Guide
Page 10
© Copyright 2018 NCCI Holdings, Inc. All Rights Reserved.
AIS201830th Anniversary© Copyright 2018 NCCI Holdings, Inc. All Rights Reserved.
2
4
6
8
10
12
1985 1990 1995 2000 2005 2010 2015
Calendar Year
Recession
Pretax Embedded Yield
Pretax New Money Yield
P/C Industry Bond Embedded Yield and New Money Yield
Sources: NCCI, A.M. Best’s Aggregates & Averages, Federal Reserve Bank, Value Line, TreasuryDirect.gov, Barron’s, and BloombergEmbedded Yield is the reported investment income for bond instruments divided by the asset value of those instrumentsNew Money Yield is the pretax yield on bonds
Percent
Key Takeaways
• Both Embedded and New Money Yields have generally declined over the last 30 years • During and immediately after the last three recessions, the New Money Yield declined • Throughout this period, the New Money Yield is generally below the Embedded Yield, but in recent years the two have continued to
slowly converge

2018 State of the Line Guide
Page 11
© Copyright 2018 NCCI Holdings, Inc. All Rights Reserved.
AIS201830th Anniversary© Copyright 2018 NCCI Holdings, Inc. All Rights Reserved.
P/C Industry After-Tax Return on SurplusPrivate Carriers
p PreliminarySources: 1997–2007 and 2013–2017p NAIC’s Annual Statement data; 2008–2012 ISOAfter-tax return on average surplus, excluding unrealized capital gains
66.4
-5
0
5
10
15
20
97 98 99 00 01 02 03 04 05 06 07 08 09 10 11 12 13 14 15 16 17p
Calendar Year
Average (1997–2016): 7.6%
Percent
Key Takeaways
• The after-tax return on surplus decreased again—down to 6% in 2017, remaining below the long-term average of 7.6%. • The largest contributor to the decrease was an additional $18 billion in P/C underwriting losses between 2016 and 2017. Surplus also
increased, further contributing to the drop in the return.

2018 State of the Line Guide
Page 12
© Copyright 2018 NCCI Holdings, Inc. All Rights Reserved.
AIS201830th Anniversary© Copyright 2018 NCCI Holdings, Inc. All Rights Reserved.
0.74
0.5
1.0
1.5
2.0
Premium-to-Surplus Ratio
P/C Industry Premium-to-Surplus RatioPrivate Carriers
p PreliminarySources: 1997–2007 and 2013–2017p NAIC’s Annual Statement data; 2008–2012 ISO
$113B
$225B
$ Billions
$552
$749
200
400
600
800
97 98 99 00 01 02 03 04 05 06 07 08 09 10 11 12 13 14 15 16 17p
Net Written Premium Surplus
Key Takeaways
• Unrealized capital gains, primarily from the appreciation of common stocks, helped push surplus to another record level • Surplus grew faster than net written premium over the period displayed, resulting in a small drop in the premium-to-surplus ratio to
0.74

2018 State of the Line Guide
Page 13
© Copyright 2018 NCCI Holdings, Inc. All Rights Reserved.
AIS201830th Anniversary© Copyright 2018 NCCI Holdings, Inc. All Rights Reserved.
WC Net Written PremiumPrivate Carriers and State Funds
p PreliminarySource: NAIC’s Annual Statement data; includes state insurance fund data for the following states: AZ, CA, CO, HI, ID, KY, LA, MD, MO, MT, NM, OK, OR, RI, TX, and UTEach calendar year total for state funds includes all funds operating as a state fund in that year
37.8 40.1 39.8
47.845.6 45.0
10
20
30
40
50
97 98 99 00 01 02 03 04 05 06 07 08 09 10 11 12 13 14 15 16 17p
Calendar Year
State Funds
Private Carriers
$ Billions
Key Takeaways
• In 2017, net written premium for private carriers dropped slightly to $39.8 billion • Total market net written premium volume also declined slightly in 2017 to $45.0 billion • Net written premium growth is stagnant, in part due to the continued growth in offshore cessions • In addition, payroll growth has been offset by loss cost decreases and little to no change in carrier pricing levels

2018 State of the Line Guide
Page 14
© Copyright 2018 NCCI Holdings, Inc. All Rights Reserved.
AIS201830th Anniversary© Copyright 2018 NCCI Holdings, Inc. All Rights Reserved.
Proportion of Total WC Premium Ceded
Source: NAIC’s Annual Statement data
2011 2012 2013 2014 2015 2016 2017
2011 2017
Average Annual Growth
Direct and Assumed (+6% per year)
Ceded (+11% per year)
24%Ceded
32%Ceded
Key Takeaways
• Both total direct and assumed (D&A) and ceded premium volume increased between 2011 and 2017, with the growth rate in ceded earned premium exceeding that for D&A over this period
• D&A earned premium increased at an average annual rate of 6% between 2011 and 2017, while earned premium ceded to reinsurers increased at an average annual rate of 11%

2018 State of the Line Guide
Page 15
© Copyright 2018 NCCI Holdings, Inc. All Rights Reserved.
AIS201830th Anniversary© Copyright 2018 NCCI Holdings, Inc. All Rights Reserved.
WC Residual Market PremiumNCCI-Serviced WC Residual Market Pools
p Preliminary, incomplete policy year projected to ultimateIncludes Pool data for all NCCI-serviced WC Residual Market Pool states, valued as of 12/31/2017Tennessee Reinsurance Mechanism premium is not includedSource: NCCI’s Residual Market Quarterly Results
$1.5B
$1.0B
97 98 99 00 01 02 03 04 05 06 07 08 09 10 11 12 13 14 15 16 17p
Policy Year
Key Takeaway
• Premium for the NCCI-serviced Residual Market Pools has not changed significantly over the last five policy years

2018 State of the Line Guide
Page 16
© Copyright 2018 NCCI Holdings, Inc. All Rights Reserved.
AIS201830th Anniversary© Copyright 2018 NCCI Holdings, Inc. All Rights Reserved.
-1
0
1
02 03 04 05 06 07 08 09 10 11 12 13 14 15 16 17
Percent
Policy Year
Premium Average Policy Size
Total estimated annual premiumIncludes Pool and direct assignment data for all NCCI-administered WC Residual Market Plan states
WC Residual Market—Changes in Premium vs. Average Policy SizeNCCI-Administered WC Residual Market Plan States
Key Takeaways
• The average policy size in the residual market tends to be a leading indicator of the size of the residual market. • When larger policies are removed, the size of the residual market typically declines. The opposite is a sign that the residual market is
likely to start growing.

2018 State of the Line Guide
Page 17
© Copyright 2018 NCCI Holdings, Inc. All Rights Reserved.
AIS201830th Anniversary© Copyright 2018 NCCI Holdings, Inc. All Rights Reserved.
Size of Risk
Premium ($ Millions)
Q1 2017 Q1 2018 % Change From 2017
$ 0 – 2,499 36.1 39.3
$ 2,500 – 4,999 20.0 19.4
$ 5,000 – 9,999 26.5 25.3
$ 10,000 – 49,999 68.5 61.4
$ 50,000 – 99,999 21.2 19.5
$ 100,000 and Over 26.6 20.2
Total 198.9 185.1 -7
-24
-8
-10
-5
-3
9
WC Residual Market Premium by Size of RiskNCCI-Administered WC Residual Market Plan States
Total estimated annual premiumIncludes Pool and direct assignment data for all NCCI-administered WC Residual Market Plan states
Key Takeaway
• Written premium volume has declined for all risk sizes greater than $2,500, with the largest decrease observed for risk sizes greater than $100,000

2018 State of the Line Guide
Page 18
© Copyright 2018 NCCI Holdings, Inc. All Rights Reserved.
AIS201830th Anniversary© Copyright 2018 NCCI Holdings, Inc. All Rights Reserved.
WC Residual Market ShareNCCI-Serviced WC Residual Market Pools
p PreliminaryIncludes Pool and direct assignment data for all NCCI-serviced WC Residual Market Pool statesSource: NCCI’s Residual Market Management Summary
8
5
10
15
20
97 98 99 00 01 02 03 04 05 06 07 08 09 10 11 12 13 14 15 16 17p
Calendar Year
Percent
Key Takeaway
• The residual market share has remained steady at 8% since 2013

2018 State of the Line Guide
Page 19
© Copyright 2018 NCCI Holdings, Inc. All Rights Reserved.
AIS201830th Anniversary© Copyright 2018 NCCI Holdings, Inc. All Rights Reserved.
Top Five Residual Market Class Codes Based on Residual Market Plan Total Written Premium for 2017
8.5%
6.1%
3.6% 3.3%2.5%
Carpentry5645
Roofing5551
Local Trucking 7228
Painting5474
Long-Haul Trucking7229
Top classification codes excluding the Standard Exception classificationsResults are based on manual premium volume for both intrastate policies and the state-specific portion of interstate policiesSource: NCCI’s Policy data
Key Takeaway
• Carpentry, roofing, local and long-haul trucking, and painting made up about 24% of the residual market premium in 2017

2018 State of the Line Guide
Page 20
© Copyright 2018 NCCI Holdings, Inc. All Rights Reserved.
AIS201830th Anniversary© Copyright 2018 NCCI Holdings, Inc. All Rights Reserved.
Source: 2016 and 2017 NAIC’s Annual Statement Statutory Page 14
+15%
–15%
0%
WC Direct Written Premium Change—2017Private Carriers
Key Takeaways
• Between 2016 and 2017, the change in countrywide private carrier direct written premium is a slight increase of 0.1% • There is considerable variation in premium growth across states
2018 State of the Line Guide
Page 21
© Copyright 2018 NCCI Holdings, Inc. All Rights Reserved.
AIS201830th Anniversary© Copyright 2018 NCCI Holdings, Inc. All Rights Reserved.
WC Direct Written Premium Change by ComponentPrivate Carriers—NCCI States
Sources: Direct Written Premium Change: NAIC’s Annual Statement Statutory Page 14 for all states where NCCI provides ratemaking servicesComponents: NCCI’s Policy data
2017 vs. 2016
Payroll
Loss Cost and Mix
Carrier Discounting
Other Factors
Change in Direct Written Premium: 0.0%
-0.4%
+0.4%
-4.2%
+4.4%
Key Takeaways
• For NCCI states, private carrier direct written premium volume remained flat between 2016 and 2017 • Changes in bureau loss cost level, mix of business, and other factors served to offset the premium level increases due to changes in
payroll and carrier discounting • The Other Factors category may include changes in audit impacts, average experience mod, deductible credit types or amounts, mix of
policy types, or mix between private carrier and state fund markets

2018 State of the Line Guide
Page 22
© Copyright 2018 NCCI Holdings, Inc. All Rights Reserved.
AIS201830th Anniversary© Copyright 2018 NCCI Holdings, Inc. All Rights Reserved.
1%
2%
3%
4%
Prof. &BusinessServices
Trade,Transport.,& Utilities
Education& HealthServices
Manufac-turing
FinancialActivities
Construc-tion
Leisure & Hospitality
All Other
1%
2%
3%
4%
Prof. &BusinessServices
Trade,Transport.,& Utilities
Education& HealthServices
Manufac-turing
FinancialActivities
Construc-tion
Leisure & Hospitality
All Other
Sources: Moody’s Analytics and NCCI
+1.6%
WageRate
+3.4%
Payroll
+1.8%
Employment
Increases in Payroll Continue to Drive Changes in PremiumForecast Change 2016–2017
Key Takeaways
• The overall change in payroll (+3.4%) is driven equally by changes in average wage (+1.6%) and employment (+1.8%). • Average wages grew at an above-average rate for the Trade, Transportation, and Utilities; Financial Activities; and All Other sectors.
Employment grew at an above-average rate for the Professional and Business Services; Education and Health Services; Financial Activities; Construction; and Leisure and Hospitality sectors.
• After showing almost no growth in the previous year, employment in the Manufacturing sector resumed growth due to increases in durable goods-related manufacturing.

2018 State of the Line Guide
Page 23
© Copyright 2018 NCCI Holdings, Inc. All Rights Reserved.
AIS201830th Anniversary© Copyright 2018 NCCI Holdings, Inc. All Rights Reserved.
WC Approved Changes in Bureau Premium LevelWeighted by Effective Date—NCCI States
p PreliminarySource: NAIC’s Annual Statement Statutory Page 14Values reflect changes in average premium levels between years, based on approved changes in advisory rates, loss costs, assigned risk rates, and rating values, as of 5/10/2018IN and NC are filed in cooperation with state rating bureaus
Percent
-5.4
-9.6-10
-5
0
5
02 03 04 05 06 07 08 09 10 11 12 13 14 15 16 17 18p
Calendar Year
Key Takeaways
• The changes shown reflect several factors that impact NCCI filings, such as changes in claim frequency and severity, changes in the economy, cost containment initiatives, legislative reforms, and judicial decisions
• Written premiums are expected to decrease by an average of 9.6% from 2017 to 2018 as a result of NCCI filings

2018 State of the Line Guide
Page 24
© Copyright 2018 NCCI Holdings, Inc. All Rights Reserved.
AIS201830th Anniversary© Copyright 2018 NCCI Holdings, Inc. All Rights Reserved.
Most Recent Changes in Bureau Premium LevelVoluntary Market, Excludes Law-Only Filings
Premium level changes in advisory rates, loss costs, and rating values, as of 5/10/2018, as filed by the applicable rating organization, relative to those previously approved IN and NC are filed in cooperation with state rating bureaus
Percent
-16
.3
-16
.2
-15
.4 -14
.1
-14
.0
-13
.9
-13
.7
-13
.3
-13
.0
-12
.8
-12
.7
-12
.6
-12
.0
-11
.3
-10
.7
-10
.7
-10
.3 -9.8
-9.4 -8.7
-8.7 -7
.9
-7.6
-7.6 -7.0
-7.0 -6.4
-6.0
-5.8 -5.3 -4.6 -3
.7 -3.0
-3.0 -2.3 -1.7 -0
.9
0.4
-20
-10
0
10
OK NM AR CT OR AL TX NH MD IN CO TN ME NC IL MT WV FL UT GA IA AK KS NE SC SD AZ MS ID RI KY VT DC MO NV HI VA LA
Key Takeaway
• The most recent filings resulted in decreases for all but one NCCI state

2018 State of the Line Guide
Page 25
© Copyright 2018 NCCI Holdings, Inc. All Rights Reserved.
AIS201830th Anniversary© Copyright 2018 NCCI Holdings, Inc. All Rights Reserved.
WC Impact of Discounting on PremiumPrivate Carriers—NCCI States
p PreliminarySources: NAIC’s Annual Statement Statutory Page 14 and NCCI’s Financial Call data Rate/loss cost departure reflects carrier departure from NCCI rate level, which excludes a profit and contingency provision and expense constantBased on data for all states where NCCI provides ratemaking services, excluding TX
0.5
-25
-15
-5
5
97 98 99 00 01 02 03 04 05 06 07 08 09 10 11 12 13 14 15 16 17p
Policy Year
Percent
Key Takeaway
• The overall estimated impact of carrier discounting was 0.5% in 2017

2018 State of the Line Guide
Page 26
© Copyright 2018 NCCI Holdings, Inc. All Rights Reserved.
AIS201830th Anniversary© Copyright 2018 NCCI Holdings, Inc. All Rights Reserved.
WC Impact of Discounting on Premium by ComponentPrivate Carriers—NCCI States
p PreliminarySources: NAIC’s Annual Statement Statutory Page 14 and NCCI’s Financial Call data Dividend ratios are based on calendar year statisticsRate/loss cost departure reflects carrier departure from NCCI rate level, which excludes a profit and contingency provision and expense constantBased on data for all states where NCCI provides ratemaking services, excluding TX
97 98 99 00 01 02 03 04 05 06 07 08 09 10 11 12 13 14 15 16 17p
Policy Year
Rate/Loss Cost Departure
Schedule Rating
Dividends
Key Takeaways
• Recent years are a mix of relatively smaller dividend payouts, moderate schedule rating credits, and upward rate and loss cost departures
• Since 2002, the individual elements have been offsetting, which has led to a modest overall impact from discounting

2018 State of the Line Guide
Page 27
© Copyright 2018 NCCI Holdings, Inc. All Rights Reserved.
AIS201830th Anniversary© Copyright 2018 NCCI Holdings, Inc. All Rights Reserved.
WC Pricing—Market Index SurveyPercentage of Respondents
Sources: The Council of Insurance Agents & Brokers: Q4 P/C Market Index Surveys (2014–2017); results for “All Regions”
48%
4Q 14 4Q 15 4Q 16 4Q 17
13% 12%
Reported Increase
Reported No Change
Reported Decrease
Key Takeaway
• The percentage of respondents seeing price increases at renewal has remained consistent over the last few years

2018 State of the Line Guide
Page 28
© Copyright 2018 NCCI Holdings, Inc. All Rights Reserved.
AIS201830th Anniversary© Copyright 2018 NCCI Holdings, Inc. All Rights Reserved.
WC Pricing—Market Index SurveyPercentage of Respondents, Based on 4Q Results
2000 2001 2002 2003 2004 2005 2006 2007 2008 2009 2010 2011 2012 2013 2014 2015 2016 2017
Reported Increase
Reported No Change
Reported Decrease
2002 2012
Sources: The Council of Insurance Agents & Brokers: Q4 P/C Market Index Surveys (2000–2017); results for “All Regions”
Key Takeaways
• 2002 and 2012 coincide with the turning points in the respective underwriting cycles and the beginning of the improvement in the combined ratios
• It takes a couple years after the turning point for price decreases to become the norm

2018 State of the Line Guide
Page 29
© Copyright 2018 NCCI Holdings, Inc. All Rights Reserved.
AIS201830th Anniversary© Copyright 2018 NCCI Holdings, Inc. All Rights Reserved.
WC Combined Ratio—Underwriting Gain AchievedPrivate Carriers
p PreliminarySource: NAIC’s Annual Statement data
122
93
115
89
97 98 99 00 01 02 03 04 05 06 07 08 09 10 11 12 13 14 15 16 17p
Calendar Year
Percent
Key Takeaways
• This long-term history of workers compensation combined ratios for private carriers shows the low of 89% in Calendar Year 2017—well beneath the previous low of 93% seen in 2006
• The most recent underwriting cycle has shown a seven-year trend of improving results
2018 State of the Line Guide
Page 30
© Copyright 2018 NCCI Holdings, Inc. All Rights Reserved.
AIS201830th Anniversary© Copyright 2018 NCCI Holdings, Inc. All Rights Reserved.
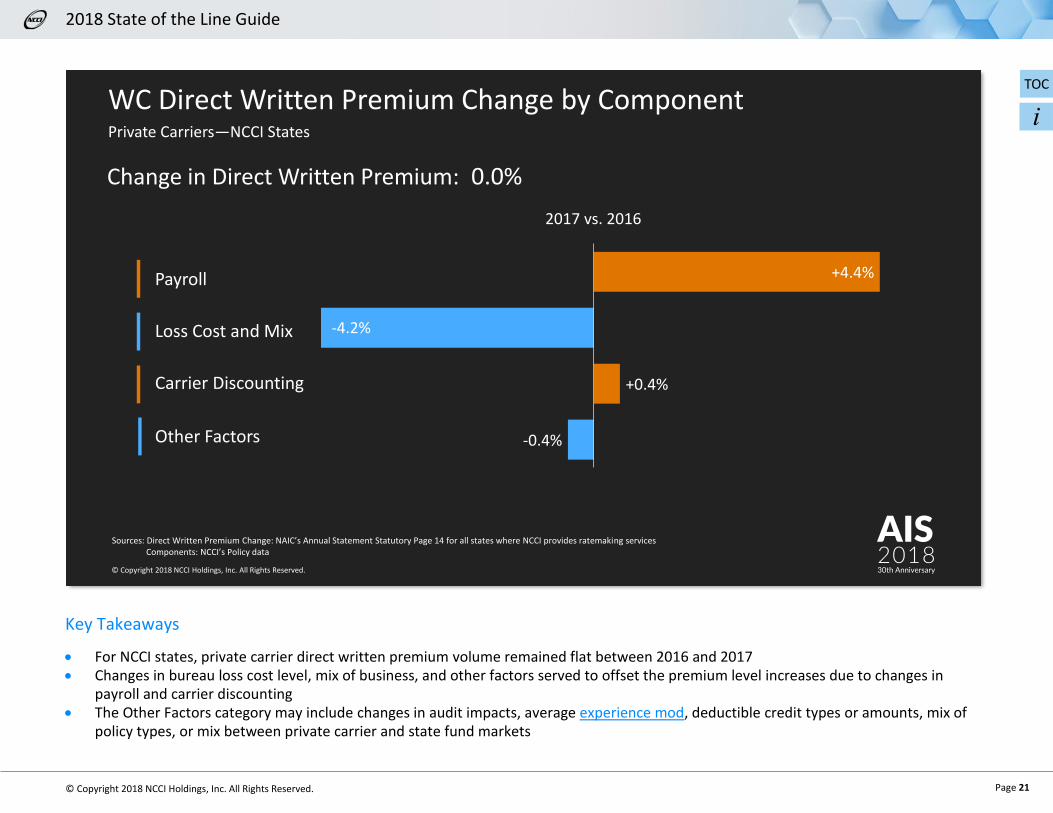
WC Combined Ratio by ComponentPrivate Carriers
p PreliminarySource: NAIC’s Annual Statement data
53 49
14 13
25 26
1 2
97 98 99 00 01 02 03 04 05 06 07 08 09 10 11 12 13 14 15 16 17p
Loss Ratio
Loss Adjustment Expense (LAE) Ratio
Underwriting Expense Ratio
Calendar Year
DividendsPercent
Key Takeaways
• The loss ratio underlying the 2017 combined ratio is the primary driver of the decrease in the combined ratio versus that for 2016 • The other components—LAE, underwriting expenses, and dividends as ratios to premium—have recently been relatively stable

2018 State of the Line Guide
Page 31
© Copyright 2018 NCCI Holdings, Inc. All Rights Reserved.
AIS201830th Anniversary© Copyright 2018 NCCI Holdings, Inc. All Rights Reserved.
WC LAE-to-Loss Ratio—Net Incurred LAE to Incurred LossesPrivate Carriers
p PreliminarySource: NAIC’s Annual Statement dataLAE includes Defense and Cost Containment Expense plus Adjusting and Other Expense
Percent
26.6 27
10
20
30
40
97 98 99 00 01 02 03 04 05 06 07 08 09 10 11 12 13 14 15 16 17p
Calendar Year
Key Takeaways
• LAE as a ratio to incurred losses has generally increased over time • In recent years, the ratio has been slightly higher—likely resulting from favorable loss experience

2018 State of the Line Guide
Page 32
© Copyright 2018 NCCI Holdings, Inc. All Rights Reserved.
AIS201830th Anniversary© Copyright 2018 NCCI Holdings, Inc. All Rights Reserved.
WC Residual Market Combined RatioNCCI-Serviced WC Residual Market Pools
p Preliminary, incomplete policy year projected to ultimateIncludes Pool data and Plan expenses for pool members for all NCCI-serviced WC Residual Market Pool states, valued as of 12/31/2017Tennessee Reinsurance Mechanism experience is not included in the combined ratiosSource: NCCI’s Residual Market Quarterly Results
Percent
4% lower
106
98
25
50
75
100
125
97 98 99 00 01 02 03 04 05 06 07 08 09 10 11 12 13 14 15 16 17p
Policy Year
Key Takeaways
• The residual market combined ratio for Policy Year 2017 is preliminary and based on an incomplete year • The 2016 combined ratio of 98% is more mature and likely more representative of that year’s pool results

2018 State of the Line Guide
Page 33
© Copyright 2018 NCCI Holdings, Inc. All Rights Reserved.
AIS201830th Anniversary© Copyright 2018 NCCI Holdings, Inc. All Rights Reserved.
p PreliminarySource: NAIC’s Annual Statement dataInvestment Gain on Insurance Transactions includes Other Income2013 is adjusted to exclude a material realized gain resulting from a single company transaction that involved corporate restructuring; unadjusted value is 19.4
Average (1997–2016): 13.2%
Percent
WC Investment Gain on Insurance TransactionsRatio to Net Earned Premium, Private Carriers
10.812
5
10
15
20
25
97 98 99 00 01 02 03 04 05 06 07 08 09 10 11 12 13 14 15 16 17p
Calendar Year
Key Takeaways
• The investment gain on insurance transactions increased slightly to 12% in 2017 • The latest gain remains below the long-term average of 13.2%, but consistent with the results for the most recent few years

2018 State of the Line Guide
Page 34
© Copyright 2018 NCCI Holdings, Inc. All Rights Reserved.
AIS201830th Anniversary© Copyright 2018 NCCI Holdings, Inc. All Rights Reserved.
WC Pretax Operating GainPrivate Carriers
p PreliminarySource: NAIC’s Annual Statement dataOperating Gain equals 1.00 minus (Combined Ratio less Investment Gain on Insurance Transactions and Other Income)2013 is adjusted to exclude a material realized gain resulting from a single company transaction that involved corporate restructuring; unadjusted value is 17.7
16.9
23
-15
-10
-5
0
5
10
15
20
25
97 98 99 00 01 02 03 04 05 06 07 08 09 10 11 12 13 14 15 16 17p
Calendar Year
Average (1997–2016): 6.9%
Percent
Key Takeaways
• The combined ratio of 89%, paired with a 12-point investment gain on insurance transactions, resulted in a 23-point pretax operating gain in 2017
• Underwriting gains due to the improvement in the loss ratios have driven the increase in the recent years’ operating gains

2018 State of the Line Guide
Page 35
© Copyright 2018 NCCI Holdings, Inc. All Rights Reserved.
AIS201830th Anniversary© Copyright 2018 NCCI Holdings, Inc. All Rights Reserved.
Social Security Disability Insurance and Workers CompensationThe idea of a “race to the bottom” is not borne out by the facts
Dual RecipientsInteraction of Coverages
Most states did not reduce WCbenefits in the last 15 years.
In states that did lower WC benefits, SSDI applicationstypically decreased following these reforms.
Observed increases in SSDI applications were impacted much more by the Great Recession than by WC benefit levels.
Cost shifting may serve to realign practices and/or to bring costs back in line with the original intent of a program, whether that program is WC, SSDI, or Medicare.
WC SSDI
SSDI and WC work together to provide benefits to dual recipients.While workers receive dual benefits, WC generally shoulders the majority of the cost.
Sources: “Social Security Disability Insurance and Workers Compensation Cost Shifting” and “Social Security Disability Insurance and Workers Compensation” on ncci.com
Key Takeaways
• NCCI’s research has shown that most states did not reduce WC indemnity benefits from 2000 to 2015 • Observed increases in SSDI applications by state were impacted far more by the Great Recession than by WC benefit levels • When the work injury involves permanent total disability, WC generally shoulders the majority of the cost (in standard offset states)

2018 State of the Line Guide
Page 36
© Copyright 2018 NCCI Holdings, Inc. All Rights Reserved.
AIS201830th Anniversary© Copyright 2018 NCCI Holdings, Inc. All Rights Reserved.
p PreliminarySource: NAIC’s Annual Statement dataAccident Year information is reported as of 12/31/2017Includes dividends to policyholders
9489
9599
25
50
75
100
125
2008 2009 2010 2011 2012 2013 2014 2015 2016 2017p
Calendar Year Accident YearPercent
WC Net Combined Ratios—Calendar Year vs. Accident Year As ReportedPrivate Carriers
Key Takeaways
• The AY 2017 net combined ratio is 99% (4 points higher than AY 2016) • While the AY 2017 combined ratio is currently higher than the corresponding CY 2017 value, NCCI expects AY 2017 to develop favorably
over time

2018 State of the Line Guide
Page 37
© Copyright 2018 NCCI Holdings, Inc. All Rights Reserved.
AIS201830th Anniversary© Copyright 2018 NCCI Holdings, Inc. All Rights Reserved.
9599
89 91
25
50
75
100
125
2008 2009 2010 2011 2012 2013 2014 2015 2016 2017
Accident Year
NCCI Selections As ReportedPercent
WC Net Combined Ratios—NCCI’s Accident Year Selections vs. As ReportedPrivate Carriers
Sources: As Reported: NAIC’s Annual Statement Schedule P—Part 1D data as of 12/31/2017NCCI Selections: NCCI’s analysis based on NAIC’s Annual Statement data
Key Takeaway
• For the years shown on this chart, NCCI’s selections suggest that experience for the most recent AYs will develop favorably over time, and the opposite will occur for the relatively older AYs
2018 State of the Line Guide
Page 38
© Copyright 2018 NCCI Holdings, Inc. All Rights Reserved.
AIS201830th Anniversary© Copyright 2018 NCCI Holdings, Inc. All Rights Reserved.
Percent
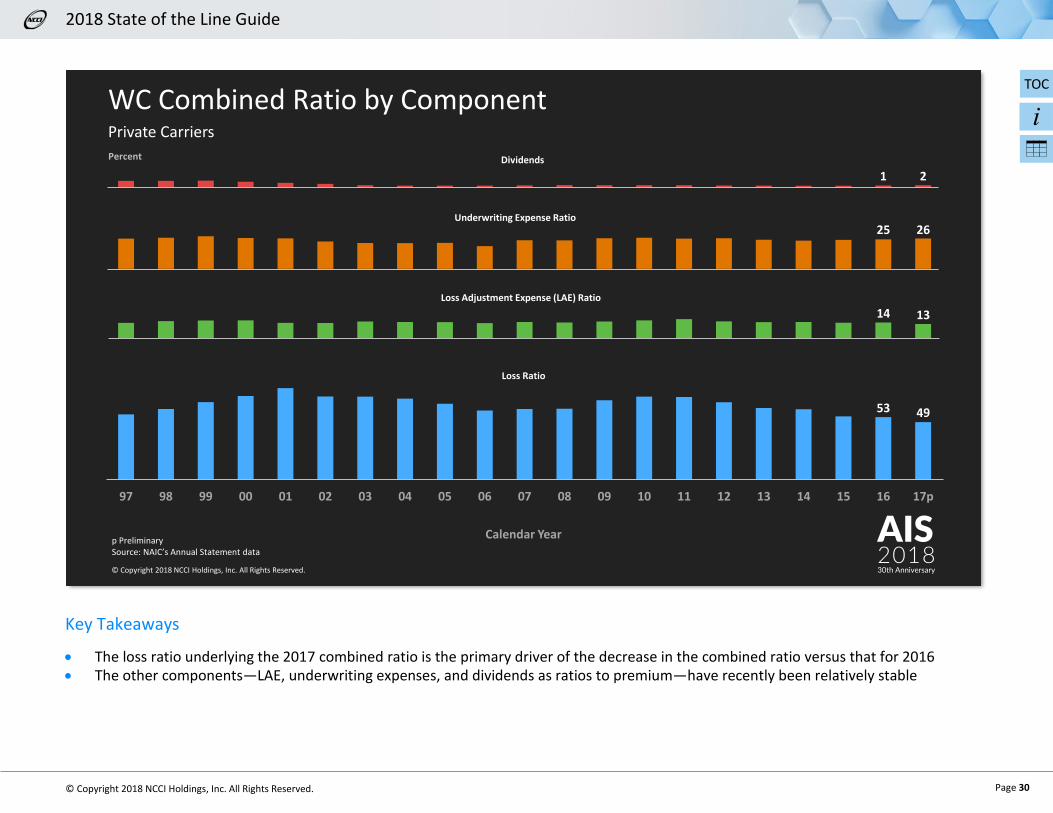
62 6369
72
0
25
50
75
100
Accident Year
NCCI Selections As Reported
Deficiences Redundancies
2008 2009 2010 2011 2012 20172013 2014 2015 2016
WC Net Loss and LAE Ratios—NCCI’s Accident Year Selections vs. As Reported Private Carriers
Sources: As Reported: NAIC’s Annual Statement Schedule P—Part 1D data as of 12/31/2017NCCI Selections: NCCI’s analysis based on NAIC’s Annual Statement data
As Reported Loss and LAE ratios are net of tabular reserve discounts and gross of nontabular reserve discounts
Key Takeaways
• Loss and LAE ratios result after removing the expense components from the combined ratios • The largest difference between NCCI Selections and the As Reported values is in AY 2017, contributing to the decrease in the overall
estimated reserve deficiency

2018 State of the Line Guide
Page 39
© Copyright 2018 NCCI Holdings, Inc. All Rights Reserved.
AIS201830th Anniversary© Copyright 2018 NCCI Holdings, Inc. All Rights Reserved.
Source: NCCI’s analysis based on NAIC’s Annual Statement Schedule P—Part 1D data at year-end valuationsConsiders all reserve discounts as deficiencies
2017 Tabular Discount Is $4.3 Billion(33% of CY Total Reserves)
(1% of CY Total Reserves)
$ Billions
WC Net Loss and LAE Reserve DeficienciesPrivate Carriers
21
5
1
5
10
15
20
25
97 98 99 00 01 02 03 04 05 06 07 08 09 10 11 12 13 14 15 16 17
Year-End Valuation
Key Takeaways
• NCCI’s estimate of the 2017 overall reserve deficiency is $1 billion, which is $4 billion less than that for year-end 2016. • NCCI’s estimate of the overall reserve deficiency reflects tabular discounts as deficiencies. For year-end 2017, since tabular discounts
represent $4.3 billion, industry reserves net of tabular discounts may be considered redundant.

2018 State of the Line Guide
Page 40
© Copyright 2018 NCCI Holdings, Inc. All Rights Reserved.
AIS201830th Anniversary© Copyright 2018 NCCI Holdings, Inc. All Rights Reserved.
Source: NAIC’s Annual Statement Schedule P—Part 1D data at year-end valuationsAs Reported Loss and LAE ratios are net of tabular reserve discounts and gross of nontabular reserve discounts
76 787272
Percent
2008 2009 2010 2011 2012 20172013 2014 2015 2016
Years with deficiencies have developed upward over time
Years with redundancies have developed downward over time
Change Between 1st and Current Report
Accident Year
Emergence of Reported WC Net Loss and LAE RatiosPrivate Carriers
Key Takeaways
• The reported net loss and LAE ratios for AYs 2008–2011 have either increased or remained level since 1st report • NCCI expects the reported net loss and LAE ratios for AYs 2013–2017 to further decline over time

2018 State of the Line Guide
Page 41
© Copyright 2018 NCCI Holdings, Inc. All Rights Reserved.
AIS201830th Anniversary© Copyright 2018 NCCI Holdings, Inc. All Rights Reserved.
2010 and 2011 adjusted primarily for significant changes in audit activityp Preliminary, based on data valued as of 12/31/2017Source: NCCI’s Financial Call data, developed to ultimate, premium adjusted to current wage and voluntary pure premium level, excludes high-deductible policies;
based on data through 12/31/2016 Values displayed reflect the methodology underlying the most recent rate/loss cost filingIncludes all states where NCCI provides ratemaking services; WV is excluded through 2011
-6.2 -6
-10
-5
0
5
97 98 99 00 01 02 03 04 05 06 07 08 09 10 11 12 13 14 15 16 17p
Accident Year
Average Annual Change: –3.7%(1997–2016)
Percent
WC Lost-Time Claim FrequencyClaims per $1M Pure Premium, Private Carriers and State Funds—NCCI States
Key Takeaways
• NCCI estimates a –6% claim frequency change between AYs 2016 and 2017 • The long-term average annual change in lost-time claim frequency is –3.7%

2018 State of the Line Guide
Page 42
© Copyright 2018 NCCI Holdings, Inc. All Rights Reserved.
AIS201830th Anniversary© Copyright 2018 NCCI Holdings, Inc. All Rights Reserved.
WC Lost-Time Claim Frequency
Average Annual Change 2012–2016Average Annual Change 1992–1996
Source: NCCI’s Financial Call data, developed to ultimate, premium adjusted to current wage and voluntary pure premium level, excludes high-deductible policies; based on data through 12/31/2016
Values displayed reflect the methodology underlying the most recent rate/loss cost filingIncludes all states where NCCI provides ratemaking services
+10%–10%
Key Takeaways
• The average annual change for AYs 1992–1996 was –4.8% compared to –4.5% for AYs 2012–2016 • Declines in claim frequency have been occurring for decades

2018 State of the Line Guide
Page 43
© Copyright 2018 NCCI Holdings, Inc. All Rights Reserved.
AIS201830th Anniversary© Copyright 2018 NCCI Holdings, Inc. All Rights Reserved.
NCCI and BLS Measures of Lost-Time Claim FrequencyIndex 1981 = 100
25
50
75
100
125
1981 1986 1991 1996 2001 2006 2011 2016
NCCI
BLS
Sources: US Bureau of Labor Statistics (BLS); incidence rate for total private industry; injury and illness cases involving days away from workNCCI’s Frequency and Severity Analyses; lost-time claims based on the states where NCCI provides ratemaking services, including state funds; excludes high-deductible policies
Key Takeaway
• The trend in BLS incidence rates closely tracks NCCI’s frequency values

2018 State of the Line Guide
Page 44
© Copyright 2018 NCCI Holdings, Inc. All Rights Reserved.
AIS201830th Anniversary© Copyright 2018 NCCI Holdings, Inc. All Rights Reserved.
250,000
500,000
750,000
1,000,000
Under10K
10K–20K
20K–30K
30K–40K
40K–50K
50K–60K
60K–70K
70K–80K
80K–90K
90K–100K
100K–110K
110K–120K
120K–130K
130K–140K
140K–150K
150K–160K
160K–170K
170K–180K
180K–190K
190K–200K
200K–210K
210K–220K
220K–230K
230K–240K
240K–250K
Number of Lost-Time Claims
Claim Size Range ($)
500
1,000
1,500
2,000
2,500
1M–3M 3M–5M 5M–7M 7M–9M 9M–11M Over 11M
Distribution of Lost-Time Claims by Size
Claims over $1Maccount for less than0.5% of counts, but contribute 7% to losses.
Claims less than the average size account for 75% of counts, but contribute25% to losses.
Source: NCCI’s Unit Statistical Plan data; includes data for policies expiring between 2010 and 2015Includes all states where NCCI provides ratemaking services
Key Takeaways
• The majority of lost-time claims, approximately 75%, cost less than the average claim amount of $40K • Although claims over $1M make up less than 0.5% of claim counts, they account for 7% of total claim dollars

2018 State of the Line Guide
Page 45
© Copyright 2018 NCCI Holdings, Inc. All Rights Reserved.
AIS201830th Anniversary© Copyright 2018 NCCI Holdings, Inc. All Rights Reserved.
Changes in Lost-Time Claims by SizeNumber of Lost-Time Claims
0
300
01 02 03 04 05 06 07 08 09 10 11 12 13 14 15
Accident Year
$1M–$2M $2M–$5M Over $5M
Over the last 15 years, the number of claims under $1M has continued to decline, while the observed changes in larger claim sizes have been relatively more volatile
200K
350K
Under $1M
Source: NCCI’s Financial Call data at 2nd report by Accident YearIncludes all states where NCCI provides ratemaking services, excluding TX and WV
Key Takeaway
• The number of claims less than $1M have generally exhibited a declining pattern, while the number of claims exceeding that dollar amount have been relatively more volatile over time

2018 State of the Line Guide
Page 46
© Copyright 2018 NCCI Holdings, Inc. All Rights Reserved.
AIS201830th Anniversary© Copyright 2018 NCCI Holdings, Inc. All Rights Reserved.
Indemnity Data Call (IDC)Implementation Timeline
2018
Approved by NCCI’s Board of Directors
Release of IDC Implementation Guide and Webinar
Updates available on ncci.com
Data Educational Program to include IDC classes
First IDC Reporting Deadline
2019 2020
Start of IDC Collection
Source: NCCI Circular IND-2018-02 “Indemnity Data Call—New Indemnity Data Call Resources—Available on ncci.com”
Key Takeaways
• The Indemnity Data Call was approved by the NCCI Board of Directors in January 2018 • The IDC Implementation Guide and webinar were released in April • By the second quarter of 2020, carriers should be collecting IDC data, with the first reporting due to NCCI by the third quarter of that
year

2018 State of the Line Guide
Page 47
© Copyright 2018 NCCI Holdings, Inc. All Rights Reserved.
AIS201830th Anniversary© Copyright 2018 NCCI Holdings, Inc. All Rights Reserved.
p Preliminary, based on data valued as of 12/31/2017Sources: Severity: NCCI’s Financial Call data, developed to ultimate, excludes high-deductible policies; based on data through 12/31/2016
Values displayed reflect the methodology underlying the most recent rate/loss cost filingIncludes all states where NCCI provides ratemaking services; WV is excluded through 2007
$2
3.4
$2
4.4
2.7%4%
5
10
15
20
25
97 98 99 00 01 02 03 04 05 06 07 08 09 10 11 12 13 14 15 16 17p
Accident Year
Severity($ Thousands)
WC Average Indemnity Claim SeverityPrivate Carriers and State Funds—NCCI States
Key Takeaway
• NCCI estimates that the average indemnity cost per claim for AY 2017 will be about 4% higher than that for AY 2016
2018 State of the Line Guide
Page 48
© Copyright 2018 NCCI Holdings, Inc. All Rights Reserved.
AIS201830th Anniversary© Copyright 2018 NCCI Holdings, Inc. All Rights Reserved.
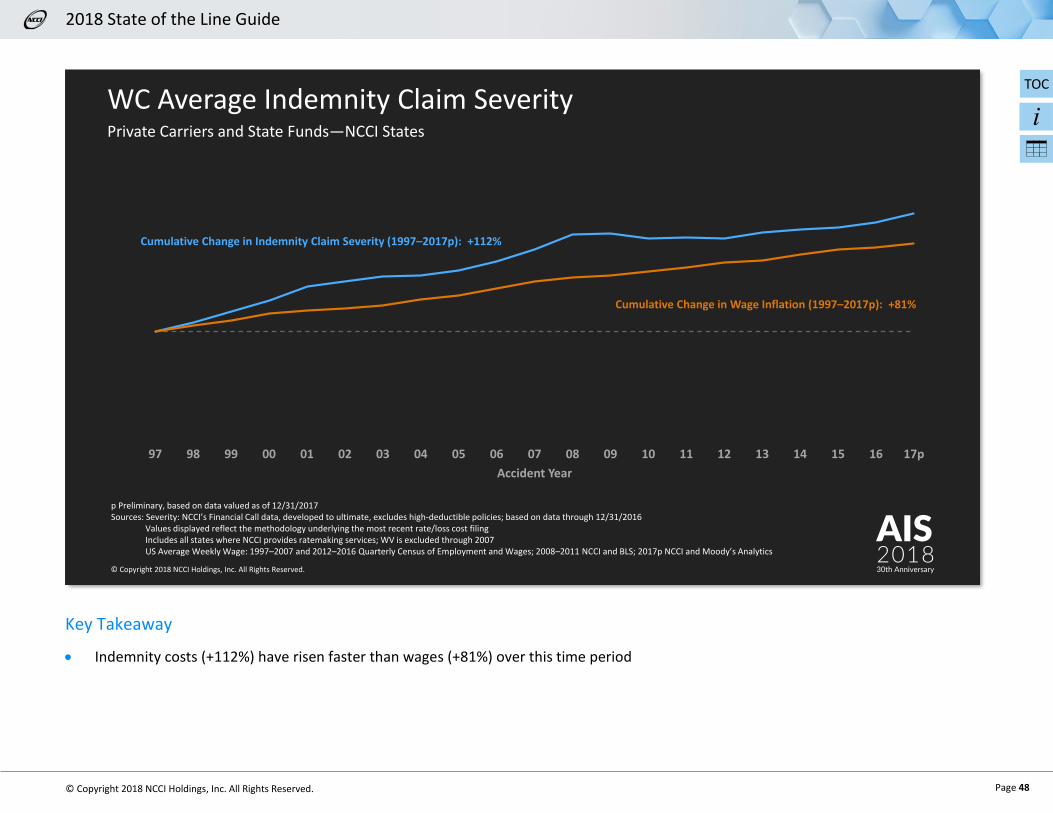
p Preliminary, based on data valued as of 12/31/2017Sources: Severity: NCCI’s Financial Call data, developed to ultimate, excludes high-deductible policies; based on data through 12/31/2016
Values displayed reflect the methodology underlying the most recent rate/loss cost filingIncludes all states where NCCI provides ratemaking services; WV is excluded through 2007US Average Weekly Wage: 1997–2007 and 2012–2016 Quarterly Census of Employment and Wages; 2008–2011 NCCI and BLS; 2017p NCCI and Moody’s Analytics
97 98 99 00 01 02 03 04 05 06 07 08 09 10 11 12 13 14 15 16 17p
Accident Year
Cumulative Change in Indemnity Claim Severity (1997–2017p): +112%
Cumulative Change in Wage Inflation (1997–2017p): +81%
WC Average Indemnity Claim SeverityPrivate Carriers and State Funds—NCCI States
Key Takeaway
• Indemnity costs (+112%) have risen faster than wages (+81%) over this time period

2018 State of the Line Guide
Page 49
© Copyright 2018 NCCI Holdings, Inc. All Rights Reserved.
AIS201830th Anniversary© Copyright 2018 NCCI Holdings, Inc. All Rights Reserved.
97 98 99 00 01 02 03 04 05 06 07 07 08 09 10 11 12 13 14 15 16 17p
Accident Year Accident Year
p Preliminary, based on data valued as of 12/31/2017Sources: Severity: NCCI’s Financial Call data, developed to ultimate, excludes high-deductible policies; based on data through 12/31/2016
Values displayed reflect the methodology underlying the most recent rate/loss cost filingIncludes all states where NCCI provides ratemaking services; WV is excluded through 2007US Average Weekly Wage: 1997–2007 and 2012–2016 Quarterly Census of Employment and Wages; 2008–2011 NCCI and BLS; 2017p NCCI and Moody’s Analytics
Changes in indemnity claim severity outpaced changes in wage inflation by 1.9% per year, on average
Indemnity claim severity and wagesgrew at a similar rate
Relative Growth Rates—Indemnity Severity vs. Wage InflationPrivate Carriers and State Funds—NCCI States
Key Takeaways
• The majority of the gap between the cumulative changes in indemnity claim severity and wages arises from years prior to 2007 • Since 2007, indemnity severity and wages have grown at approximately the same rate

2018 State of the Line Guide
Page 50
© Copyright 2018 NCCI Holdings, Inc. All Rights Reserved.
AIS201830th Anniversary© Copyright 2018 NCCI Holdings, Inc. All Rights Reserved.
WC Average Indemnity Claim SeverityAverage Annual Change 2012–2016, Private Carriers and State Funds—NCCI States
Source: NCCI’s Financial Call data, developed to ultimate, excludes high-deductible policies; based on data through 12/31/2016Values displayed reflect the methodology underlying the most recent rate/loss cost filingIncludes all states where NCCI provides ratemaking services
+10%
–10%
Key Takeaways
• The average annual change in indemnity severity from 2012 to 2016 is +1.8% • Observed decreases in Oklahoma and Tennessee may be attributable to reforms in these states that lowered indemnity benefits • The Alaska increase is driven by large claim activity in 2016

2018 State of the Line Guide
Page 51
© Copyright 2018 NCCI Holdings, Inc. All Rights Reserved.
AIS201830th Anniversary© Copyright 2018 NCCI Holdings, Inc. All Rights Reserved.
p Preliminary, based on data valued as of 12/31/2017Source: NCCI’s Financial Call data, developed to ultimate, excludes high-deductible policies; based on data through 12/31/2016Values displayed reflect the methodology underlying the most recent rate/loss cost filingIncludes all states where NCCI provides ratemaking services; WV is excluded through 2007
$2
8.8
$2
9.9
6.0%4%
5
10
15
20
25
30
97 98 99 00 01 02 03 04 05 06 07 08 09 10 11 12 13 14 15 16 17p
Accident Year
Severity($ Thousands)
WC Average Medical Lost-Time Claim SeverityPrivate Carriers and State Funds—NCCI States
Key Takeaway
• NCCI estimates that the AY 2017 average medical lost-time claim severity is 4% higher than the corresponding AY 2016 value

2018 State of the Line Guide
Page 52
© Copyright 2018 NCCI Holdings, Inc. All Rights Reserved.
AIS201830th Anniversary© Copyright 2018 NCCI Holdings, Inc. All Rights Reserved.
WC Average Medical Lost-Time Claim SeverityPrivate Carriers and State Funds—NCCI States
p Preliminary, based on data valued as of 12/31/2017Sources: Severity: NCCI’s Financial Call data, developed to ultimate, excludes high-deductible policies; based on data through 12/31/2016
Values displayed reflect the methodology underlying the most recent rate/loss cost filingIncludes all states where NCCI provides ratemaking services; WV is excluded through 2007Personal Health Care (PHC) Chain-Weighted Price Index: Centers for Medicare & Medicaid Services
97 98 99 00 01 02 03 04 05 06 07 08 09 10 11 12 13 14 15 16 17p
Accident Year
Cumulative Change in Medical Lost-Time Claim Severity (1997–2017p): +175%
Cumulative Change in the Personal Health Care Chain-Weighted Price Index (1997–2017p): +61%
Key Takeaway
• Medical lost-time claim costs have risen faster (+175%) than the PHC index (+61%) over the period displayed, with the majority of the gap occurring in prerecession years

2018 State of the Line Guide
Page 53
© Copyright 2018 NCCI Holdings, Inc. All Rights Reserved.
AIS201830th Anniversary© Copyright 2018 NCCI Holdings, Inc. All Rights Reserved.
p Preliminary, based on data valued as of 12/31/2017Sources: Severity: NCCI’s Financial Call data, developed to ultimate, excludes high-deductible policies; based on data through 12/31/2016
Values displayed reflect the methodology underlying the most recent rate/loss cost filingIncludes all states where NCCI provides ratemaking services; WV is excluded through 2007Personal Health Care (PHC) Chain-Weighted Price Index: Centers for Medicare & Medicaid Services
97 98 99 00 01 02 03 04 05 06 07 07 08 09 10 11 12 13 14 15 16 17p
Accident Year
Medical lost-time claim severity grew approximately 4.5% per year faster than medical care prices
Change in Medical lost-time claim severity and medical care prices tracked one another
Accident Year
Relative Growth Rates—Medical Severity vs. Price InflationPrivate Carriers and State Funds—NCCI States
Key Takeaways
• Similar to indemnity, the majority of the gap between the cumulative changes in medical lost-time claim severity and the PHC index since 1997 arises from years prior to 2007
• Since 2007, medical lost-time claim severity and medical care prices have grown at approximately the same rate

2018 State of the Line Guide
Page 54
© Copyright 2018 NCCI Holdings, Inc. All Rights Reserved.
AIS201830th Anniversary© Copyright 2018 NCCI Holdings, Inc. All Rights Reserved.
WC Average Medical Lost-Time Claim SeverityAverage Annual Change 2012–2016, Private Carriers and State Funds—NCCI States
Source: NCCI’s Financial Call data, developed to ultimate, excludes high-deductible policies; based on data through 12/31/2016Values displayed reflect the methodology underlying the most recent rate/loss cost filingIncludes all states where NCCI provides ratemaking services
+10%
–10%
Key Takeaways
• The average annual change in medical lost-time claim severity was +2.3% from 2012 to 2016 • The increase in Nevada is due to a very large claim occurring in 2016 • The decrease in North Carolina is driven by the combination of large claim activity in 2012 and medical fee schedule changes in 2013 and
2015

2018 State of the Line Guide
Page 55
© Copyright 2018 NCCI Holdings, Inc. All Rights Reserved.
AIS201830th Anniversary© Copyright 2018 NCCI Holdings, Inc. All Rights Reserved.
Utilization of OpioidsThe Decline in Prescribed Opioids in Workers Compensation
2012 2016
In 2012, approximately 55% of WC claimants with a prescription were prescribed an opioid
By 2016, that share decreased to about 45%
Source: NCCI’s Medical Data Call, Service Years 2012 and 2016
Key Takeaways
• Research utilizing NCCI’s Medical Data Call compared opioid use in WC claimants that received a prescription of any kind in Service Years 2012 and 2016.
• Approximately 55% of those claimants were prescribed an opioid in 2012. By 2016, that share had decreased to about 45%.

2018 State of the Line Guide
Page 56
© Copyright 2018 NCCI Holdings, Inc. All Rights Reserved.
BACKGROUND AND DATA SOURCES SLIDE 1: P/C INDUSTRY NET WRITTEN PREMIUM GROWTH
Background
The net written premium in this slide provides a measure of the size of each major line of business in the property/casualty (P/C) insurance industry.
Data Sources
• National Association of Insurance Commissioners’ (NAIC’s) Annual Statement data for individual carriers prior to consolidation of affiliated carriers
• Insurance Expense Exhibit Part II—Allocation to Lines of Business Net of Reinsurance
The value for the most recent year is preliminary because additional data submissions may still be received by the NAIC.
SLIDE 2: P/C INDUSTRY NET COMBINED RATIO
Background
The calendar year combined ratios in this slide measure the overall performance of each line of business and the P/C industry as a whole, prior to the consideration of investment and other income. A combined ratio is the sum of the loss ratio, the loss adjustment expense (LAE) ratio, the dividend ratio, and the underwriting expense ratio. The loss, LAE, and dividend ratios are calculated as ratios to earned premium. The underwriting expense ratio is calculated as a ratio to written premium to provide a better match of the timing of the numerator and denominator.
Data Sources
• National Association of Insurance Commissioners’ (NAIC’s) Annual Statement data for individual carriers prior to consolidation of affiliated carriers
• Insurance Expense Exhibit Part II—Allocation to Lines of Business Net of Reinsurance
The value for the most recent year is preliminary because additional data submissions may still be received by the NAIC.

2018 State of the Line Guide
Page 57
© Copyright 2018 NCCI Holdings, Inc. All Rights Reserved.
SLIDE 3: IMPACT OF CATASTROPHES ON P/C LOSSES
Background
This slide summarizes the impact on P/C industry losses due to natural catastrophes in the United States in 2017.
Data Source
• Willis Re Summary of Natural Cat Events 2017
SLIDE 4: P/C INDUSTRY NET COMBINED RATIO (BY YEAR)
Background
This slide displays a longer history of the combined ratios for the total P/C industry. See the background section of Slide 2 for more information.
Data Sources
• NAIC’s Annual Statement data: 1997–2007 and 2012–2017p • ISO: 2008–2011
The value for the most recent year is preliminary because additional data submissions may still be received by the NAIC.

2018 State of the Line Guide
Page 58
© Copyright 2018 NCCI Holdings, Inc. All Rights Reserved.
SLIDE 5: P/C INDUSTRY INVESTMENT GAIN RATIO
Background
The investment gain ratio includes both realized capital gains and net investment income.
The investment gain ratio measures the investment performance of the P/C industry by comparing investment income to earned premium, the primary source of investment funds for insurance carriers.
Data Sources
• NAIC’s Annual Statement data: 1997–2007 and 2013–2017p • ISO: 2008–2012
The value for the most recent year is preliminary because additional data submissions may still be received by the NAIC.
SLIDE 6: P/C INDUSTRY BOND EMBEDDED YIELD AND NEW
MONEY YIELD
Background
Embedded Yield is the reported pretax investment income, excluding capital gains, for bond instruments held by P/C insurers divided by the asset value of those instruments. Embedded Yield is derived from accounting data as reported. It includes investment income both from (old) bonds owned at the beginning of each year and (new) bonds acquired during the year.
New Money Yield is the pretax yield for a bond portfolio containing similar securities and maturities, but whose yields reflect current bond prices.
The gray bars in the graph indicate periods of recession in the United States.
Data Sources
• Embedded Yield is based on data from A.M. Best’s Aggregates & Averages
• New Money Yield is based on data from A.M. Best’s Aggregates & Averages, the Federal Reserve Bank, Value Line, TreasuryDirect.gov, Barron’s, and Bloomberg

2018 State of the Line Guide
Page 59
© Copyright 2018 NCCI Holdings, Inc. All Rights Reserved.
SLIDE 7: P/C INDUSTRY AFTER-TAX RETURN ON SURPLUS
Background
The after-tax return on surplus compares net income generated from all sources to policyholder surplus. Since surplus varies throughout the year as income is earned, the return is calculated as the ratio of net income to the average of the surplus at the beginning of the year and end of the year. The return on surplus tends to follow the ebb and flow of the underwriting cycle.
Data Sources
• NAIC’s Annual Statement data: 1997–2007 and 2013–2017p • ISO: 2008–2012
The value for the most recent year is preliminary because additional data submissions may still be received by the NAIC.
SLIDE 8: P/C INDUSTRY PREMIUM-TO-SURPLUS RATIO
Background
The premium-to-surplus ratio is one measure that can be used to help determine whether there is sufficient policyholder surplus to support the P/C insurance industry’s writings.
Data Sources
• NAIC’s Annual Statement data: 1997–2007 and 2013–2017p • ISO: 2008–2012
The value for the most recent year is preliminary because additional data submissions may still be received by the NAIC.
2018 State of the Line Guide
Page 60
© Copyright 2018 NCCI Holdings, Inc. All Rights Reserved.
SLIDE 9: WC NET WRITTEN PREMIUM
Background
This slide exhibits workers compensation (WC) net written premium by year, separately for private carriers and state funds.
In the context of the State of the Line presentation, NCCI’s definition of state funds includes only those carriers that are both members of the American Association of State Compensation Insurance Funds and largely exempt from paying federal income taxes. All other carriers are included in the private carrier values.
Data Sources
• NAIC’s Annual Statement data • Insurance Expense Exhibit Part II—Allocation to Lines of
Business Net of Reinsurance
The value for the most recent year is preliminary because additional data submissions may still be received by the NAIC.
SLIDE 10: PROPORTION OF TOTAL WC PREMIUM CEDED
Background
This slide highlights the relative rates of growth between Direct and Assumed (D&A) and ceded earned premium.
Data Source
• NAIC’s Annual Statement data, Schedule P, Part 1D—Workers Compensation

2018 State of the Line Guide
Page 61
© Copyright 2018 NCCI Holdings, Inc. All Rights Reserved.
SLIDE 11: WC RESIDUAL MARKET PREMIUM
Background
Insureds unable to obtain coverage in the voluntary market can secure coverage through the Residual Market Pool in participating states. The estimated ultimate premium for all Residual Market Pools serviced by NCCI is displayed by policy year.
Data Sources
• Pool data for all NCCI-serviced WC Residual Market Pool states, valued as of 12/31/2017
• Tennessee Reinsurance Mechanism premium is not included • NCCI’s Residual Market Quarterly Results
SLIDE 12: WC RESIDUAL MARKET—CHANGES IN PREMIUM VS. AVERAGE POLICY SIZE
Background
The residual market total estimated annual premium and average policy size are displayed by policy year.
Data Source
• Pool and direct assignment data for all NCCI-administered WC Residual Market Plan states, including the prorated premium of cancelled policies

2018 State of the Line Guide
Page 62
© Copyright 2018 NCCI Holdings, Inc. All Rights Reserved.
SLIDE 13: WC RESIDUAL MARKET PREMIUM BY SIZE OF RISK
Background
This slide compares estimated residual market premium volumes by size of risk between the first quarters of 2017 and 2018.
Data Source
• Pool and direct assignment data for all NCCI-administered WC Residual Market Plan states, including the prorated premium of cancelled policies
SLIDE 14: WC RESIDUAL MARKET SHARE
Background
Pool and direct assignment premium for all NCCI-serviced Residual Market Pool states as a percentage of total WC market premium is displayed by calendar year.
Data Sources
• Pool and direct assignment data for all NCCI-serviced WC Residual Market Pool states valued as of 12/31/2017
• NCCI’s Residual Market Management Summary

2018 State of the Line Guide
Page 63
© Copyright 2018 NCCI Holdings, Inc. All Rights Reserved.
SLIDE 15: TOP FIVE RESIDUAL MARKET CLASS CODES
Background
The top five residual market class codes are based on Policy Year 2017 estimated written premium in the residual market, excluding Standard Exception classifications, for all states in which NCCI provides ratemaking services except Texas.
Data Source
• NCCI’s Policy data
SLIDE 16: WC DIRECT WRITTEN PREMIUM CHANGE—2017
Background
Underlying the change in countrywide direct written premium volume are the changes in premium volume by individual jurisdiction. These percentage changes are based on private carrier data only and exclude monopolistic fund states. Teal represents premium volume increases, while red represents premium volume decreases. The deeper colors represent larger magnitudes of change.
Data Source
• NAIC’s Annual Statement Statutory Page 14 for calendar year written premium by state

2018 State of the Line Guide
Page 64
© Copyright 2018 NCCI Holdings, Inc. All Rights Reserved.
SLIDE 17: WC DIRECT WRITTEN PREMIUM CHANGE BY
COMPONENT
Background
This slide provides the major components impacting the overall change in private carrier direct written premium (DWP) for all states where NCCI provides ratemaking services.
Data Sources
• DWP Change: NAIC’s Annual Statement Statutory Page 14 • Components: NCCI’s Policy data
SLIDE 18: INCREASES IN PAYROLL CONTINUE TO DRIVE CHANGES IN
PREMIUM
Background
Since payroll is the major driver of premium growth, we can use Moody’s forecasts to analyze it further. Although the +3.4% growth in payroll shown on this slide does not match the +4.4% change shown on the prior slide due to differing underlying data sources, the detail from Moody’s helps explain the underlying components of the payroll growth.
The bottom of the slide contains the changes in average wages and employment by economic sector. The sectors are listed by size of total payroll, with the largest sector shown at the left. The respective white lines represent the average growth rates for wages and employment.
Data Sources
• Moody’s Analytics • NCCI • All Other includes the three smallest sectors: Natural
Resources and Mining, Information, and Other Services

2018 State of the Line Guide
Page 65
© Copyright 2018 NCCI Holdings, Inc. All Rights Reserved.
SLIDE 19: WC APPROVED CHANGES IN BUREAU PREMIUM LEVEL
Background
The bureau premium level changes shown here reflect the approved changes in advisory rates, loss costs, and assigned risk rates as filed in jurisdictions where NCCI provides ratemaking services as of May 10, 2018.
The percentage changes by state, which reflect the impact on written premium (from one year to the next) due to NCCI filing activity, are weighted using calendar year direct written premium as reported to the NAIC. Texas is included beginning with Calendar Year 2011, and West Virginia beginning with Calendar Year 2008.
The methodology underlying this slide has been revised (from that used in past years) to reflect the effective date of each state’s filing when determining the impact on written premium from one year to the next.
Data Source
• NAIC’s Annual Statement Statutory Page 14
The value for the most recent year is preliminary because there may be additional filing approvals with effective dates in 2018.
SLIDE 20: MOST RECENT CHANGES IN BUREAU PREMIUM LEVEL
Background
This slide displays the most recent approved change (or filed and pending change) in voluntary market advisory rates or loss costs in each jurisdiction where NCCI provides ratemaking services as of May 10, 2018. Law-only filings are not included in this analysis.
In the slide, teal represents premium level increases, while red represents premium level decreases. The deeper colors represent larger magnitudes of change.
2018 State of the Line Guide
Page 66
© Copyright 2018 NCCI Holdings, Inc. All Rights Reserved.
SLIDE 21: WC IMPACT OF DISCOUNTING ON PREMIUM
Background
This slide shows the combined impact of rate/loss cost departures, schedule rating, and dividends on policy year premium based on private carrier data for all jurisdictions where NCCI provides ratemaking services, excluding Texas. Dividend ratios are based on calendar year statistics. The rate/loss cost departure reflects carrier departures from the NCCI rate level, which excludes both a profit and contingency provision and an expense constant.
Data Sources
• NAIC’s Annual Statement Statutory Page 14 • NCCI’s Financial Call data
The value for the most recent year is preliminary because additional data submissions may still be received by the NAIC.
SLIDE 22: WC IMPACT OF DISCOUNTING ON PREMIUM BY
COMPONENT
Background
This slide shows the component impacts of rate/loss cost departures, schedule rating, and dividends on policy year premium based on private carrier data for all jurisdictions where NCCI provides ratemaking services, excluding Texas. Dividend ratios are based on calendar year statistics. The rate/loss cost departure reflects carrier departures from the NCCI rate level, which excludes both a profit and contingency provision and an expense constant.
Data Sources
• NAIC’s Annual Statement Statutory Page 14 • NCCI’s Financial Call data
The value for the most recent year is preliminary because additional data submissions may still be received by the NAIC.

2018 State of the Line Guide
Page 67
© Copyright 2018 NCCI Holdings, Inc. All Rights Reserved.
SLIDE 23: WC PRICING—MARKET INDEX SURVEY
Background
Survey respondents were asked to review recent renewals and determine how premium rates have changed over a specific period of time.
Blue represents the percentage of agents that observed an increase in premium rates at renewal, while light gray represents the percentage of agents that observed a decrease.
These observations may be used to determine trends in pricing from one year to the next.
Data Source
• The pricing survey was provided by The Council of Insurance Agents & Brokers
SLIDE 24: WC PRICING—MARKET INDEX SURVEY (HISTORY)
Background
This slide provides a longer history of survey results. See Slide 23 for more background.
Data Source
• The pricing survey was provided by The Council of Insurance Agents & Brokers

2018 State of the Line Guide
Page 68
© Copyright 2018 NCCI Holdings, Inc. All Rights Reserved.
SLIDE 25: WC COMBINED RATIO—UNDERWRITING GAIN ACHIEVED
Background
This slide shows workers compensation combined ratios. See the background section of Slide 2 for more information.
Data Sources
• NAIC’s Annual Statement data for individual carriers prior to consolidation of affiliated carriers
• Insurance Expense Exhibit Part II—Allocation to Lines of Business Net of Reinsurance
The value for the most recent year is preliminary because additional data submissions may still be received by the NAIC.
SLIDE 26: WC COMBINED RATIO BY COMPONENT
Background
This slide shows the components of the workers compensation combined ratios. The loss ratios in this slide compare net incurred losses to net earned premium. The loss ratio is the largest component of the combined ratio.
The loss adjustment expense (LAE) ratio compares net incurred LAE to net earned premium. LAE includes both defense and cost containment expenses (DCCE) and adjusting and other expenses.
The underwriting expense ratio compares the costs associated with writing insurance to net written premium. The underwriting expenses included in the ratio are:
• Commission and brokerage expenses • Taxes, licenses, and fees • Other acquisition expenses • General expenses
Policyholder dividends are the smallest component of the combined ratio and are compared to net earned premium.
Data Sources
• NAIC’s Annual Statement data for individual carriers prior to consolidation of affiliated carriers
• Insurance Expense Exhibit Part II—Allocation to Lines of Business Net of Reinsurance
The value for the most recent year is preliminary because additional data submissions may still be received by the NAIC.

2018 State of the Line Guide
Page 69
© Copyright 2018 NCCI Holdings, Inc. All Rights Reserved.
SLIDE 27: WC LAE-TO-LOSS RATIO—NET INCURRED LAE TO
INCURRED LOSSES
Background
The ratio of net incurred LAE to net earned premium provides the contribution of LAE to the overall combined ratio. This slide displays LAE as a ratio to losses, which may be a more meaningful measure of the effort it takes to manage and settle claims.
Data Sources
• NAIC’s Annual Statement data for individual carriers prior to consolidation of affiliated carriers
• Insurance Expense Exhibit Part II—Allocation to Lines of Business Net of Reinsurance
The value for the most recent year is preliminary because additional data submissions may still be received by the NAIC.
SLIDE 28: WC RESIDUAL MARKET COMBINED RATIO
Background
Historical residual market combined ratios are displayed on this slide for all NCCI-serviced Residual Market Pool states. These ratios reflect projected ultimate losses, servicing carrier allowance, producer fees, and other pool and plan administration expenses as a ratio to ultimate premium plus pool interest income on cash flow.
The results are calculated by policy year (PY), which allows a direct match between premium earned and claims incurred for a given block of policies. PY combined ratios can change over time as new claims are reported and the reserves on existing claims are reevaluated.
Data Sources
• Pool data and Plan expenses for pool members for all NCCI-serviced WC Residual Market Pool states; data valued as of 12/31/2017
• Tennessee Reinsurance Mechanism experience is not included in the combined ratios
• NCCI’s Residual Market Quarterly Results

2018 State of the Line Guide
Page 70
© Copyright 2018 NCCI Holdings, Inc. All Rights Reserved.
SLIDE 29: WC INVESTMENT GAIN ON INSURANCE TRANSACTIONS
Background
The overall investment gain is allocated by line of business according to the NAIC-prescribed allocation procedure.
The WC Investment Gain on Insurance Transactions (IGIT) ratio measures investment performance by comparing investment income allocated to the WC line of business to WC earned premium.
Data Sources
• NAIC’s Annual Statement data for individual carriers prior to consolidation of affiliated carriers
• Insurance Expense Exhibit Part II—Allocation to Lines of Business Net of Reinsurance
The value for the most recent year is preliminary because additional data submissions may still be received by the NAIC.
SLIDE 30: WC PRETAX OPERATING GAIN
Background
The pretax operating gain in this slide measures the overall financial performance of the workers compensation line, considering both underwriting income and investment income. Pretax operating gain excludes direct changes to surplus, including, but not limited to, changes in:
• Unrealized capital gains • Unrealized foreign exchange gain • Net deferred income tax • Nonadmitted assets • The provision for reinsurance • Surplus notes
Data Sources
• NAIC’s Annual Statement data for individual carriers prior to consolidation of affiliated carriers
• Insurance Expense Exhibit Part II—Allocation to Lines of Business Net of Reinsurance
The value for the most recent year is preliminary because additional data submissions may still be received by the NAIC.

2018 State of the Line Guide
Page 71
© Copyright 2018 NCCI Holdings, Inc. All Rights Reserved.
SLIDE 31: SOCIAL SECURITY DISABILITY INSURANCE AND WORKERS
COMPENSATION
Background
Workers compensation (WC) is intended to compensate employees for work-related injuries. Social Security Disability Insurance (SSDI) provides benefits for workers who become totally disabled from injuries or conditions, whether work-related or not.
A disabled person may qualify as a “dual-recipient,” eligible to receive both WC and SSDI benefits, subject to a cap. For example, a preexisting cardiovascular condition coupled with a work-related injury may result in total disability.
This slide displays the takeaways of NCCI’s analysis of the interaction of WC and SSDI benefits. NCCI analyzed SSDI applications immediately following reforms in selected states. NCCI also analyzed benefits paid to dual recipients of WC and SSDI to determine the share of benefits paid under each program.
Data Sources
• “Social Security Disability Insurance and Workers Compensation Cost Shifting”
• “Social Security Disability Insurance and Workers Compensation”
These articles can be found on ncci.com.
SLIDE 32: WC NET COMBINED RATIOS—CALENDAR YEAR VS. ACCIDENT YEAR AS REPORTED
Background
The net combined ratios are the sum of the net incurred loss and LAE ratio, underwriting expense ratio, and dividend ratio. In this slide, the overall private carrier workers compensation combined ratios are shown for the most recent 10 years on both calendar year (CY) and accident year (AY) bases.
The AY combined ratio reflects the experience on accidents as of the latest data evaluation date. See Slide 4 for more background.
Data Sources
• NAIC’s Annual Statement, Schedule P, Part 1D • Insurance Expense Exhibit Part II—Allocation to Lines of
Business Net of Reinsurance
The value for the most recent year is preliminary because additional data submissions may still be received by the NAIC.

2018 State of the Line Guide
Page 72
© Copyright 2018 NCCI Holdings, Inc. All Rights Reserved.
SLIDE 33: WC NET COMBINED RATIOS—NCCI’S ACCIDENT YEAR
SELECTIONS VS. AS REPORTED
Background
The net combined ratios are the sum of the net incurred loss and LAE ratio, underwriting expense ratio, and dividend ratio. In this slide, NCCI’s selected combined ratios are compared to reported private carrier workers compensation combined ratios. The values are shown for the most recent 10 years on an accident year (AY) basis. The AY combined ratio reflects the experience on accidents as of the latest data evaluation date.
Data Sources
• NAIC’s Annual Statement, Schedule P, Part 1D • Insurance Expense Exhibit Part II—Allocation to Lines of
Business Net of Reinsurance
The value for the most recent year is preliminary because additional data submissions may still be received by the NAIC.
SLIDE 34: WC NET LOSS AND LAE RATIOS—NCCI’S ACCIDENT
YEAR SELECTIONS VS. AS REPORTED
Background
The accident year (AY) net incurred loss and LAE ratio is calculated as a ratio of AY net losses and LAE to CY earned premium. The values in this slide compare NCCI selections to those reported at the latest evaluation by private carriers. For a given AY, a deficiency is reflected where NCCI’s selected net loss and LAE ratio is higher than the reported value by carriers; a redundancy is reflected where NCCI’s selected net loss and LAE ratio is lower than the reported value by carriers.
Data Source
• NAIC’s Annual Statement, Schedule P, Part 1D

2018 State of the Line Guide
Page 73
© Copyright 2018 NCCI Holdings, Inc. All Rights Reserved.
SLIDE 35: WC NET LOSS AND LAE RESERVE DEFICIENCIES
Background
The net reserve deficiency is the dollar difference (in billions) between NCCI’s estimate of net loss and LAE reserves and the reported private carrier net loss and LAE reserves.
The overall workers compensation net reserve deficiency is calculated for all accident years combined at each year-end valuation.
A positive value on this slide indicates an overall reserve deficiency.
Data Source
• NAIC’s Annual Statement, Schedule P, Part 1D
SLIDE 36: EMERGENCE OF REPORTED WC NET LOSS AND LAE
RATIOS
Background
The net incurred loss and LAE ratio is calculated as the ratio of incurred losses and LAE to earned premium. The accident year (AY) net incurred loss and LAE ratios change over time as losses are paid, and the reserves on claims are reevaluated (i.e., AY emergence).
For each accident year, the dot on the left is the net loss and LAE ratio reported at 1st report, while the dot on the right is the value reported at year-end 2017.
Data Source
• NAIC’s Annual Statement, Schedule P, Part 1D
2018 State of the Line Guide
Page 74
© Copyright 2018 NCCI Holdings, Inc. All Rights Reserved.
SLIDE 37: WC LOST-TIME CLAIM FREQUENCY
Background
This slide displays changes in frequency (lost-time claims per million dollars of pure premium) for all jurisdictions where NCCI provides ratemaking services. Accident Years 1997–2011 exclude West Virginia. High-deductible policies are excluded from all years.
Premium and lost-time claims are developed to an ultimate basis. Premium is also adjusted to current wage and voluntary pure premium level. Data is valued as of 12/31/2016. However, Accident Year 2017 is based on preliminary data valued as of 12/31/2017. Accident Years 2010 and 2011 show adjusted values, primarily due to significant changes in audit activity due to the Great Recession.
Data Source
• NCCI’s Financial Call data
SLIDE 38: WC LOST-TIME CLAIM FREQUENCY (BY STATE)
Background
The average annual changes in lost-time claim frequency between AYs 1992–1996 and AYs 2012–2016 (based on an exponential fit) are displayed in these US maps. Teal represents increases in average frequency, while red represents decreases. The deeper colors represent larger magnitudes of change.
Data is included for all jurisdictions where NCCI provides ratemaking services. The data for Nevada and West Virginia was not available for the 1992–1996 calculation.
Data Sources
• NCCI’s Financial Call data

2018 State of the Line Guide
Page 75
© Copyright 2018 NCCI Holdings, Inc. All Rights Reserved.
SLIDE 39: NCCI AND BLS MEASURES OF LOST-TIME CLAIM
FREQUENCY
Background
NCCI lost-time frequency values and US Bureau of Labor Statistics (BLS) incidence rates for total private industry have been separately tracked since 1981.
For the NCCI frequency values, Accident Years 1981–2011 exclude West Virginia. High-deductible policies are excluded from all years. Premium and claims are developed to an ultimate basis. Premium is also adjusted to current wage and voluntary pure premium level.
BLS values are a countrywide measure of the frequency of workplace injuries and illnesses based on cases involving days away from work.
Data Sources
• NCCI’s Frequency and Severity Analyses • US Bureau of Labor Statistics (BLS)
SLIDE 40: DISTRIBUTION OF LOST-TIME CLAIMS BY SIZE
Background
This slide shows the distribution of claims based on the reported total incurred loss amount. Claim counts, as reported, are grouped into their respective claim size ranges. Data includes five policy periods, generally expiring between 2010 and 2015, in all states for which NCCI provides ratemaking services. All claims are valued as of a 2nd report and have been inflation-adjusted to a common level.
Data Source
• NCCI Unit Statistical Plan data

2018 State of the Line Guide
Page 76
© Copyright 2018 NCCI Holdings, Inc. All Rights Reserved.
SLIDE 41: CHANGES IN LOST-TIME CLAIMS BY SIZE
Background
Lost-time claim counts were aggregated by accident year (2001–2015) and by claim size range to illustrate how the distribution of losses by size changes over time. Loss dollars were adjusted to a common inflation level prior to assigning to a size range. The data reflects all states where NCCI provides ratemaking services, excluding Texas and West Virginia.
Data Source
• NCCI’s Financial Call data
SLIDE 42: INDEMNITY DATA CALL (IDC)
Background
This chart contains a timeline for the new Indemnity Data Call (IDC), beginning with the NCCI Board of Directors’ decision to proceed with collecting this information and extending through when data providers will be required to make their first IDC submissions to NCCI.
Data Source
• NCCI Circular IND-2018-02 “Indemnity Data Call–New Indemnity Data Call Resources–Available on ncci.com”

2018 State of the Line Guide
Page 77
© Copyright 2018 NCCI Holdings, Inc. All Rights Reserved.
SLIDE 43: WC AVERAGE INDEMNITY CLAIM SEVERITY
Background
This slide displays average indemnity claim severity based on data for all jurisdictions where NCCI provides ratemaking services. Accident Years 1997–2007 exclude West Virginia. High-deductible policies are excluded from all years. Losses are developed to an ultimate basis. Data is valued as of 12/31/2016. However, Accident Year 2017 is based on preliminary data valued as of 12/31/2017.
Data Source
• NCCI’s Financial Call data
SLIDE 44: WC AVERAGE INDEMNITY CLAIM SEVERITY (AND WAGE
INFLATION)
Background
This slide compares the growth in average indemnity claim severity with the growth in average weekly wages.
Average weekly wages between 2008 and 2011 were adjusted to compensate for exceptional volatility in bonuses for the financial sector during these years.
Both the WC average indemnity claim severity and average weekly wage trend lines have been indexed to 1997.
Data Sources
• Indemnity severity is from NCCI’s Financial Call data • US Average Weekly Wage is based on (a) Quarterly Census of
Employment and Wages (QCEW) data from the US Bureau of Labor Statistics (BLS) for 1997–2007 and 2012–2016 and (b) QCEW and average weekly earnings data from the BLS for 2008–2011; 2017p is estimated by NCCI using forecasts from Moody’s Analytics

2018 State of the Line Guide
Page 78
© Copyright 2018 NCCI Holdings, Inc. All Rights Reserved.
SLIDE 45: RELATIVE GROWTH RATES–INDEMNITY SEVERITY VS. WAGE INFLATION
Background
This slide compares the growth in indemnity claim severity to the growth in workers’ wages during the 1997–2007 and 2007–2017 time periods.
Data Sources
• Indemnity severity is from NCCI’s Financial Call data • US Average Weekly Wage is based on (a) Quarterly Census of
Employment and Wages (QCEW) data from the US Bureau of Labor Statistics (BLS) for 1997–2007 and 2012–2016 and (b) QCEW and average weekly earnings data from the BLS for 2008–2011; 2017p is estimated by NCCI using forecasts from Moody’s Analytics
SLIDE 46: WC AVERAGE INDEMNITY CLAIM SEVERITY (BY STATE)
Background
The average annual change in indemnity claim severity by state between 2012 and 2016 (based on an exponential fit) is displayed here. Teal represents increases in average indemnity severity, while red represents decreases. The deeper colors represent larger magnitudes of change.
The average indemnity claim severity includes data for all jurisdictions where NCCI provides ratemaking services. High-deductible policies are excluded from all years. Losses are developed to an ultimate basis. Data is valued as of 12/31/2016. The displayed changes in severity are different from those used in ratemaking, with the most significant differences being that these values are not on-leveled or wage-adjusted.
Data Source
• NCCI’s Financial Call data

2018 State of the Line Guide
Page 79
© Copyright 2018 NCCI Holdings, Inc. All Rights Reserved.
SLIDE 47: WC AVERAGE MEDICAL LOST-TIME CLAIM SEVERITY
Background
This slide displays average medical lost-time claim severity based on data for all jurisdictions where NCCI provides ratemaking services. Accident Years 1997–2007 exclude West Virginia. High-deductible policies are excluded from all years. Losses are developed to an ultimate basis. Data is valued as of 12/31/2016. However, Accident Year 2017 is based on preliminary data valued as of 12/31/2017.
Data Source
• NCCI’s Financial Call data
SLIDE 48: WC AVERAGE MEDICAL LOST-TIME CLAIM SEVERITY (AND
PRICE INFLATION)
Background
This slide compares the growth in average medical lost-time severity with the growth in the Personal Health Care Chain-Weighted Price Index (PHC). The PHC is a proxy for medical care price inflation that responds to changes in the blend of different medical services over time.
Both the WC average medical lost-time claim severity and PHC trend lines have been indexed to 1997.
Data Sources
• Medical severity is from NCCI’s Financial Call data • PHC Chain-Weighted Price Index is from the Centers for
Medicare & Medicaid Services

2018 State of the Line Guide
Page 80
© Copyright 2018 NCCI Holdings, Inc. All Rights Reserved.
SLIDE 49: RELATIVE GROWTH RATES—MEDICAL SEVERITY VS. PRICE
INFLATION
Background
This slide compares the growth in medical claim severity to the growth in the Personal Health Care (PHC) index during the 1997–2007 and 2007–2017 time periods.
Data Source
• NCCI’s Financial Call data • PHC Chain-Weighted Price Index is from the Centers for
Medicare & Medicaid Services
SLIDE 50: WC AVERAGE MEDICAL LOST-TIME CLAIM SEVERITY (BY
STATE)
Background
The average annual change in medical lost-time claim severity by state between 2012 and 2016 (based on an exponential fit) is displayed here. Teal represents increases in average medical severity, while red represents decreases. The deeper colors represent larger magnitudes of change.
The average medical lost-time claim severity includes data for all jurisdictions where NCCI provides ratemaking services. High-deductible policies are excluded from all years. Losses are developed to an ultimate basis. Data is valued as of 12/31/2016. The displayed changes in severity are different from those used in ratemaking, with the most significant differences being that these values are not on-leveled or wage-adjusted.
Data Source
• NCCI’s Financial Call data

2018 State of the Line Guide
Page 81
© Copyright 2018 NCCI Holdings, Inc. All Rights Reserved.
SLIDE 51: UTILIZATION OF OPIOIDS
Background
This slide shows the percentage of claimants with a prescription, of any kind, who also had at least one prescription for an opioid. The percentages are based on prescriptions in 2012 and 2016.
Data Source
• NCCI’s Medical Data Call, Service Years 2012 and 2016

2018 State of the Line Guide
Page 82
© Copyright 2018 NCCI Holdings, Inc. All Rights Reserved.
DATA TABLES
SLIDE 4: P/C INDUSTRY NET COMBINED RATIO (BY YEAR)
Combined ratios in the following table are shown in percentages.
SLIDE 5: P/C INDUSTRY INVESTMENT GAIN RATIO
Values in the following table are shown in percentages.
1997 1998 1999 2000 2001 2002 2003 2004 2005 2006 2007 2008 2009 2010 2011 2012 2013 2014 2015
102 106 108 110 116 107 100 98 101 92 95 104 101 102 108 103 96 97 98
2016 2017p
101 104
Year 1997 1998 1999 2000 2001 2002 2003 2004 2005 2006 2007 2008
Net Realized Capital Gains to Net Earned Premium 4.0 6.5 4.6 5.5 2.1 0.8 1.5 2.2 2.9 0.8 2.0 –4.6
Net Investment Income to Net Earned Premium 15.3 14.4 13.7 13.8 12.1 11.2 10.2 9.6 11.9 12.0 12.5 11.7
Investment Gain Ratio 19.3 20.9 18.3 19.3 14.2 12.0 11.7 11.8 14.8 12.8 14.5 7.1
2009 2010 2011 2012 2013 2014 2015 2016 2017p
–1.9 1.4 1.6 1.4 2.3 2.3 1.9 1.5 3
11.1 11.3 11.3 10.7 10.1 9.4 9.4 8.9 9
9.3 12.7 12.9 12.1 12.5 11.7 11.3 10.4 12
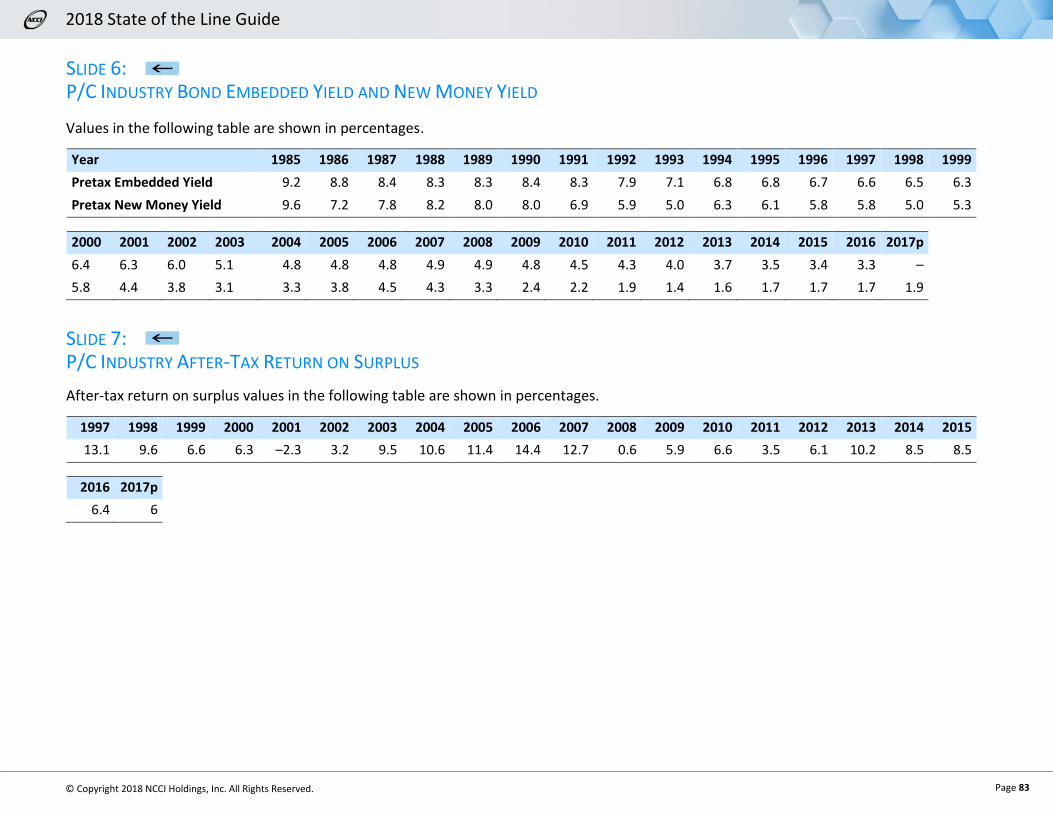
2018 State of the Line Guide
Page 83
© Copyright 2018 NCCI Holdings, Inc. All Rights Reserved.
SLIDE 6: P/C INDUSTRY BOND EMBEDDED YIELD AND NEW MONEY YIELD
Values in the following table are shown in percentages.
Year 1985 1986 1987 1988 1989 1990 1991 1992 1993 1994 1995 1996 1997 1998 1999
Pretax Embedded Yield 9.2 8.8 8.4 8.3 8.3 8.4 8.3 7.9 7.1 6.8 6.8 6.7 6.6 6.5 6.3
Pretax New Money Yield 9.6 7.2 7.8 8.2 8.0 8.0 6.9 5.9 5.0 6.3 6.1 5.8 5.8 5.0 5.3
2000 2001 2002 2003 2004 2005 2006 2007 2008 2009 2010 2011 2012 2013 2014 2015 2016 2017p
6.4 6.3 6.0 5.1 4.8 4.8 4.8 4.9 4.9 4.8 4.5 4.3 4.0 3.7 3.5 3.4 3.3 –
5.8 4.4 3.8 3.1 3.3 3.8 4.5 4.3 3.3 2.4 2.2 1.9 1.4 1.6 1.7 1.7 1.7 1.9
SLIDE 7: P/C INDUSTRY AFTER-TAX RETURN ON SURPLUS
After-tax return on surplus values in the following table are shown in percentages.
1997 1998 1999 2000 2001 2002 2003 2004 2005 2006 2007 2008 2009 2010 2011 2012 2013 2014 2015
13.1 9.6 6.6 6.3 –2.3 3.2 9.5 10.6 11.4 14.4 12.7 0.6 5.9 6.6 3.5 6.1 10.2 8.5 8.5
2016 2017p
6.4 6

2018 State of the Line Guide
Page 84
© Copyright 2018 NCCI Holdings, Inc. All Rights Reserved.
SLIDE 8: P/C INDUSTRY PREMIUM-TO-SURPLUS RATIO
Year 1997 1998 1999 2000 2001 2002 2003 2004 2005 2006 2007 2008 2009
Surplus ($ Billions) 309 333 334 318 290 288 349 396 428 489 524 460 511
Net Written Premium ($ Billions) 277 282 287 300 324 370 405 426 425 442 439 432 418
Premium-to-Surplus Ratio 0.90 0.84 0.86 0.94 1.12 1.29 1.16 1.08 0.99 0.90 0.84 0.94 0.82
2010 2011 2012 2013 2014 2015 2016 2017p
559 554 587 653 675 675 696 749
424 438 457 477 497 514 528 552
0.76 0.79 0.78 0.73 0.74 0.76 0.76 0.74
SLIDE 9: WC NET WRITTEN PREMIUM
Premium values in the following table are shown in $ billions.
Year 1997 1998 1999 2000 2001 2002 2003 2004 2005 2006 2007 2008 2009 2010
State Funds 2.8 2.6 2.7 3.7 6.0 8.4 11.2 11.8 10.1 7.8 6.7 5.5 4.3 3.9
Private Carriers 24.2 23.3 22.3 25.0 26.1 29.2 31.1 34.7 37.8 38.6 37.6 33.8 30.3 29.9
Total 27.0 25.9 25.0 28.6 32.1 37.7 42.3 46.5 47.8 46.5 44.3 39.3 34.6 33.8
2011 2012 2013 2014 2015 2016 2017p
4.1 4.4 4.9 5.7 5.8 5.4 5.2
32.3 35.1 36.9 38.5 39.7 40.1 39.8
36.4 39.5 41.8 44.2 45.5 45.6 45.0

2018 State of the Line Guide
Page 85
© Copyright 2018 NCCI Holdings, Inc. All Rights Reserved.
SLIDE 11: WC RESIDUAL MARKET PREMIUM
Residual market premium values in the following table are shown in $ billions.
1997 1998 1999 2000 2001 2002 2003 2004 2005 2006 2007 2008 2009 2010 2011 2012 2013 2014 2015
0.6 0.3 0.3 0.4 0.6 1.1 1.4 1.5 1.4 1.2 0.9 0.7 0.5 0.5 0.5 0.8 1.1 1.1 1.2
2016 2017p
1.1 1.0
SLIDE 12: WC RESIDUAL MARKET—CHANGES IN PREMIUM VS. AVERAGE POLICY SIZE
Residual market premium values and average policy size values in the following table are shown in dollars.
Year 2002 2003 2004 2005 2006 2007 2008 2009 2010 2011 2012 2013 2014 2015 2016 2017
Premium ($ Millions) 791 997 1,015 924 781 660 501 396 344 389 580 758 808 799 758 726
Average Policy Size 5,405 5,419 4,948 4,426 3,822 3,436 3,024 2,790 2,675 3,008 4,194 4,875 4,775 4,394 3,948 3,769
SLIDE 14: WC RESIDUAL MARKET SHARE
Residual market shares in the following table are shown in percentages.
1997 1998 1999 2000 2001 2002 2003 2004 2005 2006 2007 2008 2009 2010 2011 2012 2013 2014 2015
8 4 3 3 5 11 13 13 12 10 8 7 5 5 5 7 8 8 8
2016 2017p
8 8

2018 State of the Line Guide
Page 86
© Copyright 2018 NCCI Holdings, Inc. All Rights Reserved.
SLIDE 16: WC DIRECT WRITTEN PREMIUM CHANGE—2017
Direct written premium changes in the following table are shown in percentages.
AK AL AR AZ CA CO CT DC DE FL GA HI IA ID IL IN KS
–6.3 –2.5 1.9 –1.8 0.5 3.4 –6.3 11.4 7.5 15.0 5.2 2.3 –2.1 10.7 –5.7 –5.7 –5.1
KY LA MA MD ME MI MN MO MS MT NC NE NH NJ NM NV NY
–4.1 –4.7 2.7 0.3 1.8 –4.6 –6.4 –4.2 –0.2 4.5 –3.0 –2.4 –6.3 –1.9 –1.2 –2.2 6.3
OK OR PA RI SC SD TN TX UT VA VT WI WV
–6.6 0.9 –1.6 5.1 5.7 –0.6 –0.7 –4.7 0.6 0.8 –5.2 –2.2 –1.3
SLIDE 18: INCREASES IN PAYROLL CONTINUE TO DRIVE CHANGES IN PREMIUM
Values in the following table are shown in percentages.
Forecast Change 2016–2017
Sector Change in Average Wage Change in Employment
Professional and Business Services 1.6 2.1
Trade, Transportation, and Utilities 2.2 0.8
Education and Health Services 1.2 2.4
Manufacturing 1.4 0.7
Financial Activities 1.9 2.0
Construction 1.2 3.4
Leisure and Hospitality 1.5 2.6
All Other 1.7 1.0

2018 State of the Line Guide
Page 87
© Copyright 2018 NCCI Holdings, Inc. All Rights Reserved.
SLIDE 19: WC APPROVED CHANGES IN BUREAU PREMIUM LEVEL
Approved changes in bureau premium level in the following table are shown in percentages.
2002 2003 2004 2005 2006 2007 2008 2009 2010 2011 2012 2013 2014 2015 2016
–1.9 2.2 –0.1 –0.9 –0.4 –2.3 –4.1 –4.6 –3.3 –1.3 1.4 0.1 –1.3 –3.9 –3.6
2017 2018p
–5.4 –9.6
SLIDE 20: MOST RECENT CHANGES IN BUREAU PREMIUM LEVEL
Changes in bureau premium level in the following table are shown in percentages.
AK AL AR AZ CO CT DC FL GA HI IA ID IL IN KS KY
–7.9 –13.9 –15.4 –6.4 –12.7 –14.1 –3.0 –9.8 –8.7 –1.7 –8.7 –5.8 –10.7 –12.8 –7.6 –4.6
LA MD ME MO MS MT NC NE NH NM NV OK OR RI SC SD
0.4 –13.0 –12.0 –3.0 –6.0 –10.7 –11.3 –7.6 –13.3 –16.2 –2.3 –16.3 –14.0 –4.6 –7.0 –7.0
TN TX UT VA VT WV
–12.6 –13.7 –9.4 –0.9 –3.7 –10.3

2018 State of the Line Guide
Page 88
© Copyright 2018 NCCI Holdings, Inc. All Rights Reserved.
SLIDE 21: WC IMPACT OF DISCOUNTING ON PREMIUM
Values in the following table are shown in percentages.
1997 1998 1999 2000 2001 2002 2003 2004 2005 2006 2007 2008 2009 2010 2011 2012 2013 2014 2015
–17.1 –21.8 –21.0 –18.1 –12.4 –2.8 1.4 3.5 2.2 –0.8 –3.7 –6.7 –7.4 –7.7 –6.0 –2.7 1.3 2.5 2.4
2016 2017p
0.3 0.5
SLIDE 23: WC PRICING—MARKET INDEX SURVEY
Values in the following table are shown in percentages.
Year (4Q) 2014 2015 2016 2017
Reported Increase 43 12 13 12
Reported No Change 26 31 25 41
Reported Decrease 31 57 62 47
SLIDE 25: WC COMBINED RATIO—UNDERWRITING GAIN ACHIEVED
Combined ratios in the following table are shown in percentages. Information for state funds is included for informational purposes.
Year 1997 1998 1999 2000 2001 2002 2003 2004 2005 2006 2007 2008 2009 2010 2011
Private Carriers 101 107 115 118 122 111 110 107 103 93 101 101 110 115 115
State Funds 131 142 145 137 117 116 103 102 102 106 115 121 129 138 133
2012 2013 2014 2015 2016 2017p
109 102 100 94 94 89
124 115 116 107 108 115

2018 State of the Line Guide
Page 89
© Copyright 2018 NCCI Holdings, Inc. All Rights Reserved.
SLIDE 26: WC COMBINED RATIO BY COMPONENT
Values in the following table are shown in percentages.
Year 1997 1998 1999 2000 2001 2002 2003 2004 2005 2006 2007 2008 2009 2010 2011
Dividend Ratio 5.4 5.3 5.6 4.7 3.7 2.8 1.6 1.3 1.3 1.3 1.5 1.7 1.6 1.6 1.6
Underwriting Expense Ratio 25.9 26.7 28.0 26.4 26.1 23.5 22.2 22.1 22.3 19.6 24.6 24.5 26.2 26.7 25.9
LAE Ratio 13.8 15.3 15.8 15.9 13.8 13.7 15.0 14.5 14.4 13.6 14.5 14.1 14.9 16.0 17.0
Loss Ratio 55.5 60.1 65.9 71.2 78.0 70.8 70.7 68.9 64.5 58.7 60.1 60.3 67.6 70.7 70.3
Combined Ratio 101 107 115 118 122 111 110 107 103 93 101 101 110 115 115
2012 2013 2014 2015 2016 2017p
1.4 1.3 1.2 1.2 1.4 2
26.2 25.0 24.3 24.9 25.3 26
15.2 14.4 14.5 14.0 14.1 13
65.8 60.9 59.8 53.7 53.1 49
109 102 100 94 94 89
SLIDE 27: WC LAE-TO-LOSS RATIO—NET INCURRED LAE TO INCURRED LOSSES
LAE-to-loss ratios in the following table are shown in percentages.
1997 1998 1999 2000 2001 2002 2003 2004 2005 2006 2007 2008 2009 2010 2011 2012 2013 2014 2015
24.9 25.5 24.0 22.3 17.7 19.4 21.2 21.0 22.3 23.2 24.1 23.4 22.0 22.6 24.1 23.0 23.7 24.2 26.1
2016 2017p
26.6 27

2018 State of the Line Guide
Page 90
© Copyright 2018 NCCI Holdings, Inc. All Rights Reserved.
SLIDE 28: WC RESIDUAL MARKET COMBINED RATIO
Combined ratios in the following table are shown in percentages.
1997 1998 1999 2000 2001 2002 2003 2004 2005 2006 2007 2008 2009 2010 2011 2012 2013 2014 2015
103 116 116 116 111 113 108 105 103 104 109 112 108 110 112 106 102 103 99
2016 2017p
98 106
SLIDE 29: WC INVESTMENT GAIN ON INSURANCE TRANSACTIONS
Investment gain ratios in the following table are shown in percentages.
1997 1998 1999 2000 2001 2002 2003 2004 2005 2006 2007 2008 2009 2010 2011 2012 2013 2014 2015
19.1 14.9 18.5 18.3 11.6 14.9 10.2 10.0 12.8 9.9 12.0 8.7 10.8 14.8 14.7 13.7 15.2 11.6 10.9
2016 2017p
10.8 12
SLIDE 30: WC PRETAX OPERATING GAIN
Pretax operating gains in the following table are shown in percentages. Data for state funds is included for informational purposes.
Year 1997 1998 1999 2000 2001 2002 2003 2004 2005 2006 2007 2008 2009 2010 2011
Private Carriers 18.5 7.5 3.2 0.1 –10.0 4.1 0.7 3.2 10.3 16.7 11.3 8.1 0.5 –0.2 –0.1
State Funds N/A N/A N/A –7.9 –1.0 –1.4 6.4 7.6 13.2 10.9 7.5 –1.7 3.5 2.4 –3.3
2012 2013 2014 2015 2016 2017p
5.1 13.5 11.8 17.1 16.9 23
8.1 6.5 5.3 9.4 8.5 3

2018 State of the Line Guide
Page 91
© Copyright 2018 NCCI Holdings, Inc. All Rights Reserved.
SLIDE 32: WC NET COMBINED RATIOS—CALENDAR YEAR VS. ACCIDENT YEAR AS REPORTED
Combined ratios in the following table are shown in percentages.
Year 2008 2009 2010 2011 2012 2013 2014 2015 2016 2017p
Calendar Year 101 110 115 115 109 102 100 94 94 89
Accident Year 104 107 115 111 103 97 93 94 95 99
SLIDE 33: WC NET COMBINED RATIOS—NCCI’S ACCIDENT YEAR SELECTIONS VS. AS REPORTED
Combined ratios in the following table are shown in percentages.
Year 2008 2009 2010 2011 2012 2013 2014 2015 2016 2017p
NCCI Selected 105 110 117 113 104 96 93 90 89 91
As Reported 104 107 115 111 103 97 93 94 95 99
SLIDE 34: WC NET LOSS AND LAE RATIOS—NCCI’S ACCIDENT YEAR SELECTIONS VS. AS REPORTED
Net loss and LAE ratios in the following table are shown in percentages.
Year 2008 2009 2010 2011 2012 2013 2014 2015 2016 2017p
NCCI Selected 79 82 89 85 76 70 67 64 62 63
As Reported 78 80 86 83 76 71 68 68 69 72

2018 State of the Line Guide
Page 92
© Copyright 2018 NCCI Holdings, Inc. All Rights Reserved.
SLIDE 35: WC NET LOSS AND LAE RESERVE DEFICIENCIES
Deficiencies in the following table are shown in dollars.
Year-End Valuation 1997 1998 1999 2000 2001 2002 2003 2004 2005 2006 2007 2008 2009 2010
Deficiency ($ Billions) 10 15 18 20 21 18 15 12 9 4 2 6 9 10
2011 2012 2013 2014 2015 2016 2017
11 13 11 10 7 5 1
SLIDE 36: EMERGENCE OF REPORTED WC NET LOSS AND LAE RATIOS
Net loss and LAE ratios in the following table are shown in percentages.
Year 2008 2009 2010 2011 2012 2013 2014 2015 2016 2017
1st Report 76 80 83 83 80 76 73 72 72 72
Current Report 78 80 86 83 76 71 68 68 69 72
SLIDE 37: WC LOST-TIME CLAIM FREQUENCY
Values in the following table are shown in percentages.
Accident Year 1997 1998 1999 2000 2001 2002 2003 2004 2005 2006 2007 2008 2009 2010
Frequency Change 0.5 –3.9 –2.3 –4.5 –6.9 –4.5 –4.1 –3.7 –6.6 –4.5 –2.2 –4.3 –4.9 10.6
Adjusted Frequency Change 3.6
2011 2012 2013 2014 2015 2016 2017p
–3.9 –5.8 –4.0 –3.0 –5.1 –6.2 –6
–0.9

2018 State of the Line Guide
Page 93
© Copyright 2018 NCCI Holdings, Inc. All Rights Reserved.
SLIDE 43: WC AVERAGE INDEMNITY CLAIM SEVERITY
Year 1997 1998 1999 2000 2001 2002 2003 2004 2005 2006
Indemnity Severity ($ Thousands) 11.5 12.5 13.6 14.9 16.4 16.9 17.5 17.6 18.1 19.1
Change (%) — 9.0 9.1 9.1 10.0 3.3 3.1 1.1 2.8 5.5
2007 2008 2009 2010 2011 2012 2013 2014 2015 2016 2017p
20.4 22.1 22.2 21.6 21.8 21.6 22.3 22.6 22.8 23.4 24.4
6.8 8.1 0.6 –2.8 0.7 –0.6 2.8 1.4 1.0 2.7 4
SLIDE 44: WC AVERAGE INDEMNITY CLAIM SEVERITY (AND WAGE INFLATION)
Values in the following table are shown in percentages.
Year 1997 1998 1999 2000 2001 2002 2003 2004 2005 2006 2007 2008 2009
Indemnity Severity Change — 9.0 9.1 9.1 10.0 3.3 3.1 1.1 2.8 5.5 6.8 8.1 0.6
US Average Weekly Wage Change — 5.6 4.7 6.3 2.3 1.1 2.7 4.3 3.5 4.7 4.6 2.7 1.1
2010 2011 2012 2013 2014 2015 2016 2017p
–2.8 0.7 –0.6 2.8 1.4 1.0 2.7 4
2.3 2.9 2.8 1.1 3.1 3.1 1.2 1.7
SLIDE 45: RELATIVE GROWTH RATES—INDEMNITY SEVERITY VS. WAGE INFLATION
See the data table underlying Slide 44 (above) for the underlying annual percentage changes.

2018 State of the Line Guide
Page 94
© Copyright 2018 NCCI Holdings, Inc. All Rights Reserved.
SLIDE 47: WC AVERAGE MEDICAL LOST-TIME CLAIM SEVERITY
Year 1997 1998 1999 2000 2001 2002 2003 2004 2005 2006
Medical Severity ($ Thousands) 10.9 11.8 13.0 13.9 15.7 17.0 18.3 19.2 20.5 21.7
Change (%) — 8.3 10.2 6.7 13.6 7.9 8.1 4.7 7.0 5.5
2007 2008 2009 2010 2011 2012 2013 2014 2015 2016 2017p
22.9 24.2 25.2 25.2 25.8 26.0 26.5 27.4 27.2 28.8 29.9
5.8 5.6 4.2 –0.2 2.4 0.8 1.9 3.7 –1.0 6.0 4
SLIDE 48: WC AVERAGE MEDICAL LOST-TIME CLAIM SEVERITY (AND PRICE INFLATION)
Values in the following table are shown in percentages.
Year 1997 1998 1999 2000 2001 2002 2003 2004 2005 2006
Medical Severity Change — 8.3 10.2 6.7 13.6 7.9 8.1 4.7 7.0 5.5
PHC Chain-Weighted Price Index Percentage Change — 2.1 2.5 2.9 3.7 3.0 3.3 3.5 3.1 3.0
2007 2008 2009 2010 2011 2012 2013 2014 2015 2016 2017p
5.8 5.6 4.2 –0.2 2.4 0.8 1.9 3.7 –1.0 6.0 4
3.3 2.6 2.7 2.7 2.1 1.8 1.5 1.4 0.7 1.2 1.4
SLIDE 49: RELATIVE GROWTH RATES—MEDICAL SEVERITY VS. PRICE INFLATION
See data table underlying Slide 48 (above) for the underlying annual percentage changes.

2018 State of the Line Guide
Page 95
© Copyright 2018 NCCI Holdings, Inc. All Rights Reserved.
APPENDIX A—DEFINITIONS Accident Year (AY)—A loss accounting definition in which experience is summarized by the calendar year in which an accident occurred.
Adjusting and Other Expenses (AOE) Incurred—Loss adjustment expenses, other than those categorized as Defense and Cost Containment Expense. Examples:
• Fees of adjusters and settling agents (but not if engaged in a contentious defense) • Attorney fees incurred in the determination of coverage, including litigation between the insurer and the policyholder
Assigned Carrier—The insurer assigned to provide coverage to an eligible employer that has applied for workers compensation insurance under NCCI’s Workers Compensation Insurance Plan. An assigned carrier can be either a servicing carrier or direct assignment carrier.
Calendar Year (CY)—A method of accounting that includes all financial transactions occurring during a 12-month period, beginning January 1.
Carrier Discounting—Combined impact on premium due to rate/loss cost departures, schedule rating, and dividends.
Commissions and Brokerage Expenses Incurred—Fees paid to producers.
Defense and Cost Containment Expense (DCCE) Incurred—Expenses for defense by the insurer in contentious situations (whether a first-party or third-party claim) for litigation involving a claim and for cost containment expense. Examples:
• Surveillance expenses • Fixed amounts for cost containment expenses • Case management expenses for managing the overall cost of a claim • Litigation management expenses • Fees or salaries for appraisers, private investigators, hearing representatives, reinspectors, and fraud investigators, if working in defense
of a claim • Attorney fees incurred owing to a duty to defend • Cost of engaging experts
Direct Assignment—Assigned risk business written and serviced directly by an insurance company that has been authorized by the Insurance Department to write such business. These insureds are written without reinsurance through the National Workers Compensation Reinsurance Pooling Mechanism or other reinsurance pool.
Dividends to Policyholders—When actual costs and expenses are less than anticipated costs and expenses, carriers may opt to return the difference to policyholders in the form of a dividend.
Earned Premium—Proportional share of each policy’s written premium applicable to the expired part of the policy. Derived by subtracting the change in the unearned premium reserve from the written premium.

2018 State of the Line Guide
Page 96
© Copyright 2018 NCCI Holdings, Inc. All Rights Reserved.
APPENDIX A—DEFINITIONS Estimated Annual Premium—Premium charged by an insurance company, at the time the policy is issued, for coverage provided by an insurance contract for a period of time. Estimated premium is reported before endorsements or audits.
Experience Mod—A factor calculated from actual case loss experience used to adjust an insured’s manual premiums (up or down) based on the insured’s loss experience relative to the average underlying the manual premiums. It compares the insured’s experience to the average class experience.
Exposure Accident Year (EAY):
• Claims/Losses—Are on an accident year basis • Earned Premium—Final audited premium for each policy is allocated to the appropriate calendar year based on the period of exposure
General Expenses Incurred—Overhead expenses incurred in the insurer’s operations, other than those included in the other expense categories. Examples:
• Salaries • Rent and rent items • Equipment
Net Written Premium—The gross premium income adjusted for additional or return premiums, including any additions for reinsurance assumed and deductions for reinsurance ceded.
Other Acquisitions, Field Supervision, and Collection Expenses Incurred—Expenses incurred in obtaining insurance business. Examples:
• Salaries • Equipment • Advertising • Employee relations and welfare • Allowance to managers and agents • Postage, telephone, and express • Rent and rent items
Policy Year (PY)—The year of the effective date of the policy. Policy year financial results summarize experience for all policies with effective dates in a given calendar year period.
Pure Premium—Portion of bureau level premium that provides for indemnity and medical loss payments.
Residual Market Pool—A financial agreement among participating insurers to share in the experience of certain assigned risks. This reduces both administrative costs and annual fluctuations in the liability of participating insurers resulting from the operation of state insurance plans.
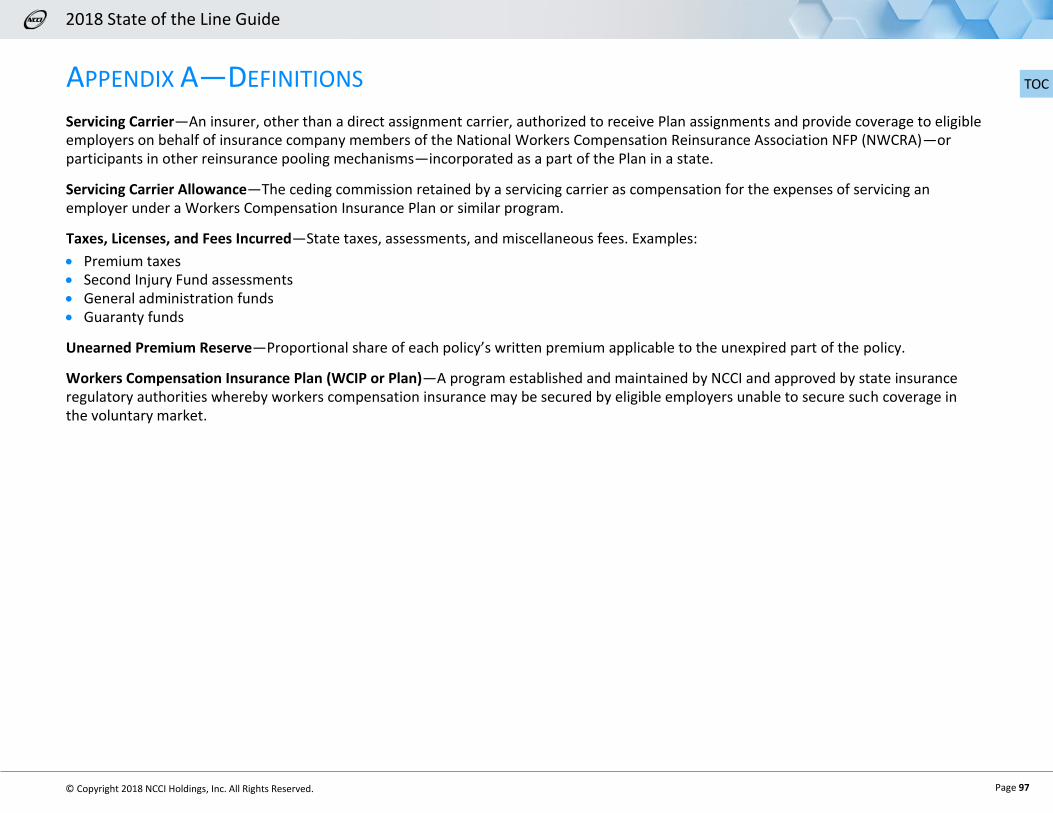
2018 State of the Line Guide
Page 97
© Copyright 2018 NCCI Holdings, Inc. All Rights Reserved.
APPENDIX A—DEFINITIONS Servicing Carrier—An insurer, other than a direct assignment carrier, authorized to receive Plan assignments and provide coverage to eligible employers on behalf of insurance company members of the National Workers Compensation Reinsurance Association NFP (NWCRA)—or participants in other reinsurance pooling mechanisms—incorporated as a part of the Plan in a state.
Servicing Carrier Allowance—The ceding commission retained by a servicing carrier as compensation for the expenses of servicing an employer under a Workers Compensation Insurance Plan or similar program.
Taxes, Licenses, and Fees Incurred—State taxes, assessments, and miscellaneous fees. Examples:
• Premium taxes • Second Injury Fund assessments • General administration funds • Guaranty funds
Unearned Premium Reserve—Proportional share of each policy’s written premium applicable to the unexpired part of the policy.
Workers Compensation Insurance Plan (WCIP or Plan)—A program established and maintained by NCCI and approved by state insurance regulatory authorities whereby workers compensation insurance may be secured by eligible employers unable to secure such coverage in the voluntary market.

2018 State of the Line Guide
Page 98
© Copyright 2018 NCCI Holdings, Inc. All Rights Reserved.
APPENDIX B—FORMULAS
After-Tax Return on Surplus = Net Income
Average Surplus
Average Surplus = 0.5 x (Surplus as regards policyholders, December 31 current year
+ Surplus as regards policyholders, December 31 prior year)
Combined Ratio = Loss Ratio + LAE Ratio + Dividend Ratio + Underwriting Expense Ratio
Combined Ratio (Residual Market Slides) = Losses
Earned Premium +
Expenses and Allowances
Written Premium
Dividend Ratio = Dividends to Policyholders
Earned Premium
Indicated Net Loss & LAE Reserves = Ultimate Net Loss & LAE – Net Loss & LAE Payments
Investment Gain on Insurance Transactions Ratio = Investment Gain on Funds Attributable to Insurance Transactions + Other Income Less Other Expenses
Earned Premium
Investment Gain Ratio = Net Investment Gain (Loss)
Earned Premium
Loss Adjustment Expense (LAE) Ratio = DCCE Incurred + AOE Incurred
Earned Premium
Loss & LAE Ratio = Incurred Loss + DCCE Incurred + AOE Incurred
Earned Premium
Loss Ratio = Incurred Loss
Earned Premium
Net Earned Premium = Net Written Premium + Change in Unearned Premium Reserve
Net Reserve Deficiency = NCCI Indicated Net Loss & LAE Reserves – Private Carrier Net Loss & LAE Reserves As Reported

2018 State of the Line Guide
Page 99
© Copyright 2018 NCCI Holdings, Inc. All Rights Reserved.
APPENDIX B—FORMULAS
Premium-to-Surplus Ratio = Net Written Premium
Surplus as regards policyholders
Pretax Operating Gain = 1 – (Combined Ratio – Investment Gain on Insurance Transactions Ratio)
Underwriting Expense Ratio =
Commissions and Brokerage Expenses Incurred
+ Taxes, Licenses, and Fees Incurred
+ Other Acquisitions, Field Supervision and Collection Expenses Incurred
+ General Expenses Incurred
Written Premium