Embed Size (px)
Citation preview

2018SustainabilityReport

Welcome to Our Sustainability Report
Kimberly-Clark’s 16th sustainability report provides an annual update on the progress we have made towards our Sustainability 2022 goals. Our reporting timeframe covers January 1 through December 31, 2018. The company’s progress is portrayed through stories that highlight our work around the world as well as key data and metrics, prepared in accordance with the Global Reporting Initiative (GRI)’s Sustainability Reporting Standards “Core” level.
For questions regarding the content of this report, please contact us at [email protected].
Photo: Through Kimberly-Clark’s partnership with Plan International, students in Bolivia can manage their periods with dignity in bathrooms built at local schools.

Strategy• Message from Mike Hsu, CEO• Sustainability 2022 Overview• 2018 Progress Dashboard• UN Sustainable Development Goals
Priorities • Social Impact• Forests & Fiber • Waste & Recycling• Energy & Climate• Supply Chain
Governance• Board of Directors• Sustainability Advisory Board• Compliance & Ethics• Diversity & Inclusion• Materiality • Engagement
• Principles • Memberships • Awards
Data• Business Data• Data Tables• GRI Index Tables
Assurance
Table of Contents
STRATEGY PRIORITIES GOVERNANCE ASSURANCEDATA

Strategy
STRATEGY PRIORITIES GOVERNANCE ASSURANCEDATA
Kimberly-Clark partnered with Charities Aid Foundation to repair and maintain toilets in schools in India. With access to sanitation, young girls can focus on their education.

Creating a Better Future for the Communities We Serve
We are three years into our ambitious Sustainability 2022 program, and I’m inspired by the impact we’ve made. Through our brand-led programs like Toilets Change Lives and No Baby Unhugged, and our leadership in creating the Alliance for Period Supplies, we’re taking action on critical issues around the world.
In 2018 our teams advanced water stewardship in some of the world’s most water stressed areas, reduced the use of fiber from natural forests, and diverted manufacturing waste and post-consumer waste to higher value beneficial uses. We also exceeded our energy and climate goals four years ahead of schedule!
We’ve achieved some big goals, but we know that new challenges to the environment are emerging and consumers’ expectations are shifting. We must continue to leverage our legacy of innovation to come up with newsolutions to meet these needs.
I am proud of the great work our teams are doing to create a betterlife for the communities we serve while building a more sustainable future.
Sustainability 2022 OverviewMessage from Mike Hsu, CEO 2018 Progress Dashboard UN Sustainable Development Goals
STRATEGY PRIORITIES GOVERNANCE ASSURANCEDATA

Sustainability 2022 OverviewEverything we do at Kimberly-Clark is connected to our vision to lead the world in essentials for a better life. As we approach our 150th year in business, we remain committed to improving the communities where we work and live. Our sustainability strategy, Sustainability 2022, is our framework to help us achieve that mission.
We set ambitious goals in the areas of social impact, forests and fiber, energy and climate, waste and recycling, and supply chain which enable us to have a lasting impact around the world. Our priorities and goals are informed by who we serve, what we do, and how we do it. We work together to foster innovative ideas and pursue longer-term change while striving to create social, environmental, and financial value.
20%
SUSTAINABILITY2022
OURSTRATEGY
OURPRIORITIES
OUR 2022GOALS
OURVISION
TO LEAD THE WORLD IN ESSENTIALSFOR A BETTER LIFE
INNOVATION
COMMITMENTVALUE
We strive to create social, environmental and
financial value. Our priorites and goals are informed by who we serve, what we do and
how we do it.
We work together to foster innovative ideas and
pursue long-term change.
SOCIALIMPACT
IMPROVE THE WELL-BEING OF
25MPEOPLE IN NEED
UPHOLD OURCOMMITMENT TO HUMAN RIGHTS, WORKER SAFETY,
ANTI-CORRUPTION, AND
ENVIRONMENTAL PROTECTION
REDUCTION IN GREENHOUSE
GASSES
INNOVATE OUR TISSUE PRODUCTS TO REDUCE THEIR NATURAL FOREST
FOOTPRINT BY
50%BY 2025
EXTEND OUR
ZEROWASTE MINDSET
SUPPLYCHAIN
FORESTS& FIBER
ENERGY& CLIMATEWASTE &
RECYCLING
Message from Mike Hsu, CEO
STRATEGY PRIORITIES GOVERNANCE ASSURANCEDATA
Download
Sustainability 2022 Overview 2018 Progress Dashboard UN Sustainable Development Goals

Kimberly-Clark’s 2018 Progress Dashboard
SOCIALIMPACT
FORESTS& FIBER
WASTE &RECYCLING
ENERGY& CLIMATE
SUPPLYCHAIN
2022 GOAL 2018 TARGET 2018 ACTUAL 2018 PERFORMANCE
Set sustainable water use targets
20% reduction of greenhouse gas emissions
Identify and deploy solutions that avoid and/or divert 150,000 MT of materials to higher value alternatives.
50% reduction in natural forest fiber use(Note: by 2025)
Improve the lives of 25M people in need
5 Mills
-18%
20,000 MT
-25%
4.8M
6 Mills
-27%
21,245 MT
-30%
5.2M
Message from Mike Hsu, CEO
STRATEGY PRIORITIES GOVERNANCE ASSURANCEDATA
2018 Progress Dashboard UN Sustainable Development GoalsSustainability 2022 Overview

SOCIAL IMPACT(1) No Poverty (3) Good health and wellbeing(5) Gender equality(6) Clean water and sanitation(11) Sustainable cities and communities(17) Partnerships for the goals
FORESTS & FIBER(15) Life on land(17) Partnerships for the goals
WASTE & RECYCLING(11) Sustainable cities and communities(12) Responsible consumption and production(14) Life below water(15) Life on land(17) Partnerships for the Goals
ENERGY & CLIMATE(7) Affordable and clean energy(13) Climate action(17) Partnerships for the goals
SUPPLY CHAIN(9) Industry, innovation and infrastructure(10) Reduced inequalities(12) Responsible consumption and production(17) Partnerships for the goals
Message from Mike Hsu, CEO
The Sustainable Development Goals (SDGs) are the United Nations’ framework for ending poverty and protecting the planet. Each of Kimberly-Clark’s goals align with the SDGs in one or more area.
STRATEGY PRIORITIES GOVERNANCE ASSURANCEDATA
UN Sustainable Development GoalsSustainability 2022 Overview 2018 Progress Dashboard

Priorities
STRATEGY PRIORITIES GOVERNANCE ASSURANCEDATA
Kimberly-Clark social impact programs continue to make a difference in the communities where we work and live.

Kimberly-Clark delivers the essentials for a better life to one-quarter of the world’s population every day.
We develop social programs that drive meaningful and lasting change through a combination of brand-led commercial programs, retail executions, community partnerships, and Kimberly-Clark Foundation support. Our programs grow brand equity and performance at the shelf and provide unique opportunities for employee engagement in the community in direct support of the identified brand missions.
Social Impact Waste & Recycling Energy & Climate Supply ChainForests & Fiber
Improve the well-being of
25 MILLIONPEOPLE IN NEED
through social and community investments that increase access to sanitation, help children thrive, and
empower women and girls.
SOCIALIMPACT
2022 Goal:
SDG Alignment
Photo: Through our partnership with Australian not-for-profit Foodbank, families and communities across Australia always have access to basic necessities, including diapers.
STRATEGY PRIORITIES GOVERNANCE ASSURANCEDATA

How Impact Is Achieved and Measured• Support the communities in which we operate through company and employee giving and volunteerism.
• Align programs to the promise of our brands to create sustainable social impact, increase brand equity and performance at shelf, and deliver supply chain benefits.
• Measure the business and social impact with key performance indicators and use learnings to scale the programs that are most impactful.
(Note that we consider people in need as those living in poverty, where poverty is not only economic but also social, political and cultural.)
2018 ProgressWe’ve made the following progress towards our goal:
Social Impact
To review our Social Impact data, click here
5.2 Million
Access to Sanitation:1.5 Million Lives
Impacted
Helping Children Thrive:3.4 Million Lives
Impacted
Empowerment of Women and Girls:
270,000 Lives Impacted
Total lives impactedtowards 2022 goal:
In Latin America, our Toilets Change Lives program aims to deliver dignifying, safe and clean access to sanitation through its brands while strengthening equity and driving sales. Through the program and our partnership with NGO Water for People, more than 32,800 people were directly impacted in 2018.
STRATEGY PRIORITIES GOVERNANCE ASSURANCEDATA
Waste & Recycling Energy & Climate Supply ChainForests & Fiber

Social Impact
2018 Featured Social Impact Stories
A Unique Approach to Accelerating the Sanitation Economy: Through the Toilet Board Coalition’s “Toilet Accelerator” program, Kimberly-Clark employees are mentoring local entrepreneurs in developing markets to explore new technology, programs, and business, bringing together local entrepreneurs and multinationals. The Toilet Accelerator program led to the development of the Toilet Integration (TI) Sanitation Center, a clean, safe toilet on wheels and health and hygiene resource center for women in India. Read more about the program
Alliance for Period Supplies: With U, She Can: Kimberly-Clark’s U by Kotex® brand believes that nothing should stand in the way of a woman’s progress, especially not her period. However, one in four American women struggle to purchase period products due to lack of income. In 2017, U by Kotex® launched “With U She Can,” a program dedicated to providing period supplies to women and girls who need them most. U by Kotex® joined forces with the National Diaper Bank Network in May 2018 to form the Alliance for Period Supplies. In the first year, the brand completed seven retail programs and 10 million products were donated.Read more about the program
SOCIALIMPACT
STRATEGY PRIORITIES GOVERNANCE ASSURANCEDATA
Waste & Recycling Energy & Climate Supply ChainForests & Fiber

FORESTS& FIBER
Social Impact
As one of the world’s largest buyers of market pulp, we know that protecting forests is critical to creating a resilient supply chain for our products.
Kimberly-Clark has been recognized as a market leader for responsible fiber sourcing and forest protection by major environmental groups like FSC®, Greenpeace, and WWF.
We know there is difficult work ahead to drive further improvements. We are continuing the challenging work of developing alternatives to traditional sources of fiber for our products while encouraging our suppliers, customers, and consumers to look for FSC® certification.
Innovate our tissue products to reduce their natural forest footprint by
50%while increasing our use of
environmentally-preferred fibers (EPF)* by 2025.
2025 Goal:
Photo: Since Kimberly-Clark Taiwan’s Green Up for a Better Future campaign launched in 2014, more than 9,000 students and teachers have been trained on forest conservation, FSC certification, and responsible consumption.
* Environmentally-preferred fibers (EPF) include Forest Stewardship Council®-certified virgin fibers, recycled fibers and sustainable alternative natural fibers in tissue products. Natural forests are composed of native species that self-regenerate and contain key elements of native ecosystems such as wildlife and biological diversity. To us, this primarily includes boreal fibers known as Northern Bleached Softwood Kraft (NBSK).
STRATEGY PRIORITIES GOVERNANCE ASSURANCEDATA
SDG Alignment
Waste & Recycling Energy & Climate Supply ChainForests & Fiber

How Impact Is Achieved and Measured
• Continue to source 100% virgin wood fiber for our products from certified sources and apply the same objective to fiber-based packaging.
• Reduce the use of wood fiber sourced from natural forests by 50% and increase use of environmentally-preferred fiber (EPF) to 90% in our global tissue products by 2025.
• Deliver sustainable alternative fiber innovation to reduce our use of fiber sourced from natural forests.
• Support the Consumer Goods Forum commitment to zero net deforestation by 2020.
2018 Progress We reduced our use of fiber from natural forest landscapes by 30% over the 2011 base year, while 87% of the fiber used in our tissue products was from environmentally-preferred sources.
We are committed to responsible forestry practices and global organizations, like the Forest Stewardship Council® (FSC®), that link land owners, business, forestry and communities are an important part of our sustainable wood fiber strategy.
We engage customers and consumers through brand-led commercial programming, retail execution and partnerships to continuously raise visibility and education. To review our Forests & Fiber data, click here
Kimberly-Clark was honored by the Forest Stewardship Council® (FSC®) with a 2018 Leadership Award for our collaboration with World Wildlife Fund on the “Heart Your Planet” campaign in North America. The partnership increases consumer awareness about the importance of purchasing FSC®-certified products from responsibly managed forests. This is the third FSC® Leadership Award we have received since 2014.
STRATEGY PRIORITIES GOVERNANCE ASSURANCEDATA
Social Impact Waste & Recycling Energy & Climate Supply ChainForests & Fiber

2018 Featured Forests and Fiber StoriesEncouraging Responsible Forest Management: Kimberly-Clark has been involved in the Appalachian Woodlands Alliance (AWA), a project that brings together the Rainforest Alliance and forest product leaders across the United States who are committed to practicing responsible forestry. The AWA engages small landowners in the Southeastern United States to demonstrate the value in certifying their lands to the FSC® standard.Read more about the program
Employing the Circular Economy to Extend the Life of Packaging Waste: Kimberly-Clark Professional™ has been committed to using recycled fiber in its products for over three decades. As the availability of high-grade recycled fiber decreased, the team saw an opportunity in packaging waste. “We found ways to extract value from packaging waste and started processing these more challenging grades,” said Paul Williams, Global Kimberly-Clark Professional™ Senior Manufacturing Director, Towel and Tissue. “Our investments and technology around recycled fiber allow us to strike a balance between meeting customers’ quality requirements and expectations and doing the right thing for our planet.” Our 2015 investment in a drum pulper at our Loudon, Tennessee mill allows us to increase the amount of recycled fiber in a range of Kimberly-Clark Professional™ Kleenex and Scott brand towel products. Read more about the program
FORESTS& FIBER
STRATEGY PRIORITIES GOVERNANCE ASSURANCEDATA
Social Impact Waste & Recycling Energy & Climate Supply ChainForests & Fiber
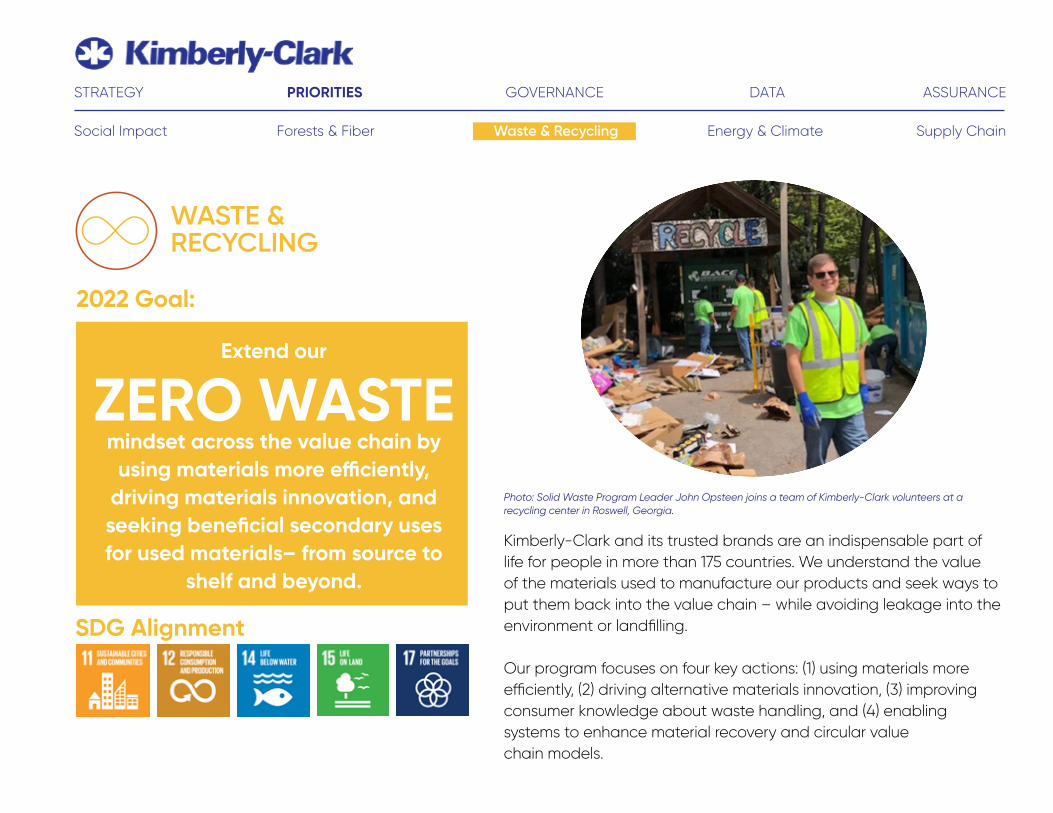
Kimberly-Clark and its trusted brands are an indispensable part of life for people in more than 175 countries. We understand the value of the materials used to manufacture our products and seek ways to put them back into the value chain – while avoiding leakage into the environment or landfilling.
Our program focuses on four key actions: (1) using materials more efficiently, (2) driving alternative materials innovation, (3) improving consumer knowledge about waste handling, and (4) enabling systems to enhance material recovery and circular value chain models.
Social Impact
Extend our
ZERO WASTEmindset across the value chain by
using materials more efficiently, driving materials innovation, and seeking beneficial secondary uses for used materials– from source to
shelf and beyond.
WASTE &RECYCLING
2022 Goal:
Photo: Solid Waste Program Leader John Opsteen joins a team of Kimberly-Clark volunteers at a recycling center in Roswell, Georgia.
STRATEGY PRIORITIES GOVERNANCE ASSURANCEDATA
SDG Alignment
Waste & Recycling Energy & Climate Supply ChainForests & Fiber

STRATEGY PRIORITIES GOVERNANCE ASSURANCEDATA
Kimberly-Clark is focused on designing packaging to be recyclable, reusable or compostable and is identifying partnerships and systems-based innovations that enable recycling. Our aspiration is to divert materials from our oceans and landfills and keep them in the value chain for secondary, beneficial uses.
We continue to support and grow recycling programs to raise consumer awareness on responsible disposal. Additionally, we are identifying opportunities to increase post-consumer recycled content in our plastic packaging.
Kimberly-Clark is a leader in standing up recycling initiatives around the world. We partner with organizations that educate consumers on recycling and provide collection points where consumers can drop off plastic packaging found on products like Kleenex, Cottonelle, and Huggies. In addition, our Kimberly-Clark Professional™ business labels their products to help end users easily know what’s eligible for recycling and how to do it.
How Impact Is Achieved and Measured• Net basis weight reduction
• Adopt cradle-to-cradle design principles and environmentally preferred materials innovation, including design of products/packaging to be recyclable, reusable or degradable, ensuring appropriate research and scientific evidence of materials breaking down in accordance with a credible standard • Increase the net value from waste services and recycling
• Deploy initiatives to avoid environmental leakage and/or landfill avoidance of 150,000 metric tons (MT) of post-consumer waste
Social Impact Waste & Recycling Energy & Climate Supply ChainForests & Fiber
To review our Waste & Recycling data, click here

2018 ProgressBased on our success in diverting manufacturing waste from landfills, we are extending our Zero Waste Mindset to products and packaging.We diverted 96% of our manufacturing waste from landfill to higher value beneficial uses in 2018.
We also achieved our post-consumer waste target of 20,000 MT in 2018. We diverted 21,245 MT of materials to higher value alternatives.
We’ve made great progress in diverting manufacturing waste and recognize the challenges to address the remaining few percentages of materials still going to landfills. And although we are happy with our 2018 post-consumer waste progress, there are many challenges in scaling product and systems solutions that enable us to achieve our program goal.
STRATEGY PRIORITIES GOVERNANCE ASSURANCEDATA
Both our consumer and Kimberly-Clark Professional™ businesses signed on to WRAP UK’s Plastics Pact, an ambitious initiative that brings businesses from across the plastics value chain together with the UK government and NGOs to keep plastic in the economy and out of the environment.
Social Impact Waste & Recycling Energy & Climate Supply ChainForests & Fiber

WASTE &RECYCLING
2018 Featured Waste & Recycling Stories
Turning Manufacturing Waste into Cardboard: Our Romagnano Mill in Italy is turning sludge, previously classified as “waste,” into a raw material used to produce new products. Since May 2017, our sludge has been used as a raw material by a manufacturer of cardboard. Not only does this reduce the quantity of material classified as waste, but it increases the number of available options to recover the material, reducing the dependency to landfill.Read more about the program
Incentivizing Waste Pickers to Divert Plastic from Environment: Kimberly-Clark partnered with Hyderabad, India-based social enterprise Waste Ventures India to educate and incentivize waste pickers to collect soft plastic packaging which is currently not collected by pickers because it lacks financial value. Once collected, the plastic packaging is converted from waste to energy, displacing coal. From August to December 2018, the project collected and processed 35 metric tons of soft plastic waste and is on track to achieve its 100 ton target by August. Read more about the program
STRATEGY PRIORITIES GOVERNANCE ASSURANCEDATA
Social Impact Waste & Recycling Energy & Climate Supply ChainForests & Fiber

Kimberly-Clark’s goal is to increase energy efficiency while at the same time finding alternative sources of energy. We deploy energy conservation and alternative energy programs to minimize climate change impacts, reduce greenhouse gas (GHG) emissions from our operations, and transform our financial performance.
Our programs focus on reducing GHG emissions from our direct emissions from operations (“Scope 1”) and our indirect emissions from utility suppliers (“Scope 2”). We also measure emissions from our upstream and downstream supply chain (“Scope 3”).
Social Impact
20%REDUCTION
in absolute greenhouse gasses versus a 2005 baseline.
ENERGY& CLIMATE
2022 Goal:
(Note: Modeling using the Science-Based Targets Initiative’s “Sectorial Decarbonisation Approach” validates that this target is aligned with climate science and is “science-based.”)
Photo: The solar energy project at our Tuas Mill in Singapore is the first Kimberly-Clark onsite renewable energy project in the region and is one of the largest solar panel installments in Singapore.
STRATEGY PRIORITIES GOVERNANCE ASSURANCEDATA
SDG Alignment
Waste & Recycling Energy & Climate Supply ChainForests & Fiber

How Impact Is Achieved and Measured
• Conservation Projects: Reduce GHG emissions and total delivered cost through the adoption of energy best practices and the identification and execution of energy reduction and efficiency improvement projects across our operations.
• LEAN Energy: Reduce greenhouse gas emissions and total delivered costs through LEAN energy deployment and energy efficiency standard practice adoption across our operations. LEAN Energy engages employees in a culture of conservation to execute process changes which optimize energy efficiency.
• Alternative Energy: Create a step change reduction in greenhouse gas emissions and energy cost by switching to lower carbon emitting fuels (e.g. natural gas, landfill gas, biomass and renewable energy).
To review our Energy & Climate data, click here
In 2017, Kimberly-Clark made a major commitment to renewable energy by entering its first utility-scale virtual power purchase agreements (VPPAs) for approximately 1 million megawatt hours (MWh) per year of electricity from two new wind power projects in Texas and Oklahoma. In 2018, the wind farms’ PPAs delivered a total of 786,681 MWh of renewable electricity to Kimberly-Clark, offsetting 99% of the electricity purchased by Kimberly-Clark Professional™ manufacturing sites in United States.
STRATEGY PRIORITIES GOVERNANCE ASSURANCEDATA
Social Impact Waste & Recycling Energy & Climate Supply ChainForests & Fiber

2018 ProgressWe are pleased to announce that Kimberly-Clark achieved a 27%GHG emissions reduction in 2018 (versus the 18% target) over our2005 baseline.
Since the start-up of our Sustainability 2022 strategy, a total of 809,000 MTCO2e have been reduced through:
• 400+ energy conservation projects, with GHG emission reductions of approximately 164,000 MTCO2.
• LEAN Energy full deployment in 37 sites, with GHG emissions reduction of approximately 78,000 MTCO2e.
• 6 alternative energy projects implemented around biomass boilers, fuel switching to lower GHG emitting fuels and cogeneration, with GHG emissions reduction of approximately 117,000 MT CO2e.
• 2 wind Virtual Power Purchase Agreement (VPPA) executed in Texas and Oklahoma, offsetting 450,000 MTCO2.
Since our 2022 goal was achieved several years early, we will continue to stretch in efforts to reduce GHG emissions by an additional 20% (market-based assessment).
STRATEGY PRIORITIES GOVERNANCE ASSURANCEDATA
We achieved ourenergy and climate
goal this year—4 years ahead of schedule!
GHG emissions from171,000 passenger vehiclesdriven for one year
CO2 emissions fromelectricity consumed by96,000 homes in one year
Equivalent reductionof 809,000 MTCO2e:
Social Impact Waste & Recycling Energy & Climate Supply ChainForests & Fiber
2018 Featured Energy & Climate Stories
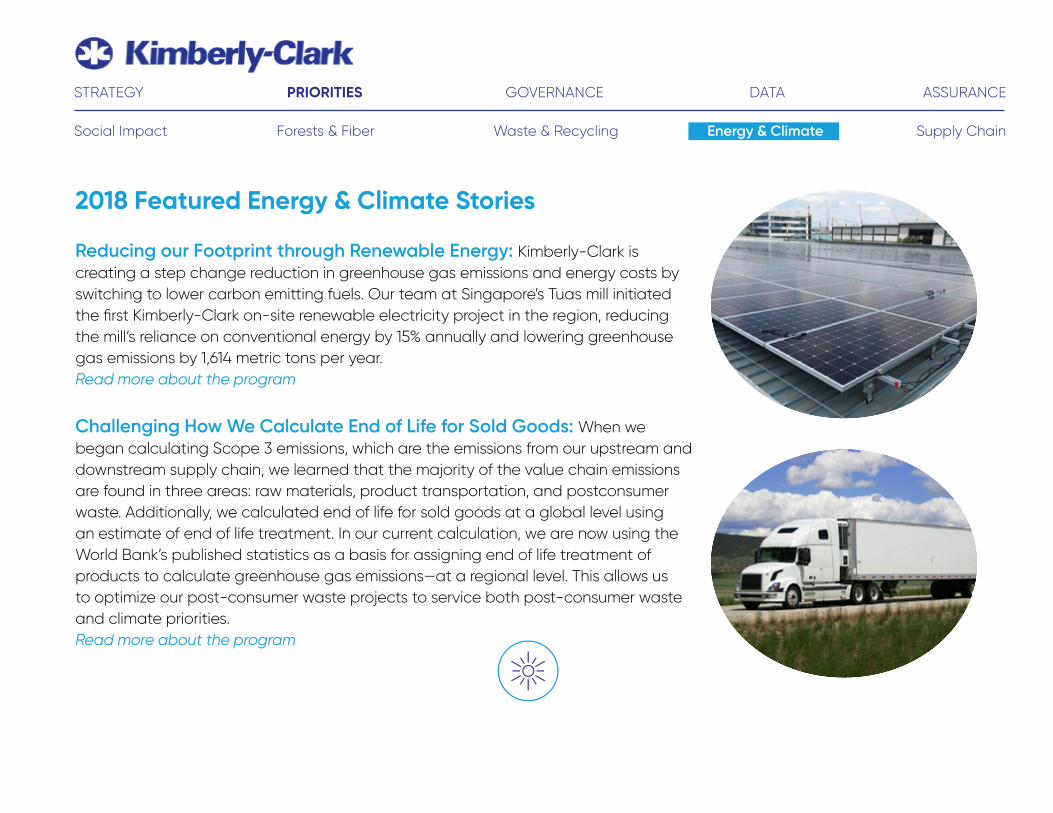
Reducing our Footprint through Renewable Energy: Kimberly-Clark is creating a step change reduction in greenhouse gas emissions and energy costs by switching to lower carbon emitting fuels. Our team at Singapore’s Tuas mill initiated the first Kimberly-Clark on-site renewable electricity project in the region, reducing the mill’s reliance on conventional energy by 15% annually and lowering greenhouse gas emissions by 1,614 metric tons per year.Read more about the program
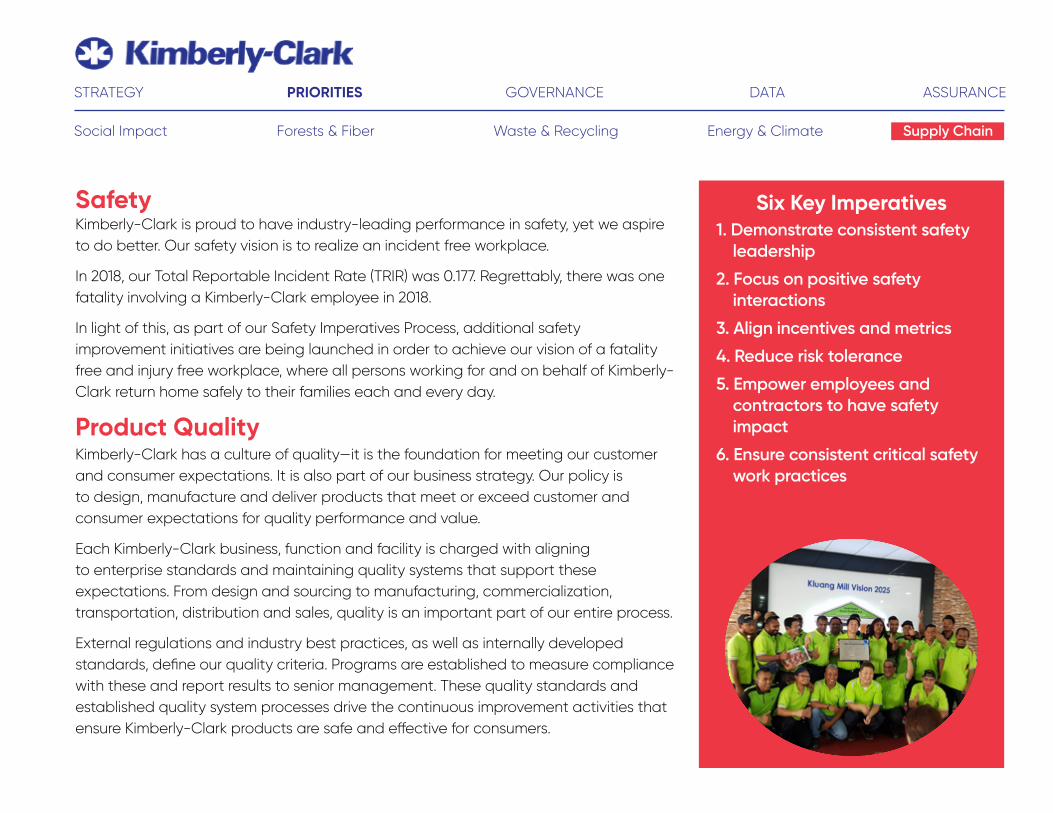
Challenging How We Calculate End of Life for Sold Goods: When we began calculating Scope 3 emissions, which are the emissions from our upstream and downstream supply chain, we learned that the majority of the value chain emissions are found in three areas: raw materials, product transportation, and postconsumer waste. Additionally, we calculated end of life for sold goods at a global level using an estimate of end of life treatment. In our current calculation, we are now using the World Bank’s published statistics as a basis for assigning end of life treatment of products to calculate greenhouse gas emissions—at a regional level. This allows us to optimize our post-consumer waste projects to service both post-consumer waste and climate priorities.Read more about the program
ENERGY& CLIMATE
STRATEGY PRIORITIES GOVERNANCE ASSURANCEDATA
Social Impact Waste & Recycling Energy & Climate Supply ChainForests & Fiber

Kimberly-Clark’s supply chain helps us deliver products that are essential for a better life to one quarter of the world’s population, every day. We recognize that a socially responsible supply chain creates value for the company, our customers and our suppliers while minimizing risks.
Our program focuses on working with our mills and key suppliers to ensure that (1) our standards for social and environmental performance are met, (2) the products and materials we purchase come from traceable, resilient and sustainable sources, and (3) we challenge our supply chain partners to drive innovation in sustainability.
Social Impact
LIVE OURVALUES
through proactive environmental and social programs.
SUPPLYCHAIN
2022 Goal:
Photo: Members of our global sustainability and procurement teams collaborate with suppliers to bring Total Water Management to the Romagnano mill in Italy.
STRATEGY PRIORITIES GOVERNANCE ASSURANCEDATA
SDG Alignment
Waste & Recycling Energy & Climate Supply ChainForests & Fiber

How Impact Is Achieved and Measured• Water: Invest in water treatment and recycling technologies and partner to support communities in water-stressed areas.
• Social Compliance: Monitor Kimberly-Clark and key supplier performance to our workplace and human rights standards.
• Supplier Collaboration: Partner to create shared value through sustainability-related innovation.
• Environmental, Health and Safety (EHS): Conduct EHS audits to confirm facility performance against safety and environmental standards and to check the health of our EHS Management System.
Photo: Global water program leader Vetrivel Dhagumudi leads community stakeholders in a water scarcity workshop.
STRATEGY PRIORITIES GOVERNANCE ASSURANCEDATA
Social Impact Waste & Recycling Energy & Climate Supply ChainForests & Fiber
To review our Supply Chain data, click here

Water Security
Water is an essential to a better life, and critical to many of Kimberly-Clark’s manufacturing processes. In addition, water resiliency creates social value.
Twelve of our 44 tissue manufacturing sites are located in water-stressed regions. Our water strategy has shifted focus to site specific sustainable water use targets at mills in water-stressed regions of the world. This is a shift from our past approach to company-wide water use reduction targets. Utilizing this approach, we are able to concentrate our impact to areas that need help the most. In fact, we have already seen positive results. We have achieved more than a 24% reduction in our water use at water-stressed mills.
We also recognize that the communities surrounding mills experiencing water stress will have important social needs. Engagement at the local community level is helping to identify appropriate mechanisms to support these needs.
STRATEGY PRIORITIES GOVERNANCE ASSURANCEDATA
In 2018, Cape Town, South Africa, came within days of running out of water. This posed a threat to production at our Epping Mill and to the lives of those in surrounding communities. The mill answered by introducing water-saving mechanisms and building a small water treatment plant. By the end of 2018, the mill had reduced water use by 58%. The mill also engaged with local stakeholders and NGO’s to drive action on sustainable water stewardship. The project continues to gain momentum and is becoming a model to tackling water stress around the world.
Social Impact Waste & Recycling Energy & Climate Supply ChainForests & Fiber

Commitment to Human Rights and Ethical PracticesWe are committed to ensuring that employees around the world – including those of our suppliers – are treated with respect and that our workplace and human rights standards are met.
This commitment is formalized in our Human Rights in Employment Policy and our Code of Conduct.
Centered on our values and reflecting our vision, our Supplier Social Compliance Standards are aligned with the goals of international standards like the International Labor Organization’s Declaration on Fundamental Principles and Rights at Work. Our Supplier Social Compliance Standards are publicly available and are shared with our suppliers on our SupplierLINK portal as well as through contract terms and conditions.
Our Code of Conduct guides our interaction with suppliers, partners, customers and consumers worldwide.
STRATEGY PRIORITIES GOVERNANCE ASSURANCEDATA
Social Impact Waste & Recycling Energy & Climate Supply ChainForests & Fiber

Ensuring Compliance Standards Are Met We assess and ensure both our suppliers and our own facilities comply with these standards through third-party audits. The Sedex SMETA 4 pillar audit standard is deployed as our preferred audit protocol. However, as members of the AIM-Progress, we also support the principle of Mutual Recognition and honor equivalent, recently-conducted audit reports conducted by accredited third-party auditors.
Audits are conducted using a risk-based approach to measure compliance. The audit makes an assessment of key issue areas, including freedom of association and collective bargaining; child labor; potential forced labor indicators and abuse of labor; discrimination; work hours, wages, and benefits; safe and healthy workplace; environment; and business integrity. If the results identify areas of non-compliance, Kimberly-Clark works closely with the supplier to remediate and resolve issues as quickly as possible.
We met our Social Compliance target for Kimberly-Clark sites and facilities by assuring 100% compliance with customer & licensor requirements as well as with our own Social Compliance Standard. Furthermore, we exceeded our target for suppliers by assuring that 82% of audited suppliers were compliant with our Standards and have sought to engage with remaining non-compliant suppliers on remediation of findings.
Supplier CollaborationWe believe that long-term strategic supplier relationships are key to driving innovative solutions that meet our consumer and customer needs. Through our Supplier Collaboration Program, we are committed to becoming a ‘Customer of Choice’ and partnering with key strategic suppliers.
In deploying these activities, we’ve identified actions in the areas of increased chemical transparency, expanded social compliance scope for labor categories, and expanded upon supplier risk assessment in due diligence processes.
By working together, we are accelerating efforts to create value from source to shelf across our supply chain.
STRATEGY PRIORITIES GOVERNANCE ASSURANCEDATA
Social Impact Waste & Recycling Energy & Climate Supply ChainForests & Fiber

Environmental ComplianceEnvironmental team members from around the world collaborate to build capabilities, continuously improve our systems and standards and assess performance gaps in areas including air emissions, chemical management, water and wastewater treatment, and waste management.
Elements of the environmental compliance program include:
• Optimizing the implementation of our Environmental, Health and Safety (EHS) Management System and its policy, organization, planning and implementation elements.
• Modeling our EHS Management System with the ISO 14001 Standard.
• Deployment of the EHS Audit program. Conformance is verified by first, second or third party audits and corrective measures are tracked to closure.
In 2018, we achieved our targets related to this program with 28 EHS audits conducted and on-time closure of more than 95% of environmental findings.
STRATEGY PRIORITIES GOVERNANCE ASSURANCEDATA
Social Impact Waste & Recycling Energy & Climate Supply ChainForests & Fiber
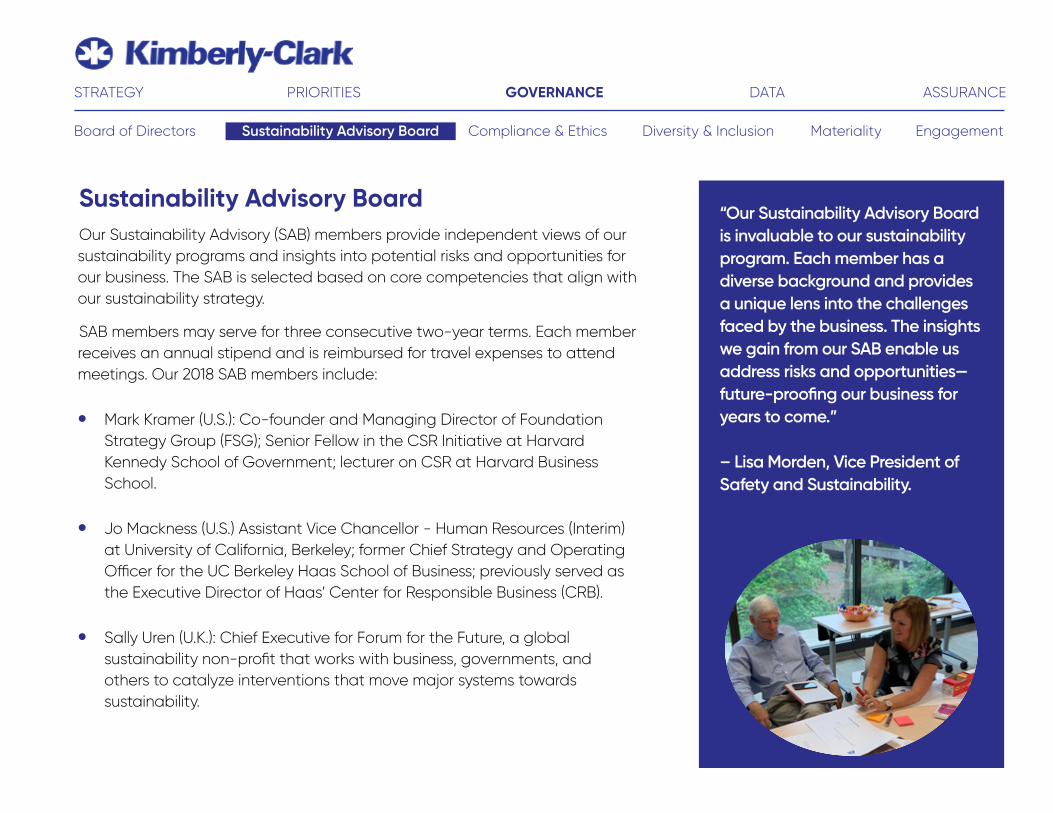
1. Demonstrate consistent safety leadership
2. Focus on positive safety interactions
3. Align incentives and metrics
4. Reduce risk tolerance
5. Empower employees and contractors to have safety impact
6. Ensure consistent critical safety work practices
SafetyKimberly-Clark is proud to have industry-leading performance in safety, yet we aspire to do better. Our safety vision is to realize an incident free workplace.
In 2018, our Total Reportable Incident Rate (TRIR) was 0.177. Regrettably, there was one fatality involving a Kimberly-Clark employee in 2018.
In light of this, as part of our Safety Imperatives Process, additional safety improvement initiatives are being launched in order to achieve our vision of a fatality free and injury free workplace, where all persons working for and on behalf of Kimberly-Clark return home safely to their families each and every day.
Product QualityKimberly-Clark has a culture of quality—it is the foundation for meeting our customer and consumer expectations. It is also part of our business strategy. Our policy is to design, manufacture and deliver products that meet or exceed customer and consumer expectations for quality performance and value.
Each Kimberly-Clark business, function and facility is charged with aligning to enterprise standards and maintaining quality systems that support these expectations. From design and sourcing to manufacturing, commercialization, transportation, distribution and sales, quality is an important part of our entire process.
External regulations and industry best practices, as well as internally developed standards, define our quality criteria. Programs are established to measure compliance with these and report results to senior management. These quality standards and established quality system processes drive the continuous improvement activities that ensure Kimberly-Clark products are safe and effective for consumers.
Six Key Imperatives
STRATEGY PRIORITIES GOVERNANCE ASSURANCEDATA
Social Impact Waste & Recycling Energy & Climate Supply ChainForests & Fiber

Governance
STRATEGY PRIORITIES GOVERNANCE ASSURANCEDATA

GovernanceKimberly-Clark remains committed to our values and guiding principles – quality, service, and fair dealing. Our governance structure grounds our day-to-day actions to ensure we conduct business with the highest standards and integrity. Our governance structure comprises of:
• A Board of Directors and its committees to provide oversight and guidance.
• An independent Sustainability Advisory Board to provide counsel on key governance, social and environmental issues.
• A clear reporting structure and lines of accountability.
• A global Code of Conduct.
• Corporate policies and local procedures.
More details on our governance and corporate policies can be found on our website.
Board of DirectorsOur Board of Directors and its committees provide oversight and guidance to our businesses and our relationships with stakeholders.
Kimberly-Clark’s annual proxy statement contains detailed information on our Board and committee structure, the independence of the members, and the responsibilities and meeting frequency of each committee.
To review our Governance data, click here
STRATEGY PRIORITIES GOVERNANCE ASSURANCEDATA
Board of Directors Compliance & Ethics Diversity & Inclusion MaterialitySustainability Advisory Board Engagement
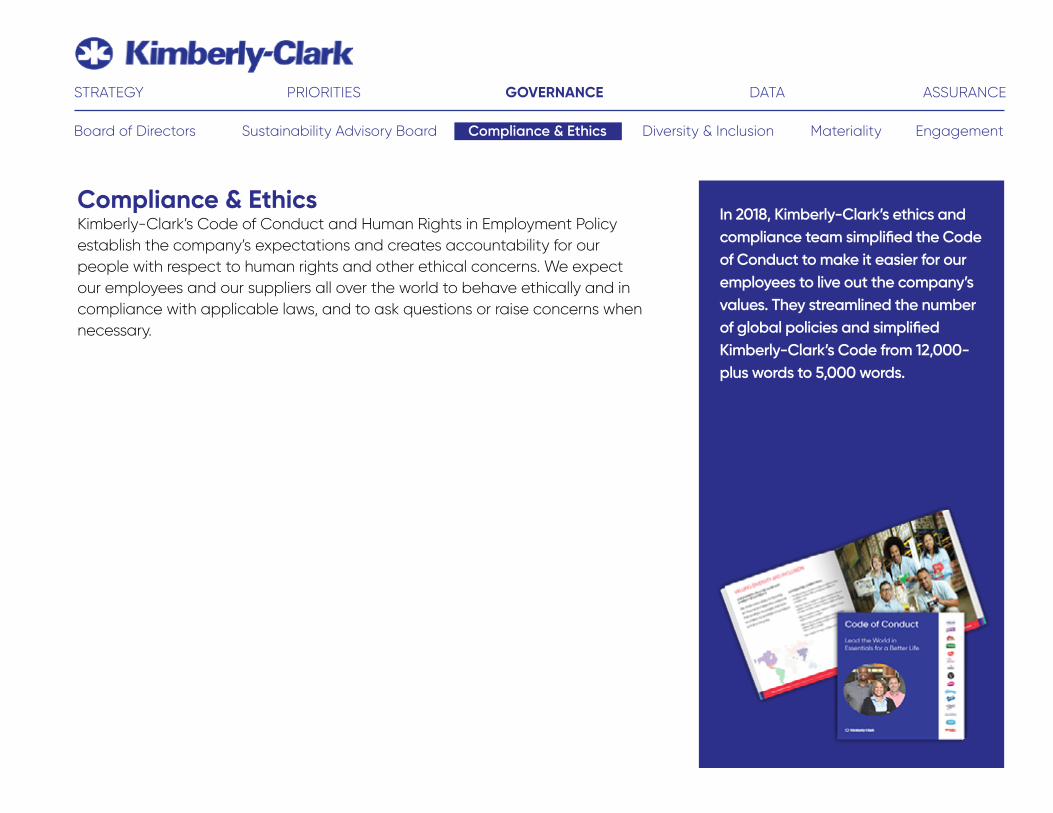
Sustainability Advisory BoardOur Sustainability Advisory (SAB) members provide independent views of our sustainability programs and insights into potential risks and opportunities for our business. The SAB is selected based on core competencies that align with our sustainability strategy.
SAB members may serve for three consecutive two-year terms. Each member receives an annual stipend and is reimbursed for travel expenses to attend meetings. Our 2018 SAB members include:
• Mark Kramer (U.S.): Co-founder and Managing Director of Foundation Strategy Group (FSG); Senior Fellow in the CSR Initiative at Harvard Kennedy School of Government; lecturer on CSR at Harvard Business School.
• Jo Mackness (U.S.) Assistant Vice Chancellor - Human Resources (Interim) at University of California, Berkeley; former Chief Strategy and Operating Officer for the UC Berkeley Haas School of Business; previously served as the Executive Director of Haas’ Center for Responsible Business (CRB).
• Sally Uren (U.K.): Chief Executive for Forum for the Future, a global sustainability non-profit that works with business, governments, and others to catalyze interventions that move major systems towards sustainability.
“Our Sustainability Advisory Board is invaluable to our sustainability program. Each member has a diverse background and provides a unique lens into the challenges faced by the business. The insights we gain from our SAB enable us address risks and opportunities— future-proofing our business for years to come.” – Lisa Morden, Vice President of Safety and Sustainability.
STRATEGY PRIORITIES GOVERNANCE ASSURANCEDATA
Compliance & Ethics Diversity & Inclusion MaterialitySustainability Advisory Board EngagementBoard of Directors
Compliance & EthicsKimberly-Clark’s Code of Conduct and Human Rights in Employment Policy establish the company’s expectations and creates accountability for our people with respect to human rights and other ethical concerns. We expect our employees and our suppliers all over the world to behave ethically and in compliance with applicable laws, and to ask questions or raise concerns when necessary.
In 2018, Kimberly-Clark’s ethics and compliance team simplified the Code of Conduct to make it easier for our employees to live out the company’s values. They streamlined the number of global policies and simplified Kimberly-Clark’s Code from 12,000-plus words to 5,000 words.
STRATEGY PRIORITIES GOVERNANCE ASSURANCEDATA
Diversity & Inclusion Materiality EngagementBoard of Directors Sustainability Advisory Board Compliance & Ethics

Diversity & InclusionOur People Philosophy describes our performance-driven culture and exemplifies what it means to unleash the power of our people. Through our People Philosophy, we are creating a culture where people thrive and develop with collaborative teams that have a passion to win and a desire to make a difference.
As a global company, we work to attract and retain great people from diverse backgrounds and perspectives.
Increasing the representation of women (globally) and ethnic minorities (U.S.) in senior management positions (defined as Director-level and above) and ensuring a robust pipeline of diverse talent is part of our ongoing people strategy.
Talent DevelopmentDeveloping leaders and top talent is critical, so we value a work environment that fosters personal, professional and corporate growth while building a performance-driven organization to attract, engage, develop, reward and retain top talent.
In November 2018, more than 90 employees from the African American Employee Network (AAEN), Focus Asia (FA) and Latin American Network for Diversity (LAND) attended the NA Multicultural Leadership & Development Symposium. The Symposium provided an opportunity for professional development, exposure to senior leaders, and networking for all salaried employees within Kimberly-Clark North America while providing leaders an opportunity to identify future talent.
STRATEGY PRIORITIES GOVERNANCE ASSURANCEDATA
Diversity & Inclusion Materiality EngagementBoard of Directors Sustainability Advisory Board Compliance & Ethics

MaterialityThe Global Reporting Initiative’s (GRI) materiality principle states that a sustainability report should cover aspects that:
• Reflect the organization’s significant economic, environmental and social impacts; or
• Substantively influence the assessments and decisions of stakeholders.
We conducted a non-financial materiality assessment to determine topics deemed most important to both internal and external stakeholders.
The materiality assessment results inform our sustainability strategies and ensure we provide transparent, comprehensive and accessible coverage of topics that are of significant importance to key stakeholders and reflect the organization’s significant economic, environmental and social impacts on the business.
STRATEGY PRIORITIES GOVERNANCE ASSURANCEDATA
Diversity & Inclusion Materiality EngagementBoard of Directors Sustainability Advisory Board Compliance & Ethics

Materiality Matrix
Chemical usage
Environmentally-friendly products & packagingWaterscarcity
Waterscarcity
Responsible marketingManufacturing wasteWater management
Bribery & corruption
Empowerment of women and girls
Talent development
Occupational health & safety
Deforestation
Forced laborChild labor
Customer satisfaction
Innovation
Product quality and safety
Climate change
Access to sanitation infrastructure
Product & packaging end-of-life
Energy usageLeadership succession plan
LOW
MED
IUM
HIG
HV
ERY
HIG
H
IMPO
RTA
NC
E TO
STA
KEH
OLD
ERS
IMPACT ON THE BUSINESS
BiodiversityHygiene education
Responsible remuneration
Freedom of association & collective bargaining
Animal testingSupply chain diversity
Female menstrual education
Alternative fiber
Fiber
PetrochemicalsChanges in tax regulation
Transportation
Ethical sourcing
Maternal and child health Economic development
Big data
Political & economic stability
E-commerce
Commodity volatility
Emerging middle class
Active aging
Private label
Diversity & inclusionIP
LOW MEDIUM HIGH VERY HIGH
KEY Business practices
EnvironmentProduct People & Community
Talent attraction & retentionOperating context
STRATEGY PRIORITIES GOVERNANCE ASSURANCEDATA
Diversity & Inclusion Materiality EngagementBoard of Directors Sustainability Advisory Board Compliance & Ethics

Stakeholder EngagementWe engage with stakeholders in many ways on an ongoing basis – ranging from conducting customer and consumer research to engaging in dialogue and developing strategic partnerships with environmental and humanitarian organizations.
In addition, we communicate progress to the shareholder and investment communities through our Annual 10-K, through investor and shareholder meetings, at analyst-sponsored conferences and through distribution of our sustainability reporting content.
External PrinciplesThe United Nations’ 2030 Agenda for Sustainable Development includes a set of 17 Sustainable Development Goals (SDGs) to end poverty, fight inequality and injustice, and tackle climate change by 2030. We use the SDGs as a guide for the programs and initiatives we plan in support of our Sustainability 2022 goals.
As a signatory to the United Nations Global Compact, we are committed to upholding the Compact’s 10 Principles (per UNGC) on human rights, labor standards, the environment and anti-corruption, working within our sphere of influence to encourage their support.
STRATEGY PRIORITIES GOVERNANCE ASSURANCEDATA
Diversity & Inclusion Materiality EngagementBoard of Directors Sustainability Advisory Board Compliance & Ethics

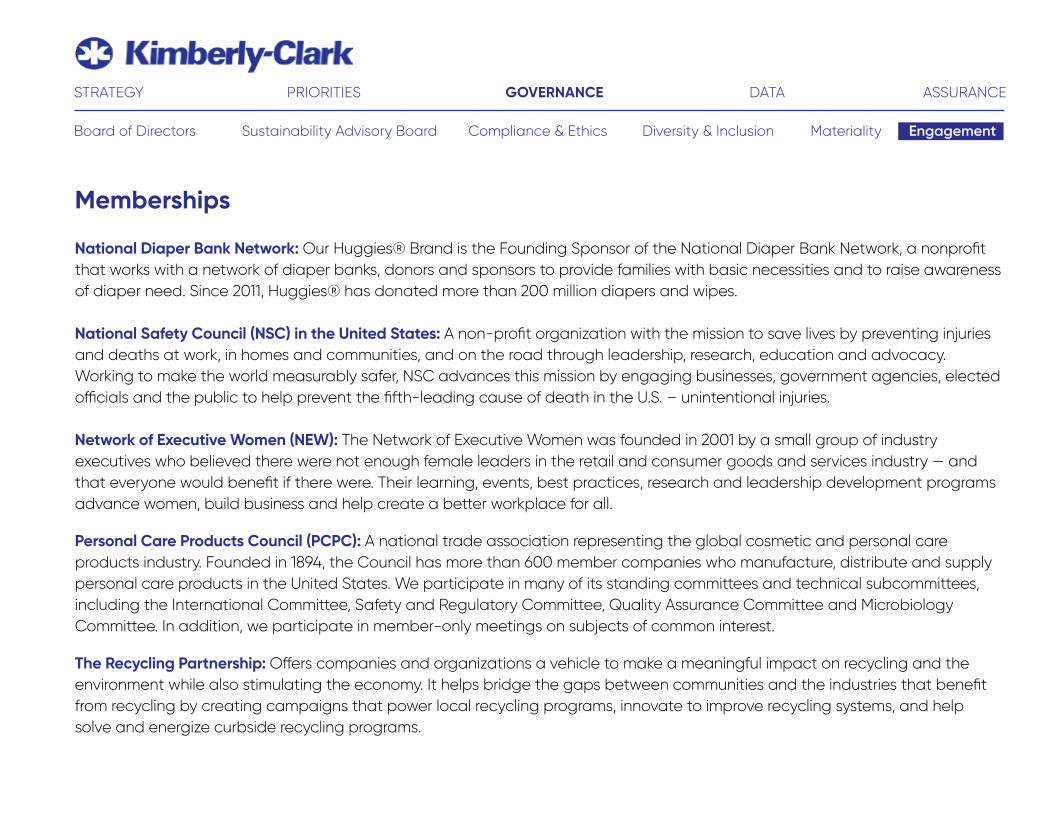
Memberships
These memberships provide platforms for the company to learn and share information about sustainability and related issues.
AIM-PROGRESS: A forum of leading Fast Moving Consumer Goods manufacturers assembled to enable and promote responsible sourcing practices and sustainable supply chains. The forum’s key objectives include building supply chain capability, effectively assuring compliance to aligned standards among members and driving continuous improvement in member supply chains.
Alliance for Period Supplies: The Alliance for Period Supplies was formed in partnership with the National Diaper Bank Network in 2018 to provide women and girls in need with period supplies. As the organization’s founding sponsor, our U by Kotex® brand has donated more than 17 million period supplies to help end period poverty in the U.S.
Association of Plastic Recyclers (APR): U.S trade association that promotes development of the plastics recycling industry by providing leadership for long-term industry growth and vitality.
Canopy: Canopy works to protect the world’s forests, species and climate by collaborating with business leaders, scientists and decision-makers to help create sustainable supply chains and foster innovative solutions to environmental challenges.
Catalyst: Catalyst helps companies in measuring or diagnosing talent management gaps or identifying the best strategies that organizations and individual business leaders can use to access and leverage the best talent. Through a combination of research and practical implementation, and often in partnership with others, they identify and provide solutions to overcoming these barriers and creating equitable workplaces in which all talent can thrive.
CEO Action for Diversity & Inclusion: A business commitment led by 600 CEOs from leading companies and business organizations to advance diversity and inclusion within the workplace.
STRATEGY PRIORITIES GOVERNANCE ASSURANCEDATA
Diversity & Inclusion Materiality EngagementBoard of Directors Sustainability Advisory Board Compliance & Ethics

Memberships
The Conference Board: A global, independent business membership and research association working in the public interest to help leaders navigate the biggest issues impacting business and better serve society. The Sustainability Council helps companies reshape and enhance sustainability efficiencies, embed sustainability into corporate strategy, and deliver products, services, and solutions that drive reductions in environmental footprint for customers.
The Consumer Goods Forum: A global industry network comprised of the CEOs and senior management of about 400 diverse retailers, manufacturers, service providers and other stakeholders across 70 countries.
Corporate Eco Forum: A community of global leaders, representing 18 industries and $3 trillion in revenues, dedicated to advancing sustainable business.
EDANA: The international association serving non-wovens and related industries. EDANA provides global leadership to create an environment beneficial to sustainable and profitable growth of the non-wovens and engineered fabrics and related industries to best serve our customers.
STRATEGY PRIORITIES GOVERNANCE ASSURANCEDATA
Diversity & Inclusion Materiality EngagementBoard of Directors Sustainability Advisory Board Compliance & Ethics

Memberships
U.S. Environmental Protection Agency (EPA) SmartWay Transportation Partner: Together, we have increased our intermodal usage by reducing length of haul, total miles, empty miles and wait time and idling at shipping and receiving docks. Since 2006, we have more than doubled intermodal utilization, from approximately 42,000 loads in 2006 to more than 85,600 loads in 2016, resulting in savings of more than 9 million gallons of diesel fuel and reduction of CO2 emissions by more than 200 million pounds.
European Partnership for Alternative Approaches to Animal Testing (EPAA): A collaboration between the European Commission, European trade associations, and companies committed to pooling knowledge and resources to accelerate the development, validation, and acceptance of alternative approaches to animal use in regulatory testing. The overall aim is the replacement, reduction, and refinement (3Rs) of animal use in regulatory testing.
Flexible Film Recycling Group (FFRG): A partnership of stakeholders from the polyethylene (PE) film value chain, including major resin suppliers, manufacturers (also known as converters), brand owners and recyclers that is working to significantly increase the collection and recycling of all flexible films and to educate the public about the importance of recycling.
Forest Stewardship Council® (FSC®): An independent, non-profit organization that protects forests for future generations. We are a member of FSC International and have renewed our Cooperation Agreement in 2013 as FSC’s selected global partner to represent the tissue industry. For the duration of this two-year agreement, we are working with FSC to create activities that will be mutually beneficial to each organization and will seek to drive increased awareness of the FSC brand, to increase the growth of FSC-certified forest areas globally and to consider the opportunities for certification of non-wood alternative fibers. We funded FSC Canada to conduct field-tests of the FSC Guidelines on Free Prior and Informed Consent that support compliance with social requirements as part of the FSC certification process. In addition, we are a representative on the FSC National Board of Directors in the United States.
STRATEGY PRIORITIES GOVERNANCE ASSURANCEDATA
Diversity & Inclusion Materiality EngagementBoard of Directors Sustainability Advisory Board Compliance & Ethics

Memberships
Foundation for Strategic Sourcing (F4SS): The Foundation for Strategic Sourcing is a non-profit organization with a primary goal to establish a forum whereby CPG marketers, external manufacturers, and secondary packagers can share the best practices towards the creation of Industry Standards aimed at improving efficiency and reducing supply chain costs.
INDA: INDA is the Association of the Nonwoven Fabrics Industry, which helps member companies in the nonwovens/engineered fabrics industry connect, innovate and develop their businesses.
Industrial Energy Consumers of America (IECA): A non-profit, member-led organization to help manufacturing companies for which the availability, use, and cost of energy, power, or feedstock play a role in their ability to compete in domestic and world markets. IECA has six organized committees; Kimberly-Clark is a member of the Energy Committee.
International Organization of Employers (IOE): IOE represents business interests in social and labor matters at the global level, especially in the International Labor Organization, which sets international workplace standards and where employers are represented alongside trade unions and governments. IOE communicates business views on the ILO’s work, including education and training, termination of employment, social security, health and safety, labor standards, and represents employers within the ILO’s complaints and supervisory mechanisms. IOE also represents the views of business in the G20 process, the International Standardization Organization, the World Health Organization and the UN Human Rights Council, among other organizations.
Institute for In Vitro Sciences (IIVS): Kimberly-Clark is a founding member and continuing supporter of IIVS, a non-profit foundation that promotes adoption and regulatory acceptance of alternatives to laboratory animal testing.
Leading Executives Advancing Diversity (LEAD): The Board of Advisors for the LEAD network and has served on the board since its founding. The mission of the LEAD Network is to attract, retain and advance women in the retail and consumer goods industry in Europe through education, leadership and business development. Its vision includes a diverse workforce where both men and women are enabled to contribute their full potential and lead their organizations to the next level of value creation.
STRATEGY PRIORITIES GOVERNANCE ASSURANCEDATA
Diversity & Inclusion Materiality EngagementBoard of Directors Sustainability Advisory Board Compliance & Ethics
Memberships
National Diaper Bank Network: Our Huggies® Brand is the Founding Sponsor of the National Diaper Bank Network, a nonprofit that works with a network of diaper banks, donors and sponsors to provide families with basic necessities and to raise awareness of diaper need. Since 2011, Huggies® has donated more than 200 million diapers and wipes.
National Safety Council (NSC) in the United States: A non-profit organization with the mission to save lives by preventing injuries and deaths at work, in homes and communities, and on the road through leadership, research, education and advocacy. Working to make the world measurably safer, NSC advances this mission by engaging businesses, government agencies, elected officials and the public to help prevent the fifth-leading cause of death in the U.S. – unintentional injuries.
Network of Executive Women (NEW): The Network of Executive Women was founded in 2001 by a small group of industry executives who believed there were not enough female leaders in the retail and consumer goods and services industry — and that everyone would benefit if there were. Their learning, events, best practices, research and leadership development programs advance women, build business and help create a better workplace for all.
Personal Care Products Council (PCPC): A national trade association representing the global cosmetic and personal care products industry. Founded in 1894, the Council has more than 600 member companies who manufacture, distribute and supply personal care products in the United States. We participate in many of its standing committees and technical subcommittees, including the International Committee, Safety and Regulatory Committee, Quality Assurance Committee and Microbiology Committee. In addition, we participate in member-only meetings on subjects of common interest.
The Recycling Partnership: Offers companies and organizations a vehicle to make a meaningful impact on recycling and the environment while also stimulating the economy. It helps bridge the gaps between communities and the industries that benefit from recycling by creating campaigns that power local recycling programs, innovate to improve recycling systems, and help solve and energize curbside recycling programs.
STRATEGY PRIORITIES GOVERNANCE ASSURANCEDATA
Diversity & Inclusion Materiality EngagementBoard of Directors Sustainability Advisory Board Compliance & Ethics

Memberships
#SeeHer: Led by the Association of National Advertisers (ANA), its mission is to increase the percentage of accurate portrayals of women and girls in U.S. advertising and media by 20% by 2020.
Supply Chain Management (SCM) World, a Gartner Company: SCM World is a cross-industry community of the leading supply chain practitioners. The community works together to advance the profession of supply chain management. Our Supply Chain Vice President, Sandra MacQuillan, is on the Executive Advisory Board.
Sustainable Brands: A learning, collaboration and commerce community of more than 348,000 sustainable business leaders from around the globe. The organization works to empower more brands to prosper by leading the way to a better world. As a corporate member, we leverage access to a peer-to-peer learning and networking group that supports us in meeting our sustainability goals.
Sustainable Packaging Coalition (SPC): A membership-based collaborative that provide thought leadership and bring our members together to strengthen and advance the business case for more sustainable packaging.
Toilet Board Coalition: The Toilet Board Coalition is a business led, public-private partnership that is made up of leading companies, government agencies, sanitation experts and non-profit organizations. Kimberly-Clark became a founding member in 2014 to help accelerate the development of the sanitation economy. Rishi Dhingra, Global Sector Lead, Vice President for Kimberly Clark’s Family Care sector and Jenny Lewis, Vice President of Kimberly-Clark’s foundation, both serve as steering committee members.
Trash Free Seas Alliance: Ocean Conservancy’s Trash Free Seas Alliance is a partnership that brings together businesses, academia, and civil society organizations to identify solutions to keep plastics out of the ocean. As members of the steering committee, our role is, in part, to shape the scope of and guide the work as well as help open doors and be some of the on-the-ground implementers of programs.
STRATEGY PRIORITIES GOVERNANCE ASSURANCEDATA
Diversity & Inclusion Materiality EngagementBoard of Directors Sustainability Advisory Board Compliance & Ethics

Memberships
United States Council for International Business (USCIB): Promotes open markets, competitiveness, innovation, sustainable development and corporate responsibility supported by international engagement and prudent regulation. USCIB presents American business views on a wide range of issues – from environmental regulation to trade policy to labor relations – directly to U.S. policymakers, U.N. and E.U. officials and a host of governments and other groups.
WRAP UK Plastics Pact: The WRAP UK Plastics Pact is an ambitious initiative that brings businesses from across the plastics value chain together with the UK government and NGOs to keep plastic in the economy and out of the environment. Signatories of the pact have committed to hit several of bold targets by 2025.
World Wildlife Fund’s (WWF) Global Forest and Trade Network (GFTN): A program to expand responsible and credibly-certified forest management which includes technical assistance throughout the certification process and enhanced marketing opportunities. GFTN participants are committed to increasing the availability of forest products from well-managed forests, helping each other benefit and profit from sustainable forest management and ending the purchase of forest products from illegal and controversial sources. We first joined GFTN in 2008 in the United Kingdom and signed a global agreement with WWF in 2011. We work with WWF to help implement the company’s global fiber procurement policy, and WWF provides technical assistance and feedback as we progressively increase the amount of environmentally-preferred fiber used in making its tissue and personal care products.
STRATEGY PRIORITIES GOVERNANCE ASSURANCEDATA
Diversity & Inclusion Materiality EngagementBoard of Directors Sustainability Advisory Board Compliance & Ethics

Organization Award Description
Ambito Financiero Newspaper, CEOP Ranking
CEOP Ranking Finished 5th CEOP and 3rd in sector ranking
Apertura Magazine Third place Best Employers Ranking Third place for Best Employers Ranking
CEOWORLD Magazine #17 of 100 The Best US Companies to Work For
K-C was named to the 2019 Best US Companies to Work For with a #17 ranking of 100 companies
Corporate Reputation Magazine #29 ranking out of 100 K-C ranked among the 100 Best Corporate Citizens with a ranking of 29th according to CR Magazine, down from 21st in 2017
CSO Magazine CSO50 The CSO50 recognizes 50 security projects that demonstrate outstanding thought leadership and business value
Delaware County Chamber of Commerce
Community Economic Impact Award The chamber recognized the community benefits of the mill changing its on-site power source from coal to natural gas
DERES DERES Awards Kimberly-Clark Uruguay was recognized with the DERES Awards in the Ethics and Corporate Government category for its “K-C Way” initiative promoting ethics and good corporate governance practices
EPA SmartWay Excellence Award Kimberly-Clark was honored for the 9th time (sixth consecutive year) with a SmartWay® Excellence Award from the U.S. Environmental Protection Agency for working with transportation providers to move goods in the cleanest, most energy-efficient way possible, while reducing the impacts of carbon pollution
Ethibel Forum Ethibel Sustainability Index: Excellence Ranking
Kimberly-Clark reconfirmed as a constituent of the Ethibel Sustainability Index (ESI) Excellence Global for playing a leading role in corporate social responsibility
Ethical Corporation 2018 Responsible Business Award for Climate Action
Recognized the company’s innovative strategies to reduce the climate impacts of its operations through energy conservation, transformative LEAN energy management programs and the increased use of alternative energy sources including renewable energy
Forbes Ranked #229 in America’s Best Employers For Women
Kimberly-Clark was ranked #229 in Forbes America’s Best Employers for Women
Forbes Ranked #99 in America’s Most Reputable Companies
Kimberly-Clark was ranked #99 in the 2018 Forbes America’s Most Reputable Companies list
Forbes Forbes’ 2018 World’s Best Employers List (#81)
Forbes’ World’s Best Employers (#81) – In 2018, Kimberly-Clark was ranked #81 overall in the Forbes’ World’s Best Employers list, up from #96 in 2017
Forbes The Just 100: America’s Best Corporate Citizens (#17)
In 2018, Kimberly-Clark received a ranking of 17 and was one of four Personal Products companies recognized in the top 100
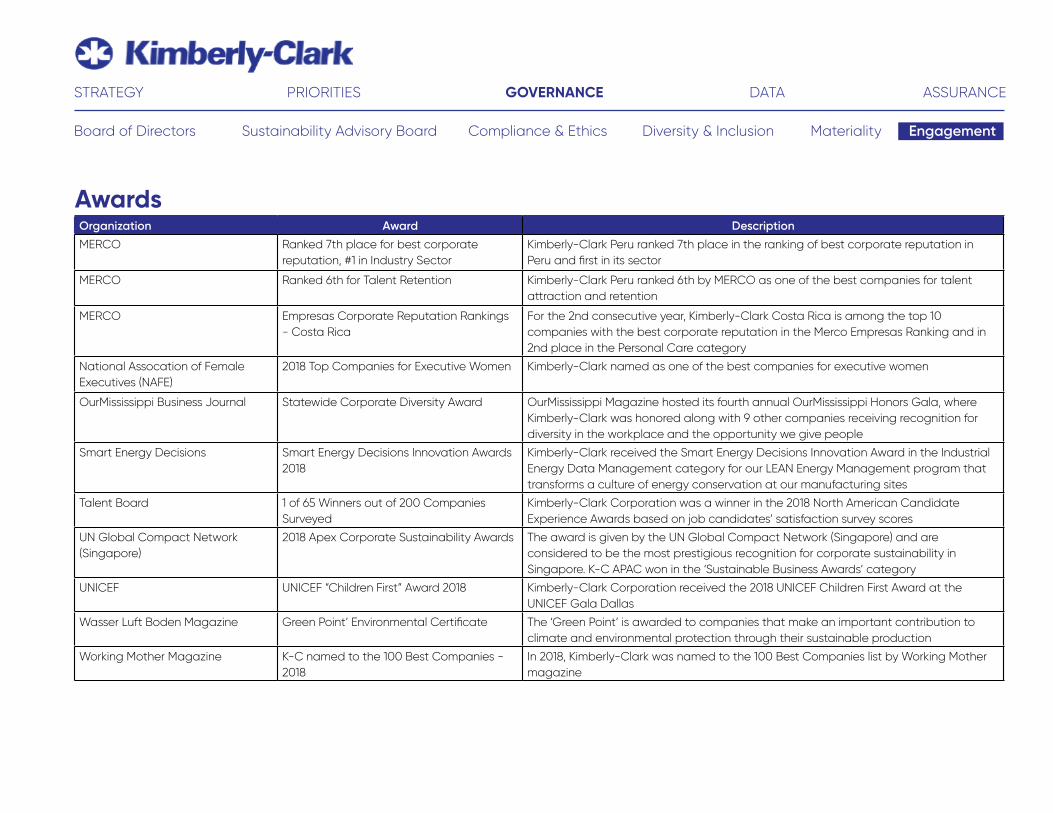
Awards
STRATEGY PRIORITIES GOVERNANCE ASSURANCEDATA
Diversity & Inclusion Materiality EngagementBoard of Directors Sustainability Advisory Board Compliance & Ethics

Organization Award Description
Forbes Ranked #56 in Best Employers for Diversity 2018
Kimberly-Clark was ranked #56 on the list of America’s Best Employers for Diversity
Forbes Magazine/Reputation Institute
World’s Most Reputable Companies for Corporate Responsibility 2018
Kimberly-Clark was ranked in the Top 100 for the first time at #37 spot
Forbes/Reputation Institute US RepTrak
Ranked #83 for World’s Most Reputable Companies
Kimberly-Clark was ranked #83 in the 2018 Forbes World’s Most Reputable Companies list
Forest Stewardship Council (FSC) 2018 FSC Leadership Awards Kimberly-Clark and World Wildlife Fund were recognized for an uncommon partnership that is engaging consumers about the importance of looking for the FSC label to support responsible forest management
FORTUNE #155 on the World’s Most Admired Companies List
The FORTUNE World’s Most Admired Companies study surveys top executives and directors from eligible companies, along with financial analysts, to identify the companies that enjoy the strongest reputations within their industries and across industries
Human Rights Campaign (HRC) 2018 Corporate Equality Index - Perfect Score
The CEI Survey committee reviews all submissions and assigns a score to each applicant. Kimberly-Clark Corporation received a perfect score of 100% on the 2018 Corporate Equality Index for the 2nd consecutive year
Imagen Magazine Eikon Silver Award Kimberly-Clark Argentina and their sustainability report was acknowledged with a silver award based on institutional communication, public affairs, political communication, public relations, publicity and marketing
Korn Ferry 2018 Employee Engagement Awards Based on a global survey of 52 companies in 47 countries, Kimberly-Clark was recognized a top employer based on answers to two questions: I feel proud to work there and I would recommend it a good place to work
MERCO K-C Argentina one of the best companies to work for
Kimberly-Clark Argentina ranked by MERCO as one of the top 100 companies to work for and recognized for the 9th consecutive time back to 2010 in the Corporate Reputation ranking
MERCO Ranked 24th for Talent Retention Kimberly-Clark Argentina ranked 24th and for the 5th consecutive year by MERCO as one of the best companies for talent attraction and retention. Ranked 2nd when broken out by industry sector
MERCO Ranked 14th for Best Corporate Reputation, #1 in Industry Sector
Kimberly-Clark Bolivia ranked 14th of companies with the best corporate reputation and #1 in the consumer goods sector in the latest MERCO ranking that evaluates brands with higher reputation
Awards
STRATEGY PRIORITIES GOVERNANCE ASSURANCEDATA
Diversity & Inclusion Materiality EngagementBoard of Directors Sustainability Advisory Board Compliance & Ethics
Organization Award Description
MERCO Ranked 7th place for best corporate reputation, #1 in Industry Sector
Kimberly-Clark Peru ranked 7th place in the ranking of best corporate reputation in Peru and first in its sector
MERCO Ranked 6th for Talent Retention Kimberly-Clark Peru ranked 6th by MERCO as one of the best companies for talent attraction and retention
MERCO Empresas Corporate Reputation Rankings - Costa Rica
For the 2nd consecutive year, Kimberly-Clark Costa Rica is among the top 10 companies with the best corporate reputation in the Merco Empresas Ranking and in 2nd place in the Personal Care category
National Assocation of Female Executives (NAFE)
2018 Top Companies for Executive Women Kimberly-Clark named as one of the best companies for executive women
OurMississippi Business Journal Statewide Corporate Diversity Award OurMississippi Magazine hosted its fourth annual OurMississippi Honors Gala, where Kimberly-Clark was honored along with 9 other companies receiving recognition for diversity in the workplace and the opportunity we give people
Smart Energy Decisions Smart Energy Decisions Innovation Awards 2018
Kimberly-Clark received the Smart Energy Decisions Innovation Award in the Industrial Energy Data Management category for our LEAN Energy Management program that transforms a culture of energy conservation at our manufacturing sites
Talent Board 1 of 65 Winners out of 200 Companies Surveyed
Kimberly-Clark Corporation was a winner in the 2018 North American Candidate Experience Awards based on job candidates’ satisfaction survey scores
UN Global Compact Network (Singapore)
2018 Apex Corporate Sustainability Awards The award is given by the UN Global Compact Network (Singapore) and are considered to be the most prestigious recognition for corporate sustainability in Singapore. K-C APAC won in the ‘Sustainable Business Awards’ category
UNICEF UNICEF “Children First” Award 2018 Kimberly-Clark Corporation received the 2018 UNICEF Children First Award at the UNICEF Gala Dallas
Wasser Luft Boden Magazine Green Point’ Environmental Certificate The ‘Green Point’ is awarded to companies that make an important contribution to climate and environmental protection through their sustainable production
Working Mother Magazine K-C named to the 100 Best Companies - 2018
In 2018, Kimberly-Clark was named to the 100 Best Companies list by Working Mother magazine
Awards
STRATEGY PRIORITIES GOVERNANCE ASSURANCEDATA
Diversity & Inclusion Materiality EngagementBoard of Directors Sustainability Advisory Board Compliance & Ethics

Data
The GRI Report has been prepared in accordance with the Global Reporting Initiative (GRI) Standard: Core option. The content index that follows cross-references the GRI disclosures and each of the 10 UNGC principles with information aligned with that disclosure or principle and serves as our Communication on Progress (COP.)
STRATEGY PRIORITIES GOVERNANCE ASSURANCEDATA

Financials 2010 2011 2012 2013 2014 2015 2016 2017 2018Net Income ($B)1 $1.8 $1.6 $1.8 $2.1 $1.52 $1.01 $2.17 $2.28 $1.41Net sales ($B)1 $18.3 $19.3 $19.5 $19.6 $19.7 $18.6 $18.2 $18.3 $18.5Net sales by division ($B)1
Personal Care1 $8.7 $9.1 $9.6 $9.5 $9.6 $9.2 $9.0 $9.1 $9.0 Consumer Tissue1 $6.5 $6.8 $6.5 $6.6 $6.6 $6.1 $6.0 $5.9 $6.0 K-C Professional1 $3.1 $3.3 $3.3 $3.3 $3.4 $3.2 $3.2 $3.2 $3.4Net sales by region ($B) North America1 $10.7 $10.8 $9.4 $9.4 $9.4 $9.5 $9.5 $9.4 $9.5 Outside North America1 $9.2 $9.3 Europe1 $3.2 $3.4 $3.1 $2.8 $2.7 $2.3 $2.2 Asia, Latin America & Other1 $6.6 $7.5 $7.3 $7.6 $8.0 $7.2 $6.8 Intergeographic: (Asia, Latin America & Other1 2
$(0.7) $(0.8) $(0.4) $(0.3) $(0.4) $(0.4) $(0.3) $(0.3) $(0.3)
Operating costs ($B)1 $15.7 $17.2 $17.1 $16.7 $16.8 $15.4 $14.9 $14.9 $16.3Cash returned to shareholders ($B) $1.9 $2.3 $2.4 $2.4 $3.2 $2.1 $2.0 $2.3 $2.2Income taxes paid ($B) $0.6 $0.5 $0.5 $0.8 $0.9 $0.7 $0.7 $1.0 $0.4
Total environmental expenditures ($M)3 $201 $226 $166 $168 $169 $173 $152 $126 $158 Capital3 $26 $32 $22 $30 $38 $61 $44 $21 $45 O&M3 $162 $171 $126 $114 $120 $96 $97 $89 $96 Government Payments and R&D3 $13.0 $23.0 $18.0 $24.0 $11.0 $16.0 $10.0 $16.0 $17.0
Assets ($B) $19.9 $19.4 $19.9 $18.9 $15.5 $14.8 $14.6 $15.2 $14.5
Donations and community investments ($M)
$20.7 $32.1 $33.0 $35.0 $35.8 $29.0 $28.2 $26.0 $27.9
Percent of net income1 1.1% 2.0% 1.8% 1.7% 2.3% 2.9% 1.3% 1.1% 2.0%
Footnotes: (1) recast from discontinued operations(2)”Intergeographic” refers to inter-company sales.(3) Total environmental expenditures were restated for 2014 to be consistent with prior years to not include equity company numbers. Totals
for 2014 exclude equity companies and Health Care facilities. (4) In 2017, began reporting net sales as North America and Outside North America to align with 10-K financial reporting.
STRATEGY PRIORITIES GOVERNANCE ASSURANCEDATA
Business Results Data Tables GRI Index Table
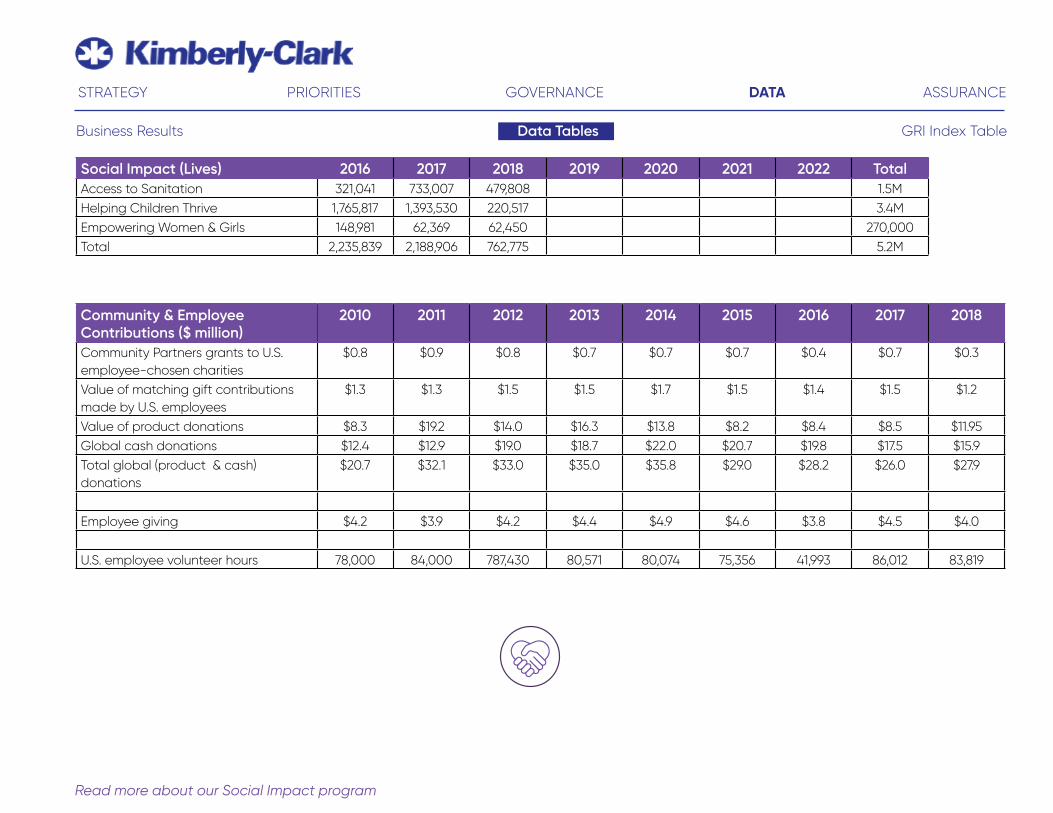
Social Impact (Lives) 2016 2017 2018 2019 2020 2021 2022 TotalAccess to Sanitation 321,041 733,007 479,808 1.5MHelping Children Thrive 1,765,817 1,393,530 220,517 3.4MEmpowering Women & Girls 148,981 62,369 62,450 270,000Total 2,235,839 2,188,906 762,775 5.2M
Community & Employee Contributions ($ million)
2010 2011 2012 2013 2014 2015 2016 2017 2018
Community Partners grants to U.S. employee-chosen charities
$0.8 $0.9 $0.8 $0.7 $0.7 $0.7 $0.4 $0.7 $0.3
Value of matching gift contributions made by U.S. employees
$1.3 $1.3 $1.5 $1.5 $1.7 $1.5 $1.4 $1.5 $1.2
Value of product donations $8.3 $19.2 $14.0 $16.3 $13.8 $8.2 $8.4 $8.5 $11.95Global cash donations $12.4 $12.9 $19.0 $18.7 $22.0 $20.7 $19.8 $17.5 $15.9Total global (product & cash) donations
$20.7 $32.1 $33.0 $35.0 $35.8 $29.0 $28.2 $26.0 $27.9
Employee giving $4.2 $3.9 $4.2 $4.4 $4.9 $4.6 $3.8 $4.5 $4.0
U.S. employee volunteer hours 78,000 84,000 787,430 80,571 80,074 75,356 41,993 86,012 83,819
Read more about our Social Impact program
STRATEGY PRIORITIES GOVERNANCE ASSURANCEDATA
Business Results
SOCIALIMPACT
Data Tables GRI Index Table

Fiber Use (million MT)1 2010 2011 2012 2013 2014 2015 2016 2017 2018Virgin Fiber 2.56 2.48 2.36 2.4 2.38 2.42 2.39 2.4 2.4 % of total 72.5% 70.3% 71.3% 71.4% 72.3% 73.5% 76.6% 76.5% 74.8%Recycled Fiber 0.97 1.05 0.95 0.96 0.91 0.87 0.73 0.73 0.81
% of total 27.5% 29.7% 28.7% 28.6% 27.7% 26.5% 23.4% 23.5% 25.2%Total 3.53 3.53 3.31 3.36 3.29 3.29 3.12 3.13 3.21
Fiber Sourcing by Certification Type (%)
2010 2011 2012 2013 2014 2015 2016 2017 2018
Virgin fiber from environmentally responsible sources1
98% 100% 100% 100% 100% 100% 100% 100% 100%
Forest Stewardship Council (FSC) 39% 47% 53% 61% 62% 64% 67% 71% 70% Sustainable Forest Initiative (SFI) 31% 30% 32% 24% 24% 23% 22% 21% 24%
Program for the Endorsement of Forest Certification (PEFC)
8% 6% 5% 4% 4% 3% 2% 2% 3%
CERFLOR (Brazil) 8% 6% 5% 4% 4% 3% 2% 2% 3% Canadian Standards Association (CSA)
7% 5% 5% 6% 7% 7% 5% 4% 0%
Forest Stewardship Council Controlled Wood (FSC-CW)
5% 8% 2% 6% 4% 3% 4% 2% 3%
Not Certified 2% 0% 0% 0% 0% 0% 0% 0% 0%
Footnotes: (1) As part of our 2011 global GF&TN agreement with WWF, we will report our total use of environmentally preferred fiber for all fiber-containing products. Virgin pulp will include all Kimberly-Clark manufactured pulp, purchased market pulp and third-party contract-manufactured fiber-containing products. Kimberly-Clark began collecting fiber data from third-party contract manufacturers in 2009.
Footnotes: (1) Approximately 150 tons of fiber were not certified in 2012, due to rounding, this is not reflected.
Read more about our Forests & Fiber program
STRATEGY PRIORITIES GOVERNANCE ASSURANCEDATA
Business Results Data Tables GRI Index Table

Environmentally-Preferred Tissue Fiber (%; Global)1
2010 2011 2012 2013 2014 2015 2016 2017 2018
Environmentally-Preferred Fiber 65% 74% 78% 83% 84% 86% 89% 89% 87%Virgin Fiber
FSC Mix 33% 39% 44% 50% 52% 55% 61% 61% 57%
FSC Plantation2 29% 33% 38% 42% 43% 44% 49% 50% 48% FSC Controlled Wood 31% 26% 22% 17% 15% 14% 11% 8% 14%Recycled Fiber Recycled content 32% 35% 34% 33% 32% 31% 28% 28% 30% Post-consumer recycled content3 13% 14% 14% 14% 14% 13% 13% 13% 13%
Environmentally-Preferred Tissue Fiber (%; North America)1
2010 2011 2012 2013 2014 2015 2016 2017 2018
Environmentally-Preferred Fiber 57% 63% 74% 79% 81% 84% 87% 86% 82%Virgin Fiber
FSC Mix 32% 37% 44% 51% 53% 56% 59% 60% 54%
FSC Plantation2 26% 30% 34% 38% 39% 40% 40% 41% 38% FSC Controlled Wood 43% 36% 27% 21% 20% 16% 14% 14% 18% Recycled Fiber Recycled content 25% 26% 30% 28% 28% 28% 28% 26% 28% Post-consumer recycled content3 20% 23% 26% 23% 23% 26% 26% 24% 26%
Footnotes: (1) Data represents Kimberly-Clark and equity affiliates(2) FSC Plantation is a subset of FSC Mix(3) Post-consumer recycled content is a subset of Recycled content; Post-consumer recycled content reported for North America and Europe only
Footnotes: (1) Data represents Kimberly-Clark and equity affiliates(2) FSC Plantation is a subset of FSC Mix(3) Post-consumer recycled content is a subset of Recycled content
STRATEGY PRIORITIES GOVERNANCE ASSURANCEDATA
Read more about our Forests & Fiber program
Business Results Data Tables GRI Index Table

Chlorine Free Wood Pulp Purchases
2010 2011 2012 2013 2014 2015 2016 2017 2018
Elemental Chlorine Free (ECF) 95% 95% 98% 98% 97% 97% 98% 98% 98%Total Chlorine Free (TCF) 5% 5% 2% 2% 3% 3% 2% 2% 2%
Natural Forest fiber use (MT) 2011 2012 2013 2014 2015 2016 2017 2018Virgin fiber from Natural Forest sources (Northern Softwood)
756,531 572,456 574,843 575,606 565,105 559,437 534,644 526,483
% Reduction of Natural Forest Fiber N/A1 24% 24% 24% 25% 26% 29% 30%
Paper Packaging Total volume in metric tons ~520,000 % Recycled Fiber 61% % Virgin Fiber 31% % of virgin fiber that was third-party certified 98% % of total fiber that was recycled or third-party-certified virgin fiber 99%
Footnotes: Total Volume from reporting suppliers that represent approximately 85% of our global paper packaging spend.”
Footnotes: 1) 2011 is the Base Year for 25% Reduction Target by 2025.
STRATEGY PRIORITIES GOVERNANCE ASSURANCEDATA
Read more about our Forests & Fiber program
FORESTS& FIBER
Business Results Data Tables GRI Index Table

Nonhazardous manufacturing waste (% of total nonhazardous waste)1
2010 2011 2012 2013 2014 2015 2016 2017 2018
Landfilled 19.1% 24.5% 22.0% 19.2% 16.2% 7.6`% 5.6% 4.7% 4.9%Recycled 18.5% 17.6% 20.2% 19.6% 18.3% 20.3% 20.6% 21.7% 22.9%Alternative Daily Cover, Mine Reclamation and Liquid Solidification
24.1% 22.5% 25.9% 29.2% 34.1% 40.0% 52.0% 51.5% 54.2%
Converted to energy 20.3% 20.4% 12.4% 12.2% 12.2% 12.7% 14.4% 14.1% 11.1%Reused 12.1% 13.3% 17.8% 18.1% 17.2% 16.7% 5.0% 5.5% 4.3%Composted 5.0% 1.1% 0.9% 0.9% 1.2% 2.0% 1.6% 1.8% 2.2%Incineration without heat recovery 0.8% 0.5% 0.9% 0.8% 0.7% 0.7% 0.8% 0.5% 0.4%Other3 N/A N/A N/A N/A N/A N/A 0.2% 0.1% 0.0%
Total nonhazardous waste (million MT) 1.37 1.29 1.33 1.28 1.25 1.15 1.23 1.21 1.14
Footnotes: (1) At Kimberly-Clark, all waste data is collected by mass except a portion of liquid waste which is collected by volume in liters with a conversion factor of 1 liter = 1 kilogram. (2) In 2016, our manufacturing waste program was expanded referencing the UL Environment Zero Waste to Landfill standard to include all wastes and recyclable materials generated at both manufacturing and non-manufacturing facilities and the disposition of those materials. Our non-hazardous manufacturing waste data was updated per our annual review process. (3) Other includes miscellaneous, alternative disposal methods and was separated from Reuse in 2016.
Read more about our Waste & Recycling program
STRATEGY PRIORITIES GOVERNANCE ASSURANCEDATA
Business Results Data Tables GRI Index Table

Hazardous manufacturing waste (% of total hazardous waste)12
2010 2011 2012 2013 2014 2015 2016 2017 2018
Biological treatment 0.8% 0.0% 0.1% 0.0% 0.1% 0.3`% 0.7% 0.9% 0.9%Recycled 50.2% 46.2% 13.8% 12.9% 12.3% 22.6% 19.9% 11.6% 12.4%Incineration without heat recovery 25.6% 26.2% 14.3% 28.1% 38.0% 36.3% 29.4% 21.6% 35.6%Chemical treatment 15.8% 15.2% 44.1% 36.5% 36.7% 26.6% 25.3% 4.6% 2.5%Surface impoundment 0.0% 7.8% 10.2% 0.0% 0.0% 0.0% 0.0% 0.0% 0.0%Thermal treatment 5.0% 1.4% 3.7% 7.9% 2.0% 0.6% 0.1% 2.6% 2.6%Permanent storage 0.0% 0.0% 1.7% 0.7% 0.4% 0.5% 0.3% 0.0% 0.1%Landfilled 1.8% 0.6% 2.9% 3.2% 4.4% 6.8% 10.7% 7.8% 13.8%Blended fuel 0.8% 2.5% 9.2% 10.7% 6.1% 6.3% 10.8% 2.2% 32.1%Deep well injection 0.0% 0.0% 0.0% 0.0% 0.0% 0.0% 0.0% 0.0% 0.0%Mandated Waste N/A N/A N/A N/A N/A N/A 2.3% 48.6%3 0.0%
Total hazardous waste (kg) 226,701 233,019 538,047 771,590 869,266 1,326,463 1,019,980 1,726,829 918,666
Manufacturing Waste Efficiency 2010 2011 2012 2013 2014 2015 2016 2017 2018Waste per metric ton of production (MT/MT of production)
0.27 0.27 0.28 0.27 0.25 0.23 0.24 0.24 0.23
Footnotes: (1) At Kimberly-Clark, all waste data is collected by mass except a portion of liquid waste which is collected by volume in liters with a conversion factor of 1 liter = 1 kilogram. (2) In 2016, our manufacturing waste program was expanded referencing the UL Environment Zero Waste to Landfill standard to include all wastes and recyclable materials generated at both manufacturing and non-manufacturing facilities and the disposition of those materials. Our hazardous manufacturing waste data was updated per our annual review process. (3) The 2017 increase in mandated waste was driven due to the government required disposal of asbestos at one of our facilities.
STRATEGY PRIORITIES GOVERNANCE ASSURANCEDATA
Read more about our Waste & Recycling program
Business Results Data Tables GRI Index Table

Materials Consumption and Production
2010 2011 2012 2013 2014 2015 2016 2017 2018
Total production volume (million MT of production)
5.04 4.80 4.71 4.76 4.96 5.06 5.07 5.08 5.07
Materials used (million MT) Virgin fiber 2.56 2.48 2.36 2.40 2.40 2.42 2.39 2.40 2.40 Recycled fiber 0.97 1.05 0.95 0.96 0.91 0.87 0.73 0.73 0.81 Polymers 0.74 0.72 0.72 0.69 0.66 0.63 0.63 0.56 0.57 Packaging 0.52 0.50 0.52 0.52 0.53 0.53 0.55 0.55 0.54 Adhesives 0.08 0.07 0.08 0.06 0.06 0.07 0.08 0.76 0.07 Polymer-based components 0.02 0.02 0.02 0.02 0.02 0.03 0.03 0.02 0.02
Post-Consumer Waste 2016 2017 2018Waste Diversion - Post-Consumer Waste Solutions
3,405 10,587 14,768
Waste Avoidance - Design to Reduce (million MT)
1,850 4,955 6,657
TotalTotal Finished Product and Packaging Waste Diverted from Landfill1
5,254 15,542 21,425
Footnote: (1) Tonnages reported are built from cumulative waste diverted from landfill towards the 150,000 MT target.
STRATEGY PRIORITIES GOVERNANCE ASSURANCEDATA
Read more about our Waste & Recycling program
WASTE &RECYCLING
Business Results Data Tables GRI Index Table

Energy Use (trillion Btu) 2010 2011 2012 2013 2014 2015 2016 2017 2018Non-renewable energy 60.8 59.8 54.4 53.1 53.1 53.8 51.90 51.74 50.17 % of total 85.0% 86.0% 94.0% 93.0% 92.8% 93.6% 92.2% 92.4% 90.0%Renewable energy 10.5 9.6 3.6 4.0 4.1 3.7 4.38 4.24 5.87 % of total 14.7% 13.8% 6.2% 7.0% 7.2% 6.4% 7.8% 7.6% 10.0%Total Energy Use 71.3 69.3 58.0 57.1 57.2 57.5 56.3 56.0 56.0
Energy Efficiency (million Btu/MT of production)
14.2 14.7 12.3 12.0 11.5 11.4 11.2 11.0 11.1
Indirect Energy Use (trillion Btu) 2010 2011 2012 2013 2014 2015 2016 2017 2018Electricity 17.52 17.21 16.94 16.96 16.59 16.50 15.71 15.73 15.9 % of total 99.0% 99.2% 99.2% 99.4% 95.1% 94.7% 93.5% 93.3% 93.5%Steam 0.2 0.1 0.1 0.1 0.9 0.9 1.1 1.1 1.1 % of total 1.0% 0.8% 0.8% 0.6% 4.9% 5.3% 6.5% 6.7% 6.5%
Total Indirect Energy use 17.7 17.4 17.1 17.1 17.4 17.4 16.8 16.9 17.0
Direct Energy Use (trillion Btu) 2010 2011 2012 2013 2014 2015 2016 2017 2018Natural gas 29.1 29.6 30.0 29.9 29.7 30.9 31.0 31.5 33.5 % of total 54.0% 56.8% 73.1% 74.3% 73.2% 75.4% 78.9% 81.1% 86.4%Purchased biomass, purchased liquor 15.5 14.1 3.6 4.0 4.1 3.7 3.9 3.7 2.7 % of total 28.9% 27.0% 8.7% 10.0% 10.9% 9.0% 10.0% 9.5% 7.1%Coal 7.8 7.3 6.5 5.6 5.5 5.2 4.3 3.6 2.5 % of total 14.4% 13.9% 15.8% 13.9% 13.4% 12.7% 11.0% 9.3% 6.4%Fuel oil 1.3 1.0 0.9 0.7 0.5 0.3 0.1 0.1 0.1 % of total 2.4% 2.0% 2.1% 1.7% 1.2% 0.7% 0.2% 0.2% 0.2%Other - - - - - - - 0.2 0.2 % of total - - - - - - - 0.0 0.0
Total Direct Energy use 53.6 52.0 40.9 40.1 40.0 41.0 39.3 38.9 38.8
Read more about our Energy & Climate program
STRATEGY PRIORITIES GOVERNANCE ASSURANCEDATA
Business Results Data Tables GRI Index Table
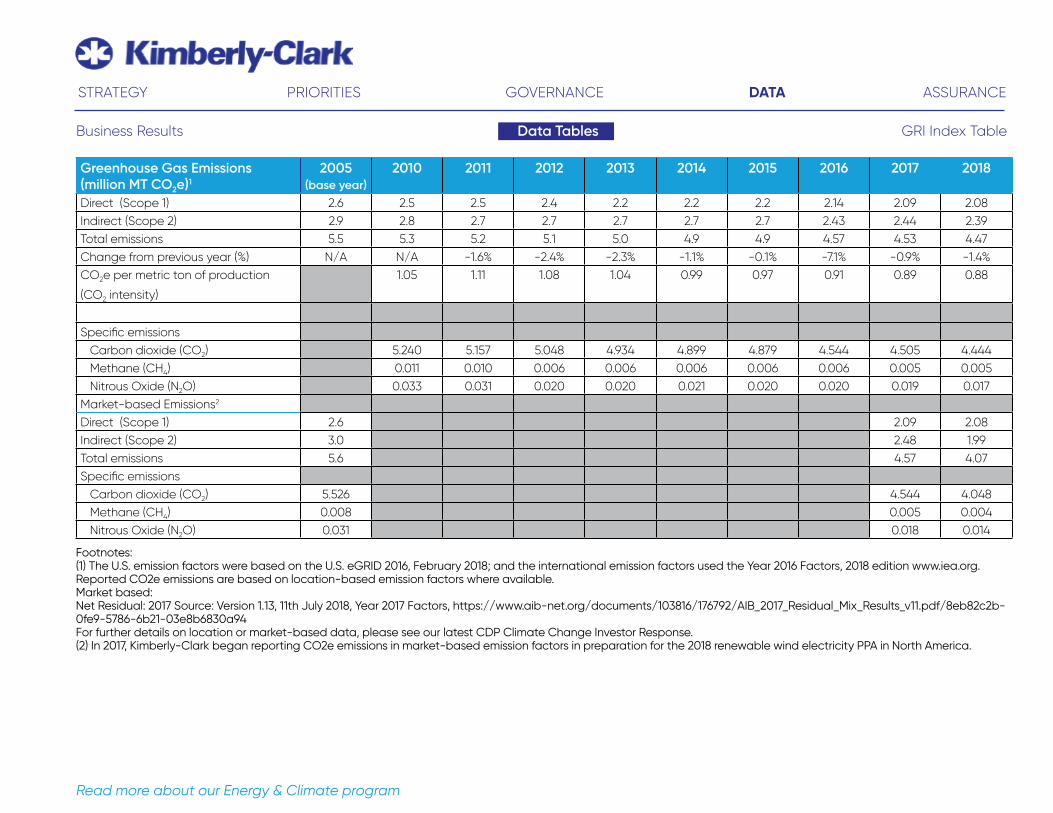
Greenhouse Gas Emissions (million MT CO2e)1
2005 (base year)
2010 2011 2012 2013 2014 2015 2016 2017 2018
Direct (Scope 1) 2.6 2.5 2.5 2.4 2.2 2.2 2.2 2.14 2.09 2.08Indirect (Scope 2) 2.9 2.8 2.7 2.7 2.7 2.7 2.7 2.43 2.44 2.39Total emissions 5.5 5.3 5.2 5.1 5.0 4.9 4.9 4.57 4.53 4.47Change from previous year (%) N/A N/A -1.6% -2.4% -2.3% -1.1% -0.1% -7.1% -0.9% -1.4%CO2e per metric ton of production
(CO2 intensity)
1.05 1.11 1.08 1.04 0.99 0.97 0.91 0.89 0.88
Specific emissions Carbon dioxide (CO2) 5.240 5.157 5.048 4.934 4.899 4.879 4.544 4.505 4.444 Methane (CH4) 0.011 0.010 0.006 0.006 0.006 0.006 0.006 0.005 0.005 Nitrous Oxide (N2O) 0.033 0.031 0.020 0.020 0.021 0.020 0.020 0.019 0.017Market-based Emissions2
Direct (Scope 1) 2.6 2.09 2.08Indirect (Scope 2) 3.0 2.48 1.99Total emissions 5.6 4.57 4.07Specific emissions Carbon dioxide (CO2) 5.526 4.544 4.048 Methane (CH4) 0.008 0.005 0.004 Nitrous Oxide (N2O) 0.031 0.018 0.014
Footnotes: (1) The U.S. emission factors were based on the U.S. eGRID 2016, February 2018; and the international emission factors used the Year 2016 Factors, 2018 edition www.iea.org. Reported CO2e emissions are based on location-based emission factors where available. Market based:Net Residual: 2017 Source: Version 1.13, 11th July 2018, Year 2017 Factors, https://www.aib-net.org/documents/103816/176792/AIB_2017_Residual_Mix_Results_v11.pdf/8eb82c2b-0fe9-5786-6b21-03e8b6830a94For further details on location or market-based data, please see our latest CDP Climate Change Investor Response. (2) In 2017, Kimberly-Clark began reporting CO2e emissions in market-based emission factors in preparation for the 2018 renewable wind electricity PPA in North America.
STRATEGY PRIORITIES GOVERNANCE ASSURANCEDATA
Read more about our Energy & Climate program
Business Results Data Tables GRI Index Table

Intermodal transportation (North America)1
2010 2011 2012 2013 2014 2015 2016 2017 2018
Total intermodal loads 78,502 87,934 91,353 92,536 95,987 87,517 85,630 79,694 78,479 Annual change 22% 12% 4% 1% 4% -5% -2% -9% -2%Miles traveled (millions) 109.4 117.8 119.6 120.0 122.0 112.9 111.8 103.8 102.5Intermodal cost savings ($M) vs. over-the-road truck costs
44.2 55.8 60.3 59.2 62.1 56.5 53.9 44.6 58.2
Estimated fuel use (million gallons of diesel) Intermodal 9.1 9.8 10.0 10.0 10.2 9.4 9.3 8.7 7.9 Comparable truck-only fuel use 18.2 19.6 19.9 20.0 20.3 18.8 18.6 17.3 15.8 Estimated gallons saved 9.1 9.8 10.0 10.0 10.2 9.4 9.3 8.7 7.9
Estimated GHG emissions (million pounds - Scope 3)2
Intermodal 204.7 220.4 223.8 224.4 228.3 211.2 209.2 194.2 117.0 Comparable truck-only fuel use 409.4 440.9 447.7 448.8 456.6 422.3 418.3 388.5 353.9 Savings 204.7 220.4 223.8 224.4 228.3 211.2 209.2 194.2 117.0
Footnotes: (1) all figures are estimates(2) Pounds of GHG emissions based on estimate of 22.45 pounds per gallon of diesel fuel
Footnotes: 1) 2010 through 2015 pollutant values were revised to reflect more accurate data from continuous emission monitors compared to previous report responses which were based on only emission factors.
Other Criteria Pollutants (MT)1 2010 2011 2012 2013 2014 2015 2016 2017 2018NOx 3,948 3,833 2,915 2,869 2,895 2,562 2,545 2,453 2,536SO2 4,193 3,013 2,452 1,787 1,776 1,860 1,689 1,638 1,692
STRATEGY PRIORITIES GOVERNANCE ASSURANCEDATA
Read more about our Energy & Climate program
Business Results Data Tables GRI Index Table
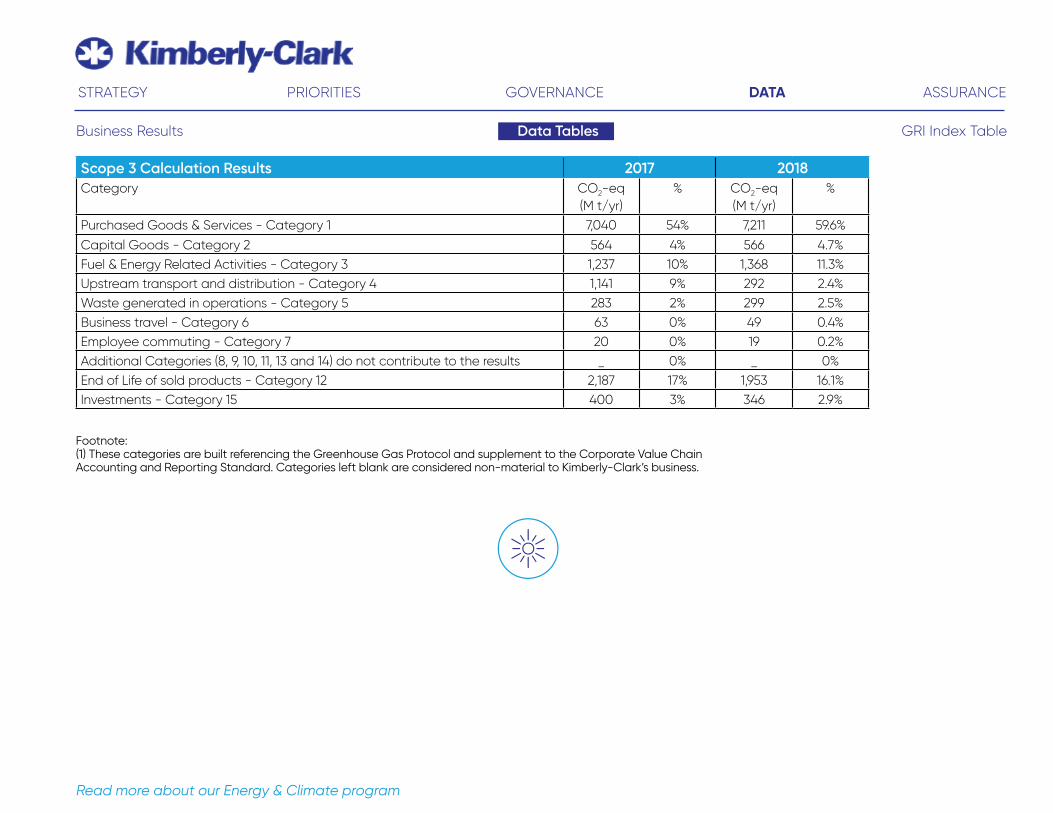
Scope 3 Calculation ResultsCategory CO2-eq
(M t/yr)% CO2-eq
(M t/yr)%
Purchased Goods & Services - Category 1 7,040 54% 7,211 59.6%
Capital Goods - Category 2 564 4% 566 4.7%Fuel & Energy Related Activities - Category 3 1,237 10% 1,368 11.3%Upstream transport and distribution - Category 4 1,141 9% 292 2.4%Waste generated in operations - Category 5 283 2% 299 2.5%Business travel - Category 6 63 0% 49 0.4%Employee commuting - Category 7 20 0% 19 0.2%Additional Categories (8, 9, 10, 11, 13 and 14) do not contribute to the results _ 0% _ 0%End of Life of sold products - Category 12 2,187 17% 1,953 16.1%Investments - Category 15 400 3% 346 2.9%
Footnote: (1) These categories are built referencing the Greenhouse Gas Protocol and supplement to the Corporate Value Chain Accounting and Reporting Standard. Categories left blank are considered non-material to Kimberly-Clark’s business.
STRATEGY PRIORITIES GOVERNANCE ASSURANCEDATA
Read more about our Energy & Climate program
2017 2018
ENERGY& CLIMATE
Business Results Data Tables GRI Index Table

Process fresh water use (million cubic meters)
2010 2011 2012 2013 2014 2015 2016 2017 2018
Surface 72.6 72.1 46.7 44.5 43.5 44.8 41.4 38.6 38.5 % of total 57% 59% 45% 48% 46% 49% 45% 43% 42%Municipal 36.3 33.0 39.7 31.8 28.3 27.3 30.9 31.2 33.4 % of total 29% 26% 38% 34% 30% 30% 34% 35% 37%Groundwater 17.7 18.0 18.2 17.0 21.9 20.0 19.3 19.6 19.5 % of total 14% 14% 17% 18% 23% 22% 21% 22% 21%Total Water use 126.5 125.2 104.6 93.3 93.6 92.1 91.6 89.4 91.4Change from previous year N/A -1% -16% -11% 0% -2% -0.4% -2.4% 2.3%Water Use Efficiency (m3 / MT of production)
44.2 46.2 41.1 35.9 35.3 35.0 35.2 34.9 35.9
Influent (Total) [m3] 2015 2016 2017 2018Kluang 1,027,535 709,462 568,414 494,875Mogi Das Cruzes 456,065 423,984 480,477 568,497Cuaca 1,200,706 1,096,686 1,306,406 1,250,563Sitio Del Nino 1,843,013 1,156,001 903,995 717,132Bernal 532,590 409,253 368,316 341,751Puente Piedra 718,079 653,345 773,613 733,612Askar 253,446 278,828 332,541 296,795Enstra 849,332 854,396 737,838 666,222Hadera 265,549 183,200 171,770 172,292Nahariya 359,480 361,470 301,356 285,620Fullerton 1,894,065 1,607,248 1,508,108 1,296,882Barbosa Site 849,431 797,632 874,635 904,363
10,249,290 8,531,505 8,327,470 7,728,604
Process effluent discharge destinations (%)
2010 2011 2012 2013 2014 2015 2016 2017 2018
Surface 87% 87% 88% 83% 88% 89% 88% 88% 87%Municipal 13% 13% 12% 17% 12% 11% 12% 12% 13%
Read more about our Supply Chain program
STRATEGY PRIORITIES GOVERNANCE ASSURANCEDATA
2015 Baseline Water use for Water Stressed Site 10,249,290% water Reduction from 2015 Baseline 24.592018 Water Use for Water Stressed Site 7,728,604
Business Results Data Tables GRI Index Table

Audit Results 2014 2015 2016 2017 2018Number of in-scope suppliers 397 272 302 391 509Facilities AuditedKimberly-Clark Branded Audits1 62 65 63 94 80Customer Branded Audits2 60 67 85 83 106Total Facilities with Major Non-Conformance Findings Requiring RemediationKimberly-Clark Branded Audited Facilities1 41 42 45 56 43
10.3 percent of in-scope suppliers
15.4 percent of in-scope suppliers
14.9 percent of in-scope suppliers
14.3 percent of in-scope suppliers
8.4 percent of in-scope suppliers
Total Facilities with Major or Minor Non-Conformance FindingsKimberly-Clark Branded Audited Facilities1 39 61 62 84 70
9.8 percent of in-scope suppliers
22.4 percent of in-scope suppliers
20.5 percent of in-scope suppliers
21.5 percent of in-scope suppliers
13.7 percent of in-scope suppliers
Non-Conformance Findings by Category (Kimberly-Clark Branded Audits Only):Health and Safety 40 facilities 38 facilities 48 facilities 56 facilities 43 facilities
(73 major findings) (92 major findings) (126 major findings) (202 major findings) (99 major findings)
Child Labor 0 facilities 0 facilities 0 facilities 0 facilities 0 facilities(0 major finding) (0 major finding) (0 major finding) (0 major finding) (0 major finding)
Potential Forced Labor Indicators3 6 facilities 3 facilities 3 facilities 7 facilities 2 facilities(7 major findings) (3 major findings) (3 major findings) (7 major findings) (2 major findings)
Freedom of Association 0 facilities 0 facilities 0 facilities 0 facilities 0 facilities(0 major finding) (0 major finding) (0 major finding) (0 major finding) (0major finding)
Discrimination 1 facility 0 facility 1 facility 1 facility 2 facilities(1 major finding) (0 major finding) (1 major finding) (1 major finding) (2 major findings)
STRATEGY PRIORITIES GOVERNANCE ASSURANCEDATA
Read more about our Supply Chain program
Footnote: (1) Kimberly-Clark branded audits refer to audits measured against Kimberly-Clark compliance standards. (2) Customer branded audits refer to audits measured against customer-specific compliance standards. (3) Forced Labor inidicators are conditions that indicate the potential for Forced Labor in an operation such as: worker movement restrictions, recruitment fees, witholding of worker documents, or similar findings.
Business Results Data Tables GRI Index Table

Kimberly-Clark Employee Safety 2010 2011 2012 2013 2014 2015 2016 2017 2018Fatalities 0 0 0 01 0 0 02 05 16
Permanently disabling injuries 14 8 9 2 2 5 4 2 11Total Reportable Incident Rate (TRIR) 0.44 0.40 0.31 0.27 0.23 0.21 0.23 0.19 0.177 North America 0.59 0.44 0.33 0.30 0.24 0.22 0.22 0.32 0.20 Latin America 0.40 0.40 0.39 0.41 0.21 0.19 0.24 0.19 0.13 Europe (EMEA for 2015)3 0.71 0.71 0.39 0.80 0.37 0.34 0.33 0.34 0.50 Middle East and Africa3 1.01 0.53 0.76 0.33 0.48 N/A N/A N/A N/A Asia/Pacific 0.32 0.23 0.14 0.20 0.17 0.17 0.15 0.13 0.14Lost-time Reportable Incident Rate
(LTRIR)
0.30 0.27 0.19 0.17 0.15 0.17 0.15 0.14 0.13
North America 0.39 0.22 0.20 0.15 0.14 0.15 0.12 0.20 0.08 Latin America 0.31 0.36 0.21 0.25 0.16 0.18 0.17 0.16 0.12
Europe (EMEA for 2015)3 0.45 0.59 0.29 0.40 0.25 0.24 0.24 0.28 0.37
Middle East and Africa3 0.87 0.37 0.52 0.14 0.29 N/A N/A N/A N/A
Asia/Pacific 0.21 0.14 0.08 0.13 0.11 0.12 0.90 0.90 0.90
Sentinel Events Reporting Rate (SERR) 1.70 1.53 1.54 1.66 2.00 4.44 4.62 4.28 4.04Safety compliance penalties $110,955 $4,800 $23,000 $1,000 $25,000 $4,500 $20,040 $18,000 $160,529
Footnotes: (1) In 2013, a motor vehicle fatality occurred in the trucking operations of Kimberly-Clark de Mixico, an unconsolitdated affiliate. (2) In 2016, there were zero fatalities involving Kimberly-Clark employees, however there were three fatalities involving contractors at a subsidiary of the partly-owned Kimberly-Clark de Mexico. One incident where an outside roofer suffered a fatal fall, another involving a contract security guard, and one where a third-party trucker was involved in a vehicle accident. (3) In 2015, the data for Europe was combined for reporting purposes as Europe, Middle East and Africa (EMEA). (4) In 2016, Kimberly-Clark Professional (KCP) reporting was combined into regional data. Therefore data was revised for 2014 and 2015 as was previously reported out separately. (5) 1 fatality involving a K-C de Mexico employee. Note there was 1 additional fatality involving a contractor, non K-C employee, in Asia Pacific. (6) In 2018 there was 1 K-C employee fatality at the Paris, TX facility when an employee was crushed by a moving vehicle at the loading dock. There was also a fatality of a K-C de Mexico employee, a partly owned subsidiary, in Bajio, Mexico; and a construction contractor fatality at the K-C de Mexicosite in Morelia, Mexico.
TRIR: Work-related events that result in fatalities, temporary or permanently disabling injuries, or illnesses, per 200,000 hours worked per annum.LTRIR: Reportable injuries/illnesses that result in time away from work or restricted work, per 200,000 hours worked per annum.SERR: Number of Sentinel Events reported per 200,000 hours worked per annum.
STRATEGY PRIORITIES GOVERNANCE ASSURANCEDATA
Read more about our Supply Chain program
SUPPLYCHAIN
Business Results Data Tables GRI Index Table

Board of Directors Diversity 2010 2011 2012 2013 2014 2015 2016 2017 2018Independent members 92.3% 92.3% 91.7% 91.7% 91.7% 90.9% 91.7% 84.60% 85.71%Women 23.1% 23.1% 25.0% 25.0% 25.0% 18.2% 25.0% 23.1% 28.57%Minority group membership 23.1% 30.81% 3.33% 3.33% 3.33% 27.3% 3.33%% 46.2% 50%Total Board members1 13 13 12 12 12 11 12 13 14Board of Directors of age 50+ 13 13 12 12 12 11 11 12 12
Turnover (Global) 2010 2011 2012 2013 2014 2015 2016 2017 2018Total 6.40% 10.10% 9.90% 10.10% 11.00% 16.50% 16.10% 12.9% 22.79%Voluntary 4.30% 5.20% 5.80% 7.40% 8.00% 10.30% 9.70% 9.6% 16.40%Involuntary 2.10% 4.90% 4.20% 2.80% 3.00% 6.20% 6.40% 3.20% 6.40%
Footnotes: (1) Through 2013, “Management” was defined as U.S. employees in EEP category 01 (executive/senior-level officials and managers, and first/middle-level officials and managers). In 2014, we revised our corporate definition for women and ethnic minorities in management to include employees identified as “Manager” in Kimberly-Clark’s Workday system (previously, the term was defined as executive/senior level officials and managers as well as first/middle level officials and managers). This change enables us to report on gender representation in management globally and aligns with our internal reporting structures.
Read more about our Governance
STRATEGY PRIORITIES GOVERNANCE ASSURANCEDATA
Business Results Data Tables GRI Index Table
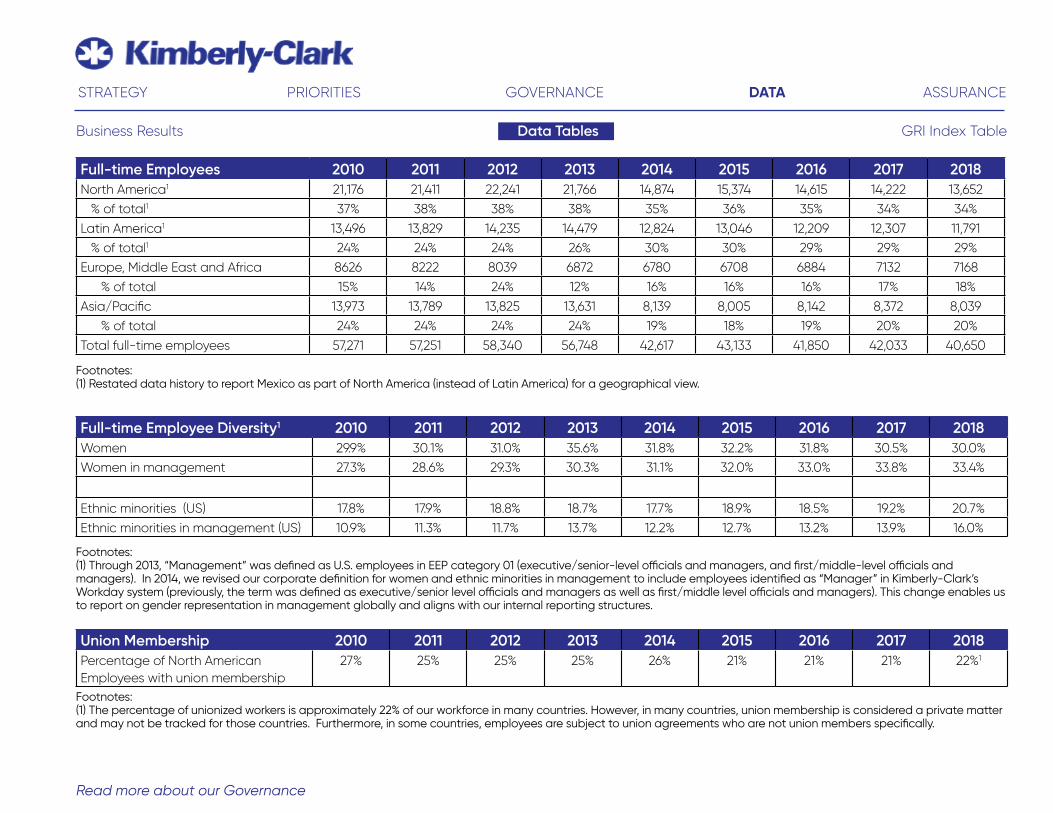
Union Membership 2010 2011 2012 2013 2014 2015 2016 2017 2018Percentage of North American Employees with union membership
27% 25% 25% 25% 26% 21% 21% 21% 22%1
Full-time Employee Diversity1 2010 2011 2012 2013 2014 2015 2016 2017 2018Women 29.9% 30.1% 31.0% 35.6% 31.8% 32.2% 31.8% 30.5% 30.0%Women in management 27.3% 28.6% 29.3% 30.3% 31.1% 32.0% 33.0% 33.8% 33.4%
Ethnic minorities (US) 17.8% 17.9% 18.8% 18.7% 17.7% 18.9% 18.5% 19.2% 20.7%Ethnic minorities in management (US) 10.9% 11.3% 11.7% 13.7% 12.2% 12.7% 13.2% 13.9% 16.0%
Footnotes: (1) The percentage of unionized workers is approximately 22% of our workforce in many countries. However, in many countries, union membership is considered a private matter and may not be tracked for those countries. Furthermore, in some countries, employees are subject to union agreements who are not union members specifically.
Footnotes: (1) Through 2013, “Management” was defined as U.S. employees in EEP category 01 (executive/senior-level officials and managers, and first/middle-level officials and managers). In 2014, we revised our corporate definition for women and ethnic minorities in management to include employees identified as “Manager” in Kimberly-Clark’s Workday system (previously, the term was defined as executive/senior level officials and managers as well as first/middle level officials and managers). This change enables us to report on gender representation in management globally and aligns with our internal reporting structures.
Full-time Employees 2010 2011 2012 2013 2014 2015 2016 2017 2018North America1 21,176 21,411 22,241 21,766 14,874 15,374 14,615 14,222 13,652 % of total1 37% 38% 38% 38% 35% 36% 35% 34% 34%Latin America1 13,496 13,829 14,235 14,479 12,824 13,046 12,209 12,307 11,791 % of total1 24% 24% 24% 26% 30% 30% 29% 29% 29%Europe, Middle East and Africa 8626 8222 8039 6872 6780 6708 6884 7132 7168 % of total 15% 14% 24% 12% 16% 16% 16% 17% 18%Asia/Pacific 13,973 13,789 13,825 13,631 8,139 8,005 8,142 8,372 8,039 % of total 24% 24% 24% 24% 19% 18% 19% 20% 20%Total full-time employees 57,271 57,251 58,340 56,748 42,617 43,133 41,850 42,033 40,650
Footnotes: (1) Restated data history to report Mexico as part of North America (instead of Latin America) for a geographical view.
STRATEGY PRIORITIES GOVERNANCE ASSURANCEDATA
Business Results Data Tables GRI Index Table
Read more about our Governance

GRI Index TableData Tables
GRI Standards
Description Cross-Reference / Direct Answer UNGC
GRI 102-1 Organization name Kimberly-Clark CorporationGRI 102-2 Primary brands, products and
services.
Sale of banned or disputed products
10-K https://www.kimberly-clark.com/en/investors/annual-reports
Zero for Kimberly-Clark. We have not knowingly sold banned or disputed products.
GRI 102-3 Headquarters location P.O. Box 619100, Dallas, Texas, USAGRI 102-4 Where the organization
operatesOur Global headquarters is in Dallas, TX, USA
We also have manufacturing facilities in 37 countries -Argentina, Australia, Bahrain, Bolivia, Brazil, Canada, Chile, China, Colombia, Costa Rica, Czech Republic, Dominican Republic, Ecuador, El Salvador, France, Germany, India, Indonesia, Israel, Italy, Korea, Malaysia, Mexico, Nigeria, Peru, Russian Federation, Saudi Arabia, Singapore, South Africa, Spain, Switzerland, Taiwan, Thailand, United Kingdom, United States of America, and Vietnam.
GRI 102-5 Nature of ownership and legal form
Publically traded Delaware U.S. corporation 10-K: http://investor.kimberly-clark.com/secfiling.cfm?filingID=55785-18-14
GRI 102-6 Markets served 10-K https://www.kimberly-clark.com/en/investors/annual-reports
GRI 102-7 Scale of the organization 10-K https://www.kimberly-clark.com/en/investors/annual-reports 41,898 total employees at year-end 2018
GRI 102-8 Total number of employees by type
REPORT SECTION - Diversity and Inclusion
41,898 total employees; 40,650 are Full-time, 192 are part time; 1,056 temporary.
Globally, 31% of all employees are women, and 43% of all full-time salaried employees are women.
34% of management globally is comprised of women.
STRATEGY PRIORITIES GOVERNANCE ASSURANCEDATA
Business Results
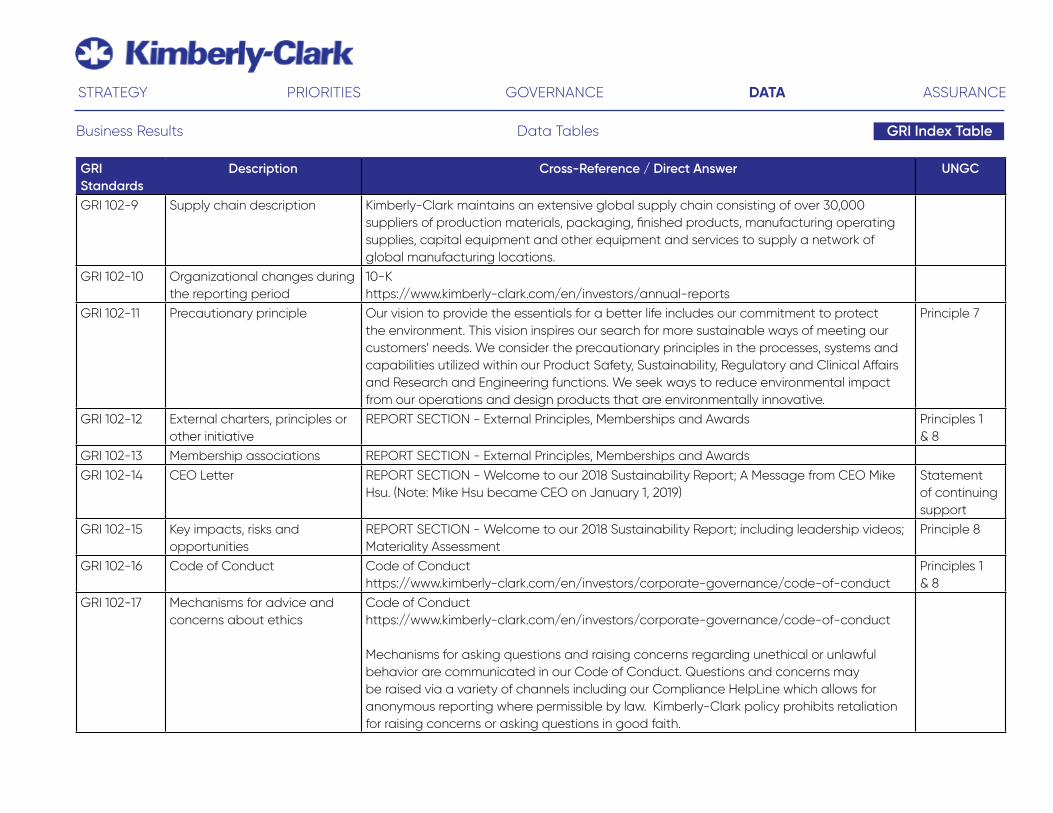
GRI Standards
Description Cross-Reference / Direct Answer UNGC
GRI 102-9 Supply chain description Kimberly-Clark maintains an extensive global supply chain consisting of over 30,000 suppliers of production materials, packaging, finished products, manufacturing operating supplies, capital equipment and other equipment and services to supply a network of global manufacturing locations.
GRI 102-10 Organizational changes during the reporting period
10-K https://www.kimberly-clark.com/en/investors/annual-reports
GRI 102-11 Precautionary principle Our vision to provide the essentials for a better life includes our commitment to protect the environment. This vision inspires our search for more sustainable ways of meeting our customers’ needs. We consider the precautionary principles in the processes, systems and capabilities utilized within our Product Safety, Sustainability, Regulatory and Clinical Affairs and Research and Engineering functions. We seek ways to reduce environmental impact from our operations and design products that are environmentally innovative.
Principle 7
GRI 102-12 External charters, principles or other initiative
REPORT SECTION - External Principles, Memberships and Awards Principles 1 & 8
GRI 102-13 Membership associations REPORT SECTION - External Principles, Memberships and Awards GRI 102-14 CEO Letter REPORT SECTION - Welcome to our 2018 Sustainability Report; A Message from CEO Mike
Hsu. (Note: Mike Hsu became CEO on January 1, 2019)Statement of continuing support
GRI 102-15 Key impacts, risks and opportunities
REPORT SECTION - Welcome to our 2018 Sustainability Report; including leadership videos; Materiality Assessment
Principle 8
GRI 102-16 Code of Conduct Code of Conducthttps://www.kimberly-clark.com/en/investors/corporate-governance/code-of-conduct
Principles 1 & 8
GRI 102-17 Mechanisms for advice and concerns about ethics
Code of Conducthttps://www.kimberly-clark.com/en/investors/corporate-governance/code-of-conduct
Mechanisms for asking questions and raising concerns regarding unethical or unlawful behavior are communicated in our Code of Conduct. Questions and concerns may be raised via a variety of channels including our Compliance HelpLine which allows for anonymous reporting where permissible by law. Kimberly-Clark policy prohibits retaliation for raising concerns or asking questions in good faith.
STRATEGY PRIORITIES GOVERNANCE ASSURANCEDATA
GRI Index TableData TablesBusiness Results

GRI Standards
Description Cross-Reference / Direct Answer UNGC
GRI 102-18 Governance structure of the organization
10-K https://www.kimberly-clark.com/en/investors/annual-reports
REPORT SECTION - Governance
Principle 8
GRI 102-20 Executive level accountability to Economic, Environmental & Social topics
Kimberly- Clark’s Chief Supply Chain Officer, Sandra MacQuillan, is a member of Kimberly-Clark’s Executive Leadership Team. She has accountability for sustainability inclusive of both environmental and social topics and reports directly to the Chief Executive Officer (CEO).
GRI 102-21 Stakeholder consultation w/ governance body on Economic, Environmental & Social topics
Kimberly-Clark’s independent Sustainability Advisory Board (SAB) was formed in 2007 to provide guidance and insights on sustainability issues to our Global Sustainability Team and our Executive Leadership Team. The SAB is comprised of top business and functional executives who have audience in governance with the CEO/Chairman of the Board. The SAB is composed of external thought leaders who possess a diversity of experience and expertise and are selected based on core competencies that align with our sustainability strategy. Its members offer independent views of our sustainability programs, as well as insights into potential risks and opportunities for our business.
GRI 102-22 Composition of the board and its committees
10-K https://www.kimberly-clark.com/en/investors/annual-reports Proxy Statementhttps://kimberlyclark.gcs-web.com/financial/proxy-statementREPORT SECTION - Governance
GRI 102-23 Whether the chair of the board is also an executive officer
Michael D. Hsu is the Chief Executive Officer of Kimberly-Clark and Thomas J. Falk is Chairman of the Board of Kimberly-Clark. (Note: Michael D. Hsu succeeded Thomas J. Falk as CEO on January 1, 2019)https://www.kimberly-clark.com/en/company/leadership
GRI 102-24 Nomination and selection processes for the board and its committees
Proxy Statementhttps://kimberlyclark.gcs-web.com/financial/proxy-statement
GRI 102-25 Board conflicts of interest Proxy Statementhttps://kimberlyclark.gcs-web.com/financial/proxy-statementCode of Conduct https://www.kimberly-clark.com/en/investors/corporate-governance/code-of-conduct
Principle 10
STRATEGY PRIORITIES GOVERNANCE ASSURANCEDATA
GRI Index TableData TablesBusiness Results

GRI Standards
Description Cross-Reference / Direct Answer UNGC
GRI 102-26 Role of Board in setting sustainability mission
Kimberly-Clark’s Vice President of Safety and Sustainability, Lisa Morden, reports once a year to the Nomination and Governance committee of the Board of Directors to report progress and answer questions relating therein; Also through strategy development with Sr. leadership (Executive Leadership Team approvals, board briefings, etc.).
Proxy Statementhttps://kimberlyclark.gcs-web.com/financial/proxy-statement
GRI 102-28 Board performance with respect to governance of sustainability topics
10-K https://www.kimberly-clark.com/en/investors/annual-reports
Proxy Statementhttps://kimberlyclark.gcs-web.com/financial/proxy-statement
Principle 8
GRI 102-29 Board role in the identification and management of sustainability impacts, risks and opportunities
10-K https://www.kimberly-clark.com/en/investors/annual-reports
Proxy Statementhttps://kimberlyclark.gcs-web.com/financial/proxy-statement
Principles 7 & 8
GRI 102-30 Board role in reviewing risk management for sustainability
Proxy Statementhttps://kimberlyclark.gcs-web.com/financial/proxy-statement
GRI 102-31 Frequency of the board’s review of sustainability impacts, risks and opportunities
10-K https://www.kimberly-clark.com/en/investors/annual-reports
Proxy Statementhttps://kimberlyclark.gcs-web.com/financial/proxy-statement
Principles 7 & 8
GRI 102-33 Process for communicating critical concerns to the board
Code of Conducthttps://www.kimberly-clark.com/en/investors/corporate-governance/code-of-conduct
GRI 102-35 Pay policies for board & executives
Proxy Statementhttps://kimberlyclark.gcs-web.com/financial/proxy-statement
GRI 102-36 Process for determining remuneration
Proxy Statementhttps://kimberlyclark.gcs-web.com/financial/proxy-statement
GRI 102-37 Process for seeking stakeholder input on remuneration
Proxy Statementhttps://kimberlyclark.gcs-web.com/financial/proxy-statement
STRATEGY PRIORITIES GOVERNANCE ASSURANCEDATA
GRI Index TableData TablesBusiness Results
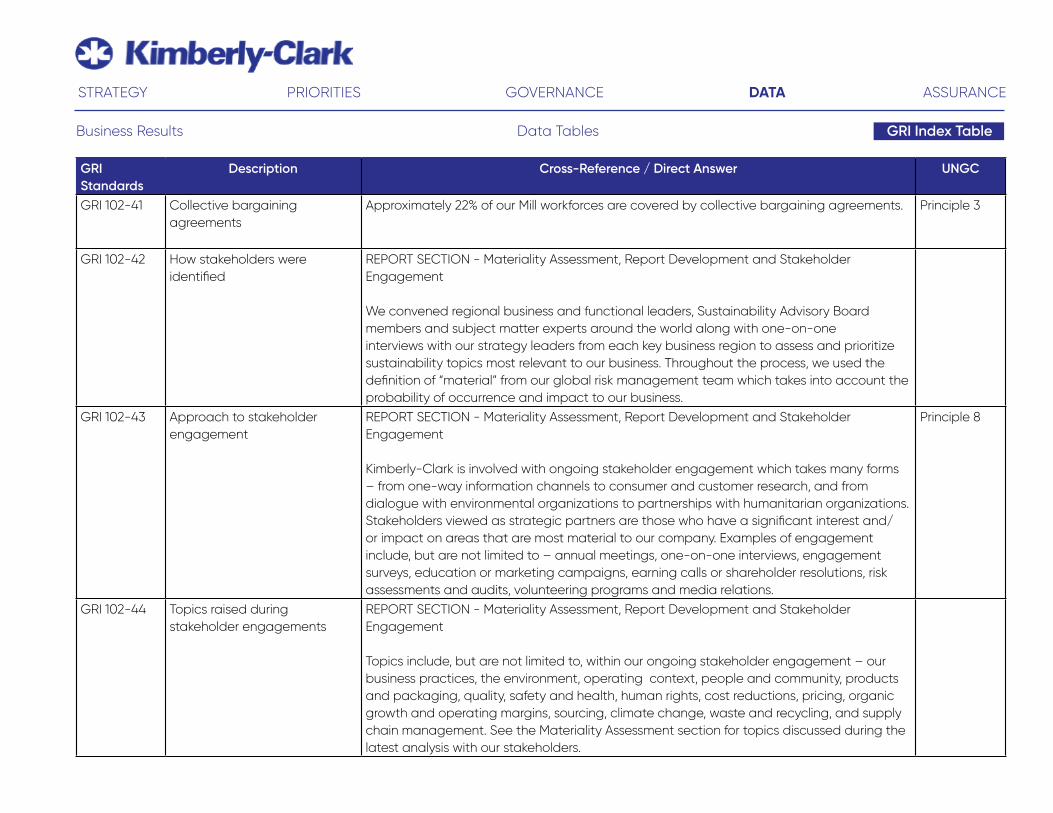
GRI Standards
Description Cross-Reference / Direct Answer UNGC
GRI 102-41 Collective bargaining agreements
Approximately 22% of our Mill workforces are covered by collective bargaining agreements. Principle 3
GRI 102-42 How stakeholders were identified
REPORT SECTION - Materiality Assessment, Report Development and Stakeholder Engagement
We convened regional business and functional leaders, Sustainability Advisory Board members and subject matter experts around the world along with one-on-one interviews with our strategy leaders from each key business region to assess and prioritize sustainability topics most relevant to our business. Throughout the process, we used the definition of “material” from our global risk management team which takes into account the probability of occurrence and impact to our business.
GRI 102-43 Approach to stakeholder engagement
REPORT SECTION - Materiality Assessment, Report Development and Stakeholder Engagement
Kimberly-Clark is involved with ongoing stakeholder engagement which takes many forms – from one-way information channels to consumer and customer research, and from dialogue with environmental organizations to partnerships with humanitarian organizations. Stakeholders viewed as strategic partners are those who have a significant interest and/or impact on areas that are most material to our company. Examples of engagement include, but are not limited to – annual meetings, one-on-one interviews, engagement surveys, education or marketing campaigns, earning calls or shareholder resolutions, risk assessments and audits, volunteering programs and media relations.
Principle 8
GRI 102-44 Topics raised during stakeholder engagements
REPORT SECTION - Materiality Assessment, Report Development and Stakeholder Engagement
Topics include, but are not limited to, within our ongoing stakeholder engagement – our business practices, the environment, operating context, people and community, products and packaging, quality, safety and health, human rights, cost reductions, pricing, organic growth and operating margins, sourcing, climate change, waste and recycling, and supply chain management. See the Materiality Assessment section for topics discussed during the latest analysis with our stakeholders.
STRATEGY PRIORITIES GOVERNANCE ASSURANCEDATA
GRI Index TableData TablesBusiness Results

GRI Standards
Description Cross-Reference / Direct Answer UNGC
GRI 102-45 Entities included in financial statements
10-K https://www.kimberly-clark.com/en/investors/annual-reports
GRI 102-46 Process for defining report boundaries and content
REPORT SECTIONS - Welcome to Our 2018 Sustainability Report; Materiality Assessment, Report Development and Stakeholder Engagement
Principle 8
GRI 102-47 Material aspects included in the report
REPORT SECTION - Materiality Assessment, Report Development and Stakeholder EngagmentFor additional information on our Materiality Assessment see pages 9-10 of our 2015 Sustainability Reporthttps://www.sustainability2022.com/en/download-center
GRI 102-48 Restatements After further review, Environmental Fines in 2017 were $6,000. GRI 102-49 Changes from previous reports
in terms of scope and/or boundaries
In early 2018, Kimberly-Clark announced a Global Restructuring Program which is expected to reduce Kimberly-Clark’s structural cost base and enhance the company’s flexibility to invest in its brands, growth initiatives and capabilities critical to delivering future growth. The company expects to close or sell approximately 10 manufacturing facilities and expand production capacity at several others to improve overall scale and cost. As part of the program, Kimberly-Clark expects to exit or divest some low-margin businesses in consumer tissue that generate approximately 1 percent of company net sales. The announcement does not alter the company’s Sustainability 2022 strategy and goals. More information on the Global Restructuring Program can be found in our press releasehttp://investor.kimberly-clark.com/releasedetail.cfm?ReleaseID=1054978
GRI 102-50 Reporting period January – December, 2018GRI 102-51 Date of most recent report 6/27/2018GRI 102-52 Reporting cycle AnnualGRI 102-53 Report contact [email protected] 102-54 Claims of reporting in
accordance with the GRI Standards
This report has been prepared in accordance with the Global Reporting Initiative (GRI)’s Sustainability Reporting Standards “Core” level.
GRI 102-55 GRI content index GRI Content IndexGRI 102-56 External assurance REPORT SECTION - Independent Assurance Statement Principle 8GRI 103-1 Explanation of the material
topic and its BoundaryREPORT SECTIONS: Welcome to Our 2018 Sustainability Report; Materiality Assessment, Report Development, and Stakeholder Engagement
STRATEGY PRIORITIES GOVERNANCE ASSURANCEDATA
GRI Index TableData TablesBusiness Results

GRI Standards
Description Cross-Reference / Direct Answer UNGC
GRI 103-2 The management approach and its components
REPORT SECTIONS - Welcome to Our 2018 Sustainability Report; Materiality Assessment, Report Development and Stakeholder Engagement
Kimberly-Clark commits to respect all human rights by having a policy commitment to do so, engaging in ongoing human rights due diligence and having processes embedded in our business to remediate human rights impacts. A foundational component of our remediation process are the myriad of formal and informal grievance mechanisms in our business.Our formal grievance mechanisms include those provided via our Code of Conduct: 1. Formal process which allows anyone around the globe to report a concern around compliance with our Code of Conduct 2. Annual acknowledgment - Annually we ask Kimberly-Clark employees to acknowledge they have read and understand our Code of Conduct and understand that they have an obligation to raise concerns regarding violations of the Code. 3. Corporate Social Compliance Audits - We conduct over 100 audits of key suppliers annually. As a part of this activity we review a given suppliers compliance with our Corporate Social Compliance Standards and local wage, hour and payroll laws. These audits include a random sampling of supplier employee interviews. 4. Consumer Reporting - Users of products around the globe may report concerns via toll-free calls or via the internet 5. Informally, we receive and investigate incidents of grievances from employees, suppliers and consumers around the globe. 6. Kimberly-Clark collaborates with global unions on an ongoing basis to discuss a variety of global labor issues with a goal to continue to foster open, productive communications.
Kimberly-Clark does not track number of grievances, however, K-C encourages its workers to raise complaints through a number of avenues such as our Code of Conduct reporting procedures, our anonymous Input to Action employee engagement survey, grievance procedures in collective bargaining agreements, and through dialogue with the European Works Council, the UNI Global Union and other similar stakeholders, to name a few. K-C also routinely encourages employees to report concerns to anyone in management with whom they feel comfortable as part of its compliance culture. Such claims, no matter how received, are thoroughly investigated.
STRATEGY PRIORITIES GOVERNANCE ASSURANCEDATA
GRI Index TableData TablesBusiness Results

GRI Standards
Description Cross-Reference / Direct Answer UNGC
GRI 103-3 Evaluation of the management approach
REPORT SECTIONS - Welcome to Our 2017 Sustainability Report; Materiality Assessment, Report Development and Stakeholder Engagement
GRI 201-1 Direct economic value generated and distributed
TABLE – Economic Performance Data10-K https://www.kimberly-clark.com/en/investors/annual-reports
GRI 201-2 Climate change risks Kimberly-Clark has been tracking its GHG emissions since 2005. The GHG emissions reduction progress has been 18.7% from 2005 to 2018. At Kimberly-Clark, the majority of our operational greenhouse gas (GHG) emissions result from energy use at our manufacturing facilities. We developed a corporate-wide GHG inventory of the three major greenhouse gases. These are Carbon Dioxide (CO2), Methane (CH4) and Nitrous Oxide (N20). Using the right Global Warming Potential Multipliers, these three types of emissions are combined and expressed into a single indicator called Carbon Dioxide equivalent (CO2e). All the GHG emissions reported internally and externally are expressed in Metric Tons of CO2e. Following the Greenhouse Gas Protocol: A Corporate Accounting and Reporting Standard (Revised Edition) issued by the World Resources Institute (WRI). All the Scope 1 and Scope 2 GHG emissions are verified by an independent third party entity to provide limited assurance of its accuracy and completeness. We have a goal of reducing GHG absolute emissions from manufacturing by 20% from a 2005 baseline (see body of report). Kimberly-Clark identified some inherent climate change risks that have the potential to generate a substantive change in its business operations, revenue and expenditure. One example of risks driven by regulation, is the carbon taxes in some of the countries and regions where K-C operates. Kimberly-Clark participates in the European Union Trading Scheme and is closely following the development of proposed climate emissions legislation in the United States and in other 35 countries where Kimberly-Clark has business interests related to its manufacturing or raw material sourcing. The company has built a database to track the existing and emerging carbon legislation in those countries where Kimberly-Clark operates, studying in particular the development of carbon legislation in the following countries: - Argentina - Australia - Bahrain - Brazil - Canada - India -Malaysia - Korea – Mexico – South Africa; among others.Continued on next page
Principle 7
STRATEGY PRIORITIES GOVERNANCE ASSURANCEDATA
GRI Index TableData TablesBusiness Results

GRI Standards
Description Cross-Reference / Direct Answer UNGC
GRI 201-2 Climate change risks Continued from previous pageOne particular example, is the imminent carbon tax scheme in South Africa, where the policy has been in the works for the better part of a decade. It was announced that a carbon tax in South Africa will go into effect on June 1st, 2019, making South Africa one of the about 40 countries worldwide to adopt a carbon-pricing program. The tax will be introduced in phases: The first phase will run until December 2022 and will tax carbon at a rate of about $8.34 per ton of CO2e. The treasury will assess the impact of the tax and the country’s progress toward emissions goals before the second phase of the policy, which will start in 2013 and end in 2030. In order to mitigate this risk, the K-C Family Care mill Enstra in South Africa will install a brand new natural gas boiler, in order to mitigate the greenhouse gas emissions and the high maintenance costs. It is calculated that the greenhouse gas emissions reduction obtained with the installation of the new natural gas boiler will be 17,000 MTCO2e. The project was approved in 2018 with scheduled startup during the third quarter of 2019. Also, changes in rain patterns and higher impacts from meteorological phenomenon are offering some risk to guarantee the efficient operation and competitive manufacturing costs on some countries where Kimberly-Clark has manufacturing facilities. One particular example of this risk, is Papeles del Cauca mill (Cauca), Colombia, is a strategic manufacturing facility within the Latin American Operations of Kimberly-Clark, manufacturing tissue products for the local market and regional market. The mill gets its electricity from the national utility grid, with consumption of more than 100,000 MW-h/year. Approximately 65%of the electricity in Colombia is generated from hydraulic sources; extreme temperatures in some areas of the country, changes in the rain patterns and some intense meteorological phenomenon such as “El Nino” are having during the recent years high impact on the availability and cost of electricity, due to the reduction of water levels in rivers and dams. Since 2015, the cost of electricity in Cauca mill has increased 33%, reaching in 2018 an average cost of $100 per megawatt-h. Continued on next page
Principle 7
STRATEGY PRIORITIES GOVERNANCE ASSURANCEDATA
GRI Index TableData TablesBusiness Results

GRI Standards
Description Cross-Reference / Direct Answer UNGC
GRI 201-2 Climate change risks Continued from previous page It was approved in 2018 the implementation of a new combined heat and power plant, capable to self-generate electricity and process steam, step-change savings can be achieved through the reduction of expensive electricity procured from the utility grid, and the use of exhaust heat for the generation of steam that can be used to offset some of the steam currently produced in the natural gas boiler of the site. A cogeneration plant capable to generate 10MWh of electricity and 12,000 lb/h of process steam, will produce 83% of the electricity demanded by Cauca mill and 100% of the process steam. Upon completion, the self-generate cost of electricity for the mill will be 50% lower. The start-up is scheduled during the fourth quarter of 2019. To support the growth of renewable energy sources, Kimberly-Clark has signed on to the Corporate Renewable Energy Buyers’ Principles, a collaboration of leading companies seeking simplified access to the renewable electricity to meet their clean and low carbon energy goals. Kimberly-Clark is actively looking for other alternatives, such as renewable energy (see body of report.)
Principle 7
GRI 201-3 Benefit plan coverage 10-K https://www.kimberly-clark.com/en/investors/annual-reportshttp://www.careersatkc.com/home.aspx
GRI 201-4 Financial assistance from the government
Kimberly-Clark does not receive financial assistance from US governments that would materially affect our position.
Principle 7
GRI 203-1 Infrastructure investments TABLE - Community & Employee ContributionsGRI 203-2 Investment s in high-poverty
areasSocial Impact: https://www.sustainability2022.com/five-priorities/social-impact
STRATEGY PRIORITIES GOVERNANCE ASSURANCEDATA
GRI Index TableData TablesBusiness Results

GRI Standards
Description Cross-Reference / Direct Answer UNGC
GRI 204-1 % of spend assigned to local suppliers
Kimberly-Clark’s global manufacturing network is served by an extensive supply chain that includes local, regional and global suppliers for purchased goods, materials, packaging and services. Our sourcing processes seek to balance responsible sourcing standards and support for local supplier options while optimizing total delivered cost inclusive of material cost and transportation. As a result, a significant amount of purchases are made with local suppliers where possible, while recognizing that some purchases must be made where suppliers are available on a global basis.
GRI 205-1 Risks related to corruption In Kimberly-Clark’s Code of Conduct, we discuss mechanisms for reporting unlawful/unethical behavior.Link 1: https://www.kimberly-clark.com/en/investors/corporate-governance/code-of-conductLink 2: https://www.kimberly-clark.com/en/responsibility/ethics-governance
Principle 10
GRI 205-2 Communications and training on anti-corruption
In 2018, we provided 30 mins of Code of Conduct training to all office-based K-C employees with computer access. We also provided additional risk-based training as needed. The 2018 Code of Conduct training included content regarding conducting business using third parties. As part of the annual Code of Conduct training, employees were required to read, understand, and comply with the Code of Conduct. Anti-corruption is addressed in the Code of Conduct.
https://www.kimberly-clark.com/en/investors/corporate-governance/code-of-conduct
It is the policy of Kimberly-Clark to conduct business in compliance with all anti-bribery and anti-corruption laws.
Principle 10
STRATEGY PRIORITIES GOVERNANCE ASSURANCEDATA
GRI Index TableData TablesBusiness Results

STRATEGY PRIORITIES GOVERNANCE ASSURANCEDATA
GRI Standards
Description Cross-Reference / Direct Answer UNGC
GRI 206-1 Anti-competitive behavior Operating with integrity and high ethical standards is critical, and Kimberly-Clark has strict corporate policies and a Code of Conduct that govern its business operations and practices globally. In 2018, we were subject to various legal actions and governmental inquiries regarding anti-competitive behavior. Kimberly-Clark seeks to provide voluntary cooperation to authorities, in accordance with the company’s strict corporate policies and Code of Conduct.
https://www.kimberly-clark.com/en/investors/corporate-governance/code-of-conduct
Principle 10
GRI 301-1 Materials by weight or volume TABLE - Materials Consumption and Production Principle 8GRI 301-2 Recycled input materials TABLE - Materials Consumption and Production Principle 8GRI 301-3 Products and packaging
materials reclaimedTABLE - Post-Consumer Waste Principle 8
& 9GRI 302-1 Energy consumption (Scope 1
& 2)TABLE - Energy use (Direct and Indirect) Principle 8
GRI 302-2 Energy consumption outside the organization (Scope 3)
TABLE - Energy use (Direct and Indirect)
GRI 302-3 Energy intensity TABLE - Energy use (Direct and Indirect)GRI 302-4 Energy reductions TABLE - Energy use (Direct and Indirect) Principle 8
& 9
GRI Index TableData TablesBusiness Results

GRI Standards
Description Cross-Reference / Direct Answer UNGC
GRI 303-1 Water withdrawals by source TABLE - Water use Principle 8GRI 303-3 Water recycled and reused TABLES - Water Use, Tissue Manufacturing Water Use Efficiency Principle 8GRI 304-2 Impacts on biodiversity All of our wood fiber suppliers are certified under a forest certification scheme which assures
that there is a low risk of sourcing wood fiber from protected areas or areas of high diversity outside protected areas
Principle 8
GRI 304-3 Habitats protected or restored All of our wood fiber suppliers are certified under a forest certification scheme which assures that there is a low risk of sourcing wood fiber from protected areas or areas of high diversity outside protected areas
Principle 8
GRI 305-1 Direct greenhouse gas (GHG) emissions (Scope 1)
TABLE - Greenhouse Gas Emissions Principle 8
GRI 305-2 Energy indirect greenhouse gas (GHG) emissions (Scope 2)
TABLE - Greenhouse Gas Emissions Principle 8
GRI 305-3 Other indirect greenhouse gas (GHG) emissions (Scope 3)
TABLES - 2018 Scope 3 Calculation Results and Intermodal Transportation Principle 8
GRI 305-4 GHG emissions intensity TABLE - Greenhouse Gas Emissions Principle 8GRI 305-5 Reduction of GHG emissions In 2018, Kimberly-Clark’s absolute direct and indirect (scope 1 and 2) global GHG emissions
were 4,522 Million metric tons (MT) of CO2e. This GHG emissions represent a reduction of 18.7% from the baseline year of 2005; which is one percent points reduction versus the previous year 2017. This reduction was mainly driven by the impact of more than 220 energy conservation projects impacting in 2018, aligned with the implementation of energy best practices around lighting, compressed air, steam systems, heat recovery and process improvements focused on energy efficiency and energy consumption. See Body of Report
Principle 7, 8 & 9
STRATEGY PRIORITIES GOVERNANCE ASSURANCEDATA
GRI Index TableData TablesBusiness Results

GRI Standards
Description Cross-Reference / Direct Answer UNGC
GRI 305-7 NOx, SO2 and other significant air emissions
TABLE - Other Criteria Pollutants Principle 8
GRI 306-1 Water discharge by quality and destination
Since 2000, we have required all facilities and business units to certify their compliance with our biological oxygen demand (BOD) and total suspended solids (TSS) global wastewater performance standards. In 2006, we developed a program to monitor acute toxicity at our international mills on a rotating basis and introduced corrective measures at mills where acute toxicity was present. And in 2011 we formalized the standard requiring that all wastewater discharges be free of acute toxicity. Within our Sustainability 2022 strategy, we are following the same standards established prior.
Principle 8
GRI 306-2 Waste by type and disposal method
TABLE - Manufacturing Waste, Nonhazardous and Hazardous Principle 8
GRI 306-3 Significant spills No significant spills Principle 8GRI 306-4 Transport of hazardous waste TABLE - Hazardous Manufacturing Waste Principle 8GRI 307-1 Monetary value of significant
finesNo significant environmental fines in 2018.
GRI 308-1 New suppliers screened using environmental criteria
Kimberly-Clark deploys a targeted approach to addressing environmental impacts in our supply chain both at the initial sourcing and ongoing category management periods. These approaches include, but are not limited to:
* Kimberly-Clark’s SupplierLINK portal provides a listing of applicable standards and requirements for raw materials and social responsibility [https://www.kimberly-clark.com/en-us/company/supplier-link/standards-and-requirements]* Fiber-based packaging suppliers must report their ongoing use of recycled and responsibly sourced fiber.* Contract manufacturing & branded packaging suppliers are subject to periodic social compliance audits administered by our Corporate Social Compliance program. * Contract manufacturers are reviewed through a thorough, multi-category due diligence process including environmental factors. * Risk assessments are performed for existing suppliers on a multi-disciplinary basis, including for environmental and social sustainablity risk factors.
STRATEGY PRIORITIES GOVERNANCE ASSURANCEDATA
GRI Index TableData TablesBusiness Results

GRI Standards
Description Cross-Reference / Direct Answer UNGC
GRI 308-2 Supply chain environmental impacts
Kimberly-Clark deploys a targeted approach to addressing environmental impacts in our supply chain both at the initial sourcing and ongoing category management periods. These approaches include, but are not limited to:
* Kimberly-Clark’s SupplierLINK portal provides a listing of applicable standards and requirements for raw materials and social responsibility [https://www.kimberly-clark.com/en-us/company/supplier-link/standards-and-requirements]* Fiber-based packaging suppliers must report their ongoing use of recycled and responsibly sourced fiber.* Contract manufacturing & branded packaging suppliers are subject to periodic social compliance audits administered by our Corporate Social Compliance program. * Contract manufacturers are reviewed through a thorough, multi-category due diligence process including environmental factors. * Risk assessments are performed for existing suppliers on a multi-disciplinary basis, including for environmental and social sustainablity risk factors.
GRI 401-1 Rates of Employee Turnover Global turnover totals approximatly 9,550 (5450 Hourly, 4100 Salary)
U.S. tunrover totals 2,400 (1000 Hourly and 1400 Salary)
* all roundedGRI 401-2 Benefits provided to full-time
employeesKimberly-Clark is a global company with manufacturing facilities and offices in 72 countries. As a result of this diversity in operational locations, benefits vary between countries and significant operating locations.
Across all locations, Kimberly-Clark strives to provide a market-competitive benefits package to employees within their specific location, which may include access to government-provided benefits where applicable.
STRATEGY PRIORITIES GOVERNANCE ASSURANCEDATA
GRI Index TableData TablesBusiness Results
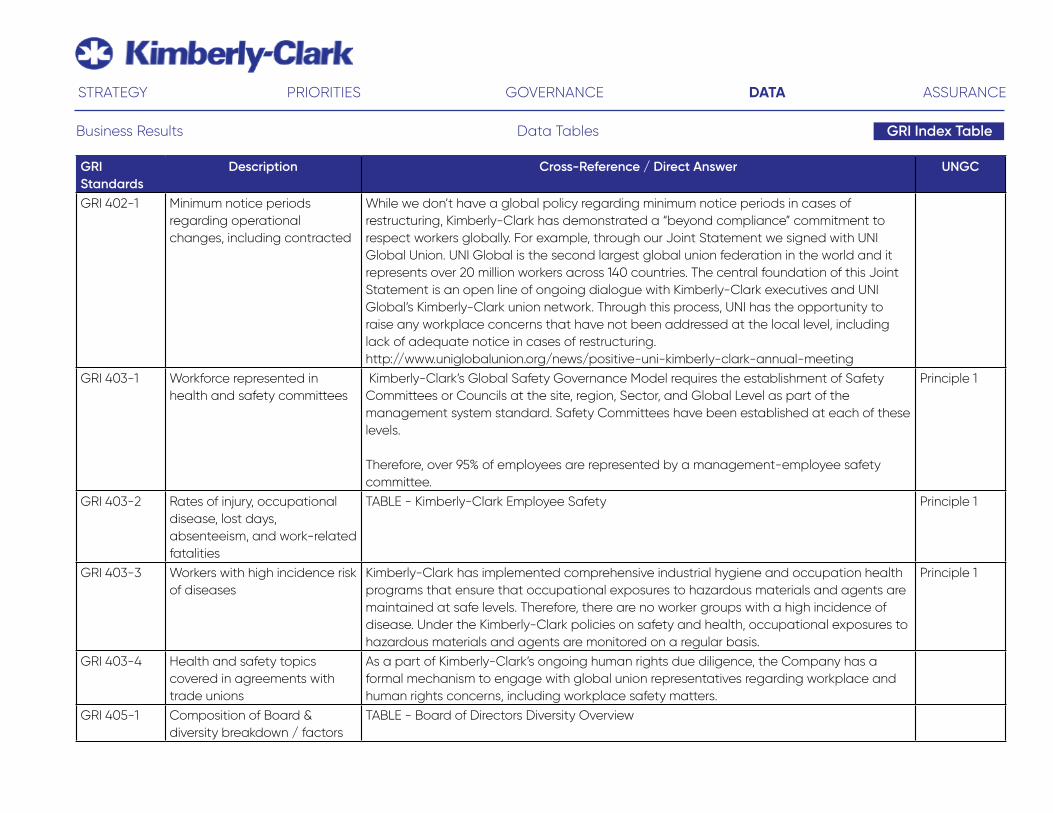
GRI Standards
Description Cross-Reference / Direct Answer UNGC
GRI 402-1 Minimum notice periods regarding operational changes, including contracted
While we don’t have a global policy regarding minimum notice periods in cases of restructuring, Kimberly-Clark has demonstrated a “beyond compliance” commitment to respect workers globally. For example, through our Joint Statement we signed with UNI Global Union. UNI Global is the second largest global union federation in the world and it represents over 20 million workers across 140 countries. The central foundation of this Joint Statement is an open line of ongoing dialogue with Kimberly-Clark executives and UNI Global’s Kimberly-Clark union network. Through this process, UNI has the opportunity to raise any workplace concerns that have not been addressed at the local level, including lack of adequate notice in cases of restructuring. http://www.uniglobalunion.org/news/positive-uni-kimberly-clark-annual-meeting
GRI 403-1 Workforce represented in health and safety committees
Kimberly-Clark’s Global Safety Governance Model requires the establishment of Safety Committees or Councils at the site, region, Sector, and Global Level as part of the management system standard. Safety Committees have been established at each of these levels.
Therefore, over 95% of employees are represented by a management-employee safety committee.
Principle 1
GRI 403-2 Rates of injury, occupational disease, lost days, absenteeism, and work-related fatalities
TABLE - Kimberly-Clark Employee Safety Principle 1
GRI 403-3 Workers with high incidence risk of diseases
Kimberly-Clark has implemented comprehensive industrial hygiene and occupation health programs that ensure that occupational exposures to hazardous materials and agents are maintained at safe levels. Therefore, there are no worker groups with a high incidence of disease. Under the Kimberly-Clark policies on safety and health, occupational exposures to hazardous materials and agents are monitored on a regular basis.
Principle 1
GRI 403-4 Health and safety topics covered in agreements with trade unions
As a part of Kimberly-Clark’s ongoing human rights due diligence, the Company has a formal mechanism to engage with global union representatives regarding workplace and human rights concerns, including workplace safety matters.
GRI 405-1 Composition of Board & diversity breakdown / factors
TABLE - Board of Directors Diversity Overview
STRATEGY PRIORITIES GOVERNANCE ASSURANCEDATA
GRI Index TableData TablesBusiness Results

GRI Standards
Description Cross-Reference / Direct Answer UNGC
GRI 406-1 Incidents of discrimination Through our Corporate Social Compliance Audits, Kimberly-Clark had the following allegations: 0 allegation of Discrimination for K-C Audits in 20186 allegation of Discrimination for Customer Required Audits in 2018
Principle 6
GRI 407-1 Freedom of association and collective bargaining
In the course of facility & supplier auditing, no violations of freedom of association or collective bargaining were identified.
GRI 408-1 Child Labor 0 incidences of child labor within supply chain Principles 1, 2 & 5
GRI 409-1 Forced or Compulsory Labor TABLE - Social Compliance Audit Results Principles 1, 2 & 4
GRI 410-1 Security personnel trained in the organization’s human rights policies
Kimberly-Clark employees, including those security personnel who are Kimberly-Clark employees, receive Code of Conduct training which includes instructions on Kimberly-Clark’s Human Rights policies.
https://www.kimberly-clark.com/en/responsibility/ethics-governance
Principles 1 & 2
GRI 411-1 Incidents of violations involving rights of indigenous peoples
We know of no incidents involving rights of indigenous peoples. Principles 1 & 2
GRI 412-1 Operations that have been subject to human rights assessments
We conducted corporate social compliance audits in 37 countries in 2018. Principles 1, 2, 4 & 5
GRI 412-2 Employee training on human rights
In 2018, we provided 30 mins of Code of Conduct training to all office-based K-C employees with computer access. We also provided additional risk-based training as needed. The 2018 Code of Conduct training did not specifically call out Human Rights as a topic within the course; however, as part of the annual Code of Conduct training, employees were required to read, understand, and comply with the Code of Conduct. The Code of Conduct specifically addresses Human Rights on page 40.
https://www.kimberly-clark.com/en/investors/corporate-governance/code-of-conduct
Principles 1 - 6
STRATEGY PRIORITIES GOVERNANCE ASSURANCEDATA
GRI Index TableData TablesBusiness Results

GRI Standards
Description Cross-Reference / Direct Answer UNGC
GRI 412-3 Investment agreements and contracts that include human rights clauses or underwent screening
Clauses concerning human rights are incorporated into all of our terms and conditions in supplier contracts and purchase orders.
Principles 1 - 6
GRI 413-1 % operations w/ local community programs
REPORT SECTION: Welcome to Our 2018 Sustainability Report; Materiality Assessment, Stakeholder Engagement, Social Impact and Community & Employee Contributions Table We believe collaboration and feedback ensures that our reporting addresses the issues that are important to our business, stakeholders and customers alike. That’s why, when considering what to include in this report, we engaged with internal and external stakeholders, including our Sustainability Advisory Board, customers, NGOs, peer companies and Kimberly-Clark business and functional teams.
GRI 414-1 New suppliers that were screened using labor practices criteria
In 2018, 7 new external contract manufacturers were audited as part of our Corporate Social Compliance program prior to selection as suppliers.
Principles 1 - 6
GRI 414-2 Incidents of Negative impacts in supply chain & actions taken
We completed a total of 220 social compliance audits for 185 key facilities in 2018;
In 2018, 10 suppliers were identified as having potential or actual impacts for labor practices such as passport retention, discrimination, corruption, or working hours. Of those found to have actual impacts through auditing, approximately 50% mitigated those findings within 2018.
0 relationships were terminated due to non-compliances of our Suppliers Social Compliance Standards.
GRI 415-1 Political contributions In general, Kimberly-Clark’s Anti-Corruption Policy prohibits employees and representatives from making contributions on behalf of Kimberly-Clark to candidates for political office or for other political campaigns. All exceptions require written pre-approval from Kimberly-Clark’s General Counsel and Chief Compliance Officer.
Principle 10
STRATEGY PRIORITIES GOVERNANCE ASSURANCEDATA
GRI Index TableData TablesBusiness Results
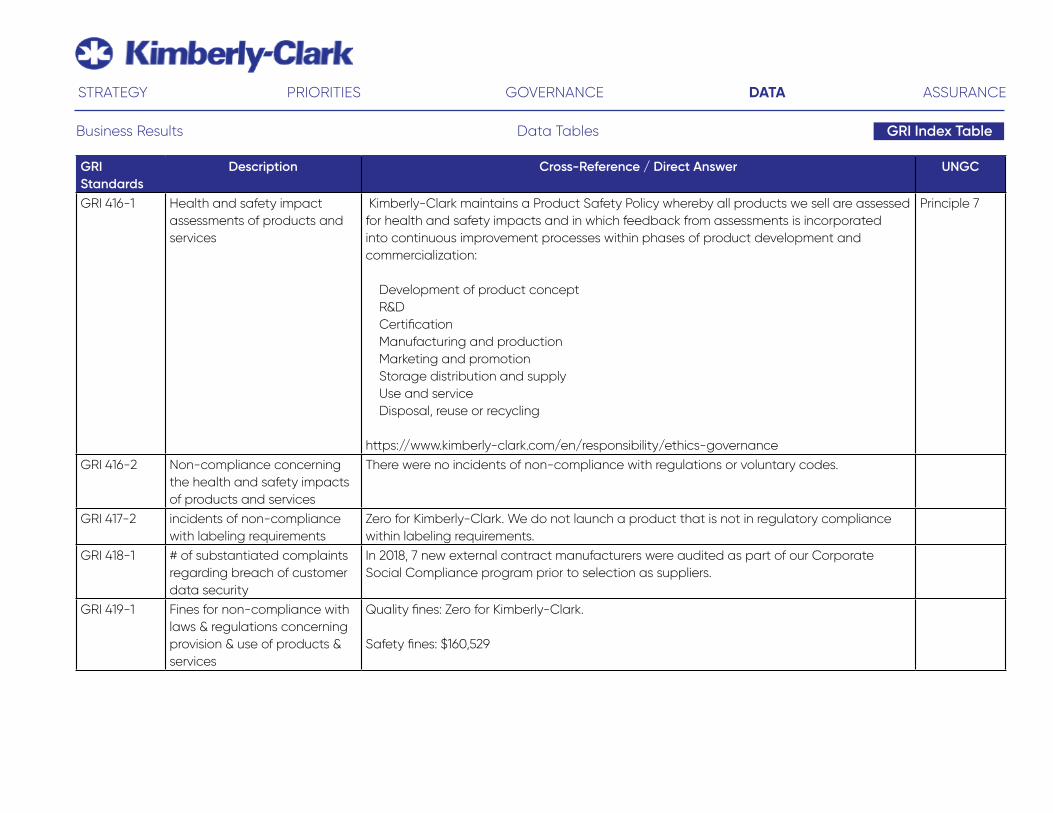
GRI Standards
Description Cross-Reference / Direct Answer UNGC
GRI 416-1 Health and safety impact assessments of products and services
Kimberly-Clark maintains a Product Safety Policy whereby all products we sell are assessed for health and safety impacts and in which feedback from assessments is incorporated into continuous improvement processes within phases of product development and commercialization:
Development of product concept R&D Certification Manufacturing and production Marketing and promotion Storage distribution and supply Use and service Disposal, reuse or recycling
https://www.kimberly-clark.com/en/responsibility/ethics-governance
Principle 7
GRI 416-2 Non-compliance concerning the health and safety impacts of products and services
There were no incidents of non-compliance with regulations or voluntary codes.
GRI 417-2 incidents of non-compliance with labeling requirements
Zero for Kimberly-Clark. We do not launch a product that is not in regulatory compliance within labeling requirements.
GRI 418-1 # of substantiated complaints regarding breach of customer data security
In 2018, 7 new external contract manufacturers were audited as part of our Corporate Social Compliance program prior to selection as suppliers.
GRI 419-1 Fines for non-compliance with laws & regulations concerning provision & use of products & services
Quality fines: Zero for Kimberly-Clark.
Safety fines: $160,529
STRATEGY PRIORITIES GOVERNANCE ASSURANCEDATA
GRI Index TableData TablesBusiness Results

A Message From Our External Assurance Firm
Scope and Objectives
WSP was commissioned by Kimberly-Clark Corporation (Kimberly-Clark) to conduct independent assurance of its 2018 Sustainability Report (‘the report’) as published on the company’s website at http://www.kimberly-clark.com/sustainability.
We planned and performed our work in accordance with the AA1000 Assurance standard 2008 (AA1000AS). We were engaged to provide an AA1000 Type 2 assurance, which covers evaluation of adherence to the AA1000AS assurance principles of Inclusivity, Materiality and Responsiveness. We also reviewed the reliability of specified sustainability performance information to a moderate level of assurance.
In addition, as criteria for our assurance work, we used the GRI 101 Foundation guidelines which set out the Reporting Principles for defining report content and quality and the ISO standard 14064-3: Greenhouse gases Part 3: Specification with Guidance for the validation and verification of greenhouse gas assertions.
The information and presentation of data within the Sustainability Report is the responsibility of Kimberly-Clark. This statement is the responsibility of WSP and represents our independent opinion. The intended users of this statement are the readers of the Kimberly-Clark Sustainability Report, an it is intended for this statement to be read in its entirety.
Our assurance team has the appropriate experience and competency to complete this assurance engagement. WSP has a Quality Management System (QMS) which is certified to BS EN ISO9001 under which all our work is managed. The WSP Assurance team is not working for Kimberly-Clark beyond what is required of this assignment.
STRATEGY PRIORITIES GOVERNANCE ASSURANCEDATA

Methodology for Adherence to the AA 1000 accountability Principles and GRI
Our work was conducted between March and May 2019. We tested, on a sample basis, the processes and management practices used to adhere to and evaluate adherence to the AA1000AS Accountability Principles of Inclusivity, Materiality and Responsiveness. The GRI Reporting Principles of ‘stakeholder inclusiveness’ and ‘materiality’ for defining report content are very similar to the AA1000AS principles. In addition, we also tested adherence to the GRI Reporting Principles of ‘sustainability context’ and ‘completeness’ and to the GRI Reporting Principles for defining report quality of accuracy, balance, clarity, comparability, reliability and timeliness. Evidence gathering for evaluating adherence to the Principles included:
• Understanding and testing the processes used to adhere to and evaluate adherence to the Accountability Principles and the GRI Reporting Principles.
• Inquiring of management, including senior management at executive and functional levels, and of relevant management responsible for the day to day management of sustainability, about the effectiveness of processes used to manage and evaluate the sustainability impact of Kimberly-Clark.
• A review of the output of Kimberly-Clark’s 2016 materiality review and strategy based updates and how the AA1000 inclusivity principle has been addressed.
• Observing and inspecting management practices, process testing and evidence gathering across the organization on a sample basis.
• Collecting and evaluating documentary evidence and management representations that support adherence to the principles.
STRATEGY PRIORITIES GOVERNANCE ASSURANCEDATA

Methodology for Assurance of Sustainability Performance Data
WSP’s review of specific sustainability performance data used ISO14064-3 as a guideline under the AA1000AS standard as the umbrella standard. Currently there is no assurance guideline specifically for water, waste, or energy. Therefore, WSP has applied the principles from ISO14064-3 to the Greenhouse gas emissions, water, waste, and energy assurance. The performance data review has been conducted to a limited level of assurance including evaluation of the adequacy of the collection, processing, consolidation and internal reporting of data. The WSP inventory and management system review consisted of a desktop review of supporting data and an output of the 2018 inventory and data files from the Kimberly-Clark internal sustainability data management system.
WSP Opinion
On the basis of the work conducted, nothing came to our attention to suggest that the Sustainability Report does not meet the principles, content and quality requirements of AA1000AS for a Type 2 Moderate Level of Assurance and the GRI Reporting Principles.
We have made the following findings and conclusions with respect to the AA1000 (2008) principles and the GRI Reporting Principles.
Inclusivity – Kimberly-Clark has systems in place for internal and external stakeholders to participate in the development of the organization’s response to sustainability issues. The 2016 materiality assessment process helped identify the links between stakeholder participation and the determination of Kimberly-Clark’s sustainability issues. Stakeholders also have opportunity for engagement in relation to the Sustainability Program via regular internal and external stakeholders’ interactions throughout the year. Stakeholder participation continues to be encouraged across all regions and sites through the network of sustainability coordinators. It will be important to include needs and expectations of local as well as global stakeholders in evaluation of material issues to report in future.
STRATEGY PRIORITIES GOVERNANCE ASSURANCEDATA

Sustainability Context and Materiality –The report presents performance information for Kimberly-Clark’s direct activities as well as its value chain. Geographic contexts are referenced where appropriate, however, it is noted that in general the report presents the global activities and performance.
Kimberly-Clark completed a sustainability materiality assessment in 2016 which determined the relevance and significance of issues that are material to its sustainability performance. This materiality assessment followed a clear process for identifying business risks which was informed by engagement with stakeholders, societal and peer-based norms, financial considerations and policy-based performance. The materiality assessment process was reviewed during 2018 to check current stakeholder interests and expectations were identified and represented the issues for inclusion in the 2018 Sustainability report. There is a commitment to conduct a refresh of the sustainability materiality process during 2019. Consideration should be made to producing regional materiality matrices in addition to the global materiality matrix to ensure that regional variations can be documented and addressed as appropriate.
Responsiveness and Report Quality – The Kimberly-Clark Sustainability Report provides stakeholders with a globally representative explanation of changes in the organization throughout the year, and reports on performance on all the key material issues. Data is provided to support qualitative statements where available and the accuracy of data is audited internally before it is presented in the Sustainability Report. Assumptions and techniques used for estimation are included as part of this review process. In addition, the Kimberly-Clark Internal Audit team conducted an auditof internal compliance with Kimberly-Clark’s policy on Global Fiber Procurement.
Kimberly-Clark also communicates with employees on a variety of sustainability issues through team meetings, email communication, noticeboards and the intranet. Responses are made to sustainability requests from customers and other stakeholders as they arise.
STRATEGY PRIORITIES GOVERNANCE ASSURANCEDATA

GRI Reporting Principles for Defining Report Quality - It is our opinion that the Sustainability Report meets the GRI Reporting Principles for defining report quality of accuracy, balance, clarity, comparability, reliability and timeliness.
Completeness -The report includes coverage of material topics and their boundaries, sufficient to reflect significant economic, environmental, and social impacts, and to enable stakeholders to assess the reporting organization’s performance in the reporting period.
Accuracy - The reported information is considered sufficiently accurate and detailed for stakeholders to assess the reporting organization’s performance.
Balance - The reported information reflects positive and negative aspects of the reporting organization’s performance to enable a reasoned assessment of overall performance. Performance information is presented to show year on year comparison and the achievement or otherwise towards goals set.
Clarity - The report presents information in a manner that is understandable and accessible to stakeholders with the appropriate use of tables and diagrams and stories to help present information.
Comparability -Sustainability data are selected, compiled and reported in accordance with the Global Reporting Initiative (GRI) Sustainability Reporting Standards, Core level which are best practice benchmarks which allow for comparison relative to other organizations on a year by year basis.
Reliability - The reported information is gathered, recorded, compiled, and analyzed in a way that it can be subject to examination, and that establishes the quality and materiality of the information. The information and data in the report is subject to rigorous internal audit review. The internal audit process together with the external assurance of the Sustainability report and specified reporting information using a recognized best practice standard ensures that the report can be relied upon.
Timeliness -The information in the report clearly indicates the time period to which it relates and this is presented alongside data from previous years to aid comparability of data year on year.
STRATEGY PRIORITIES GOVERNANCE ASSURANCEDATA

Reliability of Specified Performance Information
Scope 3 emissions (purchased goods and services, capital goods, fuel and energy related activities, upstream transportation and distribution, waste generated in operations, end of life treatment of sold products, and investments), energy, water, and waste performance data for 2018 and have been able to obtain an AA1000:2008 moderate level of assurance in respect of the data which is reported in the Sustainability Report. This level of assurance is equivalent of a limited assurance under ISO 14064-3.
The findings of the assurance engagement provide confidence in the systems and processes used for managing and reporting sustainability performance information. Data trails selected were identifiable and traceable, and the personnel responsible were able to reliably demonstrate the origin(s) and interpretation of data.
The internal sustainability data management system compares data entries against a band of expected values to flag significant anomalies in the data. Kimberly-Clark collects the specified performance data monthly. Quarterly reviews by the Kimberly-Clark Sustainability Corporate team enables data to be analyzed more frequently, and as a result, Kimberly-Clark can more actively identify data anomalies and improvement opportunities for sites not meeting their improvement goals.
A few errors in the reporting of waste, water or energy were identified during the assurance exercise; These include misallocation of renewable energy for market-based emissions and misreported or missing energy data. However, these did not have a material impact on reporting at Kimberly-Clark Group level. All errors were corrected prior to the Sustainability Report being published.
Recommendations for Kimberly-Clark to consider implementing for future reporting have been provided in a separate “Data Assurance Review Findings Report”. Kimberly-Clark has addressed all requests for clarification and has completed all necessary corrective actions. The details of the scope of this assurance review can be found in the following tables.
STRATEGY PRIORITIES GOVERNANCE ASSURANCEDATA

Assurance Parameter Relevant Inventory SpecificationCalculation and Reporting Protocol GHG The Greenhouse Gas Protocol: A Corporate Accounting and Reporting Standard
(Revised Edition)Verification Standard GHG ISO 14064-3Type of Assurance GHG LimitedOrganizational Boundary GHG Operational controlGeography GHG Global operationsInventory Period and Emissions Covered GHG January 1, 2018 to December 31, 2018 Scope 1 GHG 2,078,281 metric tons CO2e (all Scope 1 sources) Scope 2 Location-Based GHG 2,387,014 metric tons CO2e (all Scope 2 sources) Scope 2 Market-Based GHG 1,987,158 metric tons CO2e (all Scope 2 sources)Scope 3 GHG Category 1 Purchased Goods & Services: 7,211,326 metric tons CO2eScope 3 GHG Category 2 Capital Goods: 566,569 metric tons CO2eScope 3 GHG Category 3 Fuel & Energy Related Activities: 1,367,852 metric tons CO2eScope 3 GHG Category 4 Upstream Transportation and Distribution:
292,147 metric tons CO2e1
Scope 3 GHG Category 5 Waste generated in Operations: 299,440 metric tons CO2e
Assurance Parameter Relevant Inventory SpecificationScope 3 GHG Category 12 End of Life sold products: 1,953,082 metric tons CO2eScope 3 GHG Category 15 Investments: 346,068 metric tons CO2eSupporting Documents Reviewed GHG Scope 1, 2, and 3 Inventory activity data and calculations in SoFi Energy
purchasing data, spend data, product transportation data, waste and water inventory and invoice data, production volumes, and
investment allocations.Date Review Complete May 23, 2019
Assurance Scope: GHG and Energy
Footnote: (1) Upstream transportation emissions include outbound product transport only.
STRATEGY PRIORITIES GOVERNANCE ASSURANCEDATA
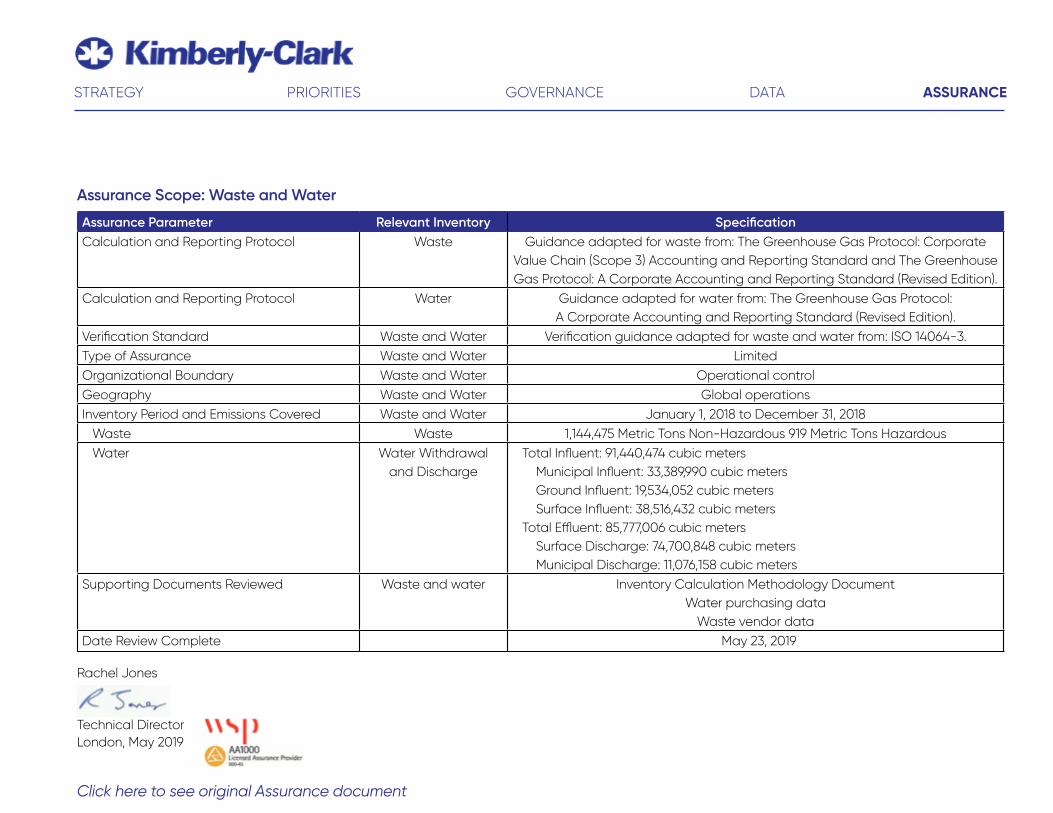
Assurance Parameter Relevant Inventory SpecificationCalculation and Reporting Protocol Waste Guidance adapted for waste from: The Greenhouse Gas Protocol: Corporate
Value Chain (Scope 3) Accounting and Reporting Standard and The Greenhouse Gas Protocol: A Corporate Accounting and Reporting Standard (Revised Edition).
Calculation and Reporting Protocol Water Guidance adapted for water from: The Greenhouse Gas Protocol: A Corporate Accounting and Reporting Standard (Revised Edition).
Verification Standard Waste and Water Verification guidance adapted for waste and water from: ISO 14064-3.Type of Assurance Waste and Water LimitedOrganizational Boundary Waste and Water Operational controlGeography Waste and Water Global operationsInventory Period and Emissions Covered Waste and Water January 1, 2018 to December 31, 2018 Waste Waste 1,144,475 Metric Tons Non-Hazardous 919 Metric Tons Hazardous Water Water Withdrawal
and Discharge Total Influent: 91,440,474 cubic meters Municipal Influent: 33,389,990 cubic meters Ground Influent: 19,534,052 cubic meters Surface Influent: 38,516,432 cubic meters Total Effluent: 85,777,006 cubic meters Surface Discharge: 74,700,848 cubic meters Municipal Discharge: 11,076,158 cubic meters
Supporting Documents Reviewed Waste and water Inventory Calculation Methodology DocumentWater purchasing data
Waste vendor dataDate Review Complete May 23, 2019
Assurance Scope: Waste and Water
Rachel Jones
Technical DirectorLondon, May 2019
STRATEGY PRIORITIES GOVERNANCE ASSURANCEDATA
Click here to see original Assurance document

2018SustainabilityReport