Embed Size (px)
Citation preview

http://www.IQuOD.org
2018 International Quality-Controlled Ocean Database
(IQuOD) – 5th IQuOD Annual Workshop
5th CLIVAR GSOP IQuOD 3rd IODE SG-IQuOD 2ns SCOR WG 148
16-18 April, Oostende, IODE headquarters
Belgium

1
Editors
Catia Domingues, Marlos Goes, Rachel Killick, Franco Reseghetti, Simona Simoncelli, Guilherme Castelao
– with great help from notetakers, chairs and presenters.
Bibliographic Citation
IQuOD (International Quality-controlled Ocean Database) 5th Annual Workshop Report, April, 2018.
Sponsorship
We greatly acknowledge financial and logistical support from:
• The International Council for Science, Scientific Committee on Oceanic Research (SCOR) via Working Group 148 (http://www.scor-int.org/SCOR_WGs_WG148.htm).
• IODE Project for the SG IQuOD project established by IODE-XXIII (2015) through Recommendation IODE-XXIII.3 and the project is managed by the IODE Steering Group for the IODE-IQuOD project (SG-IQuOD).
2
Organizers/Steering Team
Organizing Commitee
● Catia Domingues (University of Tasmania, Australia / co-chair of IQuOD Steering Team) ● Matthew Palmer (Met Office, UK / co-chair of IQuOD Steering Team) ● Peter Pissierssens (IODE) ● Janet Sprintall (SIO/UCSD, USA / co-chair of XBT Science Team) ● Gustavo J. Goni (AOML/NOAA, USA, AOML/NOAA, USA / co-chair of XBT Science Team)
Local Organizers/IODE
• Peter Pissierssens
• Kristin De Lichtervelde
• Sofie De Baenst
• Claudia Delgado
• Aditya Naik Kakodkar
IODE Portal: SG-IQuOD
2018 meeting of the IODE Steering Group for the International Quality Controlled Ocean Database
16 - 18 April 2018, Oostende, Belgium
https://www.iode.org/index.php?option=com_oe&task=viewEventAgenda&eventID=2100
• Overview
• Agenda
• Documents
• Participants (32 participants + 6 participants online via webex)

3
Workshop objectives
• To provide an overview of what has been completed as part of IQuOD interim product v0.1 and discuss what went well and what could be improved (e.g., integrity checks, traceability, roadblocks, etc)
• To review/discuss task teams plans beyond v0.1 and workout a draft plan/timeline (to note roadblocks and resources required to overcome them)
• To start planning for training/outreach activities
• To plan for dissemination/feedback strategies for IQuOD datasets/related products.

4
Table of Contents
1. DAY 1: MONDAY MORNING ............................................................................................................................................ 5
1.1 MONDAY 9.20 AM – IOC’S DATA AND INFORMATION EXCHANGE PROGRAMME: IODE............................................................................ 6 1.2 MONDAY 9.40 AM – IOC CAPACITY DEVELOPMENT STRATEGY 2015-2021 AND THE ROLE OF THE OCEAN TEACHER GLOBAL ACADEMY (OTGA) 9 1.3 MONDAY 10.00 AM – IQUOD OVERVIEW .................................................................................................................................... 12 1.4 MONDAY 11.00 AM – INTELLIGENT META-DATA TASK TEAM: PLANS AND PROGRESS ........................................................................ 15 1.5 MONDAY 11.30 AM – UNCERTAINTIES TASK TEAM: SUMMARY ......................................................................................................... 17 1.6 MONDAY 12.00 PM – IQUOD FORMATS TASK TEAM ...................................................................................................................... 18
2 DAY 1: MONDAY AFTERNOON ....................................................................................................................................... 20
2.1 MONDAY 2.00 PM – LONG TERM AND REAL TIME OBSERVATIONS NETWORK OF THE OCEAN MEGA SCIENCE CENTER..................................... 21 2.2 MONDAY 2.20 PM – UDASH – UNIFIED DATABASE FOR ARCTIC AND SUBARCTIC HYDROGRAPHY .............................................................. 22 2.3 MONDAY 2.40 PM – GLOBAL TEMPERATURE-SALINITY PROFILE PROGRAMME (GTSPP) ........................................................................ 23 2.4 MONDAY 3.30 PM – TASK TEAM: GDAC ..................................................................................................................................... 24
3 DAY 2: TUESDAY MORNING .......................................................................................................................................... 27
3.1 TUESDAY 9.00 AM – USE OF Α - CONVEX HULLS FOR QUALITY CONTROL OF T/S DATA SETS ....................................................................... 28 3.2 TUESDAY 9.20 AM – CUSTOMIZED GLOBAL XBT DATA-SET FOR QUALITY CONTROL PERFORMANCE TEST .................................................. 29 3.3 TUESDAY 9.40 AM – FROM SEADATANET TO SEADATACLOUD .......................................................................................................... 31 3.4 TUESDAY 10.00 AM – TASK TEAM: AUTOMATED QUALITY CONTROL .................................................................................................. 32 3.5 TUESDAY 11.00 AM – EXPERT QUALITY CONTROL TASK TEAM .......................................................................................................... 34 3.6 TUESDAY 11.30 AM – A NEW TASK TEAM? LINKING IQUOD TO OHC AND OCEAN FORECASTING SYSTEMS (PERFORMANCE METRICS) . 37 3.7 TUESDAY 12.00 PM – DISCUSSION QC + METRICS .......................................................................................................................... 40
4 DAY 2: TUESDAY AFTERNOON ....................................................................................................................................... 42
4.1 TUESDAY 2.00 PM – ENGAGING WITH SCOR & IODE..................................................................................................................... 43 4.2 TUESDAY 2.20 PM – BIASES OF FIVE LATENT HEAT FLUX PRODUCTS AND THEIR IMPACTS ON MIXED-LAYER TEMPERATURE ESTIMATES IN THE SOUTH
CHINA SEA 44 4.3 TUESDAY 2.40 PM – PLANNING FOR IMPACT .................................................................................................................................. 45 4.4 TUESDAY 3.30 PM – TRACKING SCOR WG148 TORS + OVERALL DISCUSSION..................................................................................... 46
5 DAY 2: WEDNESDAY MORNING ..................................................................................................................................... 47
5.1 WEDNESDAY 9.00 AM – TS DATA INTEGRATION AND MANAGEMENT IN NMDIS ................................................................................... 48 5.2 WEDNESDAY 9.20 AM – 11.00 AM: TASK TEAM LEADERS DISCUSSIONS .............................................................................................. 48 5.3 WEDNESDAY 11.00 AM – 12.00 PM: ARC LINKAGE FUNDING + WRAP UP ......................................................................................... 49
6 ACTION ITEMS/QUESTIONS/COMMENTS (INCLUDING ROLLOVERS) ................................................................................ 51
New grant offering will support research and scientific discovery with AI technologies to advance agriculture, biodiversity conservation, climate change and water ...................................................................................................................................... 64
7 LIST OF PARTICIPANTS .................................................................................................................................................. 68

5
1. Day 1: Monday morning
Monday Speakers
Chair + 2 Notetakers
Steve Diggs Marlos Goes/Rachel Killick
9.00 am Welcome, Logistics Peter Pissierssens, IODE staff
9.20 am IOC’s Data and Information Exchange programme: IODE
Peter Pissierssens (invited talk - 15 min + 5 min)
9.40 am IOC Capacity Development Strategy 2015-2021 and the Role of the OceanTeacher Global Academy (OTGA)
Claudia Delgado (invited talk - 15 min + 5 min)
10.00 am IQuOD overview Steve Diggs
10.30 - 11.00 am Coffee Break
Chair + 2 Notetakers
Gui Castelao Mauro Cirano/Janet Sprintall
11.00 am Task Team: I-metadata Matt Palmer (via Webex)
11.30 am Task Team: Uncertainty Bec Cowley (via webex)
12.00 pm Task Team: Format Marty Hidas
12.30 - 2.00 pm
Lunch Break

6
1.1 Monday 9.20 am – IOC’s Data and Information Exchange programme: IODE
IOC’s Data and Information Exchange programme: IODE
Presenter: Peter Pissierssens
Chair: Steve Diggs Notes: Rachel Killick and Marlos Goes
• IOC = Intergovernmental Oceanographic Commission – as a part of UNESCO – established in 1960.
• IODE = established in 1961 from UNESCO.
• Curiosity science -> (2014) -> data and information for society – now results and benefit orientated.
• 149 member states and the majority of those are developing countries.
• IODE mission statement in 1961. Objectives: to facilitate, promote and exchange; long term archival
management and services e.g. a lot of the data from the former Soviet Union needed/ needs to be
recovered; promote the use of international standards; promoting capacity of member states;
• Making up IODE: NODC = National Oceanographic Data Centres; Associate Data Units (not only one
data centre per country); also deal with information – this is often text e.g. journals and publications
– very important => network of marine librarians. Now individual libraries can join the IODE.
• 63 NODCs, 22 ADUs, 63 have neither, many of these are small island states.
• IODE = A network of networks: data management, marine information management, OBIS (an
existing network that was adopted); ICAN; other organizations e.g. IQuOD.
• IODE global activities: facilitation, coordination, inter-program activities, products.
• IODE management: IODE national coordinators; IODE committee (meets every two years); IODE
management group; secretariat.
• IODE and IOC interactions: IODE committee reports to IOC assembly (also meets every two years –
the IODE budget is submitted to the IOC assembly for approval).
• The projects are at the heart of IODE. Groups of experts; working groups; intersessional working
groups; joint bodies e.g. JCOMM, harmful algal blooms. Projects have to be finite, apart from
certain persistent datasets e.g. WOD!
• Policies and strategies: IOC Oceanographic Data Exchange Policy (2003) – no reason to not exchange
data – this is an ideal, but many things make this trickier. IOC Strategic Plan for Data and
Information Management (2017 – 2021); IOC Communication and Outreach Strategy (2017).
• Quality management is also very important: IODE project office quality policy, IODE quality
management framework; IODE project and activity and performance evaluation.
• Best practices and standards – very difficult to agree on these! There may be multiple best
practices, the thing that tends to make things a standard is stakeholders using them. 61 manuals
and guides related to ocean data and marine information management; 3 adopted standards, but
they will now be holding a best standards repository.
• How to? Become an ADU; Become an NODC; Accredit existing NODC; Designate IODE national
coordinators; Obtain CD assistance.
• Ocean Data, Ocean Knowledge: talking more about ocean knowledge now.
7
• ODIS = Ocean Data and Information Sources: Online browsable, searchable catalogue of existing
ocean related web-based sources/ systems of data and information; provide information on
products and visualisations; contribute to Agenda 2030 objectives and UN Decade on Ocean
Science.
• ODIS user groups: scientists – academic and private sector; governmental agencies, NGOs and
others.
• Having access to ocean data is one of the key developments of the decade.
• IODE capacity development: Training programme (OceanTeacher); visiting experts programme,
travel grants; regional networks programme (have done lots in Africa); IOC capacity development
strategy.
Questions/Comments:
• (Janet Sprintall) JS: What’s the main barrier to getting new member states? Often institutional weakness
– lots of priorities, often governments don’t see the benefit of ocean research => need to educate
decision makers that they need to monitor what’s going on.
• SD (Steve Diggs): Lots of initiatives for best practices, have there been efforts to align best practices?
Yes, working through AtlantOS and others to bring people in to one access to best practices. Challenge
is if you have 100 best practices for the same thing, how do you rank them!
• CD (Catia Domingues): Making data available – is it old or new data that is missing? Physical data is
almost real time so isn’t as much a problem, but biological data often requires more study so
researchers like to hold on to their information until they have written a paper so they embargo it, but
even after the embargo expires the data remains just with the scientist. Good to keep track of cruises as
then you can follow up data that you’re expecting (the NODCs do this).
• CD: Can we link with countries to get the old data? It’s tricky, especially as the NODC participation varies
– if it’s a civilian organization it will likely be the same person for a long time; if it’s a military
organization then the contact person changes regularly and they have to keep explaining IODE and its
importance. Military organizations also often don’t want to share their data. ADUs are done in civilian
organizations.
• Mauro: Can we just bypass the NODC? It’s tricky, but the ADUs can do it. If you’re part of the family
then it goes both ways, if you give data then you get access to data.
• CD: Relationship between IODE and China? China has a big and very active NODC and they play an
active role in West Bank, the Western Pacific – China is active trying to get data exchange going there as
at the moment there isn’t much. Japan is also very active in data management in the region.
Extra notes from Marlos Goes:
IOC/IODE introduction Started in 1961 – Marine research and information Objectives:
1- Facilitate and promote the exchange of data
2- Long term archival- IODE helped retrieve the URSS data after decay
8
DATA CENTERS - THE NODC – promote access and stewardship if national resource of oceanographic data. IODE created the associate data unit to help regional centers AIU – regional centers can join the IODE program. IODE structural elements: NODCs: 63 ADUs – 22 Several IOD projects under the IODE umbrella. IODE is becoming more like a service program Management: IODE committee decides every two years the goals IODE and IOC member States: IODE defines goals and sends to IOC for approval Projects are defined and they are finite, except for a few like the WOD. Policies: no restriction of data exchange. Reality is different, because scientists may want to keep the data restrict for some time (publication, etc.) Defined in 2003. Meet same standard of quality for all data centers. Evaluation of the products. Agreement of standards is the Holy Grail. Communities have different best practices. There is now a repository for best practices. There are manuals and guidance for data management plans, which the projects should fit in. Training is provided for countries that want to start an NODC. Ocean data and information source was advised by members to provide information on products, web-based searches, contribute to sustained development. ODIS user groups: scientists, governments, non-government organizations, industry.
IODE Capacity building:
Training, visiting experts program. Travel grants.
Janet: What is a barrier to get new members?
Ans: institutional barriers– governments are not aware of the importance of data management and coastal
management. No long term vision of decision makers. Countries with marine resources need to understand
the importance of data management and capacity building.
Steve Diggs- What are the adoptable best practices for ocean?
They are working together with Jay Pearlman (http://sites.ieee.org/oceanrcn/about/jay-pearlman/), and
they are creating linkages among centers to define best practices. Build inventory of best practices before
ranking them.
Catia: What data are you intended to make available?
Scientists want generally to keep data during some embargo period. Scientists are not good at sharing after
embargo. NODCs give reports of cruises and expeditions which can be used as an inventory of the data.
World ocean database and NODCs do quality control. Sea level: PMSL is the global data archive, but real
time are in the national centers.
Navy and militaries do not want to share data when they control the NODCs. Civilians are less restrict about
data.
Mauro: Could the data be delivered before going to an NODC?
And ADU can be created to store and deliver the data, and be the link between the NODC and IOD. They can
be set up by a university and institution.
Catia: How China relates to this?
China has a big data center.
9
1.2 Monday 9.40 am – IOC Capacity Development Strategy 2015-2021 and the
Role of the Ocean Teacher Global Academy (OTGA)
IOC Capacity Development Strategy 2015-2021 and the Role of the OceanTeacher Global Academy (OTGA) Presenter: Claudia Delgado
Chair: Steve Diggs Notes: Rachel Killick and Marlos Goes
• IOC capacity development strategy 2015 -2021.
• Ocean governance at the international level: OceanTeacher belongs to IODE which is in IOC which is in
UNESCO.
• IOC’s vision: strong scientific understanding and systematic observation of the changing world climate
and ocean ecosystems shall underpin global governance for a healthy ocean, and global, regional and
national management of risks and opportunities from the ocean
• http://sites.ieee.org/oceanrcn/about/jay-pearlman/ … - this is what defines pretty much everything
that is done.
• 4 high level objectives: healthy ocean ecosystems, early warning for ocean hazards, resiliency to climate
change and variability, enhanced knowledge of emerging issues.
• IOC from vision to execution: build knowledge, apply knowledge. At the core is capacity development –
member states need to be able to manage their ocean information.
• IASS, 2016: Addressing capacity development – different levels e.g. knowledge and infrastructure =>
take into account different aspects. Who are you addressing regarding capacity development:
Individuals (you may train one so they can make a difference), organizational, societal. Capacity
development is not an exact science – sometimes trial and error and learning in the process.
• IOC has drafted and its member states approved in 2015 the IOC Capacity Development Strategy. 6
main outputs: 1. Human resources developed; 2. Access to physical infrastructure established or
improved; 3. Global, regional, sub-regional mechanisms strengthened; 4. Development of ocean
research policies; 5. Visibility awareness increased; 6. Sustained (long-term) resource mobilisation
reinforced. Share knowledge – keep teaching – gender balance.
• Activities are implemented by actions e.g. Continuous Professional Development – www.ioc-cd.org –
can get a copy of the strategy here and can find out how it has been implemented and who has been
attending, can also see IOC capacity development fund and resources available.
• IOC aren’t doing this all alone – many other agencies in the picture e.g. IAEA, pogo, IMO, SCOR
• Historical background: The core activity of IODE has always been capacity development – now have over
three decades of experience in this. Started with a strong focus on Africa (ODIN Africa) providing
computers and other equipment. Now that IODE has settled in Ostend it’s possible to have a more
sustained teaching program(~2005). In 2014 OceanTeacher global academy was established – provides
a programme of training courses related to IOC programmes, contributing to the sustainable
management of oceans and coastal areas worldwide, and relevant member states in the region. Now
multiple training centres, not just in Ostend.

10
• Aim: At least one regional training centre in each region/ for each language group; partner with existing
groups, don’t start from scratch. Courses should be shared across the regional training centres, mainly
using video conferencing – this also allows experts to contribute without being there. Use of common
OceanTeacher e-learning platform. Think about time zones when working out who can share training
sources.
• Facts and figures: Over 2500 trained face to face, 130 courses around the world (120 countries), train in
English, Spanish, French and Portuguese. Over 4200 people registered at the moment.
• OceanTeacher was mentioned at the United Nations General Assembly in December 2014.
• OceanTeacher e-learning platform: uses moodle – designed to support training courses and resources;
because it’s online wherever people are they can get access to it. Different categories of the training
resources: IODE, coastal marine management and planning, harmful algal bloom, tsunami, marine
scientific research.
• Example screenshots of e-learning platform – not just a list of powerpoints, but tools and links to other
resources as well e.g. assessment tools: assignments, quizzes – results can be provided in real-time/
remotely. Can customise the training courses e.g. language and brand.
• Online application form for OceanTeacher now – much more manageable! Can also issue online
certificates as well.
• Training the 21st century generation using 19th century tools? Are we still using the same tools? Is this
what we want? Qingdao Declaration (2015): promoting the use of ICT to achieve education targets.
• Also mustn’t forget the Agenda 2030 (sustainable development goal 14: Life Below Water) – through
OceanTeacher can also address: 4, 5, 9 and 13.
www.oceanteacher.org Questions/Comments:
• Charles: Just online training? At the moment people still get physical certificates – but if it all goes
online, so will the certificates. One year to collect ideas and suggestions and a new project proposal for
funding will be suggested next year. Face to face training courses will still be there as well so we need to
keep building on this as well.
• Charles: What is the value of the certificate when IODE aren’t a university? Some training centres are
academic institutions, also trying to involve universities. Need to balance theoretical and hands on
work.
• CD: A new project proposal for capacity development – would IQuOD be able to fill a gap in this? Quite
possibly – Claudia will be listening to our meeting. Consult with the member states as to what training
will be useful – whatever is most requested is what they try to address. Ask for suggestions of burning
issues in the future that need to be addressed. Currently a small group of trainers – therefore hoping for
more, maybe from the IQuOD community.
• Mauro Cirano (MC): Which students are the courses aimed at? Most people attending already have a
BSc in something Ocean Science related, but also higher level training e.g. postdocs, but main audience
is BSc students who are working in oceanographic data centres or similar. 30 hours of training.
• BM (Bill Mills): How do you match students to the right level of course? Provide requirements list, the
students self-report their own skills and if they’re asking for financial support they also need an
endorsement letter.
11
Extra notes from Marlos Goes:
Ocean teacher is a program from the IODE, under IOC and UNESCO. IOC Vision: Strong scientific understanding of science and ecosystems for a healthy governance. High level objectives: Resilience of ecosystems (3 more). Build scientific knowledge, applying knowledge to societal benefits, and improving governance. Individual training for helping organizations and society. Capacity development Strategy: defined in 2012: All members may have the capacity to meet the goals. Human resources focus on academic higher education, and training. Continuous professional development, promote training courses, workshops, etc. www.ioc-cd.org Capacity development is done by many agencies. OceanTeacher: Developed in 2014 new ocean teacher academy. Developed a network of training centers. 3 regional training centers in Africa. Training centers should represent region, and not built from scratch, but enhance local capacity. Cost shared across regional training centers, video conferencing and common u-learn platform. Facts and Figures: over 2500 people trained in 120 countries and 4 languages. Over 4000 people registered as users for training resources. United Nations acknowledge the efforts from OceanTeacher. E-learning: Support face-to-face learning. Everything is uploaded on the platform. Persons can replicate course in their institutions. Categories: IODE, marine data, management, planning. Harmful algae bloom. Marine scientific research. Assignment, questionnaires, quizzes are available. Online application form is done online. Certificates are issued. Agenda 2030 sustainable development goals Agenda 2030. Charles Sun: Certificates: Online certificates. Are the courses given online? The online trainings will in the future be all online. More complete online course strategy. People can take it all online. Ans: there is one year target to finish the course. Online learning will be very important. Training sites will still be there in regional training centers. Peter: Charles talked about the value of a certificate. This is not an academic institution. Some of the training centers are academic institutions, such as institutions. Data management is hands on exercises.
12
Catia: New project proposal for capacity building. Will there be a gap that IQuOD to fill up the gap. They ask for suggestions for training topics, which are addressed by ranking. Mauro: What level of students are the focus? Ans: students generally have a bachelor degree in OS and work in management institutions. They are the main focus. 30hrs of training.
1.3 Monday 10.00 am – IQuOD overview
IQuOD overview (Steve Diggs) Presenter: Steve Diggs
Chair: Steve Diggs Notes: Rachel Killick and Marlos Goes
• Windmills and time machines – tilting at windmills.
• We put our data out there – they’re exposed to the public. We know the instruments back in time
don’t have the accuracy we would like.
• Time machines: Shoichi’s presentation a few years ago – data from the Japanese Navy from the
Second World War – Shoichi sought to find the original hydrographers to get the metadata, but by
the time he’s reaching these people it’s often too late – the metadata is crumbling away as people
grow old and die.
• World Ocean Database by year: late 1960s to the early 1980s was the XBT period of dominance
and there are still XBTs about in high density transect; MBTs are used a lot less now. WOD is
made up of a bunch of components and not all are climate quality – so we have IQuOD!
• IQuOD in a nutshell: GDAC, uncertainty, AutoQC, Formats, Intelligent Metadata, Duplicates/
Machine Learning/ Expert QC.
• IQuOD is globally diverse – wide adoption => also of interest to IODE. 17 member nations, close
collaboration, frequent online meetings. Big support comes from CLIVAR, IOC, IODE, SCOR.
• Going from something messy to something trustworthy. WOD – through manual and AutoQC.
• “iMeta” Algorithm (v0.1) – building a decision tree to assign a platform type in the metadata –
working out which type of probe something is.
• Duplicate checking – reveals data which can skew statistics. Climatology is off if you don’t remove
duplicates.
• The AutoQC processor: finding the set of most effective automatic QC tests: Test dataset -> wodpy
– about 50 QC tests previously developed -> Build database – work out which tests complement
each other.
• Wodpy – takes ASCII data and puts it into a numpy array or a pandas dataframe.

13
• Expert QC – machine learning for Expert QC – ask for help from the experts on the profiles that
confuse the machine learning. Optimise time from the experts so that they’re only seeing the ones
that actually need expert opinion.
• IQuOD version 0.1 is now out (as of 12th April). Included first -cut uncertainties– also XBT bias
corrections from Cheng et al., 2014.
• IQuOD – a flagship program that others can learn from.
• What’s really important is the data – if we can improve the data this will continue to have impact.
Questions/Comments:
• Claudia: Why is the map (slide 15) not covering very much of Africa? Struggle with continued
interest.
• Gustavo Goni (GG): Optimal QC – real time and delayed mode – visual and automatic QC done –
discussion between Auto QC and the operators who do the QC. Are we going to use the knowledge
of those who already do a lot of QC? Yes, that’s definitely a goal – and the code is on GitHub so
people can play around with it – hopefully we’ll be able to define a set of QC tests that we
recommend people to use e.g. at the Met Office.
14
Extra notes from Marlos Goes:
• Developers gave misinformation on the thermosteric changes in the ocean.
• Profiles in the Sea of Japan taken during the WWII. There was no good metadata. Went after the
metadata from people who made the measurements. People were deceased when he looked for
the metadata.
• MBTs
• Not all data are climate quality.
• IQuOD has 6 to 7 main task teams:
• GDAC - hold the data,
• Uncertainty -
• Auto QC –
• Formats –
• Intelligent metadata
• Duplicates/ machine learning/ Expert QC -
• 5-7 continents – Demographics is very international . Big support from CLIVAR, IODE, SCOR.
• Expert QC, Auto QC applied.
• Start to check how deep the profile is. Reassign platform type in the metadata. Back out the type of
data it is.
• Duplicate check – identical profiles removed (or flagged along with near-duplicate profiles).
• Bill Mills – Different codes used to do wire stretching etc. Now it is in python. 50 QC tests.
Implementation and papers on them. Decide optimal decision in the profiles.
• Expert QC – Gui. Web interface . Evaluate good and bad data . Leave to the experts the data that are
questionable. Leve the minimum to the experts.
• Boyer. Depth correction may deal with the negative depths.
• Summary: This is only for temperature. IQuOD deals with intelligent metadata, code unification,
other programs can learn on.
• Claudia: Why is South Africa the only country in Africa?
• Senegal showed some interest. Room for discussion how to include Africa.
• Gustavo: AutoQC can be done with historical and real time data. Deploy XBTs (8000 in real time).
Auto QC and visual QC to the GTS, used to forecast. What the operators are doing to include data in
the GTS.
• Ans: 3 month after correction they will be in IOD.
• Knowledge from IQuOD can be used to enhance procedures in their systems in real time.
• Boyer: this is ideal
• British: Met Office. QC and real time want to use AutoQC to real time data.
• Gustavo: This is a step to improve real time QC. Janet: Best practices have to be wide spread.
• Steve: IQuOD created adoptable best practices.
15
1.4 Monday 11.00 am – Intelligent Meta-Data Task Team: Plans and Progress
Intelligent Meta-Data Task Team: Plans and Progress Presenter: Matt Palmer, via webex
Chair: Gui Castelao Notes: Janet Sprintall and Mauro Cirano Updates on v0.1
• Main achievement is assignment of Intelligent Metadata for unknown XBT profiles
• Plans: ongoing efforts exploring Machine Learning approaches
• Publication of paper
• Input from other Task Team member on a wider perspective
• Approx. 50 % historical XBT profiles missing probe type and/or manufacturer
• Only assigns probes to either TSK and/or Sippican since they represent majority of manufacturers.
Outline of IQuOD imeta algorithm (deterministic system, .i.e. a best -guess approach):
• Revision of max depth different from previous works
• Profiles then sorted according to date depending on historical record, which are based on depth
histograms. Histograms have some interesting skewness that might be due to bathymetric effects or
mislabelled probes
• Date criteria based on most numerous known profiles for given depth range or date of probe
availability
• Overall the algorithm has an average success of 77% for correctly identifying both problems type
and manufacturer – modest improvement is achieved by only using probe type
o What would it take to improve this rate? Does that mean the Expert QC will have to handle
the remaining 23%?
Ultimately want a more probabilistic framework i.e. on availability date of each probe = “earliest to market” dates from Cowley et al (2013). Intermediate step is exploring machine learning approaches – using neural network approaches
o Achieve substantial improvements over imeta algorithm - >6-% in some years
o More in-depth work needed on training and validation
o But there is a potential for over confidence in classification of unknown probes.
o Needs more in-depth work on training and validation datasets – needs more input and
feedback from community
o These machine learning approaches seem to yield a better accuracy (80%) compared to
imeta
o Even better accuracy can be achieved using ensemble methods
16
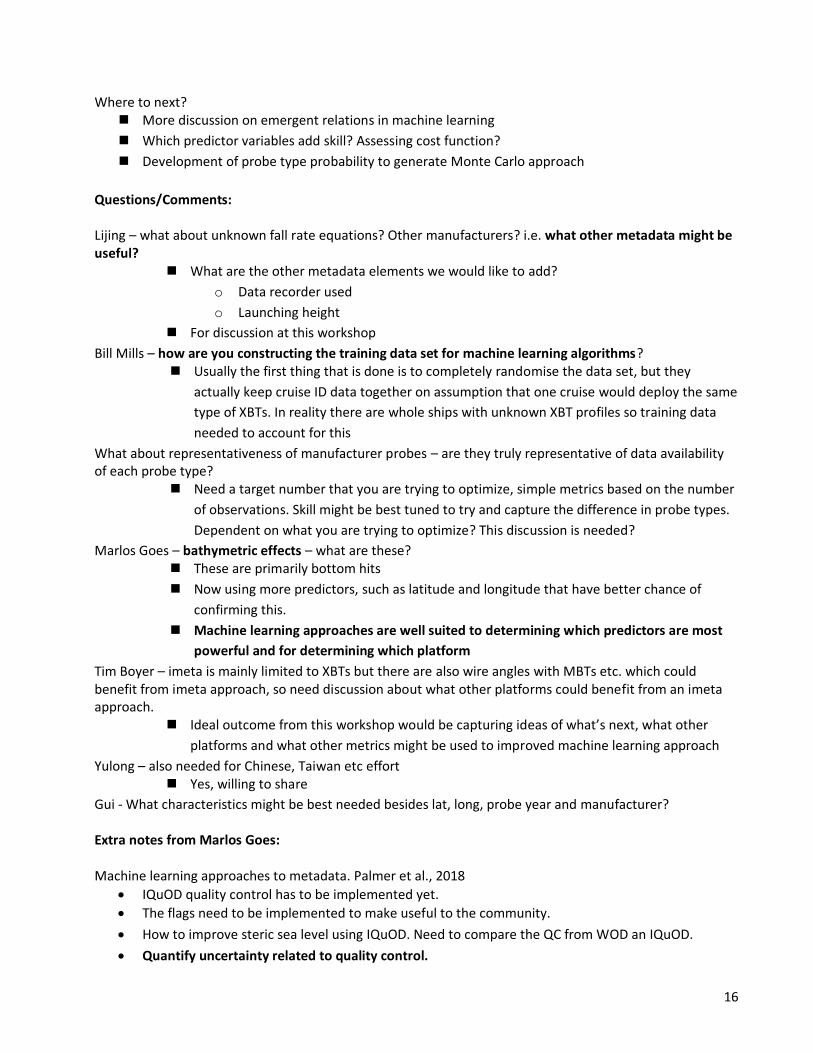
Where to next?
◼ More discussion on emergent relations in machine learning
◼ Which predictor variables add skill? Assessing cost function?
◼ Development of probe type probability to generate Monte Carlo approach
Questions/Comments: Lijing – what about unknown fall rate equations? Other manufacturers? i.e. what other metadata might be useful?
◼ What are the other metadata elements we would like to add?
o Data recorder used
o Launching height
◼ For discussion at this workshop
Bill Mills – how are you constructing the training data set for machine learning algorithms? ◼ Usually the first thing that is done is to completely randomise the data set, but they
actually keep cruise ID data together on assumption that one cruise would deploy the same
type of XBTs. In reality there are whole ships with unknown XBT profiles so training data
needed to account for this
What about representativeness of manufacturer probes – are they truly representative of data availability of each probe type?
◼ Need a target number that you are trying to optimize, simple metrics based on the number
of observations. Skill might be best tuned to try and capture the difference in probe types.
Dependent on what you are trying to optimize? This discussion is needed?
Marlos Goes – bathymetric effects – what are these? ◼ These are primarily bottom hits
◼ Now using more predictors, such as latitude and longitude that have better chance of
confirming this.
◼ Machine learning approaches are well suited to determining which predictors are most
powerful and for determining which platform
Tim Boyer – imeta is mainly limited to XBTs but there are also wire angles with MBTs etc. which could benefit from imeta approach, so need discussion about what other platforms could benefit from an imeta approach.
◼ Ideal outcome from this workshop would be capturing ideas of what’s next, what other
platforms and what other metrics might be used to improved machine learning approach
Yulong – also needed for Chinese, Taiwan etc effort ◼ Yes, willing to share
Gui - What characteristics might be best needed besides lat, long, probe year and manufacturer? Extra notes from Marlos Goes: Machine learning approaches to metadata. Palmer et al., 2018
• IQuOD quality control has to be implemented yet.
• The flags need to be implemented to make useful to the community.
• How to improve steric sea level using IQuOD. Need to compare the QC from WOD an IQuOD.
• Quantify uncertainty related to quality control.
17
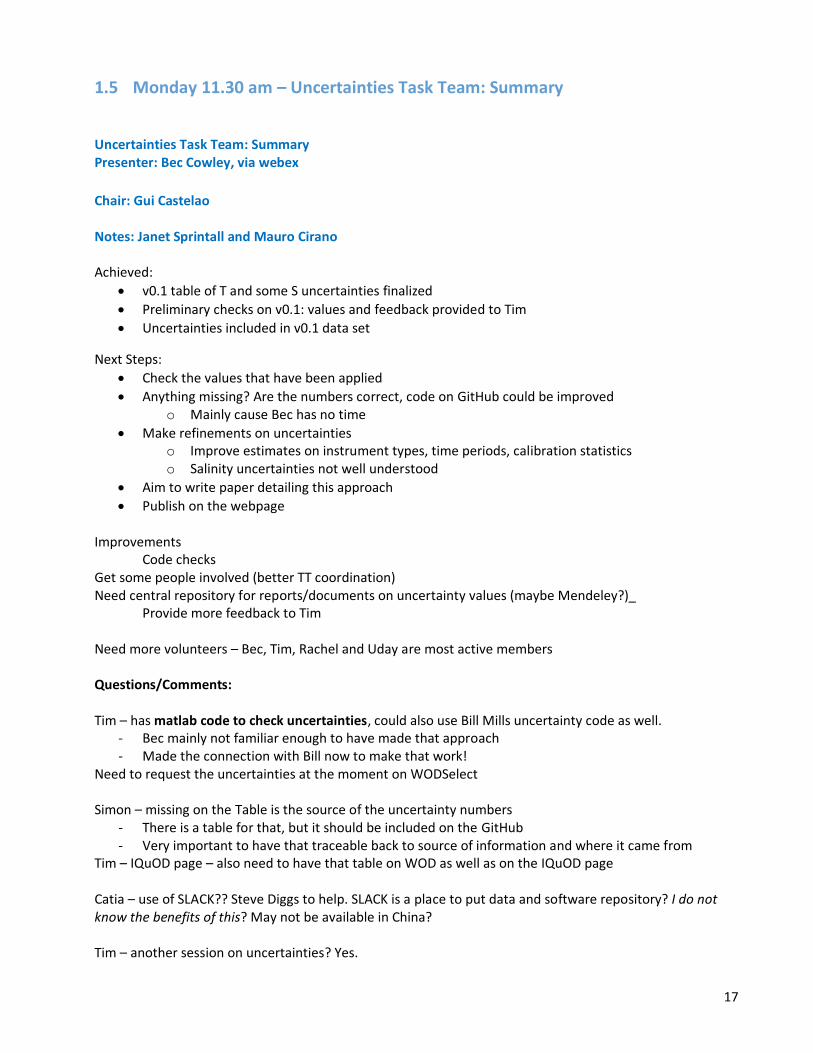
1.5 Monday 11.30 am – Uncertainties Task Team: Summary
Uncertainties Task Team: Summary Presenter: Bec Cowley, via webex
Chair: Gui Castelao Notes: Janet Sprintall and Mauro Cirano Achieved:
• v0.1 table of T and some S uncertainties finalized
• Preliminary checks on v0.1: values and feedback provided to Tim
• Uncertainties included in v0.1 data set
Next Steps:
• Check the values that have been applied
• Anything missing? Are the numbers correct, code on GitHub could be improved o Mainly cause Bec has no time
• Make refinements on uncertainties o Improve estimates on instrument types, time periods, calibration statistics o Salinity uncertainties not well understood
• Aim to write paper detailing this approach
• Publish on the webpage
Improvements Code checks Get some people involved (better TT coordination) Need central repository for reports/documents on uncertainty values (maybe Mendeley?)_ Provide more feedback to Tim Need more volunteers – Bec, Tim, Rachel and Uday are most active members Questions/Comments: Tim – has matlab code to check uncertainties, could also use Bill Mills uncertainty code as well.
- Bec mainly not familiar enough to have made that approach - Made the connection with Bill now to make that work!
Need to request the uncertainties at the moment on WODSelect Simon – missing on the Table is the source of the uncertainty numbers
- There is a table for that, but it should be included on the GitHub - Very important to have that traceable back to source of information and where it came from
Tim – IQuOD page – also need to have that table on WOD as well as on the IQuOD page Catia – use of SLACK?? Steve Diggs to help. SLACK is a place to put data and software repository? I do not know the benefits of this? May not be available in China? Tim – another session on uncertainties? Yes.
18
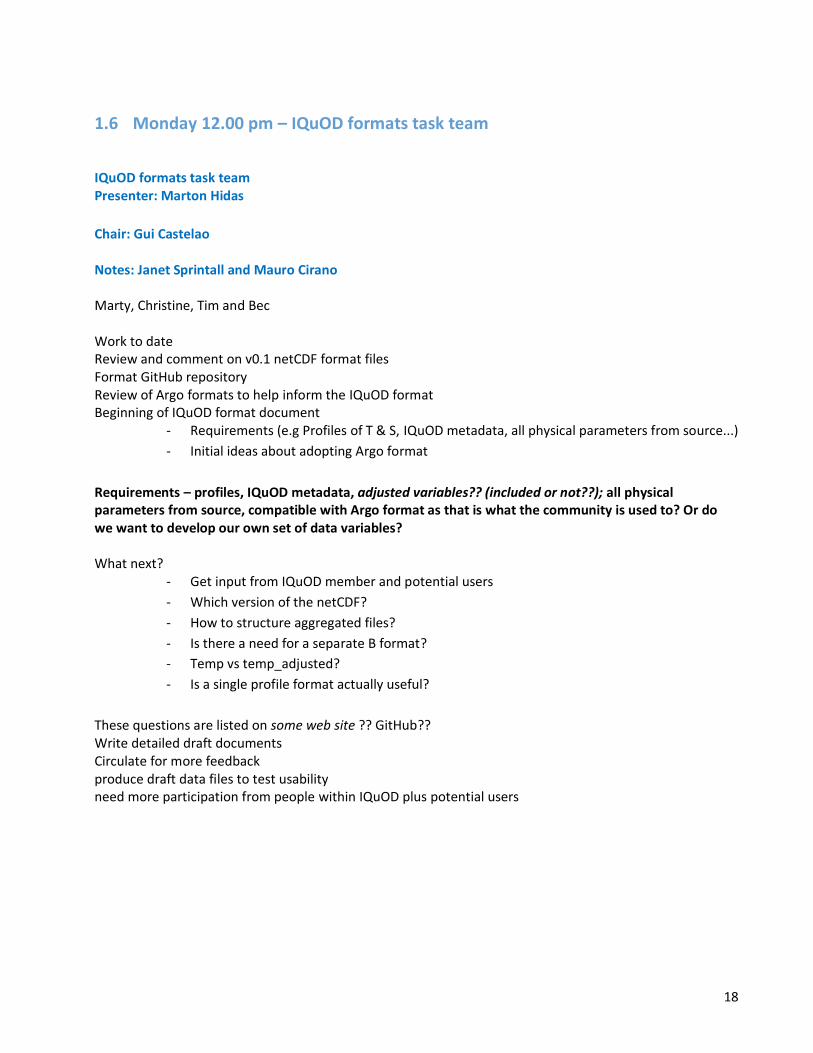
1.6 Monday 12.00 pm – IQuOD formats task team
IQuOD formats task team Presenter: Marton Hidas
Chair: Gui Castelao Notes: Janet Sprintall and Mauro Cirano Marty, Christine, Tim and Bec Work to date Review and comment on v0.1 netCDF format files Format GitHub repository Review of Argo formats to help inform the IQuOD format Beginning of IQuOD format document
- Requirements (e.g Profiles of T & S, IQuOD metadata, all physical parameters from source...)
- Initial ideas about adopting Argo format
Requirements – profiles, IQuOD metadata, adjusted variables?? (included or not??); all physical parameters from source, compatible with Argo format as that is what the community is used to? Or do we want to develop our own set of data variables? What next?
- Get input from IQuOD member and potential users
- Which version of the netCDF?
- How to structure aggregated files?
- Is there a need for a separate B format?
- Temp vs temp_adjusted?
- Is a single profile format actually useful?
These questions are listed on some web site ?? GitHub?? Write detailed draft documents Circulate for more feedback produce draft data files to test usability need more participation from people within IQuOD plus potential users

19
Questions/Comments: Bill – any decisions on what format? Yes, using netCDF Charles – big user is URDAP, but netCDF is not human readable, only machine readable, IODE has a template for data design Tim – even if CDF or NETCDF file compliant still readable. More relevant to have separate B files for bio.
- Probably best to provide a driver to read in the files
Gui – include a format checker. Suggests keeping information on GitHub so as to have integrity Catia – best to have conformity with Argo user community Too big of a challenge to get Argo and ocean community to change to new format Simon – from users point of view, most Argo users would not use the majority of metadata but probably best to start with what most Argo users find most useful Tim – most important to have it CF compliance names. There are other ways that we can make it known to user that the changes have been made. Tim does not think that we need to carry through the original values? But Charles and Catia think it is necessary to carry this information through (who? What? When? Are basic tenets of data management). Tim says that keeping the original data sets causes a huge data base that is detrimental to reading the data. IQuOD data have a WOD identifier so it is possible for the reader to look at the data sets. He would prefer if the reader went back to WOD data set rather than provide the whole data sets. Marty said that subsequent IQuOD versions should not keep storing the “old” versions of IQuOD profiles but rather should produce a “new” dataset. Steve Diggs - GTSPP has the historical data set available but GLODAP also produces the improved data sets. Make sure there are suitable identifiers so that there is traceability. Simon - Useful to have documentation about what has changed – need details about changes from version to version.

20
2 Day 1: Monday afternoon
Monday Speakers
Chair + 2 Notetakers
Lijing Cheng Simon Good/Sergio Larios
2.00 pm Long term and real time observations of the Ocean Mega Science Center (PPT not available)
Prof Fan Wang, Chinese Academy of Sciences (invited talk -15 min + 5 min)
2.20 pm UDASH - Unified Database for Arctic and Subarctic Hydrography
Tim Boyer, on behalf of Axel Behrendt (invited talk -15 min + 5 min)
2.40 pm Global Temperature−Salinity Profile Programme (GTSPP)
Dr Charles Sun (invited talk -15 min + 5 min)
3.00 - 3.30 pm Coffee Break
Chair + 2 Notetakers
Gustavo Goni Francis Bringas/Uday Bhaskar
3.30 pm Task Team: GDAC Tim Boyer
4.00 pm GDAC discussion Tim Boyer
4.30 pm Overall discussion All
5.00 pm Close

21
2.1 Monday 2.00 pm – Long term and real time observations network of the
Ocean Mega Science Center
Long term and real time observation network in the WTPO of the center for ocean mega-science (COMS), Chinese Academy of Sciences Presenter: Prof Fan Wang
Chair: Lijing Cheng Notes: Simon Good and Sergio Larios The Western Pacific Warm pool is an important region for influencing climate modes such as ENSO, yet there are few observations in the area. Continuous, systematic and comprehensive subsurface observations are needed. Since 2013, a long term observing system was established. It includes four stations and three arrays. Sensors were deployed in places of oceanographic interest. Many (450) CTD measurements were also made, as well as other observations including from ADCP. Last year the network went from 1 to 10 real time moorings and increased depth from 1000 to 3000 m. Research findings from the data include the variation of currents and the exchange of intermediate waters. The CASSON network set up is a promising component for GOOS and GCOS. Questions/Comments: Q. How near to real time are the data available? A. Currently only used for scientific research. Q. Are there any contributions to OceanSITES? A. Not yet. Q. Can there be collaboration with NCEI to get the data into their database? A. Welcome a discussion about that. Q. How big are the impacts caused by the variability in the region? A. Important for global climate and China. E.g. can influence monsoons and tracks of typhoons (which influences rainfall etc.) Extra notes from Janet Sprintall: Observational networks of COMS/CAS New organization of CAS reformation CASSON – CAS Scientific Observing Network Construction of a deep observing network e.g. along Most mooring deployments are 3-4 years including WPAC along 130E, along 142N from PNG to 0N (Aug 2014 – Nov 2017) And ITF 30 deep sea subsurface moorings and 121 subsurface moorings Have real time observations available now at hourly timescales through iridium Real time CASSON will be a promising component of both GOOS and GCOS – to be part of the international effort No plans as yet to make the data available as part of OceanSites but in the future.

22
2.2 Monday 2.20 pm – UDASH – unified database for Arctic and Subarctic
hydrography
UDASH – unified database for Arctic and Subarctic hydrography Presenter: Tim Boyer, on behalf of Axel Behrendt
Chair: Lijing Cheng Notes: Simon Good and Sergio Larios The Arctic is changing relatively rapidly so we need data in the region. The WOD is the largest supplier but has missing data (~15,000) and there are problems with the data. In this project, all publicly available data were obtained and comprehensive QC performed. 288,532 profiles were obtained (1980-2015) – within PANGEA repository and published in ESSD Journal. The QC is shown to reduce the variability between profiles compared to not QCed profiles and the WOD QC. Version 1.0 of UDASH has been published. Questions/Comments: Q. What does rename some cruises mean? A. Unknown – need to follow up with Axel. Q. How can we get Axel involved? A. He is now aware of IQuOD efforts but could not attend this meeting. Q. How can we be sure that the QC is doing the right thing and is not QCing out too many profiles? A. Need to get second opinions. Q. Does removing data impact on bringing in new data as the distribution of the data will be influenced? A. Agree that need to be careful about that since profiles may be recorded in extreme locations that do not follow the general statistical distribution. Q. Did the WOD improve based on this work? A. WOD has added some of the data sources used in UDASH. Some of the extra data are already in WOD but have flipped latitudes in the original source. Q. Can we use ancillary information such as river outflow volumes to help with Expert QC? A. Yes, it is possible. One option is to increase allowed standard deviations in those regions but there could be not enough data to make robust statistics. Moreover, we need to be careful as statistics can change over time.
23
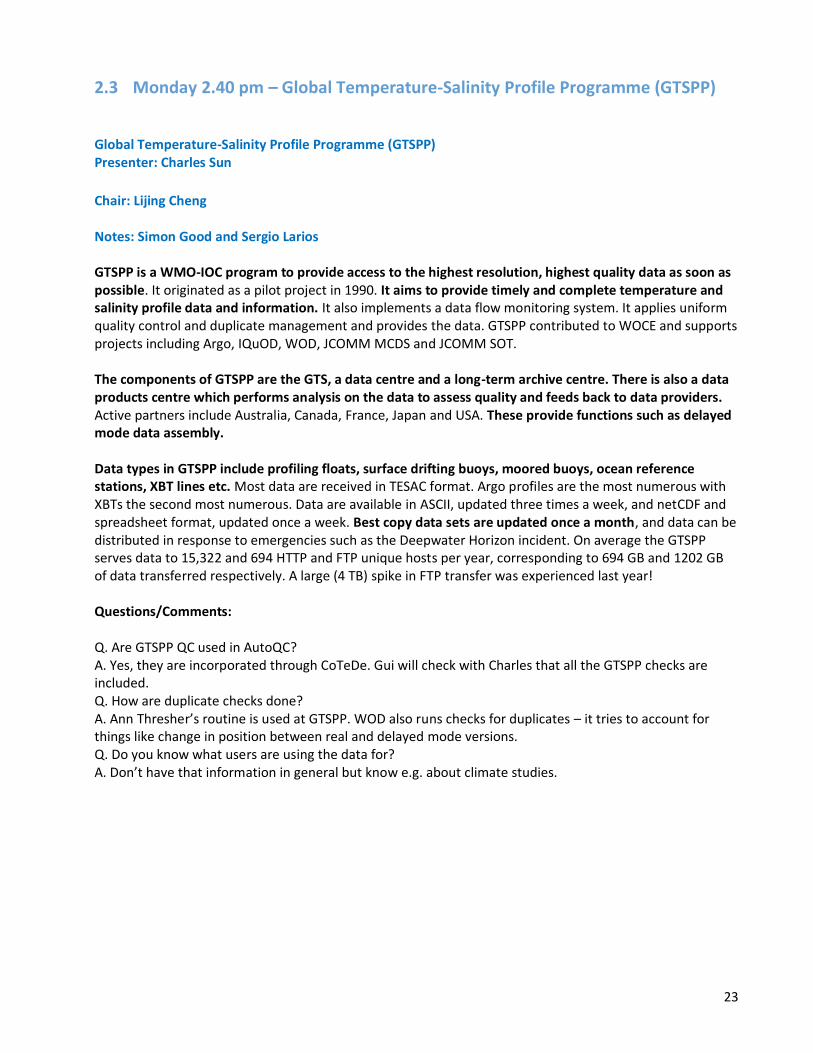
2.3 Monday 2.40 pm – Global Temperature-Salinity Profile Programme (GTSPP)
Global Temperature-Salinity Profile Programme (GTSPP) Presenter: Charles Sun
Chair: Lijing Cheng Notes: Simon Good and Sergio Larios GTSPP is a WMO-IOC program to provide access to the highest resolution, highest quality data as soon as possible. It originated as a pilot project in 1990. It aims to provide timely and complete temperature and salinity profile data and information. It also implements a data flow monitoring system. It applies uniform quality control and duplicate management and provides the data. GTSPP contributed to WOCE and supports projects including Argo, IQuOD, WOD, JCOMM MCDS and JCOMM SOT. The components of GTSPP are the GTS, a data centre and a long-term archive centre. There is also a data products centre which performs analysis on the data to assess quality and feeds back to data providers. Active partners include Australia, Canada, France, Japan and USA. These provide functions such as delayed mode data assembly. Data types in GTSPP include profiling floats, surface drifting buoys, moored buoys, ocean reference stations, XBT lines etc. Most data are received in TESAC format. Argo profiles are the most numerous with XBTs the second most numerous. Data are available in ASCII, updated three times a week, and netCDF and spreadsheet format, updated once a week. Best copy data sets are updated once a month, and data can be distributed in response to emergencies such as the Deepwater Horizon incident. On average the GTSPP serves data to 15,322 and 694 HTTP and FTP unique hosts per year, corresponding to 694 GB and 1202 GB of data transferred respectively. A large (4 TB) spike in FTP transfer was experienced last year! Questions/Comments: Q. Are GTSPP QC used in AutoQC? A. Yes, they are incorporated through CoTeDe. Gui will check with Charles that all the GTSPP checks are included. Q. How are duplicate checks done? A. Ann Thresher’s routine is used at GTSPP. WOD also runs checks for duplicates – it tries to account for things like change in position between real and delayed mode versions. Q. Do you know what users are using the data for? A. Don’t have that information in general but know e.g. about climate studies.

24
2.4 Monday 3.30 pm – Task Team: GDAC
Task Team: GDAC Presenter: Tim Boyer
Chair: Gustavo Goni Notes: Rachel Killick, Francis Bringas and Uday Bhaskar
IQuOD – maximise the quality, consistency and completeness of the long-term global subsurface record. The big news is that IQuOD version 0.1 is now available and it’s also on the THREDDs server – netCDF, CF compliant, ragged array format. Every three months this will be updated (like WOD is updated every three months with data from GTSPP, ICES etc.) – it will keep the same DOI when it gets updated, but it will get a new version number. Uncertainty assignment – depends on various factors – it’s on every measurement of temp, depth and pressure and some salinities. Depends on various factors: recording devices, sensors, fabrication year etc. Version 0.1 also includes the iMeta algorithm – so there aren’t unknown types, there are assigned types and its shown that this is assigned by intelligent metadata. Duplicates check – lots of thorough checking e.g searching in places we hadn’t searched for before – 1955 recorded instead of 1985, but the next step is to work out which is the correct one and which is the incorrect one! Why do duplicates arise? Different data sources – data can go wrong at any point. Working out which is the right one and which is the wrong one hasn’t been done yet – feel free to volunteer to do that! Not part of IQuOD v0.1: Coriolis anomaly flags – dropped because of lack of communication. How does IQuOD differ from WOD? In the ASCII file, first bit is a Q not a B (legacy means it’s a B); WOD has a choice for XBT bias corrections, for IQuOD Cheng et al., 2014 are the default, but you can choose others; intelligent metadata; uncertainties for depth, pressure, temp and position (but the position uncertainties are all empty so we need to do something about this). The AutoQC process – wodpy – IQuOD github. For IQuOD you can only get observed level data, not standard levels. Give the data to regional expert centres for manual QC – the information will be sent back to NCEI and then the data will be archived. Expect to get data from other places, not just the expert centres.

25
Questions and Comments + Overall discussion: CD: Once we have the AutoQC do we still need the Coriolis flags? It would be nice to at least have the Coriolis checks in the AutoQC, which they’re not currently. GG: How do you cope with years of XBT data that don’t have a year in the Cheng et al., 2014 scheme? Just use the last available year. CD: How do you get uncorrected data? Just specify no corrections when you go to WODselect. GG: XBTs are likely to continue to change – will we keep just using Cheng et al., 2014 or will we use a different scheme as better ones become available? CD: Will take what the XBT science team recommend. FR (Franco Reseghetti): Want something time variable and temperature variable. LC: At each meeting we should review the XBT correction options and check which one we want to be recommending, whether it’s Cheng et al., 2014 still or whether things have moved on. SG: Remember that there is uncertainty in the XBT correction method – none of them are perfect. GG: Are the uncertainties in IQuOD the same regardless of XBT correction? TB: Yes – uncertainties and bias corrections are separate. TB: There are more MBTs than XBTs in the historical database, but we don’t do as much to try and correct them. E.g. the correction should be different in the Pacific and the Atlantic.
26
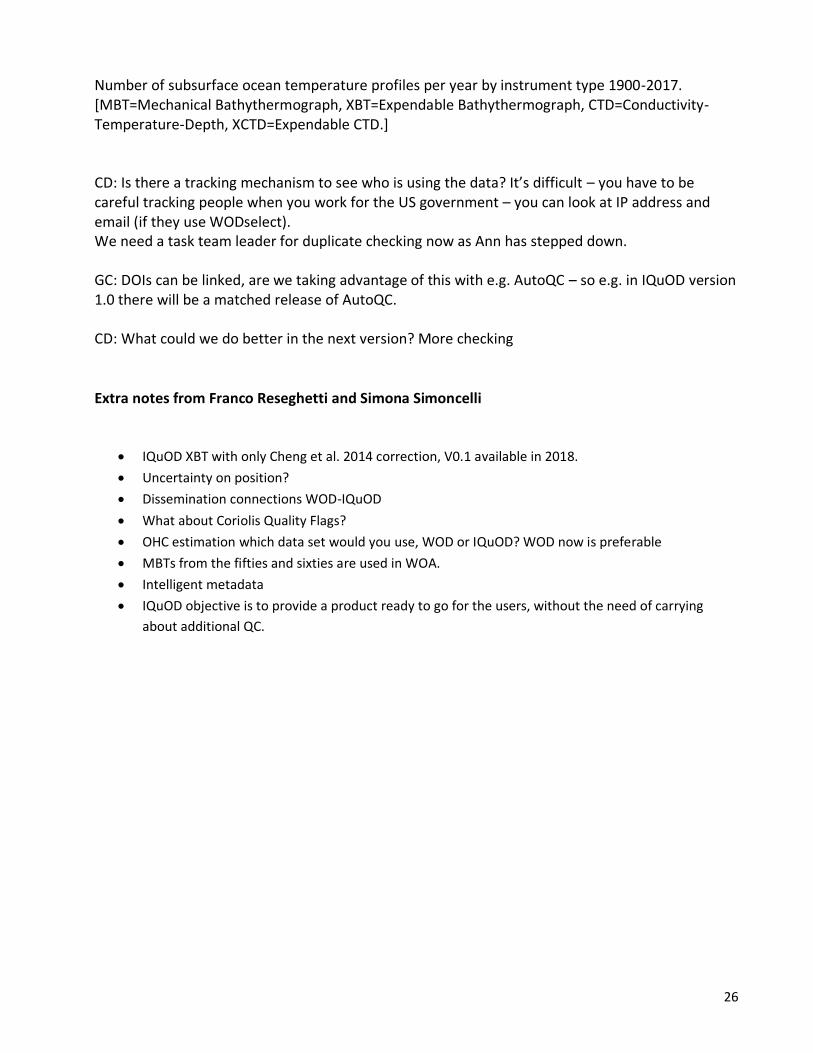
Number of subsurface ocean temperature profiles per year by instrument type 1900-2017. [MBT=Mechanical Bathythermograph, XBT=Expendable Bathythermograph, CTD=Conductivity-Temperature-Depth, XCTD=Expendable CTD.] CD: Is there a tracking mechanism to see who is using the data? It’s difficult – you have to be careful tracking people when you work for the US government – you can look at IP address and email (if they use WODselect). We need a task team leader for duplicate checking now as Ann has stepped down. GC: DOIs can be linked, are we taking advantage of this with e.g. AutoQC – so e.g. in IQuOD version 1.0 there will be a matched release of AutoQC. CD: What could we do better in the next version? More checking
Extra notes from Franco Reseghetti and Simona Simoncelli
• IQuOD XBT with only Cheng et al. 2014 correction, V0.1 available in 2018.
• Uncertainty on position?
• Dissemination connections WOD-IQuOD
• What about Coriolis Quality Flags?
• OHC estimation which data set would you use, WOD or IQuOD? WOD now is preferable
• MBTs from the fifties and sixties are used in WOA.
• Intelligent metadata
• IQuOD objective is to provide a product ready to go for the users, without the need of carrying
about additional QC.

27
3 Day 2: Tuesday morning
Tuesday Speakers
Chair + 2 Notetakers Mauro Cirano Rachel Killick/Gui Castelao
9.00 am Use of Alpha convex hull for quality control of T/S data
TVS Udaya Bhaskar (invited talk - 15 min + 5 min)
9.20 am Customized Global XBT data set for quality control performance test
Francis Bringas (invited talk - 15 min + 5 min)
9.40 am From SeaDataNet to SeaDataCloud Simona Simoncelli (invited talk - 15 min + 5 min) - via Webex
10.00 am Task Team: Auto QC Bill Mills and Simon Good
10.30 - 11.00 am Coffee Break
Chair + 2 Notetakers Rachel Killick Marty Hidas/Steve Diggs
11.00 am Task Team: Expert QC/Machine learning
Gui Castelao
11.30 am Task Team: Performance metrics (obs/model)
Lijing Cheng and Mauro Cirano
12.00 pm Discussion QC + metrics All
12.30 - 2.00 pm Lunch Break + Group Photo

28
3.1 Tuesday 9.00 am – Use of α - convex hulls for quality control of T/S data sets
Use of α - convex hulls for quality control of T/S data sets Presenter: TVS Udaya Bhaskar
Chair: Mauro Cirano Notes: Rachel Killick and Gui Castelao Previous work – spatial pattern being used to generate a polygon (convex hull) – classify points as bad or
good whether they fall inside or outside a polygon. Allow some scatter (+/- 2 sd).
Bhaskhar et al., 2017 – Published paper: Quality control of oceanographic in situ data from Argo floats using climatological convex hulls.pdf Addressing comments of reviewers: Need to interpolate observations to standard depths, this could
introduce errors. Multiple convex hulls corresponding to standard depths are treated independently –
tedious when doing for multiple levels => why not do whole profiles at once.
Build polygons for T vs D, S vs D and TS data from the climatology.
When alpha becomes zero then you have a convex hull – the higher the alpha value the more it becomes a
minimum spanning tree – don’t want either extreme – want an alpha value in the middle.
Build polygons using n-tuples, use Jordan curve to separate points into two halves.
Salinity and temperature convex hulls, and both against depth. Example for float where there is drift
towards the end of the series.
Minimise errors by only using points from climatology that fall within the convex hull.
Did the same thing on a seasonal basis.
The hulls are confined to the region of the float trajectory and the data is checked for annual, seasonal and
individual months.
Questions:
GC: Is the polygon on depth, temp and salinity? There are three polygons: T vs S, T vs D and S vs D.
GC: Would it be worth doing this as one single solid? This is what it is.
GC: How do you not over fit? Playing with alpha, minimising the area without losing any of the points. Alpha
is not a constant for all months.
Francis (FB): Do the points identified as being bad look bad when you see them as a whole profile? Yes.
29
3.2 Tuesday 9.20 am – Customized Global XBT Data-Set for Quality Control
Performance Test
Customized Global XBT Data-Set for Quality Control Performance Test Presenter: Francis Bringas
Chair: Mauro Cirano Notes: Rachel Killick and Gui Castelao
XBT data flow: deployment, data is transmitted in real time to the lab, undergoes automatic QC (data are
flagged and points are either good or bad), good data go to the GTS, bad ones go to be visually checked.
Once the cruise is completed all the data is submitted to the lab and undergoes delayed mode quality
control – the data are archived.
AOML inserts 12 000 – 14 000 XBT profiles every year – more than 400 000 profiles in more than 20+ years.
Automatic QC tests are simple, they’re done in real time: Date, constant value, location, depth, gross value,
climatology, vertical gradient, spike, analysis.
All profiles form high density XBT transects undergo scientific/ expert QC and are submitted to GTSPP/WOD.
Auto QC in 2014 – results of different QCs were not conclusive.
Tokyo report 4.6 Progress on the Auto QC benchmarking - don’t think that the set of profiles needs to be
very large.
Dataset – 100 globally selected XBT profiles in 13 different regions, different basins. In each region 6 profiles
were selected – 2 good and 4 bad – bad profiles should fail during one or more tests – also want to check
that good points in the bad profiles are correctly flagged as good.
Example profiles in the South Atlantic Ocean and North Pacific Ocean.
Maximum depth (bathymetry) – can the AutoQC correctly flag points that look good, but can’t be because
the ocean doesn’t reach the depth that the probe has claimed to be reached. Also look at detecting points
with bad location etc.
In some cases a flag should be for the whole profile e.g. location – want to have a very good AutoQC, want
to know why profiles have been flagged. Expert procedures should be implemented after completing the
best possible Auto QC in order to minimise expert effort. Procedures should be regional – it won’t be good
enough if it’s global.
BM: How well did you do? There are things that need to be tuned still.
BM: Is 100 profiles really enough to test on, you’ll end up with outliers? This is true – started large, decided
that was too many, so shrunk it down. BM: Maybe start with a medium sized data set.
RC: Middle, right for N. Pacific Ocean – all the points look bad? They match climatology and nearby profiles.
RC: Once an XBT profile fails everything below that depth fails – this XBT has leaked, so everything below

30
the first failure point will be too warm. GG: But sometimes the reason the first point is bad is just because of
an offset and then you don’t want to flag everything below – maybe it should be considered which point has
failed and then you decide whether you flag everything below it or not.
RC: Compare AutoQC results with results from visual QC. GG: Showing what is currently done at AOML and what needs to be improved. RC: Have you given your tests to AutoQC yet? Not yet as have been converting from Fortran to Python. Simona: Make sure you consider decadal variability. UB: Showing that a depth recorded is not a feasible depth? Use the best bathymetry record that can be found, but it still might not be right. RC: It’s also possible that someone has recorded an incorrect probe type. SG: Looks like an interesting dataset – could be used as a final test dataset for AutoQC – it’s small enough that it’s independent dataset and all of them can be visually checked. GC: It’s a hard problem – it’s hard to produce an AutoQC that replaces a human when humans have so much knowledge. Small datasets like this are useful for testing – you can create the cost function from things like this. Maton Hidas (MH): Keeping information about which QC tests in each case – useful for the autoQC and
Expert QC, but this may well be useful to keep in general so people know about it. FB: Yes, this could be
useful. TB: Haven’t talked that much about the flagging system – GTSPP has a simple flagging system: good,
bad, maybe; then a more elaborate flagging system – which test failed.
TB: Shows the importance of the Expert QC e.g. bathymetry test – maybe the location was wrong or the
bathymetry if the profile seems good; e.g.2. Depth test – maybe something wasn’t really a T10. If the
experts are only going to look at the profiles that have been flagged by AutoQC – then we need to make
sure AutoQC flags anything we have any doubts about.
Summary provided by Francis Bringas:
Customized Global XBT Data-Set for Quality Control Performance Tests
Following recommendations from the 2016 IQuOD meeting in Tokyo, a data-set of XBT profiles was created
in order to test the performance of different AQC tests. The data-set contain 100 real XBT profiles selected
from 13 different regions, including high latitudes, Gulf of Mexico, Mediterranean Sea, North Pacific,
Tropical Pacific, South Pacific, etc. For each region there are 2 good profiles and 4 bad profiles or profiles
containing bad points. Bad points in profiles should fail during one or more tests such spikes, gradients,
climatology, etc., depending on the QC procedure in use. Additionally, there are profiles with good data
with problems in date, location, bathymetry, depth according to probe type, among other. The goal is to
test the ability of different QC procedures to correctly detect bad and good points.
An AQC procedure that minimizes the number of profiles that requires Expert QC is critical for IQuOD. This
ideal AQC should be able to accurately detect as many good profiles as possible avoiding flagging good
profiles and/or good points. It should also be able to detect bad points or bad profiles and provide
information of the reason these points were flagged in order to facilitate additional tests or procedures.
This requires a system of flags that properly describe the AQC result according to the IQuOD goal and
objectives. The AQC procedures should also be regional to account for regional ocean features. Expert QC
should be conducted only after completing the best possible AQC in order to minimize expert effort.

31
3.3 Tuesday 9.40 am – From SeaDataNet to SeaDataCloud
From SeaDataNet to SeaDataCloud Presenter: Simona Simoncelli
Notes: Janet Sprintall, Rachel Killick and Gui Castelao Chair: Mauro Cirano Seadatanet – pan-european semi-distributed marine data infrastructure
- Idea to have all marine institutions in Europe (110 data centers) share their data (2.1 mill ocean data sets available)
- Seadatacloud innovation – idea to build up a virtual research environment to include data but also to provide standard and new data products by using historical data collections and climatologies
- WP11 Data products = want to improve the quality of existing data set so that’s the interest in IQuOD so as to create the best data products. View this as an iterative approach to facilitate the upgrade of the database and versioning of data products
- QC – all undertaken on regional level using ODV to produce PI Docs (Product Information Docs). - Data (individual profiles, gridded climatologies and reports describing the product characteristics and
quality (DOI)) available from their website www.seadatanet.org - Expecting updated new release in early 2019 - Also have an overall Products Catalogue listing available data - Data products conference in Barcelona in November 2018
- Seadatacloud – IQuOD links include
o Automated QC o Duplicates o Regional products o Regional expertise o Data exchange o Training activities o Data rescue
Gui – what approach do you use for QC The data have been QCed at the data center level. Regional leaders use ODV to visually QC the regional data collections using common guidelines (format issues, stations on land, gross range check, spike detection). The future aim is to make this done more automatically considering the best automate procedures available in the international community. Also happy to collaborate using Gui and Simon’s Auto and Expert QC system to make their trainers and system more efficient. Catia – how are you funded? Etc. Funded until 2020 as part of Horizon 2020. We are a small group and that is a problem. There are 7 regional coordinators/experts so to take on all this is very challenging, so that is why SeaDataNet community is looking forward to collaboration with other communities. No user feedback is obtained at the moment but we are going to monitor PPI users through DOI usages. At the moment they ask who you are and why you are interested in the data as part of the login – then you get an unique MARINE ID so they can trace your usage of what products. But they don’t how many users there are at present. Catia – do you attach uncertainty to your observations or planning?
32
Not currently attaching uncertainty. Franco will be the one to help with this estimate. So that is one reason why they are interested in this collaboration with IQuOD to share that experience. Catia – what % of data are missing metadata? Probably >80% of data have instrument type record so this is a good starting point. They will start this at the data providers level to ask to provide all available additional information. This may apply to both “recent” data and historical data. For historical data there could be a problem to recover this information so they are interested in the Imetadata procedure to recover this information. Data rescue activity and data gaps analysis in collaboration with CMEMS is situ TAC– this is a collaboration with EMODNET data ingestion project.
3.4 Tuesday 10.00 am – Task team: Automated Quality Control
Task team: Automated Quality Control Presenters: Bill Mills and Simon Good
Chair: Mauro Cirano Notes: Rachel Killick and Gui Castelao
Benchmark the automatic QC tests from around the world.
Background: different groups around the world who run their own QC systems – everyone is doing their
own thing, but we don’t know which are the best tests, which are the most effective. We need good
automatic QC because manual operators aren’t going to be able to look at everything. So how do we work
out which are the best tests? Use smaller datasets where we can be really confident which points are good
and bad because they have been carefully analysed already.
Approach: Make this as open as possible, Python implementations of as many QC tests as possible –
everything on GitHub: https://github.com/IQuOD. Code that reads the dataset and runs each QC check on
each profile – can look at what the best combination of tests is. This means groups don’t need to run their
own tests themselves – no separation and then merging with this new approach. It’s modular so it’s easy to
add new tests. Collaboration – working this has allowed us to benefit immensely from the efforts of BM and
GC. Tested – it’s a well-tested system – can make sure that changes don’t break anything else. The software
itself should be viewed as IQuOD products – anyone can use them, they’re free.
Currently there are 50 QC tests implemented in AutoQC – including tests from Argo, CSIRO, CoTeDe (GTSPP
and novel QC tests e.g. fuzzy logic), EN4 tests, ICDC (from Viktor Gouretski), WOD.
How do you work out the performance of the QC test? On a per profile basis – if any level is flagged then
flag the whole profile, if no levels are bad then don’t flag any of the profile. Could use this as a DO NOT USE
list for a first IQuOD AutoQC dataset. Could be used as input to enhanced QC – could be used in real time.

33
Each profile has a True (rejected) or False (not rejected) flag from each QC test – these are then compared
to the truth flags (true positive, false positive, true negative, false negative).
Lots of progress since the last workshop: A lot of progress has been made on improving the infrastructure –
now runs using an SQLite database rather than postgresql; parallelised execution; improved the logging;
verbose infrastructure; finding bugs; Running tests through the autoQC system: finding a problem with test
datasets being too clean – need data with some problems in! QuOTA is still the main source of test data but
details such as how to deal with wire breaks is causing issues. Examining the outputs of the test runs. New
code to generate ROC curves from the AutoQC results: allows AND combinations of test results.
Sample construction: Start with 155 K QuOTA profiles; requirements for consideration filters down to 148 K
profiles; filter down to Jan, Feb, Mar and Jun as these are the most fully QC’d data – this leaves about 40 K
profiles. Select 10 K good & 10 K profiles. The wire break test is a pre-processing step – but this isn’t perfect.
Example of summary results for all the data – still working through the issues! Summary of true positive and
false positive rate for all the tests.
Combining tests: Receiver Operator Characteristic (ROC) plots: in general we want to maximise true positive
rate and minimise false positive rate – balancing the two may be different depending on your motivations
for different datasets.
Generation of the ROC curves: The results from the QC tests are ANDed together to produce combined QC
results – QC tests can also be inverted! Points are added by finding the test combination that when ORed
with the existing tests gives the highest gradient to the ROC curve (while still rejecting a significant number
of profiles).
What tests form our best set? Tend to find combinations of tests ANDed together are the most effective.
Best combinations when run on 1000 randomly selected QuOTA profiles.
Sample construction: Started with QuOTA profiles – wanted to have only those with complete Expert QC –
then selected 20 000 profiles – 10 000 good and 10 000 bad. What made selection more tricky is wire breaks
– don’t want it to only tag wire breaks and miss everything else! Therefore, used Bec’s wire break test and
removed all the profiles that were flagged. What’s the best true positive rate we can get with a sub percent
false positive rate. Categorization of performance: true positive rate 38% (+/- 1) and false positive rate 0.2%.
Look at the false positives – why were they flagged? Still need to look into this. False negatives – you don’t
want to damage your learning algorithm! False negatives where you wonder why they haven’t been
flagged? We should be able to get them very cleanly – why are we not getting them at the moment?
Stochastic examples of tests. Some false negatives where it’s hard to understand why the experts have
flagged certain levels.
Algorithm performance? Looking stuff up efficiently and effectively. CPU utilization degrades over time –
why?
Next steps: Want to release an IQuOD dataset that has AutoQC flags in; testing on QuOTA or/ and
Hydrobase; need to resolve issues, rerun the processing and determine the best set of tests to use to flag
the suspect profiles, these can flag the profiles that are strongly suspected to have a problem; release the
profiles and a journal paper; need to build up the communication between auto and Expert QC; want to be
able to use Expert QC decisions to improve AutoQC – need a feedback loop (do TTs need to be separate?).
GG: Who are the members of this task team: Bill and Simon – but very keen for others to contribute.
34
3.5 Tuesday 11.00 am – Expert Quality Control Task Team
Expert Quality Control Task Team Presenter: Gui Castelao
Chair: Rachel Killick Notes: Marty Hidas and Steve Diggs
● "Community Quality Control" - machine learning in support of Expert QC ● Machine Learning (ML) connecting the best of two worlds ● Spurious data are inevitable, so QC is a requirement, and will be in the future ● Modern times demand efficiency:
● low latency for real-time ● large volumes
● Ideal QC would be as fast as Auto QC, flexible, and top quality as manual QC ● How to make task of Expert QC easier? ● ML techniques
● Unsupervised learning - better representation and simplification of the problem (e.g. EOFs, clustering)
● Supervised learning - e.g. classification (provide the data in a new space) Example: Gradient test defined as GTSPP project data in a new space. Linear regression – calibration needs to represent all possible occurrences, which is very difficult to sample. Not feasible. Way less bad data exists.
● Training data needs to be fully representative of real data, including all possible "bad data" ● General problem is unbalanced data, i.e. only small fraction of real data is bad ● requirements (?)
● Anomaly Detection ● Does not need additional features. ● By definition is the best decision making strategy.
● QC criteria ● Feasible limits ● Climatology test (z-score threshold) ● Independent multiple feature climatology (Gronell 2008) ● Questions:
● Could we obtain some information from other tests? ● Is a Gaussian distribution a good assumption
● Multi-dimension perspective ● How to define grey areas? ● more degrees of freedom means more flexibility on decision making (Castelao 2015, 2016)
● Anomaly detection: criteria based on valid data, so unprecedented spurious measurements or unbalanced data sets are not a problem.
● ExpertQC user interface - https://expertqc.castelao.net ● interactively flag profiles, system learns to mimic expert's decisions ● Mimic the expert and bring to the expert only a reduced number of cases.
● Community QC

35
● system calibrates for each user to allow for different levels of expertise ● give "easy" stuff to lower level users, give the hard stuff to the experts ● combine all for community calibration > New flags & CoTeDe release with new parameters
(to use in Auto QC) ● CoTeDe is updated every time more information from experts comes. ● Feedback of opensource is crucial for method improvement.
● Close the cycle by returning the calibrated CoTeDe to the community ● Provide open access to the flagging dataset ● Challenges
● time for development (maintenance minimised by automation in the cloud) ● scientific development is small fraction of the requirements to keep system running ● computationally expensive (need to use "mathematical tricks" to make this affordable) to
be used in operations. ● Future work
● recruit, engage, learn from QC experts ● advance techniques for specific problems (wire break, bottom hit, pattern identification) –
Rebecca is leading ● anonymise human flags and make them open access ● propose a procedure for (cross-)validation of experts (trainees) ● Use this as a training/educational tool
● CoTe De l'eau - http://cotede.castelao.net ● open-source free software ● customisable with presets ● run in parallel for efficiency ● easy to extend available tests ● easy to integrate
● Discussion: ● Bill: moving to higher dimensions has problem with sparseness of data?
● Gui: if you add a particular dimension that leads to sparseness, it's not a useful dimension to add for analysis
● Bill: will the expertQC web interface capture why users flag certain points? ● G: yes, the user can select flagging reasons from a list (e.g. spike, wire break, etc..). Also
mentioned that point-by-point QC is not very efficient, but having this information is helpful for the system
● Catia: adjustable std dev on climatology shown in interface - does that affect what points are flagged? ● G: no, this is only for display. The expert decides what is flagged.
● Bill: per-profile decisions of good/bad can be fed into the ROC generation algorithm used in AutoQC team
● Franco: How do you take into account physical limit on rate of change (e.g. temperature with depth)? Do you allow profile to have good data below any anomaly? ● G: don't consider instrument metadata such as uncertainty (??). This tool is primarily to
support human QC, so it only flags individual features ● G: can also flag many points at once, by selecting a region in the profile plot

36
Extra notes from Marlos Goes:
Machine learning QC is a problem for 15 years from now. We are not there yet, a lot to code. QC has to be real time, handle large volumes. Ideal QC is fast as Auto QC but the same quality as Expert QC. How to improve Expert QC? Machine Learning is the answer, which consists of many techniques. Supervised learning is needed in the first stage. Machine learning classification: Project the data in a new space. Example: Gradient test defined as GTSPP project data in a new space. Linear regression – calibration needs to represent all possible occurrences, which is very difficult to sample. Not feasible. Way less bad data exists. Unbalanced dataset has to be handled. Anomaly detection does not need additional features. By definition is the best decision making strategy. Ann and Susan: Make the data behave in different perspectives: gradient method, etc. Same perspective applied here: combine information from different tests. Is a gaussian a good way to represent data? What is the multidimension test? How to define the gray areas? More dimensions can define what the gray areas are. Anomaly test: What is anomalous? Define not only the bad but also the good ones. All in the expertqc.castelao.net Mimic the expert and bring to the expert only a reduced number of cases. System learns with experts to make a community calibration. CoTeDe is updated every time more information from experts comes. Feedback of opensource is crucial for method improvement. Challenges: Time for development. Scientific development is a small part of the problem. System requirements and computation for operations is the big expense. Future work: Recruit, engage and learn. Employ advanced techniques: ex: hit bottom, wire break (Rebecca leading). Cross validation, flags, and training new experts with this tool in the future.

37
3.6 Tuesday 11.30 am – A new task team? Linking IQuOD to OHC and Ocean
Forecasting Systems (performance metrics)
A new task team? Linking IQuOD to OHC and Ocean Forecasting Systems (performance metrics) Presenters: Lijing Cheng and Mauro Cirano
Chair: Rachel Killick Notes: Marty Hidas and Steve Diggs
• Propose a new task team, linking IQuOD to OHC and Ocean Forecasting Systems (performance
metrics)
• How can others benefit from IQuOD data and activities?
• Overall aim: Keeping track of IQuOD improvements
• How can IQuOD benefit the OHC estimates?
• improvements in QC
• understand uncertainty due to data quality in OHC estimate
• As a community dataset, should document how XBT data are handled
• Generally CH14 applied, but other issues, many decisions to make:
• unknown brands & FREs
• Sparton XBTs and other known but less-used brands
• separating shallow-unknown and deep-unknown
• Proposed actions:
• document technical details within IQuOD activity to set stage for future improvement and make
sure all information traceable
• work with iMeta and XBT group to find solutions for the problems, make improvements in
IQuOD v1
• Update CH14 using IQuOD product
• Can improvements in data QC improve the OHC estimate?
• makes more physical sense?
• better closure of sea level budget?
• better closure of Earth energy budget?
• (both were improved by Argo data)
• proposed action:
• invite OHCers to calculate OHC based on IQuOD data
• maintain/update OHC time series for each IQuOD version, keep track of changes
• Uncertainty in OHC due to data quality
• define quality-related uncertainty in historical estimates
• Boyer et al. 2016 estimated the uncertainties due to XBT data quality
• key idea: use IQuOD uncertainty estimates to perturb each measurement, use result to
calculate OHC
• Proposed actions:
38
• make 4 "Perturbed-IQuOD" datasets (using 4 best XBT schemes, 4 salinity data)
• ask community to calculate OHC based on each
• compare to quantify global/regional uncertainties
• IQuOD benefit to Data Assimilation (DA) community?
• reduce QC
• provide better estimates of measurement uncertainties
• reanalysis products would be first target
• How can DA community provide feedback to IQuOD?
• Proposed actions
• Engage (convince) the OFS (via GODAE OceanView) to use IQuOD as a sensitivity experiment
• Related task teams:
• How to speed up the process?
• organize a quick survey to be sent together with a summarised presentation of IQuOD
• present IQuOD at next GODAE OceanView science team meeting
• if successful, present results at GOV symposium 2019
• Discussion:
• Simona: the Copernicus marine service is already collecting anomalies from DA of prediction
systems and reanalysis so you could use the connections with Coriolis and Mercator Ocean to
speed up the process
• Catia: this is a very good start. we can link these activities with other communities (e.g. CLIVAR
GSOP ??)
• Lijing: plan to present this at CLIVAR workshop later this year
• Catia: we could coordinate the OHC community to use the IQuOD data and flags instead of
getting them from different sources
• Tim: yes, we can do that, once we have the IQuOD product out that is suitable as input for OHC.
We're not there yet.
• Gustavo: some people have stopped using XBT data for OHC estimates
• Catia: stopped using XBT data in 2004, using only Argo data since then
• Janet: Are the differences due to this within the uncertainties?
• Catia: Yes
• Simon:
1. you could also test the uncertainties due to the XBT bias corrections.
2. When looking at effects of uncertainties, you have to take correlations into account, which
makes this more challenging.
3. You could also test effects of using different combinations of QC checks in IQuOD to add
into the uncertainty estimates
• Marlos: How do you add "structured noise" into IQuOD to test uncertainties?
• Lijing: first approach is just to use white noise based on IQuOD uncertainties
• Tim: the IQuOD product includes an uncertainty value for each individual measurement, but
currently it's set to a constant value for each profile based on manufacturers
• Gustavo: talking about groups we want to reach, following results from a paper on impact of
fall-rate equation issues on various derived parameters, two more communities where IQuOD
product would be well received:
• Meridional heat transport
39
• Monitoring Boundary currents
• Catia: I'm not sure if IQuOD will make much difference to these products, but the more
communities we reach, the better will be our uptake.
Extra notes from Marlos Goes:
NEW TASK TEAM: IQuOD, OHC and forecasting systems.
Idea: How other can benefit from IQuOD data/activities
Keep track of IQuOD improvements.
1 - Can IQuOD benefit the OHC estimate – Improving ocean estimates. Quantify this improvement
2- Quantify uncertainty due to quality of OHC estimate.
Problems and decisions: Unknown brands, FREs; Sparton XBTs and other less used brands Separate shallow and deep unknowns. Sippican or Hanawa standards. Keep track of IQuOD improvements, clean version. Improve CH14 using new IQuOD data. How to improve OHC estimates, and how good is good? Better close sea-level budget and energy budget. Proposition: Invite IQuOD team to estimate OHC. Update OHC, sea-level and heat budget analysis. Mapping has been quantified by Boyer et al. 2016, but not data quality. IQuOD mean plus deviation to make a perturbed ensemble. Quantify uncertainty due to data quality. Both white and red noise. Make perturbed IQuOD dataset. 4 best XBT schemes, and 4 salinity data. Cross validate with different groups. Mapping and data uncertainty have different patterns of biases. Mauro – 2nd part: 2 questions: 1- How IQuOD benefit data – provide better estimates.
2- How DA community feedback on IQuOD. What is missing?
Make recommendations in conjunction. Better way using the GODAE Ocean View.
GODAE has several task teams, 2 more appropriate are Observing system evaluation, and Data
assimilation team. Include FOAM, Met Office etc.
How to speed up the process: Through the program office. Summarize presentation of the
IQuOD. Try to present in the next GODAE symposium (May 2019 Canada)
WCRP workshop at the end of the year.
Catia: Open to other communities (WCRP/WDAC, ECCO, CLIVAR). Include hindcast.
Lijing: This project will be presented in the CLIVAR workshop (EEI)
Simona: Copernicus marine service is already doing to provide statistics of bad data.
Greg Johnson is leading on the EN4 side. Catia is doing her OHC estimates.
40
Good: using different XBT corrections schemes for DA. 2) applying IQuOD uncertainties for data.
3) Use different QC checks.
Gustavo: Using IQuOD to compute ocean currents, meridional heat transport. XBT data is used
to compute MHT. This community would also benefit from IQuOD.
Boyer: AutoQC – False negatives unable to be found depth problems. Find tests which are
efficient. Build set of tests for specific problems.
3.7 Tuesday 12.00 pm – Discussion QC + metrics
Discussion QC + metrics
Chair: Rachel Killick Notes: Marty Hidas and Steve Diggs
• Tim: question about why we have some of the false negatives in the AutoQC experiments. We know we have these tests (e.g. constant value), and we should we using them, even if they only pick up rare events.
• Bill: problem with using simple tests in machine learning is you pick up many crazy edge cases
• Gui: we can improve on this by adding logging to make better sense of the individual AutoQC tests
• Bill: in Hamburg we were talking about aiming to minimise false positives, but now it seems more like we want to maximise true positives, as this will feed in to Expert QC

41
AutoQC email comments from Bec:
From: Rebecca Cowley <[email protected]>
Subject: AQC workflows
As I am missing the after-workshop discussions, I thought I’d write a couple of things down that I thought of after the discussion on workflows yesterday.
We talked about not re-qcing the data once an expert has looked at it, and Tim said that he would like to re do the AQC everytime we have an update. After thinking about this, I do tend to agree with Tim. It won’t hurt to re-do the AQC on the entire dataset, as sometimes the expert (or machine) will still miss things and the AQC will pick it up. The subtlety is this - if a profile that has been through ‘expert’ QC fails subsequent runs of AQC for the same reasons everytime, we don’t want to keep looking at the profile. I’m not sure how that will be managed.
Bill made the point that the EQC will take considerably longer time frames than the AQC, and this is why we don’t want to keep putting profiles back for EQC if they continue to fail the AQC processes. The flagging system will have to allow us to pick and choose what profiles we look at in EQC and keep the AQC flags separate.
The AQC process, I think, can be improved with some machine learning routines, and maybe following what Ann did in Quota. She started with a small set of highly QC’d data, then screened all ‘new’ data against it. Those that failed were EQC’d. Then the dataset got bigger and the next dataset that was added was screened against the ‘good’ dataset. I’m not sure how we can adapt this to the WOD, as it is one big dataset, but maybe you have some ideas? Maybe we can start with Hydrobase, Quota, CCHDO, any others?
Finally, some comments on the AQC issues that Bill brought up in his talk. Bill showed a couple of profiles where the AQC said the data was OK, but the Expert QC said the data was bad. It is difficult to find out why the QC decision was made by simply looking at the profile, we would need to check with buddies and the climatology to assist. The Quota dataset is not perfect, and the expert sometimes makes ‘safe’ decisions. For example, the one with the wirebreak - the expert (maybe me or Ann) has put the wirebreak a point higher than the AQC. The reason might be that there is a subtle warming above the wirebreak (a wire stretch), or that we simply moved it there mistakenly. I was learning QC on the Quota dataset, so my decisions then would not be what I would do now that I know a lot more. It is quite common, though, for the expert to play it safe - remove some good data to ensure that all the bad is removed. That might be a good philosophy to follow with the acceptable ratio of true positives to false positives.
Also, I was a bit nervous with the presentation that Francis made, and maybe a bit confused. I thought that the talk was proposing that we use the 100 profiles that he selected and showed in the presentation as a test of the AQC. That is why I was questioning the flags he was showing on the data. If we are going to use a small dataset for testing, we need to use one that we know has correct QC on it.

42
4 Day 2: Tuesday afternoon
Tuesday Speakers
Chair + 2 Notetakers Uday Bhaskar Franco Reseghetti/Lijing Cheng/Toru Suzuki
2.00 pm Engaging with SCOR & IODE: relevant projects, NODCs, ADUs
Charles Sun, Toru Suzuki, Catia Domingues, Tim Boyer
2.20 pm Biases of Five Latent Heat Flux Products and their impacts on mixed-layer temperature estimates in the South China Sea
Prof RongWang Zhang (invited talk - 15 min + 5 min)
2.40 pm Planning for impact: dissemination strategy (interim products), website, documentation, training and value added products
All discussion
3.00 - 3.30 pm Coffee Break
Chair + 2 Notetakers Janet Sprintall Gustavo Goni/Charles Sun
3.30 pm Tracking SCOR WG148 ToRs Catia Domingues
4.00 pm Planning future activities for interim/final products
All
4.30 pm Overall discussion All
5.00 pm Close

43
4.1 Tuesday 2.00 pm – Engaging with SCOR & IODE
Engaging with SCOR & IODE: relevant projects, NODCs, ADUs
Presenter: Catia Domingues
Chair: Uday Bhaskar Notes: Franco Reseghetti, Lijing Cheng and Toru Suzuki TEOS-10, IODE relevant projects Tim Boyer = Trial to describe the real Ocean. Calculation of the density profiles from temperature and salinity. Problems related to the density inversion. IQuOD controls the quality of profiles. Problems with data at higher latitude. CD = I agree, largest effects are on Antarctic intermediate water. Tim Boyer = Data rescue. No resources for the replacement of some people. IODE contribution: at a level of small projects. Digitization of old data, but it is a long and complex process. Several problems, for example meteorological data, cruises from Russia and so on. Claudia Delgado= Ocean data management for ocean teacher. We are waiting for a reply for a submitted report. Simona Simoncelli, as leader of SeaDataNet WP on quality check of data and data products, states that the interaction with IQuOD to share some common activities is wished. There are data with restricted access in SeaDataNet/SeaDataCloud and this is an issue, because data providers keep these data restricted even after the embargo period. EMODNET is another EU-project collecting data from European data providers. Different types of users of data within SeaDataNet, EMODNET and Copernicus. Main activities in common within SeaDataCloud and CMEMS in situ TAC are oriented to forecast (RT/NRT) and reanalysis (DM/REP) production. Tim Boyer = It is important to share data for all applications, otherwise there are reproducibility issues. Check to eliminate duplicate data extracted from SDN. CD = Collaborations are important to share data and activity
44
4.2 Tuesday 2.20 pm – Biases of Five Latent Heat Flux Products and their impacts
on mixed-layer temperature estimates in the South China Sea
Biases of Five Latent Heat Flux Products and their impacts on mixed-layer temperature estimates in the
South China Sea
Presenter: Prof RongWang Zhang
Chair: Uday Bhaskar Notes: Franco Reseghetti, Lijing Cheng and Marlos Goes
Tim Boyer = Why do you use monthly climatology? RW = We have no sufficient data.
Catia Domingues = Next step? RW = We are trying to improve this product.
Conveners = Is a large scale expansion planned? RW = Most of the data comes from the southern seas of
China, because this is the main area of interest, probably in the future the studies will concern a larger area.
Tim Boyer = Did you look at the calculation in OHC and the comparison with this heat flux in order to
evaluate possible correlations? RW = It is planned in the future to do this.
- HeXOS - TOGA-COARE - CBLAST - Buoys, mooring buoys, flux towers.
- Use Bulk formula for calculation of fluxes. - Use cool skin correction for skin temperature. - Generally 30% underestimate fluxes. - Poor observations to validate fluxes. - Validate over sea ice

45
4.3 Tuesday 2.40 pm – Planning for impact
Planning for impact: dissemination strategy (interim products), website, documentation, training and
value added products
Presenter: Catia Domingues
Chair: Uday Bhaskar Notes: Franco Reseghetti, Lijing Cheng and Toru Suzuki There are areas without contact points and reference persons. Viktor Gouretski suggested some possible contact in Russia. A. Vorontsov could be the contact person, maybe. Guilherme Castelao = (after request by Catia Domingues) Trial to prepare a team of experts of XBT data in regional areas. In my website, after a quick registration form, experts from all the world can login and provide their knowledge. CD = Africa is empty, without contributing countries, unfortunately. Africa is the main target for IOC and UN. Simona Simoncelli = There are African/Middle East data providers (Tunisia, Morocco, Israel, Turkey…) in the Mediterranean and Black Seas within SeaDataNet community but they have difficulties in sharing their data. There are both political and funding issues (more than expertise) that prevent monitoring activities and data sharing. CD asks Claudia Delgado to talk with TT leaders. IQuOD proposes training courses and this can be included in IODE training courses plan. Claudia Delgado suggests to propose one-two training courses. For example Tim Boyer had a training course in Colombia (in Spanish) in 2016 targeted. on specific arguments for South America. Claudia Delgado = The training course should be well tailored and targeted. Funding the courses. CD = Help for preparing technical staff. Gustavo Goni = Which is the interest of African countries in Oceanographic activities? Importance of ocean observations and their impact on climate, fisheries, and so on. Training is important to create a consciousness of the common problems. Is there an Ocean observing system? Claudia Delgado = IQuOD is at a very specialised level with respect to most of African countries.
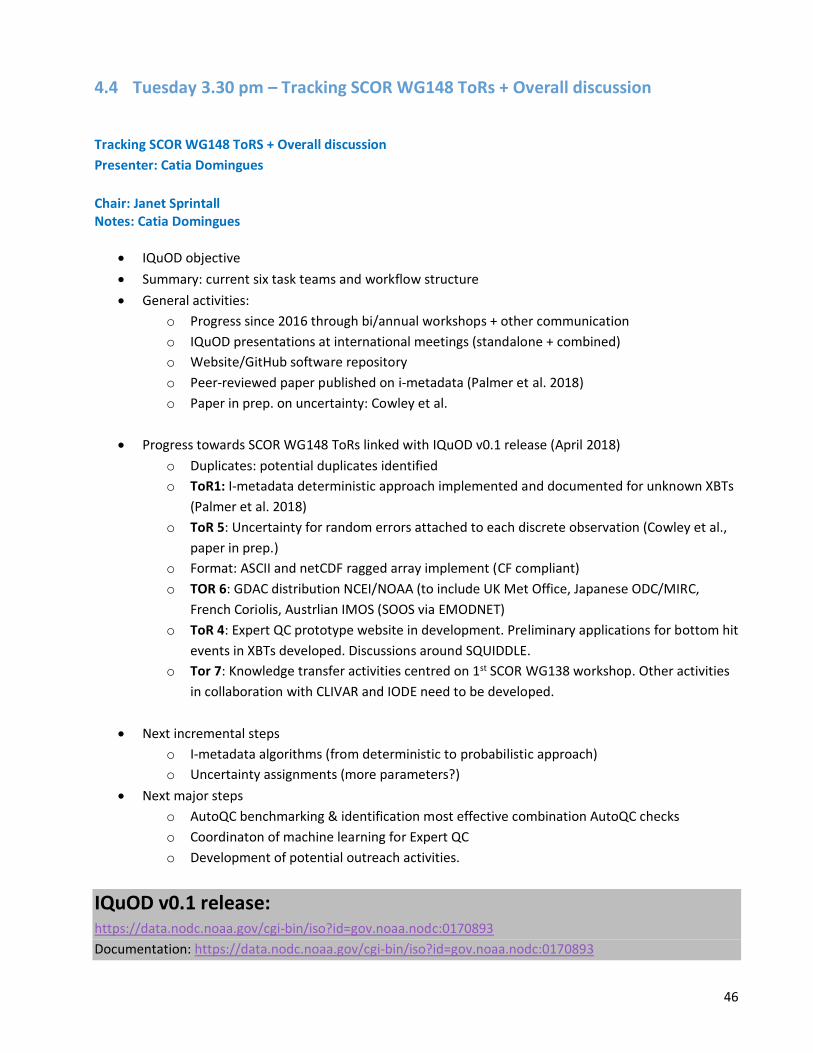
46
4.4 Tuesday 3.30 pm – Tracking SCOR WG148 ToRs + Overall discussion
Tracking SCOR WG148 ToRS + Overall discussion
Presenter: Catia Domingues
Chair: Janet Sprintall Notes: Catia Domingues
• IQuOD objective
• Summary: current six task teams and workflow structure
• General activities:
o Progress since 2016 through bi/annual workshops + other communication
o IQuOD presentations at international meetings (standalone + combined)
o Website/GitHub software repository
o Peer-reviewed paper published on i-metadata (Palmer et al. 2018)
o Paper in prep. on uncertainty: Cowley et al.
• Progress towards SCOR WG148 ToRs linked with IQuOD v0.1 release (April 2018)
o Duplicates: potential duplicates identified
o ToR1: I-metadata deterministic approach implemented and documented for unknown XBTs
(Palmer et al. 2018)
o ToR 5: Uncertainty for random errors attached to each discrete observation (Cowley et al.,
paper in prep.)
o Format: ASCII and netCDF ragged array implement (CF compliant)
o TOR 6: GDAC distribution NCEI/NOAA (to include UK Met Office, Japanese ODC/MIRC,
French Coriolis, Austrlian IMOS (SOOS via EMODNET)
o ToR 4: Expert QC prototype website in development. Preliminary applications for bottom hit
events in XBTs developed. Discussions around SQUIDDLE.
o Tor 7: Knowledge transfer activities centred on 1st SCOR WG138 workshop. Other activities
in collaboration with CLIVAR and IODE need to be developed.
• Next incremental steps
o I-metadata algorithms (from deterministic to probabilistic approach)
o Uncertainty assignments (more parameters?)
• Next major steps
o AutoQC benchmarking & identification most effective combination AutoQC checks
o Coordinaton of machine learning for Expert QC
o Development of potential outreach activities.
IQuOD v0.1 release: https://data.nodc.noaa.gov/cgi-bin/iso?id=gov.noaa.nodc:0170893
Documentation: https://data.nodc.noaa.gov/cgi-bin/iso?id=gov.noaa.nodc:0170893

47
5 Day 2: Wednesday morning
Wednesday Speakers
Chair + 2 Notetakers Sergio Larios Charles Sun/Janet Sprintall
9.00 am TS Data Integration and Management in NMDIS
Prof Yulong Liu (invited talk - 15 min + 5 min)
9.20 am Review planned TT activities TT leaders (I-M, Unc., Format)
9.40 am Review planned TT activities AQC EQC
TT leaders (Dupes, AQC, EQC)
10.00 am Review planned TT activities TT leaders (GDAC, Metrics, outreach)
10.30 - 11.00 am Coffee Break
Chair + 2 Notetakers Toru Suzuki Marlos Goes/Sergio Larios
11.00 am Overview: Australian Research Council Proposal with International Partners
Catia Domingues
11.30 am Planning: regular video meetings + 2019 workshop
Catia Domingues
12.00 pm Agreed actions + Wrap up All
12.30 - 2.00 pm Close + Lunch
XBT workshop @ 2 pm

48
5.1 Wednesday 9.00 am – TS data integration and management in NMDIS
TS data integration and management in NMDIS
Presenter: Prof Yulong Liu
Chair: Sergio Larios Notes: Janet Sprintall
- NMDIS started in 1958 - Construction of marine cloud for storing data - Used for data analysis and prediction, marine data mining, analysis and prediction method
library - Outlined technique for elimination of duplicates - Outlined different methods of data testing for accuracy - Need for more manpower resources to handle data QC - There are a number of data information services in China
Uday – are all data in the public domain Some data are available but not all Catia – do you follow other data center protocols or your own Not necessarily
5.2 Wednesday 9.20 am – 11.00 am: Task Team Leaders discussions
Task Team Leaders discussions
Chair: Sergio Larios Notes: Janet Sprintall, Mauro Cirano and Marlos Goes Duplicates – how to move forward on this?
- Gui - How bad is this problem?
- Tim - It is correlated with the number of levels – for <4 levels it is more than 100K, whereas for >15
levels it’s more like 10-15K so it is a small percentage (~1%) but nonetheless someone has to look at
this (2.4 m MBTs etc).
- Yulong and Bin Zhang will look at this
- Tim – how will we do this? How to decide which profile to keep? You really have to look at the
origin of the data set, so it is an investigative process of the originator of the data and metadata the
original data is available from the NCEI data base but it can be a fairly slow process for each profile

49
- Lijing – can we divide this task up?
- Tim – many techniques for finding duplicates can be automated but the bulk of the work is the
expert looking at each profile to determine if duplicates but which one to keep
- In most cases a duplicate is not that harmful – it can skew statistics – but better to keep both in the
data base rather than pull one out until the decision is certain.
- Some cases are obvious, but many cases it will be difficult for machine learning to solve this issue.
- NCEI has basic duplicate checks to eliminate exact same data, but if there are issues in
date/time/location/platform then not so straightforward.
- How can we reduce the number of experts needed for this problem? It really is a problem on case
by case result. Throwing out by machine will not probably be the best way to solve this issue – really
need expertise to manually address this problem as too many nuances.
- Simon – it will be able to be included in Auto QC to detect duplicates but not to solve the issues.
- Tim - Duplicates should not be the highest priority for IQuOD so could do this on a case needed
basis.
- Main platform offenders are unknown as Ann/Ed’s analysis is not split out by platform type, but Tim
could do this.
- Bec – knows this and the offenders are nearly all MBTs, XBTs and CTDs.
- Can Ann share her fortran scripts publicly? Bec would not go back to the fortran scripts, but would
rather just use the algorithm and incorporate that into the GitHub python scripts. Sergio has
volunteered to do this. He will talk with Abby to do this as he is an expert in fortran but not python
and Abby vv, so this will be a good way to move this problem forward.
5.3 Wednesday 11.00 am – 12.00 pm: ARC Linkage funding + Wrap up
Potential funding mechanism from Australia: ARC linkage proposal Promotes national, and international, collaboration and research partnerships between key stakeholders in research and innovation including higher education institutions, government, business, industry and end-users.Research and development is undertaken to apply advanced knowledge to problems, acquire new knowledge and as a basis for securing commercial and other benefits of research. To facilitate successful collaboration between higher education institutions and other parts of the innovation system, Linkage Projects proposals can be submitted at any time and funding outcomes are announced within six months of proposal submission. Rebecca Dorgelo/UTAS: The good news is that Linkage projects no longer have deadlines, so there is more flexibility there. Though when talking with an ARC representative before the break, they noted that there is a spike in application numbers around the December period – so they strongly suggested avoiding that time of year.
• Next IQuOD workshop: Lijing has offered to host, however, some US members may not be able to
attend. We need further consultations.
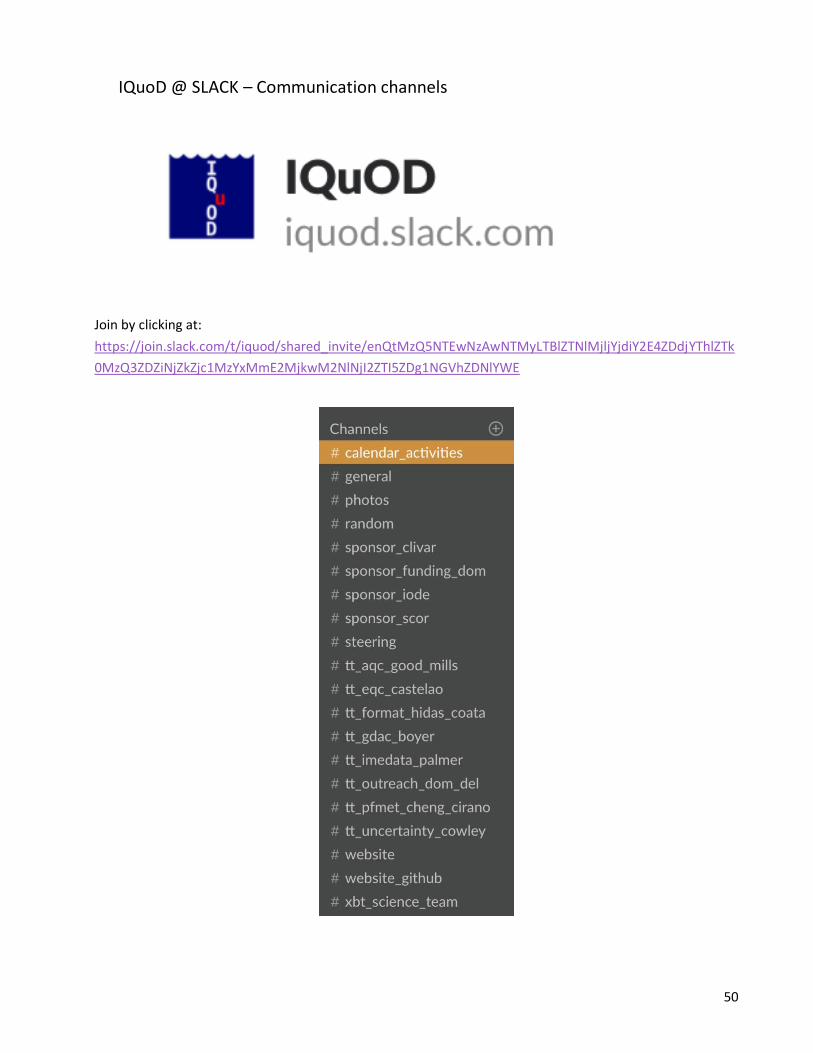
50
IQuoD @ SLACK – Communication channels
Join by clicking at:
https://join.slack.com/t/iquod/shared_invite/enQtMzQ5NTEwNzAwNTMyLTBlZTNlMjljYjdiY2E4ZDdjYThlZTk
0MzQ3ZDZiNjZkZjc1MzYxMmE2MjkwM2NlNjI2ZTI5ZDg1NGVhZDNlYWE
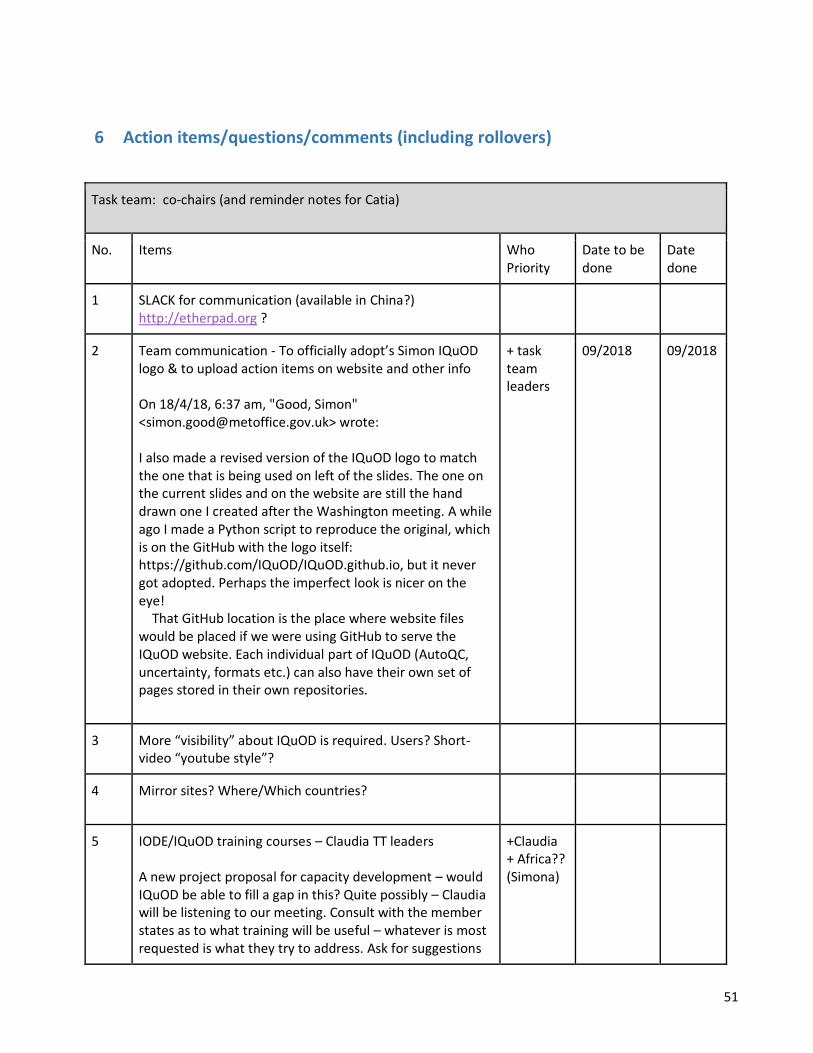
51
6 Action items/questions/comments (including rollovers)
Task team: co-chairs (and reminder notes for Catia)
No. Items Who Priority
Date to be done
Date done
1 SLACK for communication (available in China?) http://etherpad.org ?
2 Team communication - To officially adopt’s Simon IQuOD logo & to upload action items on website and other info On 18/4/18, 6:37 am, "Good, Simon" <[email protected]> wrote: I also made a revised version of the IQuOD logo to match the one that is being used on left of the slides. The one on the current slides and on the website are still the hand drawn one I created after the Washington meeting. A while ago I made a Python script to reproduce the original, which is on the GitHub with the logo itself: https://github.com/IQuOD/IQuOD.github.io, but it never got adopted. Perhaps the imperfect look is nicer on the eye! That GitHub location is the place where website files would be placed if we were using GitHub to serve the IQuOD website. Each individual part of IQuOD (AutoQC, uncertainty, formats etc.) can also have their own set of pages stored in their own repositories.
+ task team leaders
09/2018 09/2018
3 More “visibility” about IQuOD is required. Users? Short-video “youtube style”?
4 Mirror sites? Where/Which countries?
5 IODE/IQuOD training courses – Claudia TT leaders A new project proposal for capacity development – would IQuOD be able to fill a gap in this? Quite possibly – Claudia will be listening to our meeting. Consult with the member states as to what training will be useful – whatever is most requested is what they try to address. Ask for suggestions
+Claudia + Africa?? (Simona)

52
of burning issues in the future that need to be addressed. Currently a small group of trainers – therefore hoping for more, maybe from the IQuOD community.
6 Gauge IODE nation members
7 IQuOD webpage, Central repository for docs + codes + data + versions etc
8 PANGEA repository?
9 Need to understand IQuOD updates at WOD/uncorrected versions Catia to talk with Tim. Matt/Tim – traceability |static/dynamic versions
10 Tracking metrics for IQuOD users? DOI?
11 Additions to IODE/IQuOD: Franco? Yulong? Thomas Moore?
12 SCOR/Russia contact
13 Review members/duties Marcela/Kath/Korea/Gui Maze/Russia/King/Austin/Greg Reed/ Squiddle/Ariel/Stefan/ BODC?/ China Prof Fan Wang
14 Duplicates task team leaders?
15 Interactions with XBT science team – two-way
16 Engagement with SeaDataNet/Copernicus and EMODNET: Datasets, data products, Auto QC, Expert QC staff/regional, duplicates, training activities, data rescue. Funding beyond 2020? SOOS/EMODNET
17 Develop systematic user feedback mechanism? +Simona
18 Next workshop?
19 Regular meeting with task team leaders
20 Engagement with BODC? Brigit Klein/Germany?
21 Copernicus KPIs
22 Email list/helpdesk?
23 Full resolution data?
24 Corrections for MBTs? | priorities

53
Task team: Uncertainty | Bec Cowley and John Gould Members:
No. Item Who Priority
Date to be done
Date done
1 Need to double-check uncertainty values applied to v0.1 Tim/Bill’s codes?
2 Apply refinements to uncertainties: instrument types, time periods, calibration statistics; salinity uncertainties not well understood. Develop a template for feedback from those who collected data. Uncertainties for which parameters? Expand the experts table. Online survey? https://www.surveymonkey.com
John G, Bec, Viktor, Alexander Seb?
3 Peer reviewed paper to publish/detail approach: how far we can take the hierarchy of estimation of uncertainty (eg, instrument, manufacturer, country, institute, cruise levels) and how they are applied to IQuOD.
4 Publish approach/codes on IQuOD GitHub webpage + central repository. Cookbook?
5 Mechanism/feedback to Tim Boyer?
6 Need more volunteers & coordination Current active team: Bec, Tim, Rachel and Uday Co-chair with Bec? (she is struggling with time)
7 Can uncertainty be requested via WODselect?
8 Traceability requirement: need to implement source of the uncertainty numbers & table. Upload/publish on GitHub.
9 Interaction between QC flags and uncertainty estimates?
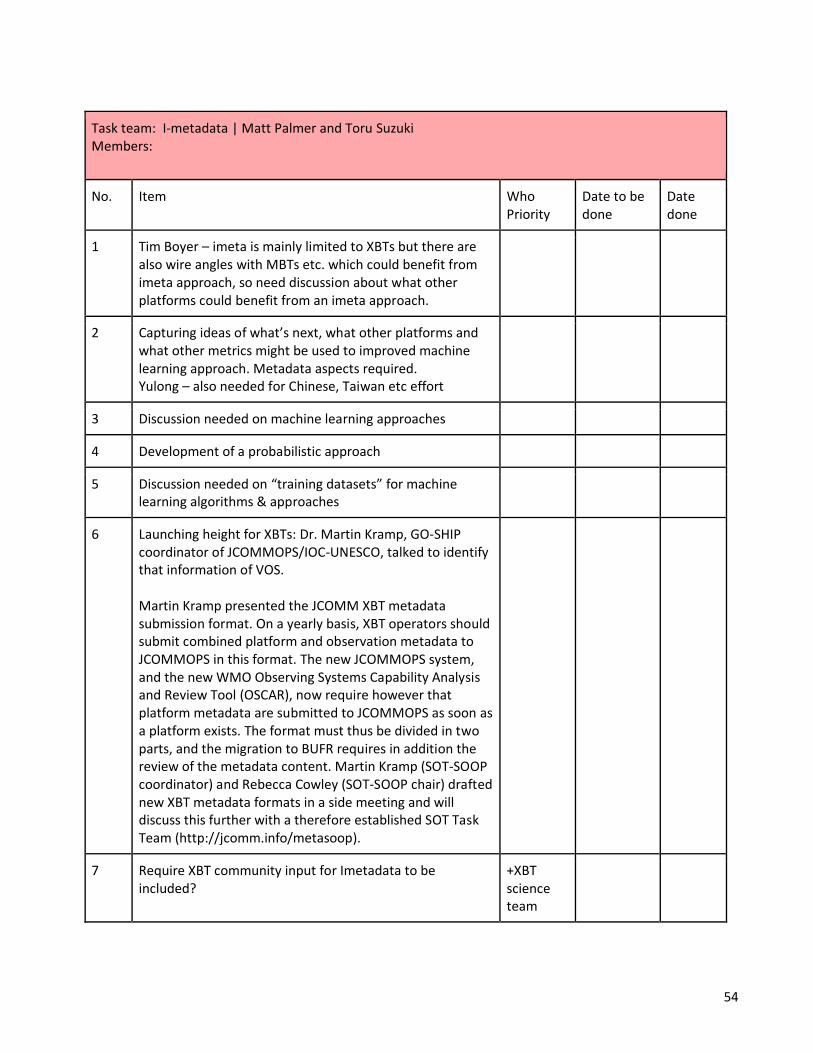
54
Task team: I-metadata | Matt Palmer and Toru Suzuki Members:
No. Item Who Priority
Date to be done
Date done
1 Tim Boyer – imeta is mainly limited to XBTs but there are also wire angles with MBTs etc. which could benefit from imeta approach, so need discussion about what other platforms could benefit from an imeta approach.
2 Capturing ideas of what’s next, what other platforms and what other metrics might be used to improved machine learning approach. Metadata aspects required. Yulong – also needed for Chinese, Taiwan etc effort
3 Discussion needed on machine learning approaches
4 Development of a probabilistic approach
5 Discussion needed on “training datasets” for machine learning algorithms & approaches
6 Launching height for XBTs: Dr. Martin Kramp, GO-SHIP coordinator of JCOMMOPS/IOC-UNESCO, talked to identify that information of VOS. Martin Kramp presented the JCOMM XBT metadata submission format. On a yearly basis, XBT operators should submit combined platform and observation metadata to JCOMMOPS in this format. The new JCOMMOPS system, and the new WMO Observing Systems Capability Analysis and Review Tool (OSCAR), now require however that platform metadata are submitted to JCOMMOPS as soon as a platform exists. The format must thus be divided in two parts, and the migration to BUFR requires in addition the review of the metadata content. Martin Kramp (SOT-SOOP coordinator) and Rebecca Cowley (SOT-SOOP chair) drafted new XBT metadata formats in a side meeting and will discuss this further with a therefore established SOT Task Team (http://jcomm.info/metasoop).
7 Require XBT community input for Imetadata to be included?
+XBT science team
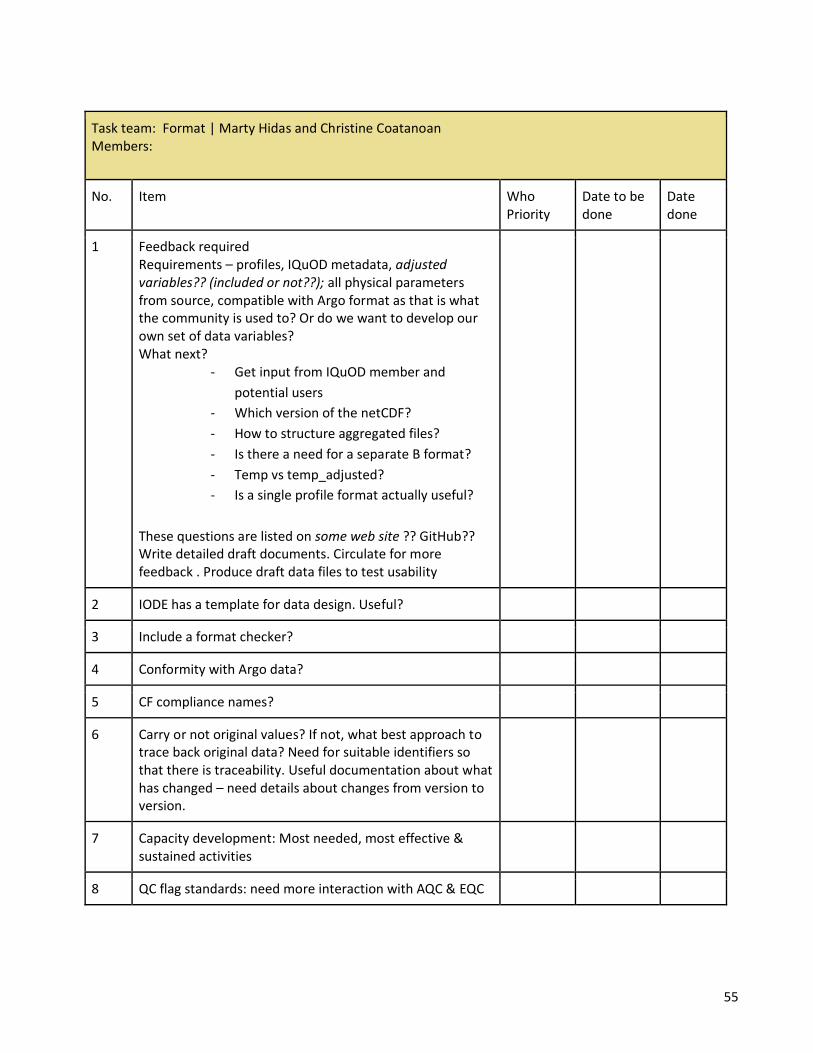
55
Task team: Format | Marty Hidas and Christine Coatanoan Members:
No. Item Who Priority
Date to be done
Date done
1 Feedback required Requirements – profiles, IQuOD metadata, adjusted variables?? (included or not??); all physical parameters from source, compatible with Argo format as that is what the community is used to? Or do we want to develop our own set of data variables? What next?
- Get input from IQuOD member and
potential users
- Which version of the netCDF?
- How to structure aggregated files?
- Is there a need for a separate B format?
- Temp vs temp_adjusted?
- Is a single profile format actually useful?
These questions are listed on some web site ?? GitHub?? Write detailed draft documents. Circulate for more feedback . Produce draft data files to test usability
2 IODE has a template for data design. Useful?
3 Include a format checker?
4 Conformity with Argo data?
5 CF compliance names?
6 Carry or not original values? If not, what best approach to trace back original data? Need for suitable identifiers so that there is traceability. Useful documentation about what has changed – need details about changes from version to version.
7 Capacity development: Most needed, most effective & sustained activities
8 QC flag standards: need more interaction with AQC & EQC
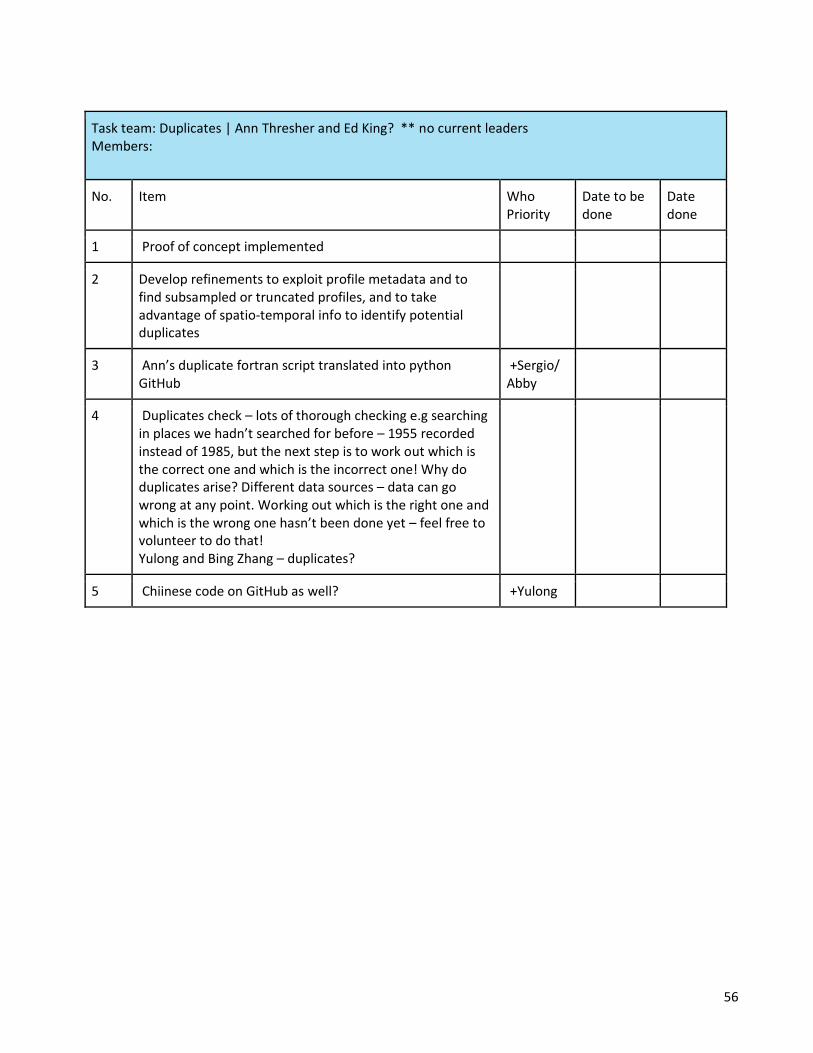
56
Task team: Duplicates | Ann Thresher and Ed King? ** no current leaders Members:
No. Item Who Priority
Date to be done
Date done
1 Proof of concept implemented
2 Develop refinements to exploit profile metadata and to find subsampled or truncated profiles, and to take advantage of spatio-temporal info to identify potential duplicates
3 Ann’s duplicate fortran script translated into python GitHub
+Sergio/ Abby
4 Duplicates check – lots of thorough checking e.g searching in places we hadn’t searched for before – 1955 recorded instead of 1985, but the next step is to work out which is the correct one and which is the incorrect one! Why do duplicates arise? Different data sources – data can go wrong at any point. Working out which is the right one and which is the wrong one hasn’t been done yet – feel free to volunteer to do that! Yulong and Bing Zhang – duplicates?
5 Chiinese code on GitHub as well? +Yulong

57
Task team: Auto QC | Simon Good and Bill Mills Members:
No. Item Who Priority
Date to be done
Date done
1 Uptake of Francis independent data for Auto QC benchmarking?
2 Alignment of flagging systems?
3 Profiles release GitHub
4 Peer-reviewed paper publication
5 Need feedback loop: Info exchange between AQC & EQC to improve AutoQC. Merge two TTs?
6 Incorporation of GLOBADAP toolbox? 2nd level Auto QC GLODAPv2. Alex Kozyr http://www.imber.info/index.php/News/Newsletters/Issue-n-27-September- 2014#toc_3_12. The Toolbox software looks for stations that are in the same area (the definition of “same area” is a variable and has to be set (normally to 2° of latitude, i.e. ~200 km) but can be changed based on knowledge of horizontal gradients in the area). The software compares the interpolated profile from each station in cruise A to each interpolated profile from cruise B within the maximum distance for a valid crossover, and a difference profile is calculated for each such pair. This process is repeated for each station in cruise A and the crossover offset and its standard deviation are calculated as the weighted mean and standard deviation of the difference profiles of each crossover pair (i.e., cruises A and B). The software performs this process for all cruises in the reference data base and displays the offsets in one figure per cruise pair. The software performs summary of all biases found for one cruise vs. all cruise in the reference data base
7 Incorporation of IMOS toolbox? Guillaume Galibert The IMOS Toolbox aims to convert oceanographic time series and profile data files into pre-processed and quality controlled (QC) IMOS compliant NetCDF files. It is written in MATLAB and Java with a graphical user interface and was developed by the Australian National Mooring
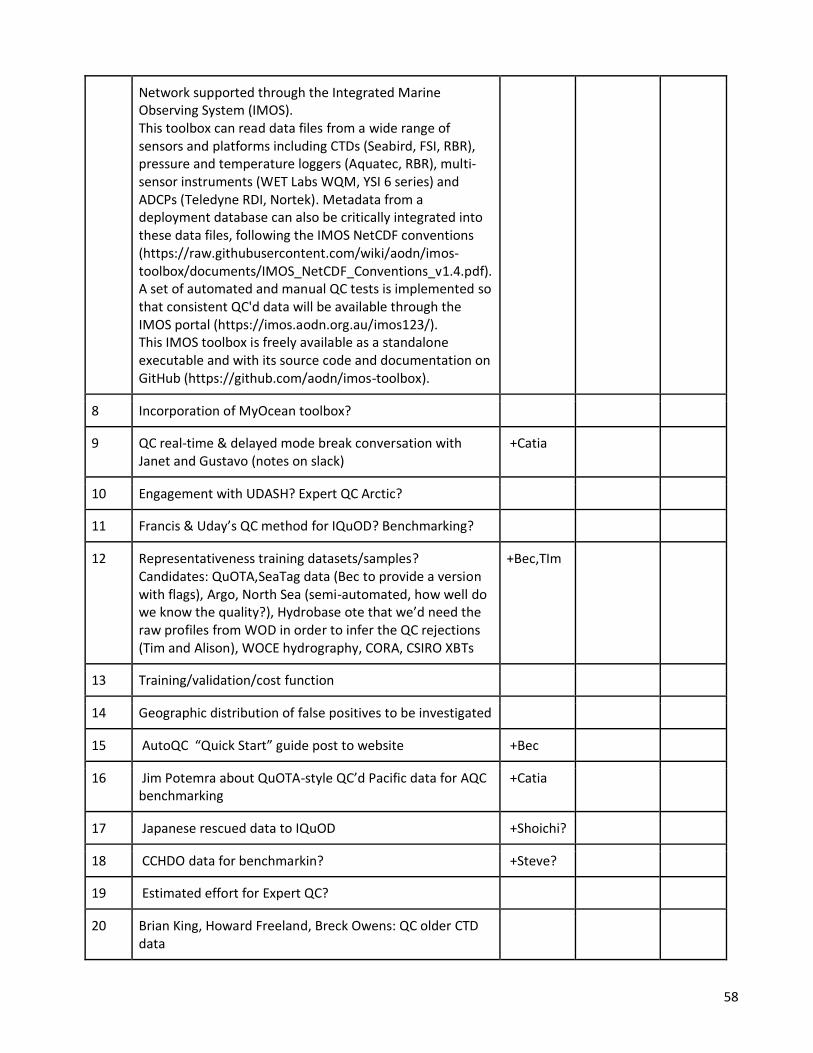
58
Network supported through the Integrated Marine Observing System (IMOS). This toolbox can read data files from a wide range of sensors and platforms including CTDs (Seabird, FSI, RBR), pressure and temperature loggers (Aquatec, RBR), multi-sensor instruments (WET Labs WQM, YSI 6 series) and ADCPs (Teledyne RDI, Nortek). Metadata from a deployment database can also be critically integrated into these data files, following the IMOS NetCDF conventions (https://raw.githubusercontent.com/wiki/aodn/imos- toolbox/documents/IMOS_NetCDF_Conventions_v1.4.pdf). A set of automated and manual QC tests is implemented so that consistent QC'd data will be available through the IMOS portal (https://imos.aodn.org.au/imos123/). This IMOS toolbox is freely available as a standalone executable and with its source code and documentation on GitHub (https://github.com/aodn/imos-toolbox).
8 Incorporation of MyOcean toolbox?
9 QC real-time & delayed mode break conversation with Janet and Gustavo (notes on slack)
+Catia
10 Engagement with UDASH? Expert QC Arctic?
11 Francis & Uday’s QC method for IQuOD? Benchmarking?
12 Representativeness training datasets/samples? Candidates: QuOTA,SeaTag data (Bec to provide a version with flags), Argo, North Sea (semi-automated, how well do we know the quality?), Hydrobase ote that we’d need the raw profiles from WOD in order to infer the QC rejections (Tim and Alison), WOCE hydrography, CORA, CSIRO XBTs
+Bec,TIm
13 Training/validation/cost function
14 Geographic distribution of false positives to be investigated
15 AutoQC “Quick Start” guide post to website +Bec
16 Jim Potemra about QuOTA-style QC’d Pacific data for AQC benchmarking
+Catia
17 Japanese rescued data to IQuOD +Shoichi?
18 CCHDO data for benchmarkin? +Steve?
19 Estimated effort for Expert QC?
20 Brian King, Howard Freeland, Breck Owens: QC older CTD data
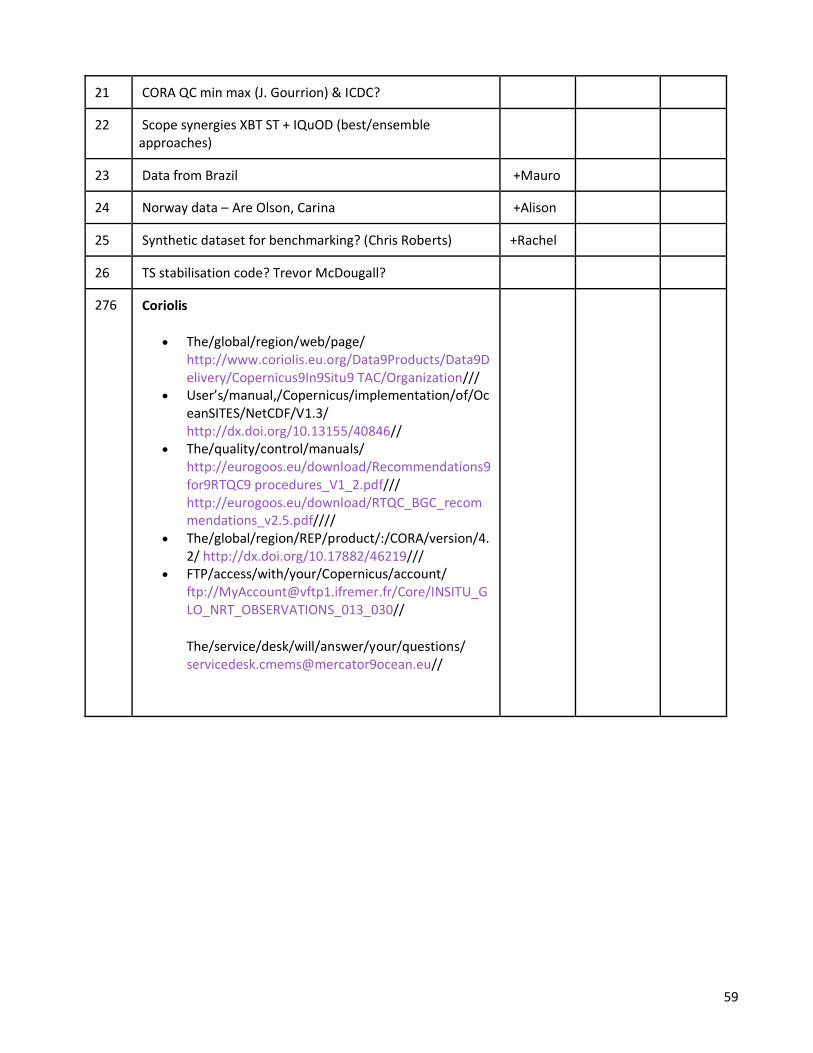
59
21 CORA QC min max (J. Gourrion) & ICDC?
22 Scope synergies XBT ST + IQuOD (best/ensemble approaches)
23 Data from Brazil +Mauro
24 Norway data – Are Olson, Carina +Alison
25 Synthetic dataset for benchmarking? (Chris Roberts) +Rachel
26 TS stabilisation code? Trevor McDougall?
276 Coriolis
• The/global/region/web/page/ http://www.coriolis.eu.org/Data9Products/Data9Delivery/Copernicus9In9Situ9 TAC/Organization///
• User’s/manual,/Copernicus/implementation/of/OceanSITES/NetCDF/V1.3/ http://dx.doi.org/10.13155/40846//
• The/quality/control/manuals/ http://eurogoos.eu/download/Recommendations9for9RTQC9 procedures_V1_2.pdf/// http://eurogoos.eu/download/RTQC_BGC_recommendations_v2.5.pdf////
• The/global/region/REP/product/:/CORA/version/4.2/ http://dx.doi.org/10.17882/46219///
• FTP/access/with/your/Copernicus/account/ ftp://[email protected]/Core/INSITU_GLO_NRT_OBSERVATIONS_013_030//
The/service/desk/will/answer/your/questions/ [email protected]//
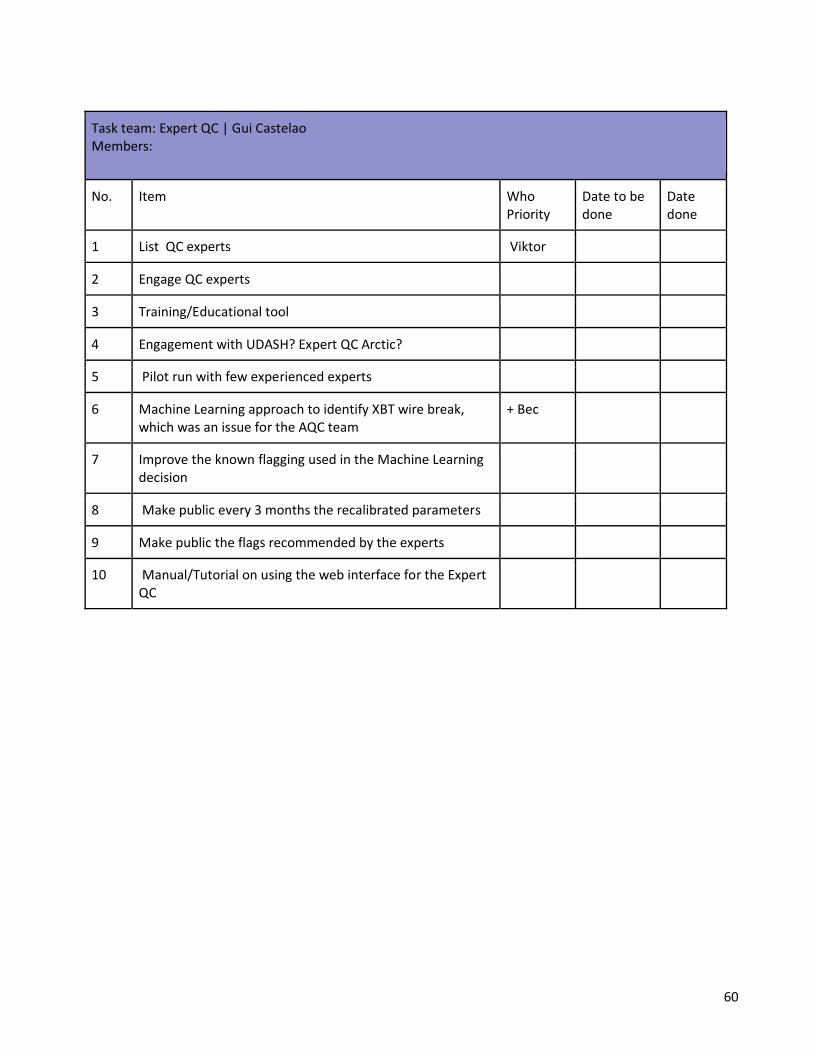
60
Task team: Expert QC | Gui Castelao Members:
No. Item Who Priority
Date to be done
Date done
1 List QC experts Viktor
2 Engage QC experts
3 Training/Educational tool
4 Engagement with UDASH? Expert QC Arctic?
5 Pilot run with few experienced experts
6 Machine Learning approach to identify XBT wire break, which was an issue for the AQC team
+ Bec
7 Improve the known flagging used in the Machine Learning decision
8 Make public every 3 months the recalibrated parameters
9 Make public the flags recommended by the experts
10 Manual/Tutorial on using the web interface for the Expert QC
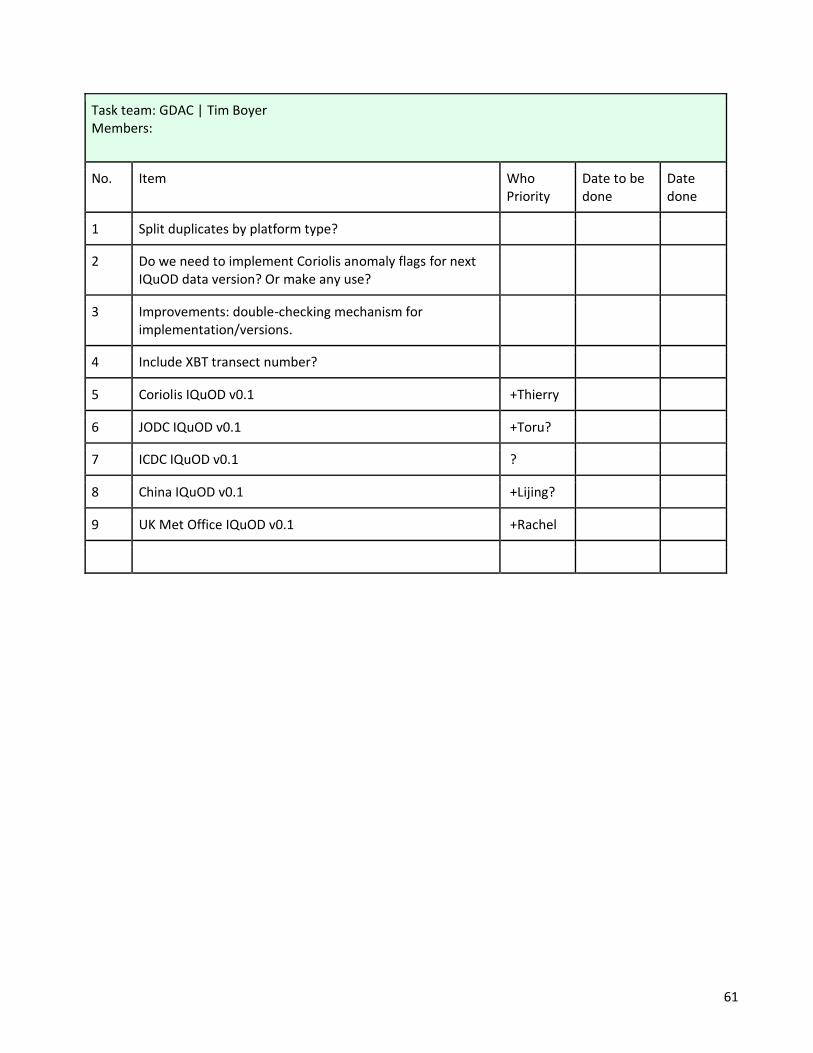
61
Task team: GDAC | Tim Boyer Members:
No. Item Who Priority
Date to be done
Date done
1 Split duplicates by platform type?
2 Do we need to implement Coriolis anomaly flags for next IQuOD data version? Or make any use?
3 Improvements: double-checking mechanism for implementation/versions.
4 Include XBT transect number?
5 Coriolis IQuOD v0.1 +Thierry
6 JODC IQuOD v0.1 +Toru?
7 ICDC IQuOD v0.1 ?
8 China IQuOD v0.1 +Lijing?
9 UK Met Office IQuOD v0.1 +Rachel

62
Task team: Performance metrics & User interface | Lijing Cheng (obs) and Mauro Cirano (reanalyses) Members:
No. Item Who Priority
Date to be done
Date done
1 Document technical details within IQuOD activity to set stage for future improvement and make sure all information traceable
2 Quantify uncertainty related to QC (eg, from WOD to IQuOD/versions) – keep track of changes
3 Work with iMeta and XBT group to find solutions for the problems, make improvements in IQuOD v1
4 Update CH14 using IQuOD product. Including other XBT corrections? Carry out perturbed experiments
5 Coordinated actions with OHC and reanalyses communities. Including feedback from users. Create users list/user requirements. Develop online survey? ESGF/ESCOG?
6 IQuOD visibility on GODAE OceanView Science Meeting & GOV Symposium 2018/2019
7 Use connections with Coriolis and Mercator Ocean to speed up process.
+Simona
8 Links with CLIVAR GSOP + Copernicus +Catia +Simona/Thierry/Christine?
9 Presentation at CLIVAR workshop (EEI)
10 Request XBT users to provide full-resolution data + metadata to IQuOD

63
Task team: Crowd-sourcing | Steve and Alison Members:
No. Item Who Priority
Date to be done
Date done
1 John Gould’s text too capture attention
2 Need to identify EQC tasks essentially independent of AutoQC work.
3 Standalone TT or together with EQC TT?
4 Crowdsourcing infracstructure: www.zooniverse.org Satisfy IQuOD needs?
+Bill, Alison
5 Crowdsource funding? Small-grants fundings? Alison, Steve
6 www.oldweather.org
7 ACRE
8 Incentive: prize cruise voyage
Task team: Funding & Sponsorship obligations Members:
No. Item Who Priority
Date to be done
Date done
1 ARC linkage cash contributions Locheed Martin ESA Jerome BoM Defence IMOS
2 Material to double check From Peter’s & Claudia’s talk IODE: Check website for E-repository for best practices and discuss with task team leaders https://www.oceanbestpractices.net Guidelines for Data management Plan:

64
https://www.iode.org/index.php?option=com_oe&task=viewDocumentRecord&docID=16859 Alignment/ranking Best Practices: Jay Pearlman IOC’s vision, Capacity development
3 Work plan IODE From: Peter Pissierssens <[email protected]> Date: Wednesday, 18 April 2018 at 5:45 am Dear Catia Due to other work I have unfortunately not been able to participate much in the workshop and I apologize for that. As you are ending the meeting tomorrow at lunch time is there anything you need from me in terms of guidance on future IODE support for IQuOD? Has any work plan been prepared for 2018-2019? As you know IODE-XXV will take place in February 2019 in Tokyo and it will be important to submit your work plan 2019-2020 at that occasion. See you Wednesday. peter
4 Sponsor/team communication - Need to report twice yearly to SCOR and IODE.
5 https://news.microsoft.com/2018/07/16/microsoft-and-national-geographic-form-ai-for-earth-innovation-grant-partnership/
New grant offering will support research and scientific discovery with AI technologies to advance agriculture, biodiversity conservation, climate change and water
Microsoft Corp. and National Geographic announced a
new partnership to advance scientific exploration and
research on critical environmental challenges with the
power of artificial intelligence (AI). The newly created $1
million AI for Earth Innovation Grant program will
provide award recipients with financial support, access
to Microsoft cloud and AI tools, inclusion in the National
Geographic Explorer community, and affiliation
with National Geographic Labs, an initiative launched by
National Geographic to accelerate transformative
change and exponential solutions to the world’s biggest
challenges by harnessing data, technology and
innovation. Individuals and organizations working at the
intersection of environmental science and computer
science can apply today

65
at https://www.nationalgeographic.org/grants/grant-
opportunities/ai-earth-innovation/.
“National Geographic is synonymous with science and
exploration, and in Microsoft we found a partner that is
well-positioned to accelerate the pace of scientific
research and new solutions to protect our natural
world,” said Jonathan Baillie, chief scientist and
executive vice president, science and exploration at the
National Geographic Society. “With today’s
announcement, we will enable outstanding explorers
seeking solutions for a sustainable future with the cloud
and AI technologies that can quickly improve the speed,
scope and scale of their work as well as support National
Geographic Labs’ activities around technology and
innovation for a planet in balance.”
“Microsoft is constantly exploring the boundaries of
what technology can do, and what it can do for people
and the world,” said Lucas Joppa, chief environmental
scientist at Microsoft. “We believe that humans and
computers, working together through AI, can change the
way that society monitors, models and manages Earth’s
natural systems. We believe this because we’ve seen it
— we’re constantly amazed by the advances our AI for
Earth collaborators have made over the past months.
Scaling this through National Geographic’s global
network will create a whole new generation of explorers
who use AI to create a more sustainable future for the
planet and everyone on it.”
The $1 million AI for Earth Innovation Grant program will
provide financial support to between five and 15 novel
projects that use AI to advance conservation research
toward a more sustainable future. The grants will
support the creation and deployment of open-sourced
trained models and algorithms that will be made broadly
available to other environmental researchers, which
offers greater potential to provide exponential impact.
Qualifying applications will focus on one or more of the
core areas: agriculture, biodiversity conservation,
climate change and water. Applications are open as of
today and must be submitted by Oct. 8, 2018. Recipients
will be announced in December 2018. Those who want
more information and to apply can
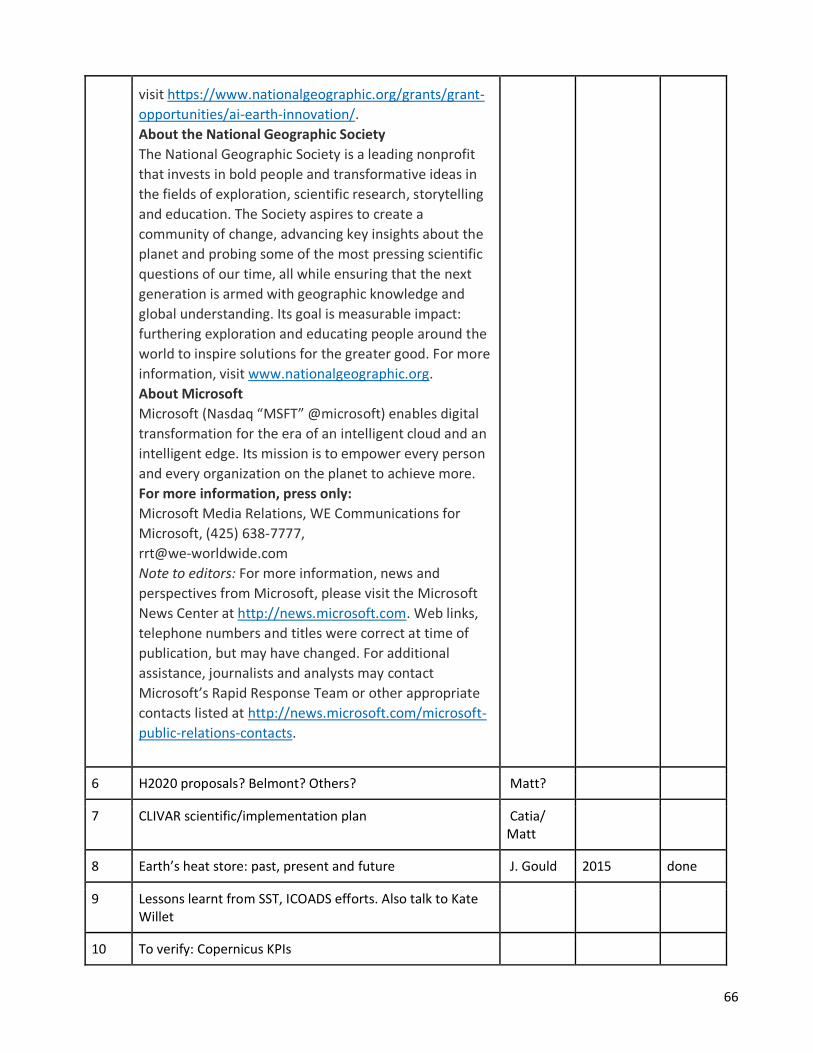
66
visit https://www.nationalgeographic.org/grants/grant-
opportunities/ai-earth-innovation/.
About the National Geographic Society
The National Geographic Society is a leading nonprofit
that invests in bold people and transformative ideas in
the fields of exploration, scientific research, storytelling
and education. The Society aspires to create a
community of change, advancing key insights about the
planet and probing some of the most pressing scientific
questions of our time, all while ensuring that the next
generation is armed with geographic knowledge and
global understanding. Its goal is measurable impact:
furthering exploration and educating people around the
world to inspire solutions for the greater good. For more
information, visit www.nationalgeographic.org.
About Microsoft
Microsoft (Nasdaq “MSFT” @microsoft) enables digital
transformation for the era of an intelligent cloud and an
intelligent edge. Its mission is to empower every person
and every organization on the planet to achieve more.
For more information, press only:
Microsoft Media Relations, WE Communications for
Microsoft, (425) 638-7777,
Note to editors: For more information, news and
perspectives from Microsoft, please visit the Microsoft
News Center at http://news.microsoft.com. Web links,
telephone numbers and titles were correct at time of
publication, but may have changed. For additional
assistance, journalists and analysts may contact
Microsoft’s Rapid Response Team or other appropriate
contacts listed at http://news.microsoft.com/microsoft-
public-relations-contacts.
6 H2020 proposals? Belmont? Others? Matt?
7 CLIVAR scientific/implementation plan Catia/ Matt
8 Earth’s heat store: past, present and future J. Gould 2015 done
9 Lessons learnt from SST, ICOADS efforts. Also talk to Kate Willet
10 To verify: Copernicus KPIs

67
11 IODE requests: https://www.iode.org/index.php?option=com_oe&task=viewDocumentRecord&docID=21195

68
7 List of participants
Event: 2018 meeting of the IODE Steering Group for the International Quality Controlled Ocean Database Dates: 2018-Apr-16 to 2018-Apr-18 Invited experts
Tim BOYER NOAA, National Oceanographic Data Centre, Silver Spring National Oceanographic Data Center NOAA/NESDIS E/OC1 SSMC3, 4th Floor 1315 East-West Highway Silver Spring MD 20910-3282 United States of America Francis BRINGAS Oceanographer / SEAS Operations National Oceanic and Atmospheric Administration, Atlantic Oceanographic and Meteorological Laboratory 4301 Rickenbacker Causeway Miami Florida 33149 United States of America Guilherme CASTELÃO CASPO UC, San Diego, Scripps Institution of Oceanography 9500 Gilman Drive Mail Code 0218 La Jolla California 92093-0218 United States of America Sergio Ignacio CASTILLO Technician CENDO Universidad Autonoma de Baja California, Instituto de Investigaciones Oceanologicas (UABC) Km 103 autopista Tijuana Ensenada Baja California 22800 Mexico Lijing CHENG Institute Of Atmospheric Physics, Chinese Academy Of Sciences, Beijing, China Qi Jia Huo Zi, De Sheng Men Wai Street, Institute Of Atmospheric Physics Beijing 100029 China
Mauro CIRANO Universidade Federal do Rio de Janeiro Departamento de Meteorologia, Instituto de Geociências Rua Athos da Silveira Ramos, 274, CCMN, Bloco G1 Cidade Universitária, Ilha do Fundão Rio de Janeiro 21941-916 Brazil Stephen DIGGS Data Manager, CLIVAR Hydrography University of San Diego, Scripps Institution of Oceanography 9500 Gilman Drive Mail Code 0214 La Jolla CA 92093 United States of America Fax: +1-801-650-8623 Catia DOMINGUES Sea level / Ocean Heat Content Scientist (Australian Research Council Future Fellow) Antarctic Climate and Ecosystems Cooperative Research Centre; ARCCSS University of Tasmania, Institute for Marine and Antarctic Studies CSIRO Marine and Atmospheric Research Private Bag 1 Aspendale Victoria 3195 Australia Marlos GOES Assistant Scientist CIMAS National Oceanic and Atmospheric Administration, Atlantic Oceanographic and Meteorological Laboratory 4301 Rickenbacker Causeway Miami Florida FL 33149 United States of America Gustavo J. GONI Oceanographer National Oceanic and Atmospheric Administration, Atlantic Oceanographic and Meteorological Laboratories; OAR Physical Oceanography Division USDC/NOAA/AOML/PHOD 4301 Rickenbacker Causeway Miami FL 33149 United States of America Fax: +1 305-361-4412
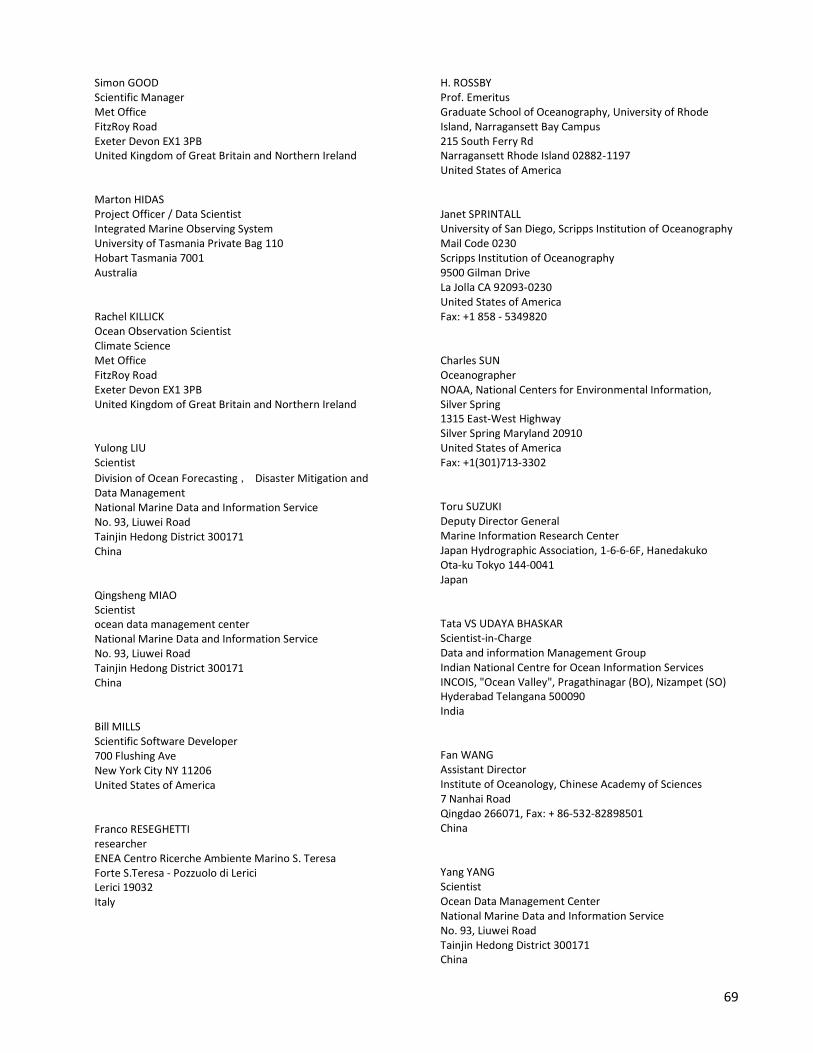
69
Simon GOOD Scientific Manager Met Office FitzRoy Road Exeter Devon EX1 3PB United Kingdom of Great Britain and Northern Ireland Marton HIDAS Project Officer / Data Scientist Integrated Marine Observing System University of Tasmania Private Bag 110 Hobart Tasmania 7001 Australia Rachel KILLICK Ocean Observation Scientist Climate Science Met Office FitzRoy Road Exeter Devon EX1 3PB United Kingdom of Great Britain and Northern Ireland Yulong LIU Scientist
Division of Ocean Forecasting , Disaster Mitigation and Data Management National Marine Data and Information Service No. 93, Liuwei Road Tainjin Hedong District 300171 China Qingsheng MIAO Scientist ocean data management center National Marine Data and Information Service No. 93, Liuwei Road Tainjin Hedong District 300171 China Bill MILLS Scientific Software Developer 700 Flushing Ave New York City NY 11206 United States of America Franco RESEGHETTI researcher ENEA Centro Ricerche Ambiente Marino S. Teresa Forte S.Teresa - Pozzuolo di Lerici Lerici 19032 Italy
H. ROSSBY Prof. Emeritus Graduate School of Oceanography, University of Rhode Island, Narragansett Bay Campus 215 South Ferry Rd Narragansett Rhode Island 02882-1197 United States of America Janet SPRINTALL University of San Diego, Scripps Institution of Oceanography Mail Code 0230 Scripps Institution of Oceanography 9500 Gilman Drive La Jolla CA 92093-0230 United States of America Fax: +1 858 - 5349820 Charles SUN Oceanographer NOAA, National Centers for Environmental Information, Silver Spring 1315 East-West Highway Silver Spring Maryland 20910 United States of America Fax: +1(301)713-3302 Toru SUZUKI Deputy Director General Marine Information Research Center Japan Hydrographic Association, 1-6-6-6F, Hanedakuko Ota-ku Tokyo 144-0041 Japan Tata VS UDAYA BHASKAR Scientist-in-Charge Data and information Management Group Indian National Centre for Ocean Information Services INCOIS, "Ocean Valley", Pragathinagar (BO), Nizampet (SO) Hyderabad Telangana 500090 India Fan WANG Assistant Director Institute of Oceanology, Chinese Academy of Sciences 7 Nanhai Road Qingdao 266071, Fax: + 86-532-82898501 China Yang YANG Scientist Ocean Data Management Center National Marine Data and Information Service No. 93, Liuwei Road Tainjin Hedong District 300171 China

70
Bin ZHANG Marine Science Data Center Institute of Oceanology Chinese Academy of Sciences, Qingdao 7 Nanhai Road Qingdao Shandong 266071 China Rongwang ZHANG Postdoc LTO South China Sea Institute of Oceanology, Chinese Academy of Sciences P.O.Box: 510301 Guangzhou 510000 China Remote (Webex) Rebecca COWLEY Data Analyst/Scientific Programmer CSIRO Oceans and Atmosphere (Hobart) GPO Box 1538 Hobart TAS 7001 Australia Matteo GUIDERI Physical Oceanographer Marine Geophysics and Oceanography Department Istituto Idrografico della Marina Passo Osservatorio, 4 Genova Liguria 16134 Italy Shoichi KIZU Associate Professor Physical Oceanography Laboratory, Department of Geophysics, Graduate School of Science, Tohoku University 980-8578 Sendai, Sendai 980-8578 Japan Fax: +81-22-795-6530 Simona SIMONCELLI Researcher Group Operational Oceanography Instituto Nazionale di Geofisica e Vulcanologia, Sezione di Bologna via Franceschini 31 Bologna Italy 40128 Italy
Luca REPETTI Capo Ufficio Piani e Sviluppo Scientifico Reparto Geofisica Marina e Oceanografia Istituto Idrografico della Marina Matthew PALMER Met Office, UK Co-chair of IQuOD Steering Team IOC/IODE Secretariat Cláudia DELGADO OTGA Project Manager, IODE Training Coordinator UNESCO / IOC Project Office for IODE Wandelaarkaai 7 Oostende 8400 Belgium Peter PISSIERSSENS Head, IOC Project Office for IODE, Oostende, Belgium and IOC capacity development coordinator UNESCO / IOC Project Office for IODE Wandelaarkaai 7 Oostende 8400 Belgium


![Data Driven - Using Market Intelligence to Procure Ocean ... - Transporeon... · [03:48] We have the largest cloud-based database of ocean freight rates in the world. Contracted ocean](https://img.dokumen.tips/doc/110x75/5ecfe32b4bed7c18ca75853c/data-driven-using-market-intelligence-to-procure-ocean-transporeon.jpg)