Embed Size (px)
Citation preview

CANADIAN COST GUIDE2018
Canadian Cost Guide 20181
ABOUT THIS GUIDE
Altus Group’s annual Construction Cost Guide is the Canadian real estate industry’s leading guide to development project costing. It is trusted as a budgeting tool by public bodies, developers, lenders, contractors, consultants and various industry professionals.
The guide is founded upon Altus Group’s proprietary database of project costs, which includes project data from over 1,400 Canadian Cost and Project Management engagements in 2017 alone. Drawing upon this comprehensive catalogue, our industry leading experts have analyzed the information and provided a succinct and user-friendly summary of the findings for each major market across the country.
While using our Cost Guide helps develop a rough preliminary project financial plan, we strongly recommend you seek professional expert advice to provide a more precise, project specific estimate and pro forma.
2018 Canadian Economic Overview
Key Market Trends
Notes on Correct Use of Data
Measurement and Application of $/SF: Sample Analysis
Data Tables for the Public and Private Sectors across Western and Eastern Canada
Canadian Cost Index
Building Type Descriptions
About our Cost and Project Management Group
Get Comprehensive Insight into Your Real Estate Construction and Development Costs
Within this year’s Cost Guide, you will find:VANCOUVER
CALGARY
EDMONTON
WINNIPEG
GTA
OTTAWA/GATINEAU
MONTREAL
HALIFAX
ST. JOHN’S

altusgroup.com 2
New Homes
220,000
Residential Renovation Projects
$72 billion
New ICI Construction
280 million sq.ft.
QUICK STATS – CANADA
2018 CANADIAN ECONOMIC OVERVIEW
2018 started with significant tailwinds from remarkable employment and economic growth last year. Almost 425,000 net new jobs were created in 2017 – a 15-year high – and the economy advanced just over 3% which is also among the fastest growing years since the recession a decade ago.
While modestly higher interest rates and looming uncertainties, such as the outcome of NAFTA negotiations, may mean economic headwinds for 2018, the recent surge in job creation, coupled with historically-high immigration will most certainly have a positive effect on consumer confidence, housing demand and absorption rates in commercial real estate.
The Canadian economy is remarkable. It topped $2 trillion in size last year, supports a population of over 35 million people and has a remarkably sustainable construction sector that will likely start some 220,000 new homes this year, work on over $72 billion in residential renovation projects and initiate some 280 million square feet of new ICI construction.
For more information contact our Economic Advisory team at 416-641-9500 or [email protected].
Sources: Stats Canada, Canada Mortgage
and Housing Canada (CMHC)
425,000 Net New Jobs (2017)

Canadian Cost Guide 20183
The real estate market’s performance in 2017 was
strongly influenced by the new homes market with
the two most active markets - Toronto and Vancouver -
experiencing very strong consumer demand for
apartment condominiums, and developer demand
for residential land. Buoyant residential land sales shot
total commercial property investment to record levels
in these two markets.
Looking forward into 2018, home buying intentions remain positive and relatively strong housing demand is expected to continue to impact both the residential land and new homes markets; although some cooling is expected due to affordability challenges and tighter mortgage lending rules. Solid economic growth should continue to drive interest in commercial property investment, with property investment in office, industrial, and retail spaces expected to continue to remain strong.
We have sampled several key metrics* from across the Canadian market to provide you with an overview of some of the key trends.
Our analysis is based on market trends up to the end of Q3 2017.
KEY MARKET TRENDS
New Condominium Apartment SalesSales of new condominium apartment units. Q3, 2017
GTA CalgaryMarket Area
EdmontonMarket Area
VancouverMarket Area
GGH**
27,153
1,532 1,0119,231
2,462

altusgroup.com 4
$7
$6
$5
$4
$3
$2
$1
$Billion
Greater TorontoArea (GTA)
OttawaMarket
Area
CalgaryMarket
Area
EdmontonMarket
Area
VancouverMarket
Area
GreaterGolden
Horseshoe(GGH)**
(2.2)
Residential Land Sales
Improved Property Sales
$20
$18
$16
$14
$12
$10
$8
$6
$4
$2
0Vancouver Edmonton Calgary GTA Ottawa Montreal Quebec
CityHalifax
Bar represents Average
Office Leasing RatesMarket net effective rate for suburban class A office space
KEY MARKET TRENDS
Improved Property and Residential Land SalesTotal transaction volumes for residential land and improved properties by market.
Canadian Cost Guide 20185
$2,500
$2,000
$1,500
$1,000
$500
Vancouver Edmonton Calgary GTA GGH
Bar represents Average
$250
$200
$150
$100
$50
Vancouver Edmonton Calgary GTA Ottawa
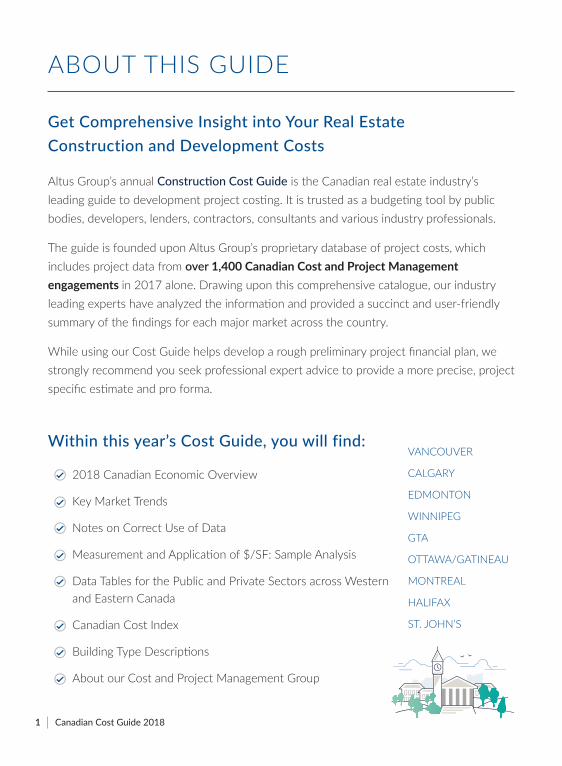
$/Square Foot Buildable Land PricesApproximate dollar per square foot ranges for land as a function of buildable area for high density residential development.
KEY MARKET TRENDS
$/Square Foot for Condominium ApartmentsThe approximate dollar per square foot sale price range for new condominium apartments.
altusgroup.com 6
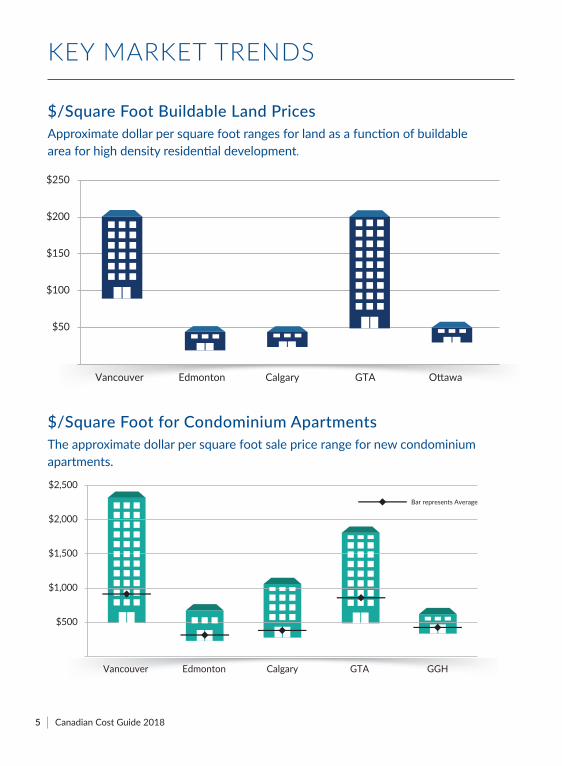
Arrows indicate directional movement from previous survey.Movement is defined as a change of more than 0.10 and due to rounding some arrows may not reflect actual movement.
Vancouver
3.0%
4.0%
5.0%
6.0%
7.0%
8.0%
Edmonton Calgary Toronto Ottawa Montreal QuebecCity
Halifax
Downtown Class “AA” Office Tier 1 Regional MallSingle-Tenant Industrial Surburban Multi-Family
4.1
3.9
4.7
4.7
4.6
3.5
5.1
4.6
5.6
4.6
5.3
4.7
6.3
4.7
6.1
5.1
6.6
5.1
6.4
5.6
6.4
5.5
4.3
4.0
4.8
3.9
6.0 6.
0
5.7
5.8
5.2
4.9
Overall Capitalization Rates
KEY MARKET TRENDS
Notes:
*The above data is based as of end of Q3, 2017
**GGH data does not include GTA numbers.
***Improved properties such as office buildings, retail centres, and industrial buildings
Source: altusgroup.com/datasolutions
About Our Data
Our Data Solutions group connects the Canadian real estate industry through the delivery of data with unparalleled breadth, integrity and relevance. Our national data platform provides you with the key benchmark metrics to assess development potential, understand market trends, and run project analysis.
For more information on our data products, contact us at [email protected]

Canadian Cost Guide 20187
1. Guide OnlyThe construction cost data contained herein is of a general nature only and subject to confirmation with respect to specific circumstances.
The unit rates for the building types described are an average range exclusively for that particular type of building. The unit rates assume that a level, open site exists with no restrictions from adjoining properties. It is assumed that stable soil conditions prevail. Average-quality finishes (unless otherwise stated), both to the exterior and interior, are also assumed.
Judgment factors must be applied within the average range to allow for:• Quality • Type of contract• Location • Extent of site works• Building shape, size and height • Design method• Topography and soil conditions • User requirements• Schedule • Procurement advantage of • Site restrictions developer/contractor• Market conditions
2. Construction Cost EscalationAn “escalation allowance” is a contingency (usually a percentage) added to the estimated construction estimate to allow for inflation in labour and material costs between the date of the estimate and the contract award. As the project moves closer to the onsite start date, the contingency reduces, reflecting the reduced risk of escalating costs.
NOTES ON CORRECT USE OF DATA

altusgroup.com 8
As we prepared the 2018 Cost Guide, US economic policies on NAFTA and interest rates continued in their uncertainty. The undetermined outcome of the trade implications of Brexit also continue to be at play. In these changing market conditions, it is imperative to have a detailed construction estimate prepared in order to capture prevailing market conditions at that time and obtain an accurate projection of your project construction costs.
3. Construction Costs OnlyThe unit costs outlined herein cover construction costs only. In all commercial developments, the project budget must also include development or “soft” costs. These would include some or all of the following:
• Land and related costs • Tenant incentives• Architectural and engineering fees • Permits and development charges• Government registered programs • Purchaser upgrades• Insurance and bond costs • Appraisals• Legal fees • Soil and environmental tests• Special design consultants • Land surveys• Special equipment and furnishings • Property taxes• Management costs • Broker commissions• Site services outside the property • Contingencies• Interest charges and lenders’ fees • Rezoning costs• Marketing and advertising • Other municipal fees• Levies • Developer profit
CANADIAN COST GUIDE2018
CANADIAN COST GUIDE2018

Canadian Cost Guide 20189
4. Correct Measurement & Use of Square Foot
In preparing a “cost per square foot” guide, we must outline how we define the area used as the denominator to calculate this value. We have adopted the Canadian Institute of Quantity Surveyors’ definition, which dictates:
1. Measure each floor to the outer face of the external walls;2. No deductions for openings at stairs, elevators or vertical ducts are made;3. A deduction is made for a non-service vertical protrusion, e.g., atrium space;4. Mezzanine floors are generally included;5. Balconies are excluded; enclosed solariums in residential condominiums are included;6. Sloping and stepped floors (auditoriums/movie theatres) are measured flat; and,7. Exclude all external covered walkways.
For building types that usually have underground parking (condominiums, offices and hotels) allow for an underground parking component of 30%. Rates for buildings where parking is not common (schools, hospitals and retail) will need parking costs added, based on the “parking garage rate” in the Guide.
For an example of how to use cost per square foot data, see page 10.
5. Federal & Provincial Sales Taxes
The unit costs provided exclude Goods & Services Tax (GST) and Harmonized Sales Tax (HST), but include Provincial Sales Tax (PST) where applicable at the time of the release of this Guide.
NOTES ON CORRECT USE OF DATA, CONTINUED
altusgroup.com 10
Total
Constructi on Area
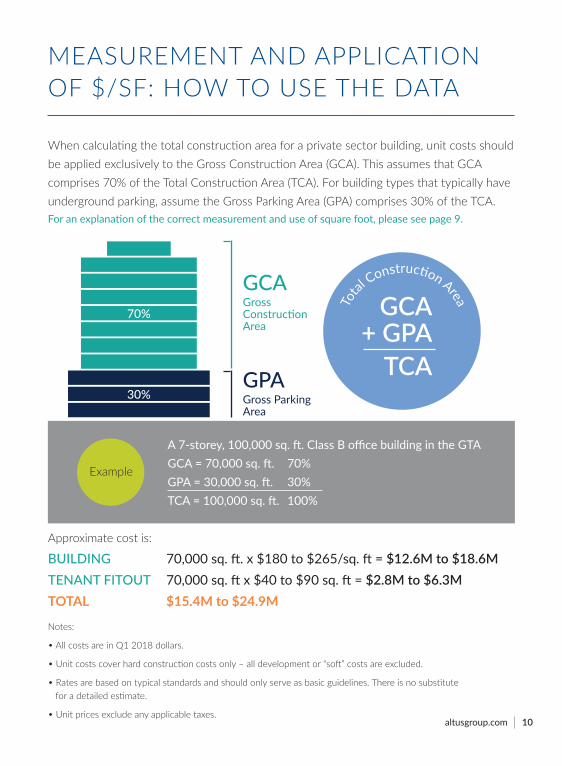
MEASUREMENT AND APPLICATION OF $/SF: HOW TO USE THE DATA
A 7-storey, 100,000 sq. ft. Class B office building in the GTAGCA = 70,000 sq. ft. 70%GPA = 30,000 sq. ft. 30%TCA = 100,000 sq. ft. 100%
Approximate cost is:
BUILDING 70,000 sq. ft. x $180 to $265/sq. ft = $12.6M to $18.6MTENANT FITOUT 70,000 sq. ft x $40 to $90 sq. ft = $2.8M to $6.3MTOTAL $15.4M to $24.9M
Notes:
• All costs are in Q1 2018 dollars.
• Unit costs cover hard construction costs only – all development or “soft” costs are excluded.
• Rates are based on typical standards and should only serve as basic guidelines. There is no substitute for a detailed estimate.
• Unit prices exclude any applicable taxes.
When calculating the total construction area for a private sector building, unit costs should be applied exclusively to the Gross Construction Area (GCA). This assumes that GCA comprises 70% of the Total Construction Area (TCA). For building types that typically have underground parking, assume the Gross Parking Area (GPA) comprises 30% of the TCA. For an explanation of the correct measurement and use of square foot, please see page 9.
GCA+ GPA
TCA30%
70%
GCAGross Construction Area
GPAGross Parking Area
Example

PRIVATE SECTOR: WESTERN CANADA EASTERN CANADA
195215215235275
75
100110135145155400
95
170200240
175180210280
4080
105145135200
145225235
85
57095
7075
525445260
265280290310330200
155210175195205900150
270285320
24526531539090150
170200190280
185285300140
15105170
100951,000705340
BUILDING TYPE $/Sq. Ft. Vancouver Calgary Edmonton Winnipeg GTA Montreal Halifax St. John’s
IND
UST
RIA
LCO
MM
ERCI
AL
RESI
DEN
TIA
L
CONDOMINIUMS/APARTMENTS Up to 6 Storeys (Hybrid Construction)(Includes Underground Parking) Up to 12 Storeys 13-39 Storeys 40-60 Storeys 60+ Storeys Premium for High Quality WOOD-FRAMED RESIDENTIAL Row Townhouse with Un�nished Basement Single-Family Residential with Un�nished Basement 3-Storey Stacked Townhouse Up to 4-Storey Wood-Framed Condo 5 to 6-Storey Wood-Framed Condo Custom-Built Single-Family Residential Additional Cost for One Level Underground Parking SENIORS’ HOUSING Independent / Supportive Living Residences Assisted Living Residences Complex Care Residences OFFICE BUILDINGS Under 5 Storeys with Surface Parking (Class B)(Over 5 Storeys incl. Underground Parking) 5 - 30 Storeys (Class B) 5 - 30 Storeys (Class A) 31 - 60 Storeys (Class A) Interior Fitout (Class B) Interior Fitout (Class A) RETAIL Strip Plaza Supermarket Big Box Store Enclosed Mall HOTELS Budget Suite Hotel 4-Star Full-Service Premium for Luxury PARKING Surface Parking Parking Garages - Free-Standing (Above-Grade) Parking Garages - Underground INDUSTRIAL FACILITIES Warehouse Urban Storage Facility Data Centre - Tier III Pharmaceutical Lab Manufacturing Facility
11 | Canadian Cost Guide 2018 altusgroup.com
290315325350370200
1852302152252501,000130
280305340
265285340390105160
155220220300
225300340160
25125145
130130925735370
220250265270320
80
120130160165190400
85
190220260
200250270295
40100
105170160215
175255260
85
590
100
8580
560530285
------
-------
---
------
----
----
---
-----
220265285305n/a160
140150160170180850120
250260295
21026528036085130
145200200270
190280285140
1590135
105105900600315
185220230245n/a60
110115135145150400
80
160185220
175175220265
3575
100150150200
150220235
90
57080
8070
460390230
------
-------
---
------
----
----
---
-----
220265295305n/a160
140155165175180850125
255265310
22027029038085130
150205205280
200285290140
1595135
110110925610330
185220235250n/a60
115120140150155400
85
165190225
175175220265
3575
105160160205
155225240
90
57585
8070
460390235
------
-------
---
------
----
----
---
-----
225270295315n/a165
140155160175190850130
255265300
21527528537090130
150205205275
195285295140
1595130
115115915595320
190225235250n/a65
110115130150150405
90
165190225
180180225275
3575
105150155205
155225245
95
57580
8570
470400240
------
-------
---
------
----
----
---
-----
------
-------
---
------
----
----
---
-----
190200205n/an/a55
110110140150150420
95
160190230
180190210n/a4080
115150145195
150200225
85
575
105
8085
510420255
235255275n/an/a160
150180170185185870130
245250295
225245260n/a85135
160180170245
195260285140
1595150
100105880635330
215245280295n/a170
140160160170n/a700135
240255280
21024528037090145
160170170250
195255275140
1590130
95n/a865625320
235250260n/an/a170
135150165160170600120
235250290
210240260n/a85135
150190175255
20026528095
15115150
130n/an/an/a325
------
-------
---
------
----
----
---
-----
170185200220n/a65
10095
115115n/a350
80
150180220
155165195255
4080
95120115185
135195205
85
55575
60n/a495410240
------
-------
---
------
----
----
---
-----
180195200n/an/a65
9590
115125125300
90
155175215
165175195n/a3575
100125135185
160200220
60
595
100
100n/an/an/a250
------
-------
---
------
----
----
---
-----
235255n/an/an/a170
145150170170175600140
240255295
220230260n/a85135
160180180245
19027028595
15130155
125n/an/an/a325
175195n/an/an/a60
110115135125125285115
170180215
170185215n/a3575
110135135190
150205230
65
5100125
95n/an/an/a250
------
-------
---
------
----
----
---
-----
Ottawa/Gatineau

PUBLIC SECTOR: WESTERN CANADA EASTERN CANADA
PRIVATE & PUBLIC SECTOR: WESTERN CANADA EASTERN CANADA
170195195350470170
550290
315575245
235270275400230325195275
195365210450395370
225265315500680265
745420
395730330
315325340550315430260425
255470315750650550
Vancouver Calgary Edmonton Winnipeg GTA Ottawa/Gatineau Montreal Halifax St. John’s
SITE
SER
VICI
NG
CIVI
CIN
STIT
UTI
ON
AL
EDUCATIONAL BUILDINGS Elementary School Secondary School Private School Universities & Colleges - Teaching, Lecture Hall Bldg. Universities & Colleges - Laboratories (Level 1 and 2) Universities & Colleges - Student Residence HEALTH CARE General Hospital/Acute Care Medical Clinic/Treatment Centre TRANSPORTATION BUILDINGS Regional Airport Terminal International Airport Terminal Bus Terminal/Garage GOVERNMENT BUILDINGS Fire/EMS Station Police Station - Local Detachment Police Station - Regional Headquarters Court House Operations Centre Penitentiary Municipal O�ce Library RECREATION/ENTERTAINMENT Ice ArenaBUILDINGS Community Aquatic Facility Multi-Use Recreational Centre Casino Facility Performing Arts Building Museum/Gallery
SITE SERVICING Local Roads - 8m road width (per metre) Arterial Roads - 9m road width (per metre) Arterial Roads - 12m road width (per metre) Private Roads - 6m road width (per metre) Residential Row Townhouses (per unit) Industrial (per acre) Commercial (per acre)
12 | Canadian Cost Guide 2018 altusgroup.com
250285350495625330
815480
410820350
450350475525475410275425
350465390600565590
210230225375490210
600330
315650275
315290330400325345215300
240380260360450425
------
--
---
--------
------
------
--
---
--------
------
------
--
---
--------
------
240270305410585265
675405
360715290
360275345450345400315380
250380285585525500
175210190305475195
495270
290540235
250240280350250340245310
185300220355415360
250285320425615280
710425
380750300
370290355470355420325400
255400300615550525
180215195310485200
495270
295550240
255245285360255350250315
190305225360420360
245275310415600275
695415
370730290
360285350460350410320390
255390295600535515
185220200320500205
510275
300565245
260250290370265360255325
195310230370430370
------
--
---
--------
------
------
--
---
--------
------
------
--
---
--------
------
------
--
---
--------
------
------
--
---
--------
------
------
--
---
--------
------
3,2003,3004,1002,500
20,500138,000187,000
3,9004,5004,9003,30030,500212,000313,000
3,3003,9004,2002,60026,000210,000230,000
2,6002,8003,6002,300
18,500125,000150,000
-------
-------
-------
3,3004,0004,4002,80027,000185,100270,400
2,5002,7003,4002,100
18,200114,100152,500
3,5004,2004,6002,90028,400194,300284,000
2,6002,8003,7002,200
19,100119,800160,100
3,4004,1004,5002,90027,700189,700277,200
2,6002,8003,5002,200
18,700117,000156,300
-------
-------
-------
3,0003,1004,0002,400
22,000134,000183,000
3,9004,4004,8003,20030,000208,000310,000
-------
2,8003,0003,8002,300
19,500125,000168,000
3,6004,3004,7003,00028,100192,500281,000
-------
2,8003,0004,0002,400
18,200116,200161,600
3,6004,0004,7002,90025,800185,400257,500
-------
3,1003,2004,1002,500
22,000140,000180,000
3,8004,2004,6003,00030,000200,000280,000
190220235300450175
545290
275550240
235260275370260315220280
170320240440390380
225255290400600230
720410
350690320
310330345455325410275350
220400320700500490
195220290395560245
720410
330655290
295305325450285370255360
255410285660495485
275300350365500260
750450
375710320
315335350450365525260350
240430310575490490
160175180305435165
495275
255535230
230255255355230295185230
160305205400375360
230265295295385185
540305
290565245
250285295365245380195235
190340200365380355
285315350375575260
720475
400700320
380375400475385525280350
265430310n/a490490
240275295300415185
530315
290575245
290285300375285425210250
180340200n/a385350
BUILDING TYPE $/Sq. Ft.
Vancouver Calgary Edmonton Winnipeg GTA Montreal Halifax St. John’sBUILDING TYPE $/Sq. Ft. Ottawa/Gatineau

British Columbia (Indexed to Vancouver)
1. Victoria 1082. Vancouver 1003. Whistler 1154. Southern Interior 955. Northern Interior 115
Western/Prairies (Indexed to Calgary)
1. Calgary 1002. Edmonton (see data table) NA3. Regina/Saskatoon 1024. Winnipeg (see data table) NA
Ontario (Indexed to GTA)
1. Southwestern Ontario: Windsor 110 London 98 Tri-City (Cambridge, Kitchener, Waterloo) 992. Hamilton and Surrounding Areas 104
3. Niagara Peninsula 1044. Barrie 1055. Toronto: Downtown Core 115 GTA 1006. Eastern (Kingston, Cornwall) 1107. Ottawa (see data table) NA8. North (Sudbury, Thunder Bay, TransCanada Corridor) 115
Quebec (Indexed to Montreal
1. Montreal 1002. Quebec City 98
Atlantic/Maritimes (Indexed to Halifax)
1. Halifax 1002. St. John’s, Newfoundland (see data table) NA
Territories (Indexed to GTA)
1. Yellowknife 1702. Iqaluit 2403. Remote Communities 275
ALTUS GROUP CANADIAN COST INDEX
13 Canadian Cost Guide 2018

altusgroup.com 14
General NotesAll costs exclude site development and premiums associated with signature architecture.
Residential
Condominiums/Apartments Assume cast-in-place concrete structure for all condos unless otherwise noted. Hybrid construction could include any combination of alternate building structures, such as precast concrete and light gauge steel. The premium for high-quality finishes should be applied to any of the condominium/apartment categories.
Wood-Framed Residential The floor area of the unfinished basement and garage should be excluded from the area used with the unit rate provided. Parking is excluded from all unit rates; however, the additional cost for one level of underground parking below the wood-framed condos is noted.
Seniors’ Housing Costs can fluctuate, depending on whether the facility is operated for a profit or is community based, the level of care, and the services provided to residents.
Commercial
Office Buildings The costs assume base building construction only, including mechanical and electrical services, washrooms, and finishing of ground floor entrance lobby and elevator lobbies to upper floors. The cost of tenant partitioning and finishes, with the
2018 COST GUIDE BUILDING TYPE DESCRIPTIONS
PRIVATE SECTOR

Canadian Cost Guide 201815
exception of ceiling and column finishes, are excluded. The cost of finishing this space can fluctuate depending on the density of partitioning and the quality of finishes. Costs assume standalone buildings and are not representative of a component within a mixed-use building.
Retail The costs given assume single-storey buildings with the exception of enclosed malls. The cost of providing parking facilities is excluded from the unit costs provided. The CRU space is considered shell. The public space is finished. Costs assume standalone buildings and are not representative of a component within a mixed-use building.
Hotels The costs exclude any allowance for FF&E, as each operator has its own definition. The cost for a budget hotel assumes no restaurant or bar facilities and minimal meeting/conference areas. Suite hotels assume a kitchenette. The costs of four-star full-service hotels include dining and conference facilities and special-use lounges. Premium for luxury should only be applied to the four-star full service hotel.
Parking On-grade parking assumes an asphalt paved surface lot, including necessary curbs, line painting, storm servicing and pole lighting. Above-grade parking assumes open air structure. Below-grade parking assumes that temporary support to the excavated sides of the proposed garage is required, and that there are no extraordinary conditions (water, contaminated soil, close proximity to underground services, etc.). Extra deep parking garages (7+ levels) and garages with site restrictions should be assessed on an individual basis. The “efficiency” of garages (parking area/stall) is also an important cost variable.
Industrial
Industrial Facilities Warehouse space is based on heated shell space, excluding mezzanine areas. A finished office component is included.
Urban storage facilities are based on multi-level facilities, which have site constraints.
2018 COST GUIDE BUILDING TYPE DESCRIPTIONS, CONTINUED
altusgroup.com 16
PUBLIC SECTOR
Data Centres are based on suburban sites, and include access flooring and redundant heating and cooling systems. Active hardware is excluded.
Pharmaceutical laboratory costs would vary depending on the level of testing and manufacturing involved. FF&E is excluded from the unit costs.
Manufacturing facilities are based on open spaces with high structures to allow space for equipment. FF&E costs are excluded.
Institutional
Educational Buildings The costs given exclude any allowance for FF&E.
Health Care With more than 40 subcategories of space types available in hospitals, the mix of costs fluctuate depending on the type of facility being constructed, the mix of beds, clinics and surgeries, as well as the building configuration. Parking and FF&E are excluded.
Civic
Transportation Buildings Regional airport terminals are typically single-storey facilities that have smaller gate and circulation capacity for local domestic flights and minimal amenities. International airport terminals are multilevel facilities with extensive amenity space for restaurants, retail stores, and have larger circulation space and gate capacity. Also included are spaces for customs
2018 COST GUIDE BUILDING TYPE DESCRIPTIONS, CONTINUED
Canadian Cost Guide 201817
and immigration control. Costs for surface and/or parking garages, airside infrastructure, and equipment are excluded.
Bus garages are slab on grade, single-storey, long span steel structures which include vehicle maintenance facilities and a small administration area. FF&E including vehicle lifts are excluded. All buildings are based on suburban facilities with no site constraints. Any associated site work and parking are excluded from the unit costs. Costs assume a design standard equivalent to LEED Silver. Premiums associated with actual certification or Gold/Platinum are excluded.
Government Buildings Fire/EMS Stations exclude any costs associated with training buildings.
Local police detachments would include offices and facilities for police and civilian members with minimal interview rooms and holding cells. Regional police headquarters would include all the same plus additional interview rooms, holding cells, training space, and administration.
Courthouses include judicial chambers, administration offices, holding cells, and courtrooms.
Operations Centre costs are based on the main facility only, including maintenance, storage, and administration areas. Any outbuildings would be an additional cost.
The range of costs for penitentiaries would vary based on the level of security and size of facility.
Municipal offices would include administration space for all municipal departments, meeting, conference rooms, council chambers, cafeteria, daycare facility, and significant atrium space.
Library costs would vary depending on the size and if they are stand alone or part of a multi-use facility.
Recreation/Entertainment Buildings Ice arenas would include single pad to four pad facilities with spectator seating; unit costs are based on steel structures.
Community aquatic facilities include single or multiple pools, minimal spectator seating, change room facilities and fitness areas; unit costs are based on conventionally framed
2018 COST GUIDE BUILDING TYPE DESCRIPTIONS, CONTINUED
altusgroup.com 18
structures for the majority of the building, and glulam wood structure for the pool area.
Multi-use recreation centres could include any combination of fitness, gymnasium, daycare, community room, and administration space. Facilities with arena, pool, and multi-purpose areas should be based on the costs for each component combined together.
Casino/gaming facilities are assumed to be single storey buildings containing gaming floor (slots and/or table games), restaurants, bars, entertainment, and retail areas. Costs include fit-out of the gaming floor, and exclude FF&E, slot machines/tables, and security system.
Recreation/Entertainment Buildings, Continued Performing arts building unit costs would vary depending on the size and function of the facility. Acoustical treatment, theatre lighting, stage, and seating requirements would all impact the cost.
Museum and gallery costs vary depending on the purpose of the space; humidity and temperature control, redundant systems, and fire prevention would affect the costs.
Site Servicing
The rates for residential site servicing are based on costs per centre line of road and allow for underground storm, sewer, water and electrical services and street lighting, earthworks, curbs, asphalt roadways and sidewalks. Items such as berms, retaining walls, noise barrier fences, entrance features, storm ponds, landscaping and external services are excluded. The higher end of the specified range should be used for municipalities, which require crusher run limestone in lieu of granular materials for the base road construction and/or where curb or road sub drains are required. Arterial road costs may be partially recoverable from the local municipality or region. The rates for townhouse servicing are provided on a per unit basis. The rates for industrial and commercial site servicing are provided on a per acre basis. Excludes any requirement for oversizing of services for future development.
2018 COST GUIDE BUILDING TYPE DESCRIPTIONS, CONTINUED

Canadian Cost Guide 201819
We are the trusted, independent source of construction cost and project management. Our skilled professionals provide expertise as well as access to the unparalleled benchmarking data and cutting-edge software that empowers effective project delivery across all asset types.
ABOUT OUR COST & PROJECT MANAGEMENT GROUP
Our database consists of over 3,000 projects and counting…
$193B
Infr
astr
uctu
re IC
IRe
side
ntial
*All values measured in current dollars.
42,377Regulation NHL Hockey
Rinks in Built Area
149,215Stacked Stanley Cups
in Building Height
$79B470M sf
1,397 projects
246M sf1,407 projects
*716M+ sf3,059+ projects
255 projects
$51B
$63B
We can strategically manage project contracts and implement detailed financial and project plans with key stakeholders to keep every project on track and on budget.
What we do for clients• Analyze key performance metrics• Residential and parking efficiency analysis• Quickly & easily find comparable projects based on location and building attributes• Predict site conditions based on knowledge of nearby projects• Benchmark construction costs• Benchmark soft costs• Track escalation trends based on actual trade contracts
• Analyze costs based on building configuration (# of storeys, typical floor plate, # of units, size of units, location etc.)• Construction efficiency analysis (ratios of concrete, rebar, formwork and cladding)• Provide industry-leading informed advisory services by linking our data, 3D estimating system and ARGUS Software.

20altusgroup.com
Our TeamIn Canada, our Cost and Project Management team is made up of approximately 160 staff in offices across the country. Our knowledge and experience across all asset types ensures that our services are tailored to each project, delivering dependable, accurate, and valuable independent advice. To talk about your project, contact your local Altus advisor or call us at (416) 641 9500 or [email protected]
British Columbia
Chris Mullins, Senior Director
Ruta Praulina, Director
Alberta & Manitoba
Stuart Boyce, Director
David Crane, Senior Director
Jack McGowan, Senior Director
Quebec & Atlantic Canada
Sergio Callocchia, Director
Grant Mercer, Director
Tammy Stockley, Associate
Michael CommonsPresident
A special thanks to all of our contributors, including Peter Norman, Vice-President and Chief Economist and John Galluzzo, Senior Director from our Research, Advisory and Valuations Group, as well as Matthew Boukall, Senior Director from our Data Solutions team.
Ontario
Colin Doran, Executive Vice-President
Alanna Boucher, Director
Marlon Bray, Senior Director
Alison Castellano, Director
Alex Chan, Director
Tom Curtin, Director
Ron Fernandez, Senior Director
Peter Grigg, Director
Paul Hughes, Senior Director
Dan Klitzke, Director
David Lai, Director
David Minor, Senior Advisor
David Schoonjans, Senior Director
David Sommerville, Senior Director
Koover Vohra, Director
Mel Yungblut, Director

Altus Group is a leading provider of independent advisory services, software and data solutions to the global commercial real estate industry. Our businesses, Altus Analytics and Altus Expert Services, reflect decades of experience, a range of expertise, and technology-enabled capabilities. Our solutions empower clients to analyze, gain market insight and recognize value on their real estate investments.
Headquartered in Canada, we have approximately 2,500 employees around the world, with operations in North America, Europe and Asia Pacific. Our clients include some of the world’s largest real estate industry participants across a variety of sectors. Altus Group pays a quarterly dividend of $0.15 per share and our shares are traded on the TSX under the symbol AIF.
This publication, or any part thereof, may not be reproduced or transmitted in any form, by any means, without the express written permission of Altus Group Limited in each specific instance.
Altus Group Limited makes no representation about the accuracy, completeness or suitability of the material represented herein for the particular purpose of any reader.
The 2018 Canadian Cost Guide was published in January 2018.
For more information:
altusgroup.com
(416) 641-9500
C A N A D I A NCOST GUIDE
2018
CANADIAN COST GUIDE2018
CANADIAN COST GUIDE2018

![Estimating Risk and the Cost of Capital in Canadian Cable ... · Estimating Risk and the Cost of Capital in Canadian Cable Television and Telecommunications ... [RESTRUCTURING] Telus](https://img.dokumen.tips/doc/110x75/5afcd4447f8b9a994d8ca4cb/estimating-risk-and-the-cost-of-capital-in-canadian-cable-risk-and-the-cost.jpg)