Embed Size (px)
Citation preview

2018 High Yield Market Outlook Nomura Corporate Research and Asset Management Inc. (NCRAM)
David Crall, CFA: Managing Director and CIO Stephen Kotsen, CFA: Managing Director and Portfolio Manager Derek Leung, CFA: Executive Director and Assistant Portfolio Manager Maryana Kushnir, CFA: Executive Director and Credit Analyst Michael Profili: Vice President and Credit Analyst Christopher Parham, CFA: Vice President and Credit Analyst Allister Aaron: Credit Analyst Heather Grantham: Head of Client Relations and Marketing Resources
STRICTLY PRIVATE AND CONFIDENTIAL Copyright © 2017 Nomura This document is the sole property of Nomura. No part of this document may be reproduced in any form or by any means – electronic, mechanical, photocopying, recording or otherwise – without the prior written permission of Nomura.
January 2018

1
High Yield Review & Outlook
Scenario Total Return
Market Yield End
1 Year
Market Spread End 1 Year
Market Default
Rate End 1 Year
US GDP WTI
Crude Oil Price
Energy Default
Rate End 1 Year
Fed Funds Rate
Upside 6.0% to 8.0%
4.5% to 5.5% 325 bps 1.0% to
1.5% 3.0%+ $60+ 2.0% +75 bps
Base 5.0% to 6.0%
5.0% to 6.0% 375 bps 1.5% to
2.0% 2.0% to
3.0% $50 to
$60 5.0% +50 bps
Mediocre Growth
2.0% to 4.0%
6.0% to 7.0% 450 bps 2.0% to
3.0% 1.0% to 2.0% $45 to $55 8.0% +25 bps
Slowdown -1.0% to 1.0%
7.0% to 8.0% 650 bps 3.0% to
4.0% -0.5% to
1.0% $40 to $50 12.0% +0 bps
Inflation Pick-up 3.0% to 5.0%
5.5% to 6.5% 325 bps 1.0% to
1.5% 3.0%+ $65+ 2.0% +100 bps
2018 Outlook NCRAM’s base case forecast for the US high yield market, as measured by the ICE BofA Merrill Lynch US High Yield Constrained Index (HUC0), calls for a total return of 5.0−6.0% in 2018. Our base case incorporates a growing US economy, with GDP growth around 2.0-3.0%, and WTI crude oil prices in a range of $50 to $60 per barrel. NCRAM expects returns in 2018 to be driven by income, with price returns approximately flat. We see spreads ending 2018 around 375 bps, approximately at the same level as at the end of 2017, and below the long-term average of around 400 bps. Below-average spreads will be supported by economic growth, healthy capital markets conditions for high yield issuers, and relatively light new issue volumes. We expect the default environment to remain benign, with default rates in the area of 1.5−2.0%. Our upside scenario includes about 50 bps of spread tightening, potentially driven by better global growth, if non-inflationary, than in our base case. Key risks to our forecast include political uncertainty and hawkish central bank activity. Within the US, high yield issuers may be impacted by the recent passage of substantial tax reform, whose stimulating effects on the overall economy could be offset for some leveraged borrowers by new limitations on interest deductibility. Internationally, geopolitical uncertainty may remain heightened, with North Korea a particular focus, and changes to international trade policy could also be disruptive for the US economy. Our base case incorporates tightening by central banks, including two US Federal Reserve (Fed) rate increases in 2018, but a more aggressively hawkish approach, especially if it came in response to an unexpected acceleration of inflation, is a risk factor for the market.
NCRAM 2018 High Yield Forecast
Source: NCRAM forecasts, as of December 31, 2017 High yield market, as measured by the ICE BofA Merrill Lynch US High Yield Constrained Index (HUC0) Economic and market forecasts presented herein reflect our judgment as of the date of this material and are subject to change without notice. These forecasts are estimated, based on assumptions listed on the subsequent pages, and are subject to significant revision and may change materially as economic and market conditions change. NCRAM has no obligation to provide updates or changes to these forecasts. If shown, case studies and examples are for illustrative purposes only. This information discusses general market activity, industry or sector trends, or other broad-based economic, market or political conditions and should not be construed as research or investment advice. The views and opinions expressed may differ from those of NCRAM affiliates. Investors are urged to consult with their financial advisors before buying or selling any securities. This information may not be current and NCRAM has no obligation to provide any updates or changes.
2
High Yield Review & Outlook
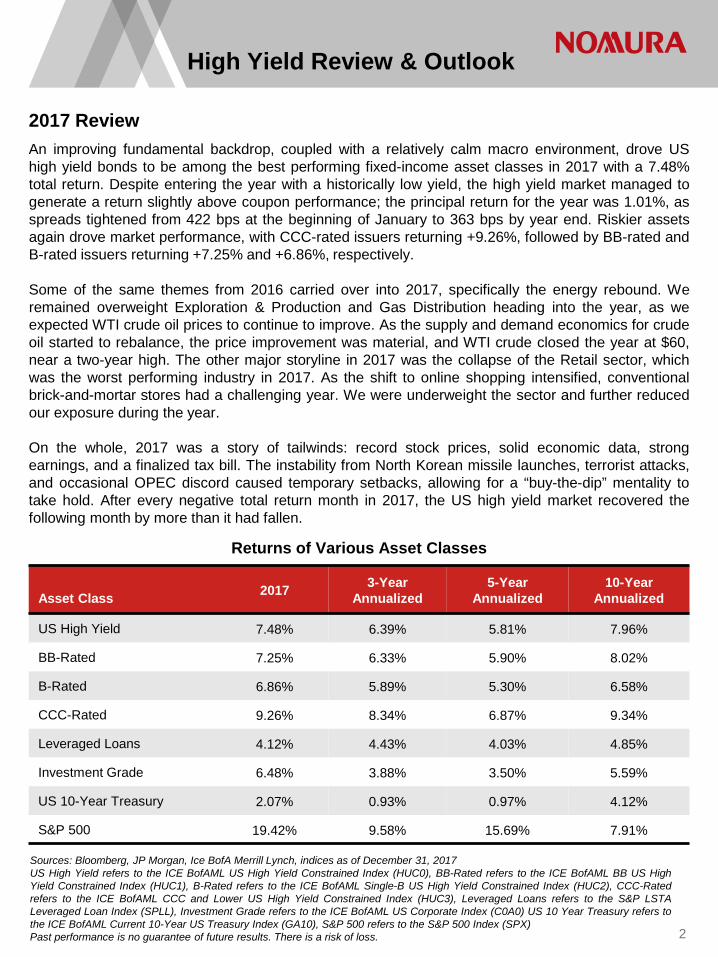
Returns of Various Asset Classes
An improving fundamental backdrop, coupled with a relatively calm macro environment, drove US high yield bonds to be among the best performing fixed-income asset classes in 2017 with a 7.48% total return. Despite entering the year with a historically low yield, the high yield market managed to generate a return slightly above coupon performance; the principal return for the year was 1.01%, as spreads tightened from 422 bps at the beginning of January to 363 bps by year end. Riskier assets again drove market performance, with CCC-rated issuers returning +9.26%, followed by BB-rated and B-rated issuers returning +7.25% and +6.86%, respectively. Some of the same themes from 2016 carried over into 2017, specifically the energy rebound. We remained overweight Exploration & Production and Gas Distribution heading into the year, as we expected WTI crude oil prices to continue to improve. As the supply and demand economics for crude oil started to rebalance, the price improvement was material, and WTI crude closed the year at $60, near a two-year high. The other major storyline in 2017 was the collapse of the Retail sector, which was the worst performing industry in 2017. As the shift to online shopping intensified, conventional brick-and-mortar stores had a challenging year. We were underweight the sector and further reduced our exposure during the year. On the whole, 2017 was a story of tailwinds: record stock prices, solid economic data, strong earnings, and a finalized tax bill. The instability from North Korean missile launches, terrorist attacks, and occasional OPEC discord caused temporary setbacks, allowing for a “buy-the-dip” mentality to take hold. After every negative total return month in 2017, the US high yield market recovered the following month by more than it had fallen.
Sources: Bloomberg, JP Morgan, Ice BofA Merrill Lynch, indices as of December 31, 2017 US High Yield refers to the ICE BofAML US High Yield Constrained Index (HUC0), BB-Rated refers to the ICE BofAML BB US High Yield Constrained Index (HUC1), B-Rated refers to the ICE BofAML Single-B US High Yield Constrained Index (HUC2), CCC-Rated refers to the ICE BofAML CCC and Lower US High Yield Constrained Index (HUC3), Leveraged Loans refers to the S&P LSTA Leveraged Loan Index (SPLL), Investment Grade refers to the ICE BofAML US Corporate Index (C0A0) US 10 Year Treasury refers to the ICE BofAML Current 10-Year US Treasury Index (GA10), S&P 500 refers to the S&P 500 Index (SPX) Past performance is no guarantee of future results. There is a risk of loss.
2017 Review
Asset Class 2017 3-Year
Annualized 5-Year
Annualized 10-Year
Annualized
US High Yield 7.48% 6.39% 5.81% 7.96%
BB-Rated 7.25% 6.33% 5.90% 8.02%
B-Rated 6.86% 5.89% 5.30% 6.58%
CCC-Rated 9.26% 8.34% 6.87% 9.34%
Leveraged Loans 4.12% 4.43% 4.03% 4.85%
Investment Grade 6.48% 3.88% 3.50% 5.59%
US 10-Year Treasury 2.07% 0.93% 0.97% 4.12%
S&P 500 19.42% 9.58% 15.69% 7.91%

0.00%
10.00%
20.00%
30.00%
40.00%
50.00%
60.00%
70.00%
80.00%
90.00%
1985
1987
1989
1991
1993
1995
1997
1999
2001
2003
2005
2007
2009
2011
2013
2015
2017
BB-Rated B-Rated CCC-Rated
0
50,000
100,000
150,000
200,000
250,000
300,000
350,000
Refies Equity monetization GCP Capex Acquisitions/LBOs
3
High Yield Review & Outlook
High yield primary market issuance increased in 2017, following three consecutive year-over-year (YOY) declines. Total new issue volume for 2017 was $328bn, marking a 14.7% increase over 2016’s total of $286bn, which was down 2% from 2015. Similar to 2016, new issue trends in 2017 represented a conservative risk profile, with volume skewed toward the upper and middle-tier buckets. Due to this risk-averse profile, 40% of the issuance was rated split-BBB or BB, 45% was rated split-BB or B, and only 15% was rated split-B or CCC. Refinancing activity led primary market issuances in 2017, accounting for 63% of total issuance, while acquisition-related issuance remained low, comprising 18% of new issues. Notably, non-USD issuance increased meaningfully in 2017, with volume setting a record high for the year. Euro and Sterling issuance totaled a USD-equivalent of $108.2bn in 2017, an increase of 72% YOY. Even with the increase in primary market issuance, the USD high yield bond market contracted slightly in 2017. The total size of the market fell by 25 bps to $1,310bn, and the number of issues decreased 2.6% to 1,898, down from 1,949 at the beginning of 2017.
Sources: Bloomberg, ICE BofA Merrill Lynch, as of December 31, 2017
2017 Review (Continued)
High Yield New Issue By Ratings Quality
High Yield New Issue Use Of Proceeds

4
High Yield Review & Outlook
We expect US Real GDP to grow by 2.0-3.0% in 2018, supported by fiscal stimulus at home and improving economic growth globally. Business spending and investment gained momentum throughout 2017, and we expect this to continue in 2018. A portion of this was due to the recovery in the Energy industry, and a portion was related to a broad based improvement in business sentiment. We expect the new tax policy to provide an additional lift to business spending, due to lower corporate taxes, along with the incentive for capital expenditures now that businesses are able to fully deduct capital expenditures in the year spent. The new tax bill is projected to cut taxes by $1.5 trillion over 10 years and includes cutting the corporate tax rate from 35% to 21%. Additionally, the defense budget for 2018, the National Defense Authorization Act, was recently signed into law and includes a 13% increase to the topline budget from the prior year’s budget. Furthermore, its possible that we will see a federal infrastructure spending program in 2018. In addition to US businesses, the US consumer is in good shape with high reported confidence levels. The S&P 500 reached an all-time high, and the headline unemployment rate reached a 17-year low. Healthy financial markets, low unemployment, and increased home values all led to growth in household wealth. Wages have been improving at roughly 2.5%, 1.0% higher than inflation, and we expect they will increase faster in the coming year. Changes to international trade policy remain a key risk in 2018. Trump’s past rhetoric has included aggressive protectionist trade strategies, such as imposing tariffs on imports from China and Mexico and withdrawing from NAFTA. A more moderate strategy on international trade now seems more likely, but generally any restriction on trade can have unintended consequences for both US and global economic growth. The path of inflation is important to the pace of Fed rate increases. Given continued economic growth, low unemployment, and more fiscal stimulus, we expect inflation to move higher in 2018 but to remain below the Fed’s target level, due to global disinflationary forces. Nomura Securities Real GDP Forecasts
Source: Nomura Securities International, Inc., forecasts as of December 12, 2017
US Economic Growth
(%) 2017E 2018E 2019E
Global Real GDP 3.8 3.9 3.6 US Real GDP 2.3 2.7 2.3 Personal consumption 2.7 2.4 2.3 Non-residential fixed invest 4.5 4.2 3.8 Residential fixed invest 1.1 1.6 2.8 Government expenditure 0.0 1.2 0.5 Exports 3.3 4.6 3.7 Imports 3.4 3.9 3.6 US Unemployment Rate 4.4 3.9 3.6 US Core PCE (y-o-y) 1.5 1.8 2.0

5
High Yield Review & Outlook
We expect that Federal Reserve policy will remain on a gradual tightening track in 2018, with other central banks likely to join the Fed in withdrawing stimulus during the course of the year. The FOMC’s most recent projection for its target rate, taken as the median of its “dot plot”, implies three rate hikes in 2018. Market expectations for Fed policy are somewhat more circumspect, with the market currently pricing in about two hikes during the year. NCRAM’s base case forecast includes two Fed rate hikes, and our overall outlook is that the policy environment will remain accommodative with rates rising only gradually, as inflation remains persistently below the Fed’s target level despite strong labor markets characterized by very low unemployment. We believe that inflation, financial conditions, and federal fiscal policy will all factor into the Fed’s rate path during 2018; we expect that, irrespective of these factors, the Fed will maintain its current trajectory, established in 2017, for winding down its balance sheet. While the leadership of the Federal Reserve will likely pass to Jerome Powell, the President’s nominee to replace Chair Janet Yellen, we expect substantial continuity in monetary policy, as Powell has voted with the FOMC majority and supported the existing policy trajectory during Yellen’s term. The Fed’s outlook for inflation has been relatively stable since the 2016 election, while its projections for growth and unemployment have somewhat improved.
Source: Bloomberg, as of December 31, 2017
The Fed and Monetary Policy

6
High Yield Review & Outlook
Globally, we believe that overseas central banks will increasingly join the Fed in a tightening posture, beginning to reverse their easy-money policies of the past five years. In particular, we expect that strong growth in Europe will lead the European Central Bank (ECB) to terminate its asset purchase program by the end of 2018, and that its messaging in the latter part of 2018 may guide toward hikes in policy rates during 2019. During November 2017, the Bank of England (BOE) undertook its first rate hike in more than a decade, and we would expect inflationary pressures in the UK to keep the BOE in a hawkish stance, despite the risks associated with Brexit. Alone among the major central banks, the Bank of Japan (BOJ) is not expected to adjust its currently pro-stimulus policy bias, and we expect the 0% target yield for the 10-year JGB to remain in place. Our view is that low global long-term rates over the past several years have contributed to keeping US long-term rates down while the Fed has embarked on its tightening cycle. Furthermore, low rates globally may have driven fund flows into higher-yielding, US dollar-denominated asset classes, including high yield bonds. Therefore, we see more hawkish behavior and messaging from overseas central banks as a risk to US high yield, particularly the higher-duration segments of the market.
Source: Bloomberg, as of December 31, 2017
The Fed and Monetary Policy (Continued)

7
High Yield Review & Outlook
On December 22, 2017, President Trump signed a tax reform bill into law, which was the largest change to the US tax code in over 30 years. The key areas of focus for the high yield market are the changes to deductibility of interest payments, the lowering of the corporate tax rate, and the ability to fully deduct capital expenditures in the year spent for the next six years. Generally, we think the tax changes will act as an economic stimulus, because the reduction in corporate and other business taxes will increase both the funds and the incentive to invest. However, the impact on high yield companies is more complex. On interest deductibility, the limit is 30% of EBITDA for 2018-2021, and then depreciation and amortization are excluded from the calculation following 2021 (EBIT). Any interest expense not deductible can be carried forward indefinitely. Also, net operating losses (NOLs) that can be carried forward and applied to offset pretax income decline to 80% from 100%. We view the interest deductibility move as mildly pro-cyclical: when economic growth and earnings decline, tax bills may actually rise. However, lowering the corporate tax rate to 21% (from 35%) and allowing companies to fully deduct capital expenditures in the year spent will mitigate some of the negative effects of decreased interest deductibility. We expect companies with low debt loads, high capital expenditures, and high present corporate tax rates to benefit the most from the tax changes. JP Morgan estimates that 75% of high yield companies will be better off because of the new tax law. However, deductibility limitations will be an issue primarily for CCC and stressed issuers and a cash flow drag during downturns. Nevertheless, we do not expect this provision to have a major effect on high yield credit quality. In the worst case, the portion of interest that is not deductible will be subject to a 21% tax. However, most high yield companies have depreciation allowances, NOLs, write-offs, and other deductions to reduce their tax bill. Most high yield companies pay relatively little corporate tax now, and we don’t expect that to change.
Sources: NCRAM, JP Morgan, as of December 31, 2017
US Tax Reform

0.00
2.00
4.00
6.00
8.00
10.00
12.00
14.00
16.00
18.00
1998 2000 2002 2004 2006 2008 2010 2012 2014 2016
US HY par
0
20
40
60
80
100
1990 1992 1994 1996 1998 2000 2002 2004 2006 2008 2010 2012 2014 2016US HY EU HY
8
High Yield Review & Outlook
The par weighted default rate at the end of 2017 was 1.27%, according to JP Morgan, below the long-term average around 3.5%. The default rate in 2017 decreased from 3.57% at the end of 2016, and the default rate in the Energy sector decreased from 13.35% to 2.09%, while non-Energy default activity remained low. The sectors most impacted by defaults in 2017 included Utilities, Technology, and Media. We believe that the default rate in 2018 will fall in the 1.5-2.0% range, consistent with the low levels seen in 2017. There are several large capital structures that could default in 2018, although we believe these events are already priced into the market. We expect that defaults in 2018 will be idiosyncratic, with very little carryover to other companies in their respective sectors. Our default rate expectations are based on steady economic growth, which should continue to allow companies to refinance and extend their upcoming maturities, while also supporting EBITDA and cash flow growth. The high yield market continues to be healthy going into 2018. The ratio of bonds trading at or below 70% of par comprises only 3.25% of the market. The sectors that we believe are most at risk in 2018 include Retail, as technological changes and movement into online retailing continues to negatively impact high yield issuers, as well as Media, where we could possibly see a large default in 2018.
Sources: Bloomberg, JP Morgan, ICE BofA Merrill Lynch, as of December 31, 2017
2018 Default Rate Outlook
US High Yield Trailing 12-Month Default Rate (%Par)
US & Euro High Yield Distress Ratio

9
High Yield Review & Outlook
We predicted that the WTI crude oil price would stabilize between $50-60/bbl in 2017, and the actual outcome came in at the low end of our forecast, with the 2017 average at $50.86/bbl. We entered 2017 with the market’s excitement about OPEC and certain non-OPEC producers’ agreement to cut production, which was reached in November 2016. At the start of 2017, the prompt NYMEX WTI contract was at $52.33/bbl, with the 2017 curve averaging $55/bbl. The excitement quickly faded as the market became impatient with the promise of “re-balancing”, and as market participants realized that OPEC producers maximized production ahead of the negotiations, leading to exports actually rising early in 2017 as producers de-stocked. Additionally, North American rig count surged, prompting concerns that US production would rebound strongly. WTI crude oil prices entered a bear market in the spring, bottoming at $42.53/bbl on June 21, 2017. Despite the prevailing bearish sentiment in the summer of 2017, the actual data turned increasingly positive and supportive of the thesis of the market re-balancing. Most importantly, the 2Q17 reporting season marked a change in the producer mentality from growth at all costs to growth within cash flow and revealed tightness in oilfield services and numerous challenges for the producers, tampering growth expectations for the North American shale oil producers. As we enter 2018, our outlook for WTI remains similar to last year’s: between $50-60/bbl. On the one hand, we see a number of positive themes underpinning the market: 1) an extended production restraint agreement by OPEC and certain non-OPEC producers; 2) heightened geopolitical risks in Venezuela and Iraq and a low likelihood that production gains in Libya and Iran in 2016 & 2017 will repeat; 3) North American producers are likely to exhibit capital discipline with prices below the $50 range, as was exemplified in the summer of 2017, as rig count declined; 4) service availability and infrastructure bottlenecks are likely to continue to inhibit ambitious plans of North American producers; and 5) positive macroeconomic backdrop. On the negative front, we are closely monitoring the following trends: 1) gasoline demand, particularly in the US; 2) any signs of an OPEC production cut deal falling apart; and 3) underlying field declines and remaining project start-ups in Brazil, West Africa, and the Gulf of Mexico.
2018 Energy Outlook
Fig 5: OECD crude oil stocks, mb Fig 6: OECD total product stocks, mb
Sources: Bloomberg, IEA, and Energy Aspects, as of December 14, 2017

10
High Yield Review & Outlook
Our overall positioning is consistent with our forecast for continued economic strength in the US and improvement overseas, our constructive outlook on crude oil and natural gas pricing, and our base case expectation of a rising rate environment. Entering 2018, we are overweight in sectors that are US-centric. Sectors we favor include Banking and Financial Services; housing-related sectors, including Real Estate, which we expect to benefit from a continuing economic recovery; and Leisure, which includes Gaming. We are also overweight Energy, where we seek issuers with the liquidity, hedging, and asset value to perform well in the $50−60 WTI price environment we expect for 2018. We are less favorable on certain sectors that are under technological or regulatory pressure, including Retail and Healthcare. Looking at the market by credit ratings, we remain underweight BB-rated issuers. Our underweight in this segment is driven by concerns about duration and the convexity of higher-priced, lower-coupon bonds. Overall we have less duration than the overall US high yield market, as we anticipate relatively strong growth, higher inflation, and a rising rate environment in the US and globally. We are generally overweight B-rated issuers and CCC-rated issuers. In our view, the strong near-term economic outlook, highly accessible capital markets, and current high levels of interest coverage for high yield issuers should all support a low level of defaults. This should support the performance of lower-rated credits.
Source: NCRAM, as of December 31, 2017
NCRAM’s Positioning
Strategy Overweight UnderweightSectorsBankingBasic IndustryCapital GoodsEnergyFinancial ServicesInsuranceLeisureReal EstateTechnology & ElectronicsTransportationAutomotiveConsumer GoodsHealthcareMediaRetailServicesTelecommunicationsUtilityCredit QualityB-RatedCCC-Rated (US-centric/non-cyclical credits)BB-Rated
Positioning

11
Disclosures
This document is prepared by Nomura Corporate Research and Asset Management Inc. (NCRAM" and is for informational purposes only. All information contained in this document is proprietary and confidential to NCRAM. All opinions and estimates included herein constitute NCRAM's judgment, unless stated otherwise, as of this date and are subject to change without notice. There can be no assurance nor is there any guarantee, implied or otherwise, that opinions related to forecasts will be met. Certain information contained herein is obtained from various secondary sources that are believed to be reliable, however, NCRAM does not guarantee its accuracy and such information may be incomplete or condensed. Historical investment performance is no guarantee of future results. There is a risk of loss. Certain information discussed in this document may constitute forward-looking statements within the meaning of the U.S. federal securities laws. Although NCRAM believes that the expectations reflected in such forward-looking statements are based on reasonable assumptions, it can give no assurance that its expectations will be achieved. Forward-looking information is subject to certain risks, trends and uncertainties that could cause actual results to differ materially from those projected. This document is intended for the use of the person to whom it is delivered. Neither this document nor any part hereof may be reproduced, transmitted or redistributed without the prior written authorization of NCRAM. Further, this document is not to be construed as investment advice, or as an offer to buy or sell any security, or the solicitation of an offer to buy or sell any security. Any reproduction, transmittal or redistribution of its contents may constitute a violation of the U.S. federal securities laws. Performance data is calculated by NCRAM based upon market prices obtained from market dealers and pricing services or, in their absence, an estimate of market value based on NCRAM’s pricing and valuation policy. Performance data stated herein may vary from pricing determined by an advisory client or by a third party on behalf of the advisory client. Performance data set forth herein is provided for the purpose of facilitating analysis of account assets managed by NCRAM, and should not be used for the purpose of reporting or advertising performance of specific account portfolios to account beneficiaries or to third parties. An investment in high yield instruments involves special considerations and certain risks, including risk of default and price volatility, and such securities are regarded as being predominantly speculative as to the issuer's ability to make payments of principal and interest. A copy of NCRAM's Code of Ethics and its Part 2A of Form ADV, are available upon request by contacting NCRAM’s Chief Compliance Officer via e-mail at [email protected] or via postal mail request at Nomura Corporate Research and Asset Management Inc., Worldwide Plaza, 309 West 49th Street, Compliance Department, 19th Floor, Attn: Chief Compliance Officer, New York, NY 10019-7316. The views and estimates expressed in this material represent the opinions of NCRAM and are subject to change without notice and are not intended as a forecast or guarantee of future results. Such opinions are statements of financial market trends based on current market conditions. The views and strategies described may not be suitable for all investors. This material has been prepared for informational purposes only, and is not intended to provided, and should not be relied upon as legal or tax advice. The portfolio may participate in new issuances of securities (New Issues), and a portion of the portfolio’s returns consequently may be attributable to its investment in New Issues. The market value of New Issues may fluctuate considerably due to factors such as the absence of a prior public market, unseasoned trading, and the limited availability for trading and limited information about the issuer. When a portfolio’s asset base is small, New Issues may have a magnified impact on the portfolio’s performance. As a portfolio’s assets grow, it is probable that the effect of the portfolio’s investment in New Issues on its total returns may not be as significant, which could reduce the portfolio’s performance. There is no guarantee that the availability or economic attractiveness of New Issues will be consistent from year to year.

12
Definitions of Indices
Set forth below are summary descriptions of various indices used in this letter. These summaries are not complete and do not purport to describe how the indices are calculated or all their parameters. In addition, these indices represent past performance, are shown solely for comparative purposes and may not be indicative of future returns. Indices are unmanaged and cannot be invested in directly. The Intercontinental Exchange (ICE) BofA Merrill Lynch US Corporate Index (C0A0) tracks the performance of US dollar denominated investment grade corporate debt publicly issued in the US domestic market. Qualifying securities must have an investment grade rating (based on an average of Moody’s, S&P and Fitch) and an investment grade rated country of risk (based on an average of Moody’s, S&P and Fitch foreign currency long term sovereign debt ratings). In addition, qualifying securities must have at least one year remaining term to final maturity, a fixed coupon schedule and a minimum amount outstanding of $250 million. Original issue zero coupon bonds, "global" securities (debt issued simultaneously in the eurobond and US domestic bond markets), 144a securities, corporate pay-in-kind securities and toggle notes qualify for inclusion in the Index. Perpetual and fixed to- floating rate corporate securities also qualify provided they are callable within the fixed rate period and are at least one year from the start of the floating rate period. Taxable and tax-exempt municipal and defaulted securities are excluded from the Index. The inception date of the index is January 31, 1976. Source: BofA Merrill Lynch, used with permission. The ICE Bank of America Merrill Lynch U.S. High Yield Constrained Index (HUC0) tracks the performance of below investment grade U.S. dollar-denominated corporate bonds publicly issued in the U.S. domestic market. Qualifying issues must be rated sub-investment grade (based on a composite of Moody’s, S&P, and Fitch) and have an investment grade rated country of risk (based on a composite of Moody’s, S&P and Fitch foreign currency long term sovereign debt rating). Qualifying bonds must have at least one year remaining term to maturity, a fixed coupon schedule and a minimum amount outstanding of USD 100 million. Perpetual, fixed-to-floating rate, defaulted, and pay-in-kind securities are excluded. 144A issues qualify for inclusion in the Index. Qualifying bonds are capitalization-weighted provided the total allocation to an individual issuer (defined by Bloomberg tickers) does not exceed 2%. Issuers that exceed the limit are reduced to 2% and the face value of each of their bonds is adjusted on a pro-rata basis. Similarly, the face value of bonds of all other issuers that fall below the 2% cap are increased on a pro-rata basis. In the event there are fewer than 50 issuers in the Index, each is equally weighted and the face value of their respective bonds is increased or decreased on a pro-rata basis. The index is re-balanced on the last calendar day of the month, based on information available up to and including the third business day before the last business day of the month. Issues that meet the qualifying criteria are included in the index for the following month. Issues that no longer meet the criteria during the course of the month remain in the index until the next month-end re-balancing at which point they are dropped from the index. The inception date of the index is September 30, 1996. The ICE BofA Merrill Lynch BB US High Yield Constrained Index (HUC1) is a subset of The BofA Merrill Lynch US High Yield Constrained Index including all securities rated BB. Inception date: December 31, 1996. The ICE BofA Merrill Lynch Single-B US High Yield Constrained Index (HUC2) is a subset of The BofA Merrill Lynch US High Yield Constrained Index including all securities rated B. Inception date: December 31, 1996. The ICE BofA Merrill Lynch CCC and Lower US High Yield Constrained Index (HUC3) is a subset of The BofA Merrill Lynch US High Yield Constrained Index including all securities rated CCC and lower. Inception date: December 31, 1996. The ICE BofA Merrill Lynch Current 10-Year US Treasury Index (GA10) is a one-security index comprised of the most recently-issued 10-year US Treasury note. The index is rebalanced monthly. In order to qualify for inclusion, a 10-year note must be auctioned on or before the third business day before the last business day of the month. Inception date: December 31, 1987. The above rules take into account all revisions up to and including September 30, 2015 Source: ICE BofA Merrill Lynch, used with permission. BofA Merrill Lynch is Licensing the BofA Merrill Lynch Indices “as is," makes no warranties regarding the same, does not guarantee the suitability, quality, accuracy, timeliness, and/or completeness of the BofA Merrill Lynch indices or any data included in, related to, or derived therefrom, assumes no liability in connection with their use, and does not sponsor, endorse, or recommend NCRAM, or any of its products or services. The S&P 500 is widely regarded as the best single gauge of the U.S. equities market, this world-renowned index is a total fair weighted index of 500 leading companies in leading industries of the U.S. economy. S&P 500 is a core component of the U.S. indices that could be used as building blocks for portfolio construction. Although S&P 500 focuses on the large-cap segment of the market, with about 75% coverage of U.S. equities, it is also an ideal proxy for the total market. It has a market capitalization of a $5 billion. The dividends of the S&P 500 constituents are reinvested. It is also the U.S. component of S&P Global 1200. The history of the S&P 500 dates back to 1923, with an expansion to include 500 companies in 1957. It is created by Standard & Poors. S&P/LSTA Leveraged Loan Index (SPLL) is a total return index that captures accrued interest, repayments, and market value changes. It represents a broad cross section of leveraged loans syndicated in the United States, including dollar-denominated loans to overseas issuers. Standard & Poor's and the Loan Syndications & Trading Association ("LSTA") conceived of the LLI to establish a performance benchmark for the syndicated leveraged loan industry.