Embed Size (px)
Citation preview

Jarrod RitchieManaging Director
Brendan MiddletonChief Financial Officer
2018HALF YEARRESULTS30 AUGUST 2018
For
per
sona
l use
onl
y

TPIEN
TERP
RISES.C
OM
DISCLAIMERSummary information
The following disclaimer applies to this document and any information provided regarding the information contained in this document (the “Information”). The Information has been prepared by TPI Enterprises Ltd and relates to the TPI Group (including, without limitation, Purplebay Pty Ltd and TPI’s Norway and Portugal subsidiaries or any new entity subsequently incorporated following the date on which this Information is provided) (collectively “TPI”). The Information in this presentation is of general background and does not purport to be complete. You are advised to read this disclaimer carefully before reading or making any other use of this document or any information contained in this document. In accepting this document, you agree to be bound by the following terms and conditions including any modifications to them.
Not financial or product advice
This presentation is for information purposes only and is not financial product or investment advice or a recommendation to acquire securities in TPI without taking into account the objectives, financial situation or needs of individuals. You are solely responsible for forming your own opinions and conclusions on such matters and the market and for making your own independent assessment of the Information. TPI is not licensed to provide financial product advice.
Financial data
All dollar values are in Australian dollars (A$) unless stated otherwise.
Past performance
Past performance information given in this presentation is given for illustrative purposes only and should not be relied upon as (and is not) an indication of future performance.
Future performance
The presentation includes forward-looking statements regarding future events and the future financial performance of TPI. Forward looking words such as “expect”, “should”, “could”, “may”, “predict”, “plan”, “will”, “believe”, “forecast”, “estimate”, “target” or other similar expressions are intended to identify forward-looking statements. Any forward looking statements included in this document involve subjective judgment and analysis and are subject to significant uncertainties, risks and contingencies, many of which are outside the control of, and are unknown to, TPI and its officers, employees, agents or associates. In particular, factors such as variable climatic conditions and regulatory decisions and processes may affect the future operating and financial performance of TPI. This may cause actual results to be materially different from any future results, performance or achievements expressed or implied by such statements. The Information also assumes the success of TPI’s business strategies. The success of the strategies is subject to uncertainties and contingencies beyond control, and no assurance can be given that the anticipated benefits from the strategies will be realised in the periods for which forecasts have been prepared or otherwise. Given these uncertainties, you are cautioned to not place undue reliance on any such forward looking statements. TPI is providing this information as of the date of this presentation and does not assume any obligation to update any forward-looking statements contained in this document as a result of new information, future events or developments or otherwise.
TPI Enterprises 2018 Half Year Result 2
For
per
sona
l use
onl
y

TPIEN
TERP
RISES.C
OM
AGENDA
Company Overview 4
Strategic Pathway to Long Term Growth 8
Results Overview 9
NRM, API and CMO: Then and Now 14
Additional Initiatives 18
Financial Results 19
Market and Strategy Update 24
Outlook 30
TPI Enterprises | 2018 Half Year Result 3
For
per
sona
l use
onl
y
TPIEN
TERP
RISES.C
OM
Washington Soul Pattinson,
20.0%
Thorney Investments,
12.2%
Wentworth Williamson,
5.0%Board &
Management, 4.5%
Other External Investors,
58.4%
COMPANY OVERVIEW
TPI Enterprises 2018 Half Year Result
CAPITAL STRUCTURE
Share Price (29 August 2018) $ 1.41
Fully Paid Ordinary Shares m 81.1
Share Appreciation Rights m 1.3
Market Capitalisation $m 114.7
Net debt (30 June 2018) $m 11.8
DIRECTORS & SENIOR MANAGEMENT
Simon Moore Independent Non-Executive Chairman
Jarrod Ritchie Managing Director
Stuart Black Independent Non-Executive Director
Todd Barlow Non-Executive Director
Jaime Pinto Company Secretary
Brendan Middleton Chief Financial Officer
TPI ENTERPRISES AT A GLANCE
• Fully integrated opiate manufacturer from poppy cultivation to tablet production.
• Lowest cost narcotic raw material (“NRM”) and active pharmaceutical ingredient (“API”)
production capability with novel water-based extraction technology.
• Rapidly growing global supplier of pain relief, cough and anti-addiction active
pharmaceutical ingredients.
• Significant contract manufacturer of finished dosage formulation (“FDF”) tablets via
contract manufacturing organisation supply agreements (“CMO”).
• Founded in 2004 and headquartered in Victoria, Australia with production facilities in
Victoria, Australia and Kragerø, Norway.
SHAREHOLDERS
4
For
per
sona
l use
onl
y

TPIEN
TERP
RISES.C
OM
TPI ENTERPRISES IS A FULLY INTEGRATED NARCOTIC SUPPLIER
TPI Enterprises 2018 Half Year Result 5
MorphineCodeine
Morphine SulphateCodeine Phosphate
Pholcodine (Cough treatment)
MS ContinPanadeine
Panadeine Forte
ThebaineOxycodone HCIHydrocodone
Buprenorphine
Oxycontin EndoneVicadin TylenolParacetamol Ibuprofen
OripavineNaloxone
NaltrexoneBuprenorphine HCI
Suboxone ReviaSubutex Narcan
Natural narcoticsSynthetic and semi-synthetic
narcotic derivatives
Finished Dosage Form (FDF)Active Pharmaceutical Ingredient (API)Raw Material Sourcing Narcotic Raw Material (NRM)
Contract manufacturing of tablets (CMO)
For
per
sona
l use
onl
y

TPIEN
TERP
RISES.C
OM
TPI Enterprises 2018 Half Year Result 6
GLOBAL SUPPLY CHAIN AND SALES
Raw Material Supply Chain NRM (Narcotic Raw Material) sales
API (Active Pharmaceutical Ingredient) sales
FDF (finished dosage formulation) sales
Northern Hemisphere Straw(Hungary and others)
-Contract growers-Straw provided by historical
competitors for toll processing
Southern Hemisphere Straw(Australia: NSW/VIC/TAS)
-Contract growers
Melbourne, AustraliaNRM Manufacturing
Sales of NRM to external customers
Internal sales of NRM to API manufacturing in Norway
Sales of poppy seed for culinary purposes
Kragerø, NorwayAPI/FDF Manufacturing
Contract manufacturing of FDF (tableted medications) from API,
sold to external customers
Contract manufacturing of non-opiate1 based FDF, sold to
external customers
Sales of API to external customers
1. Medications not derived from NRM.
For
per
sona
l use
onl
y

TPIEN
TERP
RISES.C
OM
TPI Enterprises 2018 Half Year Result 7
THE OPPORTUNITYSignificant Manufacturing Cost Advantage = Market Penetration Opportunity in Sizable Addressable Market
Total number of NRM extraction licences available globally 6
Number of fully vertically integrated (poppy straw to FDF) manufacturers 3
Lowest cost producer of NRM TPI Enterprises
Key competitive advantageNRM is often c.70-80% of the input cost of API/FDF, creating a lowest cost producer
opportunity in NRM, API and FDF
Total NRM sales volume target (2018 estimate) 52 tonnes
2021 total NRM annual production target 200 tonnes
Addressable NRM market 785 tonnesFor
per
sona
l use
onl
y
TPIEN
TERP
RISES.C
OM
STRATEGIC PATHWAY TO LONG TERM GROWTH
TPI Enterprises 2018 Half Year Result
2016 2017 2018 2019 2020
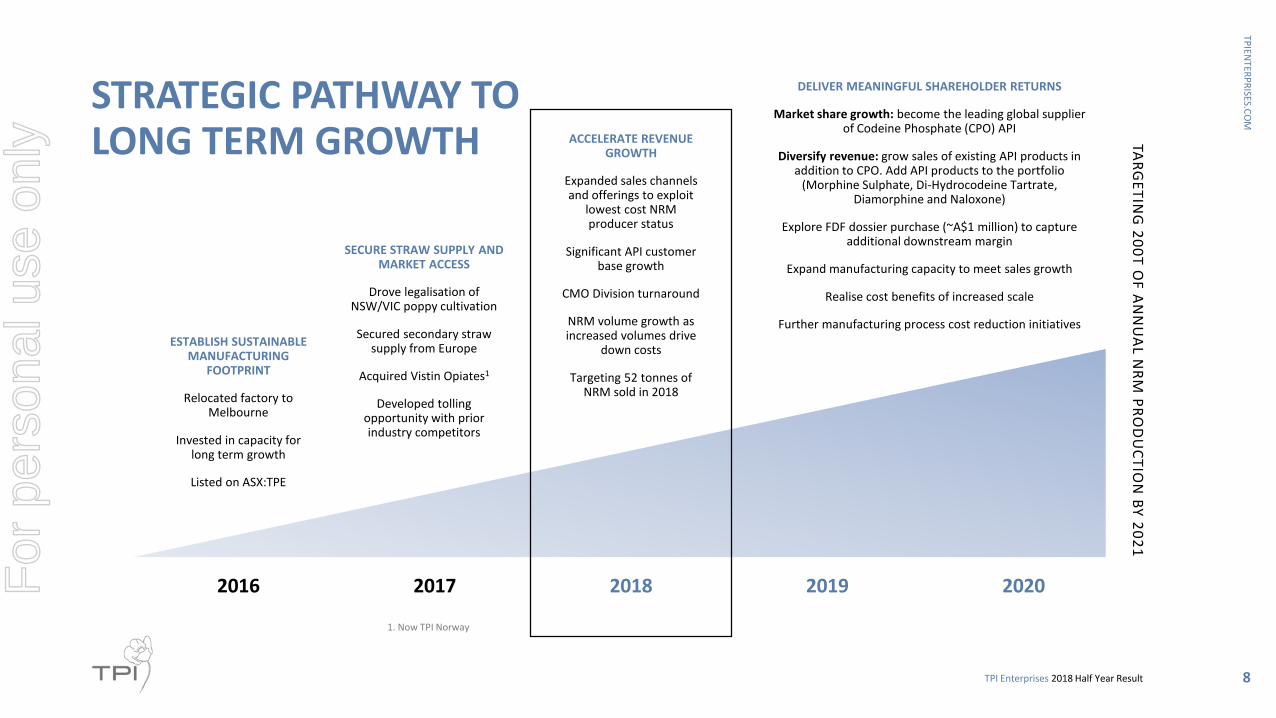
ESTABLISH SUSTAINABLE MANUFACTURING
FOOTPRINT
Relocated factory to Melbourne
Invested in capacity for long term growth
Listed on ASX:TPE
SECURE STRAW SUPPLY AND MARKET ACCESS
Drove legalisation of NSW/VIC poppy cultivation
Secured secondary straw supply from Europe
Acquired Vistin Opiates1
Developed tolling opportunity with prior industry competitors
ACCELERATE REVENUE GROWTH
Expanded sales channels and offerings to exploit
lowest cost NRM producer status
Significant API customer base growth
CMO Division turnaround
NRM volume growth as increased volumes drive
down costs
Targeting 52 tonnes of NRM sold in 2018
DELIVER MEANINGFUL SHAREHOLDER RETURNS
Market share growth: become the leading global supplier of Codeine Phosphate (CPO) API
Diversify revenue: grow sales of existing API products in addition to CPO. Add API products to the portfolio
(Morphine Sulphate, Di-Hydrocodeine Tartrate, Diamorphine and Naloxone)
Explore FDF dossier purchase (~A$1 million) to capture additional downstream margin
Expand manufacturing capacity to meet sales growth
Realise cost benefits of increased scale
Further manufacturing process cost reduction initiatives
8
1. Now TPI Norway
TAR
GE
TIN
G 2
00
T O
F A
NN
UA
L NR
M P
RO
DU
CT
ION
BY
20
21
For
per
sona
l use
onl
y

GROUP RESULTSJARROD RITCHIE MANAGING DIRECTOR
For
per
sona
l use
onl
y

TPIEN
TERP
RISES.C
OM
6.1 6.0
15.7
22.7
27.3
2H16A 1H17A 2H17A 1H18A 2H18E
2018 HALF YEAR REVENUE & OVERHEAD COST REDUCTION SUMMARY
TPI Enterprises 2018 Half Year Result
ESTIMATED
ACTUAL
• TPI Enterprises modestly exceeded its 1H18 revenue estimate of A$20.0 million, reporting A$22.7 million (+A$1.4m impact from the adoption of new revenue accounting standard AASB15).
• This result reflected growth on the prior comparable period (which did not include TPI Norway) of 281.5%.
• Group overhead cost savings from cost reduction initiatives completed during the half-year period including Norway FTE reduction, expected to be ~A$3.0 million on full-year basis compared to 2017; the full benefit of these cost reductions will be realised in 2019.
• TPI Enterprises is targeting total Group overheads for 2018 of ~A$19.0 million.
EXPECTED REVENUE EXCEEDED
REVENUE ($M)
10
GROUP OVERHEAD COSTS ($M)
22.0
19.0
3.0
FY17A Actual cost reduction FY18EFor
per
sona
l use
onl
y

TPIEN
TERP
RISES.C
OM
(5.0)(5.6)
(4.2)(3.6)
(1.8)
1H16A 2H16A 1H17A 2H17A 1H18A
324%
105%91%
43% 41%
1H16A 2H16A 1H17A 2H17A 1H18A
1.5
6.1 6.0
15.7
22.7
1H16A 2H16A 1H17A 2H17A 1H18A
POSITIVE HALF-ON-HALF TRENDS EMERGING
TPI Enterprises 2018 Half Year Result
REVENUE ($M) GROSS PROFIT ($M)
OPEX TO SALES (%)
11
(0.2)0.9 1.2
3.2
7.6
1H16A 2H16A 1H17A 2H17A 1H18A
OPERATING EBITDA ($M)
For
per
sona
l use
onl
y

TPIEN
TERP
RISES.C
OM
2018 HALF YEARRESULTS OVERVIEW CONTINUED
Record revenue of A$22.7 million, +281.5% versus 1H 2017, including the first full half year contribution from TPI Norway.
Gross margin improvement to A$7.6 million or 33.3% of operating revenue (1H 2017 gross margin: A$1.2 million, 20.9% of operating revenue).
Operating1 earnings before interest, tax, depreciation and amortisation (EBITDA) loss of A$1.8 million (1H 2017: loss of A$4.2 million).
Statutory EBITDA loss of A$1.9 million represents an +A$3.8 million improvement on the prior corresponding period (1H 2017 loss of A$5.7 million).
The result was negatively impacted by the restructuring of TPI Norway during the period and the exiting of an unprofitable CMO contract.
Restructuring and integration of TPI Norway completed, with a reduction of 29 FTE’s compared to when the business was acquired.
Minimal change in net working capital despite significant growth in sales, with a 36.7% reduction in debtors funding investment in work in progress inventory.
Australian production increased to an average 7 days per week, reflecting a significant improvement in plant utilisation levels.
Sufficient straw, WIP (work in progress) and NRM has been procured and produced to meet 2H 2018 sales targets.
No change in drawn unsecured debt of A$5.0 since 31 December 2017.
TPI Enterprises 2018 Half Year Result
1. See appendix for a reconciliation of operating versus reported EBITDA measurement. Operating EBITDA is a non-GAAP measure.
12
For
per
sona
l use
onl
y

TPIEN
TERP
RISES.C
OM
NORWAY ACQUISITION SUBSTANTIALLY EXPANDED ADDRESSABLE END USE MARKETS
TPI Enterprises 2018 Half Year Result
1H 2017 1H 2018
Available revenue streams NRM, tolling and seed API, CMO, NRM, tolling and seed
Revenue A$6.0 million A$22.7 million
Active geographic reach (no. of countries) 5 18
Number of active customer relationships 5 27
Addressable end use marketsLimited to concentrated base of
< 15 NRM customers onlyCustomer base of > 100 across
API, CMO, NRM products
Number of product categories 2 NRM4 NRM / 2 API’s32 tablet SKU’s
Business modelCompeting with single product and lowest cost promise, but low plant
capacity utilisation
Competing with vertically integrated, global supply capability with higher
plant capacity utilisation
13
For
per
sona
l use
onl
y
NRM, API AND CMOTHEN AND NOWJARROD RITCHIE MANAGING DIRECTOR
For
per
sona
l use
onl
y

TPIEN
TERP
RISES.C
OM
STRATEGY UPDATENRM: INCREASING OPPORTUNITY IN 2018/2019
To date, securing long term NRM (Narcotic Raw Material) contracts has taken longer than we expected post-relocating manufacturing to Victoria.
The key reason for this is the long term nature of existing agreements and entrenched supplier relationships.
Compounding this issue was a lack of access to sufficient quality straw, a general oversupply of narcotic material weighing on prices and the US-centric opiate crisis which weighed on demand.
Having resolved straw security in 2017, TPI Enterprises made the strategic decision to acquire Vistin Opiates to immediately broaden the addressable market with NRM volume through increasing API sales through this business.
TPI Enterprises continues to look at supply of NRM into Europe, South Africa, and Asia. It will only choose this option if margins are more profitable than the internal supply for downstream sales of API and CMO products.
TPI Enterprises has over 10 tonnes of thebaine in straw and is looking to enter the US market with small thebaine based sales in 2H 2018, growing to commercial scale supply in 2019.
TPI Enterprises retains the option of tolling straw for third parties as announced in 2017; however for 2018 direct sales contracts and internal supply for downstream processing are likely to remain the focus.
TPI Enterprises 2018 Half Year Result 15
For
per
sona
l use
onl
y

TPIEN
TERP
RISES.C
OM
STRATEGY UPDATEAPI: EXECUTING ON GROWTH STRATEGY
TPI Enterprises made the strategic decision to acquire the Norway business to accelerate penetration of the global opiate based API market.
The acquisition has delivered many new and prospective API customers and fast-tracked regulatory approvals for access other new API markets (ie. the UK).
TPI Enterprises’ decision to focus on growing API sales is proving the correct one. Dialogue with many new API customers is underway and new API contracts on favourable commercial terms have already been secured since acquisition.
TPI Enterprises expects to be able to continue to leverage its lowest cost NRM producer capability to further increase API and CMO market share in 2H 2018 and beyond.
TPI Enterprises intends to continue to focus on growing API sales, meaning the majority of NRM will be consumed internally in the short term.
TPI Enterprises is working to broaden its product portfolio with Morphine Sulphate, Dihydrocodeine Tartrate, Codeine Base and Naloxone over the coming 18-24 months.
TPI Enterprises 2018 Half Year Result 16
For
per
sona
l use
onl
y

TPIEN
TERP
RISES.C
OM
STRATEGY UPDATE CMO DIVISION: TURN-AROUND ON TRACK
TPI Enterprises has made good progress repositioning its tableting CMO business post-acquisition in 2H 2017.
Key elements in the restructure of the CMO division included a reduction of 29 FTE’s and the termination and subsequent renegotiation of unprofitable contracts.
With the restructuring complete, TPI Enterprises has secured a new 18 month contract for the supply of Codeine Phosphate (CPO) tablets, valued at A$15 million and which will consume approximately 17 tonnes of CPO.
TPI Enterprises is also pleased to announce that over the next 18 months the revenue contribution will be approx. A$45 million from the three key contracts of the CMO Division which compares favourably with the annual revenues under prior ownership of approximately A$20 million1.
TPI Enterprises believes there are further opportunities in the CMO Division - both revenue growth from opiate based products and margin expansion from further cost rationalisation and manufacturing process improvement.
TPI Enterprises 2018 Half Year Result 171. Vistin Pharma 4th quarter 2016 results presentation, 28 February 2017.
For
per
sona
l use
onl
y

TPIEN
TERP
RISES.C
OM
ADDITIONAL INITIATIVESFurther steps taken during 1H 2018 to enhance shareholder value
INSERT IMAGE OF VISTIN FACILITY
• TPI Norway financial control activities now consolidated in Australia supporting the local Norway management team. A level of cost saving will be achieved, but importantly improvements have been made in process optimisation and internal controls.
• Trade debtors reduced A$3.9 million to A$5.4 million.
• A full review of quality has been initiated to reduce manual handling of documentation and errors.
TPI Norway Cost Restructuring
• Board: Simon Moore appointed Independent Non-Executive Chairman.
• Sales & Commercial: Asia-Pacific regional sales manager appointed, with early traction in Hong Kong.
• Group Finance: centralised shared service finance team now established and based in Australia, supporting both Norway and Australian operations, reporting to Group CFO Brendan Middleton.
Group Leadership and Staffing Updates
For
per
sona
l use
onl
y

FINANCIAL RESULTSBRENDAN MIDDLETON CHIEF FINANCIAL OFFICER
For
per
sona
l use
onl
y
TPIEN
TERP
RISES.C
OM
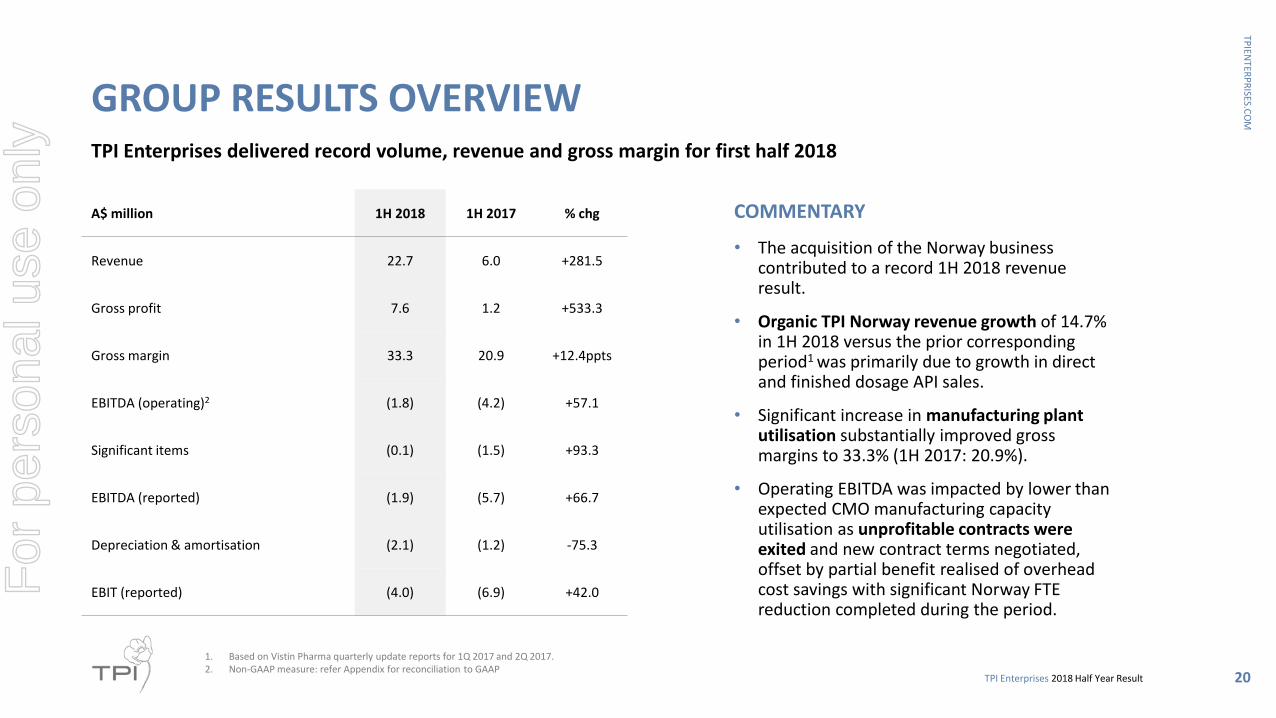
GROUP RESULTS OVERVIEWTPI Enterprises delivered record volume, revenue and gross margin for first half 2018
A$ million 1H 2018 1H 2017 % chg
Revenue 22.7 6.0 +281.5
Gross profit 7.6 1.2 +533.3
Gross margin 33.3 20.9 +12.4ppts
EBITDA (operating)2 (1.8) (4.2) +57.1
Significant items (0.1) (1.5) +93.3
EBITDA (reported) (1.9) (5.7) +66.7
Depreciation & amortisation (2.1) (1.2) -75.3
EBIT (reported) (4.0) (6.9) +42.0
• The acquisition of the Norway business contributed to a record 1H 2018 revenue result.
• Organic TPI Norway revenue growth of 14.7% in 1H 2018 versus the prior corresponding period1 was primarily due to growth in direct and finished dosage API sales.
• Significant increase in manufacturing plant utilisation substantially improved gross margins to 33.3% (1H 2017: 20.9%).
• Operating EBITDA was impacted by lower than expected CMO manufacturing capacity utilisation as unprofitable contracts were exited and new contract terms negotiated, offset by partial benefit realised of overhead cost savings with significant Norway FTE reduction completed during the period.
COMMENTARY
TPI Enterprises 2018 Half Year Result 20
1. Based on Vistin Pharma quarterly update reports for 1Q 2017 and 2Q 2017.2. Non-GAAP measure: refer Appendix for reconciliation to GAAP
For
per
sona
l use
onl
y

TPIEN
TERP
RISES.C
OM
INCOME STATEMENTStatutory EBIT loss impacted by performance of CMO operations during the period
A$ million 1H 2018 1H 2017 % chg
EBIT (reported) (4.0) (6.9) +42.0
Net finance costs (1.0) (1.5) +33.3
Income Tax benefit (before significant items)
0.2 0.0 nm
NLAT (before significant items) (4.8) (8.4) +42.9
Significant items after tax 1.1 (0.3) nm
NLAT (3.7) (8.7) +57.5
• The reported EBIT loss of $4.0 million improved on 1H 2017 as a result of record revenue growth enabled via the Norway acquisition, but was unfavourably impacted by CMO manufacturing capacity utilisation.
• Finance costs reduced by $0.5 million due to lower facility utilisation and reduction of line fees related to the unsecured working capital debt facility during the period.
• Significant items comprised the recognition of profit after tax on the sale of the Group’s Portugal operations during the half of $1.1 million compared to the prior corresponding period loss of $0.3 million attributable to these operations.
COMMENTARY
TPI Enterprises 2018 Half Year Result 21
For
per
sona
l use
onl
y

TPIEN
TERP
RISES.C
OM
IMPACT OF AASB 15 ADOPTIONResults in earlier recognition of Norway Contract Manufacturing revenue
• New revenue accounting standard requires recognition of revenue at the point of “customer control” of goods being obtained rather than transfer of “risks and rewards”.
• This has impacted Contract Manufacturing revenue where completion of manufacturing of a customer Firm Order and movement to Finished Goods has been deemed to trigger “customer control” and therefore revenue recognition, rather than delivery being the point of recognition.
• This results in an uplift in CMO revenue for the portion of a Firm Customer order completed but not delivered at each financial period end.
• The reported revenue uplift impact for 1H18 was $1.4 million.
• This new standard applies to reporting periods from 1 January 2018.
COMMENTARY
TPI Enterprises 2018 Half Year Result 22
0% 10% 20% 30% 40% 50% 60% 70% 80% 90% 100%
31 December 2017
30 June 2018
CMO Firm Order quantity status at financial period end: Finished Goods delivered and held in inventory
FG: delivered FG: inventory Not yet manufactured
AASB15 earlier revenue recognition uplift
For
per
sona
l use
onl
y

TPIEN
TERP
RISES.C
OM
BALANCE SHEET
A$ million H1 2018 H2 2017 chg
Trade receivables 5.4 9.3 (3.9)
Contract assets1 2.3 0.9 1.4
Inventories
-Raw materials 5.4 6.5 (1.1)
-Work in progress 13.6 9.2 4.4
-Finished goods2 1.2 0.8 0.4
Total inventories 20.2 16.5 3.7
Trade payables (7.7) (9.4) (1.7)
Net working capital 20.2 17.3 2.9
Cash 1.4 3.6 (2.2)
Borrowings 13.2 13.2 -
Net debt 11.8 9.6 2.2
Contributed equity 181.5 181.5 -
• Net working capital employed at balance date increased by $2.9 million versus prior period end largely due to an increase in inventories and contract assets, with trade debtors well-controlled.
• Growth in investment in NRM work-in-progress to underpin 2H 18 API sales volumes was funded by the reduction in trade debtors.
• Cash balances managed to minimise working capital facility debt drawn down and reduce interest costs.
• Working capital facility debt drawn was unchanged at $5.0 million.
COMMENTARY
TPI Enterprises 2018 Half Year Result 23
Strong reduction in trade debtors and investment in WIP underpins 2H API production ramp-up
1. The Group initially applied AASB 9 and AASB 15 at 1 January 2018. Under the transition method chosen comparative information is not restated but is shown above and included in “Net working capital” to show a reasonable like-for-like comparison.
2. Prior period Finished goods notionally restated for AASB15 impact
For
per
sona
l use
onl
y

MARKET AND STRATEGY UPDATEJARROD RITCHIE MANAGING DIRECTOR
For
per
sona
l use
onl
y

TPIEN
TERP
RISES.C
OM
0
2,000
4,000
6,000
8,000
10,000
12,000
14,000
16,000
18,000
20,000
0
20,000
40,000
60,000
80,000
100,000
120,000
2015 2016 2017 2018e
Harvested - World (LHS) Harvested - Australia (LHS)
TPI Enterprises (RHS)
The global harvest of raw opiate materials has declined rapidly, as TPI Enterprises has increased
• The global harvest of raw opiate materials (morphine, codeine and thebaine-rich poppy straw) has declined 47% since 2015.
• Codeine-rich poppy straw is declining the fastest, with Australia and France the historical primary cultivators.
• According to the INCB, Frances’ total area sown in codeine-rich poppy straw declined 63% to 1,1131 hectares in 2016.
• Similarly, Australia has decreased its total area sown in codeine-rich poppy straw from 4,652 hectares in 2015 to a total projected 1,022 hectares in 2017.
• As domestic and global cultivation of raw opiate materials have declined, TPI Enterprises has increased its share of plantings ahead of a normalisation of supply/demand, and an anticipated recovery in prices.
1. International Narcotics Control Board, ‘Estimated World Requirements for 2018’, page 106 Table 1.
PROGRESS UPDATE: MARKET SHARE GROWTH – CODEINE PHOSPHATE SUPPLY
Area harvested (ha)
25
For
per
sona
l use
onl
y

TPIEN
TERP
RISES.C
OM
TPI Enterprises invested to capitalise on declining global production, and CPO revenue is now growing rapidly
• Global consumption of CPO is relatively steady at approximately 365 tons per annum1 (graph to the right).
• The indicative revenue opportunity at this level of consumption is approximately A$275 million2 per annum.
• Despite global stocks exceeding demand and CPO prices remaining below through-the-cycle averages, TPI Enterprises’ lowest cost producer capability continues to yield new profitable sales contracts.
• The company has continue to increase its contracted volume share of the global CPO market, and is targeting 15% volume share by end-2019.
• TPI Enterprises expects to grow volume share through both expanding share with existing customers and new contract wins.
1. International Narcotics Control Board.2. Assumes an AUD/USD of 0.73 and a through-the-cycle CPO per kg price of US$550. In periods of excess supply, prices can vary below this level.
PROGRESS UPDATE: MARKET SHARE GROWTH – CPO SUPPLY
26
Tonnes of CPO Consumed1
280
290
300
310
320
330
340
350
360
370
380
2012 2013 2014 2015 2016
For
per
sona
l use
onl
y

TPIEN
TERP
RISES.C
OM
TPI Enterprises has secured substantial new CPO and CMO contracts
• New, significant codeine phosphate (CPO) supply contract announced 3 August 2018.
• Commenced supply in August 2018.
• 3-year term with a minimum contracted supply of 6 tonnes of CPO per annum.
• Minimum contracted revenues of A$9 million during the term of the contract.
• Continues the growth of TPI Norway’s API business which in the 6 months to 30 June 2018 delivered sales of API equivalent to the 12 months’ worth sales under prior ownership.
• Today TPI Enterprises also announces that it has been successful in signing two significant CMO contracts:
• The first contract will consume approximately 17 tonnes of CPO, with an 18 month term and this contract is expected to contribute A$15 million in revenue during its term.
• The second contract is for the supply of metformin tablets over an 18 month period with a total contract value of A$3 million.
TPI Enterprises continues to aggressively pursue other new contract opportunities in NRM, API and CMO.
PROGRESS UPDATE: MARKET SHARE GROWTH – NEW CONTRACTS
27
CPO Contract Update
CMO Contract Update
For
per
sona
l use
onl
y

TPIEN
TERP
RISES.C
OM
TPI Enterprises expects to diversify API revenue progressively through 2018 and beyond
• CPO is one of several APIs that TPI Enterprises is targeting.
• Currently, the company also produces and sells modest quantities of:
• Pholcodine
• TPI Enterprises is pursuing both growth in existing contracts and new contracts in each of the below-mentioned API opportunities.
• Dihydrocodeine Tartrate
• Codeine Base
• Morphine Sulphate
• Diamorphine hydrochloride
• Naloxone hydrochloride
• The estimated annual addressable market for sales for each of these APIs is meaningful (refer to the figures on the right).
PROGRESS UPDATE: REVENUE DIVERSIFICATION – ADDITIONAL APIs
1. Assumes a through-the-cycle API price per kg of US$550 and AUD/USD at time of publishing of 0.73.2. Assumes a through-the-cycle API prices for several additional APIs, and a AUD/USD at time of publishing of 0.73.3. Based on IMS data from 2013-2016 for the sale of Naloxone and an AUD/USD of 0.73
Codeine Phosphate (CPO1)
A$275MILLION PA
NEW Immediate Opportunities2
A$78MILLION PA
28
Anti-Addiction Opportunities3
A$470MILLION PA
ANNUAL ADDRESSABLE MARKET
For
per
sona
l use
onl
y

TPIEN
TERP
RISES.C
OM
PROGRESS UPDATECOST OPTIMISATION
Cost optimisation opportunity: Targeting A$3+ million reduction in Group overheads to < A$19 million in 20181
2017 annualised overhead expenses • TPI Norway: A$12.4 million2 • TPI Enterprises (ex-TPI Norway): A$9.6 million3
Cost saving initiatives• Norway FTE rationalisation (A$2.3 million gross4 - done)• Reduce growing costs (ongoing)
• System rationalisation (minimal savings - done)• Volume optimisation (ongoing)
Use of savings• Invest in working capital to grow CPO/CMO sales• Develop broader API sales portfolio
• Modest investment in finished dosage dossier(s) (~A$1 million, 2019 or later)
One-off costs to implement• 1H 2018 redundancy and legal costs: <A$0.2 million• 1H 2018 system integration charges: <A$0.3 million
• 2H 2018 one-off charges expected: None.
TPI Enterprises 2018 Half Year Result
Continued focus on maximising returns from TPI Norway
1. FY18 actual impact.2. TPI Enterprises – annualised 4Q2017 contribution.3. TPI Enterprises 1H2017 annualised.4. Prior to the addition of some incremental headcount to service new contracts.
29
For
per
sona
l use
onl
y

OUTLOOKJARROD RITCHIE MANAGING DIRECTOR
For
per
sona
l use
onl
y

TPIEN
TERP
RISES.C
OM
OUTLOOK: DELIVERING ON REVENUE GROWTH
TPI Enterprises is targeting A$50 million of revenue for calendar year 2018 reaffirming its estimate provided at the AGM in May 2018, representing +131% growth versus the prior corresponding period.
While market prices for NRM and API remain subdued, TPI Enterprises expects its lowest cost producer advantage to continue to assist in securing incremental sales contracts at commercially attractive margins.
TPI Enterprises has sufficient straw, WIP and NRM to meet sales targets for 2H 2018. Meeting its 2018 revenue target requires TPI Enterprises to contract modest additional sales volume in 2H 2018.
TPI Enterprises expects to sell significantly higher volumes of API in 2H 2018 which will assist profit margins versus 1H 2018.
Delivery of product into the new 3-year API contract commenced in August 2018.
The company expects to deliver double digit year on year growth in CMO revenues, assisted by the new CPO and metformin tableting contracts.
TPI Enterprises expects a modest contribution from seed sales (approximately A$0.5 million) in 2H 2018.
The company expects to contract approximately 5,000 – 6,000 hectares of planted area for the 2018 growing season.
TPI Enterprises expects to refinance its finance lease liability due November 2018 and is in active dialogue with debt providers.
TPI Enterprises 2018 Half Year Result 31
For
per
sona
l use
onl
y
TPIEN
TERP
RISES.C
OM
APPENDIX
TPI Enterprises 2018 Half Year Result 32
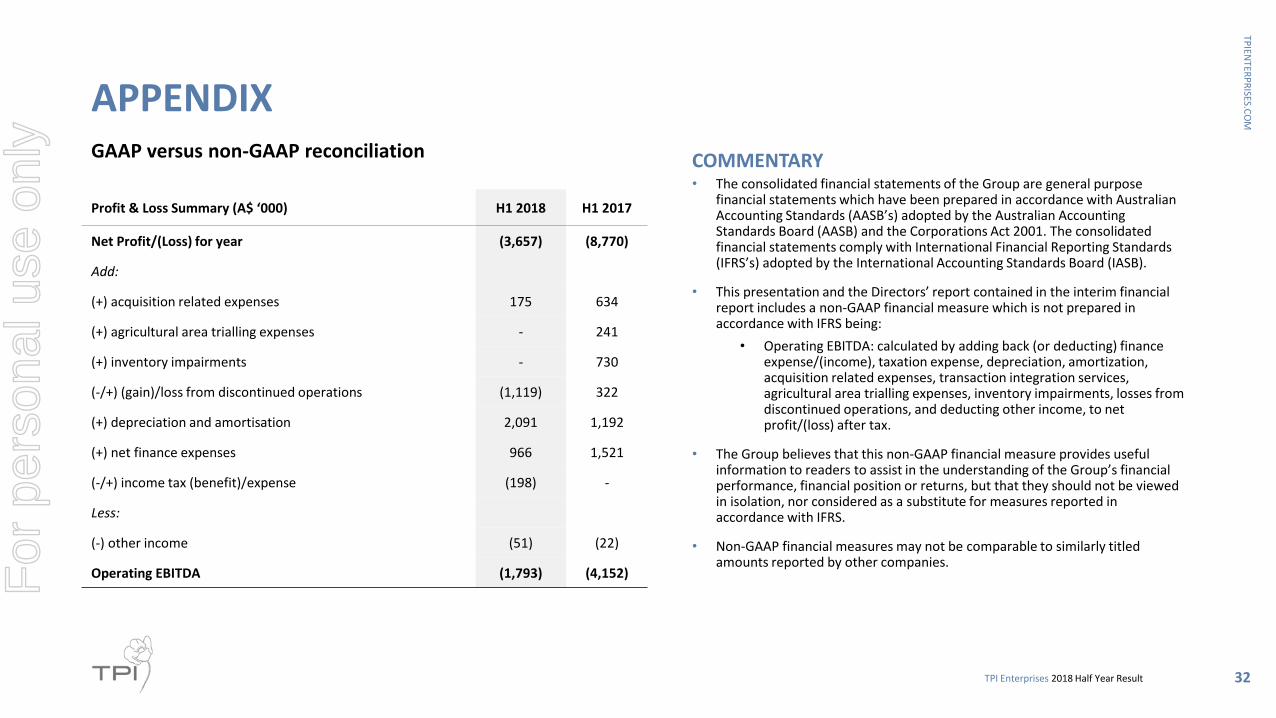
GAAP versus non-GAAP reconciliation
Profit & Loss Summary (A$ ‘000) H1 2018 H1 2017
Net Profit/(Loss) for year (3,657) (8,770)
Add:
(+) acquisition related expenses 175 634
(+) agricultural area trialling expenses - 241
(+) inventory impairments - 730
(-/+) (gain)/loss from discontinued operations (1,119) 322
(+) depreciation and amortisation 2,091 1,192
(+) net finance expenses 966 1,521
(-/+) income tax (benefit)/expense (198) -
Less:
(-) other income (51) (22)
Operating EBITDA (1,793) (4,152)
• The consolidated financial statements of the Group are general purpose financial statements which have been prepared in accordance with Australian Accounting Standards (AASB’s) adopted by the Australian Accounting Standards Board (AASB) and the Corporations Act 2001. The consolidated financial statements comply with International Financial Reporting Standards (IFRS’s) adopted by the International Accounting Standards Board (IASB).
• This presentation and the Directors’ report contained in the interim financial report includes a non-GAAP financial measure which is not prepared in accordance with IFRS being:
• Operating EBITDA: calculated by adding back (or deducting) finance expense/(income), taxation expense, depreciation, amortization, acquisition related expenses, transaction integration services, agricultural area trialling expenses, inventory impairments, losses from discontinued operations, and deducting other income, to net profit/(loss) after tax.
• The Group believes that this non-GAAP financial measure provides useful information to readers to assist in the understanding of the Group’s financial performance, financial position or returns, but that they should not be viewed in isolation, nor considered as a substitute for measures reported in accordance with IFRS.
• Non-GAAP financial measures may not be comparable to similarly titled amounts reported by other companies.
COMMENTARY
For
per
sona
l use
onl
y

For
per
sona
l use
onl
y


![УДК [281.5 : 248.211 + 248.217] : 215 Олександр Лисенко … · УДК [281.5 : 248.211 + 248.217] : 215 Олександр Лисенко, aсистент кафедри](https://img.dokumen.tips/doc/110x75/5f1fb58831df1a6f46661b4f/-2815-248211-248217-215-.jpg)