Embed Size (px)
Citation preview
Application No.: A.16-09- Exhibit No.: SCE-03 R Witnesses: B. Anderson
D. Bernaudo D. Kempf J. Lim L. Low S. Nagoshi D. Tunnicliff
(U 338-E)
2018 General Rate Case
Customer Service
Before the
Public Utilities Commission of the State of California
Rosemead, CaliforniaNovember, 2016
A
ERRATA
A2
2nd ERRATA

SUMMARY
O&M
This volume presents the Customer Service request of $199.964 million (constant 2015 $) in
operation and maintenance (O&M) expense for the 2018 Test Year forecast. SCE’s request is
$7.98 million below 2015 recorded adjusted O&M expense.
• Reflects $23.85 million of reductions that offset more than the proposed program changes.
• Includes $8.22 million ($9.97 million expense and $1.75 million benefits) related to the
proposed CS Re-Platform Project discussed in Exhibit SCE-04, Volume 3.
SCE proposes a Test Year OOR forecast of $28.177 million, a decrease of $4.077 million from
2015 recorded levels of $32.255 million primarily due to a proposed reduction to SCE’s Late
Payment Charge and the Non-Residential Connection Charge, and lower Opt-Out fee volumes.
Customer Service 2018 O&M Expense Forecast
(Constant 2015 $ millions) Excludes Uncollectibles
$27,981 $4.274
$198.69
$9.25
$7.15 $8.90
$27.981

8
1. Customer Service O&M Forecast 1
Customer Service forecasts a total 2018 Test Year O&M funding level of $199.964 2
million, $7.98 million less than the Base Year recorded costs. This forecast includes $23.85 million of 3
Operational Excellence reductions described in the previous section that offset more than the proposed 4
program changes and the O&M impact of the CS Re-Platform program. Figure I-1 below provides a 5
summary by FERC Account type and activity group: customer growth, program changes, CS 6
Re-Platform O&M expenses and benefits, and Operational Excellence. The Customer Service Test Year 7
request also includes an O&M net increase of $8.22 million ($9.97 million in expenses and $1.75 8
million in benefits) related to the planned implementation of a CS Re-Platform project that replaces the 9
obsolete Customer Service System (CSS). The CS Re-Platform project is described in detail in SCE-04, 10
Volume 3, and other Information Technology (IT)-related implementation costs as a result of CS 11
Re-Platform are described in SCE-04, Volume 1. Descriptions of the individual Customer Service FERC 12
account forecasts are described in detail within this exhibit. 13
$199.761
$8.18
$198.69
$9.25
$7.15 $8.90

9
Figure I-1 Customer Service
Summary of 2018 Test Year O&M Expense Forecast (Constant 2015 $ Millions)
Figure I-2 below provides Customer Service’s five-year recorded O&M expense history 1
and the O&M forecast including the 2018 Test Year.2
Line No. Functional Area 2015
RecordedCustomer Growth
Program Changes
CSReplatform
CSReplatform
Benefits
Operation Excellence 2018 Forecast
1 Distribution Acconts FERC 580, 586, 587 $34.76 $0.78 -$0.64 $0.00 ($0.58) ($1.18) $33.14
2 Customer Accounts FERC 901, 902, 903, 905 $149.86 $2.22 $4.05 $9.97 ($0.90) ($19.47) $145.73
3 CS&I Accounts FERC 907, 908 $23.33 $0.20 $1.03 $0.00 ($0.27) ($3.20) $21.09
4 Total $207.94 $3.21 $4.45 $9.97 ($1.75) ($23.85) $199.96
($2)($24)
$208 $3 $4 $10
$200
2015Recorded
CustomerGrowth
ProgramChanges
CS Re-platform CS Re-platformBenefits
OperationalExcellence
2018Forecast
$3.94
$0.95$4.25
$145.62$21.01
$199.77
$9$199
$8.90$8.90
$144.55$198.69

10
Figure I-2 Customer Service
Summary of O&M Test Year Forecast (Excluding Uncollectibles)
(Constant 2015 $000)
2. Customer Service Capital Expenditure Forecast 1
Customer Service forecasts the general capital expenditures necessary to deliver customer 2
service. Chapter VI of this exhibit provides the forecast for meters, specialized equipment, structures, 3
and improvements. Chapter VII of this exhibit provides the forecast for BCD specialized equipment, 4
structures, and improvements. Table I-2 summarizes the Customer Service capital expenditure forecast 5
for 2016 – 2020. 6
Forecast2011 2012 2013 2014 2015 2018
Labor 186,716 144,578 146,860 135,555 127,831 123,006 Non-labor 95,600 78,251 88,390 83,534 79,650 76,343 Other 221 656 235 259 460 615 Total 282,537 223,485 235,485 219,348 207,941 199,964
Expense Category
Recorded/Adjusted
$0
$50,000
$100,000
$150,000
$200,000
$250,000
$300,000
2011 2012 2013 2014 2015 2018
Labor Non-labor Other
122,847
199,761
76,299
$122,530
$75,543$198,688
76
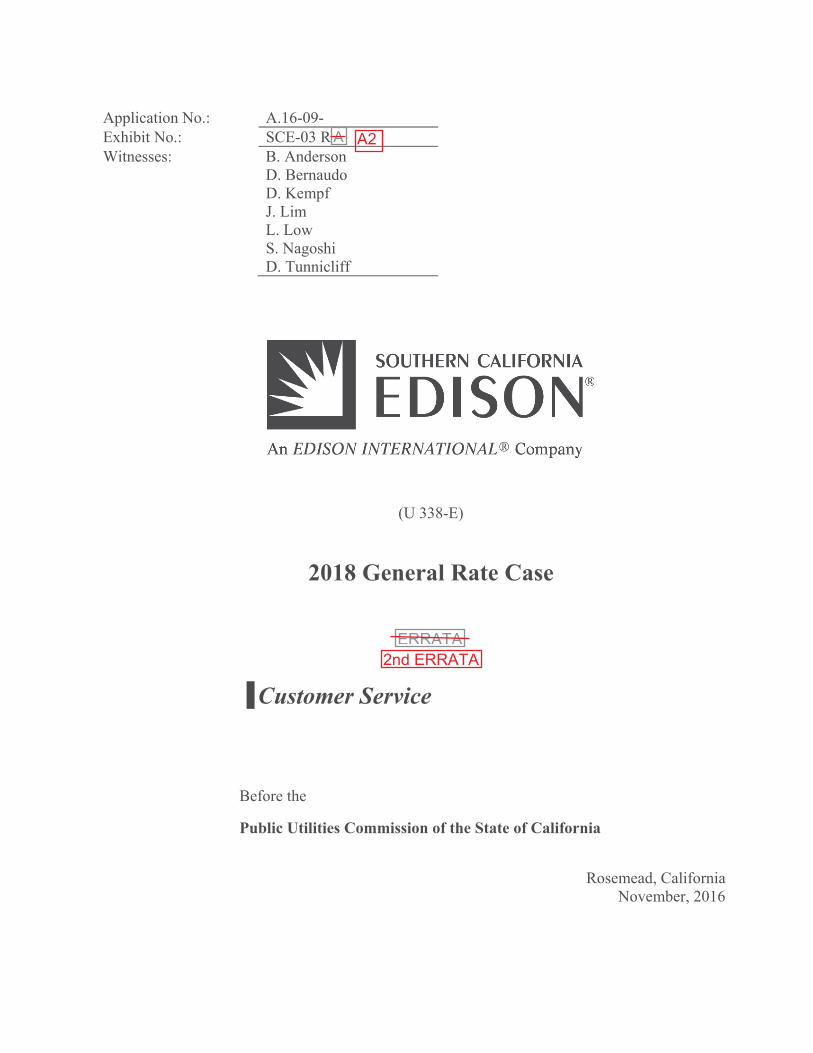
a) Historic Variance Analysis for Billing Services 1
As shown in Figure IV-20, over the five year period from 2011 to 2015, Billing 2
Services’ recorded adjusted costs declined 20 percent from $34.3 million to $27.4 million due to 3
increased efficiencies and streamlining of work functions further discussed below. 4
Figure IV-20 Billing Services
Recorded 2011-2015 / Forecast 2016-2018 FERC Account 903.500
(Constant 2015 $000)
(1) Analysis of Billing Services Variance (Excluding Policy Adjustments) 5
Labor expenses decreased by $5.0 million or 20 percent from $24.7 6
million in 2011 to $19.7 million in 2015. Implementation of ESC significantly reduced Billing 7
operations labor from 2011 through 2013 as a result of further ramping down usage and billing 8
exceptions post ESC deployment. Labor expenses continued to decline in 2014 and 2015 due to 9
continued operational efficiencies such as automating one-step exception processing and streamlining 10
$19,732
$7,810
$28,157
$19,413
$7,056
$27,084
80
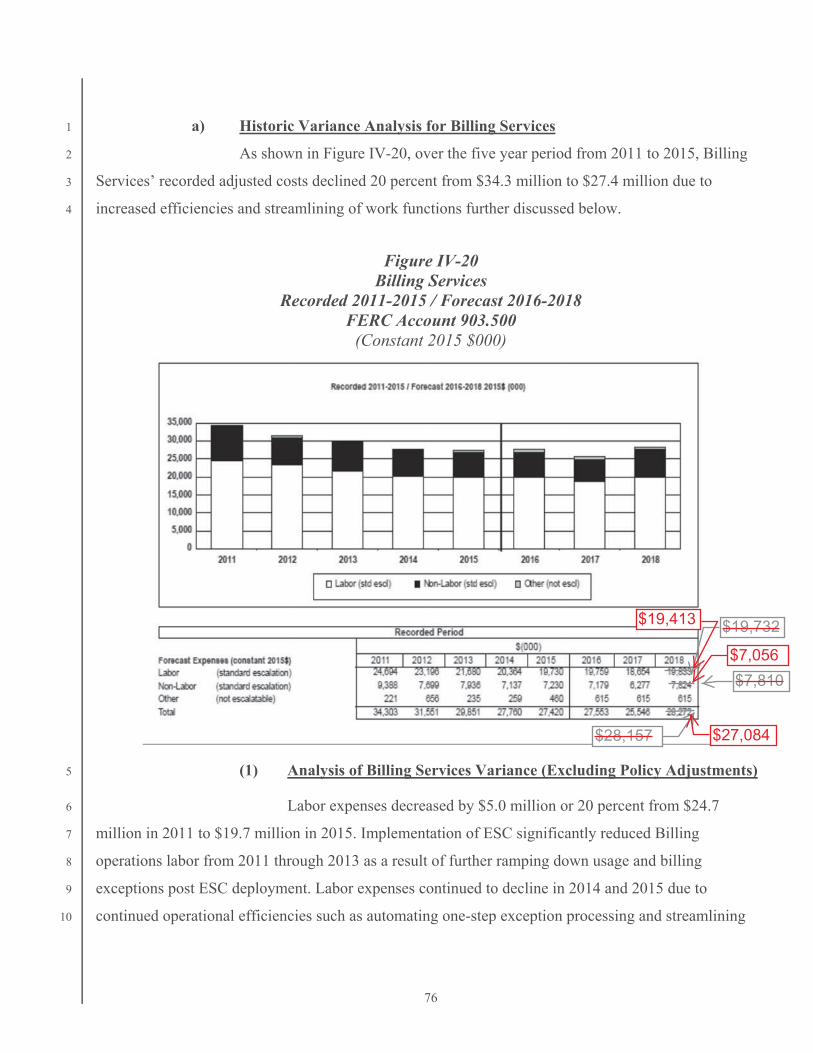
(2) Test Year Adjustments 1
SCE’s forecast of Test Year O&M expenses for Billing reflects increased 2
expenses due to customer growth, program changes, and CS Re-Platform net expenses, offset by 3
reduced expenses associated with Operational Excellence initiatives. These adjustments are described in 4
detail below and summarized in Table IV-19. The resulting O&M forecast is shown in Figure IV-20 and 5
Figure IV-22 illustrates the relative levels of the 2015 Base Year expenses to the 2018 Test Year 6
forecast and the forecast adjustments used to arrive at the forecast cost for SCE’s Billing Services in 7
2018.8
Table IV-19 Billing Test Year O&M Adjustment Summary
(Constant 2015 $000)
Continued from the previous pageCPUC stated that if costs have shown significant fluctuations from year to year, an average of recorded expenses is the appropriate basis for estimating Test Year expenses. For Billing Services, other expenses have varied significantly over the period 2011-2015.
Line No. Description Labor Non-Labor Other Total
1 Customer Growth $453 $166 $6192 Program Changes3 Policy Adjustments ($94) ($94)4 Service Guarantees $249 $2495 Net Energy Metering $154 $414 $5686 CCA Processing $610 $668 $1,2788 CS Re-Platform Expenses $1,900 $933 $2,8339 CS Re-Platform Benefits ($423) ($423)10 Operational Excellence11 Electronic Billing ($1,257) ($1,257)12 Increased Vendor Partnering ($1,594) ($1,594)13 Support Function Reduction ($998) ($330) ($1,328)15 Total Test Year Adjustments $103 $594 $155 $852
$509 $654 $1,163
$580$1 $736
$1,582 $177 $1,760
($317) ($176) ($337

84
costs. Temporary staff in RSO will be required to maintain the legacy billing system while SCE 1
employees train on the new SAP billing platform. SCE forecasts incremental Test Year expenses of 2
$2.833 million to train temporary staff and to maintain the billing processes under the legacy system 3
while SCE staff learns the new SAP-based system. 4
(i) RSO Supplemental Staff – SCE Labor 5
The incremental labor cost forecast of $5.700 million for 6
supplemental SCE labor in RSO is due to an additional 66 full-time employees (FTEs) at an average 7
monthly rate of $4,580 needed to supplement RSO employees over a 19-month period. For two months 8
from June through July 2019, the supplemental RSO staff will be trained on the legacy system to handle 9
credit, billing, collection and payment processes while RSO staff is trained on the new SAP-based 10
CR&B module and associated applications for five months from August to December 2019. The RSO 11
supplemental staff will also be trained in phases during this four-month period. Additionally, when the 12
new system goes live in early 2020, the average handling time is expected to increase 50 percent due to 13
the learning curve associated with the new system and business processes. As a result, a ten percent 14
increase in exception volume is expected. The supplemental staff will also be trained on the new SAP 15
system to support the increase in handling time and exception volume. The Test Year forecast is based 16
on levelized expenses for this GRC period (2018-2020) and equals $1.900 million.61 17
(ii) RSO Staff Augmentation – Contract Services 18
The incremental cost forecast of $2.800 million for contract 19
services in RSO is due to an additional 42 FTEs at an average monthly rate of $3,501 needed to 20
supplement RSO employees over a 19-month period. For two months from June through July 2019, the 21
contract RSO staff will be trained on the legacy system to handle credit, billing, collection and payment 22
processes while RSO staff is trained on the new SAP based CR&B module and associated applications 23
for five months from August to December 2019. The RSO contract staff will also be trained in phases 24
during this four-month period. When the new system goes live in early 2020, the average handling time 25
is expected to increase 50 percent due to the learning curve associated with the new system and business 26
61 Refer to WP SCE-03 Ch. I-VI, p. 160 regarding the expected RSO Supplemental Staff expenses for the CS
Re-Platform project.
$4.747
55
$1.582
eight
$532,000

85
processes, and a ten percent increase in exception volume is expected. The contract staff will also be 1
trained on the new SAP system to support the increase in handling time and exception volume. The Test 2
Year forecast is based on levelized expenses for this GRC period (2018-2020) and equals $933,000.62 3
(d) CS Re-Platform O&M Benefits 4
SCE expects operational efficiencies will be enabled by improved 5
technology, automation of processes, and the corresponding reductions in FTEs in future rate cases 6
(further described in SCE-04, Vol. 03). SCE forecasts the benefits charged to FERC Account 903.500 7
from implementing the new billing services system to total $423,000, as improvements to the billing 8
system reduce transaction handling and processing time.63 9
(e) Operational Excellence 10
Over the next three years, RSO forecasts $4.178 million in 11
Operational Excellence savings in FERC 903.500. RSO plans to achieve this through (1) electronic 12
billing, (2) increased partnering with vendors, and (3) reduction of support functions within Billing 13
Services. These initiatives are described further below. 14
(i) Electronic Billing 15
RSO’s electronic billing initiative will continue to migrate 16
customers to its online billing and increase postage savings as described in Postage testimony for FERC 17
903.100. As part of the benefits of increased customer enrollment in electronic billing, RSO expects to 18
save $1.257 million by reducing printing, inserting, and mailing costs by the end of 2018.64 This cost 19
savings is calculated based on saving $0.10 per mailing multiplied by the 12.569 million total 20
cumulative new ebilling transactions forecast by the Test Year. The increased forecast customer 21
enrollments is contingent on the Digital Customer Self-Service capitalized software project being 22
62 Refer to WP SCE-03 Ch. I-VI, p. 160 regarding the expected RSO Staff Augmentation expenses for the CS
Re-Platform project. 63 The CS Re-Platform benefits included in SCE’s 2018 Test Year forecast are proposed, contingent upon
approval of the corresponding CS Re-Platform project costs. Should the Commission not adopt the proposed CS Re-Platform costs in this FERC activity, the corresponding benefits must also be removed from the Test Year forecast. Refer to WP SCE-03 Ch. I-VI, p. 161 regarding the expected benefits for the CS Re-Platform project.
64 Refer to WP SCE-03 Ch. I-VI, p. 162 regarding the Operational Excellence reduction associated with E-Billing.
$177,000
86
approved by the Commission. See SCE-03, Vol. 2 for details on the Digital Customer Self-Service 1
project.2
(ii) Increased Vendor Partnering3
RSO forecasts savings resulting from partnering with 4
vendors to perform selected work functions. Beginning in 2016, RSO started to transition simple 5
transaction work, with low to medium complexity, to an external vendor. For example, in 2016 vendors 6
will perform Net Energy Metering application processing for accounts smaller than 10 kW, saving 7
$268,000. RSO plans to continue to expand vendor partnering opportunities through 2018, which can 8
maintain service levels and reduce costs for customers. By the 2018 Test Year, RSO forecasts saving 9
$1.594 million in labor costs from partnering with vendors.6510
(iii) Support Function Reduction11
RSO plans to reduce Test Year support expenses that 12
record in FERC Account 903.500. The Operational Excellence initiative is forecast to save $1.328 13
million in labor and non-labor by streamlining, prioritizing, and eliminating selected support functions.6614
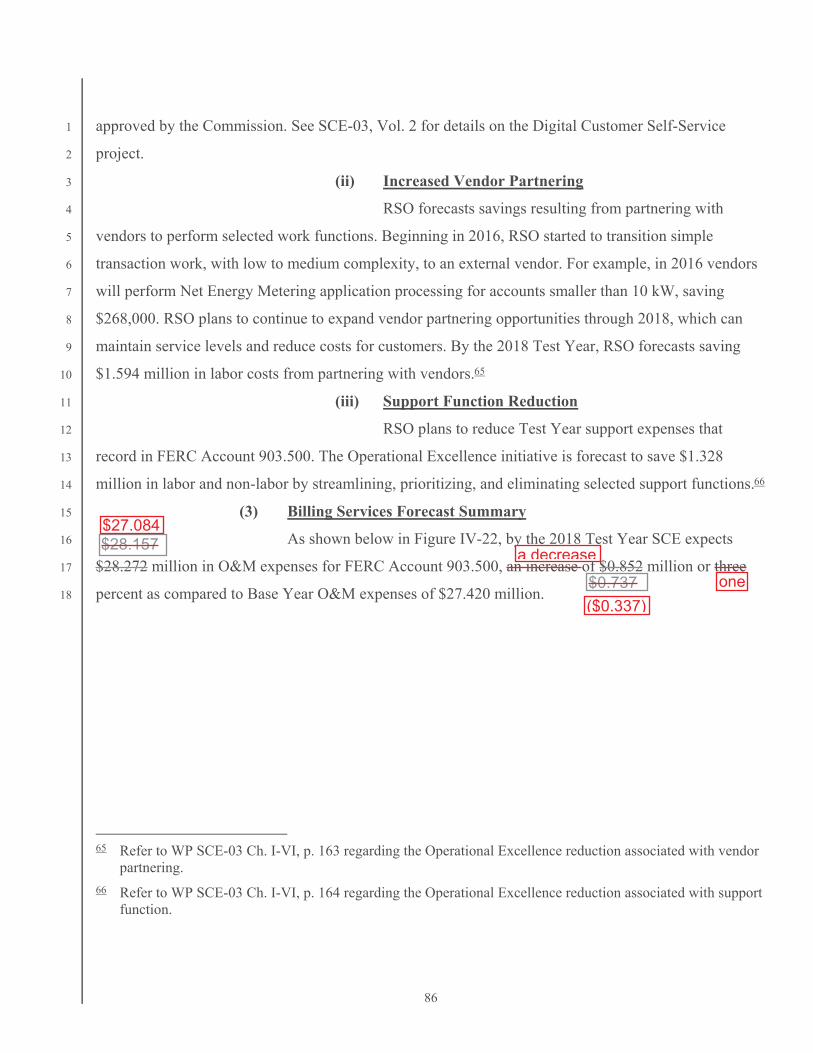
(3) Billing Services Forecast Summary 15
As shown below in Figure IV-22, by the 2018 Test Year SCE expects 16
$28.272 million in O&M expenses for FERC Account 903.500, an increase of $0.852 million or three 17
percent as compared to Base Year O&M expenses of $27.420 million. 18
65 Refer to WP SCE-03 Ch. I-VI, p. 163 regarding the Operational Excellence reduction associated with vendor partnering.
66 Refer to WP SCE-03 Ch. I-VI, p. 164 regarding the Operational Excellence reduction associated with support function.
$28.157
$0.737
$27.084
a decrease
($0.337)one

87
Figure IV-22 Billing Services Comparison of 2015 Base Year to 2018 Test Year
FERC Account 903.500 (Constant 2015 $000)
C. Credit and Payment Services [FERC Account 903.200] 1
The Credit and Payment Services function is described in Section IV.C.1 below. The O&M 2
expenses associated with this function are recorded in FERC Account 903.200. The recorded and 3
forecast O&M expenses associated with this function are described in Section IV.C.2 below. 4
1. Credit and Payment Services Functions and Base Year Operating Results 5
Credit and Payment Services consists of credit policy development and enforcement, 6
customer verification, fraud prevention, customer risk assessment, collection activities, and the overall 7
management of credit-related operations to minimize arrearages and uncollectible expense. A primary 8
goal of the Credit group is to mitigate loss of revenue by acquiring adequate security for 9
newly-established and higher-risk existing accounts and to pursue collection of unpaid balances. These 10
processes have been prescribed by the Commission and implemented in accordance with SCE’s 11
established tariffs, Rules 6 and 7 for Credit Services. 12
The Payment Services function is responsible for oversight associated with providing 13
SCE customers with convenient, efficient, and cost-effective payment options. While SCE customers 14
can continue to pay their electric bill through the U.S. mail, they also have seven electronic payment 15
$28,272( $423 )
( $4,178 )
$27,420$619
$2,001$2,833
$-
$5,000
$10,000
$15,000
$20,000
$25,000
$30,000
$35,000
2015 Recorded CustomerGrowth
ProgramChanges
CSRe-platform
CSRe-platform
Benefits
OperationalExcellence
2018Forecast
Program ChangesPolicy Adjustments ($94)Service Guarantee $249NEM $568CCA $1,278Total Program Changes $2,001
Operational ExcellenceElectronic Billing ($1,257)Vendor Partnering ($1,594)Support Function ($1,328)Total Program Changes ($4,178)
$1,163
$28,157$1,886
$1,886
$1,760 $27,084

104
As of June 2016, over 1.5 million customers, or 33 percent, receive their bills 1
electronically as opposed to mailed. In recent years, mailing costs have been lowered significantly by 2
encouraging customers to convert to electronic billing.89 SCE continues to explore options to encourage 3
customers to receive their bill electronically to reduce postage and other paper-statement-related costs. 4
a) Operating Results for Postage 5
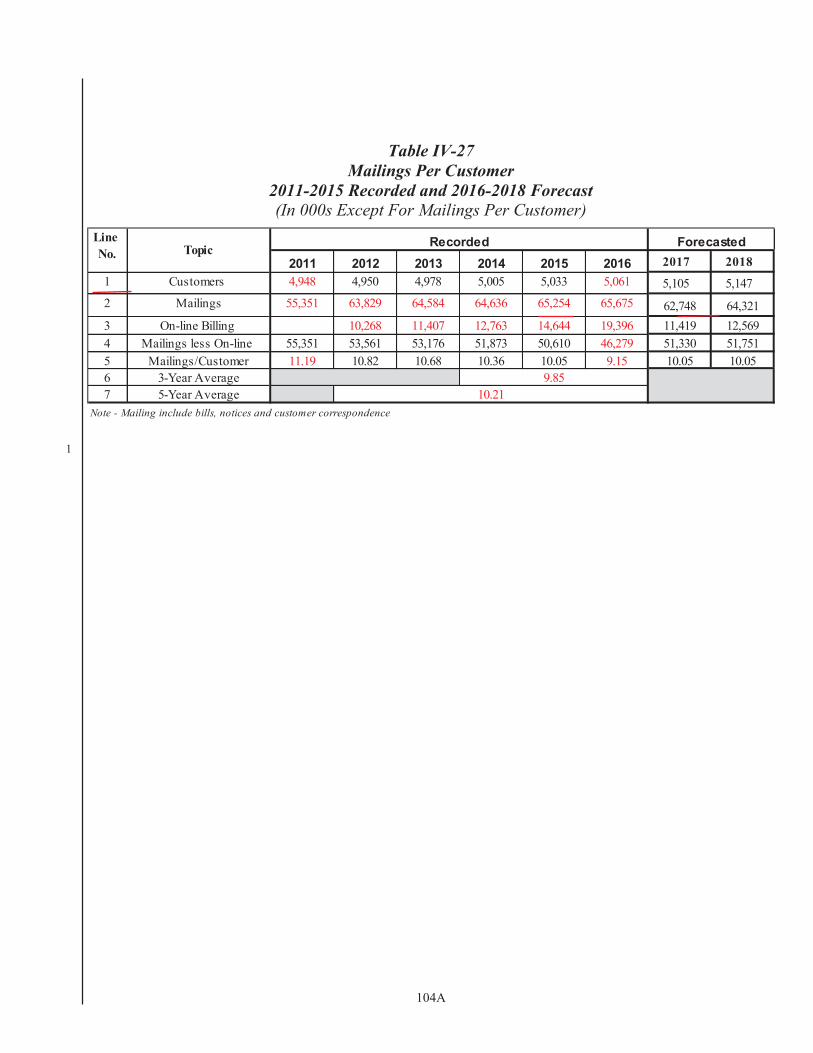
As shown in Table IV-27 below, RSO reduced mailings by 11 percent, from 6
11.23 mailings per customer in 2011 to 10.05 mailings per customer in 2015. This reduction corresponds 7
to the increase in on-line electronic billing transactions that began in 2013 and increased to 2.845 8
million on-line billing electronic transactions in 2015. 9
Table IV-27 Mailings Per Customer
2011-2015 Recorded and 2016-2018 Forecast (In 000s Except For Mailings Per Customer)
The postage rates in effect and a breakdown of recorded mailings by type for each 10
year from 2011-2015 are shown in Table IV-28. Due to its bulk mailing operations, SCE receives 11
postage discounts for six types of mailings: 12
5-Digit Presorted mailings, 13
3-Digit Presorted mailings, 14
89 Customers can elect to have their bills mailed through an electronic means (e.g., e-mail) or mailed through the United States Postal Service (USPS). In accordance with SCE Tariffs, Rule 1 (Definitions), Customer’s Mailing Address(es): The physical and electronic mailing address specified in a customer’s application or contract, or any other address subsequently given to SCE by the customer, to which any bill, notice, or other communication is to be mailed.
2011 2012 2013 2014 2015 2016 2017 20181 4,929 4,950 4,978 5,005 5,033 5,067 5,105 5,1472 N/A N/A 55,694 56,252 57,514 56,083 62,748 64,3213 N/A N/A 1,856 2,057 2,845 5,135 11,419 12,5694 55,351 53,561 53,176 51,873 50,610 50,948 51,330 51,7515 11.23 10.82 10.68 10.36 10.05 10.05 10.05 10.0567
Note - Mailings include bills, notices and customer correspondence
10.365-Year Average 10.63
CustomersMailings On-line Billing Transactions Mailings less On-line Billing Mailings / Customer3-Year Average
LineNo. Topic Recorded Forecast
2,518 6,9044,379
6,90414,644
See Table on next page
2012
11.19
104A
Table IV-27 Mailings Per Customer
2011-2015 Recorded and 2016-2018 Forecast (In 000s Except For Mailings Per Customer)
1
2011 2012 2013 2014 2015 2016 2017 20181 4,948 4,950 4,978 5,005 5,033 5,061 5,105 5,1472 55,351 63,829 64,584 64,636 65,254 65,675 62,748 64,3213 10,268 11,407 12,763 14,644 19,396 11,419 12,5694 55,351 53,561 53,176 51,873 50,610 46,279 51,330 51,7515 11.19 10.82 10.68 10.36 10.05 9.15 10.05 10.0567
Note - Mailing include bills, notices and customer correspondence10.21
9.855-Year Average
Customers ( )Mailings
On-line Billing Mailings less On-line
Mailings/Customer
Forecasted
3-Year Average
Line No. Topic Recorded

107
Table IV-28 Postage Rates and Total Expense by Type of Mailing
FERC Account 903.100
2011 2012 2013 2014 2015 2016 2017 201812 0.337 0.347 0.357 0.378 0.388 0.373 0.373 0.3733 0.362 0.371 0.381 0.403 0.413 0.396 0.396 0.3964 0.365 0.371 0.381 0.403 0.413 0.396 0.396 0.3965 0.387 0.401 0.402 0.432 0.436 0.416 0.416 0.4166 0.368 0.374 0.384 0.406 0.416 0.399 0.399 0.3997 0.450 0.374 0.384 0.406 0.416 0.399 0.399 0.3998 0.440 0.450 0.460 0.480 0.485 0.465 0.465 0.4659 0.904 0.698 0.696 0.671 0.817 0.681 0.681 0.68110 Non-Manifest 1st Class1 0.368 0.374 0.384 0.406 0.416 0.399 0.399 0.39911 Non-Manifest 1st Class Overweights 0.493 0.374 0.460 0.406 0.416 0.399 0.399 0.39912 Summary 1st Class2 N/A N/A N/A N/A N/A N/A N/A N/A13 Summary 1st Class Overweights2 1.881 1.924 1.477 2.246 2.201 2.044 2.044 2.04414 0.368 0.374 0.384 0.406 0.416 0.399 0.399 0.39915 0.403 0.412 0.384 0.408 0.417 0.399 0.399 0.39916 0.356 0.362 0.386 0.406 0.416 0.385 0.385 0.3851718 $11,236 $12,934 $13,599 $14,242 $13,956 $13,654 $13,756 $13,86919 $3,733 $4,072 $4,222 $4,033 $4,156 $4,051 $4,081 $4,11520 $87 $79 $82 $91 $121 $117 $118 $11921 $178 $218 $228 $241 $266 $256 $258 $26022 $43 $.2 $.1 $.0 $.0 $.0 $.0 $.023 $.5 $108 $ $ $1 $1 $1 $124 $26 $79 $89 $81 $74 $72 $72 $7325 $.1 $.3 $.4 $.3 $.5 $.4 $.4 $.426 Non-Manifest 1st Class1 $552 $263 $248 $260 $253 $246 $248 $25027 Non-Manifest 1st Class Overweights $2,733 $412 $ $ $ $.0 $.0 $.028 Summary 1st Class2 N/A N/A N/A N/A N/A N/A N/A N/A29 Summary 1st Class Overweights2 $957 $387 $162 $272 $322 $307 $310 $31230 $393 $411 $392 $528 $546 $531 $535 $53931 $887 $406 $440 $373 $358 $376 $379 $38232 -$571 $4 $63 $44 $22 $12 $12 $1233 $252 $238 $212 $199 $166 $124 $124 $12434 $706 $397 $191 $187 $246 $90 $90 $9035 $21,213 $20,008 $19,931 $20,551 $20,486 $19,839 $19,986 $20,14836 N/A N/A N/A N/A N/A -$1,977 -$4,396 -$4,83937 $21,213 $20,008 $19,931 $20,551 $20,486 $17,862 $15,590 $15,309
1 Included all Non-Manifest, Late notices & Miscellaneous pieces.2 These pieces did not include late notices or Miscellaneous pieces.
postage fee corrections/charges.Note: - All historical recorded costs reflect actual postage rate increases. - N/A's indicate mailing category did not exist in recorded year and on occasion new mailing rate will overlap with old rate. - Negative amounts displayed for pre-paid meter postage indicate over budget expenses.
Total
3 Adjusted amount in Pitney Bowes meters and bank account less roll over from previous year.4 Customer correspondence generated by Revenue Services and Customer Contact Center.5 Postage related costs associated with Intelligent Mail Barcode, Address Cleansing, EDI Charges, Timing of Bank Reconciliation, and USPS
Misc PiecesPrepaid Meter Postage3
Other Mailings4
Other Postage related activities5
Sub-totalOnline Billing Productivity Adjustment
Mixed AADC (Automated Area Distribution Center)Misc 1st ClassMisc 1st Class OverweightsFull 1st Class OverweightsFull 1st Class Overweights (Over 2oz)
Late Notices
Postal Expense (Nominal $000) In 2016 ($000s)5 Digit3 DigitAADC (Automated Area Distribution Center)
Misc 1st Class OverweightsFull 1st Class OverweightsFull 1st Class Overweights (Over 2oz)
Late NoticesMisc Pieces
Weighted Average
Postal Rate Category5 Digit3 DigitAADC (Automated Area Distribution Center)Mixed AADC (Automated Area Distribution Center)Misc 1st Class
Line No. Type of Mailing Recorded (Nominal $) Forecast (2016 $)

119
B. CCC Functions and Base Year Operating Results 1
This section describes the CCC’s functions and its Base Year operating results. The functions 2
performed by the CCC include handling inbound calls through IVR and CSRs, making outbound calls, 3
providing eChannel services to handle communications for customers using e-mail and web chat, and 4
operations support. These functions are critical to SCE’s ability to respond to customer requests for 5
service, information regarding their accounts, and SCE programs. Historical CCC activity levels for the 6
period 2011 through 2015 are summarized in Table V-31 below. 7
Table V-31 CCC Functions and Activity Levels
2011-2015
1. Inbound Call Handling 8
Inbound calls include customer requests and inquiries (e.g., service establishment and 9
transfer of service, payment arrangements, billing inquiries, and credit extensions), reports of power 10
outages, energy solutions, new programs and services (e.g., dynamic pricing, time-of-use (TOU), net 11
energy metering, and plug-in electric vehicle rate options), as well as 911 calls from local police and fire 12
agencies. Through SCE’s toll-free numbers, the CCC handled over 16.8 million live agent (CSR) and 13
IVR inbound calls in 2015—an increase of 6.7 percent over 2014 and 15.7 percent over 2011. In 2015, 14
live-agent call volumes decreased by 9.5 percent compared to 2014, while IVR-completed call volume 15
Line No. Function 2011 2012 2013 2014 2015
12 Live Agent Call Volume Handled 8,880,232 8,377,067 8,153,757 7,916,466 7,168,069 3 IVR Call Volume Completed 5,631,192 5,930,381 7,282,185 7,819,150 9,627,234 4 Total Call Volume 14,511,424 14,307,448 15,435,942 15,735,616 16,795,303 56 Outbound IVR Credit Calls 8,683,684 8,361,922 6,963,973 6,498,630 6,790,773 7 Outbound IVR Unplanned Outage Calls 496,734 460,714 404,963 488,039 451,139 8 Outbound IVR Planned Outage Calls 2,107,233 2,444,126 3,188,857 3,597,168 3,833,258 9
10 eChannel Service Orders 280,327 304,743 321,012 143,866 84,419 11 Web Chat - 13,440 40,523 42,848 17,190 12 Inbound Correspondence 491,269 517,567 468,520 402,986 461,269 13 Outbound Correspondence 175,715 117,256 82,669 72,153 80,286 14 Outbound Brochures 332,319 422,811 429,822 464,396 331,606 15 Billing Inquiry Investigations Completed 72,627 47,453 21,853 13,732 9,944 16 Teletypewriter (TTY) 166 87 65 46 81
Inbound Calls
Outbound Calls
Other Communication Channels
358,193

135
VI. 1
CSOD CAPITAL 2
This chapter addresses the CSOD capital requirements from 2016 through 2020 and relates only 3
to MSO operations. The MSO capital requirements include the meters needed to meet growth and 4
replacement expectations for all SCE customers, structures and improvements such as meter tool kits, 5
and specialized equipment and meters. The largest component of the MSO capital requirements is 6
related to meters, which represent approximately 98 percent of the total CSOD capital forecast. The 7
capital forecast requirements are shown in Table VI-34. 8
Table VI-34 Capital Requirements119
(Nominal $ millions)
A. Meter Capital 9
This section sets forth the capital requirements for meters and meter-related work and describes 10
the basis for the meter volume forecasts by type of work and by customer class. This section also 11
identifies the cost for the meters and meter-related work and multiplies this cost by the forecast volumes 12
to arrive at a forecast for meter capital. For 2018, SCE requires $36.2 million in meter capital. 13
1. Meter and Meter Related Work 14
MSO forecasts the volume of meters for 2016 through 2020 needed to meet expected 15
customer growth and to replace defective or damaged meters for all of SCE’s residential, commercial, 16
industrial, and agricultural customers. MSO develops the meter volume forecasts for meters such as the 17
ESC meter, the RTEM meters, and the legacy non-communicating electromechanical meters. The 18
following sections describe the different types of meters by type of work and describes how meter 19
volume estimates were developed. 20
119 Refer to WP SCE-03 Ch. I-VI, pp. 271-277 for additional detail regarding CSOD capital expenditures.
13.131 13.205

190
Table IX-50 Key SCE Online Usage Trends in 2011-2015
Customers increasingly use digital channels for interacting with SCE, including energy 1
usage visits, service turn on/off/transfer, delivery of electronic bills, and electronic payments. 2
As approved in its 2015 GRC, SCE implemented several key initiatives. For each of these 3
new initiatives, Digital Customer Experience defined the front-end user experience, measured usability 4
with a multi-step customer research framework, and incorporated feedback to support usability and 5
customer satisfaction. The key Digital Customer Experience initiatives implemented in 2015 to meet 6
continual digital channel growth are described below. 7
a) Optimized, Maintained, and Delivered Web Accessible and In-Language 8
Services 9
As part of our ongoing commitment to web accessibility, SCE incorporated 10
accessibility reviews to our standard content production process so that all pages and documents 11
published on SCE.com meet WCAG 2.0 AA compliance standards. Since 2013, we have remediated 12
over 500 documents, continue to conduct annual accessibility audits of all SCE.com content and 13
applications, and require accessibility training for all members of our content production teams. 14
For in-language support, we continue to maintain content in Spanish, Chinese, 15
Vietnamese, and Korean. Since 2013, we have translated 200 pages into the aforementioned languages, 16
resulting in about 80 percent of our English website that has an equivalent in-language page. 17
Line No. 2011 2012 2013 2014 2015
1 20,910,242 26,492,752 29,127,161 31,854,488 36,421,701 2 926,228 4,195,711 4,436,769 6,238,074 6,322,741 3 152,909 189,754 135,452 199,081 280,462 4 195,288 270,627 207,648 263,729 321,792 5 9,474,140 10,565,658 11,405,473 12,531,793 14,642,169 6 7,330,999 7,877,682 7,432,267 7,361,123 8,303,113 7 703,225 558,258 485,595 576,718 592,306 8 N/A 29,008 46,678 42,604 82,077 9 993 37,982 77,332 114,800 102,376 10 304,784 352,638 354,624 495,028 408,457
Notes: 1. Includes only enrollments via SCE.com; does not include enrollment via CheckFree.2. Includes electronic payments made through SCE.com only.3. SCE's mobile application was released in July, 2012. Figures do not include downloads of SCE's Demand Response application.
Mobile App Downloads [3]
Password Reset Report an Outage
Outage Center PageviewsPayments Transactions [2]Bills DeliveredOnline Billing Enrollments [1]Service Turn On/Off/Transfer RequestsEnergy Usage VisitsSCE.com Visits
Metrics
31,856,096
494,975 408,442
36,423,401
147,188