Embed Size (px)
Citation preview

No portion of this document may be reproduced, scanned into an electronic system, distributed, publicly displayed or used as the basis of derivative works without attributing Bloomberg Finance L.P. and the Business Council for Sustainable Energy. For more information on terms of use, please contact [email protected]. Copyright and Disclaimer notice on the last page applies throughout. Developed in partnership with the Business Council for Sustainable Energy.
2018
Sustainable Energyin AmericaFactbook
GET THE FACTS
www.bcse.org
1 © Bloomberg Finance LP 2018. Developed in partnership with The Business Council for Sustainable Energy.
The 2018 Sustainable Energy in America Factbook is the sixth in a series documenting the revolution in energy production,
delivery, and consumption in the U.S. This most recent installment surveys the landmark developments that took place in
2017 – a year in which the transformation of the U.S. energy sector rapidly intensified, even in the face of domestic policy
uncertainty.
Renewable energy output in the power sector soared to a record high on the back of a boom year for new renewables
capacity additions, as well as the first full year of service for renewable facilities commissioned in 2016. Emissions from
electricity production shrank as a result, achieving their lowest levels in at least two decades. At the same time, consumers
are devoting less of their household spending towards electricity than at any other time on record. Power prices for industrial
users also remained low, giving the U.S. a global competitive advantage in attracting energy-intensive industries.
The deployment of sustainable energy technologies has further supported a more productive U.S. economy. Economic
growth picked up to an estimated 2.3%, even as energy consumption waned, reflecting the U.S.’s rising energy productivity.
The renewables, energy efficiency, and natural gas sectors also supported the U.S. economy by providing jobs for roughly
three million Americans.
Looking outward, the U.S. solidified its role as a global exporter of liquefied natural gas, for the first time spending every
month of the year as a net exporter – rather than importer – of natural gas. And despite the federal government’s
announcement to withdraw from the Paris Agreement on climate change, U.S. corporations, states, and cities came together
to pursue a sustainable future under the We Are Still In initiative.
The Sustainable Energy in America Factbook provides a detailed look at the state of U.S. energy and the role that new
technologies, such as batteries and smart thermostats, are playing in reshaping the industry. The Factbook is researched
and produced by Bloomberg New Energy Finance and commissioned by the Business Council for Sustainable Energy. As
always, the goal is to offer simple, accurate benchmarks on the status and contributions of new sustainable energy
technologies.
Overview

2 © Bloomberg Finance LP 2018. Developed in partnership with The Business Council for Sustainable Energy.
1. Introduction
2. A look across
the U.S. energy
sector
3. Natural gas
4. Large-scale
renewable
electricity and
CCS
2.1 Bird’s eye
2.2. Policy, finance, economics
4.1 Solar (PV, solar thermal)
4.2 Wind
4.3 Biomass, biogas, waste-to-
energy
4.4 Geothermal
4.5 Hydropower
4.6 CCS
5. Distributed
power and
storage
5.1 Small-scale solar
5.2 Combined heat and power and
waste-heat-to-power
5.4 Energy storage
6. Demand-
side energy
efficiency
6.1 Energy efficiency
6.2 Demand response and digital
energy
7. Sustainable
transportation
7.1 Electric vehicles
7.2 Natural gas vehicles
7.3 Biofuels
Table of Contents
5.3 Fuel cells (stationary)

3 © Bloomberg Finance LP 2018. Developed in partnership with The Business Council for Sustainable Energy.
Notes: (1) The 2014 Factbook can be found at http://www.bcse.org/factbook/pdfs/2014%20Sustainable%20Energy%20in%20America%20Factbook.pdf
What is it? What’s new?
• Aims to augment existing, reputable sources of
information on U.S. energy
• Focuses on renewables, efficiency, and natural gas
• Fills important data gaps in certain areas (e.g., clean
energy investment flows, contribution of distributed
energy)
• Contains data through the end of 2017 wherever possible
• Employs Bloomberg New Energy Finance data in most
cases, augmented by EIA, FERC, ACEEE, LBNL, and
other sources where necessary
• Contains the very latest information on new energy
technology costs
• Has been graciously underwritten by the Business
Council for Sustainable Energy
• Is in its sixth edition (first published in January 2013)
● New coverage: This report contains data shown for the
first time in the Factbook series, including jobs produced
by the sustainable energy sector, utility smart thermostat
programs, and net metering developments.
● Updated analysis: Most charts have been extended by
one year to capture the latest data.
● 2017 developments: The text in the slides highlights
major changes that occurred over the past year.
● Format: This year’s edition of the Factbook (this
document) consists of Powerpoint slides showing
updated charts. For those looking for more context on
any sector, the 2014 edition(1) can continue to serve as a
reference. The emphasis of this 2018 edition is to capture
new developments that occurred in the past year.
About the Factbook: What is it, and what’s new?

4 © Bloomberg Finance LP 2018. Developed in partnership with The Business Council for Sustainable Energy.
About the Factbook: Understanding terminology for this report
OT
HE
R
CL
EA
N
EN
ER
GY
(no
t co
vere
d
in t
his
rep
ort
)
SU
STA
INA
BL
E E
NE
RG
Y
(as
de
fin
ed
in
th
is
rep
ort
)
RENEWABLE
ENERGY
FOSSIL-
FIRED /
NUCLEAR
POWER
DISTRIBUTED POWER,
STORAGE, EFFICIENCYTRANSPORT
• Solar
• Wind
• Geothermal
• Hydro
• Biomass
• Biogas
• Waste-to-energy
• Natural gas
• CCS
• Small-scale renewables
• CHP and WHP
• Fuel cells
• Storage
• Demand response / digital energy
• Building efficiency
• Industrial efficiency (aluminum)
• Direct use applications for natural gas
• Electric vehicles
(including hybrids)
• Natural gas vehicles
• Biofuels
• Wave / tidal• Nuclear • Lighting
• Industrial efficiency (other industries)
5 © Bloomberg Finance LP 2018. Developed in partnership with The Business Council for Sustainable Energy.
About the Factbook: The sub-sections within each sector
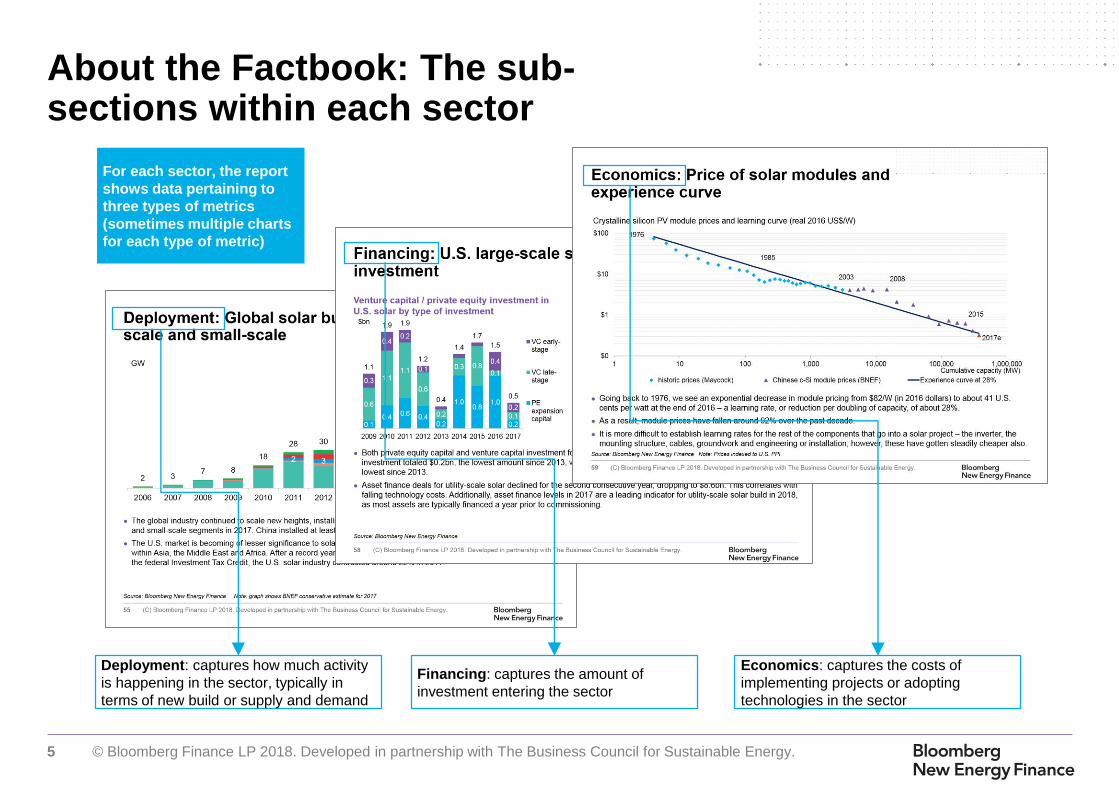
For each sector, the report
shows data pertaining to
three types of metrics
(sometimes multiple charts
for each type of metric)
Deployment: captures how much activity
is happening in the sector, typically in
terms of new build or supply and demand
Financing: captures the amount of
investment entering the sector
Economics: captures the costs of
implementing projects or adopting
technologies in the sector

6 © Bloomberg Finance LP 2018. Developed in partnership with The Business Council for Sustainable Energy.
About the Factbook: Sponsorship of this report
The Business Council for Sustainable Energy (BCSE) is a coalition of companies and trade associations
from the energy efficiency, natural gas and renewable energy sectors. The Council membership also
includes independent electric power producers, investor-owned utilities, public power, commercial end-
users and project developers and service providers for energy and environmental markets. Since 1992, the
Council has been a leading industry voice advocating for policies at the state, national and international
levels that increase the use of commercially-available clean energy technologies, products and services.

7 © Bloomberg Finance LP 2018. Developed in partnership with The Business Council for Sustainable Energy.
The massive and historic transformation of the U.S. energy sector clicked into a higher gear in 2017, despite some new headwinds including
policy uncertainties. Renewable deployment grew at a near-record pace. Energy productivity and GDP growth both accelerated, demonstrating
that the U.S. economy can grow at a reasonable rate even as total energy consumption actually declines. Liquefied natural gas export capacity
expanded, allowing the U.S. to become a serious player in global exports for the first time. Power and gas infrastructure build continued to
support grid performance and natural gas delivery. All of this combined to bring U.S. greenhouse gas emissions to a 25-year low while creating
jobs and keeping costs in check for consumers. We draw out the key highlights below.
New U.S. wind and solar build, combined with an easing drought in the West, drove renewable generation up from 15% to 18% of the
total electricity mix in one year, while contributions from natural gas and coal tapered modestly.
● Renewable generation (including hydropower) soared 14% to an estimated 717TWh in 2017, from 628TWh in 2016. The expansion brought
renewables to 18% of total U.S. generation – double their contribution a decade ago. Renewables achieved new heights partly due to a
rebound in hydro (up 13%, or 36TWh) as reservoir levels on the West Coast recovered after a severe, prolonged drought. At the same time, a
chart-busting number of wind and solar projects built in 2016 (nearly 23GW worth) had their first full year of operation in 2017, bolstering non-
hydro renewable generation by 15% to 413TWh. The surge further establishes renewables’ critical role in the U.S. power mix – renewable
technologies now contribute nearly as much electricity as the nuclear fleet.
● With 18.4GW of new additions, 2017 marked another boom year for renewables build, second only to 2016’s record of 22.7GW. Overall,
renewables have contributed 55% of total build in the past 10 years. Non-hydro renewables continued to represent the largest share of all U.S.
new installations, hitting roughly 62% in 2017.
● Build in other renewable sectors (biomass, biogas, waste-to-energy, geothermal, and hydro) continued to stall without long-term policy support.
Geothermal added only 24MW through one new project. Large-scale biomass, biogas and waste-to-energy combined added 176MW, while
hydro commissioned 208MW.
● Renewables’ rise came as natural gas-fired generation decreased by an estimated 8.1% (113TWh). This brought gas’ share of total U.S.
generation down from 34% in 2016 to 32% in 2017. Recovering gas prices, as well as a 1.7% year-on-year fall in total generation (including
estimates for distributed solar), may have also contributed to the drop in natural gas-fired generation.
● Nonetheless, natural gas retained its position as the number one producer of U.S. power, as electricity production from coal slipped as well
(although to a smaller extent – 37TWh, equivalent to a 3% decline). Continued changes to the structural make-up of the U.S. fleet will likely
cement its role here for some years: natural gas build boasted its best year since 2005, as new installations reached 10.7GW in 2017. Further,
by end-2017, owners of coal plants – which directly compete with gas in many areas of the country – had announced 12.5GW of planned
retirements for 2018, foreshadowing the largest year for coal decommissioning since the 15GW of retirements in 2015.
Executive summary (1 of 9)

8 © Bloomberg Finance LP 2018. Developed in partnership with The Business Council for Sustainable Energy.
Consumers devoted a smaller share of their spending towards electricity than at any time ever recorded, while the total share of
household expenses dedicated to energy costs also hovered near an all-time low. Power and natural gas prices remain subdued
across the country, and contract prices for wind and solar continued to plunge.
● American consumer spending on electricity shrank slightly in 2017 to 1.3% of personal consumption expenditures, down from 1.4% in 2016.
Greater energy efficiency and the continued availability of cheap fuels likely contributed to keeping electricity costs a modest part of total
consumer expenditures. Spending on natural gas also remained muted, as consumers directed just under 0.4% of their outlays to this
resource, similar to 2016 levels.
● A rebound in spending on other energy goods, especially gasoline and motor fuels, counterbalanced the drop in the share of expenditures
devoted to electricity bills. Households put 2.1% of their total consumption towards gasoline and motor fuels, up from 1.9% in 2016. However,
overall, Americans continue to direct just under 4% of their outlays to energy-related costs – only 2016 has seen a smaller share.
● Retail power prices remained subdued in the U.S. But unlike 2016, when prices fell across the country (on the back of waning wholesale power
prices), average retail prices rose modestly in 2017 across most regions. They picked up by 0.5% in New England and the Northwest; around
1% in New York, MISO and the Southeast; 1.2% in SPP; 1.5% in the Southwest; 3.5% in California; 4.8% in Florida; and 6.4% in Alaska.
However, average retail prices also dipped by roughly half a percent in PJM and ERCOT.
● In the wholesale power market, average prices rallied in 2017 across the U.S. on the back of natural gas prices, which rose 18% to average
$2.96/MMBtu at Henry Hub.
● Electricity offtakers secured renewables at ever cheaper price points. The most competitive power purchase agreements (PPAs) came in at
just over $20/MWh for solar, while wind PPAs executed in the U.S. wind belt averaged an estimated $17/MWh in 2017. Utility-scale PV capex
costs in the U.S. have declined 49% since 2013 to $1.1m/MW from $2.2m/MW, with projects in regions such as the Southeast breaking
through the symbolic “dollar-per-watt” threshold. Wind turbine prices have descended to an estimated $0.99m/MW, down 21% over the same
time period. At the same time, taller turbines and improved capacity factors have boosted the productivity of new wind facilities, driving down
prices in $/MWh terms at an even faster clip.
● Natural gas has become increasingly affordable for consumers. Retail prices for the commercial sector averaged just $8/mcf in 2017, down
42% over the past decade and near the recent trough observed in 2016. Gas prices for the industrial sector have followed a similar trajectory
but continue to undercut commercial rates, averaging just over $4/mcf in 2017.
Executive summary (2 of 9)

9 © Bloomberg Finance LP 2018. Developed in partnership with The Business Council for Sustainable Energy.
The U.S. remains competitive globally for energy-intensive industries, thanks to low industrial power prices.
● Industrial power prices in the U.S. have historically been among the most affordable in the world (averaging 6.76¢/kWh in 2016, according to
the EIA). The U.S. remained competitive even as exchange rate fluctuations—and market reforms, in the case of Japan—brought down the
dollar cost of energy for industrial consumers in China, Japan, and Mexico. Canada, with its strong stock of cheap legacy hydro, hovered at or
below U.S. prices. (Canada averaged 5.46¢/kWh in 2016.) These two countries offered the least expensive electricity for industrial users out of
the G-7 countries.
The renewable, energy efficiency, and natural gas sectors employed approximately three million Americans in 2016. Energy efficiency
was the top employer within the sustainable energy sectors, and solar was the fastest growing job-creator among all electricity
generation technologies.
● Energy efficiency provided 2.2 million jobs in 2016, according to the January 2017 report from the Department of Energy. Efficiency was the top
employer within the sustainable energy segments tracked in the report.
● Among sectors associated with electricity generation, solar employed the highest number of workers in 2016. The solar job count topped nearly
374,000, more than double those from fossil generation, which numbered 151,000 for coal, natural gas, and oil-fired sources combined (not
counting employment associated with fuel supply). Solar is still a labor-intensive field and one where a boom in new installations is driving
employment.
● Solar also added almost 74,000 jobs from 2015 to 2016, marking a 25% growth year-on-year and again taking top place out of all electricity
generation sectors. Wind was second in terms of employment growth, adding 24,650 jobs.
● Fossil fuel-fired generation also creates upstream employment (i.e., jobs related to the extraction, production and transportation of fuels). For
natural gas-fired generation, the vast majority of jobs are actually upstream; accounting for these positions brings employment tied to natural
gas to an estimated 362,000, up from around 52,000 for downstream jobs at natural gas power plants.
● The electricity storage sector also supported nearly 91,000 jobs in 2016, with just over half affiliated with battery storage. Storage is a
burgeoning sector: in 2017, the U.S. added an estimated 251MW in non-hydropower storage capacity, which drove up total commissioned
capacity by 33%.
Executive summary (3 of 9)

10 © Bloomberg Finance LP 2018. Developed in partnership with The Business Council for Sustainable Energy.
American economic growth is picking up steam – without a parallel jump in energy consumption.
● The U.S. economy advanced 2.3% in 2017, up from 1.5% in 2016. At the same time, U.S. total energy consumption dipped 0.2% to 97.2
quadrillion BTU. Energy productivity, which is the amount of GDP produced by a unit of energy, climbed 2.5% in 2017 as economic growth
continued its long-term trend of decoupling from energy use. Since 2008, energy usage has shrunk 1.7% even as GDP has accelerated by
15.3%.
● Annualized electricity consumption, excluding consumption of distributed energy resources, fell 2.6% in 2017 despite stronger economic
growth. From 1950 to 1990, demand for electricity increased at an annual average rate of 5.9%. From 1990 to 2007, that dampened to 1.9%
growth per year. Since 2007, electricity demand has actually contracted by an average of 0.2% per year.
● Energy efficiency has clearly contributed to this ongoing trend; however, the growth in utility spending on efficiency for electricity has slowed,
advancing only 1.6% in 2016 (the latest year for which data is available) to $6.3 billion. This slowdown comes in part because fewer states are
introducing new energy efficiency resource standards, while other states’ existing mandates have matured.
● Investments to boost the efficiency of natural gas usage have also paid off. The number of residential customers using natural gas expanded
21% to 69 million in the 20 years from 1998 through 2017. But consumption stayed roughly the same during that period, likely due in part to
efficiency gains.
Emissions from the electricity sector plummeted again, allowing transportation to retain its place as the largest-emitting sector for the
second year in a row.
● U.S. GHG emissions fell to their lowest levels since 1991, shrinking to an estimated 6.4GtCO2e in 2017 after contracting another 1.4% year-
on-year. The power sector continues to drive the economy’s de-carbonization – emissions from this sector ebbed 4.2% in 2017, this time on
the back of declining load and greater renewable generation (rather than coal-to-gas switching, a primary driver of 2016’s 5.8% downturn).
● Power-sector emissions now sit 28% below their 2005 peak, which puts the U.S. only 4 percentage points away from achieving its former
Clean Power Plan target of 32% below 2005 levels by 2030. The rapid emissions reduction in the power sector has also helped to bring the
U.S. halfway to its abandoned Paris Agreement target of slashing economy-wide emissions to 26% below 2005 levels by 2025.
● In 2016, the transportation sector overtook power as the largest greenhouse gas emitter, thanks mostly to lower power-sector emissions and
an absence of abatement opportunities within the transportation sector. It expanded the lead to 108MtCO2e in 2017, up from 21MtCO2e in
2016. Power and transportation account for approximately 60% of emissions, with agriculture, industry, and the commercial and residential
sectors typically accounting for the other 40%.
Executive summary (4 of 9)

11 © Bloomberg Finance LP 2018. Developed in partnership with The Business Council for Sustainable Energy.
The U.S. is solidifying its role as a global liquefied natural gas (LNG) exporter, and for the first time was a net exporter of natural gas
for every month of the year.
● Export activity stepped up at the Sabine Pass LNG terminal, which doubled its capacity in 2017 to 2.5Bcfd. LNG exports totaled 625Bcf from
January through November 2017, a value of roughly $2.8 billion (out of a $90 billion/year global LNG market). The U.S. now exports LNG to 25
countries, with Mexico, South Korea, China, and Japan serving as lead offtakers. A second export terminal opening in Maryland (Cove Point) is
scheduled to begin commercial operations in early 2018.
● Average pipeline exports to Mexico also rose, climbing 11% to 1,407Bcf as of end-November, compared to 1,265Bcf over the same period in
2016. Together, LNG and natural gas pipeline exports to Mexico have elevated average net export volumes to 2Bcfd as of end-November
2017, compared to an average 0.03Bcfd of net imports for the same period in 2016.
● The growth in foreign demand came as domestic gas demand dipped 2.8% year-on-year, in large part due to the 7.2% drop in natural gas
used for gas-fired power generation. Strengthening exports helped to propel an estimated 1.5% uptick in total gas demand from 2016 to 2017.
Utilities and independent developers continue to invest in infrastructure to improve grid operations and support the growth of clean
energy.
● Investor-owned utilities and independent transmission developers spent an estimated $22.9 billion on electric transmission in 2017, according
to figures collected by the Edison Electric Institute (EEI). This represents a 10% rise above the $20.8 billion spent in 2016, and a 91% boost
over 2011’s levels. Investments have targeted replacing aging equipment, improving reliability, and bringing renewable generation to end-use
consumers, among other purposes.
● The Midwest’s system operator, MISO, is overseeing a large build-out of its wires infrastructure, seeking to replicate Texas’ success in reducing
wind curtailment rates. The construction of the Texas Competitive Renewable Energy Zone (CREZ) transmission lines brought wind produced
in breezy west Texas to demand centers farther east, slashing curtailment rates from a peak of 17% in 2009 to under 2% for 2016. MISO,
alongside New England, experiences curtailment rates of around 4%, some of the highest currently seen in the U.S. Five of the 17
transmission projects under development through MISO’s Multi Value Project have already come online, alleviating bottlenecks and cutting
curtailment rates by 21% between 2015 and 2016.
● Gas transmission infrastructure is also set to expand, after protracted delays on several major pipelines caused by the lack of a FERC quorum,
project-specific setbacks, and regulatory hurdles. An estimated 14Bcfd of capacity was completed in 2017. Although this undershot the 33Bcfd
developers originally planned to complete, it was a notable step up from the five preceding years, in which gas transmission build ranged from
5Bcfd to 9Bcfd a year. The pipeline expansions in 2017 included 4.1Bcfd in takeaway capacity from the Appalachian Basin; however, only 1%
of this went towards relieving the natural gas constraints in New England.
Executive summary (5 of 9)

12 © Bloomberg Finance LP 2018. Developed in partnership with The Business Council for Sustainable Energy.
Continued: Utilities and independent developers continue to invest in infrastructure to improve grid operations and support the
growth of clean energy.
● Investment in midstream gas infrastructure (e.g., transmission, distribution and storage) climbed 19% from 2015 to 2016, with distribution
accounting for nearly half of the escalation in spending. Total investment in distribution hit its highest level yet at $13.4bn, a 16% expansion
from 2015 levels.
● On the consumer side, smart metering infrastructure has reached 51% of U.S. households, although regional penetration rates vary widely. As
regulators and utilities begin to undertake more activity on grid modernization and dynamic retail tariffs, even players who have traditionally
stayed away from smart meters are beginning to assess the technology’s benefits. Utilities have also begun to offer rebates to incentivize the
adoption of smart thermostats, which can be used to control peak demand. In 20 states, over half of households are eligible for rebates on
smart thermostat purchases.
Global clean energy investment rebounded to the second-highest amount on record. U.S. investments tracked 2016 levels but saw a
shift in capital deployment.
● Global new investment in clean energy advanced to $333 billion in 2017, second only to the $360 billion spent in 2015. A 24% escalation in
Chinese investment more than offset the 26% contraction in European flows, while the U.S. contribution held its ground at $57 billion, or about
17% of the global total.
● The relatively stable headline figure for U.S. clean energy investment masked shifts in how capital was deployed. Solar investment slumped
20% as policy uncertainty delayed projects and leading residential solar vendors pulled back from the market. Meanwhile, energy smart
technologies attracted 25% more funding in 2017 than in 2016 and wind investment expanded 19%.
New sales of battery, plug-in hybrid, and hybrid vehicles accelerated, driven especially by new, longer-range versions of existing
models. Meanwhile, the price of lithium-ion battery packs, a key cost component for battery electric vehicles, plummeted 23% year-on-
year.
● U.S. sales of electric vehicles (EVs), including battery electric vehicles (BEV) and plug-in hybrid electric vehicles (PHEV), jumped to over
194,000 units in 2017, up 23% from the year prior. PHEV sales leapt 24% year-on-year on the back of affordable, longer-range offerings like
the Toyota Prius Prime. BEV sales surged 22%, also as a result of longer-range affordable models, including the Chevrolet Bolt, and offerings
in new car segments such as the Tesla Model X. In all, EVs made up 1.1% of new vehicle sales in the U.S. in 2017, up from 0.9% in 2016. It is
estimated that around 749,000 EVs are on the road in the U.S. as of end-2017.
Executive summary (6 of 9)

13 © Bloomberg Finance LP 2018. Developed in partnership with The Business Council for Sustainable Energy.
Continued: New sales of battery, plug-in hybrid, and hybrid vehicles accelerated, driven especially by new, longer-range versions of
existing models. Meanwhile, the price of lithium-ion battery packs, a key cost component for battery electric vehicles, plummeted 23%
year-on-year.
● On a subsidized, lifetime basis, BEVs can cost up to one-third less than equivalent vehicles with conventional internal combustion engines
(ICE). PHEVs, on the other hand, tend to cost more than midsized ICE vehicles. This results from a combination of higher prices and fuel
costs, as well as lower subsidies.
● The price of lithium-ion battery packs, a key driver of BEV pricing, crashed 23% in 2017. Pack prices tumbled 65% between 2013 and end-
2017, bringing average prices down to $209/kWh. Cells, which contribute roughly 70% of the total cost of a pack, experienced a more rapid
decrease (26%) last year than the other cost components, thanks to economies of scale, increasing energy density, and transitions to more
efficient chemistries.
● Retail gasoline prices rallied 13% over the course of 2017, finishing at an average of $2.50/gallon compared to $2.21/gallon at end-2016. But
prices remained historically low, and consumption ticked up by an estimated 0.7% relative to the previous year.
● Start-stop technology, which cuts vehicle fuel use and idling emissions by automatically shutting off the car engine when the car is stopped,
continued to gain traction in the auto industry. The share of vehicles sold with this system in the U.S. leapt to 16.8% in 2017, up 75% from the
penetration rate in 2016.
The federal government backtracked from national and international engagement on climate change issues, prompting greater climate
commitments from sub-national and private sector players. Federal-level actions ranging from trade cases to tax reform also caused
uncertainty in the market for clean technologies.
● On June 1, 2017, President Donald Trump announced his intention to withdraw the U.S. from the Paris Agreement, an international, non-
binding climate change accord signed by 195 other countries and jurisdictions. In October 2017, the Environmental Protection Agency (EPA)
also proposed to rescind and replace the Clean Power Plan. On the transportation front, President Trump ordered EPA to reconsider the
upcoming tightening of corporate average fuel economy (CAFE) standards, covering model years 2021-2025.
Executive summary (7 of 9)

14 © Bloomberg Finance LP 2018. Developed in partnership with The Business Council for Sustainable Energy.
Continued: The federal government backtracked from national and international engagement on climate change issues, prompting
greater climate commitments from sub-national and private sector players. Federal-level actions ranging from trade cases to tax
reform also caused uncertainty in the market for clean technologies.
● In response to the U.S. withdrawal from the Paris Agreement and fading federal-level climate action, sub-national actors have created alliances
to support continued progress on the U.S. greenhouse gas reduction targets. The “We Are Still In” movement involves 2,642 mayors,
governors, CEOs, college presidents, faith organizations, and tribal leaders (as of the time of this writing). Another group, the U.S. Climate
Alliance, includes 16 governors representing over 40% of the U.S. population and $7.4 trillion in economic output. Separately, the U.S. Climate
Mayors (founded at the signing of the Paris Agreement) saw its membership swell after the U.S. withdrew from Paris. It now encompasses 383
cities covering 23% of the U.S. population, half of which are in states that have not additionally joined the U.S. Climate Alliance. Together,
these entities represent 2.7Gt in emissions (for comparison, total U.S. emissions stood at 6.4Gt for 2017). However, the level of ambition
between different entities’ emissions reduction commitments, plus the voluntary nature of such commitments, render it difficult currently to
assess the expected impact from the movement. The America’s Pledge initiative will aggregate the commitments made under these initiatives
and attempt to measure their impact across the U.S.
● In October 2017, the U.S. Department of Energy (DOE) requested that the Federal Energy Regulatory Committee (FERC) create rules to
subsidize “secure-fuel” power plants within competitive power markets that maintain 90 days’ worth of fuel supplies on site. This would have
mostly benefited coal and nuclear plants. FERC ultimately declined to implement the proposed rulemaking, citing insufficient evidence that
price distortions or retirements were affecting resiliency or reliability in the targeted power markets. The DOE itself had previously reported
that, while there might be challenges to come, wholesale power markets have ensured reliability to date, even as the electricity sector has
transformed rapidly due to factors such as flattening demand, growing natural gas penetration, and policy interventions (including renewables
support). FERC did ultimately call on system operators to study grid resiliency – that is, power systems’ ability to recover from major service
interruptions.
● In January 2018, President Trump instituted a 30% tariff on imported crystalline silicon solar modules and cells, which is scheduled to step
down to 15% by 2021. The safeguard measure was imposed in response to a trade complaint submitted by two bankrupt domestic solar
module manufacturers. The case, lodged by Suniva and SolarWorld, alleged unfair competition from Chinese manufacturers, but the resulting
tariffs will apply to practically all countries of origin. These tariff will increase all-in project costs by an estimated 4-10%.
Executive summary (8 of 9)

15 © Bloomberg Finance LP 2018. Developed in partnership with The Business Council for Sustainable Energy.
Continued: The federal government backtracked from national and international engagement on climate change issues, prompting
greater climate commitments from sub-national and private sector players. Federal-level actions ranging from trade cases to tax
reform also caused uncertainty in the market for clean technologies.
● Tax reforms passed near the end of 2017 also promise change for clean energy. While the EV, wind, and solar tax credits remain unchanged
from prior law, the corporate tax rate dropped down to 21% from 35%. This tax cut raises after-tax earnings for renewable projects, but also
reduces the supply of tax equity available for supporting renewable build. Additionally, the tax cut may free up utility money for infrastructure
investments or for lowering retail electricity rates. Further, under the new law, multinationals with overseas profits are now required to pay a
minimum level of taxes on foreign transactions under the so-called “BEAT” provision. Although this can also limit tax equity supply, the negative
impact is curbed by a provision that allows corporations to use 80% of the Investment Tax Credit (ITC) and Production Tax Credit (PTC) to
offset BEAT. Finally, the introduction of immediate, 100% depreciation of most capital expenditures can benefit providers of long-lived assets
such as energy saving building materials or technology.
● In February 2018, Congress passed the Bipartisan Budget Act, which impacted a range of energy incentives. Energy efficiency credits and
non-wind PTC technologies (biogas, biomass, waste to energy, active geothermal, hydropower, marine and hydrokinetic) received one-year
retroactive extensions. Several non-solar ITC-eligible technologies (fiber-optic solar, microturbines, fuel cells, combined heat and power, and
small wind) received five-year extensions with phase-downs. The budget law also lifted the end-2020 in-service deadline for nuclear plants to
qualify for the nuclear production tax credit. In addition, it expanded credits for qualified carbon capture and sequestration (CCS) facilities.
● States also explored reforms to some of their renewables support programs in 2017. Most customers in 40 states, plus DC, could access net
metering at the full retail rate as of August 2017. But states across the country are looking at potential reforms to the scheme: over the past
year, Arizona, Indiana, and Maine finalized plans to move away from net metering. The replacement options vary but generally offer lower
compensation rates or set a deadline by which small-scale PV owners can still qualify for net metering.
Corporations are playing a stronger role in the energy transformation, increasingly demanding cleaner energy and seeking to capture
gains from energy efficiency.
● Corporations continued to turn their attention to sustainability in 2017. The “EP100”, an initiative launched in 2016 through which companies
promise to double their energy efficiency, has gained 13 pledgees. On the renewables front, 119 companies globally had pledged by end-2017
to source 100% of their energy from renewables under the “RE100” initiative. In the U.S., corporate clean energy deal volumes for off-site
PPAs rose to 2.9GW in 2017, the second highest on record behind the 3.2GW of new contracts signed in 2015. Companies have also looked
increasingly to source clean energy in the same service territory as their load, leading to new engagement with utilities via green tariff
programs. These contributed 19% of corporate procurement in 2017.
Executive summary (9 of 9)
16 © Bloomberg Finance LP 2018. Developed in partnership with The Business Council for Sustainable Energy.
The 2018 Factbook in the context of previous editions
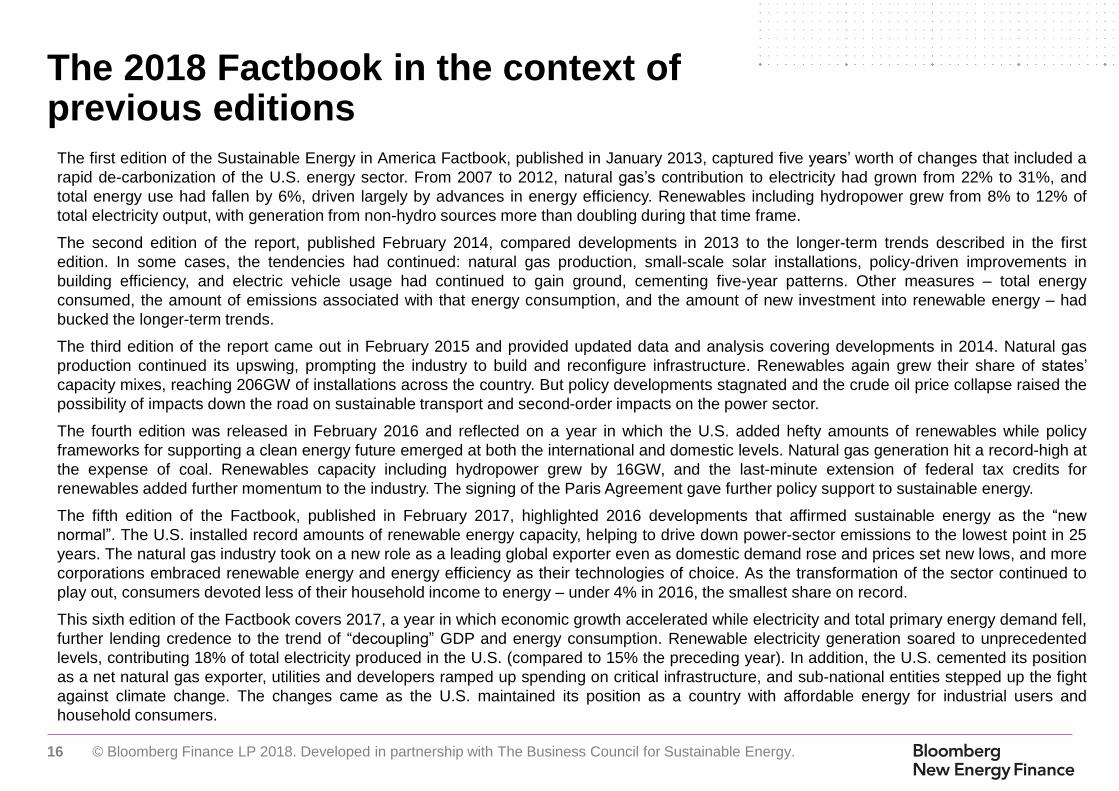
The first edition of the Sustainable Energy in America Factbook, published in January 2013, captured five years’ worth of changes that included a
rapid de-carbonization of the U.S. energy sector. From 2007 to 2012, natural gas’s contribution to electricity had grown from 22% to 31%, and
total energy use had fallen by 6%, driven largely by advances in energy efficiency. Renewables including hydropower grew from 8% to 12% of
total electricity output, with generation from non-hydro sources more than doubling during that time frame.
The second edition of the report, published February 2014, compared developments in 2013 to the longer-term trends described in the first
edition. In some cases, the tendencies had continued: natural gas production, small-scale solar installations, policy-driven improvements in
building efficiency, and electric vehicle usage had continued to gain ground, cementing five-year patterns. Other measures – total energy
consumed, the amount of emissions associated with that energy consumption, and the amount of new investment into renewable energy – had
bucked the longer-term trends.
The third edition of the report came out in February 2015 and provided updated data and analysis covering developments in 2014. Natural gas
production continued its upswing, prompting the industry to build and reconfigure infrastructure. Renewables again grew their share of states’
capacity mixes, reaching 206GW of installations across the country. But policy developments stagnated and the crude oil price collapse raised the
possibility of impacts down the road on sustainable transport and second-order impacts on the power sector.
The fourth edition was released in February 2016 and reflected on a year in which the U.S. added hefty amounts of renewables while policy
frameworks for supporting a clean energy future emerged at both the international and domestic levels. Natural gas generation hit a record-high at
the expense of coal. Renewables capacity including hydropower grew by 16GW, and the last-minute extension of federal tax credits for
renewables added further momentum to the industry. The signing of the Paris Agreement gave further policy support to sustainable energy.
The fifth edition of the Factbook, published in February 2017, highlighted 2016 developments that affirmed sustainable energy as the “new
normal”. The U.S. installed record amounts of renewable energy capacity, helping to drive down power-sector emissions to the lowest point in 25
years. The natural gas industry took on a new role as a leading global exporter even as domestic demand rose and prices set new lows, and more
corporations embraced renewable energy and energy efficiency as their technologies of choice. As the transformation of the sector continued to
play out, consumers devoted less of their household income to energy – under 4% in 2016, the smallest share on record.
This sixth edition of the Factbook covers 2017, a year in which economic growth accelerated while electricity and total primary energy demand fell,
further lending credence to the trend of “decoupling” GDP and energy consumption. Renewable electricity generation soared to unprecedented
levels, contributing 18% of total electricity produced in the U.S. (compared to 15% the preceding year). In addition, the U.S. cemented its position
as a net natural gas exporter, utilities and developers ramped up spending on critical infrastructure, and sub-national entities stepped up the fight
against climate change. The changes came as the U.S. maintained its position as a country with affordable energy for industrial users and
household consumers.

17 © Bloomberg Finance LP 2018. Developed in partnership with The Business Council for Sustainable Energy.
Table of Contents
1. Introduction
2. A look across
the U.S. energy
sector
3. Natural gas
4. Large-scale
renewable
electricity and
CCS
2.1 Bird’s eye
2.2. Policy, finance, economics
4.1 Solar (PV, solar thermal)
4.2 Wind
4.3 Biomass, biogas, waste-to-
energy
4.4 Geothermal
4.5 Hydropower
4.6 CCS
5. Distributed
power and
storage
5.1 Small-scale solar
5.2 Combined heat and power and
waste-heat-to-power
5.4 Energy storage
6. Demand-
side energy
efficiency
6.1 Energy efficiency
6.2 Demand response and digital
energy
7. Sustainable
transportation
7.1 Electric vehicles
7.2 Natural gas vehicles
7.3 Biofuels
5.3 Fuel cells (stationary)

18 © Bloomberg Finance LP 2018. Developed in partnership with The Business Council for Sustainable Energy.
Source: Bureau of Economic Analysis, EIA, Lawrence Berkeley National Laboratory, BNEF Notes: Values for 2017 are projected, accounting for seasonality, based on latest
monthly values from EIA (data available through October 2017). 2017 GDP estimate is a projection from economists compiled at ECFC <GO> on the Bloomberg Terminal.
U.S. GDP and primary energy consumption U.S. energy productivity
U.S. energy overview: Economy’s energy productivity
● GDP growth in the U.S. continued apace in 2017, even as primary energy consumption shrank. This decoupling between economic growth and
energy use is reflected in improvements to energy productivity. Within the past decade, energy productivity ticked up 17%, as GDP jumped
15% while primary energy consumption shrank 2%.
● Energy productivity, which is the amount of GDP produced by a unit of energy, climbed 2.5% to approximately $176 billion per quadrillion BTU
in 2017, up from $172 billion per quadrillion BTU in 2016. The economy is picking up steam, with annual GDP growth estimated at 2.3% for
2017 (compared to 1.5% in 2016) – without a corresponding uptick in the amount of energy used to drive the economy. Year-on-year, total
primary energy consumption decreased by 0.2%.
● According to the Lawrence Berkeley National Laboratory, the average levelized cost of saving energy through efficiency declined to $28/MWh
in 2013, from $44/MWh in 2009 – a 36% drop.
0.8
1.0
1.2
1.4
1.6
1.8
2.0
1990 '95 2000 '05 '10 '17
Indexed to 1990 levels
GDP (indexed)
Primary energy consumption
(indexed)
0.08
0.10
0.12
0.14
0.16
0.18
0.20
1990 '95 2000 '05 '10 '17
$ trillion of GDP / quadrillion BTU of energy
Energy productivity
19 © Bloomberg Finance LP 2018. Developed in partnership with The Business Council for Sustainable Energy.
Source: EIA, BNEF Notes: values for 2017 are projected, accounting for seasonality, based on latest monthly values from EIA (data available through October 2017)
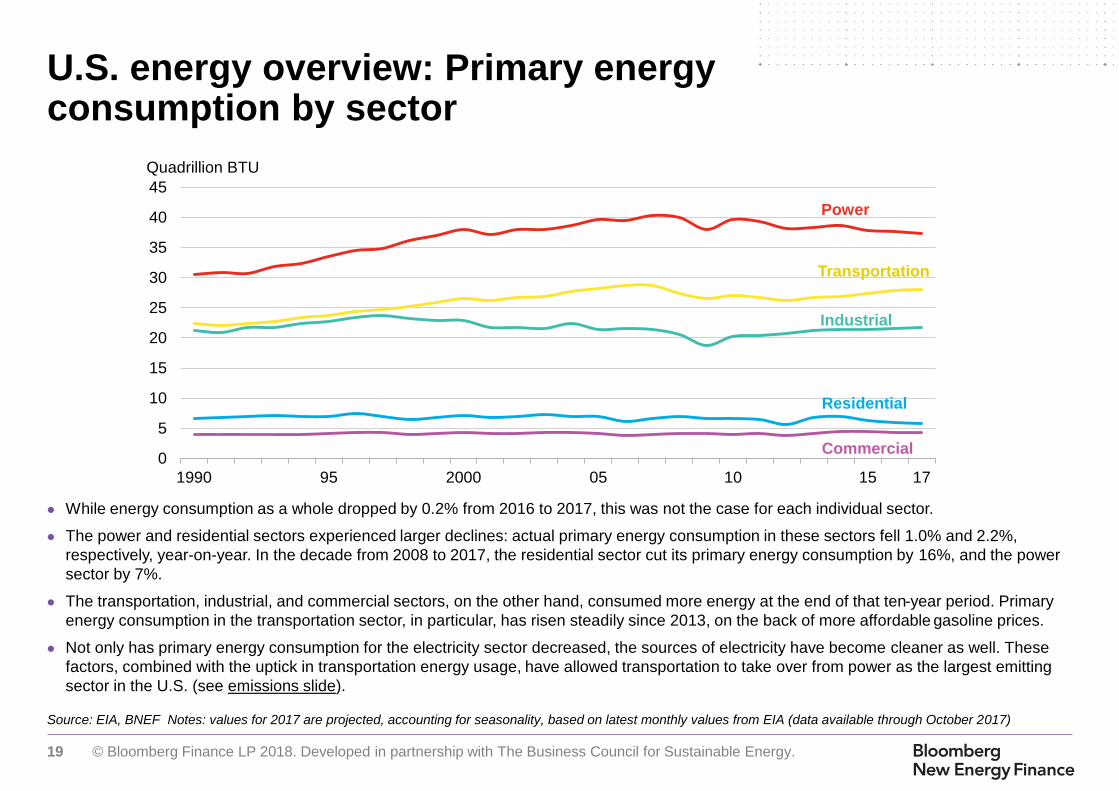
U.S. energy overview: Primary energy consumption by sector
● While energy consumption as a whole dropped by 0.2% from 2016 to 2017, this was not the case for each individual sector.
● The power and residential sectors experienced larger declines: actual primary energy consumption in these sectors fell 1.0% and 2.2%,
respectively, year-on-year. In the decade from 2008 to 2017, the residential sector cut its primary energy consumption by 16%, and the power
sector by 7%.
● The transportation, industrial, and commercial sectors, on the other hand, consumed more energy at the end of that ten-year period. Primary
energy consumption in the transportation sector, in particular, has risen steadily since 2013, on the back of more affordable gasoline prices.
● Not only has primary energy consumption for the electricity sector decreased, the sources of electricity have become cleaner as well. These
factors, combined with the uptick in transportation energy usage, have allowed transportation to take over from power as the largest emitting
sector in the U.S. (see emissions slide).
0
5
10
15
20
25
30
35
40
45
1990 95 2000 05 10 15 17
Quadrillion BTU
Commercial
Industrial
Residential
Transportation
Power

20 © Bloomberg Finance LP 2018. Developed in partnership with The Business Council for Sustainable Energy.
Source: EIA, BNEF Notes: “CAGR” on the right hand side graph is compound annual growth rate. Values for 2017 are projected, accounting for seasonality, based on the
latest monthly values from EIA (data available through October 2017). BTU stands for British thermal units.
U.S. primary energy consumption by fuel type U.S. electricity demand
U.S. energy overview: Energy and electricity consumption
● U.S. total energy consumption decreased 0.2% to 97.2 quadrillion BTU in 2017, even as GDP growth accelerated to 2.3%. Consumption of
coal, natural gas, and nuclear declined as petroleum, hydro, and renewable consumption expanded. Natural gas and coal saw some of the
largest percentage reductions (-2.5% and -2.3%, respectively) in part because the power sector’s shift away from these resources in 2017.
● Petroleum use advanced 0.3% as oil prices stayed relatively low, despite a price rebound in the second half of the year. The prior two years of
low oil prices had encouraged greater purchases of light trucks, slowing gains in the fuel efficiency of the U.S. vehicle fleet.
● Hydro surged 13.6% year-on-year as West Coast reservoirs recovered after the drought. Other renewable resources jumped as well, rising
7.1% to 8.2 quadrillion BTU.
● Growth in retail electricity demand fell 2.6% year-on-year (excluding contributions from distributed, small-scale facilities). Compound annual
electricity growth has been steadily declining, from 5.9% over 1950-1990, to 1.9% over 1990-2007, to -0.2% since 2007.
0
15
30
45
60
75
90
105
1990 '95 2000 '05 '10 '17
Quadrillion BTU
Renewables Hydro Natural gas Nuclear Petroleum Coal
-4%
-2%
0%
2%
4%
6%
0
500
1,000
1,500
2,000
2,500
3,000
3,500
4,000
4,500
1990 '95 2000 '05 '10 '17
TWh of demand
Demand Annual growth rate CAGR since 1990
Growth rate

21 © Bloomberg Finance LP 2018. Developed in partnership with The Business Council for Sustainable Energy.
Source: EIA, BNEF Note: Values for 2017 are projected, accounting for seasonality, based on latest monthly values from EIA (data available through November 2017)
U.S. electricity generation by fuel type (%) U.S. electricity generation by fuel type (TWh)
U.S. energy overview: Electricity generation mix
● Renewables generation (including hydropower) leapt an estimated 14.1% year-on-year in 2017, its largest ever one-year
surge, as output increased nearly 90TWh. Total renewable generation hit 717TWh, thanks to a rebound in hydro (up 13%,
or 36TWh) and new solar and wind build (which helped drive up generation by 53TWh, including estimates for small-scale
solar).
● The growth in renewables came as natural gas’s contribution to total generation dipped moderately to 32%, from 34% in
2016. In absolute terms, gas generation sank to 1,278TWh from a record-high 1,391TWh the previous year. Recovering
gas prices and an estimated 1.7% slump in total generation (including estimates for distributed solar) also contributed to a
squeeze on gas plants.
● Total coal generation declined 3% in 2017, but it held steady at roughly 30% of total electricity generation.
48% 44% 45% 42% 37% 39% 39% 33% 30% 30%
20%20% 20% 19%
19% 19% 19%19% 20% 20%
22% 24% 24% 25% 31% 28% 28% 33% 34% 32%
9% 11% 10% 13% 12% 13% 13% 14% 15% 18%
2008
2009
2010
2011
2012
2013
2014
2015
2016
2017
Renewables(includinghydro)Natural gas
Nuclear
Oil
Coal0
500
1,000
1,500
2,000
2,500
3,000
3,500
4,000
4,500
2008
2009
2010
2011
2012
2013
2014
2015
2016
2017

22 © Bloomberg Finance LP 2018. Developed in partnership with The Business Council for Sustainable Energy.
Source: EIA, Bloomberg New Energy Finance Notes: “Retirements” does not include conversions from coal to natural gas or biomass; includes retirements or announced
retirements reported to the EIA through November 2017. All capacity figures represent summer generating capacity.
U.S. energy overview: Completed and announced coal-fired power plant retirements
● Although the pace of coal retirements slowed in 2017 to 6.2GW, companies have already announced enough upcoming coal retirements to
make 2018 a near-record year. As of November 2017, companies had 12.5GW of coal plants slated to decommission in 2018, second only to
2015’s high of 15GW.
● Since 2011, the coal fleet has shrunk 15% from its peak size of 306GW. Persistently low gas prices and flat load have contributed to less run-
time and lower revenues for coal plants. Even as coal capacity dwindles, 22GW of new gas capacity is scheduled to commission in 2018.
● In addition, aging boilers and rising operating costs – partly due to U.S. Environmental Protection Agency (EPA) regulations covering sulfur,
nitrogen, and mercury emissions from power plants – have forced many coal plants to retire earlier than originally planned.
● One such regulation, the Mercury and Air Toxics Standard (MATS) remains in place in the midst of a lawsuit. And though the Trump
Administration has rescinded the Clean Power Plan, its companion law, the New Source Performance Standard (NSPS), is still in effect while
litigation is stalled in the courts. NSPS sets emissions limits on new coal and gas plants.
1 1 1 1 1 1 13
11
64
15
8
4
212
2 20
2
4
6
8
10
12
14
16
199
0
199
1
199
2
199
3
199
4
199
5
199
6
199
7
199
8
199
9
200
0
200
1
200
2
200
3
200
4
200
5
200
6
200
7
200
8
200
9
201
0
201
1
201
2
201
3
201
4
201
5
201
6
201
7
201
8
201
9
202
0
GW
Announced
Completed

23 © Bloomberg Finance LP 2018. Developed in partnership with The Business Council for Sustainable Energy.
Source: EIA, Bloomberg New Energy Finance Note: All values are shown in AC except solar, which is included as DC capacity. “Renewables” here does not include hydro,
which is shown separately. All capacity figures represent summer generating capacity.
U.S. energy overview: Electric generating capacity build by fuel type
● In 2017, non-hydro renewables continued to represent the largest share of build, adding 18.2GW of capacity, or roughly 62% of total build.
● Renewable additions have dominated U.S. power sector build in recent years. In the ten-year period from 2008 through 2017, renewable
energy projects, including hydro, made up 55% of all build. In the five-year period from 2013 through 2017, they contributed 62% of capacity
additions. From 2014 through 2017, solar and wind together constituted the majority of U.S. build each year.
● Prior to the renewable build boom, gas made up the majority of new capacity additions from 1992 through 2007. In 2017, gas build hit 10.7GW,
the highest level since 2005. Combined-cycle technology contributed the majority of new gas installations at 9GW.
● In total, renewables, hydro and natural gas have contributed over 93% of all generating capacity additions within the past 25 years.
0
10
20
30
40
50
60
70
199
0
199
1
199
2
199
3
199
4
199
5
199
6
199
7
199
8
199
9
200
0
200
1
200
2
200
3
200
4
200
5
200
6
200
7
200
8
200
9
201
0
201
1
201
2
201
3
201
4
201
5
201
6
201
7
GW
Other
Renewables
Hydro
Nuclear
Oil
Gas
Coal

24 © Bloomberg Finance LP 2018. Developed in partnership with The Business Council for Sustainable Energy.
Source: Bloomberg New Energy Finance, EIA Notes: All values are shown in AC except solar, which is included as DC capacity. Numbers include utility-scale (>1MW)
projects of all types, rooftop solar, and small- and medium-sized wind.
U.S. energy overview: Renewable energy capacity build by technology
● Renewable build slowed in 2017 after record-level additions in 2016: it fell 19% to 18.4GW, from 22.7GW in 2016.
● Utility-scale solar developers are rebuilding their project pipeline after rushing to commission projects in 2016 (see Section 4.1, here). In 2017,
the Southeast dominated utility-scale build with 2GW, twice as much as California. Small-scale solar was one area that showed some growth:
build expanded 5% to 3.6GW, despite a 9% slowdown in residential PV as vendors scaled back their growth plans. The smaller commercial PV
segment grew from 1.1GW in 2016 to 1.5GW in 2017. This growth did not come from a jump in deals, but due to larger system sizes.
● Wind build shrank to 7.3GW from 8.4GW in 2016. Wind developers are still aiming to bring projects online by the 2020 deadline to qualify for
the full Production Tax Credit (PTC), but many are waiting to take advantage of falling equipment costs.
● 2017 was a year of policy turbulence for the renewable industry. Key events included tax reform, solar tariffs, and discussions about grid
reliability and resilience (see the policy section for details).
● Other sectors (biomass, biogas, waste-to-energy, geothermal, hydro) are idling without similar levels of long-term policy support.
9.3 10.2
4.86.6
14.0
1.15.1
8.4 8.4 7.3
0.30.4
0.9
2.2
3.4
5.8
7.3
7.1
13.8
10.79.911.2
6.0
9.4
18.3
8.1
12.8
15.9
22.7
18.4
5
10
15
20
25
2008 2009 2010 2011 2012 2013 2014 2015 2016 2017
GWHydro
Geothermal
Biomass, biogas,waste-to-energy
Solar
Wind
25 © Bloomberg Finance LP 2018. Developed in partnership with The Business Council for Sustainable Energy.
Source: Bloomberg New Energy Finance, EIA Notes: All values are shown in AC except solar, which is included as DC capacity. Hydropower capacity and generation
exclude pumped storage facilities (unlike in past Factbooks). Totals may not sum due to rounding. Values for 2017 are projected, accounting for seasonality, based on latest
monthly values from EIA (data available through November 2017)
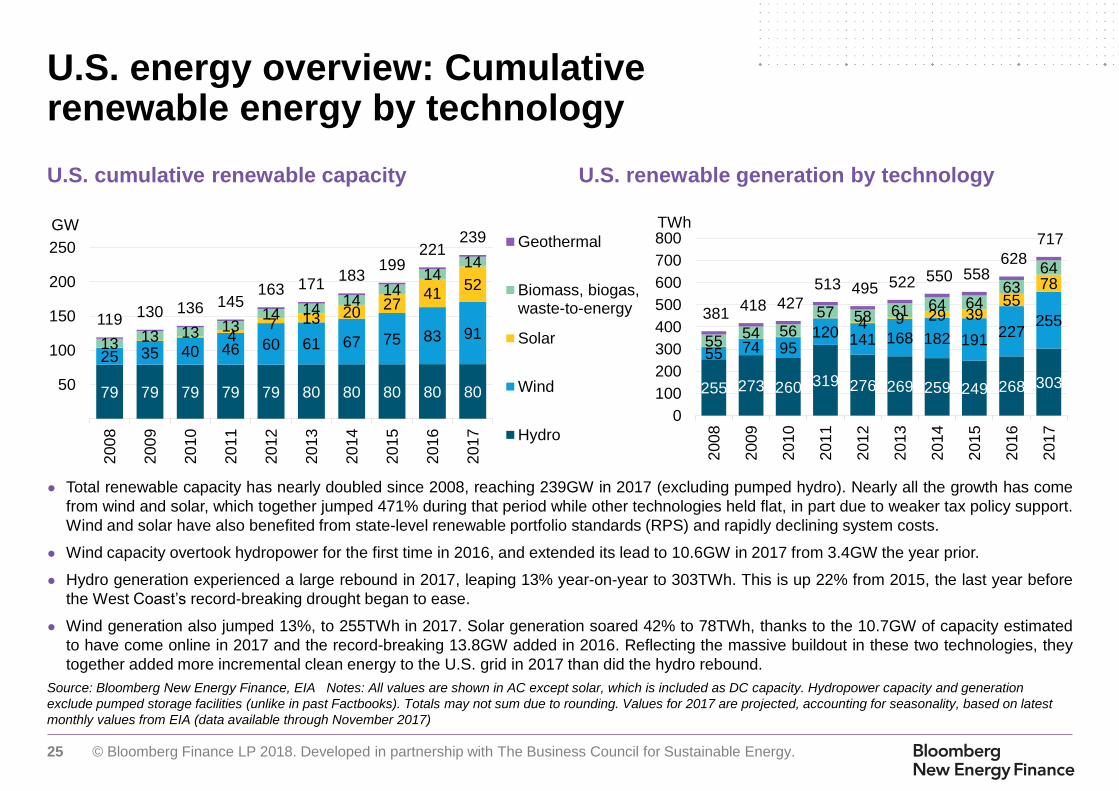
U.S. cumulative renewable capacity U.S. renewable generation by technology
U.S. energy overview: Cumulative renewable energy by technology
● Total renewable capacity has nearly doubled since 2008, reaching 239GW in 2017 (excluding pumped hydro). Nearly all the growth has come
from wind and solar, which together jumped 471% during that period while other technologies held flat, in part due to weaker tax policy support.
Wind and solar have also benefited from state-level renewable portfolio standards (RPS) and rapidly declining system costs.
● Wind capacity overtook hydropower for the first time in 2016, and extended its lead to 10.6GW in 2017 from 3.4GW the year prior.
● Hydro generation experienced a large rebound in 2017, leaping 13% year-on-year to 303TWh. This is up 22% from 2015, the last year before
the West Coast’s record-breaking drought began to ease.
● Wind generation also jumped 13%, to 255TWh in 2017. Solar generation soared 42% to 78TWh, thanks to the 10.7GW of capacity estimated
to have come online in 2017 and the record-breaking 13.8GW added in 2016. Reflecting the massive buildout in these two technologies, they
together added more incremental clean energy to the U.S. grid in 2017 than did the hydro rebound.
79 79 79 79 79 80 80 80 80 80
25 35 40 46 60 61 67 75 83 9147 13 20
2741
52
13 13 13 1314 14
1414
1414
119130 136 145
163 171183
199221
239
50
100
150
200
250
200
8
200
9
2010
201
1
201
2
201
3
201
4
2015
201
6
201
7
Geothermal
Biomass, biogas,waste-to-energy
Solar
Wind
Hydro
GW
255 273 260 319 276 269 259 249 268 303
55 74 95120 141 168 182 191
2272554 9 29 39
5578
5554 56
57 58 61 64 6463
64
381 418 427
513 495 522 550 558 628
717
0
100
200
300
400
500
600
700
800
200
8
200
9
201
0
201
1
201
2
201
3
201
4
201
5
201
6
201
7
TWh

26 © Bloomberg Finance LP 2018. Developed in partnership with The Business Council for Sustainable Energy.
Source: Bloomberg New Energy Finance, EIA, EPA Inventory of U.S. Greenhouse Gas Emissions and Sinks: 1990-2015 Notes: “Sinks” refer to forests and green areas which absorb
carbon dioxide. Values for 2017 are projected, accounting for seasonality, based on monthly values from EIA available through October 2017.
Economy-wide and energy sector emissions Emissions by sector
U.S. energy overview: Greenhouse gas emissions
● U.S. GHG emissions are projected to be at their lowest levels since 1991, falling to an estimated 6.37GtCO2e in 2017. All told, total GHG
emissions (excluding sinks) are approximately 13% below 2005 levels, or roughly halfway to the U.S.’s abandoned Paris Agreement target of
26% below 2005 levels by 2025.
● Total GHG emissions fell an estimated 1.4% year-on-year, following on the heels of a 1.9% decrease the year prior. The power sector has
been a significant driver of the economy’s decarbonization. In 2017, the power sector’s footprint contracted further as renewable energy
displaced coal and natural gas and electricity demand retreated modestly, pushing emissions down 4%. The sector’s emissions now sit at
roughly 28% below 2005 levels – only 4 percentage points away from the 2030 target of 32% below 2005 put forward in the Clean Power Plan.
● Transport emissions have continued to climb steadily, allowing the transportation sector to overtake power as the number one source of
emissions for the first time in 2016. In 2017, transportation emitted an estimated 108MtCO2e more than the country’s fleet of power plants.
● Federal progress on climate change has faltered: the Trump Administration announced its intention to withdraw from the Paris Agreement and
rescinded the previous administration’s regulation on power-sector greenhouse gas emissions, the Clean Power Plan.
4,000
4,500
5,000
5,500
6,000
6,500
7,000
7,500
8,000
1990 '95 2000 '05 '10 '17
MtCO2e
GHG emissions from
energy sector
Total GHG
emissions, 1990
Total (gross)
GHG emissions
0
500
1,000
1,500
2,000
2,500
1990 '95 2000 '05 '10 '17
MtCO2e
Power
Industry
Other (incl.
agriculture)
Buildings
Transportation

27 © Bloomberg Finance LP 2018. Developed in partnership with The Business Council for Sustainable Energy.
Source: Bloomberg New Energy Finance, EIA, Bloomberg Terminal Notes: Wholesale prices are taken from proxy power hubs in each ISO and are updated through end-
2017. All prices are in real 2017 dollars. The retail power prices shown here are not exact retail rates, but weighted averages across all rate classes by state, as published by
EIA 826. Retail prices are updated through end-October 2017. All prices are in real 2017 dollars.
Wholesale power prices Average retail power prices
U.S. energy overview: Retail and wholesale power prices
● Wholesale power prices remain historically low in real terms. However, they rebounded slightly in 2017 across most regions relative to 2016
levels, as the yearly average Henry Hub natural gas price picked up 18% to $2.96/MMBtu.
● Year-on-year, average wholesale prices rose as much as 27% in the Southwest and 17% in Northern California. ERCOT (Texas), PJM and
MISO saw some of the smaller increases, at 6%, 0.9% and 0.6%, respectively.
● Retail price responses were more muted, as wholesale power prices do not directly translate to retail rates (for example, retail rates take into
account wires costs, and in most regions they are set through a slow regulatory process). Prices rose by about half a percent in New England
and the Northwest; around 1% in New York, MISO and the Southeast; 1.2% in SPP; 1.5% in the Southwest; 3.5% in California; 4.8% in Florida;
and 6.4% in Alaska. PJM and ERCOT saw average prices ease down by 0.5% and 0.6%, respectively
● California has also switched end-users to time-of-use rates, which means rates will now vary throughout the day based on peak hours.
● Since their peak in 2008, average U.S. retail prices have come down 5.8% in real terms.
0
20
40
60
80
100
120
200
8
200
9
201
0
201
1
201
2
201
3
201
4
201
5
201
6
201
7
$/MWh (real 2017)
0
50
100
150
200
200
8
200
9
201
0
201
1
201
2
201
3
201
4
201
5
201
6
201
7
$/MWh (real 2017)New York
New England
California
Florida
PJM
Southwest
MISO
ERCOT
Southeast
SPP
Northwest
28 © Bloomberg Finance LP 2018. Developed in partnership with The Business Council for Sustainable Energy.
Source: Bloomberg New Energy Finance, government sources (EIA for the U.S.) Notes: Prices are averages (and in most cases, weighted averages) across all regions within
the country. Japanese data is for the C&I segment and 2016 figures come from a different source than preceding years.
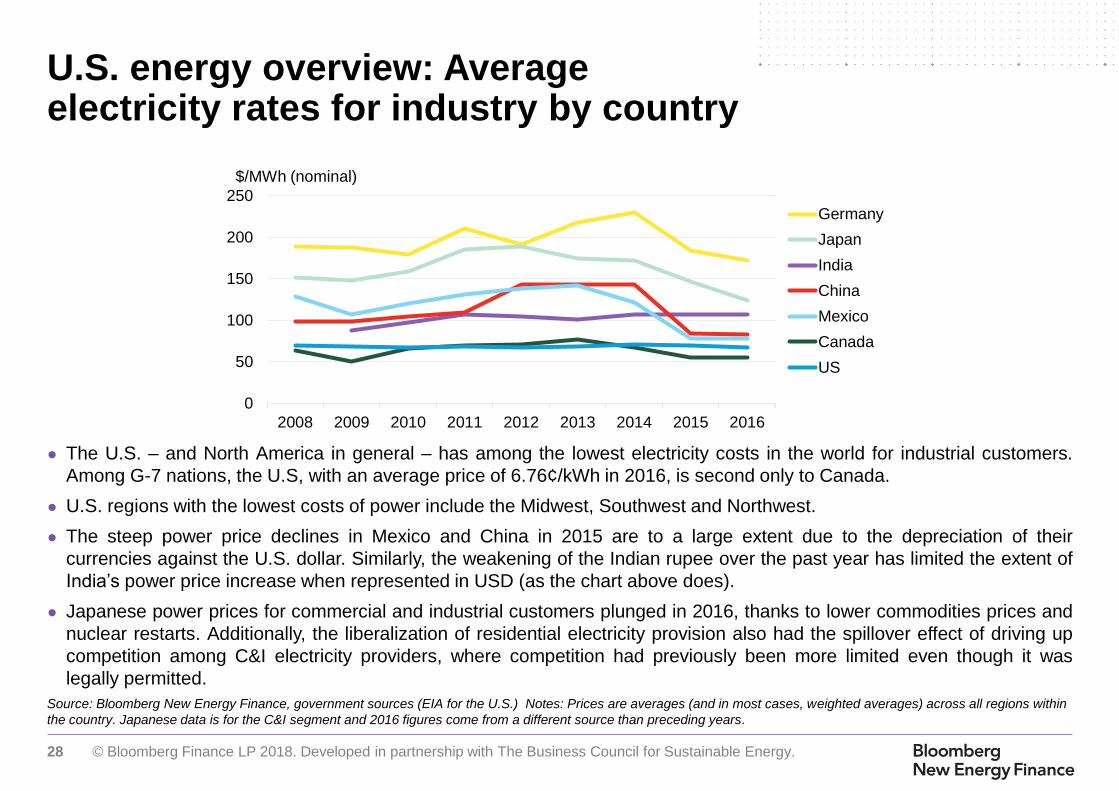
U.S. energy overview: Average electricity rates for industry by country
● The U.S. – and North America in general – has among the lowest electricity costs in the world for industrial customers.
Among G-7 nations, the U.S, with an average price of 6.76¢/kWh in 2016, is second only to Canada.
● U.S. regions with the lowest costs of power include the Midwest, Southwest and Northwest.
● The steep power price declines in Mexico and China in 2015 are to a large extent due to the depreciation of their
currencies against the U.S. dollar. Similarly, the weakening of the Indian rupee over the past year has limited the extent of
India’s power price increase when represented in USD (as the chart above does).
● Japanese power prices for commercial and industrial customers plunged in 2016, thanks to lower commodities prices and
nuclear restarts. Additionally, the liberalization of residential electricity provision also had the spillover effect of driving up
competition among C&I electricity providers, where competition had previously been more limited even though it was
legally permitted.
0
50
100
150
200
250
2008 2009 2010 2011 2012 2013 2014 2015 2016
$/MWh (nominal)
Germany
Japan
India
China
Mexico
Canada
US

29 © Bloomberg Finance LP 2018. Developed in partnership with The Business Council for Sustainable Energy.
0%
2%
4%
6%
8%
10%
1960 65 70 75 80 85 90 95 2000 05 10 15
Source: Bureau of Economic Analysis, BNEF
Total energy goods and services as share of
total consumption expenditure
Electricity and natural gas as share of total
consumption expenditure
U.S. energy overview: Energy as a share of personal consumption expenditures
● Energy spending remains below 4% of total U.S. personal consumption expenditures.
● Year-on-year, the energy share of spending held roughly the same, near 3.9%, according to early estimates. A dip in the electricity share of
spending was counterbalanced by a minor rebound in the portion of spending devoted to non-electricity, non-gas energy costs (e.g., gasoline
and other motor fuels).
● The amount spent by consumers on electricity in the U.S. has fallen every year since 2014, even as total personal expenditures climbed. As a
result, the share of personal consumption expenditures devoted to electricity has also shrunk. It dipped marginally again in 2017 to 1.3%, from
1.4% in 2016.
● Falling fuel costs and greater efficiency likely contributed to this trend.
0.0%
0.5%
1.0%
1.5%
2.0%
2.5%
1960 65 70 75 80 85 90 95 2000 05 10 15
Electricity
Natural gasTotal energy expenditures

30 © Bloomberg Finance LP 2018. Developed in partnership with The Business Council for Sustainable Energy.
62122364866
68
102
332686
52
374
98310574
310
Geo
the
rmal
Oth
er
sto
rag
e
Pum
pe
dh
ydro
Adva
nced
Gas
Batt
ery
sto
rag
e
Hydro
ele
ctr
ic
Nucle
ar
Win
d
Oth
er
Gen
era
tion
Bio
en
erg
y/C
HP
Coal
Natu
ral G
as
Sola
r
Ene
rgy
effic
ien
cy
Thousands of jobs
362
131160
77115
2,182
Source: Department of Energy (DOE) Notes: Transmission, distribution, and oil/petroleum jobs not included as available data does not break out the portion of those jobs
relevant to the electricity sector. See footnote on next slide for details on the definition for “Advanced Gas.”
Jobs in select energy segments, 2016
Sustainable energy jobs, 2016
U.S. energy overview: Jobs in select segments of the energy sector
● The renewable, energy efficiency, and natural gas sectors employed an estimated 3.3 million Americans in 2016, according to the Department of Energy.
Energy efficiency alone supported 2.2 million jobs, while solar supported roughly 374,000 and natural gas 362,000.
● While renewable sectors like solar, wind, hydropower and geothermal do not require upstream processing or extraction of a fuel, fossil-fired generation
does. Adding in these fuel-related jobs notably boosts the total employment by fossil fuel-fired generation and bioenergy. In 2016, 86% of the 362,000 jobs
associated with the natural gas sector came from fuel supply. Coal employed 160,000, with about half in coal production and supply.
● Energy efficiency jobs related to construction often hire people who also work on other types of construction tasks (26% of the 1.4 million employees in this
category spend only the minority of their time on efficiency).
3.3 million
Fuels
Generation
Energy efficiency Solar Natural Gas
0.0m 0.5m 1.0m 1.5m 2.0m 2.5m 3.0m 3.5m

31 © Bloomberg Finance LP 2018. Developed in partnership with The Business Council for Sustainable Energy.
Source: Department of Energy (DOE) Notes: 1-The graph does not separate fossil fuels into coal, gas, and oil, because this breakdown was provided for 2016 but not for 2015. To see how jobs
for coal, gas, and oil stood individually for 2016, see previous slide. 2015 data is from 2Q 2015, and 2016 data is from Q1 2016. “Advanced gas” uses a variety of technologies including high
efficiency compressor systems, advanced low NOx combustion technology, first application of closed loop steam cooling in an industrial gas turbine, advanced turbine blade and vane materials,
high temperature tbc and abradable coatings, advanced row 4 turbine blades, 3-d aero technology, or advanced brush seal.
U.S. energy overview: Jobs in electricity generation
● The graph above describes employment within electricity generation (excluding upstream fuel extraction). The solar sector is the single largest
employer in electricity generation for 2016, supporting an estimated 373,807 jobs according to the Department of Energy. Fossil fuels (coal,
gas, and oil combined) was the next largest category at 151,000,1 followed by wind with 101,738.
● Solar also added more electricity generation jobs from 2015 to 2016 than any other source. Over the year, solar employment grew by an
estimated 73,615. Wind came in second place, adding 24,650 jobs. Both outstripped jobs growth in electricity generation from fossils, which
climbed by about 15,102.1
● The strength of the solar jobs base comes partly from the labor-intensive nature of the sector, and also from the boom in solar build.
● Solar employees often work part-time in other sectors. Of the 300,192 solar industry employees counted by the Department of Energy in Q1
2016, around 30% spent the majority of their time employed in other, non-solar sectors.
● The growth in wind jobs for 2016 came on the back of strong build numbers, which hit 8.4GW that year. 2016 marked the largest year for wind
capacity additions since 2012, when developers rushed to commission projects before the then-expected expiration of the Production Tax
Credit (PTC).
2016 data
2015 data
8
20
19
36
61
56
77
136
300
6
26
33
36
66
68
102
151
374
Geothermal
Bioenergy/CHP
Other Generation
Advanced Gas
Hydroelectric
Nuclear
Wind
Fossil
Solar
Thousands of jobs in electricity generation, 2015 (lower bar) and 2016 (upper bar)1

32 © Bloomberg Finance LP 2018. Developed in partnership with The Business Council for Sustainable Energy.
Table of Contents
1. Introduction
2. A look across
the U.S. energy
sector
3. Natural gas
4. Large-scale
renewable
electricity and
CCS
2.1 Bird's eye
2.2. Policy, finance, economics
4.1 Solar (PV, solar thermal)
4.2 Wind
4.3 Biomass, biogas, waste-to-
energy
4.4 Geothermal
4.5 Hydropower
4.6 CCS
5. Distributed
power and
storage
5.1 Small-scale solar
5.2 Combined heat and power and
waste-heat-to-power
5.4 Energy storage
6. Demand-
side energy
efficiency
6.1 Energy efficiency
6.2 Demand response and digital
energy
7. Sustainable
transportation
7.1 Electric vehicles
7.2 Natural gas vehicles
7.3 Biofuels
5.3 Fuel cells (stationary)

33 © Bloomberg Finance LP 2018. Developed in partnership with The Business Council for Sustainable Energy.
Source: Bloomberg Terminal, We Are Still In, America’s Pledge, Climate Mayors, U.S. Climate Alliance, Simple Maps Note: Hawai’i and Puerto Rico have also pledged to the
Climate Alliance but are not visible in the map above. Other state members not clearly visible include Massachusetts, Maryland, Rhode Island, Vermont and Delaware.
Policy (1 of 5) : COP 21 withdrawal, “We Are Still In” and other reactions
● President Trump, on June 1, 2017, announced his intention to withdraw the U.S. from the COP 21 Paris Climate Accord, calling it “an agreement that
disadvantages the United States to the exclusive benefit of other countries.”
● Many business and political leaders disagreed with the Administration’s decision, arguing that it abdicated American leadership on climate and threatened
the country’s competitiveness in a low-carbon economy.
● Sixteen governors representing jurisdictions covering over 40% of the U.S. population joined the U.S. Climate Alliance (shown above, in purple). The
existing U.S. Climate Mayors’ group expanded to 383 cities (in blue) covering 23% of the U.S. population—half of which are in states not associated with
the Climate Alliance.
● Additionally, more than 2,642 mayors, governors, CEOs, college presidents, faith organizations, and tribal leaders responded by forming “We are Still In,” a
movement that pledges ongoing commitment to the Paris Accord’s goals. A related group, America’s Pledge, is tracking these commitments and attempting
to measure their impact. According to its initial accounting, these sub-national pledgees account for 2.7Gt in emissions. For comparison, U.S. emissions
totaled an estimated 6.4Gt estimated in 2017.
State members of the U.S. Climate Alliance and city members of Climate Mayors
34 © Bloomberg Finance LP 2018. Developed in partnership with The Business Council for Sustainable Energy.
Source: EIA, IEEE, BNEF
Average frequency of electric power service
interruptions per customer (2016)
Average duration of electric power service
interruption (2016)
0 1 2 3
CAISONYISO
ISO-NEPJM
MISOWECC
ERCOTSPP
SoutheastFlorida
Frequency (number of events)
Withoutmajorevents
With majorevents
0 200 400 600 800
CAISONYISO
ISO-NEPJM
MISOWECC
ERCOTSPP
SoutheastFlorida
Average duration (minutes)
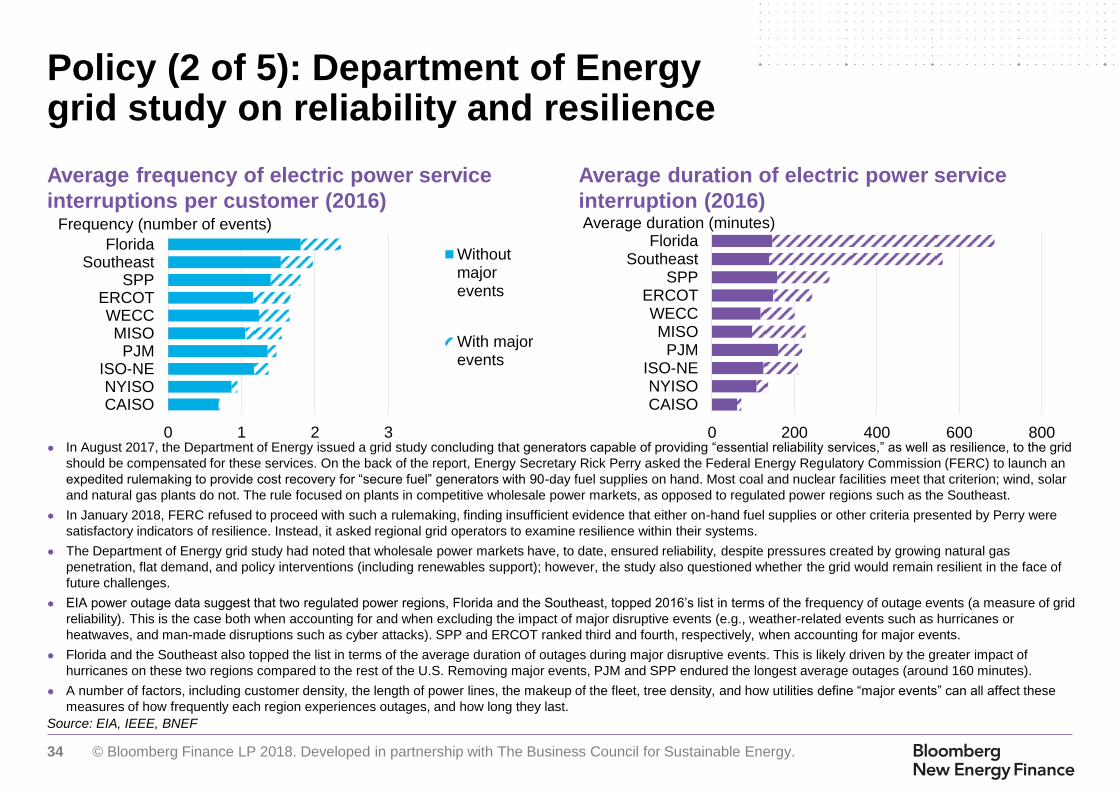
Policy (2 of 5): Department of Energy grid study on reliability and resilience
● In August 2017, the Department of Energy issued a grid study concluding that generators capable of providing “essential reliability services,” as well as resilience, to the grid
should be compensated for these services. On the back of the report, Energy Secretary Rick Perry asked the Federal Energy Regulatory Commission (FERC) to launch an
expedited rulemaking to provide cost recovery for “secure fuel” generators with 90-day fuel supplies on hand. Most coal and nuclear facilities meet that criterion; wind, solar
and natural gas plants do not. The rule focused on plants in competitive wholesale power markets, as opposed to regulated power regions such as the Southeast.
● In January 2018, FERC refused to proceed with such a rulemaking, finding insufficient evidence that either on-hand fuel supplies or other criteria presented by Perry were
satisfactory indicators of resilience. Instead, it asked regional grid operators to examine resilience within their systems.
● The Department of Energy grid study had noted that wholesale power markets have, to date, ensured reliability, despite pressures created by growing natural gas
penetration, flat demand, and policy interventions (including renewables support); however, the study also questioned whether the grid would remain resilient in the face of
future challenges.
● EIA power outage data suggest that two regulated power regions, Florida and the Southeast, topped 2016’s list in terms of the frequency of outage events (a measure of grid
reliability). This is the case both when accounting for and when excluding the impact of major disruptive events (e.g., weather-related events such as hurricanes or
heatwaves, and man-made disruptions such as cyber attacks). SPP and ERCOT ranked third and fourth, respectively, when accounting for major events.
● Florida and the Southeast also topped the list in terms of the average duration of outages during major disruptive events. This is likely driven by the greater impact of
hurricanes on these two regions compared to the rest of the U.S. Removing major events, PJM and SPP endured the longest average outages (around 160 minutes).
● A number of factors, including customer density, the length of power lines, the makeup of the fleet, tree density, and how utilities define “major events” can all affect these
measures of how frequently each region experiences outages, and how long they last.

35 © Bloomberg Finance LP 2018. Developed in partnership with The Business Council for Sustainable Energy.
Source: BNEF, National Highway Traffic Safety Administration. Note: “ICE” stands for internal combustion engine.
Policy (3 of 5): U.S. vehicle fleet fuel economy standards
● Fuel efficiency for vehicles with internal combustion engines (ICE) has improved in order to meet increasingly strict federal
and state emissions standards, the main federal example being the Corporate Average Fuel Economy (CAFE) rule.
Historically, cars have kept pace with CAFE standards. But in recent years, record-setting sales of less fuel-efficient trucks
and sport utility vehicles have closed the outperformance gap.
● For 2025, cars (as opposed to trucks) are expected to reach an average fuel efficiency of 38.4 miles per gallon. This can
occur through a combination of ICE efficiency improvements and other adjustment mechanisms such as regulatory credits
and selling more alternative fuel vehicles.
● President Trump has ordered EPA to reconsider the most stringent standards, covering model years 2021-2025.
23.8 mpg
+3.6 mpg
+0.9 mpg
28.4 mpg
-0.9 mpg +11.0 mpg
38.4 mpg
2009unadjusted
fuel economy
ICEefficiency
2009-2017
2017required
adjustments
2017 targetfuel economy
2017unadjusted
fuel economy
2025 requiredincrease in
fuel economy
2025 targetfuel economy
Miles per gallon

36 © Bloomberg Finance LP 2018. Developed in partnership with The Business Council for Sustainable Energy.
● In late 2017, President Donald Trump signed into law new tax
legislation that preserved key tax subsidies for renewables and
electric vehicles.
● The new tax law cuts corporate taxes from 35% to 21%. That
raises after-tax earnings for renewable projects but also reduces
the tax liability of major corporations that had used tax equity to
offset that liability.
● Similarly, lower tax rates also reduce the value of depreciation,
because each dollar of depreciation will produce a credit of no
more than 21% as opposed to the previous 35%.
● Further, the reduced tax rate frees up utility dollars for
infrastructure investments or to be passed back to consumers
through lower retail electricity rates, since the lower tax rate cuts
the amount utilities needed to set aside for future tax payments.
● The tax law also allows 100% expensing of most capital
expenditures in the year they are made. That provision could be a
boon for providers of long-lived products such as energy-saving
building materials and technology.
● The new law allows filers that are subject to a minimum tax on
foreign transactions, known by the acronym BEAT, to use 80% of
the value of the clean energy Investment Tax Credit (ITC) and
Production Tax Credit (PTC) to offset BEAT. This 80% offset
mitigates BEAT’s negative impact on tax-equity appetite.
● Some of the new law’s provisions expire in 2025, an event that will
impact wind projects in the pipeline today (due to the 10-year
lifespan of the PTC) more than solar (the ITC is claimed in the
project’s first year).
● The BEAT provision leaves many tax equity providers uncertain of
their tax exposure until the end of the tax year, which also means
they are uncertain of the value they can gain by pursuing tax credits.
● In February 2018, Congress passed the Bipartisan Budget Act. The
law gave a one-year, retroactive extension to incentives for non-wind
PTC technologies (biogas, biomass, waste to energy, active
geothermal, hydropower, and marine and hydrokinetic) as well as
several energy efficiency measures. It also gave five-year extensions,
with phase-outs, to several non-solar ITC technologies (fiber-optic
solar, microturbines, fuel cells, combined heat and power, and small
wind). Further, the law lifted the in-service deadline for nuclear plants
to qualify for the nuclear production tax credit, and expanded credits
for carbon capture and sequestration (CCS).
Production tax credits Investment
tax credits
Depreciation benefits
0%
10%
20%
30%
40%
50%
60%
35% tax rate 21% tax rate 21% tax rate(BEAT
provision)
21% tax rate(ITC in lieu of
PTC)
Share of total project investment
Source: BNEF
Estimated U.S. wind project tax equity
investment share
Policy (4 of 5): Tax reform

37 © Bloomberg Finance LP 2018. Developed in partnership with The Business Council for Sustainable Energy.
0.59
0.49
0.360.33 0.31 0.30 0.28
0.100.08
0.060.04
0.420.39
0.360.33
2015 2016 2017 2018 2019* 2020* 2021*
Illustrative impact of tariff on module prices, $/W (real 2017)Tariff
Module
Source: BNEF Note: 2019-21 prices are illustrative.
Policy (5 of 5): Trade policy
● President Trump in late 2017 began exploring in earnest how to make good on his campaign promise to renegotiate the
North American Free Trade Agreement (NAFTA) with Canada and Mexico. The U.S. imports substantial hydroelectric
power from Canada and is a major source of natural gas for Mexico.
● On January 23, 2018, Trump levied a 30% import duty on imported solar PV modules and cells, which will raise a module’s
2018 landed price by about 10¢/W and raise all-in project costs by an estimated 4-10% in the first year. The tariffs phase
down by 5% annually through 2021 (expiring thereafter), and also come with a 2.5GW annual exemption for cell imports.
● The president also has questioned the benefits to the U.S. of free trade with the European Union. Taken together, his
words and actions raise the risk of retaliatory action by longtime U.S. trading partners.

38 © Bloomberg Finance LP 2018. Developed in partnership with The Business Council for Sustainable Energy.
Source: Bloomberg New Energy Finance Notes: Includes new investment in wind, solar, biofuels, biomass, waste, energy smart technologies (such as electric vehicles and
lithium-ion batteries), and other renewables/low carbon services. AMER is Americas; APAC is Asia-Pacific; EMEA is Europe, Middle East, and Africa.
Finance: Total new investment in clean energy by country or region
● Global investment in clean energy hit $333.5 billion in 2017, the second highest after the $360 billion invested in 2015.
This represented a 3% increase from 2016 investment levels.
● The jump came as Chinese investment leapt 24% year on year, following a 14% dip in 2016. Chinese clean energy
investment made up 40% of the global total in 2017. European investment, on the other hand, dropped by 26%.
● Solar was the largest single recipient of investor dollars in 2017. Financing in this segment rose 18% year on year to $161
billion, even though the cost of the average utility-scale PV system actually shrank by around 25%.
● U.S. clean energy investment, which took second place after China’s, held its ground at $57 billion despite a turn towards
a less favorable domestic policy atmosphere.
10 17 35 47 44 35 47 62 53 45 52 58 56 571117 26 39
4551 63 67
90125 107 133
3039
53
75 88 91
123
13898
70
79
7478
58
15
1921 22
27
34
3952
60
5947 43
6288
130
182205 207
276
324291
269
321
360
325 333
2004 2005 2006 2007 2008 2009 2010 2011 2012 2013 2014 2015 2016 2017
$bn (nominal)
Other EMEA
Other APAC
Other AMER
Europe
Brazil
India
China
United States

39 © Bloomberg Finance LP 2018. Developed in partnership with The Business Council for Sustainable Energy.
Source: Edison Electric Institute (updated September 2017)
Finance: U.S. transmission investment by investor-owned utilities and independent transmission developers
● Investor-owned utilities and independent transmission developers spent an estimated $20.8 billion on electric transmission in 2016, a new high.
This is up 3% from 2015.
● Based on company reports, investor presentations and a survey conducted by the Edison Electric Institute (EEI), transmission investment is
likely to grow 10% in 2017 to $22.9 billion. Current capex plans suggest that investment will peak at $23.9bn in 2018; however, because 2018-
2019 budgets are not yet finalized, these numbers may be revised upwards.
● The upswing in transmission investment is motivated by a number of factors, all of which concern the utility’s fundamental aim of providing
reliable, affordable, and safe power. These include a need to replace and upgrade aging power lines, resiliency planning in response to
potential threats (both natural and man-made), the integration of renewable resources, and congestion reduction.
Actual Planned
22.923.9
22.621.6
12.0
15.1
17.2
19.7 20.2 20.8
2011 2012 2013 2014 2015 2016 2017e 2018e 2019e 2020e
$bn (nominal)

40 © Bloomberg Finance LP 2018. Developed in partnership with The Business Council for Sustainable Energy.
Source: Bloomberg New Energy Finance Notes: LCOEs do not account for the impact of the 2017 tax reform in the U.S. LCOE is the per-MWh inflation-adjusted lifecycle cost of producing electricity from a technology
assuming a certain hurdle rate (i.e., after-tax, equity internal rate of return, or IRR). The target IRR used for this analysis is 10% across all technologies. All figures are derived from Bloomberg New Energy Finance
analysis, based on numbers derived from actual deals (for inputs pertaining to capital costs per MW) and from interviews with industry participants (for inputs such as debt/equity mix, cost of debt, operating costs, and
typical project performance). Capital costs are based on evidence from actual deals, which may or may not have yielded a margin to the sellers of the equipment; the only 'margin' that is assumed for this analysis is
10% after-tax equity IRR for the project sponsor. The diamonds correspond to the costs of actual projects from regions all over the world; the hollow circles correspond to “global central scenarios” (these central
scenarios are made up of a blend of inputs from competitive projects in mature markets). For nuclear, gas, and coal, the light blue squares correspond to U.S.-specific scenarios. “CHP’” stands for combined heat and
power; “LFR” stands for linear Fresnel reflector. EIA is the source for capex ranges for nuclear and conventional plants.
0 100 200 300 400 500
Coal
Combined cycle gas
CHP
Nuclear
Large hydro
Small hydro
Biomass - anaerobic digestion
Wind - onshore
PV - no tracking
PV - tracking
Municipal solid waste
Biomass - gasification
Geothermal - flash
Landfill gas
Wind - offshore
Geothermal - binary
Solar thermal - parabolic trough
PV - thin film
Biomass - incineration
Solar thermal - LFR
Solar thermal - tower
Marine - tidal
Marine - wave
Estimated global LCOE range Country-specific LCOE 1H 2017 benchmark 2H 2016 benchmark
8441037
US China EuropeFossil technologies:
Economics: Global levelized costs of electricity (unsubsidized for new build, 1H 2017)
$/MWh

41 © Bloomberg Finance LP 2018. Developed in partnership with The Business Council for Sustainable Energy.
Source: Bloomberg New Energy Finance Note: LCOEs do not account for the impact of the tax reform in the U.S. “CCGT” stands for combined cycle gas turbine. See
previous slide for further notes regarding methodology.
Economics: U.S. levelized costs of electricity (unsubsidized for new build, 1H 2017)
● New solar PV plants can now undercut new coal build on a levelized cost of energy (LCOE) basis in the U.S. The
benchmark LCOE for a solar system with tracking was estimated at $54/MWh for 1H 2017, whereas coal came in at
$66/MWh. Capex reductions drove a $17/MWh drop in the levelized cost estimate for solar with tracking since 2H 2016.
● Meanwhile, growing renewable energy penetration and coal-to-gas switching continue to limit the average capacity factor
expected for new coal-fired power plants, helping to limit any levelized cost reductions.
● Combined-cycle gas remains one of the cheapest sources of new generation in the U.S., with benchmark projects
achieving levelized costs of $49/MWh.
● New onshore wind projects constructed in areas with strong wind resources can achieve LCOEs as low as $33/MWh,
beating out even cheap natural gas build.
0 40 80 120 160 200 240
Natural gas - CCGT
Wind - onshore
Solar PV - tracking
Coal
Solar PV - no tracking
Nuclear
Solar thermal - trough
$/MWh
LCOE range
1H 2017 benchmark
2H 2016 benchmark

42 © Bloomberg Finance LP 2018. Developed in partnership with The Business Council for Sustainable Energy.
Source: Bloomberg New Energy Finance Note: Charts show offsite PPAs only
Renewable capacity contracted by corporations,
by technology
Largest corporate offtakers, 2017
Finance: Corporate procurement of clean energy in the U.S.
● Corporate PPA volumes rose to 2.9GW in 2017, up from the 2.4GW signed in 2016. Sustainability continues to drive activity in the U.S.,
although many large corporations have met their medial targets domestically and are now looking to sign deals internationally.
● Power prices continue to remain low across the U.S., and are further depressed during hours of high wind in markets like ERCOT and SPP,
and when solar generates in CAISO. This has left many PPAs underwater, and corporations are now targeting wholesale markets with lower
existing renewable penetration, like MISO and PJM.
● Apple contracted 0.56GW of U.S. clean energy in 2017, more than any other corporation. It signed the largest PPA ever in the U.S. between a
corporation and a utility – a 235MW PV plant with NV Energy under the utility’s GreenEnergy Rider. Google signed PPAs for 0.54GW, en route
to offsetting 100% of its global electricity demand. Kimberly-Clark, T-Mobile, General Mills and Cummins all signed their first PPAs in 2017.
● Green tariff programs made up 19% of corporate procurement activity in 2017, as companies are increasingly looking to source clean energy
within the same service territory as their load. These programs are offered by utilities in 12 states, with one more state pending.
0.10.3
0.1 0.2 0.1
0.6
1.5
3.2
2.4
2.9
0
3
6
9
12
0
1
2
3
4
2008 9 10 11 12 13 14 15 16 17
Annual (GW)
Solar Wind Other Cumulative
Cumulative (GW)
356
35
45
200
536
245
200
200
160
152
62
100
100
Apple Inc
Google Inc
Kimberly-Clark
Facebook Inc
General Motors Co
T-Mobile USA
Anheuser-Busch InBev NV
Bay Area Rapid Transit
General Mills
Target Corp
MW
Solar Wind

43 © Bloomberg Finance LP 2018. Developed in partnership with The Business Council for Sustainable Energy.
Source: Bloomberg New Energy Finance, The Climate Group, company announcements, DOE. Note: The key corporate energy efficiency players displayed here are drawn from EP100
members and the list of ISO 50001 certified facilities. ISO 50001 certification means that a company has met established efficiency standards at one or more of its facilities. Corporate clean
energy procurement key players are companies that signed onto the RE100 in 2017.
Key players: corporate clean energy procurement Key players: corporate energy efficiency
Finance: Corporate procurement of clean energy and energy efficiency
● Corporations are continuing to make commitments to purchase clean energy. Through 2017, 119 companies have pledged to source 100% of
their energy consumption from renewables by signing onto the “RE100” initiative; 34% of these firms are domiciled in the U.S. Financial,
consumer staples and technology companies are the most common signees. 35 companies from nine countries joined the RE100 in 2017.
● ISO 50001, an energy management systems standard for reducing costs and carbon emissions, has become increasingly popular with U.S.
corporations. Companies and institutions that had buildings certified for ISO 50001 in 2017 include Dairygold, the Ogden Air Logistics Complex
and Kingspan Group.
● The EP100, an initiative run by The Climate Group where companies pledge to double their energy productivity, continues to gain momentum.
13 companies have signed onto the EP100, including H&M, Landsec, Johnson Controls and Swiss Re.
Retail
Financial &
Insurance
Tech
Food &
Beverage
Automotive
Financials
Retail
Manu-
facturing

44 © Bloomberg Finance LP 2018. Developed in partnership with The Business Council for Sustainable Energy.
Table of Contents
1. Introduction
2. A look across
the U.S. energy
sector
3. Natural gas
4. Large-scale
renewable
electricity and
CCS
2.1 Bird's eye
2.2. Policy, finance, economics
4.1 Solar (PV, solar thermal)
4.2 Wind
4.3 Biomass, biogas, waste-to-
energy
4.4 Geothermal
4.5 Hydropower
4.6 CCS
5. Distributed
power and
storage
5.1 Small-scale solar
5.2 Combined heat and power and
waste-heat-to-power
5.4 Energy storage
6. Demand-
side energy
efficiency
6.1 Energy efficiency
6.2 Demand response and digital
energy
7. Sustainable
transportation
7.1 Electric vehicles
7.2 Natural gas vehicles
7.3 Biofuels
5.3 Fuel cells (stationary)
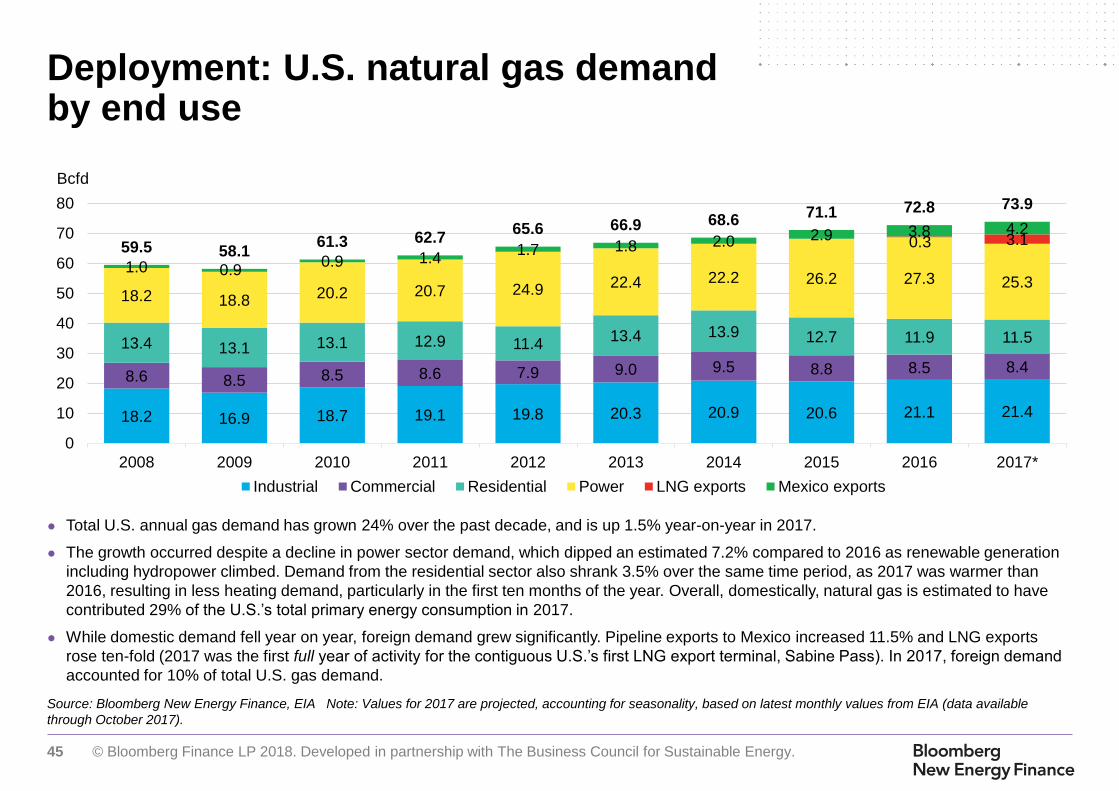
45 © Bloomberg Finance LP 2018. Developed in partnership with The Business Council for Sustainable Energy.
Source: Bloomberg New Energy Finance, EIA Note: Values for 2017 are projected, accounting for seasonality, based on latest monthly values from EIA (data available
through October 2017).
Deployment: U.S. natural gas demand by end use
● Total U.S. annual gas demand has grown 24% over the past decade, and is up 1.5% year-on-year in 2017.
● The growth occurred despite a decline in power sector demand, which dipped an estimated 7.2% compared to 2016 as renewable generation
including hydropower climbed. Demand from the residential sector also shrank 3.5% over the same time period, as 2017 was warmer than
2016, resulting in less heating demand, particularly in the first ten months of the year. Overall, domestically, natural gas is estimated to have
contributed 29% of the U.S.’s total primary energy consumption in 2017.
● While domestic demand fell year on year, foreign demand grew significantly. Pipeline exports to Mexico increased 11.5% and LNG exports
rose ten-fold (2017 was the first full year of activity for the contiguous U.S.’s first LNG export terminal, Sabine Pass). In 2017, foreign demand
accounted for 10% of total U.S. gas demand.
18.2 16.9 18.7 19.1 19.8 20.3 20.9 20.6 21.1 21.4
8.6 8.5 8.5 8.6 7.9 9.0 9.5 8.8 8.5 8.4
13.4 13.1 13.1 12.9 11.413.4 13.9 12.7 11.9 11.5
18.2 18.8 20.2 20.7 24.9 22.4 22.2 26.2 27.3 25.3
0.3 3.1
1.0 0.90.9 1.4
1.7 1.8 2.0 2.9 3.8 4.259.5 58.1
61.3 62.765.6 66.9 68.6
71.1 72.8 73.9
0
10
20
30
40
50
60
70
80
2008 2009 2010 2011 2012 2013 2014 2015 2016 2017*
Industrial Commercial Residential Power LNG exports Mexico exports
Bcfd

46 © Bloomberg Finance LP 2018. Developed in partnership with The Business Council for Sustainable Energy.
Source: Bloomberg Terminal, EIA, Baker Hughes
Deployment: U.S. gas-directed rig count and gas production
● Gas production has become more efficient since around 2009. Between September 2008 and November 2017, the U.S.
gas-directed rig count collapsed nearly 90% from a monthly average of 1,585 to 172. But at the same time, total
production rose 56%, driven by the explosive growth in shale gas production.
● In 2017, the gas-directed rig count rebounded as gas prices picked up, and infrastructure build-out promised to allow more
gas to exit the Marcellus region and reach demand centers. Recent gas production has also been buoyed by the growing
amount of associated gas generated as a byproduct of oil production.
0
200
400
600
800
1,000
1,200
1,400
1,600
1,800
0
10
20
30
40
50
60
70
80
90
2006 2007 2008 2009 2010 2011 2012 2013 2014 2015 2016 2017
Rig countNatural gas production (Bcfd)
Other lower 48 Shale Rigs

47 © Bloomberg Finance LP 2018. Developed in partnership with The Business Council for Sustainable Energy.
Source: EIA, Bloomberg New Energy Finance. Notes: Values for 2017 are projected, accounting for seasonality, based on the latest monthly values from the EIA (data
available through October 2017).
Natural gas prices to commercial customers U.S. natural gas industrial consumption
$0
$2
$4
$6
$8
$10
$12
$14
$16
1967 1977 1987 1997 2007 2017
$/mcf (real 2017$)
0
4
8
12
16
20
24
2001 2003 2005 2007 2009 2011 2013 2015 2017
Bcfd
Deployment: Natural gas supplies to commercial, industrial sectors
● Expanding U.S. gas production has pushed down the gas prices faced by industrial and commercial users by 62% and
42%, respectively, over the last 10 years. However, both these customer groups experienced a slight price uptick in 2017,
with prices to the commercial sector up to $8.01/mcf from $7.43/mcf in 2016, and the industrial sector up to $4.15/mcf from
$3.59/mcf (all in real 2017 dollars). Nevertheless, the last two years offered some of the lowest prices on record.
● The shale boom began pushing down gas prices around 2008, prompting growth in industrial demand. Industrial gas
consumption swelled 17% from 2008 to 2017, with annual growth rates averaging 2% year-on-year since 2011.
● Commercial gas consumption, on the other hand, has remained flat despite falling prices, since commercial gas demand is
largely driven by weather and the overall health of the economy.
Commercial
Industrial
Industrial
Commercial

48 © Bloomberg Finance LP 2018. Developed in partnership with The Business Council for Sustainable Energy.
Source: Bloomberg New Energy Finance, EIA Notes: Values for 2017 are projected, accounting for seasonality, based on latest monthly values from EIA (data available
through October 2017).
Deployment: U.S. natural gas residential customers vs. consumption
● Due to energy efficiency efforts, residential gas consumption has shrunk even as the number of customers has expanded.
The customer base for residential gas expanded by 12 million customers, or 21%, over the past 20 years. Meanwhile,
residential consumption has declined slightly over the same period.
● Residential gas consumption continues to be driven by weather patterns. Consumption dropped during the abnormally
mild winter of 2011-12, then jumped during the polar vortices of 2013 and 2014. 2015’s mild winter temperatures put
residential consumption back to its longer term, lower rate. It then remained flat in 2017, with average consumption in the
first ten months of the year roughly equal to that of 2016.
0
3
6
9
12
15
18
21
1995 1997 1999 2001 2003 2005 2007 2009 2011 2013 2015 2017
0
10
20
30
40
50
60
70
Residential Gas Demand (line, Bcfd)
Residential customers Residential consumption
Millions of customers
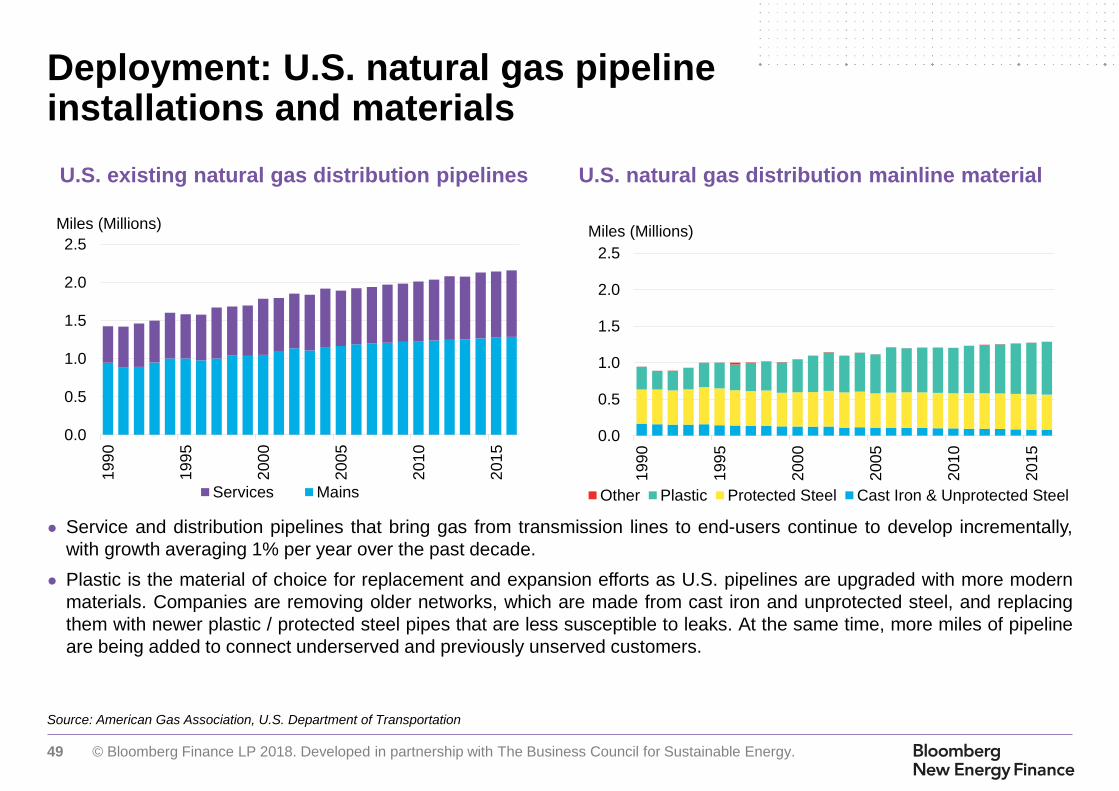
49 © Bloomberg Finance LP 2018. Developed in partnership with The Business Council for Sustainable Energy.
Source: American Gas Association, U.S. Department of Transportation
U.S. existing natural gas distribution pipelines U.S. natural gas distribution mainline material
Deployment: U.S. natural gas pipeline installations and materials
● Service and distribution pipelines that bring gas from transmission lines to end-users continue to develop incrementally,
with growth averaging 1% per year over the past decade.
● Plastic is the material of choice for replacement and expansion efforts as U.S. pipelines are upgraded with more modern
materials. Companies are removing older networks, which are made from cast iron and unprotected steel, and replacing
them with newer plastic / protected steel pipes that are less susceptible to leaks. At the same time, more miles of pipeline
are being added to connect underserved and previously unserved customers.
0.0
0.5
1.0
1.5
2.0
2.5
199
0
199
5
200
0
200
5
201
0
201
5
Miles (Millions)
Services Mains
0.0
0.5
1.0
1.5
2.0
2.5
199
0
199
5
200
0
200
5
201
0
201
5
Miles (Millions)
Other Plastic Protected Steel Cast Iron & Unprotected Steel

50 © Bloomberg Finance LP 2018. Developed in partnership with The Business Council for Sustainable Energy.
Source: Bloomberg New Energy Finance, American Gas Association, EIA Notes: EIA data used here include both first-mile takeaway capacity and other pipeline additions that
do not impact takeaway capacity. 2017 transmission capacity addition is a BNEF estimate and not EIA historical data. Expenditure values reflect figures reported to the AGA by
different types of companies across the supply chain, including transmission companies, investor-owned local distribution companies, and municipal gas utilities. “General’”
includes miscellaneous expenditures such as construction of administrative buildings. Totals may not sum due to rounding.
U.S. transmission pipeline capacity additions U.S. midstream gas construction expenditures
Deployment: U.S. midstream infrastructure capacity and investment
● Pipeline companies completed 6Bcfd of pipeline capacity in 2016, just slightly below the 7.6Bcfd planned. A number of delays pushed the
online date of many substantial projects from 2015-2016 into 2017-2018.
● The next few years are scheduled to see major increases in pipeline capacity growth. 33Bcfd of capacity was scheduled to be completed in
2017, though just under half of this is estimated to have been complete by year’s end.
● Takeaway capacity from the Appalachian Basin expanded by 4.1Bcfd in 2017, but only 0.04Bcfd (1%) of this brings gas into New England
(through the Atlantic Bridge Expansion project on the Algonquin pipeline). As a result, natural gas delivery into New England remains
constrained.
● Midstream expenditures increased 19% year-on-year in 2016. Distribution accounted for nearly half of the increased spending, rising to its
highest level yet at $13.4bn, a 16% increase over 2015 levels. There was also a small but noticeable increase in production and storage
expenditure, which more than doubled in 2016.
6 5 47 5 7 5 7 8
5 56
77
8 1012
1311 1
22
2 2
2
3
1412 11
1715
17 17
21
25
0
5
10
15
20
25
30
2008 2009 2010 2011 2012 2013 2014 2015 2016
General
Productionand storage
Undergroundstorage
Distribution
Transmission
$bn (nominal)
3 6 7 49 9 11 9 6 8 10
15
45
2217 19
5 6 7 9 614
199
6
199
7
199
8
199
9
200
0
200
1
200
2
2003
2004
2005
200
6
200
7
200
8
200
9
201
0
201
1
201
2
201
3
201
4
2015
2016
201
7
Bcfd

51 © Bloomberg Finance LP 2018. Developed in partnership with The Business Council for Sustainable Energy.
-10
-8
-6
-4
-2
0
2
4
6
8
10
2011 2012 2013 2014 2015 2016 2017
Volume (Bcfd)
Exports to Canada Exports to Mexico LNG exports Imports from Canada LNG imports Net exports*
Source: Bloomberg Terminal, EIA Note: *Net export line shows the six-month rolling average.
Deployment: U.S. natural gas exports and imports
● In 2017, the U.S. strengthened its position as a net exporter of gas. Net export volumes averaged 2Bcfd in the first eleven
months of 2017, compared to net imports of 0.03Bcfd over that period in 2016.
● Exports were net positive every month in 2017, for the first time. The U.S. has exported 625Bcf of LNG, worth roughly
$2.8 billion, through November 2017. For perspective, the global LNG market is $90bn/year, so there is room for growth.
● In 2017, the Sabine pass LNG export terminal (the U.S.’s first) doubled its capacity to 2.5Bcfd. The U.S. now exports LNG
to 25 countries, with Mexico, South Korea, China and Japan serving as top offtakers. A second export terminal, Cove
Point, is scheduled to open in Maryland in early 2018.
● The U.S. exported 1,407Bcf via pipelines to Mexico from January through November 2017, compared to 1,265Bcf over the
same period in 2016.

52 © Bloomberg Finance LP 2018. Developed in partnership with The Business Council for Sustainable Energy.
-$2.36
-$0.90
$0.82
$0.83
$2.15
$2.28
$2.41
$2.78
$3.04
$3.82
$3.92
-$3.00 -$2.00 -$1.00 $0.00 $1.00 $2.00 $3.00 $4.00
Permian (Midland)
Eagle Ford (volatile oil)
Permian (Delaware)
STACK (Meramec)
Marcellus (core)
STACK (Cana Miss.)
Utica (dry)
STACK (Woodford)
Haynesville
Barnett
Fayetteville
$/MMBtu
Source: Bloomberg New Energy Finance Note: The STACK play name is derived from “Sooner Trend Anadarko (basin) Canadian and Kingfisher (counties)”.
Economics: Gas wellhead breakevens by basin
● Producers have achieved strong efficiency gains and reductions in drilling and completion (D&C) costs over the past two
years, resulting in “breakeven” prices of $2-4/MMBtu in most basins, assuming an internal rate of return of 20%.
● Oil-directed plays, such as the Eagle Ford and Permian, show even lower breakeven costs. This is because gas is
produced as a byproduct of oil production, and the rebound in oil prices has buoyed both oil and associated gas
production.
● Breakeven prices do not take into account the basis to Henry Hub. In areas such as the Marcellus and Utica, negative
basis can eat into the attractiveness of the plays.

53 © Bloomberg Finance LP 2018. Developed in partnership with The Business Council for Sustainable Energy.
0
20
40
60
80
100
120
2005 2007 2009 2011 2013 2015 2017
$/MWh (nominal)
Source: Bloomberg New Energy Finance Notes: Assumes heat rates of 7,410Btu/kWh for CCGT and 10,360Btu/kWh for coal (both are fleet-wide generation-weighted
medians); variable O&M of $3.15/MWh for CCGT and $4.25/MWh for coal. Gas price used is Henry Hub. CCGT stands for a combined-cycle gas turbine. CAPP represents
Appalachian coal prices.
Economics: Cost of generating electricity in the U.S. from natural gas vs. coal
● Power has served as the swing demand source for natural gas: when the price of gas falls below that of coal, gas burn
rises until the differential (in $/MWh) between the two fuels closes.
● As gas becomes consistently cheaper than coal, it creates a strong impetus for coal-to-gas switching. The U.S. observed
this switching in 2012 and 2016. In 2017, gas again undercut coal in terms of marginal cost for power generation.
● Power burn in PJM has the greatest sensitivity to gas prices and also faces lower gas prices than Henry Hub (which is
shown in the graph above). The coal-to-gas switch potential is, therefore, the strongest in this region.
Gas (CCGT)
Coal (CAPP)

54 © Bloomberg Finance LP 2018. Developed in partnership with The Business Council for Sustainable Energy.
Table of Contents
1. Introduction
2. A look across
the U.S. energy
sector
3. Natural gas
4. Large-scale
renewable
electricity and
CCS
2.1 Bird's eye
2.2. Policy, finance, economics
4.1 Solar (PV, solar thermal)
4.2 Wind
4.3 Biomass, biogas, waste-to-
energy
4.4 Geothermal
4.5 Hydropower
4.6 CCS
5. Distributed
power and
storage
5.1 Small-scale solar
5.2 Combined heat and power and
waste-heat-to-power
5.4 Energy storage
6. Demand-
side energy
efficiency
6.1 Energy efficiency
6.2 Demand response and digital
energy
7. Sustainable
transportation
7.1 Electric vehicles
7.2 Natural gas vehicles
7.3 Biofuels
5.3 Fuel cells (stationary)

55 © Bloomberg Finance LP 2018. Developed in partnership with The Business Council for Sustainable Energy.
Source: Bloomberg New Energy Finance Note: Graph shows BNEF conservative estimate for 2017.
Deployment: Global solar build, large-scale and small-scale
● The global industry continued to scale new heights, installing an estimated 92-97GW of new capacity across utility-scale
and small-scale segments in 2017. China installed at least 50GW in 2017, over half of global demand.
● The U.S. market is becoming of lesser significance to solar manufacturers who are instead focused on growth markets
within Asia, the Middle East and Africa. After a record year of installations in 2016 driven by the anticipated expiration of
the federal Investment Tax Credit, the U.S. solar industry contracted around 22% in 2017.
2 3 6 7 7 1411
1.5GW 3GW7GW 8GW
18GW
28GW 30GW
42GW46GW
56GW
75GW
93GW
2006 2007 2008 2009 2010 2011 2012 2013 2014 2015 2016 2017e
Europe Japan USA China India Rest of World

56 © Bloomberg Finance LP 2018. Developed in partnership with The Business Council for Sustainable Energy.
Source: Bloomberg New Energy Finance
Deployment: U.S. large-scale solar build
● After a boom year in 2016 due to the then-anticipated ITC expiration, utility-scale installations fell 31% year-on-year to
7.1GW in 2017.
● Developers are replenishing their depleted project pipelines and entering new state markets where the next generation of
utility-scale solar projects will be developed in time to claim the full value of the Investment Tax Credit.
● No solar thermal facilities were commissioned in the U.S. in 2017, although there were a small number of project
announcements. Developers and financiers continue to focus their attention on PV.
● In January 2018, President Trump's announced the introduction of a 30% duty on imported photovoltaic cells and modules.
The tariffs ratchet down quickly and are complemented by a 2.5GW annual exemption for cell imports.
● While significant, the industry has developed buffers to absorb some of the tariff’s impact: modules have been stockpiled in
anticipation, thin-film technology has been made exempt, and buyers still have access to tariff-exempt imports from a small
number of countries home to miniscule PV manufacturing industries.
1.9
3.24.1 4.4
10.2
7.1
0.30.9
0.1
2012 2013 2014 2015 2016 2017e
GW
Solar PV
Solar thermal
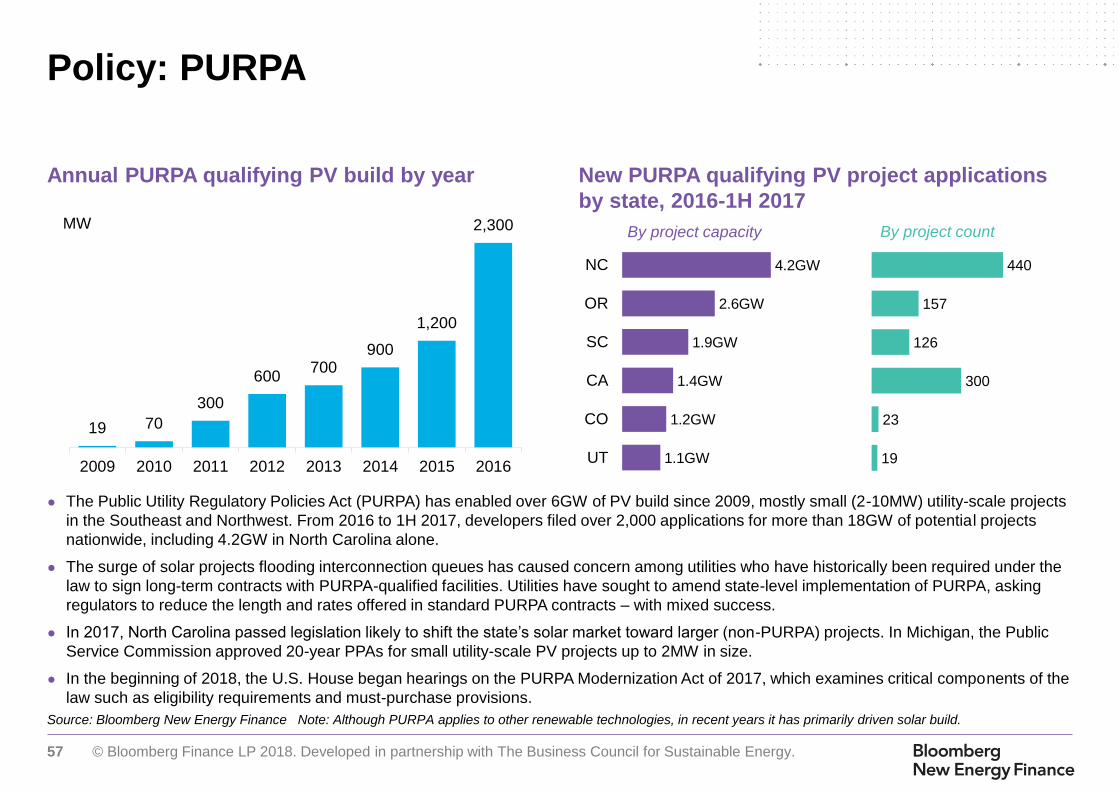
57 © Bloomberg Finance LP 2018. Developed in partnership with The Business Council for Sustainable Energy.
Source: Bloomberg New Energy Finance Note: Although PURPA applies to other renewable technologies, in recent years it has primarily driven solar build.
Annual PURPA qualifying PV build by year New PURPA qualifying PV project applications
by state, 2016-1H 2017
Policy: PURPA
● The Public Utility Regulatory Policies Act (PURPA) has enabled over 6GW of PV build since 2009, mostly small (2-10MW) utility-scale projects
in the Southeast and Northwest. From 2016 to 1H 2017, developers filed over 2,000 applications for more than 18GW of potential projects
nationwide, including 4.2GW in North Carolina alone.
● The surge of solar projects flooding interconnection queues has caused concern among utilities who have historically been required under the
law to sign long-term contracts with PURPA-qualified facilities. Utilities have sought to amend state-level implementation of PURPA, asking
regulators to reduce the length and rates offered in standard PURPA contracts – with mixed success.
● In 2017, North Carolina passed legislation likely to shift the state’s solar market toward larger (non-PURPA) projects. In Michigan, the Public
Service Commission approved 20-year PPAs for small utility-scale PV projects up to 2MW in size.
● In the beginning of 2018, the U.S. House began hearings on the PURPA Modernization Act of 2017, which examines critical components of the
law such as eligibility requirements and must-purchase provisions.
19 70
300
600700
900
1,200
2,300
2009 2010 2011 2012 2013 2014 2015 2016
MW
4.2GW
2.6GW
1.9GW
1.4GW
1.2GW
1.1GW
NC
OR
SC
CA
CO
UT
By project capacity
440
157
126
300
23
19
NC
OR
SC
CA
CO
UT
By project count

58 © Bloomberg Finance LP 2018. Developed in partnership with The Business Council for Sustainable Energy.
Source: Bloomberg New Energy Finance
Venture capital / private equity investment in
U.S. solar by type of investment
Asset finance for U.S. large-scale solar projects
by technology
Financing: U.S. large-scale solar investment
● Both private equity capital and venture capital investment for U.S. solar dropped significantly in 2017. Private equity
investment totaled $0.2bn, the lowest amount since 2009, while venture capital investment dropped to $0.3bn, the lowest
since 2013.
● Asset finance deals for utility-scale solar declined for the second consecutive year, dropping to $8.6bn. This correlates with
falling technology costs. Asset finance levels in 2017 are a leading indicator for utility-scale solar build in 2018, as most
assets are typically financed a year prior to commissioning.
0.10.4
0.60.4
0.2
1.00.8
1.0
0.2
0.6
1.11.1
0.6
0.2
0.3 0.80.1
0.1
0.3
0.40.2
0.10.4
0.2
1.1
1.9 1.9
1.2
0.4
1.4
1.7
1.5
0.5
2009 2010 2011 2012 2013 2014 2015 2016 2017
$bn
VC early-stage
VC late-stage
PEexpansioncapital
1.33.6
16.5
10.36.2
8.7
14.6 13.6
8.6
8.0
1.5
1.43.6
24.5
10.3
6.2
10.2
14.613.6
8.6
2009 2010 2011 2012 2013 2014 2015 2016 2017
$bn
Solarthermal
Utility-scale PV

59 © Bloomberg Finance LP 2018. Developed in partnership with The Business Council for Sustainable Energy.
Source: Bloomberg New Energy Finance Note: Prices indexed to U.S. PPI
Economics: Global price of solar modules and experience curve
● Module prices have decreased exponentially to an estimated 32 U.S. cents per watt in 2017, down dramatically from $74
per watt (in 2016 dollars) in 1976 – a learning rate, or reduction per doubling of capacity, of about 28%.
● Thanks to the rapid learning rate, module prices have fallen around 92% over the past decade.
● It is more difficult to establish learning rates for the rest of the components that go into a solar project – the inverter, the
mounting structure, cables, groundwork and engineering or installation; however, these have also gotten steadily cheaper.
$0
$1
$10
$100
1 10 100 1,000 10,000 100,000 1,000,000
Historic prices (Maycock) Chinese c-Si module prices (BNEF) Experience curve at 28%
1985
2003 2008
Cumulative capacity (MW)
2015
2017e
Crystalline silicon PV module prices and learning curve (real 2016 US$/W)
1976

60 © Bloomberg Finance LP 2018. Developed in partnership with The Business Council for Sustainable Energy.
Source: Bloomberg New Energy Finance Note: ‘Other’ refers to developer fees, land acquisition fees, finance arrangement, contingency and other miscellaneous costs.
Economics: Global benchmark capex for utility-scale solar PV
● The cost of building a utility-scale PV facility declined dramatically from 2010 to 2012 (based on the global benchmark for
mature markets) before leveling off to more modest annual cost reductions from 2012 to 2017.
● Utility-scale PV capex costs are estimated to have broken through the symbolic “dollar-per-watt” threshold in parts of U.S.
such as the Carolinas; however, costs remain above this level on average.
3.24
2.65
1.801.58 1.49
1.311.14
0.98
$0
$1
$2
$3
$4
2010 2011 2012 2013 2014 2015 2016 2017
Price benchmark for fixed-axis, utility-scale PV systems (real 2016 US$/W)Other
Engineering, procurement &construction
Balance of plant
Inverter
Module
61 © Bloomberg Finance LP 2018. Developed in partnership with The Business Council for Sustainable Energy.
Table of Contents
1. Introduction
2. A look across
the U.S. energy
sector
3. Natural gas
4. Large-scale
renewable
electricity and
CCS
2.1 Bird's eye
2.2. Policy, finance, economics
4.1 Solar (PV, solar thermal)
4.2 Wind
4.3 Biomass, biogas, waste-to-
energy
4.4 Geothermal
4.5 Hydropower
4.6 CCS
5. Distributed
power and
storage
5.1 Small-scale solar
5.2 Combined heat and power and
waste-heat-to-power
5.4 Energy storage
6. Demand-
side energy
efficiency
6.1 Energy efficiency
6.2 Demand response and digital
energy
7. Sustainable
transportation
7.1 Electric vehicles
7.2 Natural gas vehicles
7.3 Biofuels
5.3 Fuel cells (stationary)
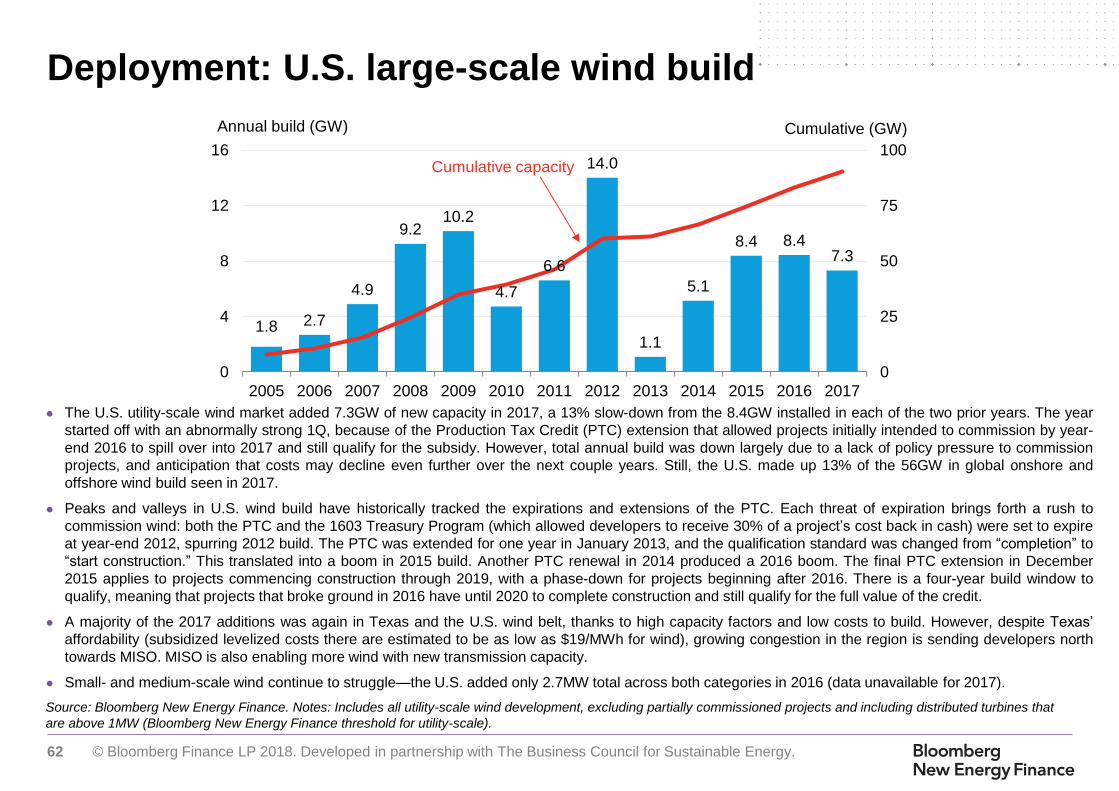
62 © Bloomberg Finance LP 2018. Developed in partnership with The Business Council for Sustainable Energy.
Source: Bloomberg New Energy Finance. Notes: Includes all utility-scale wind development, excluding partially commissioned projects and including distributed turbines that
are above 1MW (Bloomberg New Energy Finance threshold for utility-scale).
● The U.S. utility-scale wind market added 7.3GW of new capacity in 2017, a 13% slow-down from the 8.4GW installed in each of the two prior years. The year
started off with an abnormally strong 1Q, because of the Production Tax Credit (PTC) extension that allowed projects initially intended to commission by year-
end 2016 to spill over into 2017 and still qualify for the subsidy. However, total annual build was down largely due to a lack of policy pressure to commission
projects, and anticipation that costs may decline even further over the next couple years. Still, the U.S. made up 13% of the 56GW in global onshore and
offshore wind build seen in 2017.
● Peaks and valleys in U.S. wind build have historically tracked the expirations and extensions of the PTC. Each threat of expiration brings forth a rush to
commission wind: both the PTC and the 1603 Treasury Program (which allowed developers to receive 30% of a project’s cost back in cash) were set to expire
at year-end 2012, spurring 2012 build. The PTC was extended for one year in January 2013, and the qualification standard was changed from “completion” to
“start construction.” This translated into a boom in 2015 build. Another PTC renewal in 2014 produced a 2016 boom. The final PTC extension in December
2015 applies to projects commencing construction through 2019, with a phase-down for projects beginning after 2016. There is a four-year build window to
qualify, meaning that projects that broke ground in 2016 have until 2020 to complete construction and still qualify for the full value of the credit.
● A majority of the 2017 additions was again in Texas and the U.S. wind belt, thanks to high capacity factors and low costs to build. However, despite Texas’
affordability (subsidized levelized costs there are estimated to be as low as $19/MWh for wind), growing congestion in the region is sending developers north
towards MISO. MISO is also enabling more wind with new transmission capacity.
● Small- and medium-scale wind continue to struggle—the U.S. added only 2.7MW total across both categories in 2016 (data unavailable for 2017).
Deployment: U.S. large-scale wind build
1.8 2.7
4.9
9.210.2
4.7
6.6
14.0
1.1
5.1
8.4 8.47.3
0
25
50
75
100
0
4
8
12
16
2005 2006 2007 2008 2009 2010 2011 2012 2013 2014 2015 2016 2017
Cumulative (GW)Annual build (GW)
Cumulative capacity

63 © Bloomberg Finance LP 2018. Developed in partnership with The Business Council for Sustainable Energy.
Source: Bloomberg New Energy Finance. Notes: Production capacity measured by nacelle assembly on U.S. soil.
U.S. wind turbine production capacity by
manufacturer
U.S. wind turbine supply contracts for
projects by commissioning year, by
manufacturer
Deployment: U.S. wind turbine production and contracting
● The recent mergers of Nordex and Acciona Wind Power into Nordex Group (2016), and Siemens and Gamesa into Siemens Gamesa
Renewable Energy (2017), accentuated a global trend toward market consolidation. This trend was also quite noticeable in 2016, when global
wind build hit the second-highest level on record, and the top-10 manufacturers broke away from the remaining smaller players to dominate
75% of new capacity additions. Further, a “big four” of dominant wind turbine manufacturing emerged: Vestas in the lead, followed by GE,
Goldwind, and Siemens Gamesa RE.
● Vestas supplied turbines for 2.7GW of the 7.3GW of wind commissioned in the U.S. in 2017. GE came in second behind Vestas, supplying
2.1GW. Meanwhile, Siemens Gamesa (with 1.6GW) and Nordex Group (0.8GW) increased their market shares and intensified the competition
faced by the two market leaders.
● GE was the top wind turbine maker for U.S. project installations from 2003-2015, but was displaced by Vestas in 2016 and again in 2017. The
U.S. has been an important market for GE historically: almost two-thirds of GE’s all-time installations by capacity have been U.S.-based,
compared to only one-quarter for Vestas.
9.210.2
4.7
6.6
14.0
1.1
5.1
8.4 8.47.3
0
4
8
12
16
2008 2009 2010 2011 2012 2013 2014 2015 2016 2017
GW
3.95.0
5.6
10.0 9.58.3
11.5 11.4 11.6 11.2
0
4
8
12
16
2008 2009 2010 2011 2012 2013 2014 2015 2016 2017
GWUnknown
Other
Suzlon
Mitsubishi
Nordex Group
Siemens Gamesa RE
Vestas
GE
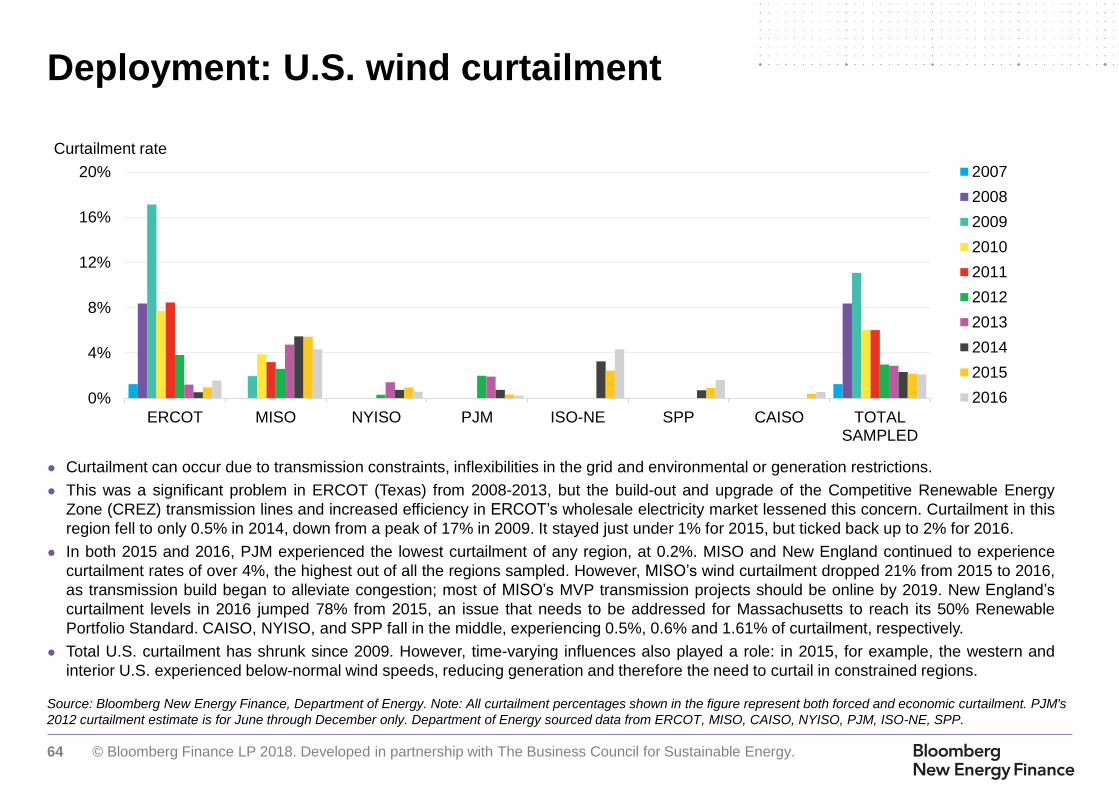
64 © Bloomberg Finance LP 2018. Developed in partnership with The Business Council for Sustainable Energy.
Source: Bloomberg New Energy Finance, Department of Energy. Note: All curtailment percentages shown in the figure represent both forced and economic curtailment. PJM's
2012 curtailment estimate is for June through December only. Department of Energy sourced data from ERCOT, MISO, CAISO, NYISO, PJM, ISO-NE, SPP.
Deployment: U.S. wind curtailment
● Curtailment can occur due to transmission constraints, inflexibilities in the grid and environmental or generation restrictions.
● This was a significant problem in ERCOT (Texas) from 2008-2013, but the build-out and upgrade of the Competitive Renewable Energy
Zone (CREZ) transmission lines and increased efficiency in ERCOT’s wholesale electricity market lessened this concern. Curtailment in this
region fell to only 0.5% in 2014, down from a peak of 17% in 2009. It stayed just under 1% for 2015, but ticked back up to 2% for 2016.
● In both 2015 and 2016, PJM experienced the lowest curtailment of any region, at 0.2%. MISO and New England continued to experience
curtailment rates of over 4%, the highest out of all the regions sampled. However, MISO’s wind curtailment dropped 21% from 2015 to 2016,
as transmission build began to alleviate congestion; most of MISO’s MVP transmission projects should be online by 2019. New England’s
curtailment levels in 2016 jumped 78% from 2015, an issue that needs to be addressed for Massachusetts to reach its 50% Renewable
Portfolio Standard. CAISO, NYISO, and SPP fall in the middle, experiencing 0.5%, 0.6% and 1.61% of curtailment, respectively.
● Total U.S. curtailment has shrunk since 2009. However, time-varying influences also played a role: in 2015, for example, the western and
interior U.S. experienced below-normal wind speeds, reducing generation and therefore the need to curtail in constrained regions.
Curtailment rate
0%
4%
8%
12%
16%
20%
ERCOT MISO NYISO PJM ISO-NE SPP CAISO TOTALSAMPLED
2007
2008
2009
2010
2011
2012
2013
2014
2015
2016

65 © Bloomberg Finance LP 2018. Developed in partnership with The Business Council for Sustainable Energy.
0
5
10
15
20
25
Jan 2
01
0
Jan 2
01
1
Jan 2
01
2
Jan 2
01
3
Jan 2
01
4
Jan 2
01
5
Jan 2
01
6
Jan 2
01
7
Jan 2
01
8
Gigawatts
Solar PV
Houston Wind
Coastal Wind
South Wind
North Wind
West Wind
Panhandle Wind
Source: Bloomberg New Energy Finance, ERCOT, EIA. Note: The Texas map displays all commissioned wind in Texas, including those outside of ERCOT.
● Texas is home to one-quarter of America’s installed wind capacity, hosting over 22GW out of 90GW installed nation-wide as of December 2017.
● The majority was enabled by a $7bn investment in the Competitive Renewable Energy Zone (CREZ) transmission lines, which connect West
Zone and Panhandle wind to load centers in the East. The CREZ lines can accommodate roughly 12.7GW of West Zone and 5.8GW of
Panhandle wind before significant curtailment (and congestion pricing) comes back into play. Most of this is already filled up, with only 2-3GW of
space left on CREZ’s lines and a plethora of wind projects proposed in the region.
Deployment: ERCOT’s Competitive Renewable Energy Zone (CREZ)
CREZ line capacity
maxes out around
6GW of Panhandle
wind
CREZ line capacity
maxes out around
18GW of West +
Panhandle wind
Wind
Solar Biomass
1,000MW
100MW
10MW

66 © Bloomberg Finance LP 2018. Developed in partnership with The Business Council for Sustainable Energy.
Source: Midwest ISO; MISO MTER14 MVP Triennial Review, September 2014.
Notes: Projects are as follows: (1) Big Stone–Brookings, (2) Brookings, SD–SE Twin
Cities, (3) Lakefield Jct.–Winnebago–Winco–Burt Area & Sheldon–Burt Area–
Webster, (4) Winco–Lime Creek–Emery–Black Hawk– Hazleton, (5) LaCrosse–N.
Madison–Cardinal & Dubuque Co– Spring Green–Cardinal, (6) Ellendale–Big Stone,
(7) Adair–Ottumwa, (8) Adair–Palmyra Tap, (9) Palmyra Tap–Quincy–Meredosia–
Ipava & Meredosia–Pawnee, (10) Pawnee–Pana, (11) Pana–Mt. Zion–Kansas–Sugar
Creek, (12) Reynolds–Burr Oak–Hiple, (13) Michigan Thumb Loop Expansion, (14)
Reynolds–Greentown, (15) Pleasant Prairie–Zion Energy Center, (16) Fargo-
Galesburg–Oak Grove, (17) Sidney–Rising.
● The American Wind Energy Association (AWEA) estimates that
transmission proposals across the U.S. could potentially enable 52GW
of wind capacity between 2017 and 2024. This does not include
transmission associated with AEP’s Wind Catcher Energy Connection.
● AWEA’s estimate includes the 14GW-enabling1 Multi Value Project
(MVP) transmission portfolio currently underway by the Midwest
Independent System Operator (MISO). There are 17 projects within
MVP: Five of these are already complete, 11 are expected to come
online by 2019, and one by 2023. This expanded MISO transmission
capacity is expected to fill up quickly—thirty gigawatts of wind and
15GW of solar are already in the MISO interconnection queue as of
December 2017.
● Finally, five high-voltage DC transmission projects by Clean Line
Energy Partners represent 16GW of potential wind capacity.
– These projects have seen a myriad of challenges, including the
Missouri Public Service Commission’s denial of the Grain Belt
Express application.
– NextEra Energy Resources acquired Clean Line’s Plains & Eastern
project assets in Oklahoma, after the project struggled to sign on the
Tennessee Valley Authority as an offtaker.
● Many of the proposed transmission projects have yet to begin
construction and much of this will not be built. Generally, transmission
build within a specific state or region receives full approval faster than
those that cross multiple jurisdictions. Furthermore, utility-owned
transmission projects have typically seen more success than private
lines. The Transwest Express line, which expects to commission by
2021, has been under development since 2005 – meaning if the asset
comes online, it will have taken 16 years to develop.
Deployment: Transmission build-out in MISO and Mountain West
MISO Multi Value Project transmission portfolio

67 © Bloomberg Finance LP 2018. Developed in partnership with The Business Council for Sustainable Energy.
Source: Bloomberg New Energy Finance Notes: Values include estimates for undisclosed deals. 2015 figure includes $323m directed towards an offshore wind project, the
Deepwater Block Island Offshore Wind Farm.
Financing: Asset finance for U.S. large-scale wind projects
● The 2017-20 wind pipeline is very healthy: a large portion of the $15.5 billion in financing secured in 2016 and the record
$19.6 billion secured in 2017 is for wind projects to be commissioned in 2018-2020.
● Asset financing has tracked closely with the status of the Production Tax Credit (PTC), which has expired and been
retroactively extended multiple times since 2012. The final chance to receive the full value of the PTC was for projects that
started construction in 2016; projects that start construction later will receive a phased-down credit.
1.9
4.3
8.7
12.5
17.6
9.6
17.7
10.6
14.3
12.210.7
12.7
15.5
19.6
0
5
10
15
20
25
2004 2005 2006 2007 2008 2009 2010 2011 2012 2013 2014 2015 2016 2017
$ bn (nominal)

68 © Bloomberg Finance LP 2018. Developed in partnership with The Business Council for Sustainable Energy.
Source: Bloomberg New Energy Finance Notes: Values based on Bloomberg New Energy Finance’s Global Wind Turbine Price Index. Values from the Index have been
converted from EUR to USD on contract execution date and are nominal.
1.60
1.52
1.94
1.74
1.50
1.53
1.34
1.36 1.33
1.27
1.25
1.22
1.21
1.32
1.20
1.20
1.11
1.15
1.060.99
1.03
0.0
0.2
0.4
0.6
0.8
1.0
1.2
1.4
1.6
1.8
2.0
2.2
1H 2H 1H 2H 1H 2H 1H 2H 1H 2H 1H 2H 1H 2H 1H 2H 1H 2H 1H 2H 1H 2H
2008 2009 2010 2011 2012 2013 2014 2015 2016 2017 2018
$m/MW
Previous Index (2H 2016) Current Index (2H 2017)
Economics: Global wind turbine price index by delivery date
● Turbine prices have fallen nearly 50% to $0.99 million/MW for turbines delivered in 2H 2017, down from $1.94 million/MW in 1H 2009. Global
oversupply continues to suppress prices.
● The price for U.S. wind turbines delivered in 2H 2017 dropped well below the global average price of $0.99 million per megawatt. Fierce price
competition between turbine manufacturers to maximize their share of the swell in 2016 orders drove the rapid U.S. pricing plunge. The 11GW
surge in 2016 turbine and equipment orders was a direct result of developers rushing to qualify as many projects as possible in time for this final
opportunity to gain 100 percent of U.S. wind’s main federal subsidy.
● In addition to dwindling turbine prices, taller turbines and improved capacity factors have also contributed to lower levelized costs for wind.

69 © Bloomberg Finance LP 2018. Developed in partnership with The Business Council for Sustainable Energy.
Source: Bloomberg New Energy Finance, SEC filings, interviews, analyst estimates Notes: MISO is the Midwest region; PJM is the Mid-Atlantic region; SPP is the Southwest
Power Pool which covers the central southern U.S.; NEPOOL is the New England region; ERCOT covers most of Texas. Wholesale power prices are based on market-traded
futures for calendar year 2018 for select nodes within the region.
Economics: U.S. wind PPA prices compared to wholesale power prices in selected markets
● Prices for wind power purchase agreements (PPAs) have fallen dramatically as levelized costs declined. According to interviews with project
developers, projects secured offtake agreements in the mid-teens in the middle U.S. in 2017. For comparison, data reported to the Federal
Energy Regulatory Commission indicate that offtake prices for contracts signed in 2011 averaged $47/MWh.
● The top regions for utility PPAs are high wind-speed regions with low development costs like SPP, MISO and ERCOT. Conversely, developing
projects in New England can be costly and time consuming, and average project capacity factors are among the lowest in the country.
● A significant number of wind projects commissioned in 2015 – representing 2.4GW of capacity – secured corporate PPAs. The popularity of
corporate PPAs continued in more recent years, with an additional 1.6GW contracted in 2016 and 2.3GW in 2017.
Solar Wind Solar Wind Solar Wind Solar Wind Solar Wind Solar Wind Solar Wind
ERCOT Southwest California Southeast PJM MISO New York
0
20
40
60
80
100
$/MWh (nominal)
Power price range
Solar PPA range
Wind PPA range

70 © Bloomberg Finance LP 2018. Developed in partnership with The Business Council for Sustainable Energy.
Source: Bloomberg New Energy Finance, ICAP, Evolution, Spectron Group Notes: “Class I” generally refers to the portion of REC markets that can be served by a variety of new renewables, including wind. In
contrast, solar REC (SREC) markets are not Class I, as these can only be met through solar. The “Class I” component is usually the bulk of most states’ renewable portfolio standards. Data in the charts above is the
sole property of ICAP United, Inc. Unauthorized disclosure, copying or distribution of the Information is strictly prohibited and the recipient of the information shall not redistribute the Information in a form to a third
party. The Information is not, and should not be construed as, an offer, bid or solicitation in relation to any financial instrument. ICAP cannot guarantee, and expressly disclaims any liability for, and makes no
representations or warranties, whether express or implied, as to the Information's currency, accuracy, timeliness, completeness or fitness for any particular purpose.
Economics: ‘Class I’ REC prices in selected U.S. state markets
● In areas with Renewable Portfolio Standards, Renewable Energy Credits (RECs) are given to eligible renewable generators for each MWh of electricity they
supply to the grid. Eligible plants can sell their RECs for additional revenue. When REC prices are high, renewable energy investment sees a higher rate of
return and new renewable build is encouraged. REC prices are driven by supply-demand considerations, among others.
● Renewable build in most major REC markets has surpassed RPS demand, thereby depressing REC prices.
● Massachusetts and Connecticut Class I RECs lost over a third of their value in 2017. New England’s Clean Energy Request for Proposals, which seeks to
procure additional Class I eligible renewables through long-term contracts, threatens to prolong the glut in regional REC markets.
● PJM Tier I Tri-Qualified REC prices fell over 70% in 2017. The drop reflects worsening market sentiment with respect to the extent of the oversupply. Cheap
wind build in western PJM has proliferated rapidly and has exerted downward pressure on REC prices.
● Texas’ massive wind fleet has greatly exceeded state renewable energy goals. Texas RECs trade at their transactional value ($.50/MWh), reflecting the low
likelihood of future REC shortages.
0
25
50
75
201
0
201
1
201
2
201
3
201
4
201
5
201
6
201
7
$/MWh (nominal)
MA Class I REC
CT Class I REC
PJM Tier 1 Tri-Qualified REC
TX Class I REC

71 © Bloomberg Finance LP 2018. Developed in partnership with The Business Council for Sustainable Energy.
Table of Contents
1. Introduction
2. A look across
the U.S. energy
sector
3. Natural gas
4. Large-scale
renewable
electricity and
CCS
2.1 Bird's eye
2.2. Policy, finance, economics
4.1 Solar (PV, solar thermal)
4.2 Wind
4.3 Biomass, biogas, waste-to-
energy
4.4 Geothermal
4.5 Hydropower
4.6 CCS
5. Distributed
power and
storage
5.1 Small-scale solar
5.2 Combined heat and power and
waste-heat-to-power
5.4 Energy storage
6. Demand-
side energy
efficiency
6.1 Energy efficiency
6.2 Demand response and digital
energy
7. Sustainable
transportation
7.1 Electric vehicles
7.2 Natural gas vehicles
7.3 Biofuels
5.3 Fuel cells (stationary)

72 © Bloomberg Finance LP 2018. Developed in partnership with The Business Council for Sustainable Energy.
Source: Bloomberg New Energy Finance, EIA, company announcements, EPA AgSTAR database Notes: Biomass includes black liquor. Biogas includes anaerobic digestion
(projects 1MW and above except wastewater treatment facilities). The graph on the right reflects anaerobic digesters on livestock farms in the U.S. and is sourced entirely from
the EPA AgSTAR database.
Annual build: large-scale bioenergy Annual build: U.S. farm-based anaerobic
digesters
Deployment: U.S. bioenergy and anaerobic digester build
● In 2017, the U.S. installed 122MW of biomass, 54MW of biogas, and no new waste-to-energy plants. Bioenergy build has tapered since 2013,
when the Production and Investment Tax Credits, as well as the 1603 Treasury program, encouraged nearly 800MW of new installations.
● Waste-to-energy technology has seen more growth in countries such as China, where the processing capacity rose 207% to 219,090t/day in
2015, from only 71,253t/day in 2009. China’s burgeoning economy has brought with it an explosion in the amount of solid waste, which has
prompted the government to invest in waste-to-energy facilities. The U.K., too, has provided more supportive policies for waste-to-energy,
encouraging five new facilities totaling 180MW of electrical generation capacity in 2015.
● The number of new farm-based anaerobic digesters coming online (shown in the graph to the right) has also slowed. 2017 saw the addition of
two projects, identical to 2016 levels. The total count of operational projects (i.e., total count accounting for retirements) has held fairly flat
since 2014 because a number of farm-based digesters have ceased operations.
143 250
75 170 187
555
111 98 122
132
136
149
166 221
187
107 40
90
54
16
5
28
85
0
100
200
300
400
500
600
700
800
2008 2009 2010 2011 2012 2013 2014 2015 2016 2017
MW
Waste-to-energy
Biogas
Biomass 35
2420
27
33
25
8 4 2 20
35
70
105
140
175
210
245
280
0
5
10
15
20
25
30
35
40
2008 2009 2010 2011 2012 2013 2014 2015 2016 2017
New projects added annually(count)
Total operational
projects (count)
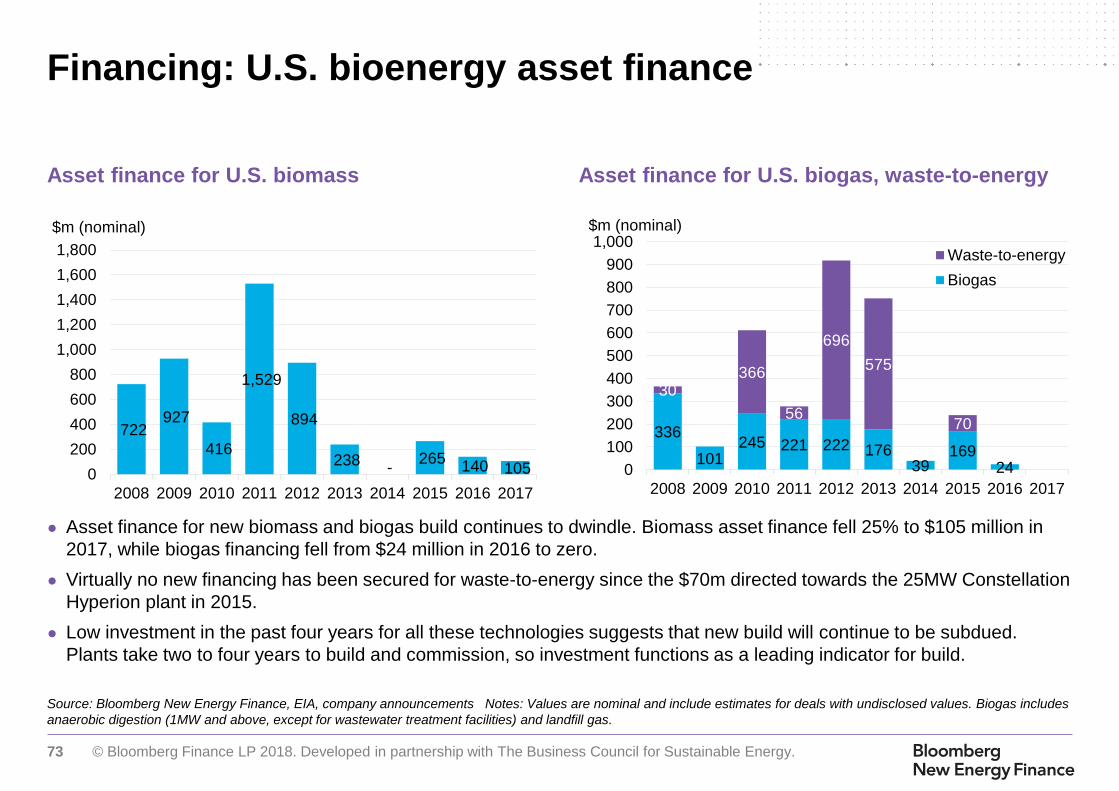
73 © Bloomberg Finance LP 2018. Developed in partnership with The Business Council for Sustainable Energy.
Source: Bloomberg New Energy Finance, EIA, company announcements Notes: Values are nominal and include estimates for deals with undisclosed values. Biogas includes
anaerobic digestion (1MW and above, except for wastewater treatment facilities) and landfill gas.
Asset finance for U.S. biomass Asset finance for U.S. biogas, waste-to-energy
Financing: U.S. bioenergy asset finance
● Asset finance for new biomass and biogas build continues to dwindle. Biomass asset finance fell 25% to $105 million in
2017, while biogas financing fell from $24 million in 2016 to zero.
● Virtually no new financing has been secured for waste-to-energy since the $70m directed towards the 25MW Constellation
Hyperion plant in 2015.
● Low investment in the past four years for all these technologies suggests that new build will continue to be subdued.
Plants take two to four years to build and commission, so investment functions as a leading indicator for build.
722 927
416
1,529
894
238 -265
140 105 0
200
400
600
800
1,000
1,200
1,400
1,600
1,800
2008 2009 2010 2011 2012 2013 2014 2015 2016 2017
$m (nominal)
336
101245 221 222 176
39169
24
30366
56
696
575
70
0
100
200
300
400
500
600
700
800
900
1,000
2008 2009 2010 2011 2012 2013 2014 2015 2016 2017
$m (nominal)
Waste-to-energy
Biogas
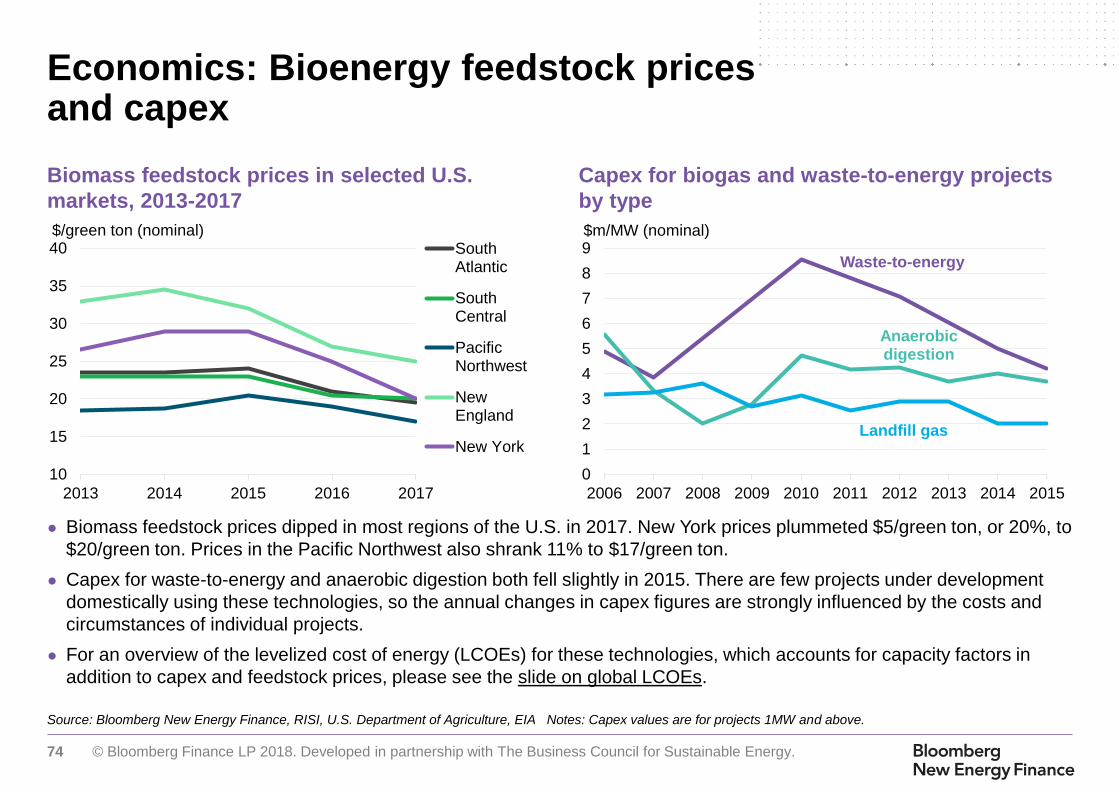
74 © Bloomberg Finance LP 2018. Developed in partnership with The Business Council for Sustainable Energy.
Source: Bloomberg New Energy Finance, RISI, U.S. Department of Agriculture, EIA Notes: Capex values are for projects 1MW and above.
Biomass feedstock prices in selected U.S.
markets, 2013-2017
Capex for biogas and waste-to-energy projects
by type
Economics: Bioenergy feedstock prices and capex
● Biomass feedstock prices dipped in most regions of the U.S. in 2017. New York prices plummeted $5/green ton, or 20%, to
$20/green ton. Prices in the Pacific Northwest also shrank 11% to $17/green ton.
● Capex for waste-to-energy and anaerobic digestion both fell slightly in 2015. There are few projects under development
domestically using these technologies, so the annual changes in capex figures are strongly influenced by the costs and
circumstances of individual projects.
● For an overview of the levelized cost of energy (LCOEs) for these technologies, which accounts for capacity factors in
addition to capex and feedstock prices, please see the slide on global LCOEs.
10
15
20
25
30
35
40
2013 2014 2015 2016 2017
$/green ton (nominal)SouthAtlantic
SouthCentral
PacificNorthwest
NewEngland
New York
Waste-to-energy
Anaerobic digestion
Landfill gas
0
1
2
3
4
5
6
7
8
9
2006 2007 2008 2009 2010 2011 2012 2013 2014 2015
$m/MW (nominal)

75 © Bloomberg Finance LP 2018. Developed in partnership with The Business Council for Sustainable Energy.
Table of Contents
1. Introduction
2. A look across
the U.S. energy
sector
3. Natural gas
4. Large-scale
renewable
electricity and
CCS
2.1 Bird's eye
2.2. Policy, finance, economics
4.1 Solar (PV, solar thermal)
4.2 Wind
4.3 Biomass, biogas, waste-to-
energy
4.4 Geothermal
4.5 Hydropower
4.6 CCS
5. Distributed
power and
storage
5.1 Small-scale solar
5.2 Combined heat and power and
waste-heat-to-power
5.4 Energy storage
6. Demand-
side energy
efficiency
6.1 Energy efficiency
6.2 Demand response and digital
energy
7. Sustainable
transportation
7.1 Electric vehicles
7.2 Natural gas vehicles
7.3 Biofuels
5.3 Fuel cells (stationary)
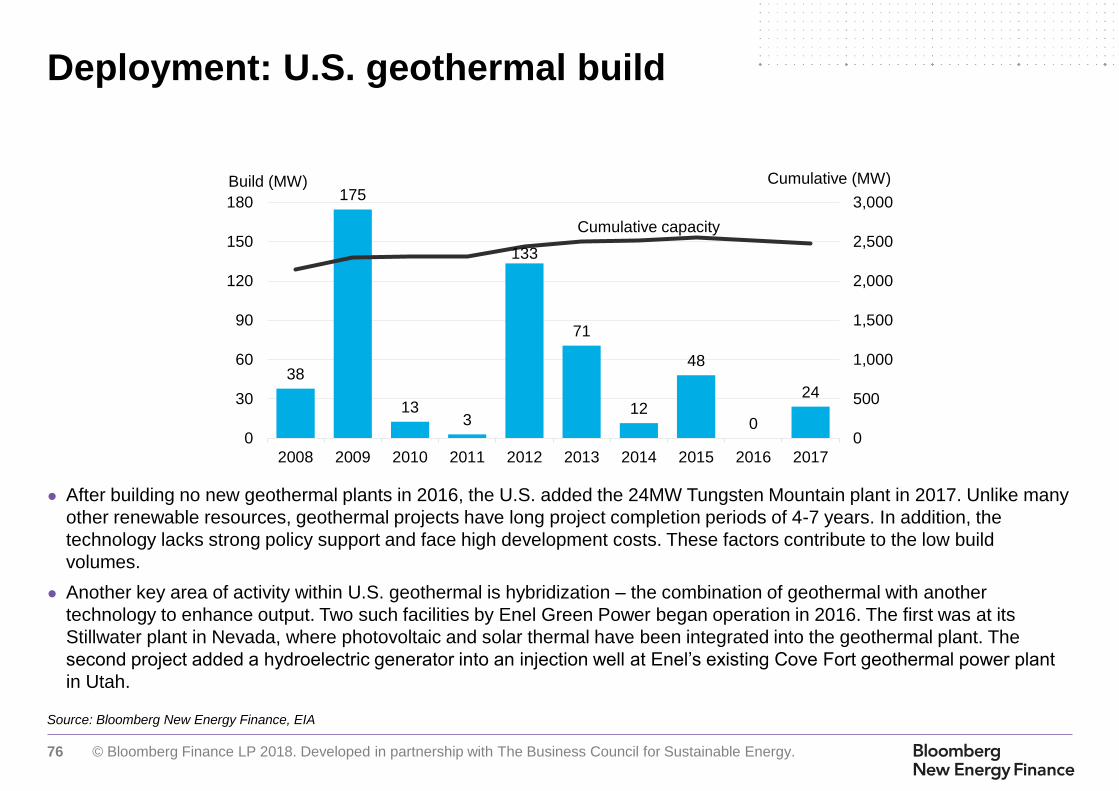
76 © Bloomberg Finance LP 2018. Developed in partnership with The Business Council for Sustainable Energy.
Source: Bloomberg New Energy Finance, EIA
Deployment: U.S. geothermal build
● After building no new geothermal plants in 2016, the U.S. added the 24MW Tungsten Mountain plant in 2017. Unlike many
other renewable resources, geothermal projects have long project completion periods of 4-7 years. In addition, the
technology lacks strong policy support and face high development costs. These factors contribute to the low build
volumes.
● Another key area of activity within U.S. geothermal is hybridization – the combination of geothermal with another
technology to enhance output. Two such facilities by Enel Green Power began operation in 2016. The first was at its
Stillwater plant in Nevada, where photovoltaic and solar thermal have been integrated into the geothermal plant. The
second project added a hydroelectric generator into an injection well at Enel’s existing Cove Fort geothermal power plant
in Utah.
38
175
133
133
71
12
48
0
24
0
500
1,000
1,500
2,000
2,500
3,000
0
30
60
90
120
150
180
2008 2009 2010 2011 2012 2013 2014 2015 2016 2017
Cumulative (MW)Build (MW)
Cumulative capacity

77 © Bloomberg Finance LP 2018. Developed in partnership with The Business Council for Sustainable Energy.
Table of Contents
1. Introduction
2. A look across
the U.S. energy
sector
3. Natural gas
4. Large-scale
renewable
electricity and
CCS
2.1 Bird's eye
2.2. Policy, finance, economics
4.1 Solar (PV, solar thermal)
4.2 Wind
4.3 Biomass, biogas, waste-to-
energy
4.4 Geothermal
4.5 Hydropower
4.6 CCS
5. Distributed
power and
storage
5.1 Small-scale solar
5.2 Combined heat and power and
waste-heat-to-power
5.4 Energy storage
6. Demand-
side energy
efficiency
6.1 Energy efficiency
6.2 Demand response and digital
energy
7. Sustainable
transportation
7.1 Electric vehicles
7.2 Natural gas vehicles
7.3 Biofuels
5.3 Fuel cells (stationary)

78 © Bloomberg Finance LP 2018. Developed in partnership with The Business Council for Sustainable Energy.
Source: Bloomberg New Energy Finance, EIA, FERC Notes: 2017 data are as of end-November 2017. The licensing figures exclude pumped storage licenses.
U.S. hydropower build and cumulative capacity U.S. new hydropower capacity licensed or
exempted by FERC
Deployment: U.S. hydropower build and licensed capacity
● Fewer megawatts of hydropower capacity were commissioned in 2017 than in the previous year. Out of the 208MW of new build, 122MW
came from the repair effort at the Wanapum dam in Washington. The remaining 85MW came from small hydro projects, the most sizable of
which was the 76MW Smithland Hydroelectric project southwest of Louisville, Kentucky. No new pumped hydro storage capacity has been
added in the U.S. since 2012.
● FERC issued licenses or exemptions for 265MW of hydropower in 2017, the highest amount in at least a decade.
● Hydro projects that began construction before the end of 2016 were able to claim eligibility for the Production Tax Credit (PTC), which was
worth $12/MWh for this technology in 2016 and is indexed to inflation. This is roughly half the value of the wind PTC. The Bipartisan Budget
Act passed in February 2018 extended the PTC qualification deadline for hydropower by one year retroactively, through December 31, 2017.
122
244343
122 122
227
12220 26 22
39
109
86
56 21
153
85
42
97
98
99
100
101
102
0
100
200
300
400
500
2008 2009 2010 2011 2012 2013 2014 2015 2016 2017
Build (MW)
Large hydro Small hydro
Hydro Pumped storage Cumulative capacity
Cumulative (GW)
0
127151
138162
32
205
71
218
265
0
50
100
150
200
250
300
2008 2009 2010 2011 2012 2013 2014 2015 2016 2017
Capacity (MW)
79 © Bloomberg Finance LP 2018. Developed in partnership with The Business Council for Sustainable Energy.
Table of Contents
1. Introduction
2. A look across
the U.S. energy
sector
3. Natural gas
4. Large-scale
renewable
electricity and
CCS
2.1 Bird's eye
2.2. Policy, finance, economics
4.1 Solar (PV, solar thermal)
4.2 Wind
4.3 Biomass, biogas, waste-to-
energy
4.4 Geothermal
4.5 Hydropower
4.6 CCS
5. Distributed
power and
storage
5.1 Small-scale solar
5.2 Combined heat and power and
waste-heat-to-power
5.4 Energy storage
6. Demand-
side energy
efficiency
6.1 Energy efficiency
6.2 Demand response and digital
energy
7. Sustainable
transportation
7.1 Electric vehicles
7.2 Natural gas vehicles
7.3 Biofuels
5.3 Fuel cells (stationary)

80 © Bloomberg Finance LP 2018. Developed in partnership with The Business Council for Sustainable Energy.
Source: Bloomberg New Energy Finance
Deployment: Cumulative installed CCS capture rate in the U.S.
● Industrial processes that cannot easily substitute renewable energy sources for fossil-fuel power generation are drawing
more attention from government funding programs and technology developers. The U.S. Department of Energy has said it
expects hubs of CCS infrastructure to develop in certain industrial areas, suggesting some momentum behind U.S. CCS
projects linked to chemicals production and other industries.
● In April 2017, the Illinois Industrial Carbon Capture and Storage project, capturing 1 million metric tons of CO2 a year for
geological storage, began operating. The project was funded with $141 million from the DOE and about $66 million from
private sources. The Petra Nova Carbon Capture plant in Texas, capturing 1.4 million metric tons of CO2 a year from a
240MW slipstream of flue gas, is the world’s largest CCS system retrofitted to a coal-fired power plant.
0
5
10
15
20
25
30
35
1985 1990 1995 2000 2005 2010 2015 2016 2017
Other
Cementproduction
Ethanolproduction
Fertilizerproduction
Oil refining
Power plant
Gas processing
Million metric tons CO2/year

81 © Bloomberg Finance LP 2018. Developed in partnership with The Business Council for Sustainable Energy.
Table of Contents
1. Introduction
2. A look across
the U.S. energy
sector
3. Natural gas
4. Large-scale
renewable
electricity and
CCS
2.1 Bird's eye
2.2. Policy, finance, economics
4.1 Solar (PV, solar thermal)
4.2 Wind
4.3 Biomass, biogas, waste-to-
energy
4.4 Geothermal
4.5 Hydropower
4.6 CCS
5. Distributed
power and
storage
5.1 Small-scale solar
5.2 Combined heat and power and
waste-heat-to-power
5.4 Energy storage
6. Demand-
side energy
efficiency
6.1 Energy efficiency
6.2 Demand response and digital
energy
7. Sustainable
transportation
7.1 Electric vehicles
7.2 Natural gas vehicles
7.3 Biofuels
5.3 Fuel cells (stationary)

82 © Bloomberg Finance LP 2018. Developed in partnership with The Business Council for Sustainable Energy.
Source: Bloomberg New Energy Finance, company filings Note: Q4 2017 data for individual vendors was not available at time of production.
Annual U.S. small-scale PV build Installations of top three residential PV vendors
Deployment: U.S. small-scale solar build by type
● In 2017, the U.S. residential solar market contracted for the first time in more than a decade as the industry undergoes a prolonged period of
restructuring. The three leading vendors have moderated their growth ambitions in search of near-term profitability. In combination, they
installed 25% less capacity in 3Q 2017 than the same period in 2016. Most notably, Tesla’s 3Q deployments fell to 109MW, 42% below the run-
rate achieved by SolarCity immediately before it was acquired, and its lowest levels in over three years. While Sunrun and the large number of
local installers are winning some of the share left by Tesla’s decline, their growth was insufficient to maintain national-level growth in 2017.
● The residential downturn has been led by California, and the SREC states of Massachusetts and Maryland. In addition, many of the states that
enacted net-metering reforms in 2016 have seen their residential solar markets contract as a result.
● Onsite commercial and institutional solar was the only U.S. solar segment to grow in 2017. The uptick was driven largely by California, which
lifted the 1MW system threshold in 2016. New York, Texas, Oregon and South Carolina were also stand-out performers in 2017, with each
market tripling in size.
0.6
1.11.3
2.0
2.32.1
0.9
1.2
0.90.8
1.1
1.5
0.0
0.5
1.0
1.5
2.0
2.5
2012 2013 2014 2015 2016 2017e
GW
Residential Commercial and industrial
82
10
7
13
7
17
7
15
3 18
9 25
6
27
2
21
4
20
1
18
7
20
1
15
0
17
6
10
9
3534
3737
42
5668
60 65 80 77
7376
903749
5046
66
61 59
55 61 59 47
4647
47
0
50
100
150
200
250
300
350
400
Q1 Q2 Q3 Q4 Q1 Q2 Q3 Q4 Q1 Q2 Q3 Q4 Q1 Q2 Q3 Q4
2014 2015 2016 2017
MW
SolarCity Tesla Sunrun Vivint

83 © Bloomberg Finance LP 2018. Developed in partnership with The Business Council for Sustainable Energy.
PA
ME
NY
VAWVUT
WA
WY
WI
IL
IA
KS MO
MNND
NE
AROK
TX
AZ
CA CO
ID
MT
NM
NV
OR
IN
MI
OH
FL
GA
KY
NC
SC
DC
LA
ALMS
SD
NJ
VT
NH
MA
RICT
DE
MD
Legend
Retail net metering
Sub-retail export tariff
Feed-in tariff
No payment/export banHI
AK
Source: Bloomberg New Energy Finance, DSIRE
Policy: Net metering regulation as of August 2017 by state
● As of August 2017, net metering at the full retail rate was available to most customers within 40 states and D.C. Net
metering has been discontinued in three states over the past year and reform proposals are being considered in a number
of other states.
● Arizona, Indiana and Maine formalized plans to transition away from retail-rate net energy metering in the past year,
joining Hawaii, Louisiana and Nevada. The replacement schemes vary: Arizona will compensate small-scale PV systems
at the five-year-average utility-scale PPA price, and only for 10 years; Indiana will only offer net metering to systems
connected before 2022; and Maine will phase down the value of a net metering credit by 10% each year starting in 2018.

84 © Bloomberg Finance LP 2018. Developed in partnership with The Business Council for Sustainable Energy.
Source: Bloomberg New Energy Finance Note: ‘Lease/PPA’ and ‘loan’ refer to the type of payments securitized.
Annual U.S. solar ABS issuance by type Annual U.S. solar ABS issuance by vendor
Financing: Issuance of solar asset-backed securities
● 2017 saw record issuance of U.S. solar asset-backed securities: $1.45bn through the end of November.
● The growing number of solar loan-backed securitizations – as opposed to lease/PPA-backed deals – is consistent with the
trend toward host ownership of PV systems among U.S. households, and the rising market share of “long tail” installers
(i.e., the fragmentation of the U.S. solar market).
● Bespoke finance products for regional and local installers (provided by Mosaic and Dividend, for example) promise to keep
the pressure on newer national third-party installers like Sunnova even as sales from “the big three” (SolarCity/Tesla,
Sunrun and Vivint) fall.
Lease/PPA Loan$54
$272 $235$321
$1,446
2013 2014 2015 2016 2017
$m (nominal)
SolarCity/Tesla SunrunSpruce
Mosaic
Sunnova
Dividend
$54
$272 $235$321
$1,446
2013 2014 2015 2016 2017
$m (nominal)

85 © Bloomberg Finance LP 2018. Developed in partnership with The Business Council for Sustainable Energy.
Table of Contents
1. Introduction
2. A look across
the U.S. energy
sector
3. Natural gas
4. Large-scale
renewable
electricity and
CCS
2.1 Bird's eye
2.2. Policy, finance, economics
4.1 Solar (PV, solar thermal)
4.2 Wind
4.3 Biomass, biogas, waste-to-
energy
4.4 Geothermal
4.5 Hydropower
4.6 CCS
5. Distributed
power and
storage
5.1 Small-scale solar
5.2 Combined heat and power and
waste-heat-to-power
5.4 Energy storage
6. Demand-
side energy
efficiency
6.1 Energy efficiency
6.2 Demand response and digital
energy
7. Sustainable
transportation
7.1 Electric vehicles
7.2 Natural gas vehicles
7.3 Biofuels
5.3 Fuel cells (stationary)

86 © Bloomberg Finance LP 2018. Developed in partnership with The Business Council for Sustainable Energy.
Source: Bloomberg New Energy Finance, DOE CHP Installation Database (maintained by ICF) Notes: EIA is the best available source for generation data, but is not
comprehensive for CHP. The generation figures here are thus underestimated. Specifically, EIA does not collect data for sites <1MW; EIA may not be aware of certain
installations and thus may not send these sites a survey for reporting; and EIA categorizes some CHP systems as “electric power” rather than “industrial CHP,” if these
systems sell power to the grid while providing steam to an adjacent facility. Values for 2017 are projected, accounting for seasonality, based on latest monthly values from EIA
(data available through November 2017).
U.S. CHP build and cumulative capacity U.S. CHP generation (EIA-tracked plants)
Deployment: U.S. CHP build and generation
● New CHP installations dropped in 2016 to 476MW, from 623MW in 2015. Since spiking in 2014 to 1.3GW, build has fallen each year as industrial
installments contracted.
● The total operational CHP capacity in the U.S. has remained relatively stable in recent years. In 2016, the operational capacity ticked back up to 82.6GW,
rebounding from the slight dip in 2015 to 81.1GW due to site retirements and industrial plant closures.
● The sharp jump in installations in 2014 also provided a lasting uptick in CHP generation. Further, in 2015 and 2016, low gas prices continued to encourage
greater CHP generation. According to EIA net generation data, CHP units produced an estimated 341TWh in 2017, or 8.5% of total U.S. generation. EIA
data may underestimate total CHP production as they do not capture some newer installations, which tend to be smaller and excluded from EIA estimates
(see notes below).
● In 2016, the U.S. added 76 large-scale CHP projects (500kW or greater) and 97 small- to medium-sized projects (1-500kW). This represents a growth in
installations over 2015 levels, when the U.S. added 73 large-scale facilities and 91 small- to medium-size projects .
155272 270 299 288 264 156
278 183
377414 397 414
582404
1097
277285
35
10 1699
122
14
5
688
567695 682
813
991
682
1258
623
476
76
77
78
79
80
81
82
83
0
200
400
600
800
1,000
1,200
1,400
2008 2009 2010 2011 2012 2013 2014 2015 2016
Build (MW)
Other Industrial Commercial Cumulative (GW)
Operational capacity (GW)
305 293 305 301 309 294
367 374 367341
0
50
100
150
200
250
300
350
400
200
8
200
9
2010
2011
201
2
201
3
201
4
201
5
201
6
201
7
TWh
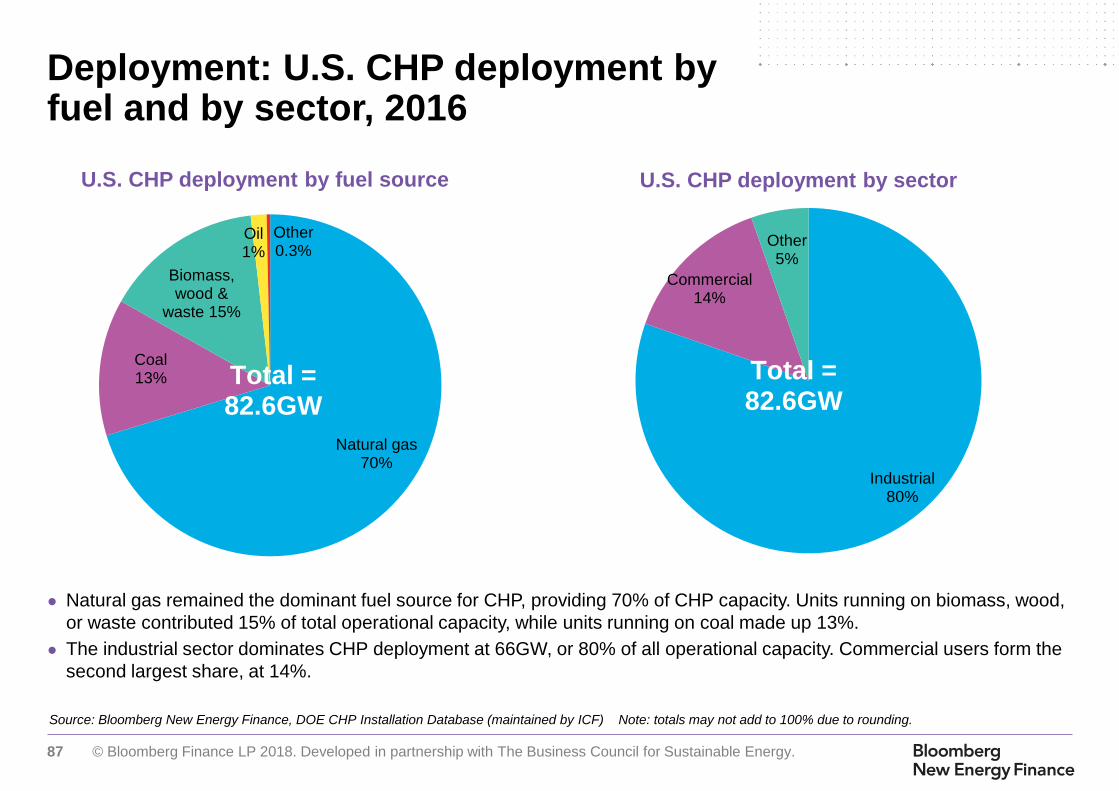
87 © Bloomberg Finance LP 2018. Developed in partnership with The Business Council for Sustainable Energy.
● Natural gas remained the dominant fuel source for CHP, providing 70% of CHP capacity. Units running on biomass, wood,
or waste contributed 15% of total operational capacity, while units running on coal made up 13%.
● The industrial sector dominates CHP deployment at 66GW, or 80% of all operational capacity. Commercial users form the
second largest share, at 14%.
Source: Bloomberg New Energy Finance, DOE CHP Installation Database (maintained by ICF) Note: totals may not add to 100% due to rounding.
U.S. CHP deployment by fuel source U.S. CHP deployment by sector
Deployment: U.S. CHP deployment by fuel and by sector, 2016
© Bloomberg Finance L.P. 2016. Developed in partnership with The Business Council for Sustainable Energy.
Natural gas70%
Coal13%
Biomass, wood &
waste 15%
Oil1%
Other0.3%
Total = 82.6GW
Industrial80%
Commercial14%
Other5%
Total = 82.6GW

88 © Bloomberg Finance LP 2018. Developed in partnership with The Business Council for Sustainable Energy.
● Overall asset financing for CHP has declined as build tapered over the past few years. Note that financing figures
assume a two-year lag between financing and deployment.
● Steam turbines, internal combustion turbines, and gas combustion turbines remain the more affordable CHP technologies
in terms of capital cost.
Source: Bloomberg New Energy Finance; EPA Combined Heat and Power
Partnership, Catalogue of CHP Technologies, prepared by ICF. Notes: ICF reports
that CHP capex has remained fairly constant since 2008. BNEF data reflect capex
for small CHP facilities powered by gas-fired reciprocating engines, gas turbines
and microturbines and are based on an internal survey among industry participants.
Source: Bloomberg New Energy Finance, DOE CHP Installation Database (maintained
by ICF) Notes: Values are estimated assuming a two-year lag between financing and
deployment, and assuming a weighted average capex of $1.5m/MW from 2010
onwards to reflect a recent trend toward smaller systems. Financing figures are only
available through 2014 since deployment figures are only available through 2016.
Asset finance for U.S. CHP Capital cost of CHP by technology
Financing and economics: U.S. CHP asset finance and capex
© Bloomberg Finance L.P. 2016. Developed in partnership with The Business Council for Sustainable Energy.
727
1122
963872
1486
1023
1887
934
715
0
200
400
600
800
1,000
1,200
1,400
1,600
1,800
2,000
2006 2007 2008 2009 2010 2011 2012 2013 2014
$m (nominal)
0
2
4
6
8
10
12
Fuel Cells Microturbines GasCombustion
Turbines
InternalCombustion
Engines
SteamTurbines
$/W

89 © Bloomberg Finance LP 2018. Developed in partnership with The Business Council for Sustainable Energy.
Table of Contents
1. Introduction
2. A look across
the U.S. energy
sector
3. Natural gas
4. Large-scale
renewable
electricity and
CCS
2.1 Bird's eye
2.2. Policy, finance, economics
4.1 Solar (PV, solar thermal)
4.2 Wind
4.3 Biomass, biogas, waste-to-
energy
4.4 Geothermal
4.5 Hydropower
4.6 CCS
5. Distributed
power and
storage
5.1 Small-scale solar
5.2 Combined heat and power and
waste-heat-to-power
5.4 Energy storage
6. Demand-
side energy
efficiency
6.1 Energy efficiency
6.2 Demand response and digital
energy
7. Sustainable
transportation
7.1 Electric vehicles
7.2 Natural gas vehicles
7.3 Biofuels
5.3 Fuel cells (stationary)

90 © Bloomberg Finance LP 2018. Developed in partnership with The Business Council for Sustainable Energy.
Source: E4Tech Fuel Cell Industry Review 2017, Fuel Cell and Hydrogen Energy Association, SGIP, Bloomberg New Energy Finance Notes: Fuel cells installed before 2003
are excluded due to the expected 10-year lifetime of these installations. *2017 data are preliminary.
Deployment: U.S. stationary fuel cell build
● Stationary fuel cell build hit its highest point on record, reaching an estimated 85MW of new installations in 2017. Build has rebounded since
reaching a low in 2014, surpassing 70MW every subsequent year. Key developments in 2017 included:
– Bloom Energy’s strategic alliance with PowerSecure generated 37MW of installations using its solid oxide fuel cell (SOFC) technology at
twelve Equinix data centers in California and New York state. These began installation in 2017 and will be completed in 2018.
– FuelCell Energy reduced its annual output from 50MW to 25MW to support cost control measures. Despite this, its carbonate fuel cell
technology has been sought for a sizeable 39.8MW project with Long Island Power Authority’s FIT IV Program at three sites. It also secured
a 7.4MW PPA with Connecticut Municipal Electric Energy Cooperative which will provide resiliency to the local U.S. Navy submarine base.
– Doosan Fuel Cell America signed a strategic alliance with Wells Fargo to finance new PPAs that Doosan Energy Solutions secure may with
new commercial, industrial and municipal customers.
● U.S. fuel cell activity is concentrated in six states: California, Connecticut, Delaware, New York, New Jersey and North Carolina. In 2017,
subsidies were cut in California and New Jersey. Fuel cell companies have moved towards PPA models that shield end-customers from the
high upfront cost of these systems, finding some success in 2017.
6.8 3.4 2.4 5.5 2.2 5.0 4.3 3.6
13.6
28.3
82.8
51.6
24.5
75.0 70.0
85.0
0
100
200
300
400
500
0
20
40
60
80
100
Pre-2003
2003 2004 2005 2006 2007 2008 2009 2010 2011 2012 2013 2014 2015 2016 2017e
Annual build (MW) Cumulative build (MW)
91 © Bloomberg Finance LP 2018. Developed in partnership with The Business Council for Sustainable Energy.
Table of Contents
1. Introduction
2. A look across
the U.S. energy
sector
3. Natural gas
4. Large-scale
renewable
electricity and
CCS
2.1 Bird's eye
2.2. Policy, finance, economics
4.1 Solar (PV, solar thermal)
4.2 Wind
4.3 Biomass, biogas, waste-to-
energy
4.4 Geothermal
4.5 Hydropower
4.6 CCS
5. Distributed
power and
storage
5.1 Small-scale solar
5.2 Combined heat and power and
waste-heat-to-power
5.4 Energy storage
6. Demand-
side energy
efficiency
6.1 Energy efficiency
6.2 Demand response and digital
energy
7. Sustainable
transportation
7.1 Electric vehicles
7.2 Natural gas vehicles
7.3 Biofuels
5.3 Fuel cells (stationary)
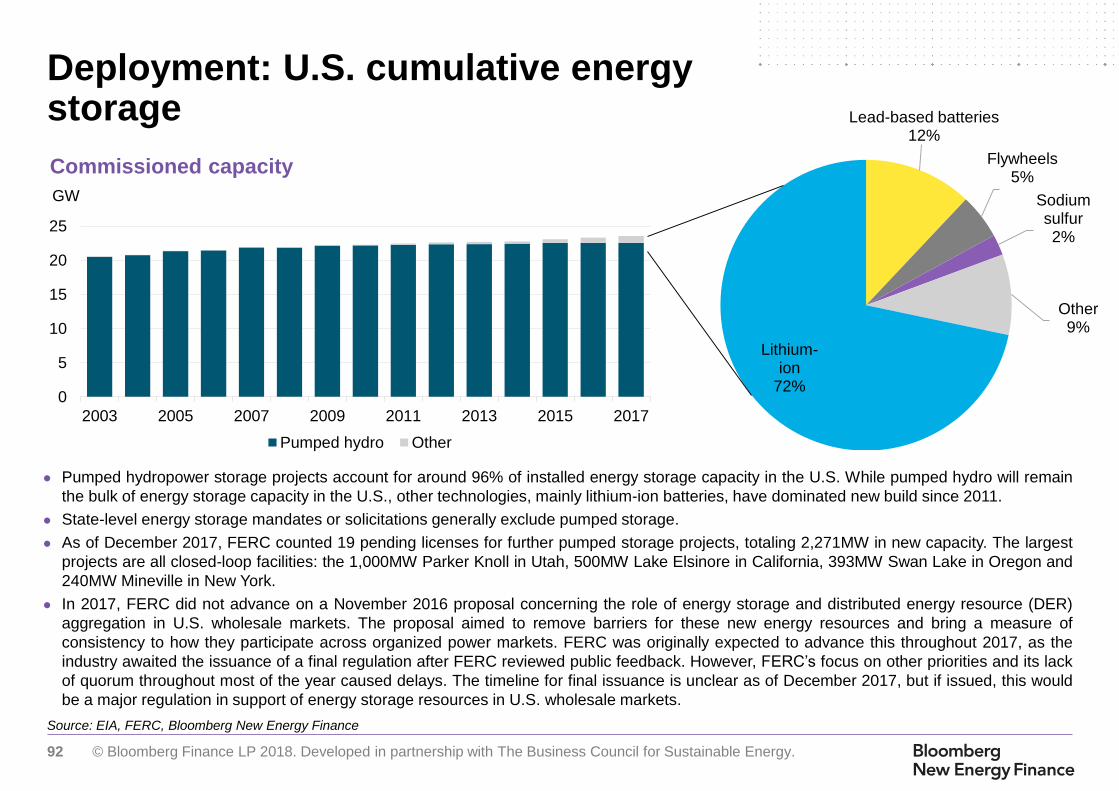
92 © Bloomberg Finance LP 2018. Developed in partnership with The Business Council for Sustainable Energy.
Lead-based batteries12%
Flywheels5%
Sodium sulfur2%
Other9%
Lithium-ion
72%0
5
10
15
20
25
2003 2005 2007 2009 2011 2013 2015 2017
GW
Pumped hydro Other
Source: EIA, FERC, Bloomberg New Energy Finance
Deployment: U.S. cumulative energy storage
● Pumped hydropower storage projects account for around 96% of installed energy storage capacity in the U.S. While pumped hydro will remain
the bulk of energy storage capacity in the U.S., other technologies, mainly lithium-ion batteries, have dominated new build since 2011.
● State-level energy storage mandates or solicitations generally exclude pumped storage.
● As of December 2017, FERC counted 19 pending licenses for further pumped storage projects, totaling 2,271MW in new capacity. The largest
projects are all closed-loop facilities: the 1,000MW Parker Knoll in Utah, 500MW Lake Elsinore in California, 393MW Swan Lake in Oregon and
240MW Mineville in New York.
● In 2017, FERC did not advance on a November 2016 proposal concerning the role of energy storage and distributed energy resource (DER)
aggregation in U.S. wholesale markets. The proposal aimed to remove barriers for these new energy resources and bring a measure of
consistency to how they participate across organized power markets. FERC was originally expected to advance this throughout 2017, as the
industry awaited the issuance of a final regulation after FERC reviewed public feedback. However, FERC’s focus on other priorities and its lack
of quorum throughout most of the year caused delays. The timeline for final issuance is unclear as of December 2017, but if issued, this would
be a major regulation in support of energy storage resources in U.S. wholesale markets.
Commissioned capacity

93 © Bloomberg Finance LP 2018. Developed in partnership with The Business Council for Sustainable Energy.
Source: Bloomberg New Energy Finance Note: Includes projects that are larger than 500kW/500kWh, have announced a specific location, and has been confirmed by the
relevant company through public data. *These targets were proposed in January 2018
Deployment: U.S. announced and commissioned energy storage projects
< 5MW
5-55MW
> 55MW
No storage
NY: 1.5GW
storage target
announced*CA: 1.325GW
storage target
by 2020,with
an additional
500MW led by
utilities
PJM: 280MW+
operational for
frequency regulation
OR: 39MW
proposed by
PGE
FL: Duke Energy
Florida and FPL
each propose
50MW pilots
TX: NextEra, NRG,
and E.On brought
online 51.8MW of
projects in ERCOT
AZ: AZ Commissioner
Andy Tobin proposes
3GW target*
CO: Xcel receives $21-
36/MWh solar + storage
and wind + storage bidsNV: Energy
storage
target
consideration
signed into
law
MD: Approved
30% tax credit for
residential and
commercial
storage projects
MA: 200MWh
aspirational energy
storage target
established
HI: KIUC signs
$110/MWh solar +
storage PPA with
AES
2.0 AL
38.0 AK
89.6 AZ -
AR
1,455 CA
9.3 CO
2.1 CT
- DC
9.0 DE
63.0 FL
1.0 GA
103.0 HI
0.1 ID
177.7 IL
36.4 IN
-IA
0.1 KS
2.0 KY
0.5 LA
1.3 ME
15.9 MD
110.6 MA2.7 MI
23.4 MN
-MS
5.2 MO
0.1 MT
-NE
50.0 NV
0.6 NH
17.2 NJ
6.5 NM
117.6 NY
31.6 NC
-ND
75.4 OH
0.8 OK
10.7 OR
146.3 PA
- RI
8.0 SC
-SD
0.1 TN
161.9 TX
6.2 UT
5.4 VT
4.1 VA
20.2 WA
66.5 WV
-WI-
WY
2,877 US
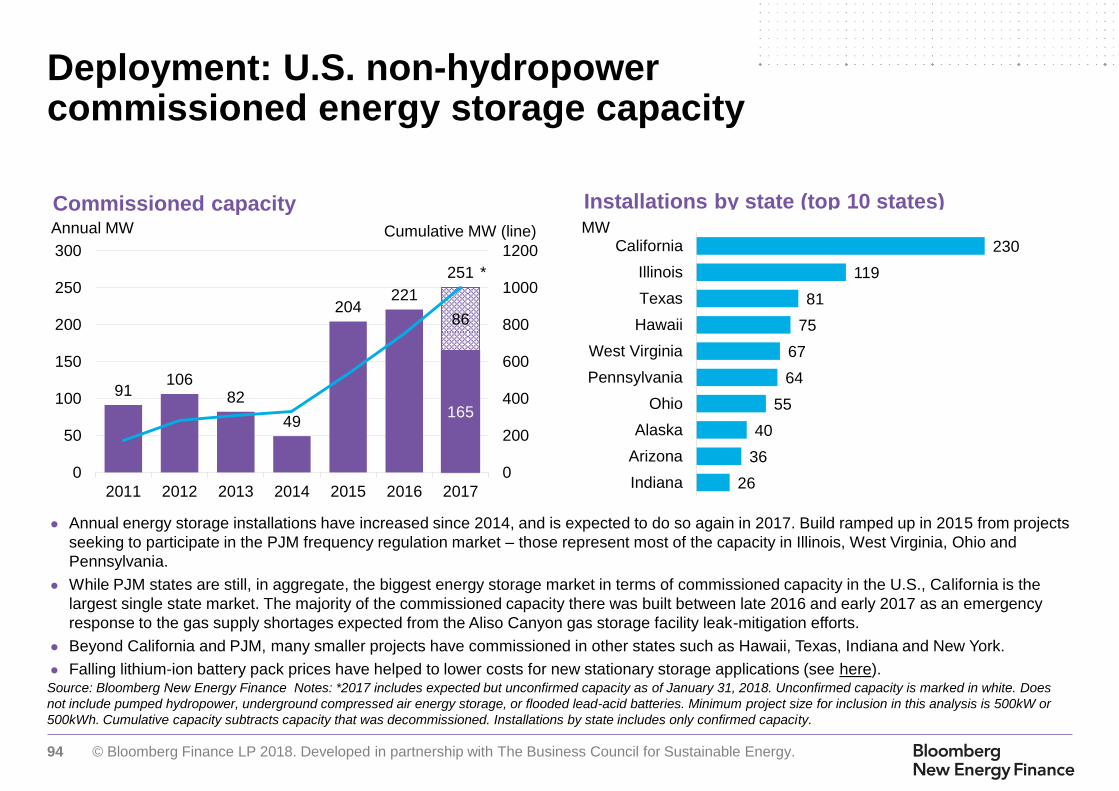
94 © Bloomberg Finance LP 2018. Developed in partnership with The Business Council for Sustainable Energy.
165
86
91106
82
49
204221
251
0
200
400
600
800
1000
1200
0
50
100
150
200
250
300
2011 2012 2013 2014 2015 2016 2017
Annual MW Cumulative MW (line)
Source: Bloomberg New Energy Finance Notes: *2017 includes expected but unconfirmed capacity as of January 31, 2018. Unconfirmed capacity is marked in white. Does
not include pumped hydropower, underground compressed air energy storage, or flooded lead-acid batteries. Minimum project size for inclusion in this analysis is 500kW or
500kWh. Cumulative capacity subtracts capacity that was decommissioned. Installations by state includes only confirmed capacity.
Commissioned capacity Installations by state (top 10 states)
Deployment: U.S. non-hydropower commissioned energy storage capacity
● Annual energy storage installations have increased since 2014, and is expected to do so again in 2017. Build ramped up in 2015 from projects
seeking to participate in the PJM frequency regulation market – those represent most of the capacity in Illinois, West Virginia, Ohio and
Pennsylvania.
● While PJM states are still, in aggregate, the biggest energy storage market in terms of commissioned capacity in the U.S., California is the
largest single state market. The majority of the commissioned capacity there was built between late 2016 and early 2017 as an emergency
response to the gas supply shortages expected from the Aliso Canyon gas storage facility leak-mitigation efforts.
● Beyond California and PJM, many smaller projects have commissioned in other states such as Hawaii, Texas, Indiana and New York.
● Falling lithium-ion battery pack prices have helped to lower costs for new stationary storage applications (see here).
*
230
119
81
75
67
64
55
40
36
26
California
Illinois
Texas
Hawaii
West Virginia
Pennsylvania
Ohio
Alaska
Arizona
Indiana
MW
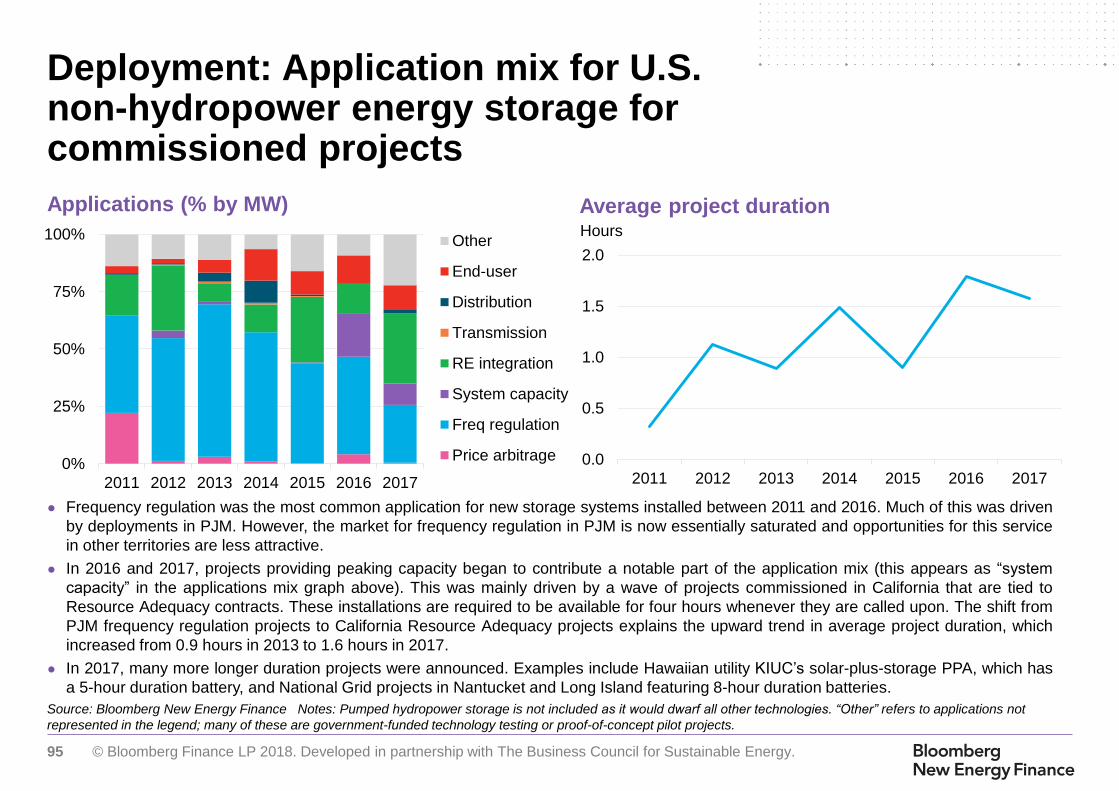
95 © Bloomberg Finance LP 2018. Developed in partnership with The Business Council for Sustainable Energy.
Source: Bloomberg New Energy Finance Notes: Pumped hydropower storage is not included as it would dwarf all other technologies. “Other” refers to applications not
represented in the legend; many of these are government-funded technology testing or proof-of-concept pilot projects.
Applications (% by MW) Average project duration
Deployment: Application mix for U.S. non-hydropower energy storage for commissioned projects
● Frequency regulation was the most common application for new storage systems installed between 2011 and 2016. Much of this was driven
by deployments in PJM. However, the market for frequency regulation in PJM is now essentially saturated and opportunities for this service
in other territories are less attractive.
● In 2016 and 2017, projects providing peaking capacity began to contribute a notable part of the application mix (this appears as “system
capacity” in the applications mix graph above). This was mainly driven by a wave of projects commissioned in California that are tied to
Resource Adequacy contracts. These installations are required to be available for four hours whenever they are called upon. The shift from
PJM frequency regulation projects to California Resource Adequacy projects explains the upward trend in average project duration, which
increased from 0.9 hours in 2013 to 1.6 hours in 2017.
● In 2017, many more longer duration projects were announced. Examples include Hawaiian utility KIUC’s solar-plus-storage PPA, which has
a 5-hour duration battery, and National Grid projects in Nantucket and Long Island featuring 8-hour duration batteries.
0%
25%
50%
75%
100%
2011 2012 2013 2014 2015 2016 2017
Other
End-user
Distribution
Transmission
RE integration
System capacity
Freq regulation
Price arbitrage 0.0
0.5
1.0
1.5
2.0
2011 2012 2013 2014 2015 2016 2017
Hours

96 © Bloomberg Finance LP 2018. Developed in partnership with The Business Council for Sustainable Energy.
Source: Bloomberg New Energy Finance Notes: Pumped hydropower storage is not included as it would dwarf all other technologies. “Other” refers to applications not
represented in the legend; many of these are government-funded technology testing or pilot projects to prove concepts. Top 10 based on commissioned capacity.
Technology mix Top 10 storage technology providers
Deployment: Technology mix for U.S. non-hydropower energy storage for commissioned projects
The lithium-ion battery has been the technology of choice for developers of projects of all sizes, because:
● It is widely available and mass produced all over the world;
● It can provide high power for short-duration applications (e.g. frequency regulation) and up to four hours of energy capacity for longer-duration
applications (e.g. investment deferral, arbitrage);
● It has a long track record of reliability and high performance;
● Projects using batteries produced by larger lithium-ion manufacturers such as Samsung SDI and LG Chem are more bankable due to the
perceived risk of emerging companies. In 2014, two prominent pure-play companies (Xtreme Power, A123 System) filed for Chapter 11; and
● It is cheaper than other technologies on a turnkey basis, and its price is falling at a faster rate than other technologies. Cost reductions and scale
are achievable because of the use of lithium-ion batteries in the transportation market, which is off-limits to most other technologies.
% by MW
0%
25%
50%
75%
100%
2011 2012 2013 2014 2015 2016 2017
Other
Supercapacitors
Zinc-based batteries
CAES
Flow batteries
Sodium sulphur
Lead-based batteries
Flywheels
Lithium-ion
219
134
130
72
56
41
37
25
24
23
Samsung SDI
BYD
A123
LG Chem
Tesla
Beacon Power
Younicos
Saft
NGK
Toshiba
MW

97 © Bloomberg Finance LP 2018. Developed in partnership with The Business Council for Sustainable Energy.
Source: Bloomberg New Energy Finance
By system integrator By owner
Deployment: U.S. energy storage commissioned projects, by integrator and owner
● System integrators are specialized companies that bring together the different components of an energy storage project – batteries, power
conversion systems, the software that manages the whole system and other hardware components – and support its installation onto the final
project site. While there is significant overlap between the top ten system integrators and owners, not all companies do both.
● AES Energy Storage has been the leading system integrator as well as project owner in the U.S.
● In the past two years, there has been consolidation among system integrators. Notable acquisitions included Wartsila’s buyout of Greensmith
and Aggreko’s purchase of Younicos in 2017 alone. Meanwhile, AES Corp. and Siemens AG announced on July 11, 2017 that they are forming
Fluence, a new energy-storage technology and services company. The deal gives AES access to Siemens’s sales channel and after-sales
services capability, cementing the company’s transition from developer to services provider.
● Some utilities such as Indianapolis Power and Light (owned by AES), SDG&E (owned by Sempra), SCE and Imperial Irrigation District (IID)
own projects that provide grid support to their distribution networks.
130
86
82
76
73
66
53
53
41
38
AES
Younicos
RES
Greensmith
NEC
BYD
GE
Tesla
Beacon Power
S&C
MW
142
99
71
70
56
41
36
32
30
20
AES
NextEra
Sempra
Invenergy
SCE
Beacon Power
Duke Energy
RES
IID
AltaGas
MW

98 © Bloomberg Finance LP 2018. Developed in partnership with The Business Council for Sustainable Energy.
Source: Bloomberg New Energy Finance Note: Values include estimates for undisclosed deals.
Financing: Venture capital/private equity investment in U.S. energy storage companies
● There has been over $4 billion of venture capital and private equity investment in U.S. energy storage companies since 2006. Of this, $197
million came in 2017, according to latest available data. The top disclosed investments for stationary storage in 2017 were:
– $34 million for Advanced Microgrid Solutions, a California-based distributed storage turnkey solution provider which received a investment
that was led by Southern Company, Energy Impact Partners and DBL Partners;
– $32 million for Primus Power, a zinc-based flow battery technology company with investors from a consortium of five companies led by
Anglo American Platinum;
– $6 million for Gridtential Energy, a lead-battery technology company which received investment from 24 participants, including lead battery
companies East Penn Manufacturing and Crown Battery;
– $2.65 million for FlexGen Power Systems, an energy storage system integrator and power conversion company with undisclosed investors.
– Total VCPE investment in the sector has shrunk each year since 2014. More confidence and consolidation of some key players have
increased the number of acquisitions and third-party investment into projects, while decreasing the overall investment into earlier-stage
energy storage companies.
218
460
256 238
348
560
192147
682
376319
197
0
100
200
300
400
500
600
700
800
2006 2007 2008 2009 2010 2011 2012 2013 2014 2015 2016 2017
$m (nominal)
PE
VC

99 © Bloomberg Finance LP 2018. Developed in partnership with The Business Council for Sustainable Energy.
Table of Contents
1. Introduction
2. A look across
the U.S. energy
sector
3. Natural gas
4. Large-scale
renewable
electricity and
CCS
2.1 Bird's eye
2.2. Policy, finance, economics
4.1 Solar (PV, solar thermal)
4.2 Wind
4.3 Biomass, biogas, waste-to-
energy
4.4 Geothermal
4.5 Hydropower
4.6 CCS
5. Distributed
power and
storage
5.1 Small-scale solar
5.2 Combined heat and power and
waste-heat-to-power
5.4 Energy storage
6. Demand-
side energy
efficiency
6.1 Energy efficiency
6.2 Demand response and digital
energy
7. Sustainable
transportation
7.1 Electric vehicles
7.2 Natural gas vehicles
7.3 Biofuels
5.3 Fuel cells (stationary)

100 © Bloomberg Finance LP 2018. Developed in partnership with The Business Council for Sustainable Energy.
0
5
10
15
20
25
30
35
40
'90 '95 '00 '05 '10 '15
Number of states
Decouplingonly
EERS only
EERS &decoupling
Source: ACEEE, Bloomberg New Energy Finance Notes: Decoupling includes all lost revenue adjustment mechanisms, but no longer includes pending policies as per a
methodology change in ACEEE reporting.
Electricity Natural gas
Policy: U.S. states with EERS and decoupling legislation for electricity and natural gas
● Energy efficiency resource standards (EERS) are state-level policies that require utilities to invest in measures that improve end-user efficiency
in order to meet energy-savings goals set by the government. Decoupling is a regulatory framework in which utilities’ revenues are based on
the reliable provision of energy, but not on the volume sold. Decoupling removes the disincentive for utilities to invest in efficiency. Utilities are
most likely to invest in energy efficiency in states with both EERS and revenue decoupling.
● The uptake of decoupling and EERS among states grew substantially from 2006 to 2010, accompanied by a dramatic increase in utility
spending on end-user efficiency from $1.9bn to $4.7bn during that period (see here). Although the number of states adopting legislation has
slowed, spending has continued to rise as EERS targets have become more stringent. In 2016, utility spending on efficiency reached $7.6bn.
0
5
10
15
20
25
30
35
40
'90 '95 '00 '05 '10 '15
Number of states
Decouplingonly
EERS only
EERS &decoupling

101 © Bloomberg Finance LP 2018. Developed in partnership with The Business Council for Sustainable Energy.
MA CT ME
NHRI
VT
PA
NY
NJMD
DCDE
OH
IL
IN
MI
WI
FL
GA
NC
VATNKYAL
LA
SCMS
AR
WV
TX
AZ
OK
NM
CA
WA
OR
NV CO
UTID
WY
MT
MO
MN IA
KS
NE
ND
SD
Plains(8%) Mid-Atlantic
(12%)
Great Lakes(15%)
Southeast(32%)
Southwest(15%)
Pacific(11%)
KY
Source: ACEEE, EIA, Bloomberg New Energy Finance Notes: The shading for individual states indicates savings from utility electrical efficiency programs as a fraction of
retail sales. State codes highlighted in red indicate EERS requirements for electric utilities. Hawaii and Alaska are not depicted.
Policy: Share of total electricity consumption by U.S. state and region, and electrical efficiency savings by state, 2016
0.0%
0.5%
1.0%
1.5%
2.0%
2.5%
3.0%
State-wide utility
electrical efficiency
savings as % of retail
sales (2016)
● The presence of EERS legislation (red highlights) and electricity savings (blue shading) are correlated and follow regional trends.
● The Southeast is notable for having both low EERS uptake and limited utility electricity savings.
● In the Rocky Mountain and Plains regions, uptake of EERS is mixed. In the rest of the U.S., uptake is near universal and electricity savings are
accordingly higher.
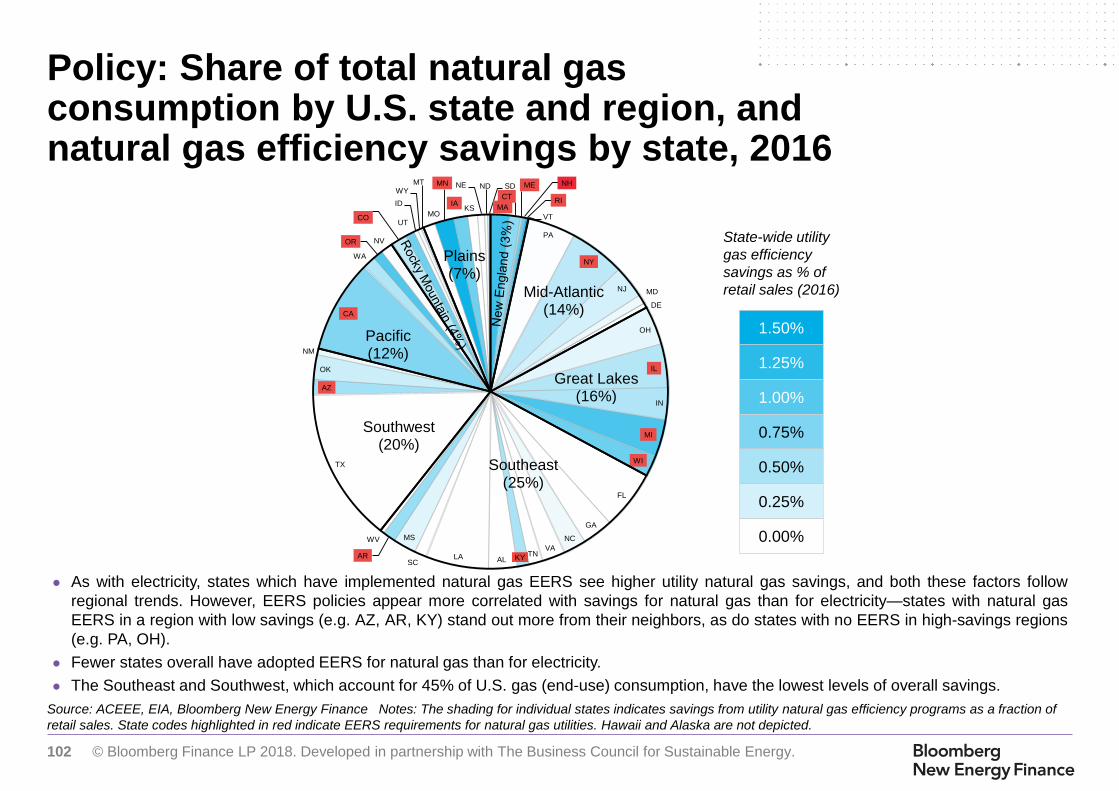
102 © Bloomberg Finance LP 2018. Developed in partnership with The Business Council for Sustainable Energy.
0.00%
0.25%
0.50%
0.75%
1.00%
1.25%
1.50%
State-wide utility
gas efficiency
savings as % of
retail sales (2016)
Source: ACEEE, EIA, Bloomberg New Energy Finance Notes: The shading for individual states indicates savings from utility natural gas efficiency programs as a fraction of
retail sales. State codes highlighted in red indicate EERS requirements for natural gas utilities. Hawaii and Alaska are not depicted.
Policy: Share of total natural gas consumption by U.S. state and region, and natural gas efficiency savings by state, 2016
MA
CT
ME NH
RI
VT
PA
NY
NJ MD
DE
OH
IL
IN
MI
WI
FL
GA
NC
VATN
KY
ALLASC
MS
AR
WV
TX
AZ
OK
NM
CA
WA
OR NV
COUT
ID
WYMT
MO
MN
IAKS
NE ND SD
Plains(7%)
Mid-Atlantic(14%)
Great Lakes(16%)
Southeast(25%)
Southwest(20%)
Pacific(12%)
KY
● As with electricity, states which have implemented natural gas EERS see higher utility natural gas savings, and both these factors follow
regional trends. However, EERS policies appear more correlated with savings for natural gas than for electricity—states with natural gas
EERS in a region with low savings (e.g. AZ, AR, KY) stand out more from their neighbors, as do states with no EERS in high-savings regions
(e.g. PA, OH).
● Fewer states overall have adopted EERS for natural gas than for electricity.
● The Southeast and Southwest, which account for 45% of U.S. gas (end-use) consumption, have the lowest levels of overall savings.

103 © Bloomberg Finance LP 2018. Developed in partnership with The Business Council for Sustainable Energy.
Source: ACEEE, EIA, Bloomberg New Energy Finance Note: Numbers in parentheses at the bottom of the chart indicate 2016 ranking. Numbers in parenthesis at the top
denote the change in score from 2016 levels.
● Massachusetts was the highest-
ranked state in 2017. Through
utility programs, it achieved
record-high electricity savings
equal to 3% of sales.
● Second-placed California scored
maximum points across a
number of categories, including
building energy codes, state
government initiatives and
appliance standards, reflecting a
number of major policy
initiatives.
● Idaho was a notable climber in
the middle-rankings, moving
from 33rd to 26th year-on-year
due to increased utility spending
on efficiency, updates to building
codes and an uptick in electric
vehicle registrations.
● Iowa fell the furthest, due to a
temporary suspension of its loan
and grant programs while the
Iowa Energy Center moves from
Iowa State University to the
Iowa Economic Development
Authority.
Policy: ACEEE state-by-state scorecard for energy efficiency policies, 2017
20
10
8
4
6
2
50
44.5
(-0
.5)
42 (
-3)
41.5
(+
2)
39 (
-1)
36.5
(+
1.5
)
35.5
(+
0)
34.5
(-1
)
34.5
(+
0)
33 (
+2)
31 (
-1)
27 (
+0.5
)
27 (
+0)
25.5
(+
1.5
)
25.5
(-1
.5)
23 (
-1.5
)
23 (
-1)
22 (
+1)
22 (
+2)
20.5
(-3
.5)
20.5
(+
0)
20 (
+0.5
)
18.5
(+
2.5
)
17.5
(+
0)
17 (
-2)
17 (
-2)
16.5
(+
3.5
)
16.5
(+
1)
16 (
+1.5
)
15.5
(-0
.5)
15.5
(+
2.5
)
14.5
(-1
)
14.5
(+
0)
14.5
(-0
.5)
14 (
+2)
13.5
(+
1)
13 (
+1)
12.5
(-1
)
12 (
-0.5
)
11 (
+1)
10 (
+0.5
)
10 (
+2)
9.5
(-1
)
9 (
-2)
8.5
(+
2)
8.5
(-1
)
7.5
(+
0.5
)
6.5
(-1
.5)
6 (
+0)
5 (
+0)
5 (
+0.5
)
3.5
(+
0.5
)
Ma
xim
um
1. M
A (
2)
2. C
A (
1)
3. R
I (4
)
4. V
T (
3)
5. O
R (
7)
6. C
T (
5)
7. N
Y (
5)
7. W
A (
8)
9. M
N (
10)
10. M
D (
9)
11. IL
(13)
11. M
I (1
1)
13. D
C (
15)
13. M
E (
11)
15. C
O (
14)
15. H
I (1
5)
17. A
Z (
18)
17. U
T (
20)
19. IA
(15)
19. P
A (
19)
21. N
H (
21)
22. F
L (
25)
23. N
J (
24)
24. D
E (
22)
24. W
I (2
2)
26. ID
(33)
26. T
X (
27)
28. K
Y (
30)
29. T
N (
25)
29. V
A (
33)
31. A
R (
27)
31. N
C (
30)
31. O
H (
29)
34. N
V (
37)
35. N
M (
35)
36. M
T (
37)
37. M
O (
32)
38. G
A (
35
)
39. A
K (
41)
40. IN
(42)
40. O
K (
44
)
42. S
C (
40)
43. A
L (
39)
44. LA
(47)
44. N
E (
42)
46. M
S (
46)
47. W
V (
44
)
48. K
S (
48)
49. S
D (
49)
49. W
Y (
50
)
51. N
D (
51)
Transportation Policies
Building energy codes
Combined Heat & Power
State Government
Initiatives
ApplianceStandards
Score
Utility & Public Benefits
Programs & Policies

104 © Bloomberg Finance LP 2018. Developed in partnership with The Business Council for Sustainable Energy.
Source: U.S. Department of Energy, U.S. Census Bureau, BNEF
● The majority of states have adopted some
version of the International Energy
Conservation Code (IECC) for both
residential and commercial buildings.
● Over time, standards are amended and
become more stringent. Thus states that
have adopted the most recent (2015)
standard have stronger incentives in place
for building efficiency.
● As with other legislation, there are strong
regional trends. States on the West Coast
tend to have either 2015 or 2012
standards in place, whereas on the East
Coast 2012 and 2009 are more common.
● The four most populous states (California,
Texas, Florida and New York) all have
2015 standards in place for both
residential and commercial buildings.
● Even for states that are labeled as having
“no state energy code,” many of the larger
jurisdictions within these states have
adopted a recent version of the IECC.
Policy: State adoption of International Energy Conservation Code in buildings
Residential buildings
Commercial buildings
As a percentage of
U.S. population
As a percentage of
U.S. population
2015
IECC
Earlier
IECCNo state
energy code
201546%
201224%
200921%
20061% NSEC
8%
201546%
201217%
200929%
NSEC8%
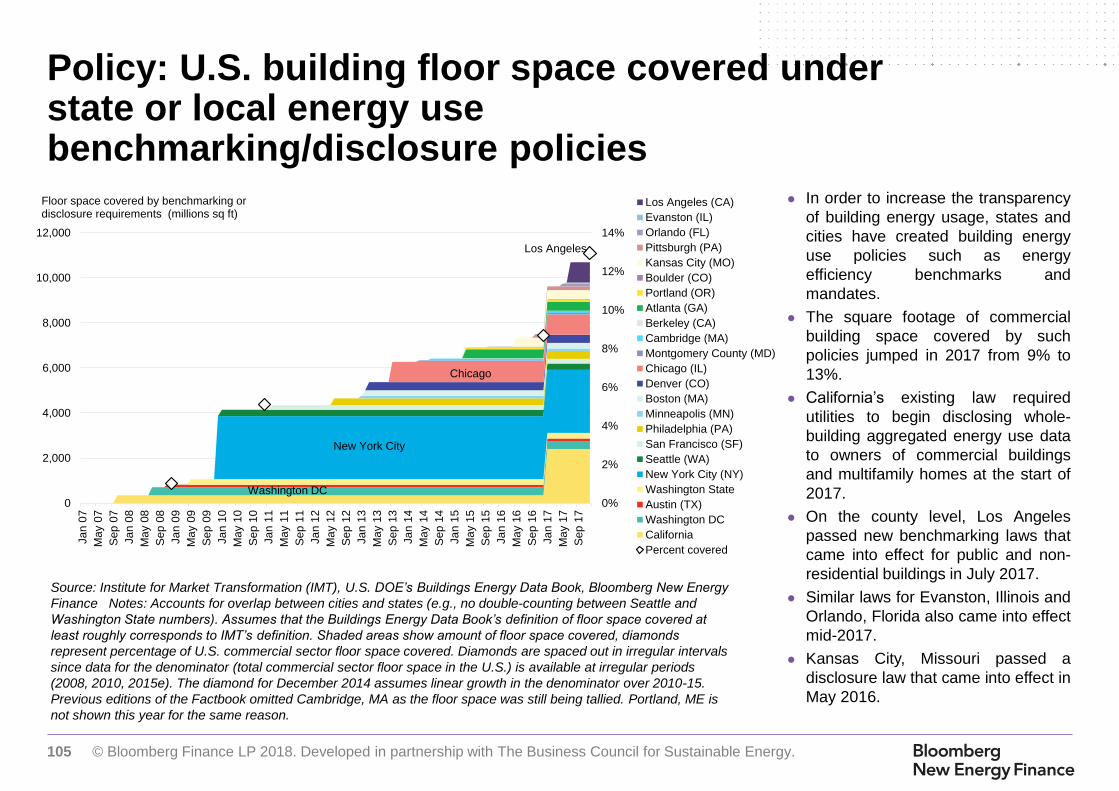
105 © Bloomberg Finance LP 2018. Developed in partnership with The Business Council for Sustainable Energy.
Source: Institute for Market Transformation (IMT), U.S. DOE’s Buildings Energy Data Book, Bloomberg New Energy
Finance Notes: Accounts for overlap between cities and states (e.g., no double-counting between Seattle and
Washington State numbers). Assumes that the Buildings Energy Data Book’s definition of floor space covered at
least roughly corresponds to IMT’s definition. Shaded areas show amount of floor space covered, diamonds
represent percentage of U.S. commercial sector floor space covered. Diamonds are spaced out in irregular intervals
since data for the denominator (total commercial sector floor space in the U.S.) is available at irregular periods
(2008, 2010, 2015e). The diamond for December 2014 assumes linear growth in the denominator over 2010-15.
Previous editions of the Factbook omitted Cambridge, MA as the floor space was still being tallied. Portland, ME is
not shown this year for the same reason.
Policy: U.S. building floor space covered under state or local energy use benchmarking/disclosure policies
● In order to increase the transparency
of building energy usage, states and
cities have created building energy
use policies such as energy
efficiency benchmarks and
mandates.
● The square footage of commercial
building space covered by such
policies jumped in 2017 from 9% to
13%.
● California’s existing law required
utilities to begin disclosing whole-
building aggregated energy use data
to owners of commercial buildings
and multifamily homes at the start of
2017.
● On the county level, Los Angeles
passed new benchmarking laws that
came into effect for public and non-
residential buildings in July 2017.
● Similar laws for Evanston, Illinois and
Orlando, Florida also came into effect
mid-2017.
● Kansas City, Missouri passed a
disclosure law that came into effect in
May 2016.
0%
2%
4%
6%
8%
10%
12%
14%
0
2,000
4,000
6,000
8,000
10,000
12,000
Ja
n 0
7
Ma
y 0
7
Sep
07
Ja
n 0
8
Ma
y 0
8
Sep
08
Ja
n 0
9
Ma
y 0
9
Sep
09
Ja
n 1
0
Ma
y 1
0
Sep
10
Ja
n 1
1
Ma
y 1
1
Sep
11
Ja
n 1
2
Ma
y 1
2
Sep
12
Ja
n 1
3
Ma
y 1
3
Sep
13
Ja
n 1
4
Ma
y 1
4
Sep
14
Ja
n 1
5
Ma
y 1
5
Sep
15
Ja
n 1
6
Ma
y 1
6
Sep
16
Ja
n 1
7
Ma
y 1
7
Sep
17
Los Angeles (CA)
Evanston (IL)
Orlando (FL)
Pittsburgh (PA)
Kansas City (MO)
Boulder (CO)
Portland (OR)
Atlanta (GA)
Berkeley (CA)
Cambridge (MA)
Montgomery County (MD)
Chicago (IL)
Denver (CO)
Boston (MA)
Minneapolis (MN)
Philadelphia (PA)
San Francisco (SF)
Seattle (WA)
New York City (NY)
Washington State
Austin (TX)
Washington DC
California
Percent covered
New York City
Washington DC
Chicago
Floor space covered by benchmarking or disclosure requirements (millions sq ft)
Los Angeles

106 © Bloomberg Finance LP 2018. Developed in partnership with The Business Council for Sustainable Energy.
Source: EPA, EIA, Bloomberg New Energy Finance Notes: There is insufficient data for total U.S. floor space of educational buildings in excess of 500,000ft2.
Deployment: Energy Star-certified floor space and total floor space for U.S. commercial buildings
● Energy Star certification is highest in large buildings, particularly offices. This is unsurprising given that the scale of large buildings mean that
certification can have a greater impact for the same amount of effort as would be the case for smaller buildings.
● Although the majority of early certification was in offices, the past decade has seen buildings used for education and retail emerge as
important segments for certification. While lodgings and buildings for warehouse/storage currently have a low uptake in Energy Star
certification, penetration is growing among the largest of these.
● The key challenge remains finding an effective strategy for increasing uptake in buildings below 50,000 ft2, where uptake remains low.
Total floorspace
Energy STAR certified floorspace as of year end 2017
Energy Star certified floorspace as of year end 2007
Education
Healthcare
Warehouse and
Storage
Offices
Mercantile
Lodging
1,000 -
5,000 ft25,000 -
10,000 ft210,000 -
25,000 ft225,000 -
50,000 ft250,000 -
100,000 ft2100,000 -
200,000 ft2200,000 -
500,000 ft2> 500,000
ft2

107 © Bloomberg Finance LP 2018. Developed in partnership with The Business Council for Sustainable Energy.
Source: © 1975 ASHRAE www.ashrae.org Note: 2023 standards reflect Department of Energy appliance standards to take effect in 2023.
Policy: Reductions in energy use by HVAC equipment, as required by efficiency standards
● As technology advanced, efficiency standards have tightened in order to continue driving building energy use reductions through innovation
and other improvements.
● Today, air conditioning equipment uses 20-40% less electricity to provide the same amount of cooling as when standards were first introduced.
● Potential remains for higher standards and further improvement to these systems, but relative efficiency gains will be incrementally smaller.
● Additional efficiency gains can come from optimizing these and other building systems through building energy codes and other “systems
efficiency” approaches.
0% 10% 20% 30% 40%
Water-cooled chillers (improvement onASHRAE Standard 90-1975)
Air-cooled chillers (improvement on ASHRAEStandard 90-1975)
Commercial Rooftop Units (improvement on1995 DOE standard)
Residential Furnaces (improvement on 1992DOE standard)
Residential Air-Conditioners (improvement on1992 DOE standard)
Reduction in Energy Use since First Standard
Current standards
2023 standards

108 © Bloomberg Finance LP 2018. Developed in partnership with The Business Council for Sustainable Energy.
Source: Energy Star Note: Non-exhaustive selection of appliances; share of certified appliances sold is based on sales data compiled by Energy Star.
Deployment: Percent of Energy Star-certified products sold by product type, 2016
● Of the products considered, laptop computers have the highest rates of certification at 81%. This is in contrast to desktop
computers, where the certification rate stands at only 51%. Because energy efficiency also impacts laptop battery life,
there is an additional incentive for consumers to opt for an efficient option. This is a likely explanation for the difference.
● Central air conditioning and clothes dryers remain among the products with lower certification rates (below one third each).
● Penetration rates can change year to year due to factors such as actual increases in the number of Energy Star-certified
products, as well as falling penetration due to the introduction of new, more stringent certification standards or the
introduction of new products that are not certified.
81%
71%
51%
48%
41%
39%
38%
35%
32%
22%
19%
29%
49%
52%
59%
61%
62%
65%
68%
78%
0% 10% 20% 30% 40% 50% 60% 70% 80% 90% 100%
Laptops
Televisions
Desktops
Refrigerators
Clothes washers
Air-source heat pumps
Room air conditioners
Freezers
Clothes dryers
Central air conditioning
Energy Star certified
Not Energy Starcertified
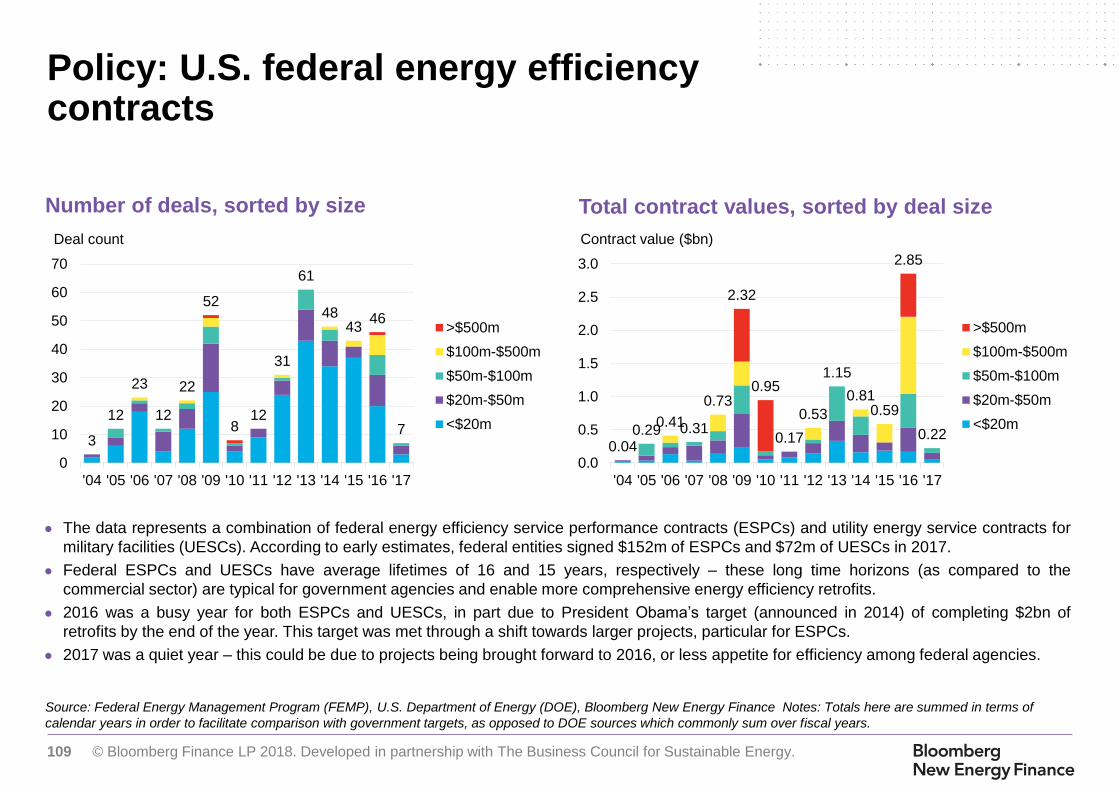
109 © Bloomberg Finance LP 2018. Developed in partnership with The Business Council for Sustainable Energy.
Source: Federal Energy Management Program (FEMP), U.S. Department of Energy (DOE), Bloomberg New Energy Finance Notes: Totals here are summed in terms of
calendar years in order to facilitate comparison with government targets, as opposed to DOE sources which commonly sum over fiscal years.
Number of deals, sorted by size Total contract values, sorted by deal size
Policy: U.S. federal energy efficiency contracts
● The data represents a combination of federal energy efficiency service performance contracts (ESPCs) and utility energy service contracts for
military facilities (UESCs). According to early estimates, federal entities signed $152m of ESPCs and $72m of UESCs in 2017.
● Federal ESPCs and UESCs have average lifetimes of 16 and 15 years, respectively – these long time horizons (as compared to the
commercial sector) are typical for government agencies and enable more comprehensive energy efficiency retrofits.
● 2016 was a busy year for both ESPCs and UESCs, in part due to President Obama’s target (announced in 2014) of completing $2bn of
retrofits by the end of the year. This target was met through a shift towards larger projects, particular for ESPCs.
● 2017 was a quiet year – this could be due to projects being brought forward to 2016, or less appetite for efficiency among federal agencies.
3
12
23
12
22
52
812
31
61
4843
46
7
0
10
20
30
40
50
60
70
'04 '05 '06 '07 '08 '09 '10 '11 '12 '13 '14 '15 '16 '17
Deal count
>$500m
$100m-$500m
$50m-$100m
$20m-$50m
<$20m
0.040.29
0.410.31
0.73
2.32
0.95
0.17
0.53
1.15
0.810.59
2.85
0.22
0.0
0.5
1.0
1.5
2.0
2.5
3.0
'04 '05 '06 '07 '08 '09 '10 '11 '12 '13 '14 '15 '16 '17
Bill
ions
Contract value ($bn)
>$500m
$100m-$500m
$50m-$100m
$20m-$50m
<$20m

110 © Bloomberg Finance LP 2018. Developed in partnership with The Business Council for Sustainable Energy.
Source: ACEEE Note: The ACEEE Scorecard points to caveats in the energy efficiency savings data reported by states. ACEEE uses a standard factor of 0.9 to convert gross
savings to net savings for those states that report in gross rather than net terms.
Deployment: Incremental annual energy efficiency achievements by electric utilities to date
● The years leading up to 2011 saw a growing number of states introducing Energy Efficiency Resource Standards (EERS) mandating utilities to
invest in energy savings among their customer-base. There was a corresponding increase in investment in utility energy efficiency programs.
● Since 2011, the number of states with EERS policies in place has leveled off, as has investment. In 2016 utility energy efficiency savings
decreased for the first time, falling slightly from the previous year.
● Although 28 states saw an increase in energy savings in 2016, Californian utilities’ savings decreased from 5.0TWh to 3.9TWh, bringing the
overall total for the country down. The ACEEE, which collects this data, attributes the difference to adjustments in its qualifying criteria for utility
energy efficiency savings, rather than a decrease in energy efficiency activity.
● Between 2015 and 2016, Arkansas, Illinois and Pennsylvania saw savings increase by 0.19TWh, 0.16TWh and 0.15TWh respectively.
7.89.9 10.6
13.1
18.4
22.9 23.024.4
25.7 26.525.4
0.0%
0.1%
0.2%
0.3%
0.4%
0.5%
0.6%
0.7%
0.8%
2006 2007 2008 2009 2010 2011 2012 2013 2014 2015 2016
0
5
10
15
20
25
30
35
40
Utility electricitysavings (right-hand axis)
Savings as a %of retail sales
Proportion of retail sales TWh

111 © Bloomberg Finance LP 2018. Developed in partnership with The Business Council for Sustainable Energy.
● In 2016, growth in utility spending on energy efficiency level off at $7.6bn, only 1% higher than the previous year. This reflects the slowdown in
new states introducing EERS policies and the maturing of many states schemes.
● While investment growth eased at the national level, the picture was more dynamic at the state level. Utilities in Washington increased
spending by $34m (+11%), and there were also notable increases in Indiana (+$34m, +33%), North Carolina (+$31m, +21%) and Kentucky
(+$30m, +38%).
● However, these gains were offset by falling investment in California (-$57m, -3%) and Maryland (-$90m, -44%). The decrease in Maryland
stems in part from a general decline in investment by the state's utilities. The drop-off in California is relatively minor when compared against
the increase from $1.57bn to $1.71bn between 2014 and 2015.
Source: CEE, ACEEE, Bloomberg New Energy Finance. Note that data for 2010-14 was sourced from CEE, and for 2006-2009 and 2015-16 from the ACEEE.
Financing: U.S. utility energy efficiency spending
1.6
2.22.6
3.0
3.9
4.7 4.8 5.0
5.66.2 6.3
0.3
0.30.6
0.8
0.8
1.0 1.1 1.2
1.31.4 1.3
1.9
2.5
3.23.8
4.7
5.76.0 6.1
6.9
7.6 7.6
0
1
2
3
4
5
6
7
8
9
10
2006 2007 2008 2009 2010 2011 2012 2013 2014 2015 2016
Natural gas
Electricity
+34%
+25%
+18%
+26%
+20%+4%
+3% +13%
+12% +1%$bn

112 © Bloomberg Finance LP 2018. Developed in partnership with The Business Council for Sustainable Energy.
● Total U.S. spending on energy efficiency through formal frameworks climbed to an estimated record level of $14.5bn in 2016.
● While utility spending and ESPCs remain the most important frameworks, the majority of growth between 2015 and 2016 was due to the scaling
of the PACE financing framework, particularly in the residential sector. According to PACENation estimates, residential investment in PACE hit
$1.6bn in 2016. PACE investments climbed 28% from 2015 to 2016, contributing to the overall 133-fold increase from 2012 through 2016.
● While our estimate for ESPC investment has leveled off in recent years, there is a certain amount of extrapolation involved due to the lack of
detailed data on the market. The picture may change when new data becomes available.
Source: ACEEE, NAESCO, LBNL, CEE, IAEE, PACENation, Bloomberg New Energy Finance Notes: The values for the 2015, 2016 ESPC market size shown here are
estimates. The most recent data from LBNL reports revenues of $5.3bn in 2014. The 2015 and 2016 estimates are based on a continuation of 2011-14 growth rates.
By framework By sector
Financing: U.S. estimated investment in energy efficiency through formal frameworks
0
2
4
6
8
10
12
14
16
'90 '92 '94 '96 '98 '00 '02 '04 '06 '08 '10 '12 '14 '16
$bn
PACE
ESPC
Utility ESPC
Utilityspending
0
2
4
6
8
10
12
14
16
'90 '92 '94 '96 '98 '00 '02 '04 '06 '08 '10 '12 '14 '16
$bn
Other
Publicbuildings
Commercial &Industrial
Residential

113 © Bloomberg Finance LP 2018. Developed in partnership with The Business Council for Sustainable Energy.
Source: The Aluminum Association, U.S. Geological Survey, U.S. Department of Interior, U.S. Department of Commerce, Can Manufacturers Institute, Institute of Scrap
Recycling Industries Notes: Not shown is the considerable share of aluminum imports consumed in the U.S., which have historically met around 45% of U.S. demand.
U.S. production of primary v. secondary
aluminum
Average annual aluminum scrap recovery, by
decade
Deployment: U.S. aluminium recycling trends
● Producing aluminum from secondary sources (i.e., recycled post-consumer and industrial scrap) consumes significantly less energy than
making new aluminum. The aluminum industry therefore provides insights into industrial-sector adoption of energy efficiency.
● The share of aluminum derived from secondary sources leapt to 84% in 2016, up from 71% in 2015. More broadly, aluminum production from
secondary sources has risen dramatically from 61% a decade prior in 2007, and from only 25% in 1980.
● Scrap recycling rose 18% from the previous to the current decade, due in large part to factors such as the addition of imported cans into the
U.S. recycling stream, increased scrap availability and increased demand for recycled aluminum in the U.S. market.
0%
10%
20%
30%
40%
50%
60%
70%
80%
90%
100%
198
0
198
2
198
4
198
6
198
8
199
0
199
2
199
4
199
6
199
8
200
0
200
2
200
4
200
6
200
8
201
0
201
2
201
4
201
6
Share of U.S. aluminum production
Secondary aluminum
Primary aluminum
0
1,000
2,000
3,000
4,000
5,000
6,000
1980s 1990s 2000s 2010s
Tons

114 © Bloomberg Finance LP 2018. Developed in partnership with The Business Council for Sustainable Energy.
Table of Contents
1. Introduction
2. A look across
the U.S. energy
sector
3. Natural gas
4. Large-scale
renewable
electricity and
CCS
2.1 Bird's eye
2.2. Policy, finance, economics
4.1 Solar (PV, solar thermal)
4.2 Wind
4.3 Biomass, biogas, waste-to-
energy
4.4 Geothermal
4.5 Hydropower
4.6 CCS
5. Distributed
power and
storage
5.1 Small-scale solar
5.2 Combined heat and power and
waste-heat-to-power
5.4 Energy storage
6. Demand-
side energy
efficiency
6.1 Energy efficiency
6.2 Demand response and digital
energy
7. Sustainable
transportation
7.1 Electric vehicles
7.2 Natural gas vehicles
7.3 Biofuels
5.3 Fuel cells (stationary)
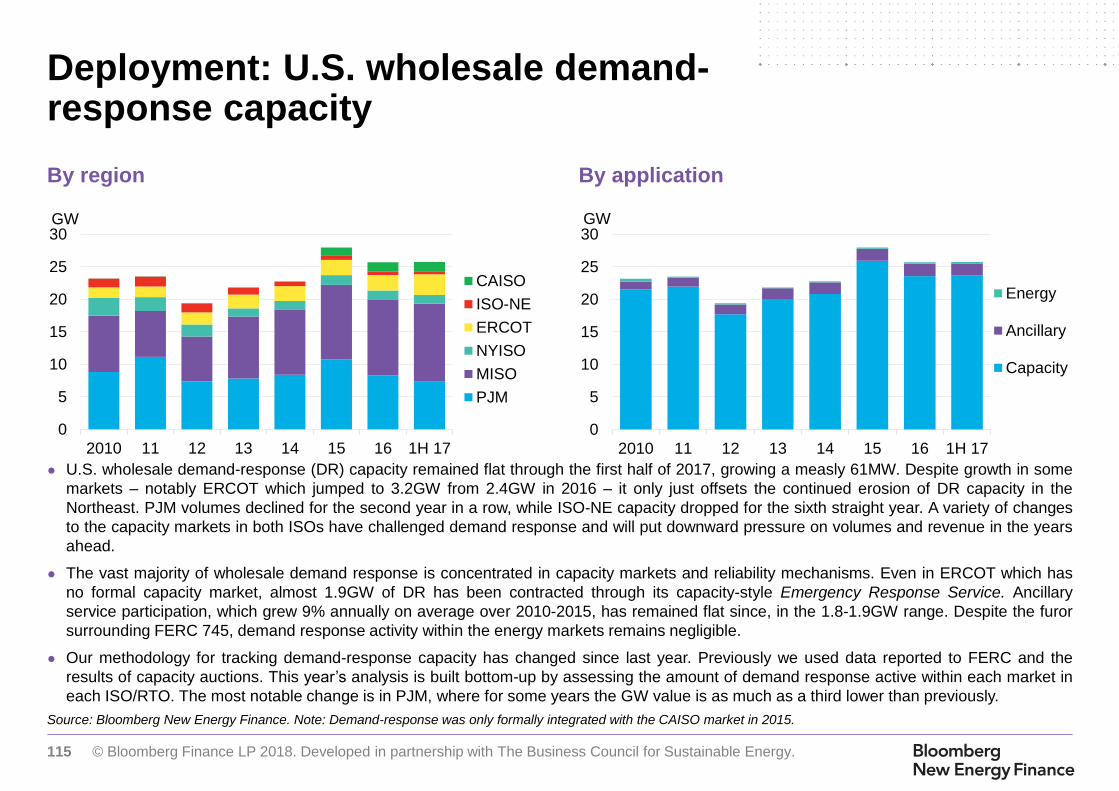
115 © Bloomberg Finance LP 2018. Developed in partnership with The Business Council for Sustainable Energy.
Source: Bloomberg New Energy Finance. Note: Demand-response was only formally integrated with the CAISO market in 2015.
By region By application
Deployment: U.S. wholesale demand-response capacity
● U.S. wholesale demand-response (DR) capacity remained flat through the first half of 2017, growing a measly 61MW. Despite growth in some
markets – notably ERCOT which jumped to 3.2GW from 2.4GW in 2016 – it only just offsets the continued erosion of DR capacity in the
Northeast. PJM volumes declined for the second year in a row, while ISO-NE capacity dropped for the sixth straight year. A variety of changes
to the capacity markets in both ISOs have challenged demand response and will put downward pressure on volumes and revenue in the years
ahead.
● The vast majority of wholesale demand response is concentrated in capacity markets and reliability mechanisms. Even in ERCOT which has
no formal capacity market, almost 1.9GW of DR has been contracted through its capacity-style Emergency Response Service. Ancillary
service participation, which grew 9% annually on average over 2010-2015, has remained flat since, in the 1.8-1.9GW range. Despite the furor
surrounding FERC 745, demand response activity within the energy markets remains negligible.
● Our methodology for tracking demand-response capacity has changed since last year. Previously we used data reported to FERC and the
results of capacity auctions. This year’s analysis is built bottom-up by assessing the amount of demand response active within each market in
each ISO/RTO. The most notable change is in PJM, where for some years the GW value is as much as a third lower than previously.
0
5
10
15
20
25
30
2010 11 12 13 14 15 16 1H 17
Th
ou
sa
nd
s
GW
CAISO
ISO-NE
ERCOT
NYISO
MISO
PJM
0
5
10
15
20
25
30
2010 11 12 13 14 15 16 1H 17
GW
Energy
Ancillary
Capacity

116 © Bloomberg Finance LP 2018. Developed in partnership with The Business Council for Sustainable Energy.
Source: Bloomberg New Energy Finance, EIA. Note: there is a 10-month lag in official smart meter statistics, as a result 2017 figures include BNEF estimates.
U.S. smart meter deployments Top 10 states by penetration
Deployment: U.S. smart electricity meter deployments
● Smart meter installations hit a peak in 2010 and 2011, supported by stimulus funding awarded in 2009. Many of the largest U.S. utilities took
advantage of the Smart Grid Investment Grant to roll out smart meters across their territories. As grant funding dried up, deployments slowed,
hitting a trough in 2014. Smart metering activity has since increased to a fairly constant six million meters per year.
● Today almost 51% of U.S. electricity customers have a smart meter, but there is enormous regional variation. The top 10 states all have
penetration of greater than 79%. In contrast only one in five or fewer customers have smart meters in the bottom 10 states. Over 2016-17,
Illinois and Michigan were the most active smart metering markets, deploying 2.4 and 1.1 million meters, respectively.
● The greatest cost saving for utilities from smart metering is replacing the need for manual meter reads. But a renewed focus on grid
modernization and growing interest in dynamic retail tariffs is leading state regulators and utilities that have shied away from the technology to
reassess the benefits of deployment. Hold-out states, such as New York and Rhode Island (where smart meters currently number in the
hundreds), have both committed to extensive smart meter rollouts over the next five to ten years.
0
10
20
30
40
50
60
70
80
0
2
4
6
8
10
12
14
16
2007 08 09 10 11 12 13 14 15 16 17
Annual Cumulative
Annual (millions) Cumulative (millions)
0% 20% 40% 60% 80% 100%
Arizona
Delaware
Vermont
California
Michigan
Oklahoma
Nevada
Georgia
Maine
D.C.
Smart meter penetration

117 © Bloomberg Finance LP 2018. Developed in partnership with The Business Council for Sustainable Energy.
Source: Bloomberg New Energy Finance. Note: Colors indicate the size of the rebate. This analysis only includes utilities with more than one million customers or at least 20%
of customers in their state. Eligibility is likely to be higher in states with several small utilities. States excluded from the graph do not have smart thermostat rebate programs
among utilities that meet the threshold to be covered in this analysis.
Deployment: U.S. smart thermostat rebate availability
● Smart thermostats are becoming the weapon of choice in U.S. utility demand-response programs. Energy efficiency resources standards
(EERS) and other state policies have enabled utilities to offer rebates to customers who reduce energy consumption and peak load. Smart
thermostats are an appealing tool for utilities and customers alike to reduce peak load and, as a result, are widely marketed by utilities. For
customers, they are a fun household appliance that offers convenience and integration with the connected home. For utilities, they are a new
tool for directly controlling heating and cooling load, one of the greatest contributors to residential peak demand.
● In 20 states, over 50 percent of households are eligible for a smart thermostat rebate. In most cases the value of the rebate is under $100, but
it can be much more. In Nevada, for example, 100 percent of residential customers can receive a smart thermostat for free.
● Smart thermostat costs continue to decline with all the leading brands now offering products for $170 or less, down from $250 only a year ago.
Coupled with utility incentives that further reduce the sticker price, BNEF estimates that over 14 million households had a smart thermostat in
2017.
0%
20%
40%
60%
80%
100%
NV RI
IL VT
CA MI
ID
MA
NY
CT
UT
AZ IA
NH
DE
OK
NM WI
CO
GA
MN
PA
OR
WA
NE
MO
TX
OH
MD
KY IN
Percentage of residential customers eligible for rebates
Free
101-150
51-100
0-50
Size of
rebate ($)

118 © Bloomberg Finance LP 2018. Developed in partnership with The Business Council for Sustainable Energy.
Table of Contents
1. Introduction
2. A look across
the U.S. energy
sector
3. Natural gas
4. Large-scale
renewable
electricity and
CCS
2.1 Bird's eye
2.2. Policy, finance, economics
4.1 Solar (PV, solar thermal)
4.2 Wind
4.3 Biomass, biogas, waste-to-
energy
4.4 Geothermal
4.5 Hydropower
4.6 CCS
5. Distributed
power and
storage
5.1 Small-scale solar
5.2 Combined heat and power and
waste-heat-to-power
5.4 Energy storage
6. Demand-
side energy
efficiency
6.1 Energy efficiency
6.2 Demand response and digital
energy
7. Sustainable
transportation
7.1 Electric vehicles
7.2 Natural gas vehicles
7.3 Biofuels
5.3 Fuel cells (stationary)

119 © Bloomberg Finance LP 2018. Developed in partnership with The Business Council for Sustainable Energy.
Source: Bloomberg New Energy Finance
U.S. EV sales U.S. HEV sales
Deployment: U.S. electric vehicle and hybrid electric vehicle sales
● Sales of electric vehicles – a category that includes battery electric vehicles (BEV) and plug-in hybrid electric vehicles (PHEV) – increased 23%
to over 194,000 units in 2017, from 158,000 units in 2016. Sales of EV models from three automakers – General Motors, Tesla and Toyota –
accounted for 59% of total U.S. sales in 2017. Longer range versions of known models (e.g., the Toyota Prius Prime), long-range affordable
BEVs (e.g., the Chevrolet Bolt), and newer electrified car segments (e.g., the Tesla Model X) are responsible for increasing EV sales.
● PHEV sales rose the most in percentage terms, up 24% year-on-year on the back of continued consumer interest in the Chevrolet Volt and the
well-priced Toyota Prius Prime. BEVs saw a 22% jump in sales and sustained their advantage over PHEVs by over 13,000 units in 2017.
● Sales of hybrid electric vehicles (HEV) totalled just over 371,000 units in 2017 – a 7% increase compared to 2016. Toyota Prius was the best-
selling model in 2017 with over 65,600 units, followed by the Ford Fusion and the Toyota RAV4.
0%
1%
2%
3%
4%
5%
6%
0
10
20
30
40
50
60
1Q
2Q
3Q
4Q
1Q
2Q
3Q
4Q
1Q
2Q
3Q
4Q
1Q
2Q
3Q
4Q
1Q
2Q
3Q
4Q
2013 2014 2015 2016 2017
Thousand units
BEV PHEV EV share in new vehicle sales
Share (%)
0%
1%
2%
3%
4%
5%
0
40
80
120
160
200
1Q
2Q
3Q
4Q
1Q
2Q
3Q
4Q
1Q
2Q
3Q
4Q
1Q
2Q
3Q
4Q
1Q
2Q
3Q
4Q
2013 2014 2015 2016 2017
Thousand units
HEV
Share (%)

120 © Bloomberg Finance LP 2018. Developed in partnership with The Business Council for Sustainable Energy.
Source: Bloomberg New Energy Finance, MarkLines Note: FCV= fuel cell electric vehicles, PHEV= plug-in hybrid electric vehicles and BEV=battery electric vehicles; models
available in North America (Canada and U.S.) are available in the U.S.; CAFE stands for Corporate Average Fuel Economy
Deployment: EV model availability in North America
● By Q4 2017, 54 EV models were available to North American consumers, including three fuel cell electric vehicles (FCVs),
26 PHEVs, and 25 BEVs.
● The number of PHEV models has been growing steadily in the last three years, from 38% of all EVs on offer in Q4 2015 to
48% in Q4 2017, taking share from fully electric vehicles. This shift towards partial electrification takes place as
automakers face stringent fuel efficiency requirements in their core markets (EU, China and the U.S.) and cater to
consumers’ preference for having the option of both combustion and electric powertrains.
● New EV models launched in 2017 include the Tesla Model 3, the second-generation Nissan Leaf and the Toyota Prius
PHEV.
3 3 4 5 5 5 5 5 5 4 7 5 5 6 8 8 10 11 12 14 15 15 15 15 16 15 18 18 19 20 19 19 19 21 23 23 24 25
22 2 2
3 44 4
66 6 7 8 8 9 11
9 10 1115 17 18 18
2023 24
26 26
1 1 1 1 1 1 1 2 2 2
22 2 2
2 22 2
22 2 2 2 2
3 3 3 33
4 3 3 33
3 43 3
1 14 4 5 6 6 6 6 7 7 6
119 9 10
13 1416 17
2022 23 24 25 25
28 29 30 3133
39 39 40 4044
4951
53 54
1Q2Q3Q4Q1Q2Q3Q4Q1Q2Q3Q4Q1Q2Q3Q4Q1Q2Q3Q4Q1Q2Q3Q4Q1Q2Q3Q4Q1Q2Q3Q4Q1Q2Q3Q4Q1Q2Q3Q4Q
2008 2009 2010 2011 2012 2013 2014 2015 2016 2017
Number of EV models available
FCV
PHEV
BEV
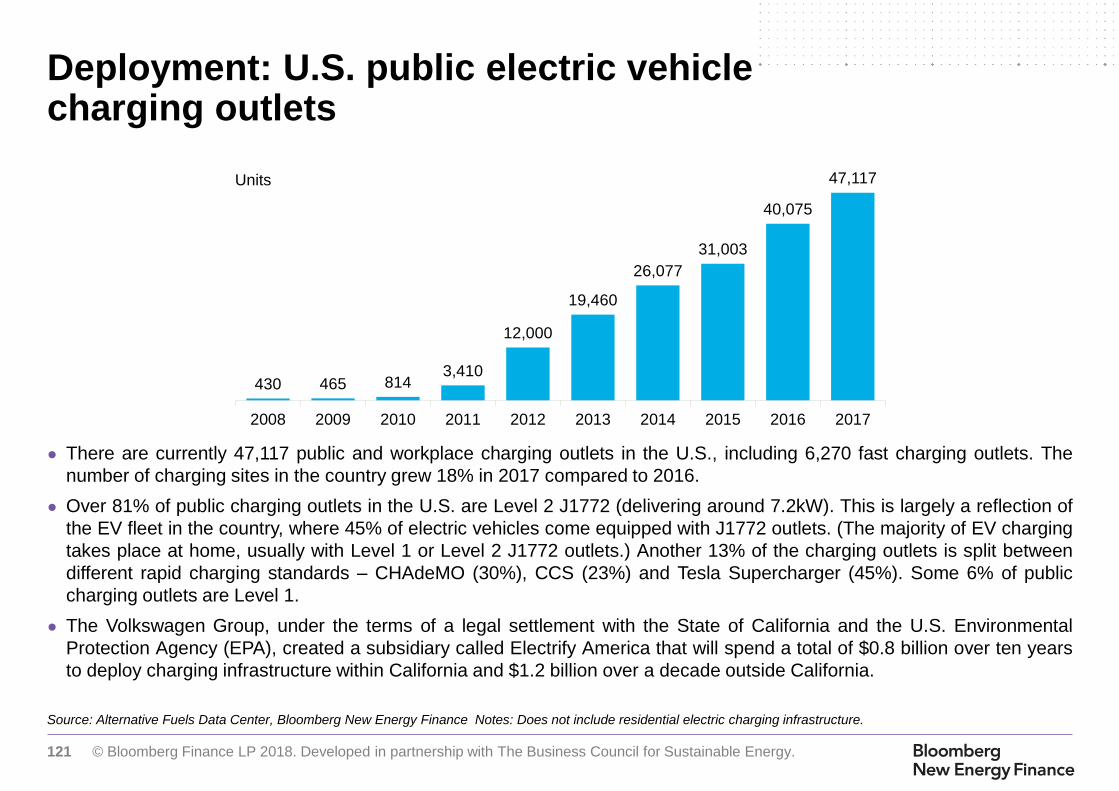
121 © Bloomberg Finance LP 2018. Developed in partnership with The Business Council for Sustainable Energy.
Source: Alternative Fuels Data Center, Bloomberg New Energy Finance Notes: Does not include residential electric charging infrastructure.
Deployment: U.S. public electric vehicle charging outlets
● There are currently 47,117 public and workplace charging outlets in the U.S., including 6,270 fast charging outlets. The
number of charging sites in the country grew 18% in 2017 compared to 2016.
● Over 81% of public charging outlets in the U.S. are Level 2 J1772 (delivering around 7.2kW). This is largely a reflection of
the EV fleet in the country, where 45% of electric vehicles come equipped with J1772 outlets. (The majority of EV charging
takes place at home, usually with Level 1 or Level 2 J1772 outlets.) Another 13% of the charging outlets is split between
different rapid charging standards – CHAdeMO (30%), CCS (23%) and Tesla Supercharger (45%). Some 6% of public
charging outlets are Level 1.
● The Volkswagen Group, under the terms of a legal settlement with the State of California and the U.S. Environmental
Protection Agency (EPA), created a subsidiary called Electrify America that will spend a total of $0.8 billion over ten years
to deploy charging infrastructure within California and $1.2 billion over a decade outside California.
430 465 8143,410
12,000
19,460
26,077
31,003
40,075
47,117
2008 2009 2010 2011 2012 2013 2014 2015 2016 2017
Units

122 © Bloomberg Finance LP 2018. Developed in partnership with The Business Council for Sustainable Energy.
Source: Bloomberg New Energy Finance. Notes: BNEF has tracked lithium-ion battery prices since 2010 through an annual market survey process. It collects, anonymizes and
aggregates price data for battery cells and packs. The numbers presented in the chart above include cell and pack prices for electric vehicles.
Economics: Lithium-ion battery pack prices
● Lithium-ion battery prices have fallen 65% since 2013, hitting $209/kWh in 2017. The diminishing cost of battery packs is the driving force
behind the falling cost of BEVs.
● Battery packs consist of cells and the equipment that make up the rest of the pack. For BEV batteries, the pack consists of the battery
management system, wiring, pack housing, and the thermal management system.
● From 2016 to 2017, declining cell costs drove most of the price decline—cell prices shrank 26% ($52/kWh), while pack prices fell by a smaller
16% ($12/kWh). Cells account for around 70% of the total pack price, on average.
● In the past year, economies of scale, greater cell energy density, and improvements to pack design continued play major roles in reducing
costs.
● Stationary storage systems use similar cells. However, because of smaller order volumes, the price of a pack for stationary storage developers
is closer to $300/kWh, or 51% greater than for automakers.
411367
234 199147
188173
116
74
62
599
540
350
273
209
2013 2014 2015 2016 2017
$/kWh
Pack
Cell

123 © Bloomberg Finance LP 2018. Developed in partnership with The Business Council for Sustainable Energy.
Source: EPA, Bloomberg New Energy Finance
Deployment: Share of vehicles with start/stop technologies
● Start-stop systems automatically shut off the engine when the vehicle is stopped, to cut fuel use and reduce idle
emissions. A battery continues to power lights and accessories while the engine is off. The engine automatically restarts
when the driver lifts their foot off the brake pedal. Start-stop systems deliver up to 5% fuel savings to conventional internal
combustion engine vehicles, depending upon driving conditions.
● The share of new vehicles sold with this system in the U.S. leapt to 16.8% in 2017, up from 9.6% in 2016.
● The deployment share corresponds to start/stop systems in non-hybrid vehicles. Hybrids typically include a start/stop
function as part of the electrified drivetrain; including hybrids, the total share of start/stop would be closer to 20%.
0.6%
2.3%
5.1%
7.2%
9.6%
16.8%
2012 2013 2014 2015 2016 2017
Share of new vehicles sold with stop/start systems in the U.S.

124 © Bloomberg Finance LP 2018. Developed in partnership with The Business Council for Sustainable Energy.
Source: Bloomberg New Energy Finance. Notes: Upfront cost includes down payment, financing and sales tax and is net of incentives; running costs consist of road tax,
insurance, maintenance and fuel. Calculations assume 10,100 miles driven per year, $2.6/gallon cost of gasoline and $0.105/kWh cost of electricity.
Economics: Total cost of ownership for BEVs, PHEVs, and ICE vehicles, accounting for purchasing credit incentives
● Battery electric vehicles cost up to a third less than owning equivalent gasoline cars for all segments – small, medium and large vehicles –
other than luxury SUVs. Both capital and fuel costs are lower for BEVs; capital costs benefit from up to $10,000 in federal and state incentives.
● Plug-in hybrids typically cost more than midsize gasoline cars. Prices for PHEVs are higher, incentives are lower and gasoline adds further fuel
costs compared to BEVs.
BEV
PHEV
ICE
U.S. 2017 models ($ thousands) $/mile
-7.5-4.9-3.7-4.9-3.9
-13.4-16.6
-5.3-6.3-5.4-4.3-4.8-9.9-4.5-4.9-4.9-5.4-6.1-6.1
-29.1-24.6-15.4
43.625.316.425.017.978.999.630.237.731.223.226.663.319.421.521.323.826.826.5127.0107.467.4
6.96.4
6.06.4
6.35.7
6.26.6
8.27.3
6.77.2
9.98.59.58.8
9.09.79.6
15.113.4
11.8
0.850.53
0.37
0.53
0.40
1.41
1.77
0.63
0.78
0.66
0.51
0.58
1.25
0.47
0.52
0.50
0.540.60
0.59
2.24
1.91
1.26
BMW i3Fiat 500e
Chevrolet Spark EVNissan Leaf
VW e-GolfTesla Model STesla Model XChevrolet VoltAudi A3 e-tron
Ford Fusion EnergiToyota Prius
Ford C-Max EnergiBMW X5 xDrive40e
Honda FitKia Soul
Toyota CorollaChevrolet Cruze
Toyota CamryHonda Accord
Mercedes S ClassBMW 7 Series
Average ICE luxury SUV
Resale value Upfront cost Running cost

125 © Bloomberg Finance LP 2018. Developed in partnership with The Business Council for Sustainable Energy.
Source: Bloomberg New Energy Finance. Notes: Upfront cost includes down payment, financing and sales tax and is net of incentives; running costs consist of road tax,
insurance, maintenance and fuel. Calculations assume 10,100 miles driven per year, $2.5/gallon cost of gasoline and $0.125/kWh cost of electricity.
Economics: Total cost of ownership for BEVs, PHEVs, and ICE vehicles, excluding purchasing credit incentives
● Without price subsidies:
– Current BEV models can be up to 28% more expensive than small and midsize gasoline cars, but more than half as costly to own and
operate as luxury SUVs.
– Midsize plug-in hybrids are a third more expensive than equivalent gasoline cars, but in the SUV segment PHEVs are more than 15%
cheaper.
$/mile
BEV
PHEV
ICE
U.S. 2017 models ($ thousands)
-7.5-4.9-3.7-4.9-3.9
-13.4-16.6
-5.3-6.3-5.4-4.3-4.8-9.9-4.5-4.9-4.9-5.4-6.1-6.1
-29.1-24.6-15.4
53.635.326.435.027.988.9109.637.745.238.730.734.170.819.421.521.323.826.826.5127.0107.467.4
6.96.4
6.06.4
6.35.7
6.26.6
8.27.3
6.77.2
9.98.59.58.8
9.09.79.6
15.113.4
11.8
1.050.73
0.57
0.72
0.60
1.61
1.96
0.77
0.93
0.80
0.66
0.72
1.40
0.47
0.52
0.50
0.54
0.60
0.59
2.24
1.91
1.26
BMW i3Fiat 500e
Chevrolet Spark EVNissan Leaf
VW e-GolfTesla Model STesla Model XChevrolet VoltAudi A3 e-tron
Ford Fusion EnergiToyota Prius
Ford C-Max EnergiBMW X5 xDrive40e
Honda FitKia Soul
Toyota CorollaChevrolet Cruze
Toyota CamryHonda Accord
Mercedes S ClassBMW 7 Series
Average ICE luxury SUV
Resale value Upfront cost Running cost

126 © Bloomberg Finance LP 2018. Developed in partnership with The Business Council for Sustainable Energy.
Source: EIA, UMTRI, Bloomberg New Energy Finance Notes: Analysis of gasoline consumption is based on daily averages of “total gasoline all sales / deliveries by prime
supplier.” Values for 2017 are projected, accounting for seasonality, based on the latest monthly values from EIA (data available through November 2017). Average fuel-
economy rating relies on combined city/highway EPA fuel economy ratings.
U.S. gasoline consumption U.S. average fuel-economy rating (weighted by
sales) of purchased new vehicles
Deployment: U.S. gasoline consumption and fuel economy
● Gasoline consumption rose for the third consecutive year, but growth slowed. Consumption inched up 0.7%, or 0.95bn
gallons, year-on-year, to 137bn gallons by the end of 2017. This was substantially slower than 2016, when consumption
expanded 3%, or 4.3bn gallons, year-on-year,. Tightening federal fuel economy standards may have helped to offset some
of the impact of low gasoline prices, and gasoline prices also began to rise in 2017.
● Consumption has climbed 8% since the 2014 trough on the back of low prices, and is only 0.8% from the all-time peak
reached in 2005.
● Average U.S. vehicle fuel economy made little gains in 2017, leaving this the third year in which average vehicle fuel
economy has held at around 25mpg. Though federal corporate average fuel economy regulations have tightened, cheaper
gasoline prices have also incentivized Americans to purchase less fuel-efficient vehicles.
0
50
100
150
198
5
198
7
1989
199
1
199
3
199
5
1997
199
9
200
1
200
3
2005
200
7
200
9
201
1
201
3
2015
201
7
Bn gallons per year
15
17
19
21
23
25
27
Oct2007
Oct2008
Oct2009
Oct2010
Oct2011
Oct2012
Oct2013
Oct2014
Oct2015
Oct2016
Oct2017
Miles per gallon
Monthly rating
Average rating
by model year
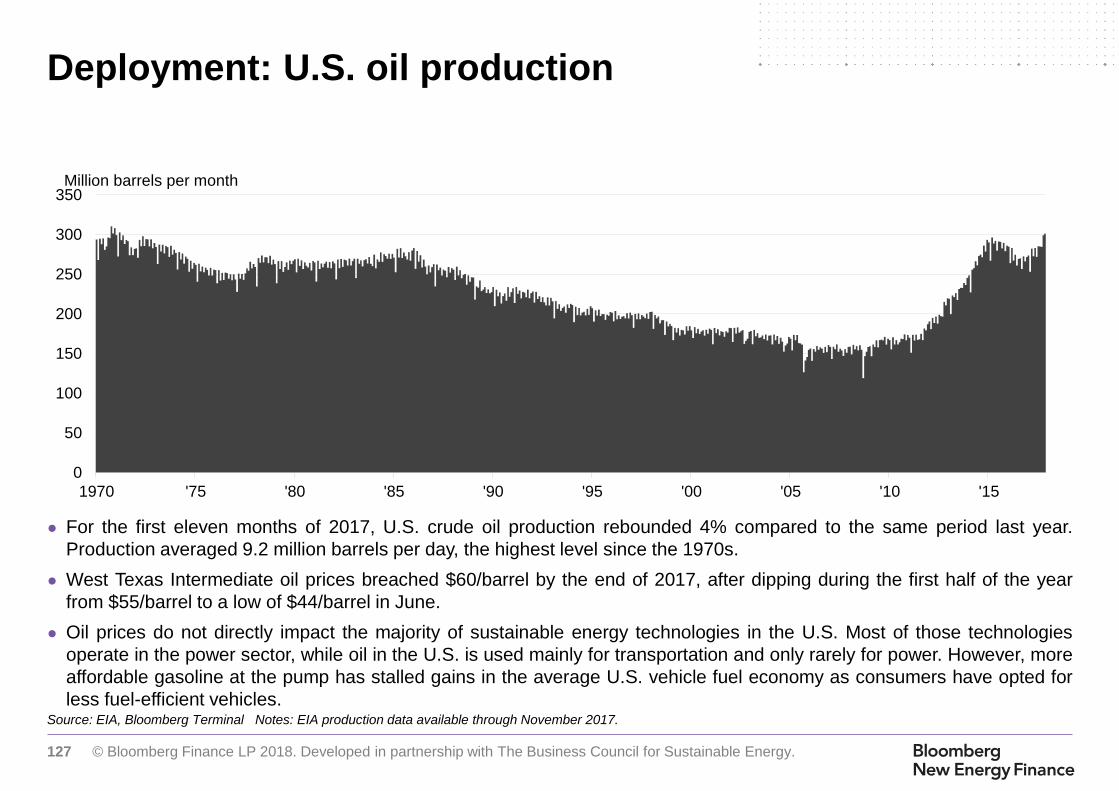
127 © Bloomberg Finance LP 2018. Developed in partnership with The Business Council for Sustainable Energy.
Source: EIA, Bloomberg Terminal Notes: EIA production data available through November 2017.
Deployment: U.S. oil production
● For the first eleven months of 2017, U.S. crude oil production rebounded 4% compared to the same period last year.
Production averaged 9.2 million barrels per day, the highest level since the 1970s.
● West Texas Intermediate oil prices breached $60/barrel by the end of 2017, after dipping during the first half of the year
from $55/barrel to a low of $44/barrel in June.
● Oil prices do not directly impact the majority of sustainable energy technologies in the U.S. Most of those technologies
operate in the power sector, while oil in the U.S. is used mainly for transportation and only rarely for power. However, more
affordable gasoline at the pump has stalled gains in the average U.S. vehicle fuel economy as consumers have opted for
less fuel-efficient vehicles.
0
50
100
150
200
250
300
350
1970 '75 '80 '85 '90 '95 '00 '05 '10 '15
Million barrels per month
'17
128 © Bloomberg Finance LP 2018. Developed in partnership with The Business Council for Sustainable Energy.
Table of Contents
1. Introduction
2. A look across
the U.S. energy
sector
3. Natural gas
4. Large-scale
renewable
electricity and
CCS
2.1 Bird's eye
2.2. Policy, finance, economics
4.1 Solar (PV, solar thermal)
4.2 Wind
4.3 Biomass, biogas, waste-to-
energy
4.4 Geothermal
4.5 Hydropower
4.6 CCS
5. Distributed
power and
storage
5.1 Small-scale solar
5.2 Combined heat and power and
waste-heat-to-power
5.4 Energy storage
6. Demand-
side energy
efficiency
6.1 Energy efficiency
6.2 Demand response and digital
energy
7. Sustainable
transportation
7.1 Electric vehicles
7.2 Natural gas vehicles
7.3 Biofuels
5.3 Fuel cells (stationary)

129 © Bloomberg Finance LP 2018. Developed in partnership with The Business Council for Sustainable Energy.
Source: EIA, Alternative Fuels Data Center Notes: Values for natural gas demand in 2017 are projected, accounting for seasonality, based on latest monthly values from EIA
(data available through October 2017). Data excludes gas consumed in the operation of pipelines.
Deployment: U.S. natural gas demand from natural gas vehicles
● Natural gas use in vehicles has grown steadily since 2013. In 2017, the amount of natural gas used for this purpose rose 4% year-on-year to
43.4Bcf. This represents a 44.5% increase over 2013 levels, and a 5.9% compounded annual growth rate over the last decade (since 2008).
The pick-up in 2014 coincided with the start of a period of low natural gas prices across the U.S.
● Compressed natural gas (CNG) remains more widely used than liquefied natural gas (LNG), and this is reflected in the amount of fueling
infrastructure available for each technology. As of January 18, 2018, there were 1,676 CNG stations across the U.S., compared to 137 LNG
stations (including public and private stations).
● The number of CNG and LNG stations shrank slightly from 2016, when the CNG station count had hit 1,725 and the number of LNG stations
hit 140.
14.5 15.0
18.320.5
22.9 23.7 24.726.0 27.3
28.730.0 30.0 30.0
35.3
39.441.9
43.4
2001 2002 2003 2004 2005 2006 2007 2008 2009 2010 2011 2012 2013 2014 2015 2016 2017
Bcf

130 © Bloomberg Finance LP 2018. Developed in partnership with The Business Council for Sustainable Energy.
Table of Contents
1. Introduction
2. A look across
the U.S. energy
sector
3. Natural gas
4. Large-scale
renewable
electricity and
CCS
2.1 Bird's eye
2.2. Policy, finance, economics
4.1 Solar (PV, solar thermal)
4.2 Wind
4.3 Biomass, biogas, waste-to-
energy
4.4 Geothermal
4.5 Hydropower
4.6 CCS
5. Distributed
power and
storage
5.1 Small-scale solar
5.2 Combined heat and power and
waste-heat-to-power
5.4 Energy storage
6. Demand-
side energy
efficiency
6.1 Energy efficiency
6.2 Demand response and digital
energy
7. Sustainable
transportation
7.1 Electric vehicles
7.2 Natural gas vehicles
7.3 Biofuels
5.3 Fuel cells (stationary)

131 © Bloomberg Finance LP 2018. Developed in partnership with The Business Council for Sustainable Energy.
Source: Bloomberg New Energy Finance, Bloomberg Terminal, EPA Notes: 2017 values are estimated. Fuels under the RFS2 are categorized by D codes, to determine fuel
type. D3 stands for Cellulosic Biofuels, D4 for Biomass-based Diesel, D5 for Advanced Biofuel, D6 for Renewable Fuel, D7 for Cellulosic Diesel. See the EPA's website for more
information.
First generation biofuels Next-generation biofuels
Deployment: Volumes of biofuels blended under the federal Renewable Fuels Standard
● Biofuel blending into gasoline and diesel is mandated by the Renewable Fuel Standard 2 in the U.S., which is in force through 2022. The EPA
administers the program and sets annual blending targets split by fuel type.
● The highest value biofuels under the RFS2 are cellulosic biofuels or “next-generation” biofuels. These include cellulosic ethanol, cellulosic diesel
and cellulosic biogas, which are made from non-food feedstocks and possess low carbon footprints.
● Each biofuel receives a renewable identification number (RIN) upon blending, which the blender can count towards its annual mandated targets,
or sell to other blenders who otherwise would not meet targets. Biomass-based diesel and Advanced Biofuel RINs (D4 and D5) have traded as
high as $1.14 and $1.13 in 2017, respectively, compared with $0.98 for ethanol (D6). Cellulosic biofuel RINs (D3) traded as high as $2.92.
● The biofuel blending targets for 2017 were 19bn physical gallons (of which 312m was the cellulosic target). For 2018, the mandate is kept flat at
19bn gallons.
81.5
116.6
127.8
2.2
3.8
6.5
2015
2016
2017
Millions of gallons
Cellulosic biogas(D3)
Cellulosic ethanol(D3)
14.5
14.8
14.5
1.6
2.3
2.0
0.5
0.6
0.6
2015
2016
2017
Billions of gallons
First generationethanol (D5,D6)
Biodiesel (D4, D6)
Non-esterrenewable diesel(D4, D5, D6)

132 © Bloomberg Finance LP 2018. Developed in partnership with The Business Council for Sustainable Energy.
This publication is the copyright of Bloomberg New Energy Finance. No portion of this document may be photocopied,
reproduced, scanned into an electronic system or transmitted, forwarded or distributed in any way without prior consent of
Bloomberg New Energy Finance.
The information contained in this publication is derived from carefully selected sources we believe are reasonable. We do not
guarantee its accuracy or completeness and nothing in this document shall be construed to be a representation of such a
guarantee. Any opinions expressed reflect the current judgment of the author of the relevant article or features, and does not
necessarily reflect the opinion of Bloomberg New Energy Finance, Bloomberg Finance L.P., Bloomberg L.P. or any of their
affiliates ("Bloomberg"). The opinions presented are subject to change without notice. Bloomberg accepts no responsibility
for any liability arising from use of this document or its contents. Nothing herein shall constitute or be construed as an
offering of financial instruments, or as investment advice or recommendations by Bloomberg of an investment strategy or
whether or not to "buy," "sell" or "hold" an investment.
Copyright and disclaimer

Coverage.
Renewable Energy
Power & Utilities
Gas
Carbon Markets & Climate Negotiations
Energy Smart Technologies
Storage
Electric Vehicles
Mobility and Autonomous Driving
Frontier Power
Emerging Technologies
Bloomberg New Energy Finance is a
research firm that helps energy
professionals generate opportunities. With a
team of experts spread across six
continents, BNEF provides independent
analysis and insight, enabling decision-
makers to navigate change in an evolving
energy economy.
BNEF research and analysis is accessible
via web and mobile platforms, as well as on
the Bloomberg Terminal.
about.bnef.com
@BloombergNEF
Contributors: Rachel Luo (Associate, U.S. Utilities and Market Reform)Colleen Regan (Head of U.S. Utilities and Market Reform)Ethan Zindler (Head of Americas)
Economics and Policy: Kyle Harrison, Abraham Louw, Stephen Munro, Nicholas Steckler
Natural Gas: Anastacia Dialynas
Renewable Energy: Hugh Bromley, Josh Danial, Kyle Harrison, Vertis McMillan, Alex Morgan, Dean Robertson, Nathan Serota, Ben Vickers
Energy Storage, Digital Energy, and Transportation: James Frith, Salim Morsy, Aleksandra O’Donovan, Thomas Rowlands-Rees, Yayoi Sekine, Nikolas Soulopoulos, James Sprinz