Embed Size (px)
Citation preview

2018 California State Rail Plan Connecting California

Agenda
1. Logistics
2. Rail Plan Overview
3. Passenger Rail Vision
4. Freight Rail Vision
5. Program Effects
6. Implementation
7. Next Steps
8. Questions
Presenters and Webinar Staff
Caltrans Division of Rail and Mass Transportation
Shannon Simonds – Rail Planning Branch Andy Cook Shalini Chandra Denise Cross
AECOM Matt Hertel Michael Cornfield Ken Sislak

State Rail Plan Overview

What is the California State Rail Plan?
» Statewide Rail Network “Vision” » Passenger & Freight Rail
Investments » Rail Investment Program
» Short-term (2022), Mid-Term (2027) & Vision (2040)
» Program Effects Analysis » Passenger Rail System
Integration

Meeting Customer
Expectations
Synchronized Timetables
Integrated Mobility Solutions
Coordination Strategic Planning
Consensus Vision
Passenger Rail Network Integration
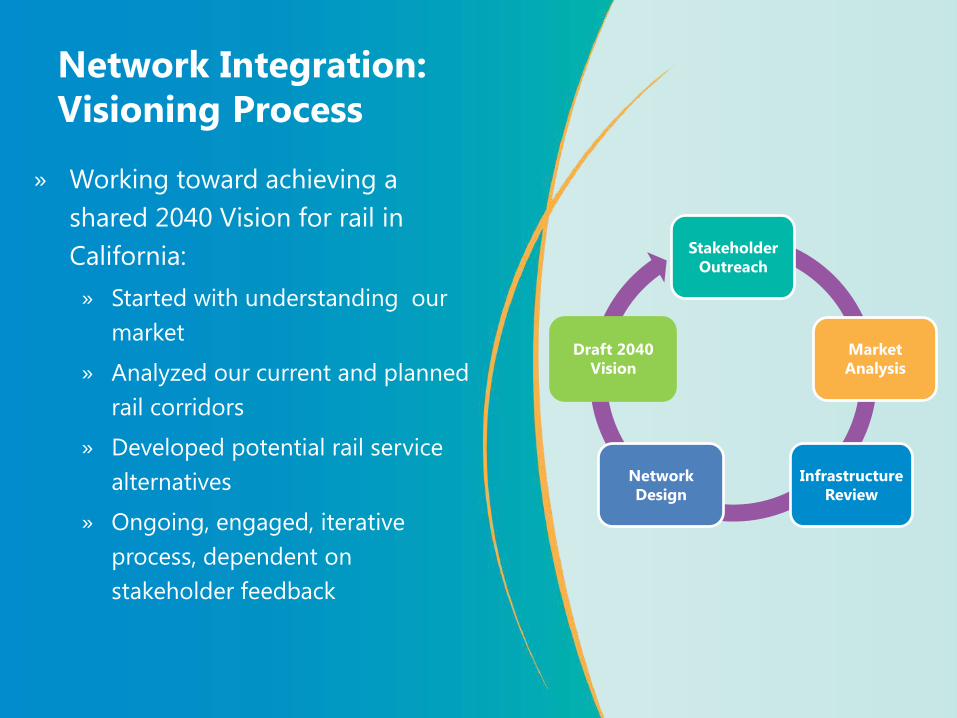
Network Integration: Visioning Process
» Working toward achieving a shared 2040 Vision for rail in California: » Started with understanding our
market
» Analyzed our current and planned rail corridors
» Developed potential rail service alternatives
» Ongoing, engaged, iterative process, dependent on stakeholder feedback
Stakeholder Outreach
Infrastructure Review
Market Analysis
Draft 2040 Vision
Network Design

Why is a Statewide Vision Warranted?
For trips over 15 miles, about 5% of those trips are longer than 100 miles and generate about 35% of passenger miles

Existing Conditions
Rail Ridership Potential by Travel Distance
(Thousand Annual Person Trips)
Existing Conditions

Rail Ridership Potential by Travel Distance
(Thousand Annual Person Trips)
Base Conditions
Potential Rail/Intercity Bus Ridership

Potential Rail/Intercity Bus Ridership
Rail Ridership Potential by Travel Distance
(Thousand Annual Person Trips)
HSR Phase 1 Conditions
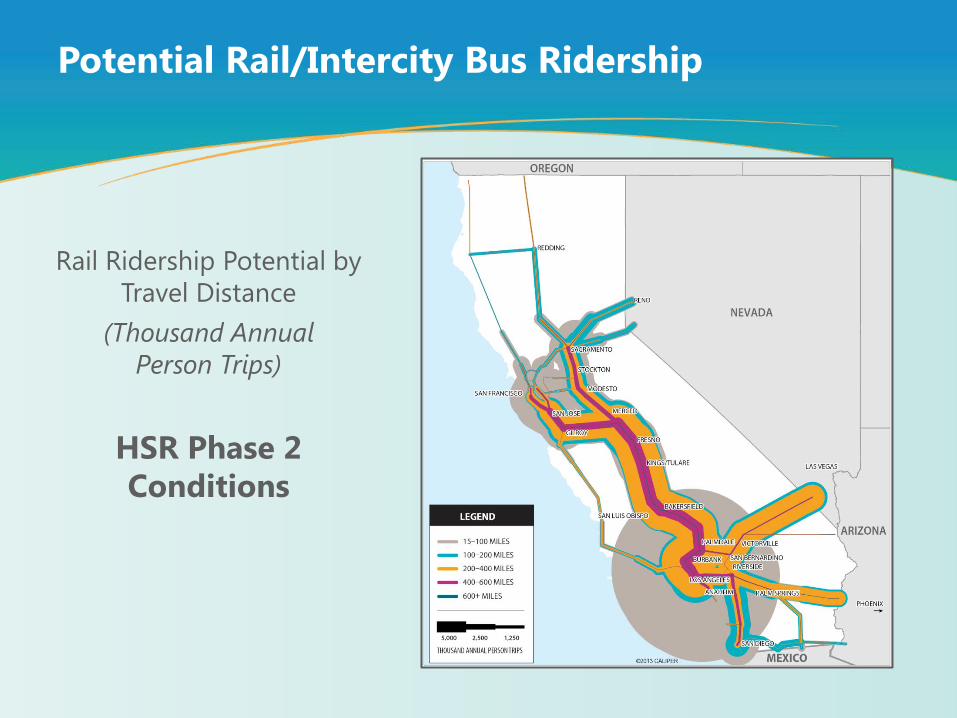
Potential Rail/Intercity Bus Ridership
Rail Ridership Potential by Travel Distance
(Thousand Annual Person Trips)
HSR Phase 2 Conditions
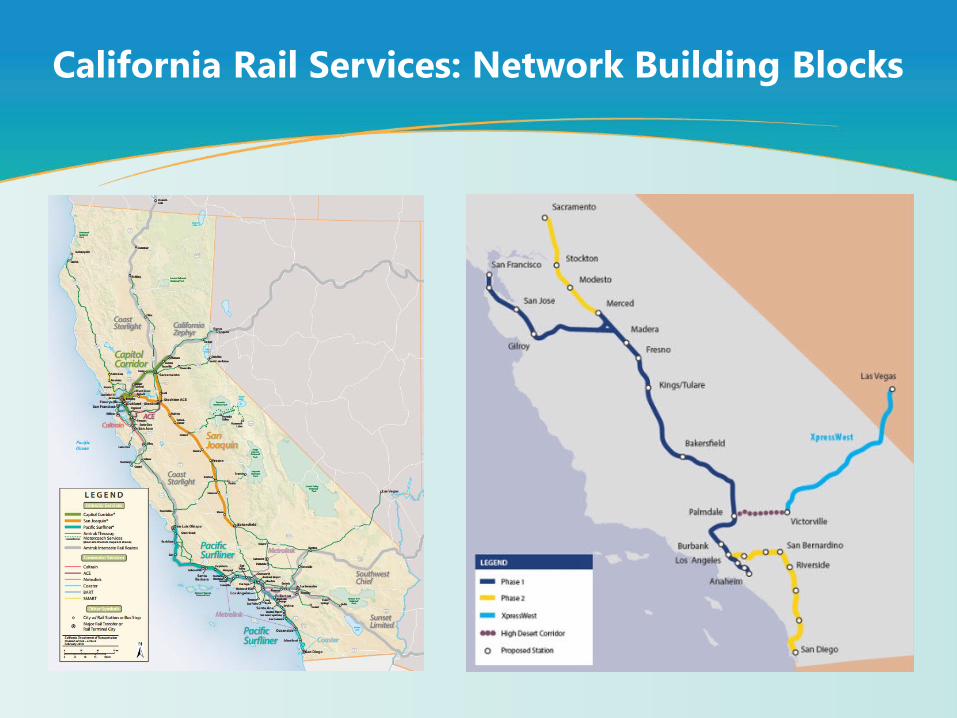
California Rail Services: Network Building Blocks

Passenger Rail Vision

Rail Plan Vision
California will have a premier, customer-focused, integrated rail
system that successfully moves people and products while enhancing
economic growth and quality of life.

Rail Plan Vision Network Goals
Connect California’s communities » Expand rail system and access
across state » Develop emerging regional rail
networks
Viable Statewide Travel Options » Increase rail share of travel market » Existing Rail ROW =
Transportation Capacity » Infrastructure savings
Efficiency and effectiveness
» More intensive utilization » Higher frequencies » Electrified & zero/near zero
emission services » Drive down costs & subsidies

2040 Vision for Passenger Rail
» Integrated Statewide Network » High Speed Rail » Intercity and Regional
Services » Integrated Express Bus
» Coordinated Schedules » Regular pulsed service » Key transfer hubs » Public Transit
Connections » Customer Focus
» Integrated Ticketing » Auto and air competitive

2040 Vision: Northern California

2040 Vision: Southern California

Freight Rail Vision
Rail Freight Vision
The freight component of the Rail Plan includes several key elements:
» A premier system requires improved track, yards, terminals and innovative service concepts
» A customer-focused system will lead to improved access to rail, competitive cost and service, & enhanced options for the State’s shippers
» An integrated system requires improved connections to smooth transfers

Trends: California’s Top Ten Trading Partners by Rail
26.7%
13.3% 7.5% 4.3% 3.2% 4.6% 3.1% 3.1% 3.8% 3.7%
34.7%
22.3%
0.1% 4.0% 5.5% 1.8%
3.3% 2.2% 0.8% 0.5%
0.0%
10.0%
20.0%
30.0%
40.0%
50.0%
60.0%
70.0%
Illinois Texas Nebraska Kansas Tennessee Utah Louisiana Oregon Canada Iowa
Inbound and Outbound Tons by Trade Partner
Inbound (% of Total Tons)
Outbound (% of Total Tons)

Percent Total Tons Carried by Freight Partner
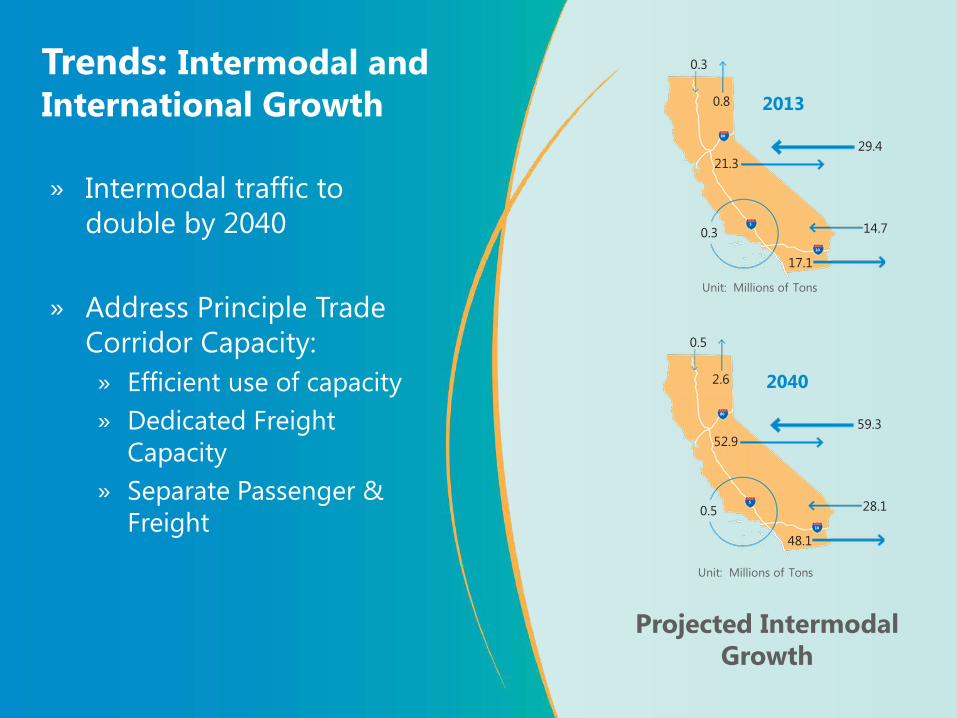
Trends: Intermodal and International Growth
» Intermodal traffic to double by 2040
» Address Principle Trade Corridor Capacity: » Efficient use of capacity » Dedicated Freight
Capacity » Separate Passenger &
Freight
0.3
0.8
0.3
21.3 29.4
14.7
17.1
80
Unit: Millions of Tons
5
10
0.5
2.6
0.5
52.9 59.3
28.1
48.1
80
Unit: Millions of Tons
5
10
Projected Intermodal Growth
2013
2040

Trends: Implications for California
» Reduced pressure on capacity in near-term: » Opportunity to explore new
markets/revenue sources for rail
» Projected intermodal growth and need to target/preserve capacity
» Partnerships are important to preserve market share for California ports

Trade Corridor Improvements
Map Key (Rail Subdivision) 5. UPRR Martinez (Oakland to
Martinez) 6. Southern Oakland Route
(Oakland to Niles Junction) 7. BNSF Mainline Stockton to
Bakersfield (San Joaquin Corridor)
8. UP Roseville to Reno over Donner Pass

Trade Corridor Improvements
Map Key (Rail Subdivision) 1. BNSF San Bernardino (LA-
San Bernardino via Fullerton & Riverside)
2. BNSF Cajon (Barstow to Keenbrook)
3. UPRR Sunset Route (Yuma Subdivision)
4. UPRR Alhambra and Los Angeles

Freight System Opportunities

Program Effects

Shifting from Highway to Railway
» The 2040 Vision projects 88 million daily passenger miles diverted to rail from highways
» Increase of 92 million daily passenger miles
» More trips on rail means: » Fewer hours lost
commuting » Less damage to roads » More efficient travel for
goods and people

» Results show moderate increase in rail ridership demand due to population growth
» However, market potential for networked services is unrealized
Rail Plan Vision: Ridership County to
County Draw Loads

32
» Result of integration and HSR shows huge increase in rail ridership demand
» Satisfies a large market potential for networked services
Rail Plan Vision: Ridership – Market Potential
County to County
Draw Loads

Changes in rolling stock
Changes in speed
Changes in turnaround time
Changes in travel distances
Driving Operating & Maintenance Costs Down

Comparing Metrics – Existing v. 2040 (Draft Results)
$0.00
$0.05
$0.10
$0.15
$0.20
2015 2040
Cost per Seat Mile
2015 2040
Cost per Train Mile
45%
65%
All costs are in 2015$

Improving Safety
» Passenger rail is already far safer than driving
» Positive Train Control – Prevents train-to-train
collisions
– Monitors train speed
– Stops trains in emergency
» Improving at-grade crossings and grade separations
» Coordinated with State and Federal regulatory partners

Improving Safety
» The 2040 Vision projects a reduction of more than 74 million vehicle miles traveled per day
» Can potentially eliminate
250 fatalities and 19,000 transportation related injuries by 2040.

Mitigation and Adaptation » State greenhouse gas emissions targets:
» 80 percent reduction from 1990 levels by 2050 » The Rail Plan helps hit these goals and build in resiliency
» Emergency Preparedness » Sea level rise adaptation
» Raising track » Relocation of rail lines to higher ground » Implementing water barriers such as dykes and berms

Advancing Sustainability and Livability
» High-speed rail will be fully electrified, and powered by 100% renewable energy reduced GHG and other pollutant emissions
» Eliminate the equivalent of over 13 million metric tons of CO2 annually
» Zero and near-zero emission locomotives
CO2 per Passenger Mile (in grams)
Highway
Base 2040 Vision
Rail
2,000
1,000
200
Provide alternative to truck transport of containerized cargo
Offer a convenient and reliable
alternative to private vehicle travel
Reduce greenhouse gas emissions
Mitigate roadway congestion
Reduce vehicle emissions
Increase electric and zero
emission trains

Supporting Sustainable Communities
» Rail is a spatially efficient mode » Lends itself to efficient land use » Compact development around
stations spares rural land and open space from development
» Creates many more connection and access points along the system
» Successful station area planning can: » Maximize ridership » Eliminate first/last mile challenges » Integrate statewide services

Moving Goods and Enhancing the Economy
» $40.8 billion of direct expenditures
» Direct Economic Benefits: » 463,000 full time jobs
» $28 billion in labor income
» $77.5 billion in new State economic output by 2040
» Nearly two dollars for every dollar invested

Implementation
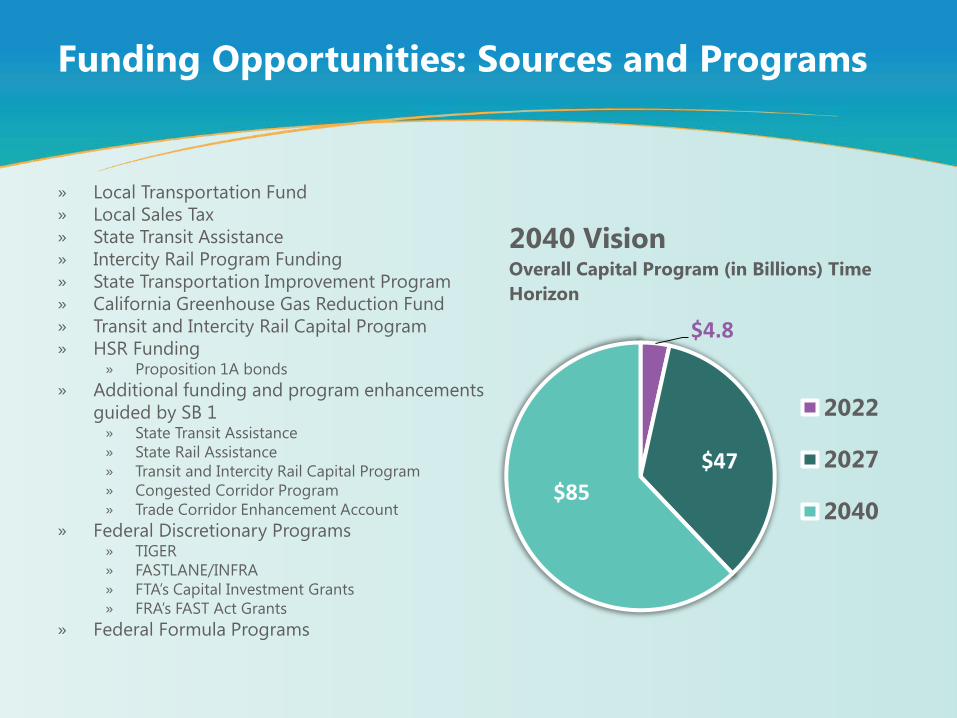
» Local Transportation Fund » Local Sales Tax » State Transit Assistance » Intercity Rail Program Funding » State Transportation Improvement Program » California Greenhouse Gas Reduction Fund » Transit and Intercity Rail Capital Program » HSR Funding
» Proposition 1A bonds » Additional funding and program enhancements
guided by SB 1 » State Transit Assistance » State Rail Assistance » Transit and Intercity Rail Capital Program » Congested Corridor Program » Trade Corridor Enhancement Account
» Federal Discretionary Programs » TIGER » FASTLANE/INFRA » FTA’s Capital Investment Grants » FRA’s FAST Act Grants
» Federal Formula Programs
$4.8
$47 $85
2040 Vision Overall Capital Program (in Billions) Time Horizon
2022
2027
2040
Funding Opportunities: Sources and Programs
Investment Strategy
Principles used to prioritize investment are under development, and include, but are not limited to:
» Services Tailored to Market Demand » Minimize Freight Interference » Avoid Duplication of Services and Investments » Minimize “Throw-Away” Interim Investments

Implementation Goals: A Phased Approach
» Rail Freight: Address ports & existing trade corridor bottlenecks » Improving & integrating passenger rail network » Caltrain electrification » High speed rail “Valley-to-Valley” corridor segments » Expanding service to Salinas and Larkspur » Early integrated ticketing investments » Service Implementation Planning
2022 Highlights
The 2022 Short-Term represents funded and committed improvements now enhanced by SB 1 funding programs.

Implementation Goals: A Phased Approach
» Rail Freight: » Dedicated Rail Freight Investment » Shared Corridor Investment
» High speed rail Central Valley to Silicon Valley » Integrating regional & intercity rail with HSR » Maximizing existing rail corridor capacity » Expanding service to SF Transbay Terminal, Yuba City, Merced,
Redlands, Coachella Valley, Las Vegas » Full implementation of integrated ticketing
2027 Highlights
The 2027 Mid-Term Plan - Phasing of the Long Term Vision to fully utilize existing corridors, supported by the funding capacity in SB 1

Implementation Goals: A Phased Approach
» Rail Freight: » Full Realization of Trade Corridor Improvements » Investments in Shared Corridors » Interregional Transportation Corridor Investments
» High Speed Rail from Anaheim to San Francisco » High Speed Rail Connections: Sacramento, Inland Empire, San Diego » New Transbay Crossing: Sacramento - San Francisco - San Jose » New regional services - Central Valley, Central Coast, & North Bay » Expanding network capacity & intensifying existing services
2040 Highlights
The 2040 Vision represents the full build-out of the long-term planning goals for the integrated statewide rail network.

Next Steps & Opportunities to Comment
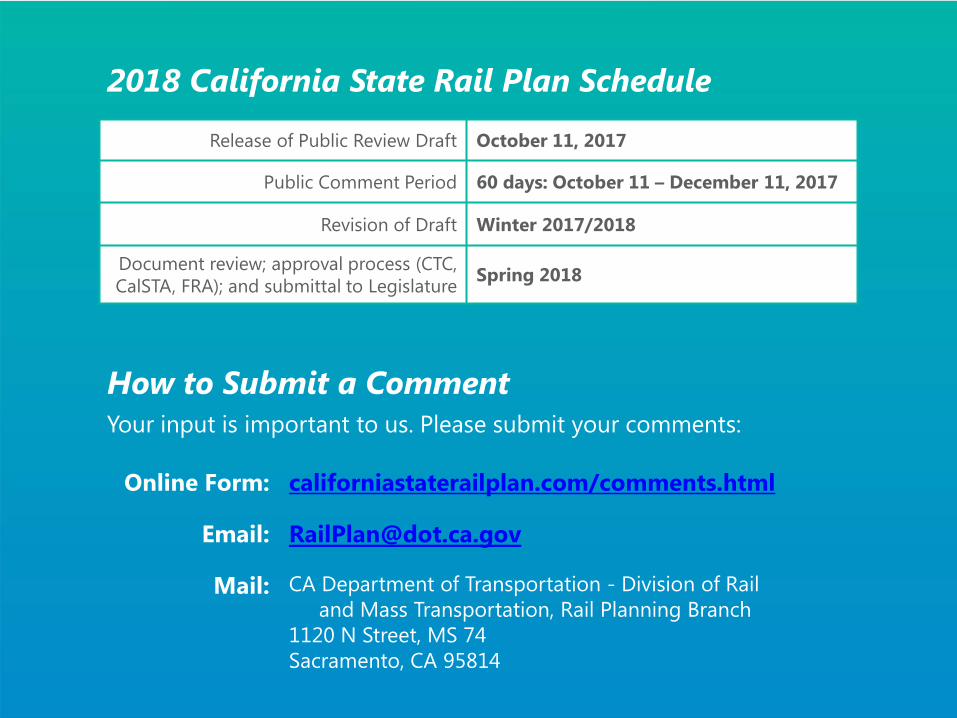
Release of Public Review Draft October 11, 2017
Public Comment Period 60 days: October 11 – December 11, 2017
Revision of Draft Winter 2017/2018
Document review; approval process (CTC, CalSTA, FRA); and submittal to Legislature Spring 2018
2018 California State Rail Plan Schedule
How to Submit a Comment Your input is important to us. Please submit your comments:
Online Form: californiastaterailplan.com/comments.html
Email: [email protected]
Mail: CA Department of Transportation - Division of Rail and Mass Transportation, Rail Planning Branch
1120 N Street, MS 74 Sacramento, CA 95814

Questions?


