Embed Size (px)
Citation preview

MAGNA INTERNATIONAL INC.
Annual Report2018

In a time of transformation, Magna continues to be a signifi cant force
in the global auto industry because of our agility, collective expertise
and technologies that will pave the way for future mobility.
Our strategic decisions today prepare us for future industry changes
by leveraging partnerships and evolving the organization, all while
continuing to grow the company and create shareholder value.
MAKING A DIFFERENCE
KEY FIGURES AT-A-GLANCE
1 2017 fi gures adjusted for adoption of the new revenue standard (Accounting Standards Codifi cation 606). 2 Return on Equity and Return on Invested Capital are non-GAAP fi nancial measures. Defi nitions and reconciliations to the most directly comparable fi nancial measures calculated in accordance with U.S. GAAP,
can be found in the Company’s Annual Report for the Year Ended December 31, 2018, in the Management’s Discussion and Analysis of Results of Operations and Financial Position section. The Magna International Inc. 2018 Annual Report has been posted on the Company’s website through the investors link at www.magna.com.
3 A two-for-one stock split was approved February 24, 2015. Dividends are shown on a post-stock split basis.
In a time of transformation, Magna continues to be a signifi cant force
in the global auto industry because of our agility, collective expertise
and technologies that will pave the way for future mobility.
Our strategic decisions today prepare us for future industry changes
by leveraging partnerships and evolving the organization, all while
continuing to grow the company and create shareholder value.
2017 2018
SALES1
U.S. $ MILLIONS
36,588
11%
15% COMPOUND AVERAGEGROWTH RATE
2017 2018
CASH FLOW FROM OPERATING ACTIVITIES1
U.S. $ MILLIONS
3,346
20172016 201820152014
DIVIDENDS PAID PER SHARE3
U.S. $
0.760.88
1.001.10
2017 2018
DILUTED EPS1
U.S. $
5.87
2017 2018
RETURN ON EQUITY1,2
19.8%
2017 2018
RETURN ON INVESTED CAPITAL1,2
15.6%
13%12%
40,827
1.32
14.9%
6.61 3,718
19.7%

M E S S A G E F R O M T H E C H I E F E X E C U T I V E O F F I C E R
In a time of transformation in the auto industry, Magna is a mobility technology company with world-class manufacturing operations, innovative products and the best people in the business, all of which help pave the way for continued success.
In 2018, we delivered strong results while positioning the company for growth in a rapidly changing market. In an industry that is one of the most complex and highly regulated, we are a valued partner to automakers and technology startup companies.
Our company of entrepreneurial-minded employees continues to anticipate the changing needs of the $1-trillion global automotive supply business by developing advanced technologies, creating partnerships that leverage each other’s capabilities, and driving change in a disruptive era.
In the coming years, we will compete in a challenging environment, with signifi cant technological and regulatory disruption and economic uncertainty. At the same time, we will continue to take full advantage of the huge opportunities for growth in lightweighting, electrifi cation, autonomy, and smart mobility. Magna has helped to transform how the world moves in the last 61 years. We will continue on that path as we help defi ne and create the future of mobility.
Leading Change in an Evolving Industry
Don WalkerChief Executive Of� cer
“ Our company of entrepreneurial-minded
employees continues to anticipate the
changing needs of the $1-trillion global
automotive supply business by developing
advanced technologies, creating partnerships
that leverage each other’s capabilities,
and driving change in a disruptive era.”
348Manufacturing/Assembly Facilities
28Countries
91Engineering/Product Development/Sales Centres
174,000+ Employees
$40.8 B Sales

and MilestonesStrategic Moves
World Class ManufacturingWe help launch new vehicles amounting to billions of dollars each year. Thirty-six Magna divisions in North America alone contributed parts to help successfully launch the redesigned 2019 Chevrolet Silverado and GMC Sierra pickup trucks, one of the biggest product rollouts of the year. Additionally, we continue to build our complete vehicle business with multiple car brands, including Mercedes-Benz, BMW, Jaguar and Toyota. To date, we have produced more than 3.5 million vehicles for various customers.
Process InnovationAs we continue to deliver new advanced technologies, we innovate how we produce them. Magna manufacturing experts accelerate smart manufacturing through processes that are rolling out across a number of our global facilities including new manufacturing cells with advanced artifi cial intelligence robotic systems that use state-of-the-art vision systems. We leverage new wearable technology to increase effi ciency and help technicians troubleshoot faster. And we continue to bring more virtual reality technologies to simulate crash tests, maximize fl oor space and enhance ergonomics.
Product InnovationWe continue to win business in core product areas from body structures to latches and electronics to powertrain. We announced new seating business with Geely’s LYNK & Co in China and BMW in the Czech Republic. Daimler introduced an industry-fi rst augmented reality navigation system on its new Mercedes-Benz A-Class that’s powered by Magna’s forward-facing camera. We also unveiled a
new composite liftgate with Jeep that reduces mass by 28% and is the highest volume production program utilizing this technology. In total, we have now produced more than 3 million thermoplastic liftgate modules.
Our People and CultureOur Fair Enterprise culture strikes a balance among the needs of our key stakeholders including our employees, customers and shareholders. We operate in a decentralized, entrepreneurial, performance-based environment that empowers our people. We take pride in knowing that our culture is a competitive advantage and we continue to be recognized as an employer of choice. Magna was named by Fortune as one of the World’s Most Admired Companies and by Forbes on their Most Admired Companies and Canada’s Best Employers for Diversity lists.
Global Footprint ExpansionWe continued to expand our geographic footprint in 2018. Three new joint ventures in China will help increase our presence in the world’s largest new vehicle market. They include an engineering joint venture with BJEV, a subsidiary of the BAIC Group, to design a battery electric vehicle architecture for the Chinese market.
Additionally, we expect to complete a second joint venture with BJEV to assemble electric vehicles (EVs) in China, at our fi rst vehicle production facility outside of Europe.
We also expanded our complete vehicle engineering services for the European market with a new partnership with Altran in Morocco.
28Countries

“ We anticipate that 2019 will be another
good year with strong sales, solid earnings
and increased free cash fl ow5, all as we
continue to invest for the future.”
Vince Gali� Chief Financial Of� cer
Magna has an unmatched breadth of vehicle product and process technologies and we remain uniquely positioned to capitalize on industry trends. These include increasing emission requirements that are driving the need for more electrifi ed powertrains and lightweight solutions as well as the demand for active safety systems and the evolution toward fully autonomous vehicles.
In 2018, we turned in another strong fi nancial performance, posting records in sales, equity income, Adjusted EBIT4, net income attributable to Magna, diluted earnings per share and cash from operating activities, among other metrics. We announced a number of strategic developments during the year including the divestiture of our Fluid Pressure & Controls business for $1.23 billion.
We also returned $2.28 billion to shareholders through $1.83 billion in share repurchases and $448 million in dividends, while also investing $1.65 billion in fi xed
assets. In addition, we recently raised our quarterly cash dividend by 11%, the 10th consecutive annual dividend increase.
Going forward, we see continued growth in each of our reporting segments driven in particular by demand for our suite of lightweighting solutions, dual-clutch transmissions, Advanced Driver Assistance Systems (ADAS), electrifi ed products, seats, mechatronic products and complete vehicle assembly. We anticipate that 2019 will be another good year with strong sales, solid earnings and increased free cash fl ow5, all as we continue to invest for the future.
Bullish on the Future
M E S S A G E F R O M T H E C H I E F F I N A N C I A L O F F I C E R
4 Adjusted EBIT is a non-GAAP fi nancial measure. A defi nition and reconciliation of Adjusted EBIT to the most comparable fi nancial measure calculated in accordance with U.S. GAAP, can be found in the Company’s Annual Report for the Year Ended December 31, 2018, in the Management’s Discussion and Analysis of Results of Operations and Financial Position section. The Magna International Inc, 2018 Annual Report has been posted on the company’s website through the investors link at www.magna.com.
5 Free cash fl ow is a non-GAAP fi nancial measure. Free cash fl ow represents cash from operating activities plus proceeds from normal course dispositions of fi xed and other assets minus capital spending minus investments in other assets.

BREADTH OF CAPABILITIES No other supplier has Magna’s completevehicle systems knowledge, which includes:
Body & Chassis • Exteriors • Powertrain • Electronics • Mirrors • Lighting • Seating •Mechatronics • Vehicle Engineering & Manufacturing
Invest for Growth We expect our free cash fl ow5 to exceed $6.5 billion in the 2019-2021 time frame.This will allow us to continue to invest in organic opportunities, increase innovation spending and seek potential acquisitions that fi t our product strategy.
Strategic Startup PartnershipsBecause Magna has deep product expertise as well as complete vehicle engineering and assembly operations, startup companies are turning to us to help speed up the commercialization of new mobility solutions including autonomous vehicles. Our collaboration with Lyft, where we are co-located in a new facility in Silicon Valley, has grown to over 300 engineers. The joint team has successfully completed a continuous 10-week public autonomous ride-sharing program with Lyft employees. Additionally, Waymo recently announced they will use Magna to integrate their self-driving system into a fl eet of diff erent vehicles.
Reimagining the Vehicle Experience Ride sharing and self-driving cars will radically change the way we use vehicle interiors. Magna’s reconfi gurable seating solutions are designed to re-imagine the vehicle cabin and make seating a changing environment depending on actual usage. Two of our new seating modes could be ready to enter production as early as 2022.
Innovative Features for Automated DrivingToday, more than 100 vehicle models on the road have Magna ADAS features, including our award-winning Trailer Angle Detection, an option being ordered on 80% of Ford F-150 trucks. We continue to deliver new autonomous features including Valet Park driver monitoring systems and 3D Surround View, which meet the growing demand from automakers seeking to integrate advanced, innovative, and safer automated driving technologies into their vehicles.
Supplying Power to the WheelsOur knowledge of complex powertrains comes from our transmission and driveline leadership position. Combined with our experience in full electric vehicles and plug-in hybrid electric vehicle (PHEV) systems, we have the basis for key scalable building-blocks for powertrain variants needed going forward, including the path to full electrifi cation.
Expanding Portfolio We enhanced our product portfolio to incorporate additional innovative technologies and match high-growth segments of the market. A 2018 joint venture with startup Rohinni will produce lighting possibilities that go beyond conventional LEDs. We also boosted our portfolio with acquisitions including OLSA, which expands our capability to design innovative lighting products, and VIZA, a move that enhances our seat-structure expertise. The acquisition of Haptronik gives us advanced motion-control software for power doors, a critical building-block for our future in mechatronics.
Positioning forthe Future

M E S S A G E F R O M T H E C H I E F T E C H N O L O G Y O F F I C E R
Accelerating the Mobility RevolutionAs the global auto industry races toward a new era in mobility, our goal is to leverage more than 60 years of experience designing and developing new technology to help our customers striving to change the entire vehicle experience, not just a few components.
Our vision of the future is where electrifi cation, autonomy and smart mobility are all intertwined. Vehicles today have become high-tech wonders, a cornerstone for the Internet of Things revolution. That is why we believe vehicles don’t just have technology, vehicles are technology.
That mindset helps drive our product strategy to meet the needs of the market today, while positioning Magna for the future. Our strategy includes a building-block approach to technology that leverages our deep systems knowledge, the ability to auto-qualify technologies from other industries, and an entrepreneurial culture that helps keep us at the forefront of possibilities.
We innovate like a startup and think like a technology company, which helps us anticipate the changing needs of the marketplace and be in a position to respond quickly. We research, validate and develop technologies that the consumer doesn’t even know they need. Additionally, we demonstrate the value of partnerships to pool resources and knowledge to attack challenges that can best be solved through collaboration.
We achieved several important milestones in 2018 and will continue to cultivate innovation and leverage our strengths as we continue to develop the roadmap to the future.
“ Our strategy includes a building-block
approach to technology that leverages
our deep systems knowledge, the ability
to auto-qualify technologies from other
industries, and an entrepreneurial culture
that helps keep us at the forefront of
possibilities.”
Swamy KotagiriChief Technology Of� cer
2,400+Startups Evaluated
13,000+ Engineers
22University Engagements

InnovationThe Power of
Collective Expertise: Deep Systems Knowledge With our expertise across the entire vehicle, Magna has the ability to develop technological advancements at an accelerated pace.
Across all of our product areas we create solutions that improve safety, drive powertrain innovations, boost occupant experience, and lead manufacturing into the future.
Some of our collaborative eff orts include:
• A multi-faceted approach to developing distinctive, high-performing micro LED lighting solutions that can be used in a variety of applications including exterior styling, seating controls and tail lights.
• Combining our electronics and powertrain expertise to develop products fi tting a variety of 48-volt mild-hybrid drivetrain architectures, reducing CO2 emissions by up to 15%.
• Developing driver monitoring systems and autonomous driving Level 2+ features that improve safety and further enable autonomy.
• Leveraging our body structures and exteriors capabilities to develop a best-in-class multi-material battery enclosure.
Agility and Entrepreneurial MindsetOur culture allows us to respond to changing market demands and gives Magna a competitive advantage as our entrepreneurial-minded people develop innovative solutions.
A prime example is our high-defi nition iCON RADAR™ that sets a new standard in high-resolution automotive radar. With a range of more than 300 metres, iCON RADAR helps close the gap between Level 3 and Level 5 to reach full reliable autonomous driving.
Positioned for Future MobilityMagna stands ready in electrifi cation and autonomy as we assemble the building-blocks of future mobility. We accomplish this by developing core competencies in-house at an accelerated pace and partnering with some of the best minds including startups, entrepreneurs, universities and technical specialists for technological advancements.
By combining the technical focus and agility of startups with the global volume production and vehicle experience of Magna, we can develop, auto-qualify and commercialize technologies in far less time.

DRIVEN PEOPLE.DRIVING CHANGE.
Putting STEM FIRST Magna is proud to sponsor FIRST Robotics competitions at the organization level as well as dozens of individual teams. For more than a decade, Magna has volunteered, mentored, and led various FIRST robotics teams and programs that have fueled its growth and engaged thousands of students from across the globe.
A Step in the Right Direction Each year, more than 2,000 Magna employees from 13 countries support World Vision’s 6k Walk for Water. The one-day, worldwide event unites thousands of people who run and walk to help bring clean water to those in need. In 2017 and 2018, Magna employees raised more than $750,000 USD.
A Sustainable Approach Our conservation awards include one from Enbridge Gas Distribution of Canada, which recognized Magna for 16 energy effi cient
projects that achieved an annual natural gas savings
of 2.75 million cubic metres, the carbon emission equivalent
of planting more than 1,600 trees.
We are continuously improving manufacturing processes at our plants to reduce their impact on the environment in key areas, including water and energy. Additionally, as part of Magna in Action, our employees around the world contribute to their communities, volunteering thousands of hours and donating to a wide range of social projects, from World Vision to Special Olympics. Magna-sponsored STEM (Science, Technology, Engineering and Math) programs, including student robotics and college-level racing events, have made math and science exciting to more than 100,000 students around the world.

Financial
)
Review 2018and Other Information
2 Management's Discussion and Analysis of Results of Operationsand Financial Position
32 Reports of Independent Registered Public Accounting Firm
34 Consolidated Statements of Income
35 Consolidated Statements of Comprehensive Income
36 Consolidated Balance Sheets
37 Consolidated Statements of Cash Flows
38 Consolidated Statements of Changes in Equity
39 Notes to Consolidated Financial Statements
71 Supplementary Financial and Share Information
Corporate Directory (inside back cover
Magna International Inc.

DECEMBER 31, 2018
MAGNA INTERNATIONAL INC.
Management’s Discussion andAnalysis of Results of Operationsand Financial Position
Unless otherwise noted, all amounts in this Management’s Discussion and Analysis of Results of Operations and
Financial Position [‘‘MD&A’’] are in U.S. dollars and all tabular amounts are in millions of U.S. dollars, except per share
figures, which are in U.S. dollars. When we use the terms ‘‘we’’, ‘‘us’’, ‘‘our’’ or ‘‘Magna’’, we are referring to Magna
International Inc. and its subsidiaries and jointly controlled entities, unless the context otherwise requires.
This MD&A should be read in conjunction with the audited consolidated financial statements for the year ended
December 31, 2018. The most recent updates to our accounting policies, including the impact of the adoption of
Accounting Standards Codification 606 – Revenue from Contracts with Customers, can be found in Note 2 of our
audited consolidated financial statements for the year ended December 31, 2018.
We announced a realignment of our management structure along product lines in December 2017. As a result,
effective January 1, 2018, our results are reported through the following business segments: Body Exteriors &
Structures, Power & Vision, Seating Systems and Complete Vehicles. Prior period amounts contained in this MD&A
have been adjusted to conform to the new segment presentation. Refer to Note 24 of our audited consolidated
financial statements for the year ended December 31, 2018 for additional information.
This MD&A contains statements that are forward looking. Refer to the ‘‘Forward-Looking Statements’’ section in this
MD&A for a more detailed discussion of our use of forward-looking statements.
This MD&A has been prepared as at March 7, 2019.
2 ANNUAL REPORT 2018

USE OF NON-GAAP FINANCIAL MEASURES
We posted record sales, net income attributable to Magna, equity income, diluted earnings per share, and cash from operating activities in 2018.
Total sales increased 12% to $40.8 billion in 2018, compared to $36.6 billion in 2017. Our sales growth largely reflects the launch of new programs
and the strengthening of a number of foreign currencies against the U.S. dollar. Our 12% increase in sales substantially outperformed global vehicle
production, which was essentially level in 2018 as compared to 2017. All of our operating segments reported record sales and outgrew global vehicle
production.
· Body Exteriors & Structures sales increased 6% to $17.5 billion.
· Power & Vision sales increased 6% to $12.3 billion.
· Seating Systems sales rose 6% to $5.5 billion.
· Complete Vehicles sales grew 70% to $6.0 billion.
Diluted earnings per share and adjusted diluted earnings per share were $6.61 and $6.71, respectively, and both increased 13% compared to 2017.
The increases largely reflect an increase in net income and a reduced share count primarily as a result of share repurchases.
Included in Other expense, net in 2018 is an impairment charge of $60 million ($59 million after tax) related to our investment in a transmission joint
venture in Europe with Ford Motor Company. The impairment reflects the expected further industry volume decline in manual transmissions, which
make up substantially all of the volume production in the joint venture.
Cash from operating activities was $3.7 billion, higher than our previous record from 2017 of $3.3 billion.
We further invested for our future, including:
· $1.7 billion for fixed assets;
· $481 million in investment and other asset spending;
· $220 million in Lyft, with whom we have entered a multi-year collaboration to fund, develop and manufacture self-driving systems; and
· $152 million to acquire OLSA, which will expand our lighting capabilities to enable us to design, engineer and manufacture headlamps, tail lamps
and other lighting products in every key region of the world.
We announced our intention to form two new joint ventures with Beijing Electric Vehicle Co. Ltd, a subsidiary of BAIC Group, for complete vehicle
manufacturing as well as engineering of electric vehicles. The engineering joint venture was formed before the end of 2018. The manufacturing joint
venture is expected to take over an existing BAIC manufacturing facility in Zhenjiang, China with capacity to build up to 180,000 vehicles per year.
We announced that we had signed an agreement to sell our Fluid Pressure & Controls business for $1.2 billion, before the assumption of net debt and
pension liabilities at closing, and subject to customary closing adjustments for net working capital. The transaction is expected to close at the end of
the first quarter of 2019.
We returned $2.3 billion to shareholders in 2018 through $1.8 billion in share repurchases and $448 million in dividends.
Our Board of Directors increased our quarterly dividend by 11% to $0.365 per share reflecting continued confidence in Magna’s future.
In addition to results presented in accordance with accounting principles generally accepted in the United States of America [‘‘U.S. GAAP’’], this report
includes the use of Adjusted EBIT, Adjusted EBIT as a percentage of sales, Adjusted diluted earnings per share, Return on Invested Capital and Return
on Equity [collectively, the ‘‘Non-GAAP Measures’’]. We believe these non-GAAP financial measures provide additional information that is useful to
investors in understanding our underlying performance and trends. Readers should be aware that Non-GAAP Measures have no standardized meaning
under U.S. GAAP and accordingly may not be comparable to the calculation of similar measures by other companies. We believe that Return on
Invested Capital and Return on Equity are useful to both management and investors in their analysis of our results of operations and reflect our ability to
generate returns. Similarly, we believe that Adjusted EBIT, Adjusted EBIT as a percentage of sales and Adjusted diluted earnings per share provide
useful information to our investors for measuring our operational performance as they exclude certain items that are not reflective of ongoing operating
profit or loss and facilitate a comparison of our performance with prior periods. The presentation of any Non-GAAP Measures should not be considered
in isolation or as a substitute for our related financial results prepared in accordance with U.S. GAAP. Non-GAAP financial measures are presented
together with the most directly comparable GAAP financial measure, and a reconciliation to the most directly comparable GAAP financial measure, can
be found in the ‘‘Non-GAAP Financial Measures Reconciliation’’ section of this MD&A.
HIGHLIGHTS
•
•
•
•
•
•
•
•
•
•
FORWARD-LOOKING STATEMENTS
Certain statements in this MD&A constitute ‘‘forward-looking information’’ or ‘‘forward-looking statements’’ (collectively, ‘‘forward-looking statements’’)
and are intended to provide information about management’s current expectations and plans. Such forward-looking statements may not be
appropriate for other purposes. Forward-looking statements may include financial and other projections, as well as statements regarding our future
plans, objectives or economic performance, or the assumptions underlying any of the foregoing, and other statements that are not recitations of
historical fact. We use words such as ‘‘may’’, ‘‘would’’, ‘‘could’’, ‘‘should’’, ‘‘will’’, ‘‘likely’’, ‘‘expect’’, ‘‘anticipate’’, ‘‘believe’’, ‘‘intend’’, ‘‘plan’’, ‘‘aim’’,
‘‘forecast’’, ‘‘outlook’’, ‘‘project’’, ‘‘estimate’’, ‘‘target’’ and similar expressions suggesting future outcomes or events to identify forward-looking
statements. Our forward-looking statements are based on information currently available to us, and are based on assumptions and analyses made by
us in light of our experience and our perception of historical trends, current conditions and expected future developments, as well as other factors we
believe are appropriate in the circumstances. Forward-looking statements in this MD&A include, but are not limited to discussions related to the
implementation of our business strategy.
MAGNA INTERNATIONAL INC. 3

OUR BUSINESS(1)
industry-wide focus on solutions aimed at reducing vehicle fuel consumption and carbon dioxide/greenhouse gas emissions, which is being driven
in large part by governmental regulation;
accelerating demand for hybrid and fully-electric vehicles;
continued growth in demand for vehicle safety features and products;
increased investment and expenditure on autonomous driving technologies and vehicle electrification;
the growth of new OEMs, particularly in China;
growth of potential industry disruptors offering ‘‘mobility-as-a-service’’ [‘‘MaaS’’] business models, including in areas such as ride-hailing and
ride sharing;
expansion of cooperative alliances among OEMs and, increasingly, between OEMs and MaaS market entrants;
efforts by the Chinese government to increase engineering, development and manufacturing of high-value, high-tech products in China, as reflected
in the Chinese central government’s ‘‘Made in China 2025’’ initiative; and
emergence of ‘‘new’’ low-cost automotive manufacturing markets, such as Vietnam and Morocco.
While we believe we have a reasonable basis for making such forward-looking statements, they are not a guarantee of future performance or outcomes.
Whether actual results and developments conform to our expectations and predictions is subject to a number of risks, assumptions and uncertainties,
many of which are beyond our control, and the effects of which can be difficult to predict, including the risk factors which are described later in
this MD&A.
OVERVIEW
We are a mobility technology company that is helping pave the way to the future with innovative products and processes. We have more than
174,000 entrepreneurial-minded employees and 348 manufacturing operations and 91 product development, engineering and sales centres in
28 countries. Our competitive capabilities include body exteriors and structures, power and vision technologies, seating systems and complete vehicle
solutions. Our common shares trade on the Toronto Stock Exchange (MG) and the New York Stock Exchange (MGA).
INDUSTRY TRENDS
Our operating results are primarily dependent on the levels of North American, European and Chinese car and light truck production by our customers.
While we supply systems and components to every major original equipment manufacturer [‘‘OEM’’], we do not supply systems and components for
every vehicle, nor is the value of our content consistent from one vehicle to the next. As a result, customer and program mix relative to market trends, as
well as the value of our content on specific vehicle production programs, are important drivers of our results.
OEM production volumes are generally aligned with vehicle sales levels. Overall vehicle sales levels are significantly affected by changes in consumer
confidence levels, which may in turn be impacted by consumer perceptions and general trends related to the job, housing and stock markets. Other
factors impacting vehicle sales levels, and thus production volumes in North America, Europe and China, include: interest rates and/or availability of
credit; fuel and energy prices; relative currency values; and other factors.
In addition to vehicle sales levels, production volumes in different regions may be impacted by a range of factors which vary from one region to the next,
including: general economic and political conditions; free trade arrangements; tariffs; relative currency values; commodities prices; supply chains and
infrastructure; availability and relative cost of skilled labour; and regulatory considerations, including those related to environmental emissions and
safety standards; and other factors.
While the foregoing economic, political and other factors are part of the general context in which the global automotive industry operates, there have
been a number of significant industry trends that are shaping the future of the industry and creating opportunities and risks for automotive suppliers.
These trends include:
•
•
•
•
•
•
•
•
•
We continue to implement a business strategy which is rooted in our best assessment as to the rate and direction of change in the automotive industry,
including with respect to trends related to vehicle electrification and autonomy, as well as MaaS. For example, to support our customers’ needs for
solutions which improve the fuel efficiency and reduce CO2 emissions of their vehicles, we are focused on delivering lightweight products and
materials, efficient transmissions and active aerodynamics, as well as hybrid/electric drive systems. Additionally, we are building on our market
leadership in camera-based advanced driver assistance systems [‘‘ADAS’’], to provide driving solutions incorporating cameras, radar, LiDAR
(for advanced applications) and domain controllers, which can be scaled to offer greater levels of automated driving functionality. We are also working
with traditional OEMs and MaaS market entrants on potential new mobility solutions which leverage our complete vehicle know-how, potentially
including our complete vehicle assembly expertise.
Our short- and medium-term operational success, as well as our ability to create long-term value through our business strategy, are subject to a
number of risks and uncertainties which are discussed later in this MD&A.
(1) Manufacturing operations, product development, engineering and sales centres and employee figures include certain operations accounted for under the equity method.
4 ANNUAL REPORT 2018

8MAR201904312877
AVERAGE FOREIGN EXCHANGE
SALES
RESULTS OF OPERATIONS
For the year
ended December 31,
2018 2017 Change
1 Canadian dollar equals U.S. dollars 0.771 0.771 –
1 euro equals U.S. dollars 1.181 1.130 + 5%
1 Chinese renminbi equals U.S. dollars 0.151 0.148 + 2%
The preceding table reflects the average foreign exchange rates between the most common currencies in which we conduct business and our
U.S. dollar reporting currency. The changes in these foreign exchange rates for the year ended December 31, 2018 impacted the reported U.S. dollar
amounts of our sales, expenses and income.
The results of operations for which the functional currency is not the U.S. dollar are translated into U.S. dollars using the average exchange rates in the
table above for the relevant period. Throughout this MD&A, reference is made to the impact of translation of foreign operations on reported U.S. dollar
amounts where relevant.
LIGHT VEHICLE PRODUCTION VOLUMES
Our operating results are mostly dependent on light vehicle production in the regions reflected in the table below:
Light Vehicle Production Volumes (thousands of units)
2018 2017 Change
North America 17,022 17,115 – 1%
Europe 22,572 22,383 + 1%
China 26,555 27,722 – 4%
RESULTS OF OPERATIONSFOR THE YEAR ENDED DECEMBER 31, 2018
Sales
2017
$36,588
2018
+ 12% $40,827
$30,000
$42,000
Sales increased 12% or $4.2 billion to $40.8 billion for 2018 compared to $36.6 billion for 2017, primarily as a result of the launch of new programs
during or subsequent to 2017, in particular in our Complete Vehicles, Body Exteriors & Structures, and Seating Systems businesses and a $601 million
increase in reported U.S. dollar sales as a result of the strengthening of the euro against the U.S. dollar, partially offset by the weakening of certain
foreign currencies against the U.S. dollar, including the Turkish lira and Brazil real.
These factors were partially offset by the impact of a change in production volumes on various other programs.
The changes in sales are discussed further in the ‘‘Segment Analysis’’ section of this MD&A.
MAGNA INTERNATIONAL INC. 5

COST OF GOODS SOLD
a $545 million net increase in reported U.S. dollar cost of goods sold primarily due to the strengthening of the Canadian dollar and Chinese renminbi
each against the U.S. dollar partially offset by the weakening of the Turkish lira, Brazilian real, and Russian ruble, each against the U.S. dollar;
higher launch costs;
higher spending associated with electrification and autonomy;
higher warranty costs of $47 million; and
higher pre-operating costs incurred at new facilities.
DEPRECIATION AND AMORTIZATION
SELLING, GENERAL AND ADMINISTRATIVE [‘‘SG&A’’]
foreign exchange gains in 2018 compared to foreign exchange losses in 2017;
a favourable settlement reached during 2018 relating to the acquisition of Getrag; and
lower costs to support our global compliance programs as a result of the substantial completion of our global review focused on antitrust risk.
higher labour and benefit costs;
increased costs incurred at new facilities;
spending associated with research & development;
a $16 million net increase in the reported U.S. dollar SG&A expense primarily due to the strengthening of the euro against the U.S. dollar partially
offset by the weakening of the Turkish lira and Brazilian real each against the U.S. dollar; and
a reduction in an indemnity receivable related to the acquisition of Getrag as a result of the favourable change in the reserve for uncertain tax
provisions at a certain equity accounted Power & Vision facility.
INTEREST EXPENSE, NET
EQUITY INCOME
net favourable commercial settlements during 2018 at certain Power & Vision facilities;
lower warranty costs at certain Power & Vision facilities;
a $6 million increase due to an acquisition in the fourth quarter of 2017; and
a $4 million net increase in reported U.S. dollar equity income mainly due to the strengthening of the Chinese renminbi and euro, both against the
U.S. dollar.
2018 2017 Change
Material $ 25,355 $ 22,034 $ 3,321
Direct labour 2,953 2,711 242
Overhead 6,747 6,150 597
Cost of goods sold $ 35,055 $ 30,895 $ 4,160
Cost of goods sold increased $4.2 billion to $35.1 billion for 2018 compared to $30.9 billion for 2017 primarily as a result of higher material, overhead
and direct labour costs associated with the increase in sales. In addition, cost of goods sold increased due to:
•
•
•
•
•
Depreciation and amortization costs increased $94 million to $1.28 billion for 2018 compared to $1.18 billion for 2017. The higher depreciation and
amortization was primarily a result of increased capital deployed mainly to support the launch of new programs during or subsequent to 2017 and a
$20 million net increase in reported U.S. dollar depreciation and amortization mainly due to the strengthening of the euro against the U.S. dollar. These
factors were partially offset by lower depreciation on assets classified as held for sale which, as of September 2018, are no longer being amortized.
SG&A expense as a percentage of sales was 4.1% for 2018 compared to 4.6% for 2017. SG&A expense decreased $4 million to $1,664 million for 2018
compared to $1,668 million for 2017. The 0.5% decrease in SG&A expense as a percentage of sales was primarily due to an increase in sales in our
Complete Vehicles segment which has a lower SG&A expense as a percentage of sales than our consolidated average. The $4 million decrease in
SG&A expense was primarily due to:
•
•
•
These factors were partially offset by:
•
•
•
•
•
During 2018, we recorded net interest expense of $93 million compared to $70 million for 2017. The $23 million increase is primarily as a result of higher
interest expense due to the increase in borrowings and higher average interest rates partially offset by higher interest income.
Equity income increased $24 million to $277 million for 2018 compared to $253 million for 2017, primarily due to:
•
•
•
•
These factors were partially offset by reduced earnings due to lower sales at our Power & Vision facilities and by higher pre-operating costs incurred at a
new Power & Vision facility, which is accounted for under the equity method.
6 ANNUAL REPORT 2018

OTHER EXPENSE, NET
(1) Impairment of investment
(2) Restructuring
(3) Impairment of long-lived assets
(4) Unrealized gain on investment revaluation
(5) Gain on formation of a new venture
(6) Gain on sale of investment
INCOME FROM OPERATIONS BEFORE INCOME TAXES
During the years ended December 31, 2018 and 2017, we recorded other expense, net items as follows:
2018 2017
Net Income Diluted Net Income Diluted
Operating Attributable Earnings Operating Attributable Earnings
Income to Magna per Share Income to Magna per Share
Impairment of investment(1) $ 60 $ 59 $ 0.17 $ 17 $ 17 $ 0.05
Restructuring(2) 45 43 0.12 29 25 0.06
Impairment of long-lived assets(3) 14 12 0.04 64 64 0.17
Unrealized gain on investment revaluation(4) (56) (53) (0.15) – – –
Gain on formation of a new venture(5) – – – (45) (34) (0.09)
Gain on sale of investment(6) – – – (26) (26) (0.07)
Other expense, net $ 63 $ 61 $ 0.18 $ 39 $ 46 $ 0.12
During 2018, we recorded an impairment charge of $60 million [$59 million after tax] on our investment in Getrag Ford Transmission GmbH. The
impairment reflects the expected further industry volume decline in manual transmissions, which make up substantially all of the volume
production in the joint venture.
During 2017, we recorded an impairment charge of $17 million [$17 million after tax] on one of our equity method investments.
During 2018, we recorded net restructuring charges of $25 million [$23 million after tax] related to certain Body Exteriors & Structures facilities and
$20 million [$20 million after tax] related to certain Power & Vision facilities.
We recorded net restructuring charges during 2017 of $14 million [$14 million after tax] related to certain Power & Vision facilities and $15 million
[$11 million after tax] for a certain Body Exteriors & Structures facility.
During 2018, we recorded fixed asset impairment charges of $14 million [$12 million after tax] related to a certain Body Exteriors & Structures
facility.
We recorded fixed asset impairment charges during 2017 of $64 million [$64 million after tax] related to two Body Exteriors & Structures facilities.
During 2018, we recorded an unrealized gain of $56 million [$53 million after tax] on the revaluation of our private equity investments.
We formed a new venture in China with Hubei Aviation Precision Machinery Co., Ltd. during 2017. The transaction resulted in a gain of $45 million
[$34 million after tax].
Our investment in Argus Cyber Security Ltd. was sold during 2017 for proceeds of $33 million. A gain of $26 million [$26 million after tax] was
recognized on the sale of the investment, which was accounted for under the cost method.
Income from operations before income taxes decreased $34 million to $2.95 billion for 2018 compared to $2.99 billion for 2017. This decrease is the
result of a $4.2 billion increase in cost of sales, a $94 million increase in depreciation and amortization, a $24 million increase in other expense, net and a
$23 million increase in interest expense, net partially offset by a $4.2 billion increase in sales, a $24 million increase in equity income and a $4 million
decrease in SG&A, each as discussed above.
MAGNA INTERNATIONAL INC. 7

INCOME TAXES
2018 2017
Income Taxes as reported $ 619 21.0% $ 741 24.8%
Reassessment of Deferred Tax Balances 21 0.7 – –
Adjustments to Valuation Allowance 17 0.6 – –
Tax effect on Other expense, net 2 (0.4) (7) (0.6)
US Tax Reform (11) (0.4) 23 0.8
$ 648 21.5% $ 757 25.0%
In the third quarter of 2018, we entered into an agreement to sell our global Fluid Pressure & Controls [‘‘FP&C’’] business to Hanon Systems. We
reassessed our positions in deferred taxes in anticipation of closing the FP&C transaction in 2019, recognizing a $21 million net reduction in deferred
tax expense [‘‘Reassessment of Deferred Tax Balances’’].
During 2018 we released a portion of our valuation allowance against our deferred tax assets in India. The valuation allowance was required due to
historical losses and uncertainty as to the timing of when we would be able to generate the necessary level of earnings to recover these deferred tax
assets. Over the past few years, some of our operations in India have delivered sustained profits which, together with forecasted profits have allowed us
to release the valuation allowance set up against the India deferred tax assets. The effect of the valuation allowance release is a reduction in income tax
expense of $17 million [‘‘Adjustments to Valuation Allowance’’].
The Reassessment of Deferred Tax Balances and the Adjustments to Valuation Allowance [the ‘‘Deferred Tax Adjustments’’] totalled $38 million in 2018.
On December 22, 2017, the United States enacted the Tax Cuts and Jobs Act [the ‘‘US Tax Reform’’], which reduced the U.S. federal corporate tax rate
from 35% to 21% beginning in 2018, required companies to pay a one-time transition tax on earnings of certain foreign subsidiaries that were
previously tax deferred and created new taxes on certain foreign-sourced earnings. At December 31, 2017, we made a reasonable estimate of its
effects on our deferred tax balances and the one-time transition tax, recognizing a provisional $23 million net reduction in income tax expense. At
December 31, 2018, we have completed our analysis of the impact of the US Tax Reform and recorded a net increase in income tax expense of
$11 million.
Excluding Other expense, net, after tax, the Deferred Tax Adjustments and the effects of US Tax Reform, the effective income tax rate decreased to
21.5% for 2018 compared to 25.0% for 2017 primarily due to a reduction in the U.S. federal statutory rate beginning in 2018 as a result of the tax reform
in the U.S. Other items lowering the effective tax rate include a change in our reserves for uncertain tax positions and a decrease in losses not benefited
in Europe. These factors were partially offset by higher accrued tax on undistributed foreign earnings.
INCOME ATTRIBUTABLE TO NON-CONTROLLING INTERESTS
NET INCOME ATTRIBUTABLE TO MAGNA INTERNATIONAL INC.
Income attributable to non-controlling interests decreased $12 million to $36 million for 2018 compared to $48 million for 2017 primarily due to
decreased profits at certain Body Exteriors & Structures operations partially offset by increased profits at a Power & Vision operation.
Net income attributable to Magna International Inc. increased $100 million to $2.3 billion for 2018 compared to $2.2 billion for 2017, as a result of a
decrease in income taxes of $122 million and a decrease in income attributable to non-controlling interests of $12 million partially offset by a decrease
in income from operations before income taxes of $34 million, each as discussed above.
8 ANNUAL REPORT 2018

8MAR201905522232 8MAR201905521016
EARNINGS PER SHARE
Diluted earnings per share Adjusted diluted earnings per share
2017
$5.87
2018
+ 13%$6.61
$4.00
$7.00
2017
$5.93
2018
+ 13%$6.71
$4.00
$7.00
2018 2017 Change
Earnings per Common Share
Basic $ 6.65 $ 5.91 + 13%
Diluted $ 6.61 $ 5.87 + 13%
Weighted average number of Common Shares outstanding (millions)
Basic 345.4 371.8 – 7%
Diluted 347.5 373.9 – 7%
Adjusted diluted earnings per share $ 6.71 $ 5.93 + 13%
Diluted earnings per share increased $0.74 to $6.61 for 2018 compared to $5.87 for 2017 as a result of a decrease in the weighted average number of
diluted shares outstanding during 2018 and the increase in net income attributable to Magna International Inc. as discussed above. The decrease in the
weighted average number of diluted shares outstanding was primarily due to the purchase and cancellation of Common Shares, during or subsequent
to 2017, pursuant to our normal course issuer bids.
Other expense, net, after tax, Deferred Tax Adjustments and US Tax Reform together negatively impacted diluted earnings per share by $0.10 in 2018
and negatively impacted diluted earnings per share by $0.06 in 2017, as discussed in the ‘‘Other expense, net’’ and ‘‘Income Taxes’’ sections.
Adjusted diluted earnings per share, as reconciled in the ‘‘Non-GAAP Financial Measures Reconciliation’’ section, increased $0.78 to $6.71 for 2018
compared to $5.93 for 2017.
MAGNA INTERNATIONAL INC. 9

8MAR201905373251
ADJUSTED EBIT AS A PERCENTAGE OF SALES
higher launch costs;
higher spending associated with electrification, autonomy and research & development;
higher pre-operating costs incurred at new facilities; and
higher warranty costs.
NON-GAAP PERFORMANCE MEASURESFOR THE YEAR ENDED DECEMBER 31, 2018
Adjusted EBIT as a percentage of sales
2017
8.5%
2018
- 0.9%7.6%
0.0%
10.0%
5.0%
The table below shows the change in Magna’s Sales and Adjusted EBIT by segment and the impact each segment’s changes have on Magna’s
Adjusted EBIT as a percentage of sales for 2018 compared to 2017:
Adjusted EBIT
Adjusted as a percentage
Sales EBIT of sales
2017 $ 36,588 $ 3,094 8.5%
Increase (Decrease) related to:
Body Exteriors & Structures 914 52 – 0.1%
Power & Vision 692 (15) – 0.2%
Seating Systems 324 (9) – 0.1%
Complete Vehicles 2,471 2 – 0.5%
Corporate and Other (162) (17) –
2018 $ 40,827 $ 3,107 7.6%
Adjusted EBIT as a percentage of sales decreased 0.9% to 7.6% for 2018 compared to 8.5% for 2017 primarily as a result of an increase in the
proportion of sales generated in our Complete Vehicles segment relative to total sales, which have a lower margin than our consolidated average. The
remaining 0.4% decrease in Adjusted EBIT as a percentage of sales was primarily due to:
•
•
•
•
These factors were partially offset by productivity and efficiency improvements at certain Body Exteriors & Structures facilities, foreign exchange gains
in 2018 compared to foreign exchange losses in 2017 and generally higher margins on higher sales.
10 ANNUAL REPORT 2018

8MAR201905522525
20MAR201917324147
RETURN ON INVESTED CAPITAL
an increase in our investment in fixed assets to refurbish or replace assets consumed in the normal course of business and for manufacturing
equipment for programs that will be launching subsequent to 2018;
an increase in working capital;
an increase in investments, including our investment in Lyft, Inc. [‘‘Lyft’’] equity during 2018; and
the net strengthening of foreign currencies against the U.S. dollar.
RETURN ON EQUITY
Return on Invested Capital
2017
15.6%
2018
- 0.7% 14.9%
10.0%
20.0%
Return on Invested Capital decreased 0.7% to 14.9% for 2018 compared to 15.6% for 2017, primarily as a result of higher Average Invested Capital
partially offset by an increase in After-tax operating profits.
Average Invested Capital increased $1.4 billion to $16.1 billion for 2018 compared to $14.7 billion for 2017 primarily due to:
•
•
•
•
After-tax operating profits increased primarily as a result of higher sales, lower income taxes, higher equity income and lower SG&A, partially offset by
higher cost of goods sold, depreciation and amortization and an increase in Other expense, net.
Return on Equity
2017
19.8%
2018
- 0.1% 19.7%
10.0%
25.0%
Return on Equity decreased 0.1% to 19.7% for 2018 compared to 19.8% for 2017. Return on Equity declined modestly as Average Shareholders’
Equity increased at a higher rate than the increase in net income attributable to Magna.
MAGNA INTERNATIONAL INC. 11

8MAR201905522678
BODY EXTERIORS & STRUCTURES
Sales – Body Exteriors & Structures
the launch of new programs during or subsequent to 2017, including the:
· Jeep Cherokee;
· Chevrolet Equinox and GMC Terrain;
· Jeep Wrangler; and
· Ford Expedition and Lincoln Navigator; and
a $157 million increase in reported U.S. dollar sales primarily as a result of the strengthening of the euro against the U.S. dollar partially offset by the
weakening of the Brazilian real and Russian ruble, each against the U.S. dollar.
SEGMENT ANALYSIS
We are a global automotive supplier which has complete vehicle engineering and contract manufacturing expertise, as well as product capabilities
including body, chassis, exterior, seating, powertrain, advanced driver assistance, electronics, vision, mechatronics and roof systems. Magna also has
electronic and software capabilities across many of these areas.
Our business is managed under operating segments which have been determined on the basis of technological opportunities, product similarities, as
well as market and operating factors. Our internal financial reporting is aligned with the way our business is managed. Accordingly, we report key
internal operating performance measures for Body Exteriors & Structures, Power & Vision, Seating Systems, and Complete Vehicles for presentation to
the chief operating decision maker to use in the assessment of operating performance, allocation of resources, and to help plan our long-term strategic
direction and future global growth.
Our chief operating decision maker uses Adjusted EBIT as the measure of segment profit or loss, since we believe Adjusted EBIT is the most
appropriate measure of operational profitability or loss for our reportable segments. Adjusted EBIT has been reconciled in the ‘‘Non-GAAP Financial
Measures Reconciliation’’ section included in this MD&A.
Adjusted
Sales EBIT
2018 2017 Change 2018 2017 Change
Body Exteriors & Structures $ 17,527 $ 16,613 $ 914 $ 1,398 $ 1,346 $ 52
Power & Vision 12,321 11,629 692 1,168 1,183 (15)
Seating Systems 5,548 5,224 324 425 434 (9)
Complete Vehicles 6,018 3,547 2,471 68 66 2
Corporate and Other (587) (425) (162) 48 65 (17)
Total reportable segments $ 40,827 $ 36,588 $ 4,239 $ 3,107 $ 3,094 $ 13
2018 2017 Change
Sales $ 17,527 $ 16,613 $ 914 + 6%
Adjusted EBIT $ 1,398 $ 1,346 $ 52 + 4%
Adjusted EBIT as a percentage of sales 8.0% 8.1% – 0.1%
Sales
2017
$16,613
2018
+ 6%$17,527
$10,000
$20,000
Sales for Body Exteriors & Structures increased 6% or $914 million to $17.5 billion for 2018 compared to $16.6 billion for 2017, primarily as a result of:
•
•
12 ANNUAL REPORT 2018

8MAR201905521326 20MAR201917323984
8MAR201905522825
the impact of a change in production volumes on various other programs; and
net customer price concessions subsequent to 2017.
Adjusted EBIT – Body Exteriors & Structures
earnings on higher sales;
productivity and efficiency improvements, including at certain previously underperforming facilities;
favourable customer pricing resolutions in 2018;
foreign exchange gains in 2018 compared to foreign exchange losses in 2017;
higher scrap steel recoveries in excess of higher net commodity costs; and
a $4 million increase in reported U.S. dollar Adjusted EBIT as a result of the strengthening of certain foreign currencies against the U.S. dollar
including the euro, Canadian dollar and Chinese renminbi partially offset by the weakening of the Russian ruble against the U.S. dollar.
higher launch costs;
inefficiencies at a plant we are closing;
higher depreciation and amortization; and
net customer price concessions subsequent to 2017.
higher launch costs;
inefficiencies at a plant we are closing; and
higher depreciation and amortization.
productivity and efficiency improvements at certain facilities;
favourable customer pricing resolutions in 2018;
foreign exchange gains in 2018 compared to foreign exchange losses in 2017; and
higher scrap steel recoveries in excess of higher net commodity costs.
POWER & VISION
Sales – Power & Vision
These factors were partially offset by:
•
•
Adjusted EBIT Adjusted EBIT as a percentage of sales
2017
$1,346
2018
+ 4%$1,398
$1,000
$1,500
2017
8.1%
2018
- 0.1%8.0%
5.0%
10.0%
Adjusted EBIT for Body Exteriors & Structures increased $52 million to $1.40 billion for 2018 compared to $1.35 billion for 2017 primarily as a result of:
•
•
•
•
•
•
These factors were partially offset by:
•
•
•
•
Adjusted EBIT as a percentage of sales for Body Exteriors & Structures decreased 0.1% to 8.0% for 2018 compared to 8.1% for 2017 primarily as a
result of:
•
•
•
These factors were partially offset by:
•
•
•
•
2018 2017 Change
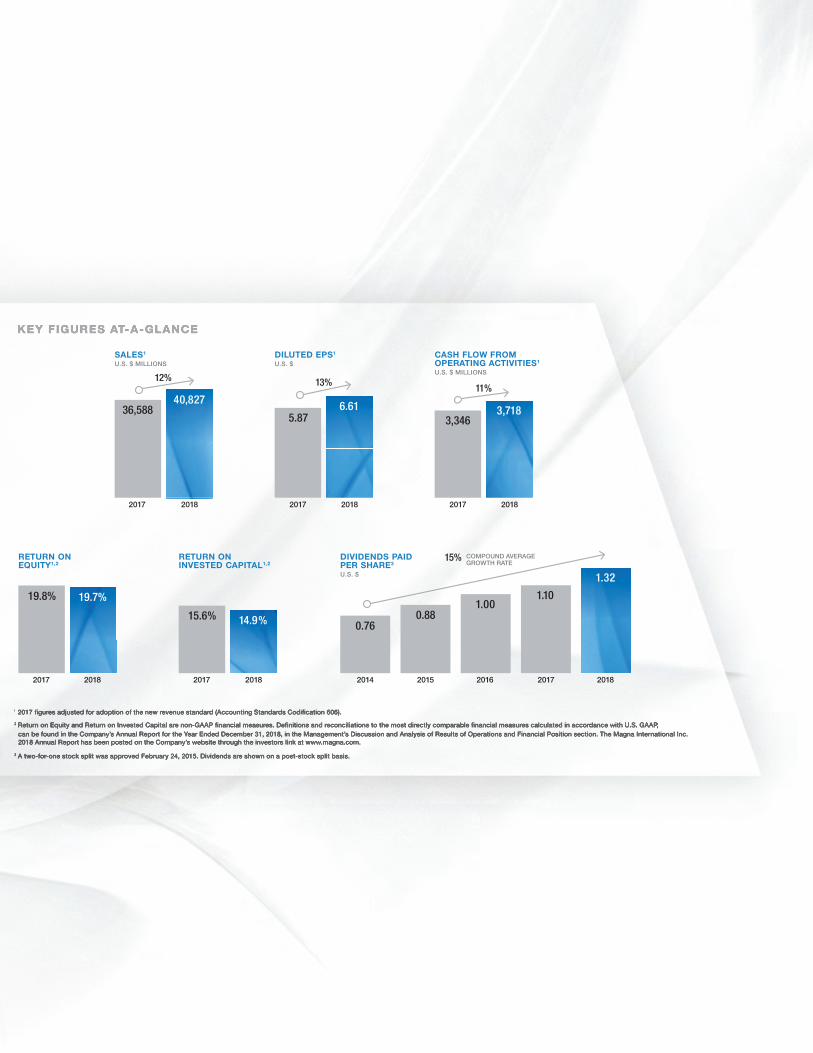
Sales $ 12,321 $ 11,629 $ 692 + 6%
Adjusted EBIT $ 1,168 $ 1,183 $ (15) – 1%
Adjusted EBIT as a percentage of sales 9.5% 10.2% – 0.7%
Sales
2017
$11,629
2018
+ 6% $12,321
$5,000
$15,000
MAGNA INTERNATIONAL INC. 13
8MAR201905521632 8MAR201905521477
the launch of new programs during or subsequent to 2017, including the;
· GMC Sierra and Chevrolet Silverado;
· Chevrolet Traverse and Buick Enclave;
· BMW X3;
· Porsche Cayenne;
· Jeep Wrangler; and
· dual-clutch transmissions on various BMW and Daimler vehicles;
a $249 million increase in reported U.S. dollar sales primarily as a result of the strengthening of the euro against the U.S. dollar; and
net facility acquisitions subsequent to 2017 which positively impacted sales by $23 million.
Adjusted EBIT – Power & Vision
higher spending associated with electrification and autonomy;
higher warranty costs of $59 million;
higher commodity costs;
net favourable commercial settlements during 2017;
higher launch costs; and
net customer price concessions subsequent to 2017.
earnings on higher sales;
foreign exchange gains in 2018 compared to losses in 2017;
a favourable settlement reached during the first quarter of 2018 relating to the acquisition of Getrag;
a $21 million increase in reported U.S. dollar Adjusted EBIT primarily due to the strengthening of the euro and Chinese renminbi, each against the
U.S. dollar;
lower employee profit sharing;
higher equity income, excluding the impact of foreign exchange, of $13 million; and
productivity and efficiency improvements.
higher spending associated with electrification and autonomy;
higher warranty costs;
higher commodity costs;
net favourable commercial settlements during 2017; and
higher launch costs.
foreign exchange gains in 2018 compared to losses in 2017;
a favourable settlement reached during the first quarter of 2018 relating to the acquisition of Getrag;
lower employee profit sharing; and
higher equity income.
Sales for Power & Vision increased 6% or $692 million to $12.3 billion for 2018 compared to $11.6 billion for 2017, primarily as a result of:
•
•
•
These factors were partially offset by the impact of a change in production volumes on various other programs and net customer concessions
subsequent to 2017.
Adjusted EBIT Adjusted EBIT as a percentage of sales
2017
$1,183
2018
- 1% $1,168
$800
$1,300
2017
10.2%
2018
- 0.7% 9.5%
6.0%
12.0%
Adjusted EBIT for Power & Vision decreased $15 million to $1.17 billion for 2018 compared to $1.18 billion for 2017 primarily as a result of:
•
•
•
•
•
•
These factors were partially offset by:
•
•
•
•
•
•
•
Equity income, excluding the impact of foreign exchange, was $13 million higher due to net favourable commercial settlements during 2018 at a certain
facility, lower warranty costs at certain facilities and a $4 million net increase in reported U.S. dollar equity income mainly due to the strengthening of the
Chinese renminbi and euro, both against the U.S. dollar. These factors were partially offset by reduced earnings due to lower sales at certain facilities,
higher pre-operating costs incurred at a new facility which is accounted for under the equity method, and a write-down of inventory and receivables
relating to one customer at a certain facility.
Adjusted EBIT as a percentage of sales for Power & Vision decreased 0.7% to 9.5% for 2018 compared to 10.2% for 2017 primarily as a result of:
•
•
•
•
•
These factors were partially offset by:
•
•
•
•
14 ANNUAL REPORT 2018

8MAR201905522985
8MAR201905521931 8MAR201905522086
SEATING SYSTEMS
Sales – Seating Systems
the launch of new programs during or subsequent to 2017, including the;
· Ford Expedition and Lincoln Navigator;
· BMW X5;
· Lynk & Co. 01 and 02; and
· Chevrolet Traverse and Buick Enclave.
the end of production on certain programs;
a facility divestiture subsequent to 2017 which negatively impacted sales by $49 million;
the impact of a change in production volumes on various other programs;
a $34 million decrease in reported U.S. dollar sales as a result of the weakening of certain foreign currencies against the U.S. dollar, including the
Turkish lira and Brazil real partially offset by the strengthening of the euro against the U.S. dollar; and
net customer price concessions subsequent to 2017.
Adjusted EBIT – Seating Systems
2018 2017 Change
Sales $ 5,548 $ 5,224 $ 324 + 6%
Adjusted EBIT $ 425 $ 434 $ (9) – 2%
Adjusted EBIT as a percentage of sales 7.7% 8.3% – 0.6%
Sales
2017
$5,224
2018
+ 6% $5,548
$2,000
$6,000
Sales in Seating Systems increased 6% or $324 million to $5.5 billion for 2018 compared to $5.2 billion for 2017, primarily as a result of:
•
These factors were partially offset by:
•
•
•
•
•
Adjusted EBIT as a percentage of salesAdjusted EBIT
2017
$434
2018
$425
$200
$500- 2%
2017
8.3%
2018
7.7%
5.0%
10.0%- 0.6%
Adjusted EBIT for Seating Systems decreased $9 million to $425 million for 2018 compared to $434 million for 2017 primarily as a result of higher
pre-operating costs incurred at new facilities, higher commodity costs and net customer price concessions subsequent to 2017.
These factors were partially offset by higher foreign exchange gains in 2018 compared to losses in 2017, earnings on higher sales, lower launch costs,
higher equity income of $5 million primarily due to an acquisition in the fourth quarter of 2017 and productivity and efficiency improvements.
Adjusted EBIT as a percentage of sales for Seating Systems decreased 0.6% to 7.7% for 2018 compared to 8.3% for 2017 primarily as a result of
higher pre-operating costs incurred at new facilities partially offset by higher foreign exchange gains in 2018 compared to losses in 2017.
MAGNA INTERNATIONAL INC. 15

8MAR201904313167 8MAR201904313314
COMPLETE VEHICLES
Sales – Complete Vehicles
the launch of the Jaguar E-Pace program which started production during the third quarter of 2017;
the launch of the Jaguar I-Pace program which started production during the first quarter of 2018;
the launch of the BMW 5-Series which started production during the first quarter of 2017; and
a $250 million increase in reported U.S. dollar sales as a result of the strengthening of the euro against the U.S. dollar.
2018 2017 Change
Complete Vehicle Assembly Volumes (thousands of units)(i) 144.6 77.9 66.7 + 86%
Sales $ 6,018 $ 3,547 $ 2,471 + 70%
Adjusted EBIT $ 68 $ 66 $ 2 + 3%
Adjusted EBIT as a percentage of sales 1.1% 1.9% – 0.8%
(i) Vehicles produced at our Complete Vehicle operations are included in Europe Light Vehicle Production volumes.
Complete Vehicle
Assembly Volumes
(thousands of units)Sales
2017
$3,547
2018
+ 70%$6,018
$-
$7,000
2017
77.9
2018
+ 86%144.6
-
150.0
Sales increased 70% or $2.5 billion to $6.0 billion for 2018 compared to $3.5 billion for 2017 and assembly volumes increased 86% or
66.7 thousand units.
The increase in Complete Vehicle sales is primarily due to:
•
•
•
•
16 ANNUAL REPORT 2018

8MAR201905373107 8MAR201905521787
Adjusted EBIT – Complete Vehicles
earnings on higher sales of the Jaguar E-Pace and I-Pace;
earnings on higher sales of the BMW 5-Series; and
a lower amount of employee profit sharing.
higher launch and other costs relating to the Mercedes-Benz G-Class and Jaguar I-Pace partially offset by lower launch costs relating to the
Jaguar E-Pace;
reduced earnings from higher depreciation and amortization and lower sales as a result of the launch of the new Mercedes-Benz G-Class;
a favourable customer pricing resolution in 2017;
higher pre-operating costs incurred at a new facility; and
spending associated with research & development.
CORPORATE AND OTHER
Adjusted EBIT Adjusted EBIT as a percentage of sales
2017
$66
2018
+ 3%$68
$40
$70
2017
1.9%
2018
1.1%
0.0%
2.0%- 0.8%
Adjusted EBIT for Complete Vehicles increased $2 million to $68 million for 2018 compared to $66 million for 2017 primarily as a result of:
•
•
•
These factors were partially offset by:
•
•
•
•
•
Adjusted EBIT as a percentage of sales for Complete Vehicles decreased 0.8% to 1.1% for 2018 compared to 1.9% for 2017 primarily as a result of
higher launch and other costs relating to the Mercedes-Benz G-Class and Jaguar I-Pace partially offset by lower launch cost relating to the Jaguar
E-Pace and reduced earnings from higher depreciation and amortization and lower sales as a result of the launch of the new Mercedes-Benz G-Class.
Adjusted EBIT in Corporate and Other decreased $17 million to $48 million for 2018 compared to $65 million for 2017, primarily due to spending
associated with corporate research & development, higher incentive compensation and a $4 million unfavourable impact of foreign exchange gains in
2017 related to the re-measurement of net deferred tax assets that are maintained in a currency other than their functional currency partially offset by
lower costs to support our global compliance programs as a result of the substantial completion of our global review focused on antitrust risk.
MAGNA INTERNATIONAL INC. 17

8MAR201904312131
CASH FLOW FROM OPERATIONS
Cash provided from operating activities
a $4.2 billion increase in cash received from customers;
a $127 million decrease in cash paid for taxes; and
higher dividends received from equity method investments of $55 million.
a $3.4 billion increase in cash paid for material and overhead;
a $520 million increase in cash paid for labour; and
higher net interest expense of $22 million as discussed in the Interest Expense, net section above.
Changes in operating assets and liabilities
a $351 million increase in accounts receivable mainly due to higher sales related to the launch of new programs during or subsequent to 2017;
a $92 million increase in inventories mainly due to higher production and engineering inventory to support launch activities partially offset by lower
tooling inventory; and
an $86 million decrease in income taxes payable relating to payments in excess of taxes provided for.
FINANCIAL CONDITION, LIQUIDITY AND CAPITAL RESOURCES
Cash provided from operating activities
2017
$3,346
2018
+ 11% $3,718
$1,000
$4,000
2018 2017 Change
Net income $ 2,332 $ 2,244
Items not involving current cash flows 1,539 1,315
3,871 3,559 $ 312
Changes in operating assets and liabilities (153) (213) 60
Cash provided from operating activities $ 3,718 $ 3,346 $ 372
Cash provided from operating activities increased $372 million for 2018 compared to 2017 primarily as a result of:
•
•
•
These factors were partially offset by:
•
•
•
Cash used in operating assets and liabilities amounted to $153 million in 2018. The net use of cash was primarily as a result of:
•
•
•
These factors were partially offset by a $265 million increase in accounts payable primarily relating to higher sales and a $105 million increase in other
accrued liabilities mainly related to higher tooling and engineering deferred revenue.
18 ANNUAL REPORT 2018

8MAR201905373549
CAPITAL AND INVESTING SPENDING
Fixed assets, investments, other assets and intangible assets additions
Investment in Lyft
Acquisitions
Proceeds from disposition
FINANCING
Cash used for investing activities
2017
$(2,145)
2018
+ 6% $(2,276)$(4,000)
$ -
2018 2017 Change
Fixed asset additions $ (1,650) $ (1,875)
Investments, other assets and intangible assets (481) (651)
Fixed assets, investments, other assets and intangible assets additions (2,131) (2,526)
Investment in Lyft (220) –
Acquisitions (148) –
Proceeds from disposition 223 332
Proceeds on disposal of facilities – 49
Cash used for investing activities $ (2,276) $ (2,145) $ (131)
In 2018, we invested $1.7 billion in fixed assets. While investments were made to refurbish or replace assets consumed in the normal course of
business and for productivity improvements, a large portion of the investment in 2018 was for manufacturing equipment and buildings for programs
that launched during 2018 or will be launching subsequent to 2018. In addition, we invested $412 million in other assets related primarily to fully
reimbursable tooling, planning, and engineering costs for programs that launched during 2018 or will be launching subsequent to 2018, and we
invested a further $69 million in investments, primarily related to equity method investments.
During 2018, we invested $200 million in Lyft as part of a multi-year collaboration with Lyft to jointly develop and manufacture self-driving systems. In
addition, we purchased $20 million in Lyft shares for an equity compensation program for certain employees working on the development of self-driving
systems.
During 2018, we acquired 100% of the equity interest in OLSA S.p.A. [‘‘OLSA’’], a global company which designs, engineers and manufactures tail
lamps and other lighting products for cash consideration of $152 million.
In 2018, the $223 million of proceeds related to normal course fixed and other asset disposals.
2018 2017 Change
Issues of debt $ 172 $ 752
Increase (Decrease) in short-term borrowings 866 (530)
Repayments of debt (171) (110)
Issue of Common Shares on exercise of stock options 50 44
Repurchase of Common Shares (1,831) (1,271)
Shares repurchased for tax withholdings on vesting of equity awards (16) (11)
Contributions to subsidiaries by non-controlling interests 4 10
Dividends paid to non-controlling interest (69) (38)
Dividends paid (448) (400)
Cash used for financing activities $ (1,443) $ (1,554) $ 111
MAGNA INTERNATIONAL INC. 19

FINANCING RESOURCES
the $1.8 billion repurchase and cancellation of 32.6 million Common Shares during 2018;
a $490 million net unrealized loss on translation of our net investment in foreign operations whose functional currency is not U.S. dollars;
the $448 million of dividends paid during 2018; and
a $106 million net unrealized loss on cash flow hedges.
CASH RESOURCES
MAXIMUM NUMBER OF SHARES ISSUABLE
The increase in short-term borrowings relates primarily to a $833 million increase in the U.S. Program during 2018.
Repurchases of Common Shares during 2018 are related to 32.6 million Common Shares repurchased for aggregate cash consideration of $1.8 billion.
Cash dividends paid per Common Share were $1.32 for 2018, for a total of $448 million compared to cash dividends paid per Common Share of $1.10
for 2017, for a total of $400 million.
As at As at
December 31, December 31,
2018 2017 Change
Liabilities
Short-term borrowings $ 1,098 $ 259
Long-term debt due within one year 201 108
Long-term debt 3,084 3,195
4,383 3,562 $ 821
Non-controlling interests 458 502 (44)
Shareholders’ equity 10,701 11,210 (509)
Total capitalization $ 15,542 $ 15,274 $ 268
Total capitalization increased by $268 million to $15.54 billion as at December 31, 2018 compared to $15.27 billion at December 31, 2017, primarily as a
result of a $821 million increase in liabilities partially offset by a $509 million decrease in shareholders’ equity and a $44 million decrease in
non-controlling interests.
The increase in liabilities relates primarily to a $833 million increase in the U.S. Program during 2018.
The decrease in non-controlling interest was primarily as a result of dividends paid during 2018 partially offset by income attributable to non-controlling
interests in 2018.
The decrease in shareholders’ equity was primarily as a result of:
•
•
•
•
These factors were partially offset by $2.3 billion of net income earned in 2018.
During 2018, our cash resources including restricted cash equivalents decreased by $37 million to $802 million primarily as a result of the cash used for
investing and financing activities partially offset by the cash provided from operating activities, as discussed above. In addition to our cash resources at
December 31, 2018, we had term and operating lines of credit totalling $3.3 billion, of which $2.0 billion was unused and available.
The Company maintains a revolving credit facility of $2.75 billion with a maturity date of June 22, 2023. The facility includes a $200 million Asian
tranche, a $100 million Mexican tranche and a tranche for Canada, U.S. and Europe, which is fully transferable between jurisdictions and can be drawn
in U.S. dollars, Canadian dollars or euros.
The following table presents the maximum number of shares that would be outstanding if all of the outstanding options at March 7, 2019
were exercised:
Common Shares 324,634,866
Stock options(i) 9,410,640
334,045,506
(i) Options to purchase Common Shares are exercisable by the holder in accordance with the vesting provisions and upon payment of the exercise price as may be determined from time to time pursuantto our stock option plans.
20 ANNUAL REPORT 2018

CONTRACTUAL OBLIGATIONS AND OFF-BALANCE SHEET FINANCING
Foreign Currency Activities
A purchase obligation is defined as an agreement to purchase goods or services that is enforceable and legally binding on us and that specifies all
significant terms, including: fixed or minimum quantities to be purchased; fixed, minimum or variable price provisions; and the approximate timing of
the transaction. Consistent with our customer obligations, substantially all of our purchases are made under purchase orders with our suppliers which
are requirements based and accordingly do not specify minimum quantities. Other long-term liabilities are defined as long-term liabilities that are
recorded on our consolidated balance sheet. Based on this definition, the following table includes only those contracts which include fixed or minimum
obligations.
At December 31, 2018, we had contractual obligations requiring annual payments as follows:
2020- 2022-
2019 2021 2023 Thereafter Total
Operating leases $ 310 $ 537 $ 429 $ 714 $ 1,990
Long-term debt 201 59 946 2,079 3,285
Unconditional purchase obligations:
Materials and services 2,985 1,269 791 324 5,369
Capital 1,019 174 44 6 1,243
Total contractual obligations $ 4,515 $ 2,039 $ 2,210 $ 3,123 $ 11,887
Our unfunded obligations with respect to employee future benefit plans, which have been actuarially determined, were $650 million at December 31,
2018. These obligations are as follows:
Termination and
Pension Retirement Long Service
Liability Liability Arrangements Total
Projected benefit obligation $ 633 $ 29 $ 394 $ 1,056
Less plan assets (406) – – (406)
Unfunded amount $ 227 $ 29 $ 394 $ 650
Our off-balance sheet financing arrangements are limited to operating lease contracts.
We have facilities that are subject to operating leases. Operating lease payments in 2018 for facilities were $286 million. Operating lease commitments
in 2019 for facilities are expected to be $262 million. A majority of our existing lease agreements generally provide for periodic rent escalations based
either on fixed-rate step increases, or on the basis of a consumer price index adjustment (subject to certain caps).
We also have operating lease commitments for equipment. These leases are generally of shorter duration. Operating lease payments for equipment
were $75 million for 2018 and are expected to be $48 million in 2019.
Although our consolidated contractual annual lease commitments decline year by year, we expect that existing leases will either be renewed or
replaced, or alternatively, we will incur capital expenditures to acquire equivalent capacity.
Our North American operations negotiate sales contracts with OEMs for payment in both U.S. and Canadian dollars. Materials and equipment are
purchased in various currencies depending upon competitive factors, including relative currency values. Our North American operations use labour and
materials which are paid for in both U.S. and Canadian dollars. Our Mexican operations generally use the U.S. dollar as the functional currency.
Our European operations negotiate sales contracts with OEMs for payment principally in euros and British pounds. The European operations’ material,
equipment and labour are paid for principally in euros and British pounds.
We employ hedging programs, primarily through the use of foreign exchange forward contracts, in an effort to manage our foreign exchange exposure,
which arises when manufacturing facilities have committed to the delivery of products for which the selling price has been quoted in foreign currencies.
These commitments represent our contractual obligations to deliver products over the duration of the product programs, which can last a number of
years. The amount and timing of the forward contracts will be dependent upon a number of factors, including anticipated production delivery schedules
and anticipated production costs, which may be paid in the foreign currency. In addition, we enter into foreign exchange contracts to manage foreign
exchange exposure with respect to internal funding arrangements. Despite these measures, significant long-term fluctuations in relative currency
values, in particular a significant change in the relative values of the U.S. dollar, Canadian dollar, euro or Chinese renminbi, could have an adverse effect
on our profitability and financial condition (as discussed throughout this MD&A).
MAGNA INTERNATIONAL INC. 21
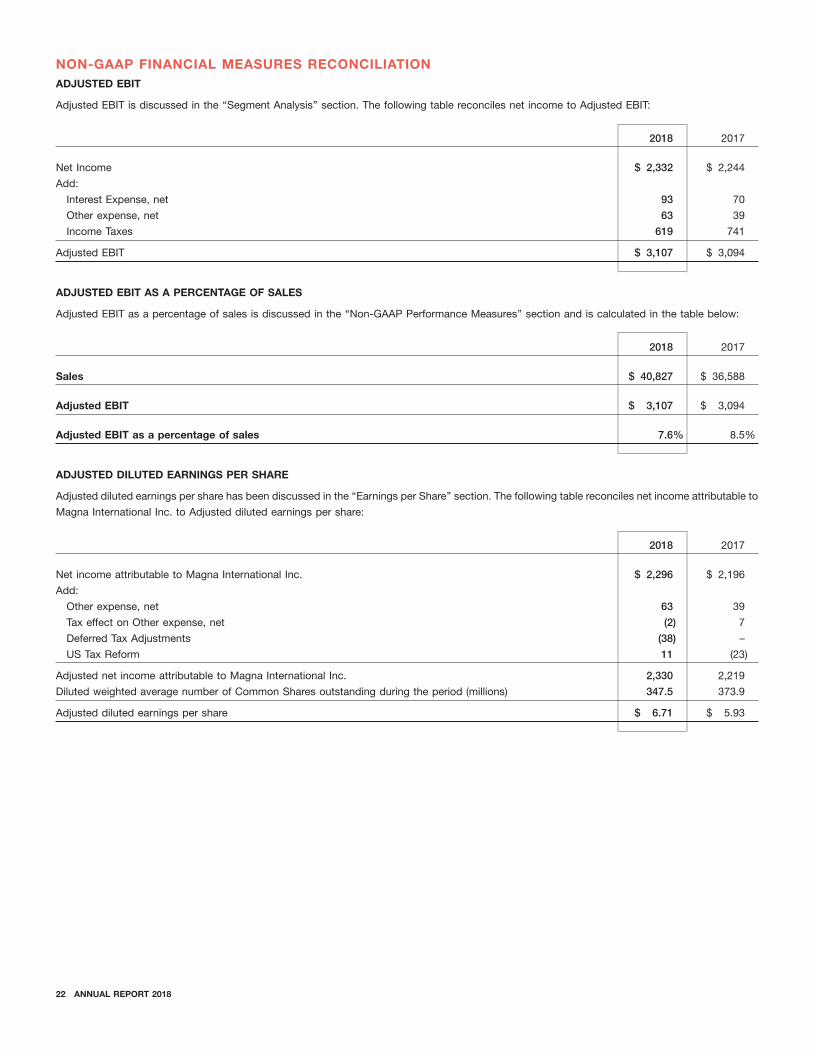
ADJUSTED EBIT
ADJUSTED EBIT AS A PERCENTAGE OF SALES
ADJUSTED DILUTED EARNINGS PER SHARE
NON-GAAP FINANCIAL MEASURES RECONCILIATION
Adjusted EBIT is discussed in the ‘‘Segment Analysis’’ section. The following table reconciles net income to Adjusted EBIT:
2018 2017
Net Income $ 2,332 $ 2,244
Add:
Interest Expense, net 93 70
Other expense, net 63 39
Income Taxes 619 741
Adjusted EBIT $ 3,107 $ 3,094
Adjusted EBIT as a percentage of sales is discussed in the ‘‘Non-GAAP Performance Measures’’ section and is calculated in the table below:
2018 2017
Sales $ 40,827 $ 36,588
Adjusted EBIT $ 3,107 $ 3,094
Adjusted EBIT as a percentage of sales 7.6% 8.5%
Adjusted diluted earnings per share has been discussed in the ‘‘Earnings per Share’’ section. The following table reconciles net income attributable to
Magna International Inc. to Adjusted diluted earnings per share:
2018 2017
Net income attributable to Magna International Inc. $ 2,296 $ 2,196
Add:
Other expense, net 63 39
Tax effect on Other expense, net (2) 7
Deferred Tax Adjustments (38) –
US Tax Reform 11 (23)
Adjusted net income attributable to Magna International Inc. 2,330 2,219
Diluted weighted average number of Common Shares outstanding during the period (millions) 347.5 373.9
Adjusted diluted earnings per share $ 6.71 $ 5.93
22 ANNUAL REPORT 2018

RETURN ON INVESTED CAPITAL
RETURN ON EQUITY
Return on Invested Capital is discussed in the ‘‘Non-GAAP Performance Measures’’ section. Return on Invested Capital is calculated as After-tax
operating profits divided by Average Invested Capital (Invested Capital is averaged on a five-fiscal quarter basis) for the period.
After-tax operating profits is calculated in the table below:
2018 2017
Net Income $ 2,332 $ 2,244
Add:
Interest Expense, net 93 70
Income taxes on Interest Expense, net at Magna’s effective income tax rate: (20) (17)
After-tax operating profits $ 2,405 $ 2,297
Invested Capital is calculated in the table below:
2018 2017
Total Assets $ 25,945 $ 25,468
Excluding:
Cash and cash equivalents (684) (726)
Deferred tax assets (300) (238)
Less Current Liabilities (10,304) (9,243)
Excluding:
Short-term borrowings 1,098 259
Long-term debt due within one year 201 108
Invested Capital $ 15,956 $ 15,628
Return on Invested Capital is calculated in the table below:
2018 2017
After-tax operating profits $ 2,405 $ 2,297
Average Invested Capital $ 16,095 $ 14,687
Return on Invested Capital 14.9% 15.6%
Return on Equity is discussed in the ‘‘Non-GAAP Performance Measures’’ section and is calculated in the table below:
2018 2017
Net income attributable to Magna International Inc. $ 2,296 $ 2,196
Average Shareholders’ Equity $ 11,663 $ 11,078
Return on Equity 19.7% 19.8%
MAGNA INTERNATIONAL INC. 23
GOODWILL AND OTHER LONG-LIVED ASSETS – IMPAIRMENT ASSESSMENTS
EQUITY METHOD INVESTMENTS – IMPAIRMENT ASSESSMENT
REVENUE RECOGNITION – COMPLETE VEHICLE ASSEMBLY ARRANGEMENTS
INCOME TAXES
SIGNIFICANT ACCOUNTING POLICIES AND CRITICAL ACCOUNTING ESTIMATES
Our significant accounting policies are more fully described in Note 1, ‘‘Significant Accounting Policies’’, to the consolidated financial statements
included in this Report. The preparation of the audited consolidated financial statements requires management to make estimates and assumptions
that affect the reported amounts of assets, liabilities, revenues and expenses and the related disclosure of contingent assets and liabilities, as of the
date of the consolidated financial statements. These estimates and assumptions are based on our historical experience, and various other
assumptions we believe to be reasonable in the circumstances. Since these estimates and assumptions are subject to an inherent degree of
uncertainty, actual results in these areas may differ significantly from our estimates.
We believe the following critical accounting policies and estimates affect the more subjective or complex judgements and estimates used in the
preparation of our consolidated financial statements and accompanying notes. Management has discussed the development and selection of the
following critical accounting policies with the Audit Committee of the Board of Directors, and the Audit Committee has reviewed our disclosure relating
to critical accounting policies in this MD&A.
We review goodwill at the reporting unit level for impairment in the fourth quarter of each year or more frequently if events or changes in circumstances
indicate that goodwill might be impaired. Goodwill impairment is assessed based on a comparison of the fair value of a reporting unit to the underlying
carrying value of the reporting unit’s net assets, including goodwill. If a reporting unit’s carrying amount exceeds its fair value, an impairment is
recognized based on that difference. The fair value of a reporting unit is determined using the estimated discounted future cash flows of the
reporting unit.
In addition to our review of goodwill, we evaluate fixed assets and other long-lived assets for impairment whenever indicators of impairment exist.
Indicators of impairment include the bankruptcy of a significant customer or the early termination, loss, renegotiation of the terms of, or delay in the
implementation of, any significant production contract. If the sum of the future cash flows expected to result from the asset, undiscounted and without
interest charges, is less than the reported value of the asset, an asset impairment would be recognized in the consolidated financial statements. The
amount of impairment to be recognized is calculated by subtracting the fair value of the asset from the reported value of the asset.
We believe that accounting estimates related to goodwill and long-lived asset impairment assessments are ‘‘critical accounting estimates’’ because:
(i) they are subject to significant measurement uncertainty and are susceptible to change as management is required to make forward-looking
assumptions regarding the impact of improvement plans on current operations, in-sourcing and other new business opportunities, program pricing and
cost assumptions on current and future business, the timing of new program launches and future forecasted production volumes; and (ii) any resulting
impairment loss could have a material impact on our consolidated net income and on the amount of assets reported in our consolidated balance sheet.
As of December 31, 2018, and 2017, we had equity method investments of $1.9 billion and $2.02 billion, respectively. We monitor our investments for
indicators of other-than-temporary declines in value on an ongoing basis in accordance with U.S. GAAP. If we determine that an other-than-temporary
decline in value has occurred, we recognize an impairment loss, which is measured as the difference between the recorded book value and the fair
value of the investment. Fair value is generally determined using an income approach based on discounted cash flows. A deterioration in the operating
results of our non-consolidated affiliates could result in the impairment of our investments.
Our complete vehicle assembly contracts with customers are complex and often include promises to transfer multiple products and services to a
customer, some of which may be implicitly contracted for. As a result, significant interpretation and judgment is sometimes required to determine the
appropriate accounting for these transactions including: (i) whether products and services are considered distinct performance obligations that should
be accounted for separately or combined; (ii) developing an estimate of the stand-alone selling price of each distinct performance obligation; and
(iii) whether the arrangement would be characterized as revenue or reimbursement of costs incurred. Changes in judgments with respect to these
assumptions and estimates could impact the timing or amount of revenue recognition.
We are subject to income taxes in Canada and other non-Canadian jurisdictions. Significant judgement and estimates are required in determining our
provision for income taxes, deferred tax assets and liabilities, and liabilities for unrecognized tax benefits.
The determination of our tax liabilities involves dealing with uncertainties in the application of complex tax laws. We recognize tax benefits from
uncertain tax positions only if it is more likely than not that the tax position will be sustained on examination by the taxing authorities, based on the
technical merits of the position. The tax benefits recognized in the financial statements from such positions are then measured based on the largest
benefit that has a greater than 50% likelihood of being realized upon ultimate settlement.
At December 31, 2018, we had gross unrecognized tax benefits of $198 million excluding interest and penalties, of which $183 million, if recognized,
would affect our effective tax rate. The gross unrecognized tax benefits differ from the amount that would affect our effective tax rate due primarily to
the impact of the valuation allowance on deferred tax assets.
24 ANNUAL REPORT 2018

WARRANTY
EMPLOYEE FUTURE BENEFIT PLANS
NORMAL COURSE ISSUER BID
Deferred tax assets and liabilities are recognized for the estimated future tax effects attributable to temporary differences between financial statement
carrying value of existing assets and liabilities and their respective tax bases and tax loss and credit carryforwards. Deferred tax assets and liabilities are
measured using the enacted tax rates and laws that will be in effect when the differences are expected to reverse. Accounting standards require that we
assess whether valuation allowances should be established or maintained against our deferred income tax assets, based on consideration of all
available evidence, using a ‘‘more-likely-than-not’’ standard. The factors used to assess the likelihood of realization are: history of losses, forecasts of
future pre-tax income and tax planning strategies that could be implemented to realize the deferred tax assets. On a quarterly basis, we evaluate the
realizability of deferred tax assets by assessing our valuation allowances and by adjusting the amount of such allowances as necessary. We use tax
planning strategies to realize deferred tax assets to avoid the potential loss of benefits.
At December 31, 2018, we had recorded deferred tax assets (net of related valuation allowances) in respect of loss carryforwards and other deductible
temporary differences of $154 million and $173 million, respectively. The deferred tax assets in respect of loss carryforwards relate primarily to
operations in Canada, India, the United Kingdom and Germany. We had domestic and foreign operating loss carryforwards of $2.3 billion and tax credit
carryforwards of $57 million, which relate primarily to Germany, Austria, the United States, Brazil, the United Kingdom, Spain and China. Approximately
$1.7 billion of the operating losses can be carried forward indefinitely. The remaining operating losses and tax credit carryforwards expire between 2019
and 2038.
We record product warranty liabilities based on individual customer agreements. Under most customer agreements, we only account for existing or
probable claims on product default issues when amounts related to such issues are probable and reasonably estimable. Under certain complete
vehicle engineering and assembly contracts, we record an estimate of future warranty-related costs based on the terms of the specific customer
agreements and the specific customers’ warranty experience.
Product liability provisions are established based on our best estimate of the amounts necessary to settle existing claims on product default issues.
Recall costs are costs incurred when government regulators and/or our customers decide to recall a product due to a known or suspected performance
issue, and we either agree or are required to participate. Costs typically include the cost of the product being replaced, the customer’s cost of the recall
and labour to remove and replace the defective part. When a decision to recall a product has been made or is probable, our estimated cost of the recall
is recorded as a charge to income in that period. In making this estimate, judgement is required as to the number of units that may be returned as a
result of the recall, the total cost of the recall campaign, the ultimate negotiated sharing of the cost between us, the customer and, in some cases
a supplier.
We monitor our warranty activity on an ongoing basis and adjust our reserve estimates when it is probable that future warranty costs will be different
than those estimates.
The determination of the obligation and expense for defined benefit pension, termination and long service arrangements and other post-retirement
benefits, such as retiree healthcare and medical benefits, is dependent on the selection of certain assumptions used by actuaries in calculating such
amounts. Those assumptions include, among others, the discount rate, expected long-term rate of return on plan assets and rates of increase in
compensation costs. Actual results that differ from the assumptions used are accumulated and amortized over future periods and therefore impact the
recognized expense in future periods. Significant changes in assumptions or significant plan amendments could materially affect our future employee
benefit obligations and future expense.
At December 31, 2018, we had past service costs and actuarial experience losses of $211 million included in accumulated other comprehensive
income that will be amortized to future employee benefit expense over the expected average remaining service life of employees or over the expected
average life expectancy of retired employees, depending on the status of the plan.
FUTURE CHANGES IN ACCOUNTING POLICIES
Refer to Note 2. Accounting Standards to the audited consolidated financial statements included in this report for the impact of recently issued
accounting pronouncements.
SUBSEQUENT EVENT
Subsequent to December 31, 2018, we purchased 3,216,363 Common Shares for cancellation and 76,119 Common Shares to satisfy stock-based
compensation awards, each under our existing normal course issuer bid for cash consideration of $168 million.
COMMITMENTS AND CONTINGENCIES
From time to time, we may be contingently liable for litigation, legal and/or regulatory actions and proceedings and other claims. Refer to note 23 of our
audited consolidated financial statements for the year ended December 31, 2018, which describes these claims.
For a discussion of risk factors relating to legal and other claims/actions against us, refer to ‘‘Item 5. Risk Factors’’ in our Annual Information Form and
Annual Report on Form 40-F, each in respect of the year ended December 31, 2017.
MAGNA INTERNATIONAL INC. 25

DISCLOSURE CONTROLS AND PROCEDURES
MANAGEMENT’S ANNUAL REPORT ON INTERNAL CONTROL OVER FINANCIAL REPORTING
Internal control over financial reporting is a process designed to provide reasonable, but not absolute, assurance regarding the reliability of financial
reporting and preparation of financial statements for external purposes in accordance with accounting principles generally accepted in the
United States. Our management is responsible for establishing and maintaining adequate internal control over financial reporting. Due to its inherent
limitations, internal control over financial reporting may not prevent or detect misstatements on a timely basis. Additionally, projections of any
evaluation of the effectiveness of internal control over financial reporting to future periods are subject to the risk that the controls may become
inadequate because of changes in conditions, or that the degree of compliance with the policies or procedures may deteriorate. Our management used
the Committee of Sponsoring Organizations of the Treadway Commission [‘‘COSO’’] Internal Control-Integrated Framework (2013) to evaluate the
effectiveness of internal control over financial reporting. Based on this evaluation, our Chief Executive Officer and our Chief Financial Officer have
assessed the effectiveness of our internal control over financial reporting and concluded that, as at December 31, 2018, such internal control over
financial reporting is effective. The Company’s internal control over financial reporting as of December 31, 2018 has been audited by Deloitte LLP,
Independent Registered Public Accounting Firm who also audited the Company’s consolidated financial statements for the year ended December 31,
2018. Deloitte LLP expressed an unqualified opinion on the effectiveness of the Company’s internal control over financial reporting. This report
precedes our audited consolidated financial statements for the year ended December 31, 2018.
CHANGES IN INTERNAL CONTROLS OVER FINANCIAL REPORTING
There have been no changes in our internal controls over financial reporting that occurred during 2018 that have materially affected, or are reasonably
likely to materially affect, our internal control over financial reporting.
CONTROLS AND PROCEDURES
Disclosure controls and procedures (as defined in Rules 13a-15(e) and 15d-15(e) under the Securities Exchange Act of 1934, as amended [the
‘‘Exchange Act’’] are designed to ensure that material information required to be disclosed in reports filed or submitted under the Exchange Act is
recorded, processed, summarized and reported on a timely basis, and that such information is accumulated and communicated to senior
management, including the Company’s Chief Executive Officer and Chief Financial Officer, as appropriate, to enable them to make timely decisions
regarding required disclosure of such information. We have conducted an evaluation of our disclosure controls and procedures as of December 31,
2018 under the supervision, and with the participation of, our Chief Executive Officer and our Chief Financial Officer. Based on this evaluation, our Chief
Executive Officer and our Chief Financial Officer have concluded that our disclosure controls and procedures (as this term is defined in the rules
adopted by Canadian securities regulatory authorities and the United States Securities and Exchange Commission [‘‘SEC’’]) are effective as of
December 31, 2018.
26 ANNUAL REPORT 2018

RISKS RELATED TO THE AUTOMOTIVE INDUSTRY
Economic Cyclicality: The global automotive industry is cyclical, with the potential for regional differences in timing of expansion and contraction
of economic cycles. A worsening of economic or political conditions in North America, Europe or Asia, may result in lower consumer confidence,
which typically translates into lower vehicle sales and production levels. A significant decline in vehicle production volumes from current levels could
have a material adverse effect on our profitability and financial condition.
Regional Volumes Declines: North America, Europe and China are key automotive producing regions for us, and our operating results are
primarily dependent on car and light truck production by our customers in these regions. A significant or sustained decline in vehicle production
volumes in these geographic regions could have a material adverse effect on our operations, sales and profitability.
Intense Competition: The automotive supply industry is highly competitive and becoming more so. Some of our competitors have higher or more
rapidly growing market share than we do in certain product or geographic areas. Additionally, a number of established electronics and
semiconductor companies have entered or expanded their presence in the automotive industry, while disruptive technology innovators have been
introducing novel product and service solutions which traditional automotive suppliers may not be able to match. Failure to successfully compete
with existing or new competitors, including failure to grow sales of our electronics products or services at or above the rate of growth of electronics
content, could have a material adverse effect on our operations, profitability and ability to fully implement our business strategy.
Trade Agreements: The global growth of the automotive industry has been aided by the free movement of goods, services, people and capital
through bilateral and regional trade agreements, particularly in North America and Europe. Introduction of measures which impede free trade could
have a material adverse effect on our operations and profitability.
Trade Disputes/Tariffs: Current international trade disputes could, among other things, reduce demand for and production of vehicles, disrupt
global supply chains, distort commodity pricing, impair the ability of automotive suppliers and vehicle manufacturers to make efficient long-term
investment decisions, create volatility in relative foreign exchange rates, and contribute to stock market volatility. Tariffs on steel and aluminum
introduced by the United States against Canada and Mexico in 2018, together with retaliatory tariffs by Canada and Mexico, remain in place despite
an agreement in principle regarding the new United States-Mexico-Canada Agreement [‘‘USMCA’’]. An ongoing trade dispute between the
United States and China has led to the imposition by the United States of tariffs on a broad range of Chinese-origin imports into the U.S., and
retaliatory tariffs by China on certain U.S.-origin imports into China, including automobiles. The continuation of these or other tariffs and/or
escalation of trade disputes which interfere with automotive supply chains could have an adverse effect on our operations and profitability.
CUSTOMER AND SUPPLIER RELATED RISKS
Customer Concentration: Although we supply parts to all of the leading OEMs, a significant majority of our sales are to six customers: General
Motors, Ford, Fiat Chrysler, BMW, Daimler and Volkswagen. In light of the amount of business we currently have with these six customers, our
opportunities for incremental growth with them in North America, Europe and China may be limited. While we continue to diversify our business,
there is no assurance we will be successful. Shifts in market share away from our top customers could have a material adverse effect on our
profitability.
Market Shifts: While we supply parts for a wide variety of vehicles produced globally, we do not supply parts for all vehicles produced, nor is the
number or value of parts evenly distributed among the vehicles for which we do supply parts. Shifts in market shares away from vehicles on which
we have significant content, as well as vehicle segments in which our sales may be more heavily concentrated, could have a material adverse effect
on our profitability.
Consumer Take Rate Shifts: Shifts in consumer preferences may impact ‘‘take rates’’ for certain types of products we sell. Examples of such
products include: manual and dual-clutch transmissions; all-wheel drive systems; power liftgates; active aerodynamics systems; advanced driver
assistance systems; and complete vehicles with certain option packages or option choices. Where shifts in consumer preferences result in higher
‘‘take rates’’ for products that we do not sell, such as planetary or continuously variable transmissions, or for products we sell at a lower price and
margin, such as cloth seats instead of leather seats, our profitability may be adversely affected.
MANUFACTURING / OPERATIONAL RISKS
Product Launch: The launch of production is a complex process, the success of which depends on a wide range of factors, including: the timing
of design changes by our customers relative to start of production; production readiness of our and our suppliers’ manufacturing facilities;
robustness of manufacturing processes; launch volumes; quality and production readiness of tooling and equipment; employees; and initial product
quality. Our failure to successfully launch material new or takeover business could have a material adverse effect on our profitability and reputation.
Operational Underperformance: From time to time, we may have some operating divisions which are not performing at expected levels of
profitability. The complexity of automotive manufacturing operations often makes it difficult to achieve a quick turnaround of underperforming
divisions. Significant underperformance of one or more operating divisions could have a material adverse effect on our profitability and operations.
RISK FACTORS
Our short and medium-term operational success, as well as our ability to create long-term value through our business strategy, are subject to risks and
uncertainties. The following are the more significant such risks:
•
•
•
•
•
•
•
•
•
•
MAGNA INTERNATIONAL INC. 27

Restructuring Costs: We may sell some product lines and/or downsize, close or sell some of our operating divisions. By taking such actions, we
may incur restructuring, downsizing and/or other significant non-recurring costs. These costs may be higher in some countries than others and
could have a material adverse effect on our profitability.
Impairments: From time to time, we record significant impairment charges related to goodwill and/or long-lived assets. The early termination,
loss, renegotiation of the terms of, or delay in the implementation of, any significant production contract could be indicators of impairment, as may
the technological obsolescence of any of our products or production assets. In conducting our impairment analysis, we make forward-looking
assumptions regarding: the impact of turnaround plans on underperforming operations; new business opportunities; program price and cost
assumptions on current and future business; the timing and success of new program launches; and forecast production volumes. To the extent such
forward-looking assumptions are not met, any resulting impairment loss could have a material adverse effect on our profitability.
Supply Disruptions: Events attributable to us or our suppliers which prevent us from supplying products to our customers could result in a range
of adverse consequences, including penalties or business interruption claims by our customers, loss of business and reputational damage. The
inability to promptly resume the supply of products could have a material adverse effect on our operations and profitability.
Skilled Labour Attraction/Retention: Our business depends on our ability to attract, develop and retain experienced and highly skilled
personnel. Such personnel are in high demand in some of the areas in which we compete, and competition for employees with certain types of skills
may be intense. For example, due to the rapid changes in the automotive industry, particularly in response to electrification, autonomous driving and
MaaS trends, we have a growing need for personnel with software and other technical skills, and we may face substantial competition for such
personnel, including from traditional software industry companies. The inability to attract and retain highly-skilled personnel could have an adverse
effect on our operations and our ability to fully implement our business strategy.
IT SECURITY
IT / Cybersecurity Breach: Although we have established and continue to enhance security controls intended to protect our IT systems and
infrastructure, there is no guarantee that such security measures will be effective in preventing unauthorized physical access or cyber-attacks. A
significant breach of our IT systems could: result in theft of funds; cause disruptions in our manufacturing operations; lead to the loss, destruction or
inappropriate use of sensitive data; or result in theft of our, our customers’ or our suppliers’ intellectual property or confidential information. The
occurrence of any of the foregoing could adversely affect our operations and/or reputation, and could lead to claims against us that could have a
material adverse effect on our profitability.
PRICING RISKS
Quote / Pricing Assumptions: The time between award of new production business and start of production typically ranges between two and
four years. Since product pricing is typically determined at the time of award, we are subject to significant pricing risk due to changes in input costs
and quote assumptions between the time of award and start of production. The inability to quote effectively, or the occurrence of a material change
in input cost or other quote assumptions between program award and production, could have an adverse effect on our profitability.
Customer Pricing Pressure: We face ongoing pricing pressure from OEMs, including through: quoting pre-requirements; long-term supply
agreements with mutually agreed price reductions over the life of the agreement; incremental annual price concession demands; pressure to absorb
costs related to product design, engineering and tooling; and OEM refusal to fully offset inflationary price increases. OEMs possess significant
leverage over their suppliers due to their purchasing power and the highly competitive nature of the automotive supply industry. As a result of the
broad portfolio of parts we supply to our six largest OEM customers, such customers may be able to exert greater leverage over us as compared to
our competitors. We attempt to offset price concessions and costs in a number of ways, including through negotiations with our customers,
improved operating efficiencies and cost reduction efforts. Our inability to fully offset price concessions and/or absorb design, engineering and
tooling costs, could have a material adverse effect on our profitability.
Commodity Price Volatility: Prices for certain key raw materials and commodities used in our parts, including steel and resin, can be volatile. To
the extent we are unable to offset commodity price increases by: passing such increases to our customers, by engineering products with reduced
commodity content, implementing hedging strategies, or otherwise, such additional commodity costs could have an adverse effect on our
profitability.
Scrap Steel Price Volatility: Some of our manufacturing facilities generate a significant amount of scrap steel in their manufacturing processes,
but recover some of the value through the sale of such scrap steel. Scrap steel prices can also be volatile and don’t necessarily move in the same
direction as steel prices. Declines in scrap steel prices from time to time could have an adverse effect on our profitability.
WARRANTY RISK
Repair / Replacement Costs: We are responsible for repair and replacement costs of defective products we supply to our customers. The
obligation to repair or replace defective products could have a material adverse effect on our operations and profitability.
Warranty Provisions: Warranty provisions for our powertrain systems and complete vehicle programs are established on the basis of the terms in
the applicable award agreements and our or our customers’ warranty experience with the applicable type of product. Warranty provisions for our
other products are based on our best estimate of the amounts necessary to settle existing or probable claims related to product defects. Actual
warranty experience which results in costs that exceed our warranty provisions, could have an adverse effect on our profitability.
•
•
•
•
•
•
•
•
•
•
•
28 ANNUAL REPORT 2018

ACQUISITION RISKS
Inherent Merger and Acquisition Risks: Acquisitions are subject to a range of inherent risks, including the assumption of incremental regulatory/
compliance, pricing, supply chain, commodities, labour relations, litigation, environmental, pensions, warranty, recall, IT, tax or other risks. Although
we seek to conduct appropriate levels of due diligence on our acquisition targets, these efforts may not always prove to be sufficient in identifying all
risks and liabilities related to the acquisition, including as a result of: limited access to information; time constraints for conducting due diligence;
inability to access target company facilities and/or personnel; or other limitations in the due diligence process. Additionally, we may identify risks and
liabilities that we are not able to sufficiently mitigate through appropriate contractual or other protections. The realization of any such risks could
have a material adverse effect on our profitability.
OTHER BUSINESS RISKS
Joint Ventures: We conduct certain of our operations through joint ventures under contractual arrangements under which we share management
responsibilities with one or more partners. Joint venture operations carry a range of risks, including those relating to: failure of our joint venture
partner(s) to satisfy contractual obligations; potential conflicts between us and our joint venture partner(s); strategic objectives of joint venture
partner(s) that may differ from our own; potential delays in decision-making; a more limited ability to implement some or all of our policies, practices
and controls, or control legal and regulatory compliance, within the joint venture(s); and other risks inherent to non-wholly-owned operations. The
likelihood of such occurrences and their potential effect on us vary depending on the joint venture arrangement, however, the occurrence of any such
risks could have an adverse effect on our operations, profitability and reputation.
Technology and Innovation: While we continue to invest in technology and innovation which we believe will be critical to our long-term growth,
the automotive industry is experiencing rapid technological change and significant disruption. Our ability to anticipate changes in technology and to
successfully develop and introduce new and enhanced products and/or manufacturing processes on a timely basis will be a significant factor in our
ability to remain competitive. If we are unsuccessful or are less successful than our competitors in consistently developing innovative products and/
or processes, we may be placed at a competitive disadvantage and may not be able to recover some or all of our investments and costs, which could
have a material adverse effect on our profitability and financial condition and ability to fully implement our business strategy.
Private Equity Investments in Technology Companies: In addition to our development activities, we have invested approximately $323 million in
Lyft and other technology companies. Such investments are an important element of our long-term strategy and we may make further private equity
investments in such companies. Investing in such companies involves a high degree of risk, including the potential loss of some or all of our
investment value. In addition, there is currently no public market for Lyft’s shares, nor for the shares of our other investments in start-ups, and we
may be unable to monetize our private equity investments in the future. The materialization of such investment-related risks could have an adverse
effect on our profitability and financial condition.
Evolving Business Risk Profile: The risk profile of our business continues to evolve with the increasing importance to us of product areas such as
powertrain and electronics. As our business evolves, we may face new or heightened risks, including: challenges in quoting for profitable returns on
products with leading-edge technologies for which we may not have significant quoting experience; increased warranty and recall risks on new
products and leading-edge technologies; increased product liability risks on safety-related products or systems; heightened risk of technological
obsolescence of some of our products, processes and/or assets; and difficulties in attracting or retaining employees with critical skills in
high-demand areas. Realization of one or more such risks could have a material adverse effect on our operations, profitability or financial condition.
Risks of Doing Business in Foreign Markets: The establishment of manufacturing operations in new markets carries a number of risks, including
those relating to: political, civil and economic instability and uncertainty; corruption risks; high inflation and our ability to recover inflation-related
cost increases; trade, customs and tax risks; expropriation risks; currency exchange rates; currency controls; limitations on the repatriation of funds;
insufficient infrastructure; competition to attract and retain qualified employees; and other risks associated with conducting business internationally.
Expansion of our business in non-traditional markets is an important element of our long-term strategy and, as a result, our exposure to the risks
described above may be greater in the future. The likelihood of such occurrences and their potential effect on us vary from country to country and are
unpredictable, however, the occurrence of any such risks could have an adverse effect on our operations, profitability and financial condition.
Relative Foreign Exchange Rates: Our profitability is affected by movements of our U.S. dollar reporting currency against the Canadian dollar,
the euro, the British pound and other currencies in which we generate revenues and incur expenses. Significant long-term fluctuations in relative
currency values, in particular a significant change in the relative values of the U.S. dollar, Canadian dollar or euro, could have an adverse effect on our
profitability and financial condition and any sustained change in such relative currency values could adversely impact our competitiveness in certain
geographic regions.
Financial Flexibility: The occurrence of an economic shock not contemplated in our business plan, a rapid deterioration of conditions or a
prolonged recession could result in the depletion of our cash resources, which could have a material adverse effect on our operations and financial
condition.
Credit Ratings Changes: There is no assurance that any credit rating currently assigned to us will remain in effect for any period of time or that any
rating will not be revised or withdrawn entirely by a rating agency in the future. A downgrade in the credit ratings assigned to us by one or more
agencies could increase our cost of borrowing or impact our ability to negotiate loans, which could have an adverse effect on our profitability,
financial condition and the trading price of our Common Shares.
•
•
•
•
•
•
•
•
•
MAGNA INTERNATIONAL INC. 29

LEGAL, REGULATORY AND OTHER RISKS
Legal and Regulatory Proceedings: From time to time, we may become involved in regulatory proceedings, or become liable for legal,
contractual and other claims by various parties, including customers, suppliers, former employees, class action plaintiffs and others. Depending on
the nature or duration of any potential proceedings or claims, we may incur substantial costs and expenses may be required to devote significant
management time and resources to the matters and may suffer reputational damage as a result of regulatory proceedings. On an ongoing basis, we
attempt to assess the likelihood of any adverse judgements or outcomes to these proceedings or claims, although it is difficult to predict final
outcomes with any degree of certainty. Except as disclosed from time to time in our consolidated financial statements and/or our MD&A, we do not
believe that any of the proceedings or claims to which we are currently a party will have a material adverse effect on our profitability; however, we
cannot provide any assurance to this effect.
Changes in Laws: A significant change in the current regulatory environment in our principal markets, including changes in tax and other laws
which impose additional costs on automotive manufacturers or consumers, could have an adverse effect on our profitability.
•
•
30 ANNUAL REPORT 2018

SELECTED QUARTERLY CONSOLIDATED FINANCIAL DATA
The following selected consolidated financial data has been prepared in accordance with U.S. GAAP.
For the three month periods ended
Mar 31, Jun 30, Sep 30, Dec 31,
2018 2018 2018 2018
Sales $ 10,792 $ 10,280 $ 9,618 $ 10,137Net income $ 669 $ 636 $ 560 $ 467Earnings per Common Share
Basic $ 1.84 $ 1.78 $ 1.63 $ 1.37Diluted $ 1.83 $ 1.77 $ 1.62 $ 1.37
For the three month periods ended
Mar 31, Jun 30, Sep 30, Dec 31,
2017 2017 2017 2017
Sales $ 8,900 $ 9,140 $ 8,864 $ 9,684Net income $ 587 $ 561 $ 521 $ 575Earnings per Common Share
Basic $ 1.51 $ 1.45 $ 1.39 $ 1.55Diluted $ 1.51 $ 1.44 $ 1.38 $ 1.54
The third quarter of the year is generally affected by the normal seasonal effects of lower vehicle production volumes as a result of OEM summershutdowns.
Included in the quarterly net income attributable to Magna International Inc. are the following Other Expense, net items that have been discussedabove:
For the three month periods ended
Mar 31, Jun 30, Sep 30, Dec 31,
2018 2018 2018 2018
Restructuring $ 3 $ 17 $ 2 $ 23Impairment of investment – – – 60Impairment of long-lived assets – – – 14Unrealized gain on investment revaluation – (56) – –
$ 3 $ (39) $ 2 $ 97
For the three month periods ended
Mar 31, Jun 30, Sep 30, Dec 31,
2017 2017 2017 2017
Restructuring $ 6 $ 3 $ 2 $ 18Impairment of long-lived asset – – – 64Impairment of investment – – – 17Gain on formation of a new venture – – – (45)Gain on sale of investment – – – (26)
$ 6 $ 3 $ 2 $ 28
For more information regarding our quarter over quarter results, please refer to our first, second and third quarter 2018 quarterly reports which areavailable through the internet on the Canadian Securities Administrators’ System for Electronic Document Analysis and Retrieval [‘‘SEDAR’’] which canbe accessed at www.sedar.com.
MAGNA INTERNATIONAL INC. 31

21FEB201423172215
Opinion on the Financial Statements
We have audited the accompanying consolidated balance sheets of Magna International Inc. and subsidiaries (the ‘‘Company’’) as of December 31,
2018 and 2017, the related consolidated statements of income, comprehensive income, changes in equity, and cash flows, for each of the two years in
the period ended December 31, 2018, and the related notes (collectively referred to as the ‘‘financial statements’’). In our opinion, the financial
statements present fairly, in all material respects, the financial position of the Company as of December 31, 2018 and 2017, and the results of its
operations and its cash flows for each of the two years in the period ended December 31, 2018, in conformity with accounting principles generally
accepted in the United States of America.
Basis for Opinion
These financial statements are the responsibility of the Company’s management. Our responsibility is to express an opinion on the Company’s financial
statements based on our audits. We are a public accounting firm registered with the PCAOB and are required to be independent with respect to the
Company in accordance with the U.S. federal securities laws and the applicable rules and regulations of the Securities and Exchange Commission and
the PCAOB.
REPORT OF INDEPENDENT REGISTERED PUBLIC ACCOUNTING FIRM
To the Shareholders and the Board of Directors of Magna International Inc.
We have also audited, in accordance with the standards of the Public Company Accounting Oversight Board (United States) (PCAOB), the Company’s
internal control over financial reporting as of December 31, 2018, based on criteria established in Internal Control – Integrated Framework (2013) issued
by the Committee of Sponsoring Organizations of the Treadway Commission and our report dated March 7, 2019, expressed an unqualified opinion on
the Company’s internal control over financial reporting.
We conducted our audits in accordance with the standards of the PCAOB. Those standards require that we plan and perform the audit to obtain
reasonable assurance about whether the financial statements are free of material misstatement, whether due to error or fraud. Our audits included
performing procedures to assess the risks of material misstatement of the financial statements, whether due to error or fraud, and performing
procedures that respond to those risks. Such procedures included examining, on a test basis, evidence regarding the amounts and disclosures in the
financial statements. Our audits also included evaluating the accounting principles used and significant estimates made by management, as well as
evaluating the overall presentation of the financial statements. We believe that our audits provide a reasonable basis for our opinion.
Chartered Professional Accountants
Licensed Public Accountants
Toronto, Canada
March 7, 2019
We have served as the Company’s auditor since 2014.
32 ANNUAL REPORT 2018

21FEB201423172215
Opinion on Internal Control over Financial Reporting
We have audited the internal control over financial reporting of Magna International Inc. and subsidiaries (the ‘‘Company’’) as of December 31, 2018,
based on criteria established in Internal Control – Integrated Framework (2013) issued by the Committee of Sponsoring Organizations of the Treadway
Commission (COSO). In our opinion, the Company maintained, in all material respects, effective internal control over financial reporting as of
December 31, 2018, based on criteria established in Internal Control – Integrated Framework (2013) issued by COSO.
Basis for Opinion
The Company’s management is responsible for maintaining effective internal control over financial reporting and for its assessment of the effectiveness
of internal control over financial reporting, included in the accompanying Management’s Annual Report on Internal Control over Financial Reporting.
Our responsibility is to express an opinion on the Company’s internal control over financial reporting based on our audit. We are a public accounting
firm registered with the PCAOB and are required to be independent with respect to the Company in accordance with the U.S. federal securities laws
and the applicable rules and regulations of the Securities and Exchange Commission and the PCAOB.
Definition and Limitations of Internal Control over Financial Reporting
A company’s internal control over financial reporting is a process designed to provide reasonable assurance regarding the reliability of financial
reporting and the preparation of financial statements for external purposes in accordance with generally accepted accounting principles. A company’s
internal control over financial reporting includes those policies and procedures that (1) pertain to the maintenance of records that, in reasonable detail,
accurately and fairly reflect the transactions and dispositions of the assets of the company; (2) provide reasonable assurance that transactions are
recorded as necessary to permit preparation of financial statements in accordance with generally accepted accounting principles, and that receipts
and expenditures of the company are being made only in accordance with authorizations of management and directors of the company; and (3) provide
reasonable assurance regarding prevention or timely detection of unauthorized acquisition, use, or disposition of the company’s assets that could have
a material effect on the financial statements.
REPORT OF INDEPENDENT REGISTERED PUBLIC ACCOUNTING FIRM
To the Shareholders and the Board of Directors of Magna International Inc.
We have also audited, in accordance with the standards of the Public Company Accounting Oversight Board (United States) (PCAOB), the consolidated
financial statements as of and for the year ended December 31, 2018 of the Company and our report dated March 7, 2019, expressed unqualified
opinion on those financial statements.
We conducted our audit in accordance with the standards of the PCAOB. Those standards require that we plan and perform the audit to obtain
reasonable assurance about whether effective internal control over financial reporting was maintained in all material respects. Our audit included
obtaining an understanding of internal control over financial reporting, assessing the risk that a material weakness exists, testing and evaluating the
design and operating effectiveness of internal control based on the assessed risk, and performing such other procedures as we considered necessary
in the circumstances. We believe that our audit provides a reasonable basis for our opinion.
Because of its inherent limitations, internal control over financial reporting may not prevent or detect misstatements. Also, projections of any evaluation
of effectiveness to future periods are subject to the risk that controls may become inadequate because of changes in conditions, or that the degree of
compliance with the policies or procedures may deteriorate.
Chartered Professional Accountants
Licensed Public Accountants
Toronto, Canada
March 7, 2019
MAGNA INTERNATIONAL INC. 33
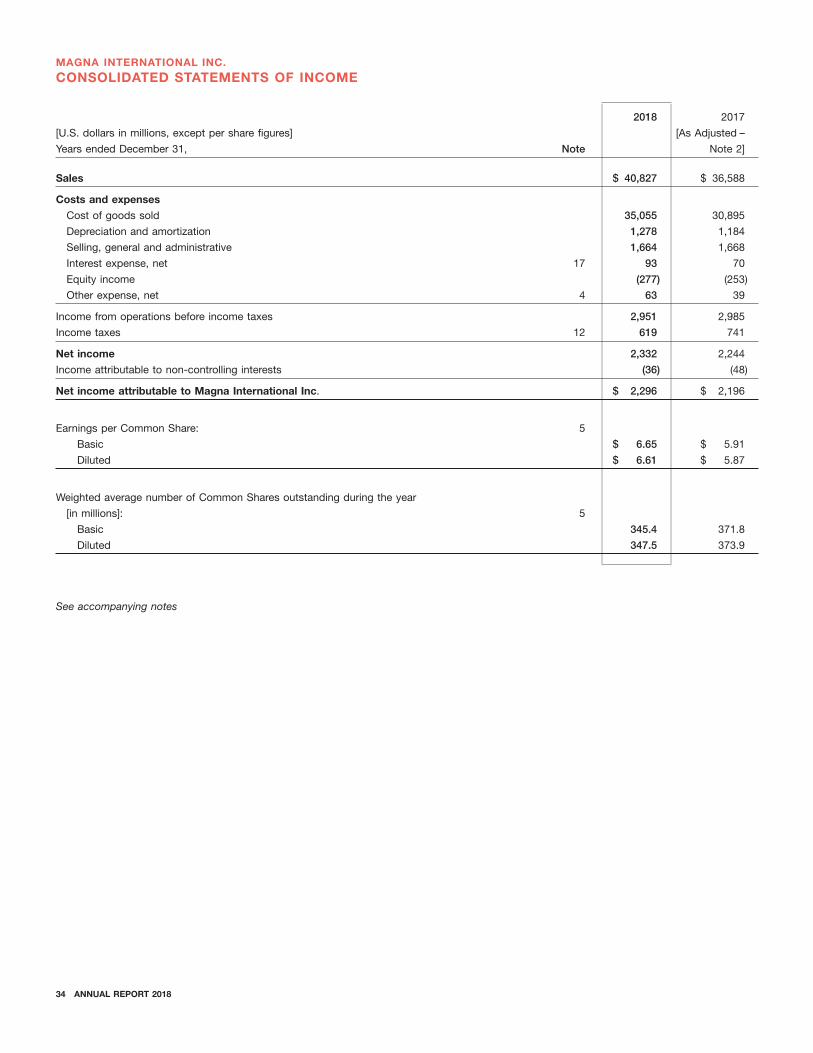
See accompanying notes
2018 2017
[U.S. dollars in millions, except per share figures] [As Adjusted –
Years ended December 31, Note Note 2]
Sales $ 40,827 $ 36,588
Costs and expenses
Cost of goods sold 35,055 30,895
Depreciation and amortization 1,278 1,184
Selling, general and administrative 1,664 1,668
Interest expense, net 17 93 70
Equity income (277) (253)
Other expense, net 4 63 39
Income from operations before income taxes 2,951 2,985
Income taxes 12 619 741
Net income 2,332 2,244
Income attributable to non-controlling interests (36) (48)
Net income attributable to Magna International Inc. $ 2,296 $ 2,196
Earnings per Common Share: 5
Basic $ 6.65 $ 5.91
Diluted $ 6.61 $ 5.87
Weighted average number of Common Shares outstanding during the year
[in millions]: 5
Basic 345.4 371.8
Diluted 347.5 373.9
34 ANNUAL REPORT 2018
MAGNA INTERNATIONAL INC.
CONSOLIDATED STATEMENTS OF INCOME

See accompanying notes
2018 2017
[U.S. dollars in millions] [As Adjusted –
Years ended December 31, Note Note 2]
Net income $ 2,332 $ 2,244
Other comprehensive (loss) income, net of tax: 21
Net unrealized (loss) gain on translation of net investment in foreign operations (515) 685
Net unrealized (loss) gain on cash flow hedges (106) 114
Reclassification of net (gain) loss on cash flow hedges to net income (1) 60
Reclassification of net loss on pensions to net income 6 5
Pension and post-retirement benefits (13) 8
Other comprehensive (loss) income (629) 872
Comprehensive income 1,703 3,116
Comprehensive income attributable to non-controlling interests (11) (79)
Comprehensive income attributable to Magna International Inc. $ 1,692 $ 3,037
MAGNA INTERNATIONAL INC. 35
MAGNA INTERNATIONAL INC.
CONSOLIDATED STATEMENTS OF COMPREHENSIVE INCOME

13MAR201805330837 13MAR201805331951
2018 2017
[U.S. dollars in millions, except shares issued] [As Adjusted –
As at December 31, Note Note 2]
ASSETSCurrent assetsCash and cash equivalents 6 $ 684 $ 726Accounts receivable 6,548 6,695Inventories 8 3,403 3,542Prepaid expenses and other 193 237Income taxes receivable 57 –Assets held for sale 3 949 –
11,834 11,200Investments 9, 18 2,189 2,079Fixed assets, net 10 8,095 8,176Intangible assets, net 13 560 650Goodwill 7, 11 1,979 2,099Deferred tax assets 12 300 238Other assets 14, 18 988 1,026
$ 25,945 $ 25,468
LIABILITIES AND SHAREHOLDERS’ EQUITYCurrent liabilitiesShort-term borrowings 17 $ 1,098 $ 259Accounts payable 6,094 6,283Accrued salaries and wages 15 769 836Other accrued liabilities 16 1,734 1,739Income taxes payable – 18Long-term debt due within one year 17 201 108Liabilities held for sale 3 408 –
10,304 9,243Long-term debt 17 3,084 3,195Long-term employee benefit liabilities 18 597 670Other long-term liabilities 19 400 326Deferred tax liabilities 12 401 322
14,786 13,756
Shareholders’ equityCommon Shares [issued: 2018 – 327,339,095; 2017 – 358,063,217] 20 3,380 3,617Contributed surplus 120 119Retained earnings 8,376 8,074Accumulated other comprehensive loss 21 (1,175) (600)
10,701 11,210Non-controlling interests 458 502
11,159 11,712
$ 25,945 $ 25,468
Commitments and contingencies [notes 17, 22 and 23]
See accompanying notes
On behalf of the Board:
Lawrence D. Worrall William L. YoungDirector Chairman of the Board
36 ANNUAL REPORT 2018
MAGNA INTERNATIONAL INC.CONSOLIDATED BALANCE SHEETS
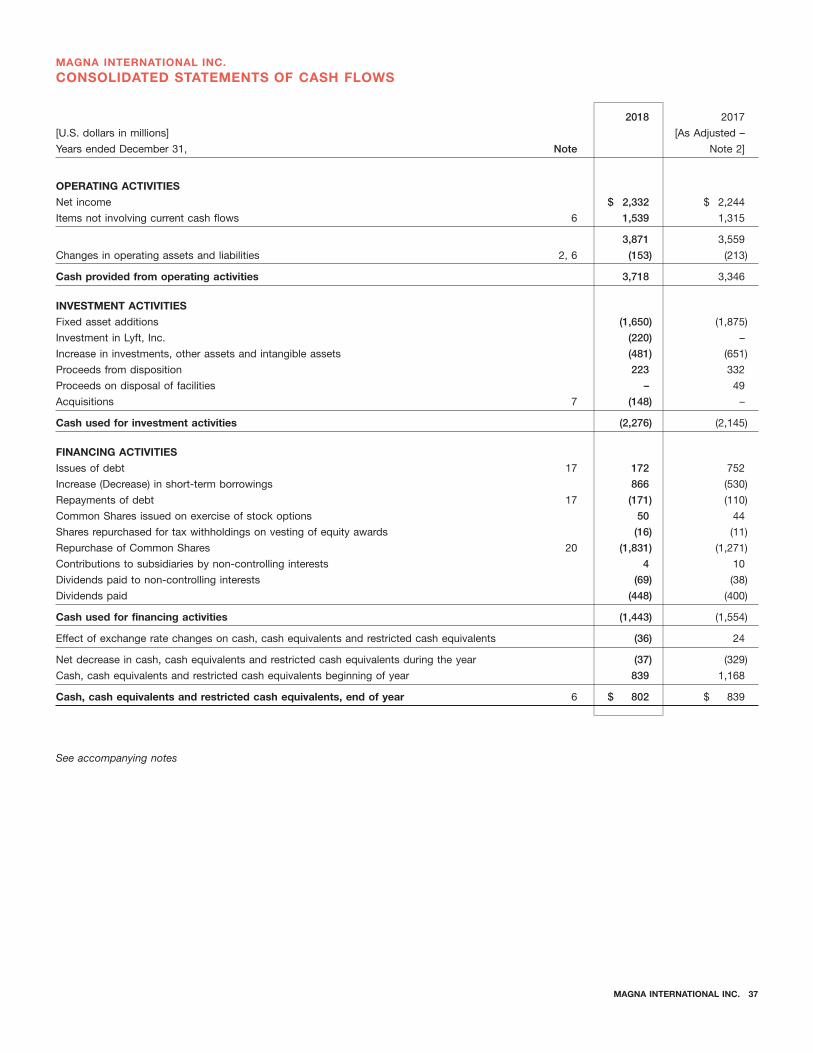
See accompanying notes
2018 2017
[U.S. dollars in millions] [As Adjusted –
Years ended December 31, Note Note 2]
OPERATING ACTIVITIES
Net income $ 2,332 $ 2,244
Items not involving current cash flows 6 1,539 1,315
3,871 3,559
Changes in operating assets and liabilities 2, 6 (153) (213)
Cash provided from operating activities 3,718 3,346
INVESTMENT ACTIVITIES
Fixed asset additions (1,650) (1,875)
Investment in Lyft, Inc. (220) –
Increase in investments, other assets and intangible assets (481) (651)
Proceeds from disposition 223 332
Proceeds on disposal of facilities – 49
Acquisitions 7 (148) –
Cash used for investment activities (2,276) (2,145)
FINANCING ACTIVITIES
Issues of debt 17 172 752
Increase (Decrease) in short-term borrowings 866 (530)
Repayments of debt 17 (171) (110)
Common Shares issued on exercise of stock options 50 44
Shares repurchased for tax withholdings on vesting of equity awards (16) (11)
Repurchase of Common Shares 20 (1,831) (1,271)
Contributions to subsidiaries by non-controlling interests 4 10
Dividends paid to non-controlling interests (69) (38)
Dividends paid (448) (400)
Cash used for financing activities (1,443) (1,554)
Effect of exchange rate changes on cash, cash equivalents and restricted cash equivalents (36) 24
Net decrease in cash, cash equivalents and restricted cash equivalents during the year (37) (329)
Cash, cash equivalents and restricted cash equivalents beginning of year 839 1,168
Cash, cash equivalents and restricted cash equivalents, end of year 6 $ 802 $ 839
MAGNA INTERNATIONAL INC. 37
MAGNA INTERNATIONAL INC.
CONSOLIDATED STATEMENTS OF CASH FLOWS

See accompanying notes
Common Shares
Non-
[U.S. dollars in millions, except number Stated Contributed Retained controlling Total
of common shares] Number Value Surplus Earnings AOCL [i] Interests Equity
Balance, December 31, 2016 382.3 $ 3,796 $ 105 $ 7,318 $ (1,451) $ 451 $ 10,219
Adoption of ASC 606 [note 2] (5) (5)
Balance, December 31, 2016, as adjusted 382.3 $ 3,796 $ 105 $ 7,313 $ (1,451) $ 451 $ 10,214
Net income, as adjusted [note 2] 2,196 48 2,244
Other comprehensive income, as adjusted [note 2] 841 31 872
Shares issued on exercise of stock options 1.7 56 (12) 44
Release of stock and stock units 0.4 22 (22) –
Shares repurchased for tax withholdings
on vesting of equity awards (0.2) (2) (9) (11)
Repurchase and cancellation under normal
course issuer bids [note 20] (26.2) (262) (1,030) 21 (1,271)
Stock-based compensation expense 48 48
Reclassification of tax effect [note 21] 11 (11) –
Contributions by non-controlling interests 10 10
Dividends paid to non-controlling interests (38) (38)
Dividends paid [$1.10 per share] 0.1 7 (407) (400)
Balance, December 31, 2017 358.1 $ 3,617 $ 119 $ 8,074 $ (600) $ 502 $ 11,712
Adoption of ASU No. 2016-16 [note 2] 3 3
Balance, December 31, 2017, as adjusted 358.1 $ 3,617 $ 119 $ 8,077 $ (600) $ 502 $ 11,715
Net income 2,296 36 2,332
Other comprehensive loss (604) (25) (629)
Shares issued on exercise of stock options 1.3 60 (10) 50
Release of stock and stock units 0.6 30 (30) –
Shares repurchased for tax withholdings
on vesting of equity awards (0.3) (3) (13) (16)
Repurchase and cancellation under
normal course issuer bids [note 20] (32.6) (334) (1,526) 29 (1,831)
Stock-based compensation expense 41 41
Contribution by non-controlling interests 4 4
Acquisition 10 10
Dividends paid to non-controlling interests (69) (69)
Dividends paid [$1.32 per share] 0.2 10 (458) (448)
Balance, December 31, 2018 327.3 $ 3,380 $ 120 $ 8,376 $ (1,175) $ 458 $ 11,159
[i] AOCL is Accumulated Other Comprehensive Loss.
38 ANNUAL REPORT 2018
MAGNA INTERNATIONAL INC.
CONSOLIDATED STATEMENTS OF CHANGES IN EQUITY

Principles of consolidation
Foreign currency translation
Cash and cash equivalents
Inventories
Long-lived assets
MAGNA INTERNATIONAL INC.
NOTES TO CONSOLIDATED FINANCIAL STATEMENTS
[All amounts in U.S. dollars and all tabular amounts in millions, except per share figures, unless otherwise noted]
1. SIGNIFICANT ACCOUNTING POLICIES
Magna International Inc. [collectively ‘‘Magna’’ or the ‘‘Company’’] is a global automotive supplier which has complete vehicle engineering and contract
manufacturing expertise, as well as product capabilities which include body, chassis, exterior, seating, powertrain, active driver assistance, electronics,
vision, mechatronics and roof systems. Magna also has electronic and software capabilities across many of these areas.
The consolidated financial statements have been prepared in U.S. dollars following accounting principles generally accepted in the United States
[‘‘GAAP’’].
The Consolidated Financial Statements include the accounts of Magna and its subsidiaries in which Magna has a controlling financial interest or is the
primary beneficiary. The Company presents non-controlling interests as a separate component within Shareholders’ equity in the Consolidated
Balance Sheets. All intercompany balances and transactions have been eliminated.
The Company operates globally, which gives rise to a risk that its earnings and cash flows may be adversely impacted by fluctuations in foreign
exchange rates.
Assets and liabilities of the Company’s operations having a functional currency other than the U.S. dollar are translated into U.S. dollars using the
exchange rate in effect at year end, and revenues and expenses are translated at the average rate during the year. Exchange gains or losses on
translation of the Company’s net investment in these operations are included in comprehensive income and are deferred in accumulated other
comprehensive income. Foreign exchange gains or losses on debt that was designated as a hedge of the Company’s net investment in these
operations are also recorded in accumulated other comprehensive income.
Foreign exchange gains and losses on transactions occurring in a currency other than an operation’s functional currency are reflected in income,
except for gains and losses on foreign exchange contracts used to hedge specific future commitments in foreign currencies and on intercompany
balances which are designated as long-term investments. In particular, the Company uses foreign exchange forward contracts for the sole purpose of
hedging certain of the Company’s future committed foreign currency based outflows and inflows. Most of the Company’s foreign exchange contracts
are subject to master netting arrangements that provide for the net settlement of contracts, by counterparty, in the event of default or termination. All
derivative instruments, including foreign exchange contracts, are recorded on the consolidated balance sheet at fair value. The fair values of derivatives
are recorded on a gross basis in prepaid expenses and other, other assets, other accrued liabilities or other long-term liabilities. To the extent that cash
flow hedges are effective, the change in their fair value is recorded in other comprehensive income; any ineffective portion is recorded in net income.
Amounts accumulated in other comprehensive income are reclassified to net income in the period in which the hedged item affects net income.
If the Company’s foreign exchange forward contracts cease to be effective as hedges, for example, if projected foreign cash inflows or outflows
declined significantly, gains or losses pertaining to the portion of the hedging transactions in excess of projected foreign currency denominated cash
flows would be recognized in income at the time this condition was identified.
Cash and cash equivalents include cash on account, demand deposits and short-term investments with remaining maturities of less than three months
at acquisition.
Production inventories and tooling inventories manufactured in-house are valued at the lower of cost determined substantially on a first-in, first-out
basis, or net realizable value. Cost includes the cost of materials plus direct labour applied to the product and the applicable share of manufacturing
overhead.
Outsourced tooling inventories are valued at the lower of subcontracted costs and market.
Fixed assets are recorded at historical cost. Depreciation is provided on a straight-line basis over the estimated useful lives of fixed assets at annual
rates of 21⁄2% to 5% for buildings, 7% to 10% for general purpose equipment and 10% to 33% for special purpose equipment.
Finite-lived intangible assets, which have arisen principally through acquisitions, include customer relationship intangibles and patents and licences.
These finite-lived intangible assets are amortized on a straight-line basis over their estimated useful lives which range from 4 to 15 years.
The Company assesses fixed and finite-lived intangible assets for recoverability whenever indicators of impairment exist. If the carrying value of the
asset exceeds the estimated undiscounted cash flows from the use of the asset, then an impairment loss is recognized to write the asset down to fair
value. The fair value of fixed and finite-lived intangible assets is generally determined using estimated discounted future cash flows.
MAGNA INTERNATIONAL INC. 39

Goodwill
Investments
Other assets
Tooling and Pre-Production Engineering Costs Related to Long-Term Supply Agreements
Warranty
Goodwill represents the excess of the cost of an acquired enterprise over the fair value of the identifiable assets acquired and liabilities assumed less
any subsequent write-downs for impairment. Goodwill is reviewed for impairment in the fourth quarter of each year, or more frequently if indicators of
potential impairment exist. Goodwill impairment is assessed based on a comparison of the fair value of a reporting unit to the underlying carrying value
of the reporting unit’s net assets, including goodwill. When the carrying amount of the reporting unit exceeds its fair value, an impairment is recognized
based on that difference. The fair value of a reporting unit is determined using the estimated discounted future cash flows of the reporting unit.
The Company accounts for investments in companies over which it has the ability to exercise significant influence but does not hold a controlling
financial interest, under the equity method [‘‘Equity method investments’’]. In some cases, investments are accounted for under the equity method
despite holding a controlling ownership interest, as a result of significant participating rights that prevent control. Under the equity method, the
Company records its proportionate share of income or losses in Equity income in the Consolidated Statements of Income.
The Company has private equity investments comprised of technology investments in certain non-consolidated affiliates over which it does not have
the ability to exercise significant influence. The Company has elected to use the measurement alternative, defined as cost, less impairments, adjusted
by observable price changes to measure these private equity investments. As a result, these private equity investments are classified within Level 3 in
the fair value hierarchy because the Company estimates the value based on valuation methods using the observable transaction price at the
transaction date and other observable inputs including rights and obligations of the securities held by the Company.
The Company monitors its equity method investments for indicators of other-than-temporary declines in value on an ongoing basis in accordance with
GAAP. If the Company determines that an other-than-temporary decline in value has occurred, it recognizes an impairment loss, which is measured as
the difference between the recorded book value and the fair value of the investment. Private equity investments are also subject to impairment reviews
conducted on a quarterly basis. The Company’s impairment analysis considers both qualitative and quantitative factors that may have a significant
impact on the investee’s fair value. Upon determining that an impairment may exist, the security’s fair value is calculated and compared to its carrying
value. An impairment is recognized immediately if the carrying value exceeds the fair value. Fair value is generally determined using an income
approach based on discounted cash flows. The inputs utilized in the analyses are classified as Level 3 inputs within the fair value hierarchy as defined in
ASC 820, ‘‘Fair Value Measurement’’ and primarily consist of expected investee revenue and costs, estimated production volumes and discount rates.
Other assets include the long-term portion of certain receivables, which represent the recognized sales value of tooling and design and engineering
services provided to customers under certain long-term contracts. The receivables will be paid in full upon completion of the contracts or in instalments
based on forecasted production volumes. In the event that actual production volumes are less than those forecasted, a reimbursement for any shortfall
will be made.
The Company incurs pre-production engineering and tooling costs related to the products produced for its customers under long-term supply
agreements. Customer reimbursements for tooling and pre-production engineering activities that are part of a long-term supply arrangement, are
accounted for as a reduction of cost. Pre-production costs related to long-term supply arrangements with a contractual guarantee for reimbursement
are included in the Company’s Other assets.
The Company expenses all pre-production engineering costs for which reimbursement is not contractually guaranteed by the customer. All
pre-production tooling costs related to customer-owned tools for which reimbursement is not contractually guaranteed by the customer or for which
the Company does not have a non-cancelable right to use the tooling is also expensed.
The Company has assurance warranties and records product warranty liabilities based on its individual customer agreements. Under most customer
agreements, the Company only accounts for existing or probable claims on product default issues when amounts related to such issues are probable
and reasonably estimable. Under certain powertrain and complete vehicle engineering and assembly contracts, the Company records an estimate of
future warranty-related costs based on the terms of the specific customer agreements and the specific customer’s warranty experience.
Product liability provisions are established based on the Company’s best estimate of the amounts necessary to settle existing claims on product default
issues. Recall costs are costs incurred when government regulators and/or the customer decides to recall a product due to a known or suspected
performance issue, and the Company is required to participate, either voluntarily or involuntarily. Costs typically include the cost of the product being
replaced, the customer’s cost of the recall and labour to remove and replace the defective part. When a decision to recall a product has been made or is
probable, the Company’s portion of the estimated cost of the recall is recorded as a charge to income in that period. In making this estimate, judgement
is required as to the number of units that may be returned as a result of the recall, the total cost of the recall campaign and the ultimate negotiated
sharing of the cost between the Company, the customer and, in some cases, a supplier to the Company.
The Company monitors warranty activity on an ongoing basis and adjusts reserve estimates when it is probable that future warranty costs will be
different than those estimates.
40 ANNUAL REPORT 2018

Employee future benefit plans
Revenue recognition
Contract Assets and Liabilities
The cost of providing benefits through defined benefit pensions, lump sum termination and long service payment arrangements, and post-retirement
benefits other than pensions is actuarially determined and recognized in income using the projected benefit method pro-rated on service and
management’s best estimate of expected plan investment performance, salary escalation, retirement ages of employees and, with respect to medical
benefits, expected health care costs. Differences arising from plan amendments, changes in assumptions and experience gains and losses that are
greater than 10% of the greater of the accrued benefit obligation at the beginning of the year and the fair value, or market related value, of plan assets at
the beginning of the year, are recognized in income over the expected average remaining service life of employees. Gains related to plan curtailments
are recognized when the event giving rise to the curtailment has occurred. Plan assets are valued at fair value. The cost of providing benefits through
defined contribution pension plans is charged to income in the period in respect of which contributions become payable.
The funded status of the plans is measured as the difference between the plan assets at fair value and the projected benefit obligation [‘‘PBO’’]. The
aggregate of all overfunded plans is recorded in other assets, and the aggregate of all underfunded plans in long-term employee benefit liabilities. The
portion of the amount by which the actuarial present value of benefits included in the PBO exceeds the fair value of plan assets, payable in the next
twelve months, is reflected in other accrued liabilities. This is determined on a plan by plan basis.
The Company enters into contracts with its customers to provide production parts or assembled vehicles. Contracts do not commit the customer to a
specified quantity of products; however, the Company is generally required to fulfill its customers’ purchasing requirements for the production life of the
vehicle. Contracts do not typically become a performance obligation until the Company receives either a purchase order and/or a customer release for
a specific number of parts or assembled vehicles at a specified price. While long-term supply agreements may range from five to seven years, contracts
may be terminated by customers at any time. Historically, terminations have been minimal. Contracts may also provide for annual price reductions over
the production life of the vehicle, and prices are adjusted on an ongoing basis to reflect changes in product content/cost and other commercial factors.
Revenue is recognized at a point in time when control of the parts produced or assembled vehicles are transferred to the customer according to the
terms of the contract. The amount of revenue recognized reflects the consideration that the Company expects to be entitled to in exchange for those
products based on purchase orders, annual price reductions and ongoing price adjustments [some of which is accounted for as variable
consideration]. The Company uses the expected value method, taking into account historical data and the status of current negotiations, to estimate
the amount to which it expects to be entitled. Significant changes to the Company’s estimates of variable consideration are not expected.
The Company’s complete vehicle assembly contracts with customers are complex and often include promises to transfer multiple products and
services to a customer, some of which may be implicitly contracted for. For these complex arrangements, each good or service is evaluated to
determine whether it represents a distinct performance obligation, and whether it should be characterized as revenue or reimbursement of costs
incurred. The total transaction price is then allocated to the distinct performance obligations based on the expected cost or cost plus a margin
approach and recognized as revenue as discussed above.
The Company also performs tooling and engineering activities for its customers that are not part of a long-term production arrangement. Tooling and
engineering revenue are recognized at a point in time or over time depending, among other considerations, on whether the Company has an
enforceable right to payment plus a reasonable profit, for performance completed to date. Over-time recognition utilizes costs incurred to date relative
to total estimated costs at completion, to measure progress toward satisfying performance obligations. Revenue is recognized as control is transferred
to customers, in an amount that reflects the consideration the Company expects to be entitled to in exchange for those goods and services. Total
tooling and engineering sales were $824.6 million [2017 – $669.5 million] for the year ended December 31, 2018.
The Company’s customers pay for products received in accordance with payment terms that are customary in the industry, typically 30 to 90 days. The
Company’s contracts with its customers do not have significant financing components.
Amounts billed to customers related to shipping and handling costs are included in Sales in the Consolidated Statements of Income. Shipping and
handling costs are accounted for as fulfillment costs and are included in Cost of goods sold in the Consolidated Statements of Income.
Taxes assessed by a governmental authority that are both imposed on and concurrent with a specific revenue-producing transaction that are collected
by the Company from a customer are excluded from revenue.
For revenues disaggregated by product group and geography, refer to Segmented Information [note 24].
The Company does not disclose the value of unsatisfied performance obligations for [i] contracts with an original expected length of one year or less
and [ii] contracts for which it recognizes revenue at the amount to which it has the right to invoice for services performed.
The Company’s contract assets include both billed and unbilled accounts receivable and are included in the Accounts Receivable balance. Unbilled
amounts typically result from sales of standalone tooling and engineering activities where revenue recognized exceeds the amount billed to the
customer. Amounts may not exceed their net realizable value. As at December 31, 2018, the Company’s unbilled accounts receivable balance was
$293 million [2017 – $305 million]. Accounts receivable related to production, tooling and engineering sales were $4.3 billion as of December 31, 2018
[2017 – $5 billion]. Contract assets do not include the costs of obtaining or fulfilling a contract with a customer, as these amounts are generally
expensed as incurred.
MAGNA INTERNATIONAL INC. 41

Government assistance
Research and development
Income taxes
Earnings per Common Share
Use of estimates
ACCOUNTING CHANGES
New Segment Structure
Customer advances are recorded as deferred revenue [a contract liability]. For the year ended December 31, 2018, the contract liability balance was
$176 million. There were no significant contract liabilities recorded for the year ended December 31, 2017. In addition there were no significant contract
liabilities recognized in revenue during the year ended December 31, 2018.
The Company makes periodic applications for financial assistance under available government assistance programs in the various jurisdictions that the
Company operates. Grants relating to capital expenditures are reflected as a reduction of the cost of the related assets. Grants relating to current
operating expenditures are generally recorded as a reduction of the related expense at the time the eligible expenses are incurred. The Company also
receives tax credits and tax super allowances, the benefits of which are recorded as a reduction of income tax expense. In addition, the Company
receives loans which are recorded as liabilities in amounts equal to the cash received. When a government loan is issued to the Company at a below-
market rate of interest, the loan is initially recorded at its net present value, and accreted to its face value over the period of the loan. The benefit of the
below-market rate of interest is accounted for like a government grant. It is measured as the difference between the initial carrying value of the loan and
the cash proceeds received.
Costs incurred in connection with research and development activities, to the extent not recoverable from the Company’s customers, are charged to
expense as incurred. For the years ended December 31, 2018 and 2017, research and development costs charged to expense were approximately
$588 million and $522 million, respectively.
The Company uses the liability method of tax allocation to account for income taxes. Under the liability method of tax allocation, deferred tax assets
and liabilities are determined based on differences between the financial reporting and tax bases of assets and liabilities and are measured using the
enacted tax rates and laws that will be in effect when the differences are expected to reverse.
No deferred tax liability is recorded for taxes on undistributed earnings and translation adjustments of foreign subsidiaries if these items are either
considered to be reinvested for the foreseeable future or if they are available for repatriation and are not subject to further tax on remittance. Taxes are
recorded on such foreign undistributed earnings and translation adjustments when it becomes apparent that such earnings will be distributed in the
foreseeable future and the Company will incur further significant tax on remittance.
Recognition of uncertain tax positions is dependent on whether it is more-likely-than-not that a tax position taken or expected to be taken in a tax return
will be sustained upon examination, including resolution of any related appeals or litigation processes, based on the technical merits of the position. A
tax position that meets the more-likely-than-not recognition threshold is measured at the largest amount of tax benefit that is greater than 50% likely of
being realized upon ultimate settlement. The Company recognizes interest and penalties related to uncertain tax positions in income tax expense.
Basic earnings per Common Share are calculated on net income attributable to Magna International Inc. using the weighted average number of
Common Shares outstanding during the year.
Diluted earnings per Common Share are calculated on the weighted average number of Common Shares outstanding, including an adjustment for
stock options outstanding using the treasury stock method.
Common Shares that have not been released under the Company’s restricted stock plan or are being held in trust for purposes of the Company’s
restricted stock unit program have been excluded from the calculation of basic earnings per share but have been included in the calculation of diluted
earnings per share.
The preparation of the consolidated financial statements in conformity with GAAP requires management to make estimates and assumptions that
affect the amounts reported and disclosed in the consolidated financial statements and accompanying notes. Actual results could differ from those
estimates.
Certain amounts in the prior period have been reclassified to conform with current period presentation [note 2].
2. ACCOUNTING STANDARDS
The Company announced a realignment of its management structure along product lines in December 2017. As a result, effective January 1, 2018, the
Company’s results are reported through the following business segments: Body Exteriors & Structures, Power & Vision, Seating Systems and Complete
Vehicles. Prior period amounts contained in these audited consolidated financial statements have been adjusted to conform to the new segment
presentation. Refer to Note 24 for additional information.
42 ANNUAL REPORT 2018

Revenue Recognition
Impact of Adopting ASC 606
On January 1, 2018, the Company adopted ASC 606, Revenue from Contracts with Customers [‘‘new revenue standard’’] using the full retrospective
transition method. The Company recognized a net reduction to opening retained earnings of $5 million as of January 1, 2017 due to the cumulative
impact of adopting the new revenue standard. The impact was primarily due to a change in the timing of recognition for customer reimbursements for
tooling and pre-production engineering activities.
The impact of adopting the new revenue standard affected certain balances in the Consolidated Statements of Income as follows:
2017
Decrease in sales $ (2,358)
Decrease in cost of goods sold (2,363)
Increase in depreciation and amortization 11
Decrease in equity income 8
Decrease in income from operations before income taxes (14)
Decrease in income taxes (3)
Decrease in net income (11)
Decrease in income attributable to non-controlling interests 1
Decrease in net income attributable to Magna International Inc. $ (10)
Earnings per Common Share:
Basic $ (0.02)
Diluted $ (0.03)
The decrease in Sales and Cost of goods sold for the period was primarily a result of the change in the accounting for tooling and pre-production
engineering activities as a cost recovery rather than as revenue, and also due to a change in the timing of recognition for customer reimbursements
related to tooling and pre-production engineering activities.
The impact of adopting the new revenue standard affected certain balances in the Consolidated Balance Sheets as follows:
2017
ASSETS
Decrease in accounts receivable $ (183)
Increase in inventories 163
Decrease in investments (9)
Increase in fixed assets, net 35
Increase in deferred tax assets 2
Increase in other assets 67
LIABILITIES AND SHAREHOLDERS’ EQUITY
Decrease in accounts payable $ (3)
Increase in other accrued liabilities 77
Increase in other long-term liabilities 22
Decrease in deferred tax liabilities (1)
Decrease in retained earnings (15)
Decrease in accumulated other comprehensive loss (3)
Decrease in non-controlling interests (2)
MAGNA INTERNATIONAL INC. 43

Income Taxes
Pensions
Financial Instruments
FUTURE ACCOUNTING STANDARDS
Derivatives and Hedging
Leases
The impact of adopting the new revenue standard affected certain balances in the Consolidated Statements of Cash Flows as follows:
2017
OPERATING ACTIVITIES
Decrease in net income $ (11)
Increase in items not involving current cash flows 9
(2)
Decrease in changes in operating assets and liabilities 19
Increase in cash provided from operating activities 17
INVESTING ACTIVITIES
Increase in fixed asset additions (17)
Increase in cash used for investing activities (17)
Cash, cash equivalents and restricted cash equivalents beginning of period 1,168
Cash, cash equivalents and restricted cash equivalents, end of period $ 839
In October 2016, the FASB issued ASU No. 2016-16, ‘‘Accounting for Income Taxes: Intra-Entity Asset Transfers of Assets Other than Inventory’’. This
guidance requires that the tax effects of all intra-entity sales of assets other than inventory be recognized in the period in which the transaction occurs.
The Company adopted ASU No. 2016-16 effective January 1, 2018 on a modified retrospective basis, through a cumulative-effect adjustment to
retained earnings. The adoption of this guidance did not have a significant impact on the Company’s consolidated financial statements.
In March 2017, the FASB issued ASU 2017-07, ‘‘Compensation – Retirement Benefits (Topic 715): Improving the Presentation of Net Periodic Pension
Cost and Net Periodic Postretirement Benefit Cost (ASU 2017-07)’’ which changes the way employers that sponsor defined benefit pension and/or
postretirement benefit plans reflect net periodic benefit costs in the income statement. On January 1, 2018, the Company retrospectively adopted the
amendments to ASC 715 which requires the presentation of service cost to be separate from the other components of net periodic costs. The Company
previously recorded service cost with other compensation costs (benefits) in Cost of goods sold and Selling, general and administrative expenses. The
adoption of this guidance required the other components of net period benefit cost to be reclassified. Prior comparative figures have not been adjusted
since the impact of ASU 2017-07 is not material.
In January 2016, the FASB issued ASU No. 2016-01, ‘‘Financial Instruments – Overall (Subtopic 825-10): Recognition and Measurement of Financial
Assets and Financial Liabilities (ASU 2016-01)’’, which addresses certain aspects of recognition, measurement, presentation, and disclosure of
financial instruments. ASU 2016-01 requires the Company to measure its private equity investments at fair value, with all gains and losses, realized and
unrealized, recognized in the consolidated statement of income. The Company adopted ASU 2016-01 in the first quarter of fiscal 2018 on a prospective
basis for private equity investments.
In August 2017, the FASB issued ASU No. 2017-12, ‘‘Derivatives and Hedging (Topic 815): Targeted Improvements to Accounting for Hedging Activities
(ASU 2017-12)’’ which amends and simplifies existing guidance in order to allow companies to more accurately present the economic effects of risk
management activities in the financial statements. The amendments of this ASU are effective for reporting periods beginning after December 15, 2018,
with early adoption permitted. The adoption of ASU 2017-12 did not have a significant impact on the Company’s consolidated financial statements.
In February 2016, the FASB issued ASU No. 2016-02, ‘‘Leases: Topic 842 (ASU 2016-02)’’, to supersede nearly all existing lease guidance under GAAP.
The guidance would require lessees to recognize most leases on their balance sheets as lease liabilities with corresponding right-of-use assets
[‘‘ROU’’]. ASU 2016-02 was effective for the Company on January 1, 2019 and has been adopted using a modified retrospective approach, with the
election of certain practical expedients. The Company is implementing a new lease accounting information system, as well as new business processes
and controls to support the preparation of financial information and the disclosures required for the new standard. The adoption of ASU 2016-02 will
result in the recognition of ROU assets and lease liabilities for the Company’s operating leases, with the most significant impact from the recognition of
ROU assets and lease liabilities related to real estate operating leases. While the Company is continuing to assess the potential impacts of
ASU 2016-02, the adoption of the new standard is not expected to have a material impact on the consolidated statements of income, changes in equity
or cash flows.
44 ANNUAL REPORT 2018

Internal-Use Software
In August 2018, the FASB issued ASU No. 2018-15, ‘‘Intangibles – Goodwill and Other Internal – Use – Software (Subtopic 350-40): Customer’s
Accounting for Implementation Costs Incurred in a Cloud Computing Arrangement That Is a Service Contract (ASU 2018-15)’’. ASU 2018-15 amends
current guidance to align the accounting for costs incurred in a hosting arrangement that is a service contract with the requirements for capitalizing
costs associated with developing or obtaining internal-use software. The guidance in ASU 2018-15 is effective for annual reporting periods beginning
after December 15, 2019, with early adoption permitted. The Company adopted the standard on January 1, 2019, on a prospective basis. The adoption
of ASU 2018-15 did not have an impact on the Company’s consolidated financial statements.
3. ASSETS AND LIABILITIES HELD FOR SALE
In the third quarter of 2018, the Company entered into an agreement to sell its global Fluid Pressure & Controls [‘‘FP&C’’] business to Hanon Systems.
The purchase price for the FP&C business, is approximately $1.23 billion, subject to customary closing adjustments. The transaction is expected to
close at the end of the first quarter of 2019.
The Company determined that the assets and liabilities of the FP&C business met the criteria to be classified as held for sale as of September 30, 2018.
Accordingly, the held for sale assets and liabilities of the FP&C business were reclassified in the consolidated balance sheet at December 31, 2018 to
current assets held for sale or current liabilities held for sale, respectively, as the sale of such assets and liabilities is expected within one year. The
business is included in the Company’s Power & Vision segment and did not meet the criteria to be classified as a discontinued operation.
The following table summarizes the carrying value of the major classes of assets and liabilities of the FP&C business which were classified as held for
sale as of December 31, 2018:
2018
Accounts receivable $ 258
Inventories 140
Prepaid expenses and other 4
Investments 4
Fixed assets, net 320
Goodwill 157
Deferred tax assets 17
Other assets 11
Intangibles 38
Assets held for sale $ 949
Accounts payable $ 226
Accrued salaries and wages 30
Other accrued liabilities 76
Income taxes payable 6
Long-term employee benefit liabilities 62
Other long-term liabilities 3
Deferred tax liabilities 5
Liabilities held for sale $ 408
Since the estimated purchase price of the assets and liabilities, less costs to sell, exceeded the carrying value, no adjustments to the long-lived assets
were necessary.
MAGNA INTERNATIONAL INC. 45

[a] Body Exteriors & Structures
For the year ended December 31, 2018
For the year ended December 31, 2017
[b] Power & Vision
For the year ended December 31, 2018
For the year ended December 31, 2017
4. OTHER EXPENSE, NET
Other expense, net consists of significant items such as: restructuring charges generally related to significant plant closures or consolidations;
impairment charges; gains or losses on disposal of facilities; unrealized gains on investments; and other items not reflective of on-going operating profit
or loss. Other expense, net consists of:
2018 2017
Body Exteriors & Structures [a]
Restructuring charges $ 25 $ 15
Impairment of long-lived assets 14 64
39 79
Power & Vision [b]
Impairment of investment 60 17
Restructuring charges 20 14
80 31
Seating Systems [c]
Gain on formation of a new venture – (45)
Corporate and Other [d]
Unrealized gain on investment revaluation (56) –
Gain on sale of investment – (26)
$ 63 $ 39
During 2018, the Company recorded net restructuring charges of $25 million [$23 million after tax] related to certain Body Exteriors & Structures
facilities.
During 2018, the Company recorded fixed asset impairment charges of $14 million [$12 million after tax] related to a certain Body Exteriors &
Structures facility.
During 2017, the Company recorded net restructuring charges of $15 million [$11 million after tax] related to a certain Body Exteriors & Structures
facility.
During 2017, the Company recorded fixed asset impairment charges of $64 million [$64 million after tax] related to two Body Exteriors & Structures
facilities.
During 2018, the Company concluded that indicators of impairment were present related to its investment in Getrag Ford Transmission Gmbh
[‘‘GFT’’] and undertook an impairment analysis to determine the fair value of the investment. Based on the difference between the fair value and the
carrying value of the investment in GFT, the Company recorded an other-than-temporary impairment charge of $60 million [$59 million after tax]
[note 9].
During 2018, the Company recorded net restructuring charges of $20 million [$20 million after tax] related to certain Power & Vision facilities.
During 2017, the Company recorded an other-than-temporary impairment charge of $17 million [$17 million after tax] on one of its equity method
investments.
During 2017, the Company recorded net restructuring charges of $14 million [$14 million after tax] related to certain Power & Vision facilities.
46 ANNUAL REPORT 2018

[c] Seating Systems
For the year ended December 31, 2017
[d] Corporate and Other
For the year ended December 31, 2018
For the year ended December 31, 2017
[a] Diluted earnings per Common Share exclude 0.8 million [2017 – 1.2 million] Common Shares issuable under the Company’s Incentive Stock Option
Plan because these options were not ‘‘in-the-money’’. The dilutive effect of participating securities using the two-class method was excluded from
the calculation of earnings per share because the effect would be immaterial.
[a] Cash, cash equivalents and restricted cash equivalents consist of:
During 2017, the Company formed a new venture in China with Hubei Aviation Precision Machinery Co., Ltd. The transaction resulted in a gain of
$45 million [$34 million after tax].
During 2018, the Company recorded an unrealized gain of $56 million [$53 million after tax] on the revaluation of its private equity investments.
During 2017, the Company’s investment in Argus Cyber Security Ltd. was sold for proceeds of $33 million. A gain of $26 million [$26 million after
tax] was recognized on the sale of the investment, which was accounted for under the cost method.
5. EARNINGS PER SHARE
Earnings per share are computed as follows:
2018 2017
[As Adjusted –
Note 2]
Basic earnings per Common Share:
Net income attributable to Magna International Inc. $ 2,296 $ 2,196
Weighted average number of Common Shares outstanding during the year 345.4 371.8
Basic earnings per Common Share $ 6.65 $ 5.91
Diluted earnings per Common Share:
Net income attributable to Magna International Inc. $ 2,296 $ 2,196
Weighted average number of Common Shares outstanding during the year 345.4 371.8
Adjustments
Stock options and restricted stock [a] 2.1 2.1
347.5 373.9
Diluted earnings per Common Share $ 6.61 $ 5.87
6. DETAILS OF CASH FROM OPERATING ACTIVITIES
2018 2017
Bank term deposits and bankers’ acceptances $ 314 $ 234
Cash 370 492
Cash and cash equivalents $ 684 $ 726
Restricted cash equivalents included in prepaid expenses [note 17] 118 113
$ 802 $ 839
MAGNA INTERNATIONAL INC. 47

[b] Items not involving current cash flows:
[c] Changes in operating assets and liabilities:
2018 2017
[As Adjusted –
Note 2]
Depreciation and amortization $ 1,278 $ 1,184
Amortization of other assets included in cost of goods sold 172 127
Impairment charges [note 4] 74 81
Other non-cash charges 7 (2)
Deferred income taxes [note 12] 31 (6)
Dividends received in excess of equity income 33 2
Non-cash portion of Other expense, net (56) (71)
$ 1,539 $ 1,315
2018 2017
[As Adjusted –
Note 2]
Accounts receivable $ (351) $ (292)
Inventories (92) (397)
Prepaid expenses and other 9 25
Accounts payable 265 512
Accrued salaries and wages (3) 7
Other accrued liabilities 105 (15)
Income taxes payable (86) (53)
$ (153) $ (213)
7. ACQUISITION
On October 31, 2018, the Company completed the acquisition of 100% of the equity interest in OLSA S.p.A. [‘‘OLSA’’], a global company which
designs, engineers and manufactures tail lamps and other lighting products. The purchase price was $152 million [net of $17 million cash acquired],
and is subject to working capital and other customary purchase price adjustments.
The acquisition of OLSA was accounted for as a business combination. The following table summarizes the provisional amounts recognized for assets
acquired and liabilities assumed at their estimated fair values:
Preliminary
amounts recognized
Cash $ 17
Non-cash working capital (52)
Fixed assets 89
Goodwill 109
Intangibles 40
Long-term debt (21)
Other long-term liabilities (3)
Deferred tax liabilities (10)
Consideration paid 169
Less: Cash acquired (17)
Net cash outflow $ 152
48 ANNUAL REPORT 2018

The preliminary purchase price allocations are subject to change and may be subsequently adjusted to reflect final valuation results and other
adjustments.
Recognized goodwill is attributable to the assembled workforce, expected synergies and other intangible assets that do not qualify for separate
recognition. All of the goodwill recognized was assigned to the Company’s Power & Vision segment.
Intangible assets consist primarily of amounts recognized for the fair value of customer contracts. These amortizable intangible assets are being
amortized on a straight-line basis over an eight year estimated useful life.
8. INVENTORIES
Inventories consist of:
2018 2017
[As Adjusted –
Note 2]
Raw materials and supplies $ 1,282 $ 1,254
Work-in-process 331 331
Finished goods 408 433
Tooling and engineering 1,382 1,524
$ 3,403 $ 3,542
Tooling and engineering inventory represents costs incurred on tooling and engineering services contracts in excess of billed and unbilled amounts
included in accounts receivable.
9. INVESTMENTS
2018 2017
[As Adjusted –
Note 2]
Equity method investments[a] $ 1,862 $ 2,023
Private equity investments 323 50
Other 4 6
$ 2,189 $ 2,079
[a] The ownership percentages and carrying value of the Company’s principal equity method investments at December 31 were as follows [in millions,
except percentages]:
2018 2017
[As Adjusted –
Note 2]
Litens Automotive Partnership[i] 76.7% $ 188 $ 221
Getrag (Jiangxi) Transmission Co., Ltd[i] 66.7% $ 1,107 $ 1,156
Getrag Ford Transmission GmbH 50.0% $ 268 $ 334
Dongfeng Getrag Transmission Co. Ltd [‘‘DGT’’][ii] 50.0% $ 72 $ 80
Hubei HAPM MAGNA Seating Systems Co., Ltd. 49.9% $ 117 $ 116
[i] The Company accounts for its investments under the equity method of accounting as a result of significant participating rights that prevent
control.
[ii] DGT – DGT is a variable interest entity [‘‘VIE’’] and depends on the Company and the Dongfeng Motor Group Company for any additional cash
needs. The Company cannot make key operating decisions considered to be most significant to the VIE, and is therefore not considered to be
the primary beneficiary. Our known maximum exposure to loss approximated the carrying value of our investment balance as at
December 31, 2018.
MAGNA INTERNATIONAL INC. 49

A summary of the total financial results, as reported by the Company’s equity method investees, in the aggregate, at December 31 was as follows:
Summarized Balance Sheets
2018 2017
[As Adjusted –
Note 2]
Current assets $ 1,914 $ 2,040
Non-current assets $ 3,870 $ 4,159
Current liabilities $ 1,500 $ 1,515
Long-term liabilities $ 1,131 $ 1,378
Summarized Income Statements
2018 2017
[As Adjusted –
Note 2]
Sales $ 5,133 $ 5,349
Cost of goods sold & expenses 4,765 5,037
Net income $ 368 $ 312
Sales to equity method investees were approximately $379 million and $284 million for the years ended December 31, 2018 and 2017, respectively.
Variable Interest Entities
The Company has two equity method investees that are variable interest entities, in which the Company is the primary beneficiary and has the power to
direct the activities that are considered most significant to the entities. As a result, the assets, liabilities, and results of operations of these variable
interest entities are included in the Company’s Consolidated Financial Statements. The Company’s maximum exposure to any potential losses
associated with these affiliated companies is limited to its investment, and was $101 million and $137 million at December 31, 2018 and 2017,
respectively.
The carrying amounts and classification of assets and liabilities included in the Company’s consolidated balance sheet related to the consolidated VIEs
are as follows:
2018 2017
[As Adjusted –
Note 2]
Current assets $ 207 $ 270
Non-current assets 118 134
Total assets $ 325 $ 404
Current liabilities $ 218 $ 263
Non-current liabilities 6 4
Total liabilities $ 224 $ 267
Assets recognized as a result of consolidating these VIEs do not represent additional assets that could be used to satisfy claims against the Company’s
general assets. Conversely, liabilities recognized as a result of consolidating these VIEs do not represent additional claims on the Company’s general
assets; rather, they represent claims against the specific assets of the consolidated VIEs.
50 ANNUAL REPORT 2018

10. FIXED ASSETS
Fixed assets consist of:
2018 2017
[As Adjusted –
Note 2]
Cost
Land $ 229 $ 269
Buildings 2,205 2,232
Machinery and equipment 14,396 14,320
16,830 16,821
Accumulated depreciation
Buildings (810) (778)
Machinery and equipment (7,925) (7,867)
$ 8,095 $ 8,176
Included in the cost of fixed assets are construction in progress expenditures of $1.0 billion [2017 – $1.4 billion] that have not been depreciated.
11. GOODWILL
The following is a continuity of the Company’s goodwill by segment:
Body
Exteriors & Power & Seating Complete
Structures Vision Systems Vehicles Total
Balance, December 31, 2016 $ 434 $ 1,237 $ 147 $ 105 $ 1,923
Acquisitions (2) 3 – – 1
Foreign exchange and other 31 125 6 13 175
Balance, December 31, 2017 463 1,365 153 118 2,099
Acquisitions [note 7] 16 109 – – 125
Assets held for sale [note 3] – (157) – – (157)
Foreign exchange and other (20) (57) (6) (5) (88)
Balance, December 31, 2018 $ 459 $ 1,260 $ 147 $ 113 $ 1,979
MAGNA INTERNATIONAL INC. 51

12. INCOME TAXES
[a] The provision for income taxes differs from the expense that would be obtained by applying the Canadian statutory income tax rate as a result of
the following:
2018 2017
[As Adjusted –
Note 2]
Canadian statutory income tax rate 26.5% 26.5%
Manufacturing and processing profits deduction (0.3) (0.3)
Foreign rate differentials (2.9) (0.4)
Losses not benefited 0.8 1.6
Utilization of losses previously not benefited (0.4) (0.1)
Earnings of equity accounted investees (1.6) (1.4)
Tax on repatriation of foreign earnings 2.7 1.4
Valuation allowance on deferred tax assets [i] (1.8) (0.1)
US tax reform [ii] 0.4 (0.8)
Research and development tax credits (1.7) (1.2)
Reserve for uncertain tax positions (1.5) (0.2)
Non-deductible foreign exchange losses [iii] 0.4 0.3
Impairment of investments [note 4] 0.6 0.1
Others (0.2) (0.6)
Effective income tax rate 21.0% 24.8%
[i] GAAP requires that the Company assess whether valuation allowances should be established or maintained against its deferred tax assets,
based on consideration of all available evidence, using a ‘‘more-likely-than-not’’ standard. The factors the Company uses to assess the
likelihood of realization are its history of losses, forecasts of future pre-tax income and tax planning strategies that could be implemented to
realize the deferred tax assets.
During the year ended December 31, 2018, the Company released certain of its valuation allowance against its deferred tax assets in Canada
and India. In the third quarter of 2018, the Company released a portion of its valuation allowance against deferred tax assets on its Canadian
capital losses as a result of the anticipated capital gain from the sale of the FP&C business [note 3]. Additionally, over the past few years, some
of the Company’s Indian operations have delivered sustained profits which, together with forecasted profits, provided sufficient evidence to
support the release of the valuation allowance set up against deferred tax assets in those Indian operations in the fourth quarter of 2018. The
net effect of these valuation allowance releases was $52 million.
[ii] On December 22, 2017, the United States enacted the Tax Cuts and Jobs Act [the ‘‘US Tax Reform’’], which reduced the U.S. federal corporate
tax rate from 35% to 21% beginning in 2018, required companies to pay a one-time transition tax on earnings of certain foreign subsidiaries
that were previously tax deferred and created new taxes on certain foreign-sourced earnings. At December 31, 2017, in accordance with
guidance provided by Securities and Exchange Commission Staff Accounting Bulletin No. 118 [‘‘SAB 118’’], the Company made a reasonable
estimate of its effects and recognized a provisional $23 million net reduction in income tax expense. In the fourth quarter of 2018, the Company
completed its analysis of the tax impact and recorded a net increase of $11 million in income tax expense as described below.
Deferred tax assets and liabilities: At December 31, 2017, the Company re-measured certain deferred tax assets and liabilities applying the new
tax rate, which resulted in a $61 million reduction to deferred tax expense. At December 31, 2018, the Company completed its analysis of the
impact of remeasurement which resulted in no further adjustment to the provisional amount recognized in 2017.
One-time transition tax: This tax is based on the Company’s total post-1986 earnings and profits [‘‘E&P’’] that were previously deferred from
U.S. income taxes. The Company recorded a provisional $38 million in current income tax expense related to the transition tax at December 31,
2017. In the fourth quarter of 2018, the Company completed its calculation of the one-time transition tax and recorded a $5 million reduction in
current income tax expense. In addition, the Company has concluded its re-evaluation of indefinite reinvestment assertions on remaining
undistributed foreign earnings, the taxation of which is affected by US Tax Reform, and recognized $16 million in deferred tax expense for
withholding taxes associated with the future remittance of the undistributed earnings of the Mexican subsidiaries held by the Magna
U.S entities.
Global Intangible Low-Taxed Income [‘‘GILTI’’]: In addition to the changes described above, the US Tax Reform contains a new law that may
subject the Company to a tax on GILTI, beginning in 2018. FASB allows an accounting policy election of either recognizing deferred taxes for
temporary differences expected to reverse as GILTI in future years, or treating such taxes as a current-period expense when incurred. The
Company has completed its assessment of GILTI and elected to treat taxes due under the GILTI provision as a current-period expense
when incurred.
52 ANNUAL REPORT 2018
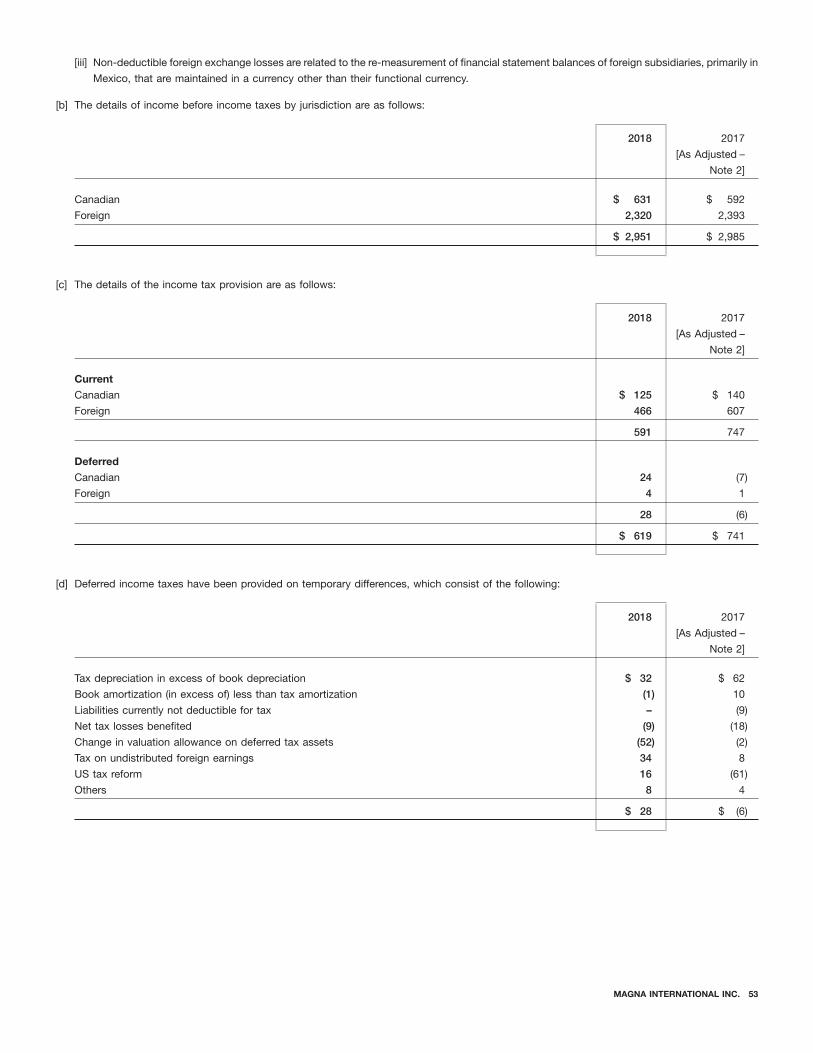
[b] The details of income before income taxes by jurisdiction are as follows:
[c] The details of the income tax provision are as follows:
[d] Deferred income taxes have been provided on temporary differences, which consist of the following:
[iii] Non-deductible foreign exchange losses are related to the re-measurement of financial statement balances of foreign subsidiaries, primarily in
Mexico, that are maintained in a currency other than their functional currency.
2018 2017
[As Adjusted –
Note 2]
Canadian $ 631 $ 592
Foreign 2,320 2,393
$ 2,951 $ 2,985
2018 2017
[As Adjusted –
Note 2]
Current
Canadian $ 125 $ 140
Foreign 466 607
591 747
Deferred
Canadian 24 (7)
Foreign 4 1
28 (6)
$ 619 $ 741
2018 2017
[As Adjusted –
Note 2]
Tax depreciation in excess of book depreciation $ 32 $ 62
Book amortization (in excess of) less than tax amortization (1) 10
Liabilities currently not deductible for tax – (9)
Net tax losses benefited (9) (18)
Change in valuation allowance on deferred tax assets (52) (2)
Tax on undistributed foreign earnings 34 8
US tax reform 16 (61)
Others 8 4
$ 28 $ (6)
MAGNA INTERNATIONAL INC. 53

[e] Deferred tax assets and liabilities consist of the following temporary differences:
[f] The Company has provided for deferred income taxes for the estimated tax cost of distributable earnings of its subsidiaries. Deferred income taxes
have not been provided on approximately $5.17 billion of undistributed earnings of certain foreign subsidiaries, as the Company has concluded that
such earnings should not give rise to additional tax liabilities upon repatriation or are indefinitely reinvested. A determination of the amount of the
unrecognized tax liability relating to the remittance of such undistributed earnings is not practicable.
[g] Income taxes paid in cash [net of refunds] were $665 million for the year ended December 31, 2018 [2017 – $782 million].
[h] As of December 31, 2018, the Company had domestic and foreign operating loss carryforwards of $ 2.33 billion and tax credit carryforwards of
$57 million. Approximately $1.70 billion of the operating losses can be carried forward indefinitely. The remaining operating losses and tax credit
carryforwards expire between 2019 and 2038.
2018 2017
[As Adjusted –
Note 2]
Assets
Tax benefit of loss carryforwards $ 660 $ 747
Liabilities currently not deductible for tax 150 173
Tax credit carryforwards 57 59
Unrealized loss on cash flow hedges and retirement liabilities 106 75
Others 12 21
985 1,075
Valuation allowance against tax benefit of loss carryforwards (506) (629)
Other valuation allowance (152) (129)
$ 327 $ 317
Liabilities
Tax depreciation in excess of book depreciation 220 212
Other assets book value in excess of tax values 50 60
Tax on undistributed foreign earnings 141 105
Unrealized gain on cash flow hedges and retirement liabilities 8 24
Unrealized gain on remeasurement of investments 9 –
428 401
Net deferred tax liabilities $ (101) $ (84)
The net deferred tax liabilities are presented on the consolidated balance sheet in the following categories:
2018 2017
[As Adjusted –
Note 2]
Long-term deferred tax assets $ 300 $ 238
Long-term deferred tax liabilities (401) (322)
$ (101) $ (84)
54 ANNUAL REPORT 2018

[i] As at December 31, 2018 and 2017, the Company’s gross unrecognized tax benefits were $198 and $243 million, respectively [excluding interest
and penalties], of which $183 and $222 million, respectively, if recognized, would affect the Company’s effective tax rate. The gross unrecognized
tax benefits differ from the amount that would affect the Company’s effective tax rate due primarily to the impact of the valuation allowance on
deferred tax assets. A summary of the changes in gross unrecognized tax benefits is as follows:
2018 2017
Balance, beginning of year $ 243 $ 220
Increase based on tax positions related to current year 20 21
(Decrease) increase based on tax positions of prior years (3) 7
Increase related to acquisitions 8 –
Settlements (13) (2)
Statute expirations (50) (17)
Foreign currency translation (7) 14
$ 198 $ 243
The Company recognizes interest and penalties with respect to unrecognized tax benefits as income tax expense. As at December 31, 2018 and
2017, the Company had recorded interest and penalties on the unrecognized tax benefits of $39 and $45 million, respectively, which reflects a
reduction in expenses related to changes in its reserves for interest and penalties of $6 in 2018 and an increase of $10 million in expenses related to
changes in its reserves for interest and penalties in 2017.
The Company operates in multiple jurisdictions throughout the world, and its tax returns are periodically audited or subject to review by both
domestic and foreign tax authorities. During the next twelve months, it is reasonably possible that, as a result of audit settlements, the conclusion of
current examinations and the expiration of the statute of limitations in several jurisdictions, the Company may decrease the amount of its gross
unrecognized tax benefits [including interest and penalties] by approximately $45 million, of which $35 million, if recognized, would affect its
effective tax rate.
The Company considers its significant tax jurisdictions to include Canada, the United States, Austria, Germany and Mexico. With few exceptions,
the Company remains subject to income tax examination in Germany for years after 2007, Mexico for years after 2012, Canada for years after 2013,
U.S. federal jurisdiction for years after 2014, and in Austria for years after 2015.
13. INTANGIBLE ASSETS
Intangible assets were as follows:
Estimated weighted
average useful
life in years 2018 2017
Cost
Customer relationship intangibles [note 7] 10 $ 415 $ 438
Computer software 2 291 348
Patent and licenses 12 340 342
1,046 1,128
Accumulated depreciation
Customer relationship intangibles [note 7] (191) (162)
Computer software (219) (263)
Patent and licenses (76) (53)
$ 560 $ 650
The Company recorded approximately $84 million and $125 million of amortization expense related to finite-lived intangible assets for the years ended
December 31, 2018 and 2017, respectively. The Company currently estimates annual amortization expense to be $77 million for 2019, $75 million for
2020, $50 million for 2021, $44 million for 2022 and $41 million for 2023.
MAGNA INTERNATIONAL INC. 55

Short-term borrowings
14. OTHER ASSETS
Other assets consist of:
2018 2017
[As Adjusted –
Note 2]
Preproduction costs related to long-term supply agreements with contractual guarantee for reimbursement $ 741 $ 732
Long-term receivables [note 22[c]] 198 204
Pension overfunded status [note 18[a]] 18 23
Unrealized gain on cash flow hedges [note 22] 9 46
Other, net 22 21
$ 988 $ 1,026
15. EMPLOYEE EQUITY AND PROFIT PARTICIPATION PROGRAM
During the year ended December 31, 2018, a trust, which exists to make orderly purchases of the Company’s shares for employees for transfer to the
Employee Equity and Profit Participation Program [‘‘EEPPP’’], borrowed up to $34 million [2017 – $19 million] from the Company to facilitate the
purchase of Common Shares. At December 31, 2018, the trust’s indebtedness to Magna was $34 million [2017 – $19 million]. The Company nets the
receivable from the trust with the Company’s accrued EEPPP payable in accrued wages and salaries.
16. WARRANTY
The following is a continuity of the Company’s warranty accruals:
2018 2017
Balance, beginning of year $ 255 $ 270
Expense, net 98 51
Settlements (111) (81)
Acquisitions 2 –
Foreign exchange and other (7) 15
Liabilities held for sale [note 3] (29) –
$ 208 $ 255
17. DEBT
The Company’s short-term borrowings consist of the following:
2018 2017
Bank indebtedness [i] $ 35 $ 9
Commercial paper [ii] 1,063 250
$ 1,098 $ 259
[i] The Company has an agreement for a credit facility that is drawn in euros. The Company is required to secure any amounts drawn on the facility
with a USD cash deposit of 105% of the outstanding euro balance. As at December 31, 2018, the gross amount outstanding under the credit facility
was $112 million [e98 million]. The credit agreement includes a netting arrangement with the bank that provides for the legal right of setoff.
Accordingly, as at December 31, 2018, this liability balance was offset against the related restricted cash equivalent deposit of $118 million. The
remaining net deposit of $6 million was included in the prepaid expenses and other balance, and is restricted under the terms of the loan. As at
December 31, 2017, the gross amount outstanding under the credit facility was $108 million [e90 million], and the net deposit included in the
prepaid expenses and other balance was $5 million.
On October 12, 2018, the Company entered into a $300 million, 364 day syndicated revolving credit facility. The facility can be drawn in U.S. dollars
or Canadian dollars. As of December 31, 2018, the Company has not borrowed any funds under this credit facility.
56 ANNUAL REPORT 2018

[a] The Company’s long-term debt, which is substantially uncollateralized, consists of the following:
[c] All of the Senior Notes pay a fixed rate of interest semi-annually except for the e550 million and e600 million Senior Notes which pay a fixed rate of
interest annually. The Senior Notes are unsecured obligations and do not include any financial covenants. The Company may redeem the Senior
Notes in whole or in part at any time, at specified redemption prices determined in accordance with the terms of each of the respective indentures
governing the Senior Notes. All of the Senior Notes were issued for general corporate purposes.
[d] The Company’s $2.75 billion revolving credit facility matures on June 22, 2023. The facility includes a $200 million Asian tranche, a $100 million
Mexican tranche and a tranche for Canada, U.S. and Europe, which is fully transferable between jurisdictions and can be drawn in U.S. dollars,
Canadian dollars or euros.
[ii] During 2017, the Company established a U.S. commercial paper program [the ‘‘U.S. Program’’] and a euro-commercial paper program [the
‘‘euro-Program’’]. Under the U.S. Program, the Company may issue U.S. commercial paper notes [the ‘‘U.S. notes’’] up to a maximum aggregate
amount of U.S. $1 billion. The U.S. Program is supported by the Company’s existing global credit facility. The proceeds from the issuance of the
U.S. notes are being used for general corporate purposes. As at December 31, 2018, $903 million [2017 – $70 million] of U.S. notes were
outstanding, with a weighted-average interest rate of 3.00% [2017 – 1.84%], and maturities less than three months.
Under the euro-Program, the Company may issue euro-commercial paper notes [the ‘‘euro notes’’] up to a maximum aggregate amount of
e500 million or its equivalent in alternative currencies. The euro notes issued are guaranteed by the Company’s existing global credit facility. The
proceeds from the issuance of the euro notes are being used for general corporate purposes. As of December 31, 2018, $160 million or e140 million
[2017 – $180 million or e150 million] of euro notes were outstanding, with a negative weighted-average interest rate of 0.24% [2017 – negative
0.22%], and maturities less than three months.
Long-term borrowings
2018 2017
Senior Notes [note 17[c]]
$750 million Senior Notes due 2024 at 3.625% $ 746 $ 746
$650 million Senior Notes due 2025 at 4.150% 644 643
e550 million Senior Notes due 2023 at 1.900% 627 657
e600 million Senior Notes due 2027 at 1.500% 683 717
Cdn$425 million Senior Notes due 2022 at 3.100% 311 338
Bank term debt at a weighted average interest rate of approximately 4.89% [2017 – 5.68%],
denominated primarily in Chinese renminbi, Indian rupee, euro and Brazilian real 153 99
Government loans at a weighted average interest rate of approximately 2.18% [2017 – 1.73%],
denominated primarily in euro, Canadian dollar and Brazilian real 109 84
Other 12 19
3,285 3,303
Less due within one year 201 108
$ 3,084 $ 3,195
[b] Future principal repayments on long-term debt are estimated to be as follows:
2019 $ 201
2020 28
2021 31
2022 315
2023 631
Thereafter 2,079
$ 3,285
MAGNA INTERNATIONAL INC. 57

[e] Interest expense, net includes:
[f] Interest paid in cash was $115 million for the year ended December 31, 2018 [2017 – $88 million].
[g] At December 31, 2018, the Company had commitments under operating leases requiring annual rental payments as follows:
[a] Defined benefit pension plans
2018 2017
Interest expense
Current $ 24 $ 10
Long-term 89 80
113 90
Interest income (20) (20)
Interest expense, net $ 93 $ 70
Total
2019 $ 310
2020 283
2021 254
2022 230
2023 199
Thereafter 714
$ 1,990
For the year ended December 31, 2018, operating lease expense was $361 million [2017 – $344 million].
18. LONG-TERM EMPLOYEE BENEFIT LIABILITIES
Long-term employee benefit liabilities consist of:
2018 2017
Defined benefit pension plans and other [a] $ 184 $ 264
Termination and long service arrangements [b] 381 368
Retirement medical benefits plans [c] 27 31
Other long-term employee benefits 5 7
Long-term employee benefit obligations $ 597 $ 670
The Company sponsors a number of defined benefit pension plans and similar arrangements for its employees. All pension plans are funded to at
least the minimum legal funding requirements, while European defined benefit pension plans are unfunded.
The weighted average significant actuarial assumptions adopted in measuring the Company’s obligations and costs are as follows:
2018 2017
Projected benefit obligation
Discount rate 3.1% 2.9%
Rate of compensation increase 2.5% 2.6%
Net periodic benefit cost
Discount rate 2.8% 3.1%
Rate of compensation increase 2.5% 2.5%
Expected return on plan assets 5.8% 5.8%
58 ANNUAL REPORT 2018

[i] The asset allocation of the Company’s defined benefit pension plans at December 31, 2018 and the target allocation for 2019 is as follows:
[ii] Includes $58 million of long-term employee benefit liabilities and $2 million of accrued salaries and wages which were reclassified to liabilities
held for sale.
Information about the Company’s defined benefit pension plans is as follows:
2018 2017
Projected benefit obligation
Beginning of year $ 687 $ 624
Current service cost 14 13
Interest cost 18 18
Actuarial (gains) losses and changes in actuarial assumptions (33) 8
Benefits paid (24) (23)
Foreign exchange (29) 47
End of year 633 687
Plan assets at fair value [i]
Beginning of year 443 330
Return on plan assets (11) 33
Employer contributions 12 82
Benefits paid (19) (18)
Foreign exchange (19) 16
End of year 406 443
Ending funded status $ 227 $ 244
Amounts recorded in the consolidated balance sheet
Non-current asset [note 14] $ (18) $ (23)
Current liability 1 3
Liabilities held for sale [note 3] [ii] 60 –
Non-current liability 184 264
Net amount $ 227 $ 244
Amounts recorded in accumulated other comprehensive income
Unrecognized actuarial losses $ (134) $ (135)
Net periodic benefit cost
Current service cost $ 14 $ 13
Interest cost 18 18
Return on plan assets (25) (20)
Actuarial losses 4 4
Net periodic benefit cost $ 11 $ 15
2019 2018
Fixed income securities 55-75% 62%
Equity securities 25-45% 36%
Cash and cash equivalents 0-10% 2%
100% 100%
Substantially all of the plan assets’ fair value has been determined using significant observable inputs [level 2] from indirect market prices on
regulated financial exchanges.
The expected rate of return on plan assets was determined by considering the Company’s current investment mix, the historic performance of
these investment categories and expected future performance of these investment categories.
MAGNA INTERNATIONAL INC. 59

Termination and long service arrangements
Retirement medical benefits plans
[b]
Pursuant to labour laws and national labour agreements in certain European countries and Mexico, the Company is obligated to provide lump sum
termination payments to employees on retirement or involuntary termination, and long service payments contingent upon persons reaching a
predefined number of years of service.
The weighted average significant actuarial assumptions adopted in measuring the Company’s projected termination and long service benefit
obligations and net periodic benefit cost are as follows:
2018 2017
Discount rate 2.8% 2.6%
Rate of compensation increase 2.9% 2.6%
Information about the Company’s termination and long service arrangements is as follows:
2018 2017
Projected benefit obligation
Beginning of year $ 378 $ 327
Current service cost 22 20
Interest cost 8 7
Actuarial losses (gains) and changes in actuarial assumptions 14 (7)
Benefits paid (14) (11)
Acquisition 2 –
Foreign exchange (16) 42
Ending funded status $ 394 $ 378
Amounts recorded in the consolidated balance sheet
Current liability $ 9 $ 10
Liabilities held for sale [note 3] 4 –
Non-current liability 381 368
Net amount $ 394 $ 378
Amounts recorded in accumulated other comprehensive income
Unrecognized actuarial losses $ (88) $ (73)
Net periodic benefit cost
Current service cost $ 22 $ 20
Interest cost 8 7
Actuarial (gains) losses (1) 3
Net periodic benefit cost $ 29 $ 30
[c]
The Company sponsors a number of retirement medical plans which were assumed on certain acquisitions in prior years. These plans are frozen to
new employees and incur no current service costs.
In addition, the Company sponsors a retirement medical benefits plan that was amended during 2009 such that substantially all employees retiring
on or after August 1, 2009 no longer participate in the plan.
The weighted average discount rates used in measuring the Company’s projected retirement medical benefit obligations and net periodic benefit
cost are as follows:
2018 2017
Retirement medical benefit obligations 4.0% 3.4%
Net periodic benefit cost 3.4% 3.8%
Health care cost inflation 6.8% 6.6%
60 ANNUAL REPORT 2018

[d] Future benefit payments
Information about the Company’s retirement medical benefits plans are as follows:
2018 2017
Projected benefit obligation
Beginning of year $ 33 $ 31
Interest cost 1 1
Actuarial (gains) losses and changes in actuarial assumptions (3) 2
Benefits paid (1) (2)
Foreign exchange (1) 1
Ending funded status $ 29 $ 33
Amounts recorded in the consolidated balance sheet
Current liability $ 2 $ 2
Non-current liability 27 31
Net amount $ 29 $ 33
Amounts recorded in accumulated other comprehensive income
Unrecognized past service costs $ – $ 1
Unrecognized actuarial gains 12 8
Total accumulated other comprehensive income $ 12 $ 9
Net periodic benefit cost
Interest cost $ 1 $ 1
Actuarial gains (1) (1)
Net periodic benefit cost $ – $ –
The effect of a one-percentage point increase or decrease in health care trend rates would not have a significant impact on the Company’s
net income.
Termination
Defined and long Retirement
benefit service medical
pension plans arrangements benefits plans Total
Expected employer contributions – 2019 $ 13 $ 9 $ 2 $ 24
Expected benefit payments:
2019 $ 23 $ 9 $ 2 $ 34
2020 25 10 2 37
2021 24 11 2 37
2022 25 13 2 40
2023 26 17 2 45
Thereafter 145 111 9 265
$ 268 $ 171 $ 19 $ 458
MAGNA INTERNATIONAL INC. 61

[a] At December 31, 2018, the Company’s authorized, issued and outstanding capital stock are as follows:
Preference shares – issuable in series –
Common Shares –
[i] Each share is entitled to one vote per share at all meetings of shareholders.
[ii] Each share shall participate equally as to dividends.
[b] On November 12, 2018, the Toronto Stock Exchange [‘‘TSX’’] accepted the Company’s Notice of Intention to Make a Normal Course Issuer Bid
relating to the purchase for cancellation, as well as purchases to fund the Company’s stock-based compensation awards or programs and/or the
Company’s obligations to its deferred profit sharing plans, of up to 33.2 million Magna Common Shares [the ‘‘2018 Bid’’], representing
approximately 10% of the Company’s public float of Common Shares. The Bid commenced on November 15, 2018 and will terminate no later than
November 14, 2019.
19. OTHER LONG-TERM LIABILITIES
Other long-term liabilities consist of:
2018 2017
[As Adjusted –
Note 2
Long-term portion of fair value of hedges [note 22] $ 40 $ 17
Long-term portion of income taxes payable 205 225
Asset retirement obligation 33 34
Long-term lease inducements 16 15
Deferred revenue 106 35
$ 400 $ 326
20. CAPITAL STOCK
The Company’s authorized capital stock includes 99,760,000 preference shares, issuable in series. None of these shares are currently issued
or outstanding.
Common Shares without par value [unlimited amount authorized] have the following attributes:
Previously, the Company had Normal Course Issuer Bids in place for the 12 month periods beginning in November 2017 and 2016.
The following is a summary of the Normal Course Issuer Bids [number of shares in the table below are expressed in whole numbers]:
2018 2017
Maximum
number Shares Cash Shares Cash
of shares purchased amount purchased amount
2016 Bid 38,000,000 – $ – 23,245,377 $ 1,109
2017 Bid 35,800,000 26,630,243 1,544 3,011,666 162
2018 Bid 33,200,000 6,014,041 287 – –
32,644,284 $ 1,831 26,257,043 $ 1,271
Certain purchases were made by way of private agreements entered into with arm’s length, third party sellers. Such private agreement purchases
were made at a discount to the prevailing market price for the Company’s Common Shares and pursuant to issuer bid exemption orders issued by
the Ontario Securities Commission. All other purchases of Common Shares are made at the market price at the time of purchase in accordance with
the rules and policies of the TSX. Purchases may also be made on the New York Stock Exchange in compliance with Rule 10b-18 under the
U.S. Securities Exchange Act of 1934.
62 ANNUAL REPORT 2018

The following table presents the maximum number of shares that would be outstanding if all the dilutive instruments outstanding at March 7, 2019
were exercised or converted:
[a] The effects on net income of amounts reclassified from AOCL, with presentation location, were as follows:
[c]
Common Shares 324,634,866
Stock options(i) 9,410,640
334,045,506
(i) Options to purchase Common Shares are exercisable by the holder in accordance with the vesting provisions and upon payment of the exercise
price as may be determined from time to time pursuant to the Company’s stock option plans.
21. ACCUMULATED OTHER COMPREHENSIVE LOSS
The following is a continuity schedule of accumulated other comprehensive loss:
2018 2017
[As Adjusted –
Note 2]
Accumulated net unrealized loss on translation of net investment in foreign operations
Balance, beginning of year $ (456) $ (1,131)
Net unrealized (loss) gain (490) 654
Repurchase of shares under normal course issuer bids[note 20] 29 21
Balance, end of year (917) (456)
Accumulated net unrealized gain (loss) on cash flow hedges [b]
Balance, beginning of year 39 (135)
Net unrealized (loss) gain (106) 114
Reclassification of net (gain) loss to net income [a] (1) 60
Balance, end of year (68) 39
Accumulated net unrealized loss on other long-term liabilities [b]
Balance, beginning of year (183) (185)
Net unrealized (loss) gain (13) 8
Reclassification of net loss to net income [a] 6 5
Reclassification of tax effect to retained earnings [c] – (11)
Balance, end of year (190) (183)
Total accumulated other comprehensive loss [d] $ (1,175) $ (600)
2018 2017
Cash flow hedges
Sales $ (6) $ (30)
Cost of sales 7 (54)
Income tax – 24
Net of tax 1 (60)
Other long-term liabilities
Cost of sales (7) (6)
Income tax 1 1
Net of tax (6) (5)
Total loss reclassified to net income $ (5) $ (65)
MAGNA INTERNATIONAL INC. 63

[b] The amount of income tax benefit (expense) that has been allocated to each component of other comprehensive loss is as follows:
[c] Amounts related to the reclassification of the stranded tax effects of the Company’s pensions and financial instruments to retained earnings related
to the adoption of ‘‘Income Statement – Reporting Comprehensive Income – Reclassification of Certain Tax Effects from Accumulated Other
Comprehensive Income’’.
[d] The amount of other comprehensive loss that is expected to be reclassified to net income during 2019 is $44 million.
[a] Foreign exchange contracts
2018 2017
Accumulated net unrealized loss on translation of net investment in foreign operations
Balance, beginning of year $ 7 $ –
Net unrealized loss – 7
Balance, end of year 7 7
Accumulated net unrealized (gain) loss on cash flow hedges
Balance, beginning of year (12) 53
Net unrealized (gain) loss 35 (41)
Reclassification of net loss to net income – (24)
Balance, end of year 23 (12)
Accumulated net unrealized loss on other long-term liabilities
Balance, beginning of year 17 30
Net unrealized (gain) loss 5 (1)
Reclassification of net loss to net income (1) (1)
Reclassification of tax effect to retained earnings – (11)
Balance, end of year 21 17
Total income tax benefit $ 51 $ 12
22. FINANCIAL INSTRUMENTS
At December 31, 2018, the Company had outstanding foreign exchange forward contracts representing commitments to buy and sell various
foreign currencies. Significant commitments are as follows:
For Canadian dollars For U.S. dollars
U.S. dollar Weighted Euro Weighted Peso Weighted
Buy (Sell) amount average rate amount average rate amount average rate
2019 230 1.32032 15 1.56777 5,240 0.04848
2019 (1,030) 0.77436 (14) 0.64273 – –
2020 18 1.29662 1 1.55732 2,676 0.04681
2020 (466) 0.77365 – – – –
2021 1 1.26809 – – 855 0.04273
2021 (174) 0.78498 – – – –
2022 1 1.30510 – – – –
2022 (64) 0.78373 – – – –
2023 (18) 0.77541 – – – –
(1,502) 2 8,771
64 ANNUAL REPORT 2018

[b] Financial assets and liabilities
For euros
Czech
U.S. dollar Weighted GBP Weighted koruna Weighted
Buy (Sell) amount average rate amount average rate amount average rate
2019 183 0.85595 14 1.12128 4,039 0.03816
2019 (142) 1.17649 (22) 0.85495 – –
2020 93 0.83001 8 1.11351 2,361 0.03836
2020 (47) 1.20790 (11) 0.88525 – –
2021 27 0.79816 – – 491 0.03729
2021 (18) 1.28271 (6) 0.92098 – –
2022 9 0.76479 – – – –
2022 (1) 1.31155 – – – –
104 (17) 6,891
Based on forward foreign exchange rates as at December 31, 2018 for contracts with similar remaining terms to maturity, the gains and losses
relating to the Company’s foreign exchange forward contracts recognized in other comprehensive income are approximately $34 million and
$101 million, respectively [note 21].
The Company does not enter into foreign exchange forward contracts for speculative purposes.
The Company’s financial assets and liabilities consist of the following:
2018 2017
[As Adjusted
– Note 2]
Financial assets
Cash and cash equivalents $ 684 $ 726
Restricted cash equivalents 118 113
Accounts receivable 6,548 6,695
Severance investments 3 4
Long-term receivables included in other assets [note 14] 198 204
Financial assets held for sale [note 3]
Accounts receivable held for sale 258 –
Severance investments held for sale 1 –
Long-term receivables held for sale – –
$ 7,810 $ 7,742
Financial liabilities
Bank indebtedness [note 17] $ 35 $ 9
Commercial paper [note 17] 1,063 250
Long-term debt (including portion due within one year) 3,285 3,303
Accounts payable 6,094 6,283
Financial liabilities held for sale [note 3]
Accounts payable held for sale 226 –
$ 10,703 $ 9,845
Derivatives designated as effective hedges, measured at fair value
Foreign currency contracts
Prepaid expenses and other $ 25 $ 55
Other assets 9 46
Other accrued liabilities (61) (32)
Other long-term liabilities (40) (17)
$ (67) $ 52
MAGNA INTERNATIONAL INC. 65

[c] Derivatives designated as effective hedges, measured at fair value
[d] Fair value
Cash and cash equivalents, restricted cash equivalents, accounts receivable, short-term borrowings and accounts payable.
Commercial Paper
Term debt
Senior Notes
[e] Credit risk
The Company presents derivatives that are designated as effective hedges at gross fair values in the consolidated balance sheets. However,
master netting and other similar arrangements allow net settlements under certain conditions. The following table shows the Company’s derivative
foreign currency contracts at gross fair value as reflected in the consolidated balance sheets and the unrecognized impacts of master netting
arrangements:
Gross Gross
amounts amounts not
presented in offset in
consolidated consolidated Net
balance sheets balance sheets amounts
December 31, 2018
Assets $ 34 $ 33 $ 1
Liabilities $ (101) $ (33) $ (68)
December 31, 2017
Assets $ 101 $ 47 $ 54
Liabilities $ (49) $ (47) $ (2)
The Company determined the estimated fair values of its financial instruments based on valuation methodologies it believes are appropriate;
however, considerable judgment is required to develop these estimates. Accordingly, these estimated fair values are not necessarily indicative of
the amounts the Company could realize in a current market exchange. The estimated fair value amounts can be materially affected by the use of
different assumptions or methodologies. The methods and assumptions used to estimate the fair value of financial instruments are described
below:
Due to the short period to maturity of the instruments, the carrying values as presented in the consolidated balance sheets are reasonable
estimates of fair values.
Due to the short period to maturity of the commercial paper, the carrying value as presented in the consolidated balance sheet is a reasonable
estimate of its fair value.
The Company’s term debt includes $201 million due within one year. Due to the short period to maturity of this debt, the carrying value as presented
in the consolidated balance sheet is a reasonable estimate of its fair value.
The fair value of our Senior Notes are classified as Level 1 when we use quoted prices in active markets and Level 2 when the quoted prices are
from less active markets or when other observable inputs are used to determine fair value. At December 31, 2018, the net book value of the
Company’s Senior Notes was $3.03 billion and the estimated fair value was $3.05 billion, determined using active market prices.
The Company’s financial assets that are exposed to credit risk consist primarily of cash and cash equivalents, restricted cash equivalents, accounts
receivable, held-to-maturity investments and foreign exchange and commodity forward contracts with positive fair values.
Cash and cash equivalents and restricted cash equivalents, which consist of short-term investments, are only invested in bank term deposits and
bank commercial paper with an investment grade credit rating. Credit risk is further reduced by limiting the amount which is invested in certain
governments or any major financial institution.
The Company is also exposed to credit risk from the potential default by any of its counterparties on its foreign exchange forward contracts. The
Company mitigates this credit risk by dealing with counterparties who are major financial institutions that the Company anticipates will satisfy their
obligations under the contracts.
In the normal course of business, the Company is exposed to credit risk from its customers, substantially all of which are in the automotive industry
and are subject to credit risks associated with the automotive industry. For the year ended December 31, 2018, sales to the Company’s six largest
customers represented 77% [2017 – 81%] of the Company’s total sales; and substantially all of its sales are to customers in which the Company
has ongoing contractual relationships.
66 ANNUAL REPORT 2018

[f] Currency risk
[g] Interest rate risk
[a] In September 2014, the Conselho Administrativo de Defesa Economica, Brazil’s Federal competition authority, attended at one of the Company’s
operating divisions in Brazil to obtain information in connection with an ongoing antitrust investigation relating to suppliers of automotive door
latches and related products. Proceedings of this nature can often continue for several years. At this time, management is unable to predict the
duration or outcome of the Brazilian investigation.
[b] In certain circumstances, the Company is at risk for warranty costs including product liability and recall costs. Due to the nature of the costs, the
Company makes its best estimate of the expected future costs [note 16]; however, the ultimate amount of such costs could be materially different.
The Company continues to experience increased customer pressure to assume greater warranty responsibility. Currently, under most customer
agreements, the Company only accounts for existing or probable claims. Under certain complete vehicle engineering and assembly contracts, and
with respect to our powertrain systems programs, the Company records an estimate of future warranty-related costs based on the terms of the
specific customer agreements, and the specific customer’s [or the Company’s] warranty experience.
[a] Magna is a global automotive supplier which has complete vehicle engineering and contract manufacturing expertise, as well as product
capabilities which include body, chassis, exterior, seating, powertrain, active driver assistance, electronics, vision, mechatronics and roof systems.
Magna also has electronic and software capabilities across many of these areas.
The Company is exposed to fluctuations in foreign exchange rates when manufacturing facilities have committed to the delivery of products for
which the selling price has been quoted in currencies other than the facilities’ functional currency, and when materials and equipment are
purchased in currencies other than the facilities’ functional currency. In an effort to manage this net foreign exchange exposure, the Company
employs hedging programs, primarily through the use of foreign exchange forward contracts [note 22[a]].
The Company is not exposed to significant interest rate risk due to the short-term maturity of its monetary current assets and current liabilities. In
particular, the amount of interest income earned on cash and cash equivalents is impacted more by investment decisions made and the demands
to have available cash on hand, than by movements in interest rates over a given period.
In addition, the Company is not exposed to interest rate risk on its term debt and Senior Notes as the interest rates on these instruments are fixed.
23. CONTINGENCIES
From time to time, the Company may become involved in regulatory proceedings, or become liable for legal, contractual and other claims by various
parties, including customers, suppliers, former employees, class action plaintiffs and others. On an ongoing basis, the Company attempts to assess
the likelihood of any adverse judgments or outcomes to these proceedings or claims, together with potential ranges of probable costs and losses. A
determination of the provision required, if any, for these contingencies is made after analysis of each individual issue. The required provision may
change in the future due to new developments in each matter or changes in approach such as a change in settlement strategy in dealing with
these matters.
The Company’s policy is to comply with all applicable laws, including antitrust and competition laws. The Company has completed its previously
announced global review focused on antitrust risk and does not currently anticipate any material liabilities in connection with the review.
In the event of an antitrust violation, Magna could be subject to fines, penalties, restitution settlements and civil, administrative or criminal legal
proceedings and other consequences, including reputational damage.
24. SEGMENTED INFORMATION
Previously, the Company organized its businesses into four reportable operating segments: North America, Europe, Asia and Rest of World. In
December 2017, the Company announced a realignment of its management structure along product lines. As a result, on January 1, 2018, the
Company changed its segments to align with the way its business is now managed.
The Company is now organized under four operating segments which have been determined on the basis of technological opportunities, product
similarities, and market and operating factors. These operating segments are also the Company’s reportable segments:
• Body Exteriors & Structures includes our body and chassis business, exteriors, roof systems, sealing systems and fuel systems operations;
• Power & Vision includes our powertrain, electronics, mirrors, lighting and mechatronics operations;
• Seating Systems is comprised of our complete seat assembly facilities and our foam, trim, structures and mechanisms operations; and
• Complete Vehicles is comprised of our contract manufacturing operations as well as our complete vehicle engineering centers.
The results of each segment are regularly reviewed by the Company’s chief operating decision maker to assess the performance of the segment
and make decisions regarding the allocation of resources. The Company’s chief operating decision maker uses Adjusted Earnings before Interest
and Income Taxes [‘‘Adjusted EBIT’’] as the measure of segment profit or loss, since management believes Adjusted EBIT is the most appropriate
measure of operational profitability or loss for its reporting segments. Adjusted EBIT is calculated by taking net income from operations and adding
back income taxes, interest expense, net, and other expense, net.
The accounting policies of each segment are the same as those set out under ‘‘Significant Accounting Policies’’ [note 1]. All intersegment sales and
transfers are accounted for at fair market value.
MAGNA INTERNATIONAL INC. 67

[a] The following tables show segment information for the Company’s reporting segments and a reconciliation of Adjusted EBIT to the Company’s
consolidated income before income taxes:
[i] Includes $541 million of net assets held for sale.
[ii] Included in Corporate and Other Adjusted EBIT are intercompany fees charged to the automotive segments.
2018
Depreciation
Total External Adjusted and Equity
sales sales EBIT amortization income
Body Exteriors & Structures $ 17,527 $ 17,220 $ 1,398 $ 697 $ (12)
Power & Vision 12,321 12,086 1,168 434 (261)
Seating Systems 5,548 5,546 425 57 (3)
Complete Vehicles 6,018 5,968 68 65 –
Corporate & Other [ii] (587) 7 48 25 (1)
Total Reportable Segments $ 40,827 $ 40,827 $ 3,107 $ 1,278 $ (277)
2017 [As Adjusted – Note 2]
Depreciation Equity
Total External Adjusted and (income)
sales sales EBIT amortization loss
Body Exteriors & Structures $ 16,613 $ 16,501 $ 1,346 $ 633 $ (10)
Power & Vision 11,629 11,344 1,183 415 (245)
Seating Systems 5,224 5,222 434 61 2
Complete Vehicles 3,547 3,513 66 46 –
Corporate & Other [ii] (425) 8 65 29 –
Total Reportable Segments $ 36,588 $ 36,588 $ 3,094 $ 1,184 $ (253)
2018
Fixed
Net Fixed asset
assets Investments Goodwill asset, net additions
Body Exteriors & Structure $ 6,946 $ 34 $ 459 $ 4,615 $ 730
Power & Vision [i] 6,675 1,680 1,260 2,123 655
Seating Systems 804 135 147 319 78
Complete Vehicles 605 2 113 607 170
Corporate & Other [ii] 798 338 – 431 17
Total Reportable Segments $ 15,828 $ 2,189 $ 1,979 $ 8,095 $ 1,650
2017 [As Adjusted – Note 2]
Fixed
Net Fixed asset
assets Investments Goodwill asset, net additions
Body Exteriors & Structure $ 7,243 $ 31 $ 463 $ 4,763 $ 930
Power & Vision 6,475 1,819 1,365 2,113 568
Seating Systems 804 136 153 306 76
Complete Vehicles 394 2 118 529 236
Corporate & Other [ii] 658 91 – 465 65
Total Reportable Segments $ 15,574 $ 2,079 $ 2,099 $ 8,176 $ 1,875
68 ANNUAL REPORT 2018

[b] The following table reconciles Net income from operations to Adjusted EBIT:
[c] The following table shows Net Assets for the Company’s reporting segments:
[d] The following table aggregates external revenues by customer as follows:
2018 2017
[As Adjusted –
Note 2]
Net Income $ 2,332 $ 2,244
Add:
Interest expense, net 93 70
Other expense, net 63 39
Income taxes 619 741
Adjusted EBIT $ 3,107 $ 3,094
2018 2017
[As Adjusted –
Note 2]
Total Assets 25,945 25,468
Deduct assets not included in segment net assets:
Cash and cash equivalents (684) (726)
Deferred tax assets (300) (238)
Long-term receivables from joint venture partners (71) (72)
Income taxes receivable (57) –
Deduct liabilities included in segment net assets:
Accounts Payable (6,094) (6,283)
Accrued salaries and wages (769) (836)
Other accrued liabilities (1,734) (1,739)
Liabilities held for sale [note 3] (408) –
Segment Net Assets $ 15,828 $ 15,574
2018 2017
[As Adjusted –
Note 2]
General Motors $ 6,303 $ 6,481
Ford Motor Company 5,721 5,760
Fiat Chrysler Automobiles 5,693 5,311
BMW 4,826 3,676
Daimler AG 4,687 4,474
Volkswagen 4,128 3,849
Other 9,469 7,037
$ 40,827 $ 36,588
MAGNA INTERNATIONAL INC. 69

[e] The following table summarizes external revenues and long-lived assets by geographic region:
Normal Course Issuer Bid
External Sales Fixed Assets, Net
2018 2017 2018 2017
[As Adjusted – [As Adjusted –
Note 2] Note 2]
North America
United States $ 10,043 $ 9,302 $ 1,356 $ 1,668
Canada 5,886 5,902 968 990
Mexico 4,618 4,634 1,311 1,269
20,547 19,838 3,635 3,927
Europe
Austria 7,750 5,191 938 863
Germany 4,893 4,243 1,271 1,313
Italy 850 858 288 235
Czech Republic 764 740 257 222
Poland 694 674 200 149
United Kingdom 517 524 191 194
Russia 424 373 138 191
Spain 382 346 47 44
Turkey 291 248 8 8
France 219 200 46 48
Slovakia 127 123 71 39
Other Europe 144 86 221 160
17,055 13,606 3,676 3,466
Asia Pacific
China 2,152 2,107 588 578
India 180 185 106 122
Korea 158 159 21 24
Other Asia Pacific 50 40 3 2
2,540 2,491 718 726
Rest of World 685 653 66 57
$ 40,827 $ 36,588 $ 8,095 $ 8,176
25. SUBSEQUENT EVENT
Subsequent to December 31, 2018, the Company purchased 3,216,363 Common Shares for cancellation and 76,119 Common Shares to satisfy stock-
based compensation awards, each under an existing normal course issuer bid for cash consideration of $168 million.
70 ANNUAL REPORT 2018

Share Information
Distribution of Shares held by Registered Shareholders
Dividends
MAGNA INTERNATIONAL INC.
Supplementary Financial and Share Information
Financial Summary
(U.S. dollars in millions, except per share figures)
(unaudited)
Years ended December 31,
2018 2017 2016 2015 2014
Total sales 40,827 36,588 36,445 32,134 34,403
Depreciation and amortization 1,278 1,184 1,056 802 845
Net income attributable to Magna International Inc. from continuing
operations 2,296 2,196 2,031 1,946 1,924
Diluted earnings per Common Share from continuing operations 6.61 5.87 5.16 4.72 4.44
Weighted average number of Common Shares outstanding – Diluted 347.5 373.9 393.2 412.7 433.2
Cash dividends paid per share 1.32 1.10 1.00 0.88 0.76
Cash flow from operations 3,718 3,346 3,266 2,332 2,822
Capital expenditures 1,650 1,875 1,807 1,591 1,495
Working capital 1,530 1,957 1,468 3,868 2,236
Fixed assets, net 8,095 8,176 7,022 5,948 5,402
Total assets 25,945 25,468 22,566 19,687 18,068
Long-term debt 3,084 3,195 2,394 2,327 806
Shareholders’ equity 11,159 11,712 10,219 9,117 8,673
Long-term debt to equity ratio 0.28:1 0.27:1 0.23:1 0.26:1 0.09:1
The Common Shares are listed and traded in Canada on the Toronto Stock Exchange (‘‘TSX’’) under the stock symbol ‘‘MG’’ and in the United States on
the New York Stock Exchange (‘‘NYSE’’) under the stock symbol ‘‘MGA’’. As of February 28, 2019, there were 1,319 registered holders of
Common Shares.
Common Shares
Canada 77.02%
United States 22.95%
Other 0.03%
Dividends for 2018 on Magna’s Common Shares were paid on each of March 23, June 8, September 14 and December 7 at a rate of U.S.$0.33 per
Common Share. Magna’s dividends have been designated as ‘‘eligible dividends’’ as defined in subsection 89(1) of the Income Tax Act (Canada) and,
accordingly, are eligible for an enhanced tax credit. Additional details are found on Magna’s website (www.magna.com), under ‘‘Company – Investors –
Shareholder Information – Dividends’’.
MAGNA INTERNATIONAL INC. 71

Price Range of Shares
The following table sets forth, for the years indicated, the high and low sales prices and volumes of Common Shares traded in each case as reported by
the TSX and NYSE, respectively.
Common Shares (TSX) (Cdn$) Stock Symbol ‘‘MG’’
Year ended December 31, 2018 Year ended December 31, 2017
Quarter Volume High Low Volume High Low
1st 66,663,208 74.86 63.63 50,978,334 60.78 55.36
2nd 60,140,550 87.13 69.78 67,602,523 62.94 52.63
3rd 68,562,603 81.27 67.63 57,238,990 67.06 57.47
4th 79,159,170 74.40 58.74 52,795,790 74.29 65.52
Common Shares (NYSE) (US$) Stock Symbol ‘‘MGA’’
Year ended December 31, 2018 Year ended December 31, 2017
Quarter Volume High Low Volume High Low
1st 83,866,053 59.99 50.78 75,883,650 46.18 41.84
2nd 72,562,177 67.47 53.91 106,004,876 46.60 39.50
3rd 81,571,294 61.65 51.34 88,215,360 53.74 45.37
4th 94,173,736 57.85 42.88 58,960,534 58.07 51.54
72 ANNUAL REPORT 2018

DirectorsWilliam L. Young (Chairman of the Board)
Scott B. Bonham
Peter G. Bowie
Mary S. Chan
Dr. Kurt J. Lauk
Robert F. MacLellan
Cynthia A. Niekamp
William A. Ruh
Dr. Indira V. Samarasekera
Donald J. Walker
Lawrence D. Worrall
Executive Offi cersDonald J. WalkerChief Executive Offi cer
Vincent J. Galifi Chief Financial Offi cer
Seetarama Swamy KotagiriChief Technology Offi cer and President, Magna Power and Vision
Tommy J. SkudutisChief Operating Offi cer
James J. Tobin, Sr.Chief Marketing Offi cer and President, Magna Asia
Guenther F. ApfalterPresident, Magna Europe andPresident, Magna Steyr
Mark DongPresident, Magna China
Aaron D. McCarthyChief Human Resources Offi cer
Riccardo C. TrecroceChief Legal Offi cer
Joanne N. HoribeChief Compliance Offi cer
Corporate Offi ceMagna International Inc.337 Magna DriveAurora, OntarioCanada L4G 7K1Telephone: (905) 726-2462
magna.com
Transfer Agent and RegistrarComputershare Trust Company of Canada
100 University Avenue, 8th FloorToronto, OntarioCanada M5J 2Y1Telephone: 1 (800) 564-6253
Computershare Trust Company N.A.
462 S. 4th StreetLouisville, KentuckyUSA 40202Telephone: 1 (800) 962-4284
From all other countriesTelephone: 1 (514) 982-7555
www.computershare.com
Exchange ListingsCommon SharesToronto Stock Exchange MGNew York Stock Exchange MGA
As a “foreign private issuer” listed on the New York Stock Exchange (NYSE), Magna is required to disclose the signifi cant ways in which its corporate governance practices diff er from those to be followed by U.S. domestic issuers under the NYSE listing standards. Please see the corporate governance section of our website (www.magna.com) for our Statement of Signifi cant Corporate Governance Diff erences (NYSE). Additionally, please refer to the Management Information Circular/Proxy Statement for our 2019 Annual Meeting of Shareholders for a description of our corporate governance practices in comparison with the requirements and guidelines of the Canadian Securities Administrators.
Shareholders wishing to communicate with the non-management members of the Magna Board of Directors may do so by contacting the Chairman of the Board through the offi ce of Magna’s Corporate Secretary at 337 Magna Drive, Aurora, Ontario, Canada L4G 7K1 (905) 726-7070.
Shareholders wishing to obtain a copy of Magna’s Notice of Intention to Make a Normal Course Issuer Bid, referred to in Note 20 to the consolidated fi nancial statements contained in this Annual Report, may do so by contacting Magna’s Corporate Secretary.
The 2019 Annual Meeting of ShareholdersThe 2019 Annual Meeting of Shareholders will be held at Hilton Toronto/Markham Suites Conference Centre, 8500 Warden Avenue, Markham, Ontario, Canada on Thursday, May 9, 2019 commencing at 10:00 a.m. (Eastern Daylight Time).
Annual ReportAdditional copies of this 2018 Annual Report or copies of our quarterly reports may be obtained from: The Corporate Secretary, Magna International Inc., 337 Magna Drive, Aurora, Ontario, Canada L4G 7K1 or www.magna.com. Copies of fi nancial data and other publicly fi led documents are available through the internet on the Canadian Securities Administrators’ System for Electronic Document Analysis and Retrieval (SEDAR) which can be accessed at www.sedar.com and on the United States Securities and Exchange Commission’s Electronic Data Gathering, Analysis and Retrieval System (EDGAR), which can be accessed at www.sec.gov.
©Magna International Inc. 2019. Magna and the logo are registered trademarks of Magna International Inc.
CORPORATE DIRECTORYCORPORATE DIRECTORYCORPORATE DIRECTORY

MAGNA INTERNATIONAL INC.
337 Magna DriveAurora, Ontario
Canada L4G 7K1(905) 726-2462
magna.com