Embed Size (px)
Citation preview
FOR
2018-19
January, 2018

MEDIUM TERM FISCAL POLICY STATEMENT
& FISCAL POLICY STRATEGY STATEMENT
FOR
2018–2019
Finance Department Government of West Bengal


Foreword
As per the statute of West Bengal Fiscal Responsibility and Budget Management
(FRBM) Act, 2010 as amended and the rules thereto, I present before this august
house the Medium Term Fiscal Policy Statement and Fiscal Policy Strategy
Statement for the year 2018-19.
January, 2018 DR. AMIT MITRA Minister of Finance
Government of West Bengal


CONTENTS
Sl. No. Subject Page No.
1 Overview of National Economy
1-3
2 Overview of State Economy 4-6
3 Overview of State Finance 7-11
4 Medium term fiscal policy statement 12-14
5 Fiscal policy strategy statement 15-20
6 Disclosure forms 21-26


Introduction Abiding by the path of fiscal discipline and imposing measures of fiscal prudence are imperative for ensuring overall fiscal health of any state economy. Governments focus on crucial fiscal indicators, aiming to eliminate/ reduce revenue deficit & fiscal deficit and to ensure prudent debt management. Greater transparency in fiscal operations of Governments and presence of medium-term framework for fiscal policy is incidental to this. The West Bengal Fiscal Responsibility and Budget Management (FRBM) Act, 2010 was enacted therefore in July 2010, with a subsequent amendment to it in April 2011. According to the stated amendment, targets which had been fixed are still continuing for the coming years. In addition to the usual targets provided under the WBFRBM Act 2010, a set of recommendations has also been provided by the Fourteenth Central Finance Commission to help meet the Union and State Governments their fiscal targets. One of the recommendations has been that the State Governments may amend their FRBM Acts to provide for the statutory flexible limits on fiscal deficit. Again, the concerned FRBM Act may also be suitably amended to provide a statutory ceiling on the sanction of new capital initiatives to an appropriate multiple of the annual budget provision. There are recommendations of similar enactments being contemplated under Article 293(1). The Finance Commission has also enunciated that fiscal deficit of all States to be anchored to an annual limit of 3 per cent of GSDP with 0.25 per cent limit of flexibility over and above this for any given year for which the borrowing limits are to be fixed if the debt-GSDP ratio is less than or equal to 25 per cent in the preceding year. State can also have, as per recommendations, a maximum fiscal deficit-GSDP limit of 3.5 per cent in any given year. As per the FRBM Act, milestones have been set on a yearly basis to evaluate progress of achievement on fiscal discipline front. This yearly Statement reflecting upon the fiscal policy and fiscal strategy of the state is prepared as per the stated Act. In the portions of the text that follows, discussions on overview in terms of growth of national economy and state economy have been made in respect of GDP / GSDP and GVA / GSVA calculated on base year 2011-12, and fiscal indicators have been arrived at accordingly. The Medium Term Fiscal Policy Statement and Fiscal Policy Strategy Statement for 2018-19 is presented along with the Annual Budget in the Assembly to reflect upon the intent of the government and initiatives adopted on behalf of it to fulfill the objectives mentioned in the stated Act in a time-bound manner.


1
Overview of National Economy The Central Statistics Office (CSO) under the Ministry of Statistics and Programme Implementation, Govt. of India released a Press Note on 5 Jan 2018 where absolute GDP and GVA figures for All India, their rates of annual growth, percentage shares etc., both at constant and current prices at base 2011-12, have been published with regard to 1st Advanced Estimates for 2017-18, as well as for previous few years. Hereunder, GDP and GVA figures of All India for the last few years, sectoral shares and growth rates of GVA over the same years are literally and graphically represented. Annual Growth of Gross Domestic Product (GDP) and Gross Value Added (GVA) at Market
Price of All India at Base, 2011-12
Year GDP Growth (Per cent) GVA Growth (Per cent) Current Price Constant Price Current Price Constant Price
2015-16 9.9 8.0 8.5 7.9 2016-17(PE) 11.0 7.1 9.7 6.6
2017-18(1st AE) 9.5 6.5 9.0 6.1 Source: Press note on 5 Jan, 2018, CSO, Government of India
GDP of India has evidently shown a decreasing rate of growth over the last few years in terms of constant price at 2011-12, as can be seen from the Table and the chart above. Now, since there is sectoral classification of GDP with regard to national figures not given, no such sectoral classification with regard to the three major sectors - agriculture and allied, industry and services sectors could be provided. However, national GVA figures are available with their data on sectoral growth and sectoral share of total GVA, which have been provided herewith.

2
Annual Growth of Gross Value Added (GVA) at basic price by Economic Activity at constant price of All India with Base, 2011-12
Sector Growth in % at Constant (2011-12) Prices
2015-16 2016-17(PE) 2017-18(1st AE) Agriculture, Forestry & Fishery 0.7 4.9 2.1 Industry 8.8 5.6 4.4 Services 9.7 7.7 8.3 GVA at basic price 7.9 6.6 6.1 Source: Press note on 5 Jan, 2018, CSO, Government of India. PE: Provisional Estimate, 1st AE: 1st Advance Estimate
Industry sector as well as total GVA of India at constant price, 2011-12, are showing declining rates of growth since 2015-16. Percentage Share of Gross Value Added (GVA) of India at basic price by Economic activity at
constant price of All India with Base, 2011-12
Sector Share in % at Constant (2011-12) Prices 2015-16 2016-17(PE) 2017-18(1st AE)
Agriculture, Forestry & Fishery 15.4 15.2 14.6 Industry 31.4 31.3 30.7 Services 53.2 53.5 54.7 GVA at basic price 100.0 100.0 100.0 Source: Press note on 5 Jan, 2018, CSO, Government of India. PE: Provisional Estimate, 1st AE: 1st Advance Estimate
Annual Growth of Gross Value Added (GVA) at basic price by Economic Activity at current
price at base, 2011-12
Sector Growth in % at Current (2011-12) Prices 2015-16 2016-17(PE) 2017-18(1st AE)
Agriculture, Forestry & Fishery 5.2 9.0 2.8 Industry 6.5 6.9 7.6 Services 10.9 11.5 11.7 GVA at basic price 8.5 9.7 9.0 Source: Press note on 5 Jan, 2018, CSO, Government of India. PE: Provisional Estimate, 1st AE: 1st Advance Estimate

3
Industry sector of GDP of India has grown by little increasing amounts as per current price for 2011-12, base over the last three years. Percentage Share of Gross Value Added (GVA) of India at basic price by Economic activity at
current price at base, 2011-12
Sector Share in % at Current (2011-12) Prices 2015-16 2016-17(PE) 2017-18(1st AE)
Agriculture, Forestry & Fishery 17.5 17.4 16.4 Industry 29.7 28.8 28.5 Services 52.8 53.8 55.1 GVA at basic price 100.0 100.0 100.0 Source: Press note on 5 Jan, 2018, CSO, Government of India. PE: Provisional Estimate, 1st AE: 1st Advance Estimate
Per capita GDP (2011-12, base) & Growth (in %) of India at Constant and Current Prices
2015-16 2016-17(PE) 2017-18(1st AE) Per Capita GDP at Constant Prices (in `) 88706 93840 98673 Growth (in %) 6.7 5.8 5.2 Per Capita GDP at Current Prices (in `) 106641 116888 126349 Growth (in %) 8.6 9.6 8.1
Per Capita GDP of India, at constant prices at base 2011-12, has been decreasing consistently over the period from 2015-16 to 2017-18.

4
Overview of State Economy
Bureau of Applied Economics & Statistics, Department of Statistics, Planning & Programme Monitoring (DoPS&PM), Government of West Bengal has deduced GSVA and GSDP figures, their annual growth rates, percentage shares etc. for the state of West Bengal for the last few financial years in terms of constant and current prices at base, 2011-12. Here GSVA and GSDP growth rates, their percentage shares across three major economic sectors etc. have been analysed at constant and current prices with base year 2011-12 and such have been literally and graphically represented below.
Annual Growth of Gross State Domestic Product (GSDP) and Gross State Value Added (GVA) at Market Price of West Bengal at Base, 2011-12
Year GSDP Growth (Per cent) GSVA Growth (Per cent) Current Price Constant Price Current Price Constant Price
2015-16 9.76 5.85 9.18 5.59 2016-17(PE) 15.97 7.98 15.37 8.31
2017-18(1st AE) 15.06 11.46 14.99 11.80 Source: BAE&S, DoPS&PM, Government of West Bengal
State economy is contributing 6.35% of National economy at current prices and 5.68% at constant prices at base 2011-12 during 2017-18 (1st AE).
GSDP of West Bengal has grown steadily and prodigiously over the period under consideration, as explained by the Table and the chart above.
Sectoral growth rates of GSVA and sectoral shares, both in percentages, at constant and current prices at base 2011-12, have been provided here for the last few years to highlight the thrust in sectoral contribution towards the State’s overall GSVA over the years. GSVA at constant prices, 2011-12, has increased at steady levels over the period under consideration.

5
Annual Growth of Gross State Value Added (GSVA) at basic price by Economic Activity at constant price of West Bengal at Base, 2011-12
Sector Growth in % at Constant (2011-12) Prices 2015-16 2016-17(PE) 2017-18(1st AE)
Agriculture, Forestry & Fishery 0.29 3.55 2.28 Industry 8.83 8.46 11.41 Services 6.37 10.16 15.61 GSVA at basic price 5.59 8.31 11.80 Source: BAE&S, DoPS&PM, Government of West Bengal
GSVA at base 2011-12 has grown in an increasing rate at constant price for the last three years and Industry and Services sectors have registered remarkable growth rates over the same period.
Percentage Share of Gross State Value Added (GSVA) of West Bengal at basic price by Economic activity at constant price at base, 2011-12
Sector Share in % at Constant (2011-12) Prices 2015-16 2016-17(PE) 2017-18(1st AE)
Agriculture, Forestry & Fishery 21.54 20.60 18.84 Industry 25.23 25.26 25.18 Services 53.23 54.15 55.99 GSVA at basic price 100.00 100.01 100.01 Source: BAE&S, DoPS&PM, Government of West Bengal
Services sector has consistently dominated the sectoral share of GSVA in constant prices over the last few years, followed by nearly equal shares of Industry and Agriculture and allied sectors.
Annual Growth of Gross State Value Added (GSVA) at basic price by Economic Activity at
current price of West Bengal at Base, 2011-12 Sector Growth in % at Current (2011-12) Prices
2015-16 2016-17(PE) 2017-18(1st AE) Agriculture, Forestry & Fishery 10.42 14.66 8.58 Industry 5.89 8.92 13.90 Services 9.95 18.20 18.20 GSVA at basic price 9.18 15.37 14.99 Source: BAE&S, DoPS&PM, Government of West Bengal

6
At current prices at base 2011-12, Industry sector has shown marvellous growths since 2015-16, and Services sector also grew commendably.
Percentage Share of Gross State Value Added (GSVA) of West Bengal at basic price by Economic activity at current price at base, 2011-12
Sector Share in % at Current (2011-12) Prices 2015-16 2016-17(PE) 2017-18(1st AE)
Agriculture, Forestry & Fishery 24.52 24.37 23.01 Industry 21.2 20.0 19.8 Services 54.27 55.60 57.16 GSVA at basic price 99.99 100.00 100.00 Source: BAE&S, DoPS&PM, Government of West Bengal
Services sector has consistently dominated the sectoral share of GSVA in current prices over the last few years, followed by nearly equal shares of Industry and Agriculture and allied sectors. Per capita GSDP (2011-12, base) & Growth (in %) of West Bengal at Constant &Current Prices
2015-16 2016-17(PE) 2017-18(1st AE) Per Capita GSDP at Constant Prices (in `) 64143 68578 75682 Growth (in %) 4.80 6.91 10.36 Per Capita GSDP at Current Prices (in `) 82851 95131 108372 Growth (in %) 8.67 14.82 13.92
Per Capita GSDP of West Bengal, both in terms of constant and current prices at base 2011-12, has been growing in steadily increasing rates over the last three years.

7
Overview of the State Finance How to manage one’s economy at best on its own self based on one’s own developed resources has been amongst the foremost priorities of any State across history. West Bengal too sets an example in striving towards the cherished objective. In the last seven years, in spite of a historical debt stress condition, significant achievements could be managed through concerted and sustained effort of the State Government. Resource mobilisation and comprehensive reforms in tax administration and collection resulted in consistently decreasing debt to GSDP ratio recorded over last 7 years. Increase in Own Tax Revenue collection of the State played a crucial part in this process of recovery.
Pattern of Revenue Receipts (` in Crore)
Financial Year
Share in Central Taxes
State’s own Tax Revenue
Non-Tax Revenue
Grants-in-Aid Total
2010-11 15954.95 21228.74 2380.50 7800.01 47264.20 2011-12 18587.81 24938.16 1340.25 13888.82 58755.04 2012-13 21226.27 32808.49 1918.15 12342.84 68295.75 2013-14 23175.02 35830.56 2022.72 11853.49 72881.79 2014-15 24594.95 39411.96 1626.66 20880.64 86514.21 2015-16 37163.93 42492.08 1861.79 28214.41 109732.20 2016-17 44625.16 45466.46 2949.86 24790.97 117832.45
2017-18 (RE) 49510.33 50070.47 3173.10 30280.18 133034.08 2018-19 (BE) 55437.40 55200.58 3395.40 32714.37 146747.76
All figures are taken from AG, West Bengal except 2017-18 & 2018-19
Own Tax Revenue has clearly dominated the shares of State Total Revenue Receipts in 2016-17. State’s Own Tax Revenue collection grew up to `45466.46 crore in 2016-17 from `21228.74 crore in 2010-11, thereby it has more than doubled in the six years. In 2017-18 (RE), the collection recorded `50070.47crore and by 2018-19 (BE), it is about to be `55200.58crore.

8
Classification of State's Own Tax Revenue (` in Crore)
Major Heads of Account 2011-12 2012-13 2013-14 2014-15 2015-16 2016-17
Land Revenue 1872.23 2023.72 2253.54 2275.74 2456.27 2568.66
Stamp and Registration Fees 2731.68 4357.23 4053.07 4196.20 4174.97 4382.73
State Excise 2117.04 2621.43 3017.66 3587.02 4015.12 5226.16 Taxes on Sales, Trades, etc. 15888.41 18554.76 21931.09 24021.91 26050.16 27982.69
Taxes on Vehicles 1007.23 1221.55 1350.66 1504.68 1707.02 1869.86
Other taxes on Income & Exp. 426.68 448.01 465.28 464.14 485.50 509.09
Taxes and Duties on Electricity 408.19 1837.15 1213.38 1946.83 2091.63 1318.87
Others* 486.71 1744.64 1545.88 1415.45 1511.40 1608.41
Total 24938.17 32808.49 35830.56 39411.96 42492.08 45466.47 Note : Others include Taxes on Agricultural Income, Taxes on Immovable Property other than Agricultural Land, Taxes on Goods and Passengers, Taxes and Duties on Commodities and Services etc.
State’s Own Tax Revenue receipts have consistently increased over the last few years.
Taxes on Sales, Trades etc. has clearly dominated the State’s Own Tax Revenue receipts in 2016-17.

9
Key parameters of State Finances are shown in the following graphs, tables and paragraphs.
Development Expenditure & Growth (YoY) in Percentage
Year ` in Crore Development Exp. as % of Total Exp. Total Exp. Development Exp.
2010-11 72962.11 38058.67 52.16 2011-12 83830.88 42952.64 51.24 2012-13 95357.49 51824.18 54.35 2013-14 108513.39 57936.08 53.39 2014-15 123042.43 70672.24 57.44 2015-16 141451.09 85406.15 60.38 2016-17 157547.52 94784.68 60.16 2017-18 (BE) 185998.25 111575.03 59.99 2018-19 (RE) 193958.75 118186.66 60.93 All figures are taken from AG, West Bengal except 2017-18 & 2018-19
Development Expenditure of the State has been increasing in steady percentages in course of the last few years, as well as share of the State’s Development Expenditure in the Total Expenditure has also been growing in roughly increasing percentages over the same period.
Capital Expenditure & Growth (YoY) in Percentage
Year ` in Crore Capital Exp. as % of Total Exp. Total Expenditure Capital Expenditure
2010-11 72962.11 2633.48 3.61 2011-12 83830.88 3211.72 3.83 2012-13 95357.49 5611.33 5.88 2013-14 108513.39 7590.25 6.99 2014-15 123042.43 10383.39 8.44 2015-16 141451.09 13280.99 9.39 2016-17 157547.52 12533.63 7.96 2017-18 (RE) 185998.25 22281.61 11.98 2018-19 (BE) 193958.75 26628.18 13.73 All figures are taken from AG, West Bengal except 2017-18 & 2018-19

10
Capital Expenditure of the State has been increasing steadily in course of the last few years’ time, and its share in the State’s Total Expenditure has also been increasing by increasing amounts. State Plan Expenditure:
The total State Plan Expenditure in 2010-11 was `11837.85 crore which grew to `49040.89 crore in 2016-17 with a Compounded Annual Growth Rate(CAGR) of 26.73%.
Expenditure on Social Infrastructure (includes Education, Sports, Art & Culture, Health & Family Welfare, Water Supply, Sanitation, Housing, Information & Broadcasting, Labour & Labour Welfare, Welfare of SC, ST and OBC, Social Welfare and Nutrition):
The total expenditure on social infrastructure in 2010-11 was `6845.61 crore which grew to `25722.15 crore in 2016-17 with a Compounded Annual Growth Rate (CAGR) of 24.69%. The overall growth of expenditure on Social Infrastructure increased more than three times over the period 2010-11 through 2016-17.

11
Expenditure on Agri and Agri-allied including Rural Development (includes Agriculture & allied activities, Rural Development, Special Areas Program and Irrigation and Flood Control):
The overall growth of expenditure on Agri and Agri-allied Services including Rural Development increased more than five times during the period 2010-11 through 2016-17. The total expenditure on Agri and agri-allied sector was `3,029.39 crore in 2010-11 which increased to `16671.15 crore (2016-17), with a 32.87% Compounded Annual Growth Rate (CAGR).
Expenditure on Physical Infrastructure (includes Energy, Industry and Minerals, Transport, Science Technology & Environment, General Economic Service):
The total expenditure on physical infrastructure in 2010-11 was `1758.92 crore which increased to `5554.02 crore in 2016-17, an increase of 21.12% in CAGR. The overall growth of expenditure on Physical Infrastructure increased more than three times over the period 2010-11 through 2016-17.
12
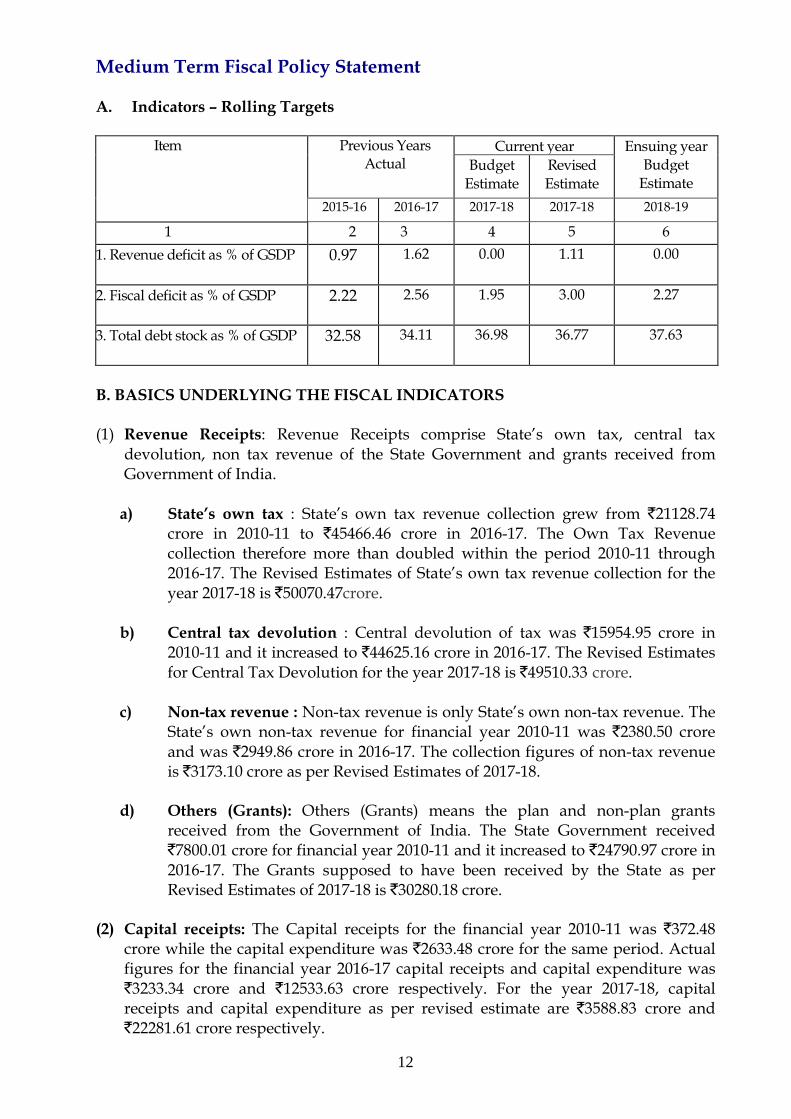
Medium Term Fiscal Policy Statement A. Indicators – Rolling Targets
Item Previous Years Actual
Current year Ensuing year Budget
Estimate Budget
Estimate Revised Estimate
2015-16 2016-17 2017-18 2017-18 2018-19
1 2 3 4 5 6 1. Revenue deficit as % of GSDP 0.97 1.62 0.00 1.11 0.00
2. Fiscal deficit as % of GSDP 2.22 2.56 1.95 3.00 2.27
3. Total debt stock as % of GSDP 32.58 34.11 36.98 36.77 37.63
B. BASICS UNDERLYING THE FISCAL INDICATORS (1) Revenue Receipts: Revenue Receipts comprise State’s own tax, central tax
devolution, non tax revenue of the State Government and grants received from Government of India.
a) State’s own tax : State’s own tax revenue collection grew from `21128.74
crore in 2010-11 to `45466.46 crore in 2016-17. The Own Tax Revenue collection therefore more than doubled within the period 2010-11 through 2016-17. The Revised Estimates of State’s own tax revenue collection for the year 2017-18 is `50070.47crore.
b) Central tax devolution : Central devolution of tax was `15954.95 crore in
2010-11 and it increased to `44625.16 crore in 2016-17. The Revised Estimates for Central Tax Devolution for the year 2017-18 is `49510.33 crore.
c) Non-tax revenue : Non-tax revenue is only State’s own non-tax revenue. The
State’s own non-tax revenue for financial year 2010-11 was `2380.50 crore and was `2949.86 crore in 2016-17. The collection figures of non-tax revenue is `3173.10 crore as per Revised Estimates of 2017-18.
d) Others (Grants): Others (Grants) means the plan and non-plan grants
received from the Government of India. The State Government received `7800.01 crore for financial year 2010-11 and it increased to `24790.97 crore in 2016-17. The Grants supposed to have been received by the State as per Revised Estimates of 2017-18 is `30280.18 crore.
(2) Capital receipts: The Capital receipts for the financial year 2010-11 was `372.48
crore while the capital expenditure was `2633.48 crore for the same period. Actual figures for the financial year 2016-17 capital receipts and capital expenditure was `3233.34 crore and `12533.63 crore respectively. For the year 2017-18, capital receipts and capital expenditure as per revised estimate are `3588.83 crore and `22281.61 crore respectively.
13
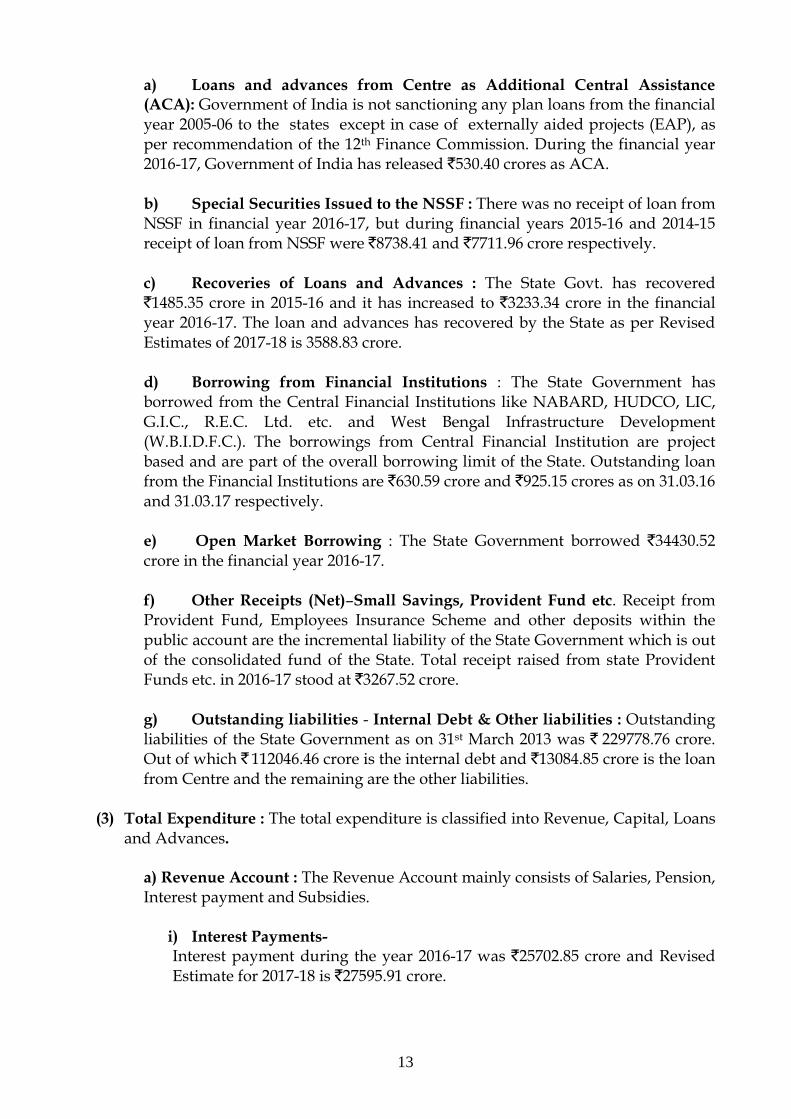
a) Loans and advances from Centre as Additional Central Assistance (ACA): Government of India is not sanctioning any plan loans from the financial year 2005-06 to the states except in case of externally aided projects (EAP), as per recommendation of the 12th Finance Commission. During the financial year 2016-17, Government of India has released `530.40 crores as ACA. b) Special Securities Issued to the NSSF : There was no receipt of loan from NSSF in financial year 2016-17, but during financial years 2015-16 and 2014-15 receipt of loan from NSSF were `8738.41 and `7711.96 crore respectively. c) Recoveries of Loans and Advances : The State Govt. has recovered `1485.35 crore in 2015-16 and it has increased to `3233.34 crore in the financial year 2016-17. The loan and advances has recovered by the State as per Revised Estimates of 2017-18 is 3588.83 crore. d) Borrowing from Financial Institutions : The State Government has borrowed from the Central Financial Institutions like NABARD, HUDCO, LIC, G.I.C., R.E.C. Ltd. etc. and West Bengal Infrastructure Development (W.B.I.D.F.C.). The borrowings from Central Financial Institution are project based and are part of the overall borrowing limit of the State. Outstanding loan from the Financial Institutions are `630.59 crore and `925.15 crores as on 31.03.16 and 31.03.17 respectively. e) Open Market Borrowing : The State Government borrowed `34430.52 crore in the financial year 2016-17. f) Other Receipts (Net)–Small Savings, Provident Fund etc. Receipt from Provident Fund, Employees Insurance Scheme and other deposits within the public account are the incremental liability of the State Government which is out of the consolidated fund of the State. Total receipt raised from state Provident Funds etc. in 2016-17 stood at `3267.52 crore. g) Outstanding liabilities - Internal Debt & Other liabilities : Outstanding liabilities of the State Government as on 31st March 2013 was ` 229778.76 crore. Out of which ` 112046.46 crore is the internal debt and `13084.85 crore is the loan from Centre and the remaining are the other liabilities.
(3) Total Expenditure : The total expenditure is classified into Revenue, Capital, Loans
and Advances. a) Revenue Account : The Revenue Account mainly consists of Salaries, Pension, Interest payment and Subsidies.
i) Interest Payments- Interest payment during the year 2016-17 was `25702.85 crore and Revised Estimate for 2017-18 is `27595.91 crore.

14
ii) Major subsidies : General subsidies for the financial year 2016-17 was `7380.55 crore and same estimated at `7685.89 crore as per Revised Estimate of 2017-18. iii) Salaries : The salary expenditure of the State Government, which includes both plan and non-plan salary, has increased to `32919.10 crore in the financial year 2016-17 as compared to `30234.06 crore in the financial year 2015-16. The annual growth to the salary expenditure comes to 8.88%. The Revised Estimates in Salary payments in the year 2017-18 is `36996.46 crore. iv) Pension : The Pension payments in the financial year 2015-16 was `12860.31 crore and such payments in the financial year 2016-17 was `12000.00 crore. Payments due to Pensions is `14673.64 crore as per Revised Estimates for the financial year 2017-18.
b) Capital Account : The actual capital expenditure for the year 2010-11 was `2633.48 crore and for 2016-17, it was `12533.63 crore, therefore a raise of about five times during the period. The revised estimate for the year 2017-18 was `22281.61 crore.
i) Disbursement of Loans and advances - The Loan and Advances has decreased to `719.80 crore in 2017-18(RE) as compared to `1197.20 crore AG actual of 2016-17. This expenditure comprises both plan & non-plan loans. ii) Capital Outlay – The Capital Outlay of the state went up from `2225.75 crore in 2010-11 to `11336.43 crore in 2016-17, thereby increasing by about five times during the interim period. `21561.81 crore is expected as capital outlay for the financial year 2017-18(RE).
4) GSDP Growth: GSDP (2011-12 base year) of the state at current price grew by 102.40% (CAGR 12.47%) in 2017-18 (1st AE) over 2011-12, and at constant price, it grew by 41.35% (CAGR 5.94%) over the same period. Therefore, in absolute terms, GSDP of the state at current price more-than-doubled over the six-year period, 2011-12 through 2017-18 (1st AE).

15
Fiscal Policy Strategy Statement A. OVERVIEW OF FISCAL POLICY & STATUS OF THE STATE West Bengal Fiscal Responsibility and Budget Management (FRBM) Act, 2010 prescribes that the State government shall progressively reduce the debt stock, revenue deficit and fiscal deficit to specified targets by financial year 2014-15. Since such figures were yet to be met by 2014-15, the targets may be put in extension for future years without bringing any necessary amendment to the Act. It however needs to be stressed in this case that despite an excessive financial burden on the State, the fiscal indicators have consistently moved towards the targets prescribed in the Act. The following tables will clarify the actual picture of the state in terms of fiscal indicators. The Debt to Total Revenue Receipt ratio for the state was 396.47% in 2010-11 and it gradually decreased to 286.58% in 2016-17. Likewise, the Debt to GSDP ratio for the state was 40.65% in 2010-11 and it gradually decreased to 34.11% in 2016-17. According to 2017-18 (RE), the Debt to Total Revenue Receipt ratio is estimated at 273.63% and as per 2018-19 (BE), it is further reduced at 269.06%. Similarly, the Debt to GSDP ratio is estimated at 36.77% as per 2017-18 (RE) and according to 2018-19 (BE), it is pegged at 37.63%.
Debt as a % of Total Revenue Receipt
Financial Year Debt (` in Crore)
Total Revenue Receipt (` in Crore)
Debt as a % of Total Revenue Receipt
2010-11 187387.40 47264.20 396.47
2011-12 207702.04 58755.04 353.51 2012-13 229778.76 68295.75 336.45 2013-14 251996.59 72881.79 345.76 2014-15 277579.15 86514.21 320.85 2015-16 306042.57 109732.21 278.90
2016-17 337682.41 117832.45 286.58
2017-18 (RE) 364018.74 133034.08 273.63
2018-19 (BE) 394832.23 146747.76 269.06 All figures are taken from AG, West Bengal except 2017-18 & 2018-19
The Revenue Deficit to Total Revenue Receipt ratio for the state was 36.55% in 2010-11 and it gradually decreased to 13.65% in 2016-17 and 8.27% in 2017-18 (RE). Likewise, the Revenue Deficit to GSDP ratio for the state was 3.75% in 2010-11 and it gradually decreased to 1.62% in 2016-17 and 1.11% in 2017-18 (RE).

16
Revenue Deficit as a % of Total Revenue Receipt
Financial Year Revenue Deficit (` in Crore)
Total Revenue Receipt (` in Crore)
Revenue Deficit as a % of Total Revenue Receipt
2010-11 17273.96 47264.20 36.55 2011-12 14571.33 58755.04 24.80 2012-13 13815.13 68295.75 20.23 2013-14 18915.48 72881.79 25.95 2014-15 17137.40 86514.21 19.81 2015-16 9095.05 109732.21 8.29 2016-17 16085.11 117832.45 13.65 2017-18 (RE) 11005.61 133034.08 8.27 2018-19 (BE) 0.00 146747.76 0.00 All figures are taken from AG, West Bengal except 2017-18 & 2018-19
The Fiscal Deficit to Total Revenue Receipt ratio for the state was 41.33% in 2010-11 and it gradually decreased to 21.54% in 2016-17. Likewise, the Fiscal Deficit to GSDP ratio for the state was 4.24% in 2010-11 and it gradually decreased to 2.56% in 2016-17. According to 2017-18 (RE), the Fiscal Deficit to Total Revenue Receipt ratio is estimated at 22.32% and as per 2018-19 (BE), it is further reduced at 16.22%. Similarly, the Fiscal Deficit to GSDP ratio is estimated at 3.00% as per 2017-18 (RE) and according to 2018-19 (BE), it is pegged at 2.27%.
Fiscal Deficit as a % of Total Revenue Receipt
Financial Year Fiscal Deficit (` in Crore)
Total Revenue Receipt (` in Crore)
Fiscal Deficit as a % of Total Revenue Receipt
2010-11 19534.96 47264.20 41.33 2011-12 17704.88 58755.04 30.13 2012-13 19146.63 68295.75 28.03 2013-14 25347.90 72881.79 34.78 2014-15 27345.30 86514.21 31.61 2015-16 20890.69 109732.21 19.04 2016-17 25385.40 117832.45 21.54 2017-18 (RE) 29698.39 133034.08 22.32 2018-19 (BE) 23805.44 146747.76 16.22
Capital Expenditure as a % of Fiscal Deficit
Financial Year
Capital Expenditure (` in Crore)
Fiscal Deficit (` in Crore)
Capital Expenditure as a % of Fiscal Deficit
2010-11 2633.48 19534.96 13.48 2011-12 3211.72 17704.88 18.14 2012-13 5611.73 19146.63 29.31 2013-14 7590.25 25347.90 29.94 2014-15 10383.39 27345.29 37.97 2015-16 13280.99 20890.69 63.57 2016-17 12533.63 25385.40 49.37 2017-18 (RE) 22279.97 29698.39 75.02 2018-19 (BE) 26628.18 23805.44 111.86
All figures are taken from AG, West Bengal except 2017-18 & 2018-19

17
State’s Capital Expenditure has been increasing steadily and consistently as percentage of State’s Fiscal Deficit since the last few years. It increased consistently from 18.14% in 2011-12 to 49.37% in 2016-17, almost in quantum jumps in the last few years. It further leaped to 75.02% according to 2017-18 (RE), and went up to 111.86% in 2018-19 (BE). This reflects on the State’s increased stress on Capital Expenditure while keeping Fiscal Deficit under control.
Revenue Expenditure as a % of Revenue Receipt
Financial Year ` in crore Revenue Expenditure as
a % of Revenue Receipt Revenue Receipt Revenue Expenditure 2010-11 47264.20 64538.16 136.55 2011-12 58755.04 73326.37 124.80 2012-13 68295.75 82110.88 120.23 2013-14 72881.79 91797.27 125.95 2014-15 86514.21 103651.61 119.81 2015-16 109732.21 118827.26 108.29 2016-17 117832.45 133917.56 113.65 2017-18 (RE) 133034.08 144039.69 108.27 2018-19 (BE) 146747.76 146747.76 100.00
All figures are taken from AG, West Bengal except 2017-18 & 2018-19
State’s Revenue Expenditure as percentage of Total Revenue Receipt has been roughly gradually decreasing for the last few years, which highlights the State’s direction towards revenue self-sufficiency.

18
Interest as a % of Revenue Receipt
Financial Year
Interest (` in Crore)
Revenue Receipt (` in Crore)
Interest as a % of Revenue Receipt
2010-11 13817.30 47264.20 29.23 2011-12 15895.99 58755.04 27.05 2012-13 17570.70 68295.75 25.73 2013-14 20756.81 72881.79 28.48 2014-15 21587.99 86514.21 24.95 2015-16 23114.92 109732.21 21.06 2016-17 25702.85 117832.45 21.81 2017-18 (RE) 27595.91 133034.08 20.74 2018-19 (BE) 27136.57 146747.76 18.49
All figures are taken from AG, West Bengal except 2017-18 & 2018-19
State’s Interest payments although have been increasing over the years, their percentage over the corresponding Revenue Receipt figures has been reducing approximately. All the above Tables indicate favourable movement towards compliance of conditions under WBFRBM Act, 2010.

19
B. FISCAL POLICY FOR THE ENSUING YEAR
(1) Tax Policy:
During recent years, the Government has introduced far-reaching reforms in Tax policy and Tax Administration. Array of Government Process Re-engineering has been introduced in State Excise and Registration & Stamp Duty collection. Major digital initiatives have also been implemented in all areas of tax collection including e-registration, e-filing of returns and e-payment of taxes to simplify procedures and reduce compliance costs. Effective e-governance initiatives of the State Government in Tax Administration have deepened the structural changes in State tax collection in the last six years thereby enhancing buoyancy.
Goods and Service Tax (GST) has been introduced in India w.e.f. 1.7.2017, subsuming some important Central and State level taxes, including the main source of State tax revenue, namely, the Value Added Tax (VAT). With the implementation of GST at the State level, the State Govt. has collaborated effectively in migrating from administration of VAT to GST. Due to the effective implementation of e-governance in VAT administration, its benefits have also been realized in implementation of GST. Due to this effort, the State has achieved the highest growth in number of new registrations under GST in the whole country.
Due to its concerted and planned execution of various reform measures in State Taxes, Collection of State Tax Revenue has increased from `42,492.00 crore in 2015-16 to `45,466.46 crore in 2016-17.
(2) Expenditure Policy
The cornerstone of State’s Expenditure Policy has consistently been greater emphasis on Capital Expenditure and Development Expenditure than on Revenue Expenditure in view of overall and long-term development of the State in the future. The thrust can be clearly observed in the regular increase of quanta in Capital and Development Expenditure heads since 2011-12 over the years. The Government decided to increase expenditure on capital creation and other social welfare and development programmes. Efforts are being made to increase plan outlays for building infrastructure in the areas of road connectivity, power, drinking water, urban utilities, etc. and welfare programmes meant for the development of the backward classes, minorities, women, child, rural and urban population living below the poverty line.
(3) Borrowing and other liabilities, Lending and Investment
State Government’s borrowing was for meeting the requirement for developmental expenditure of the State. State Government helps the Public Sector undertakings of the state by sanctioning loans, subsidy and grant for the smooth functioning of these organisations. Except this, investments to the share capital of the co-operative organisations of the state and various Public Sector undertakings may be done by the State Government by way of borrowing from different Central Financial Institutions.

20
(4) Consolidated Sinking Fund
The Consolidated Sinking Fund came into force from the financial year 1999-2000. This fund is to be utilised as an amortisation fund for redemption of the market loans of the State Government commencing from 2004-05. The outstanding balance of the extant Consolidated Sinking Fund Scheme as at end of March 2015 has transferred to the Fund. Total investment of the fund as on 31.03.2018 (2017-18 RE) is `4575.00 crore.
(5) Contingent and Other Liabilities
Government of West Bengal has enacted “the West Bengal Ceiling on Government Guarantees Act, 2001”, in which it was fixed that the total outstanding Government Guarantees as on first day of April of any year shall not exceed 90% per month of the state Revenue Receipts of the second preceding year. The Government accord guarantee worth `14624.59 cr., `15613.38 cr. and `15034.05 cr. in the past three years (2015-16 to 2017-18) which were within the ceiling.

21
SELECT FISCAL INDICATORS
SI. No.
Item Previous Years Actual
Current Year
2015-16 2016-17 BE 2017-18
RE 2017-18
(1) (2) (3) (4) (5) (6)
1 Gross fiscal deficit as per centum of GSDP
2.22
2.56
1.95
3.00
2 Revenue deficit as per centum of gross fiscal deficit
43.54
63.36
0.00
37.06
3 Total debt stock as per centum of GSDP
32.58
34.11
36.98
36.77
4 Total debt stock as per centum of total revenue receipts
278.90
286.58
256.64
273.63
5 Total debt stock as per centum of total own revenue receipts
720.23
742.71
656.22
727.01
6 Own revenue receipts as per centum of revenue expenditure
35.76
33.95
39.11
34.76
7 Capital outlay as per centum of Gross fiscal deficit
59.45
44.66
99.14
72.60
8. Interest payment as per centum of revenue receipts
21.06
21.81
18.12
20.74
9 Non-development expenditure as per centum of aggregate disbursements
39.62
39.84
39.83
40.01
10 Gross transfers from the Centre as per centum of aggregate disbursements
46.22
44.06
46.43
42.90
11 Non-tax revenue as per centum of revenue expenditure
1.57
2.20
1.56
2.20

22
COMPONENTS OF GOVERNMENT LIABILITIES (` in Crore)
SI. No.
Category Raised during the Fiscal Year
Repayment/ Redemption during
Outstanding Amount (End-March)
Previous year
(Actual) 2016-17
Current year (RE) 2017-18
Previous year
(Actual) 2016-17
Current year (RE) 2017-18
Previous year (Actual)
2016-17
Current year (RE)
2017-18
(1) (2) (3) (4) (5) (6) (7) (8)
1 Market borrowings 34430.52 37974.00 3201.04 11606.65 193638.44 220005.79
2 Loans from Centre 518.94 2063.45 975.46 1007.95 13209.12 14264.62
3 Special Securities issued to National Small Savings Fund (NSSF)
0.00 0.00 5892.79 5975.72 81776.76 75801.04
4 Borrowings from Financial Institutions/ Banks
1303.81 1900.00 1009.25 1065.65 925.15 1759.50
5 Ways and Means Advance (WMA)/Over Draft (OD) from RBI
1207.70 14000.00 1207.70 14000.00 0.00 0.00
6 State Provident Funds etc.
3267.52 3432.00 2411.09 2533.56
42404.22 46480.06
7 Reserve and deposits 64103.59 69757.20 58539.88 66579.92

23
GUARANTEES GIVEN BY STATE GOVERNMENT
Department
Max
imum
Gua
rant
ee A
mou
nt
as
on 3
1st M
arch
, 201
8 (`
)
Gua
rant
ee O
utst
andi
ng P
rinc
ipal
as
on
31st M
arch
, 201
8 (`
)
Gua
rant
ee O
utst
andi
ng In
tere
st
as o
n 31
st M
arch
, 201
8 (`
)
Gua
rant
ee F
ee a
s on
31s
t Mar
ch,
2018
(`)
Am
ount
Pai
d as
on
31st M
arch
, 20
18 (`
)
Due
Gua
rant
ee a
s on
31s
t Mar
ch,
2018
(`)
Animal Resources Development 3608000 258400 0 0 0 0
Backward Classes Welfare 1758757700 1408552299 83380000 0 0 0
Commerce & Industries 7390000 2000000 0 475818 0 475818
Co-Operation 12000000000 8640000000 0 0 0 0
Finance (IF) 35500000000 25555200000 0 0 0 0
Fisheries 44280 44280 133348 6881 0 6881
Food & Supplies 23000000000 2950000000 106152333 75900000 75900000 0
Micro & Small Scale Ent. and Textiles 40400000 21300000 19100000 7800000 1400000 6400000 Minority Affairs & Madrasah Education 12550000000 8717658000 0 5236183000 0 5236183000
Municipal Affairs 53490000 20935244 38112598 0 0 0
Power & Non-Conventional Energy Sources 61654596100 37984009651 0 1833382658 766000 1832616658 Refugee Relief & Rehabilitation 57900 56900 0 0 0 0
Tribal Development 200000000 114453470 0 0 0 0
Urban Development 3572179900 679900 0 245067013 0 245067013
Total 15034,05,23,880 8541,51,48,144 24,68,78,279 739,88,15,370 7,80,66,000 732,07,49,370

24
GUARANTEE REDEMPTION FUND (GRF)
(` in crore) Outstanding
invoked guarantees at
end of previous year
Outstanding amount in GRF at end of previous
year
Amount of guarantees likely to be
invoked during year
Addition to GRF during current
year
Withdrawal from GRF
during current year
Outstanding amount in GRF at end of current
year
(1) (2) (3) (4) (5) (6)
Nil
196.00
Nil
100.00
Nil
296.00

25
TAX REVENUES RAISED BUT NOT REALISED (PRINCIPAL TAXES)
(As at the end of reporting year)
Maj
or H
ead
Des
crip
tion
Amount under dispute (` crore)
Amount not under dispute (` crore)
Ove
r 1 y
ear
but
less
than
2 y
ears
Ove
r 2 y
ears
but
le
ss th
an 5
yea
rs
Ove
r 5 y
ears
but
le
ss th
an 1
0 ye
ars
Ove
r 10
year
s
Tota
l
Ove
r 1 y
ear
but
less
than
2 y
ears
Ove
r 2 y
ears
but
le
ss th
an 5
yea
rs
Ove
r 5 y
ears
but
le
ss th
an 1
0 ye
ars
Ove
r 10
year
s
Tota
l
Gra
nd T
otal
(1) (2) (3) (4) (5) (6) (7) (8) (9) (10) (11) (12) (13)
0022
Agricultural Income Tax
0.15 0.03 0.23 0.13 0.54 4.04 6.31 9.22 1.51 21.08 21.62
0029
R. E. Cess on Tea Estate
0.00 0.00 0.00 0.00 0.00 1.59 4.82 30.79 4.55 41.75 41.75
P. E. Cess on Tea Estate
0.00 0.00 0.00 0.00 0.00 0.81 3.19 9.55 1.29 14.84 14.84
0030
Stamps and Registration fees
Nil
Nil
Nil
157.81
157.81
Nil
Nil
Nil
Nil
Nil
157.81
0040
VAT 1213.37 7771.75 3395.90 N.A. 12381.02 976.73 1872.27 251.15 N.A. 3100.15 15481.17
Central Sales Tax
439.86
1541.06
816.04 N.A. 2796.96
69.78
188.45
15.09 N.A. 273.32 3070.28
0043
Electricity Duty
Nil 6.46 Nil Nil 6.46 8.40 15.87 1.29 9.42 34.98 41.44
0045
Betting Tax 0.00 0.00 0.00 0.00 0.00 0.00 0.00 0.00 0.00 0.00 0.00
Entertainment Tax
0.87 1.85 1.38 0.25 4.35 10.25 6.61 10.08 0.95 27.89 32.05
Luxury Tax 0.27 0.79 2.62 0.01 3.69 8.25 5.52 5.59 0.00 19.36 23.05
0039
State Excise
1.1395
5.3453
40.8519
0.4355
47.7722
0.4185
5.275
5.537
Nil
11.23
59.0027
Note: The reporting year refers to the second year preceding the year for which the annual financial statement and demands for grants are presented.

26
CONSOLIDATED SINKING FUND
(` in crore)
Out
stan
ding
at
begi
nnin
g of
the
prev
ious
yea
r 1.
4.20
16
Add
ition
s dur
ing
prev
ious
yea
r 20
16-1
7 W
ithdr
awal
s dur
ing
prev
ious
yea
r 20
14-1
5 O
utst
andi
ng a
t end
of
pre
viou
s yea
r/
begi
nnin
g of
cu
rren
t yea
r 1.
4.20
17
Out
stan
ding
as
per
cent
um o
f Sto
ck o
f SL
R Bo
rrow
ings
(%)
Add
ition
s dur
ing
curr
ent y
ear
2017
-18
With
draw
als d
urin
g cu
rren
t yea
r 20
15-1
6 O
utst
andi
ng a
t end
of
curr
ent y
ear/
be
ginn
ing
of
ensu
ring
year
1.
4.20
18
Out
stan
ding
as p
er
cent
um o
f Sto
ck o
f SL
R Bo
rrow
ings
(%)
(1) (2) (3) (4) (5) (6) (7) (8) (9)
4025.00 350.00 Nil 4375.00 N
ot A
pplic
able
200.00 Nil 4575.00
Not
App
licab
le