Embed Size (px)
Citation preview

i
ALLIANCE FINANCE COMPANY PLC | ANNUAL REPORT 2015/16
ANNUAL REPORT 2015/16

ii
ALLIANCE FINANCE COMPANY PLC | ANNUAL REPORT 2015/16
Alliance Finance Company PLC, the 3rd oldest finance company in Sri Lanka celebrated six decades of successful business operations on 18th July 2016.
Starting from humble beginnings in 1956, AFC has strived over a period of 60 years to strike a perfect balance and harmony between the interests of the multiple stakeholder groups that it represents. With a genuine concern for the well-being of our depositors, hirers, employees and shareholders, we have strived to meet the differing needs and aspirations of each and every one of them.
Achieving this balance over a sustained period of time has made the journey of 60 years a most fulfilling and gratifying one.
As we embody our core values of trust and innovation in an integrated People, Planet, Profit business philosophy, we look forward to maintaining this balance and continuing our journey steadfastly into the future, whilst embracing the exciting challenges and opportunities that await us.

1
ALLIANCE FINANCE COMPANY PLC | ANNUAL REPORT 2015/16

2
ALLIANCE FINANCE COMPANY PLC | ANNUAL REPORT 2015/16

3
ALLIANCE FINANCE COMPANY PLC | ANNUAL REPORT 2015/16
VisionTo be the most respected Licensed Finance Company in Sri Lanka, delivering superior stakeholder returns whilst supporting financial inclusion and social and environmental sustainability.
Mission To uphold the highest standards of social and environmental sustainability by delivering inclusive and innovative financial solutions to uplift the lives of people, whilst ensuring a superior experience for all our stakeholders
Core Values1. People CentricPeople includes all our stakeholders with a special emphasis on customers and staff. We consider customers as our first priority and provide what they need, ensuring their utmost satisfaction. Staff is our greatest asset and we value the voice of our staff and maintain an open door policy in the office premises to encourage dialogue.
2. IntegrityWe maintain the highest standards of integrity and accountability in all we say and do. We also strive to uphold customer trust earned throughout the period of our stand, by being committed to the highest levels of transparency. In addition to this, aligning to international standards of Social Performance Management with close monitoring of our impact created though Microfinance, we continue to
be a company accountable in providing responsible finance solutions to all our clients.
3. InnovationWe strive to keep our forward march steady in the current turbulent industry environment by positively undertaking various innovations to drive us ahead, whilst strengthening research and development to make innovation a continuous process.
4. Serve People & Conserve NatureWhilst adhering to the concept of triple bottom line, we as a company place high priority on social and environmental sustainability, with which the long term goals of the Company are strongly entwined.
5. DynamicThe business environment today is subject to rapid changes and is therefore very turbulent. Being dynamic is about keeping pace in the ever changing landscape and taking responsive action in order to meet challenges and surge ahead of the competition.
6. UnityWe take pride in the cohesion of the workforce in the Company working towards a common goal and it is a value that can only be created not infused. “All for one and one for all” philosophy has always been a key driving force of the Company’s success and we strive to maintain its consistency throughout.

4
ALLIANCE FINANCE COMPANY PLC | ANNUAL REPORT 2015/16
CONTENTS
overviewAbout AFC 6About This Report 6Financial Highlights 8Non-Financial Highlights 9Triple Bottom Line Achievements 10Economic Performance - Contribution to National Economy 11Milestones 12Awards, Certifications, Affiliations and Credit Rating 16Chairman’s Review 18Message from the Senior Advisor and past Chairman 21Deputy Chairman/ Managing Director’s Review 22
6-22Management Discussion and analysis
stewardship
AFC Sustainability Approach 32Stakeholder Engagement Approach 33Materiality assessment / Materiality Matrix 39Supply Chain Management 41Review on the Economic Environment 43SWOT Analysis 46Financial Review 48Operations Review 54Social and Environmental Review 65 Our Social Footprint 65 Customer and Product Responsibility 69 Human Capital 74 Our Environmental Footprint 82Support Services 85Geographic Footprint 96GRI G4 Index Table 101
Board of Directors 114Corporate Management 118Senior Management 120Corporate Governance 126Risk Management 134
32-101
114-134

5
ALLIANCE FINANCE COMPANY PLC | ANNUAL REPORT 2015/16
Financial InformationAnnual Report of the Directors 144Directors’ Statement on Internal Control Over Financial Reporting 148Directors’ Responsibility for Financial Reporting 149Report of the Audit Committee 150Independent Auditors’ Report 152Statement of Profit or Loss 153Statement of Comprehensive Income 154Statement of Financial Position 155Statement of Changes in Equity 156Statement of Cash Flows 157Significant Accounting Policies 158Notes to the Financial Statements 176Capital Adequacy Ratio 231
Other informationContribution to National Economy 232Depositors Information 233Debenture Investor Indicators 235Ten Year Summary - Company 236Shareholder Information 237Glossary 238
232-238
144-231Statutory InformationNotice of Meeting 241Notes 242Form of Proxy 243Corporate Information Inner Back Cover
241-iBC

6
ALLIANCE FINANCE COMPANY PLC | ANNUAL REPORT 2015/16
This report encompasses the entire operation of Alliance Finance Company PLC (AFC), strongly interwoven with the Triple Bottom Line; also covering the financial, social and environment sustainability strides of the Company. It also covers the overall strategy and future plans of the Company.
The information is presented in a more coherent, holistic and transparent manner with the intention that this report will give a clear and concise picture of our performance in terms of value creation over the short, medium and long term to all our stakeholders for their informed assessment and decisions.
Report ScopeIn the previous financial year, AFC produced the first integrated report, in compliance with Global Reporting Initiative G3 standards, which was received by the stakeholders with positive remarks. This time, AFC seeks to prepare a Sustainability Report where the sustainability performance is reported in line with the Global Reporting Initiative G4 standards. This report contains standard disclosures from the GRI sustainability guidelines. The GRI Content Index is given on pages 101-111 in this Annual Report.
Report Boundary The Annual Report contains information covering the Company’s operations of the Head Office and the branch network for the financial year ended 31st March 2016. The indicators and performance of the previous year is stated in places where comparative analysis is being used for interpretation and illustrations.
Moreover, the report also provides summary reviews on the performance of AFC’s two subsidiaries, Alfinco Insurance Brokers Private Limited and Macbertan Private Limited, for the financial year ended 31st March 2016.
MaterialityThe presentation of the information of this Annual Report has focused the most material aspects to AFC and its key stakeholders. AFC considers those aspects as the most vital pillars on which the business is built on and the future business will rely upon. The materiality
AbOuT AFC AbOuT ThiS REpORT
Alliance Finance Company PLC (AFC) is a Quoted Public Limited Liability Company incorporated under the Companies Ordinance No. 51 of 1938. The Company was approved and registered under the Finance Business Act No. 42 of 2011, Finance Leasing Act No. 56 of 2000 and is also an approved Credit Agency under the Mortgage Act No.6 of 1949 and Trust Receipt Ordinance No.12 of 1947. The Company operates from its head office in Colombo and with a network of 87 points of presence island wide. The Company’s corporate information is listed on the page inner back cover of this report.

7
ALLIANCE FINANCE COMPANY PLC | ANNUAL REPORT 2015/16
assessment and the basis of their materiality determination are given in the Materiality Assessment section on pages 39-40 of this report.
ComplianceThis Annual Report is prepared for the period starting from 1st April 2015 to 31st March 2016, complying with the general annual report cycle of the Company, for both financial and sustainability reporting. Consequently, the financial performance of the Company has been reported in compliance with the Sri Lanka Financial Reporting Standards (SLFRS) and Sri Lanka Accounting Standards (SLAS) promulgated by the Institute of Chartered Accountants of Sri Lanka. Where applicable, the Company has followed the rules and regulations of the following as well.
• Directions and rules of the Central Bank of Sri Lanka
• Companies Act No. 07 of 2007• Finance Business Act No. 42 of 2011• Finance Leasing Act No. 56 of 2000• The Listing Rules of the Colombo
Stock Exchange
The disclosures on Corporate Governance have been done in accordance with the Corporate Governance Direction No. 3 of 2008 issued by the Central Bank of Sri Lanka and the listing rules of the Colombo Stock Exchange.
External Assurance External assurance for the Financial Statements and the related notes is given by M/s. Baker Tilly Edirisinghe and Company through their audit and their assurance is given on page 152 of this Annual Report. There has been no external assurance taken this time for the sustainability content of the report.
PresentationoftheReportThe Annual Report will be presented in both printed and electronic formats this year. All the shareholders will be given the report in the form of a CD-ROM and the same will be available on the official web page of AFC (www.alliancefinance.lk) in PDF format. As a measure of reducing the carbon footprint of the Company, the printed copies of this report will only be posted on request to those who need it in that format.
AbOuT ThiS REpORT
ContactforQueriesFor any inquiries on this Annual Report 2015/16 or any information included therein to be informed and obtained from the contact below.
The Chief Financial OfficerAlliance Finance Company PLC84, Ward PlaceColombo 07SRI LANKATel: +94 112 673 673Fax: +94 112 697 205Email: [email protected]
8
ALLIANCE FINANCE COMPANY PLC | ANNUAL REPORT 2015/16
FiNANCiAl highlighTS
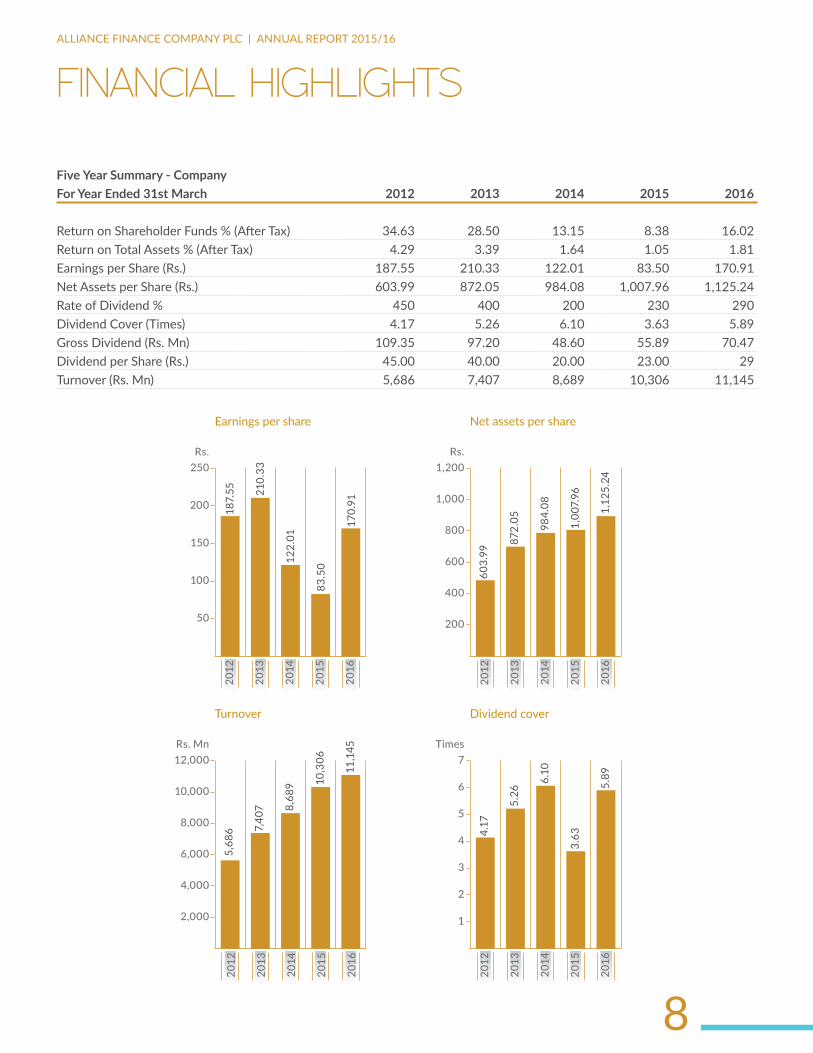
Five Year Summary - CompanyForYearEnded31stMarch 2012 2013 2014 2015 2016
Return on Shareholder Funds % (After Tax) 34.63 28.50 13.15 8.38 16.02Return on Total Assets % (After Tax) 4.29 3.39 1.64 1.05 1.81Earnings per Share (Rs.) 187.55 210.33 122.01 83.50 170.91Net Assets per Share (Rs.) 603.99 872.05 984.08 1,007.96 1,125.24Rate of Dividend % 450 400 200 230 290Dividend Cover (Times) 4.17 5.26 6.10 3.63 5.89Gross Dividend (Rs. Mn) 109.35 97.20 48.60 55.89 70.47Dividend per Share (Rs.) 45.00 40.00 20.00 23.00 29Turnover (Rs. Mn) 5,686 7,407 8,689 10,306 11,145
rs.
50
100
250
200
150
2012
2013
2014
2015
2016
Earnings per share
187.
55 210.
33
122.
01
83.
50
170.
91
rs. Mn
2,000
4,000
12,000
10,000
8,000
6,000
2012
2013
2014
2015
2016
Turnover
5,6
86 7,40
7 8,68
9 10,3
06
11,1
45
rs.
400
200
600
1,200
1,000
800
2012
2013
2014
2015
2016
Net assets per share
603.
99
872.
05
984.
08
1,00
7.96
1,12
5.24
Times
2
1
3
7
6
5
4
2012
2013
2014
2015
2016
Dividend cover
4.17
5.26
6.10
3.63
5.89

9
ALLIANCE FINANCE COMPANY PLC | ANNUAL REPORT 2015/16
NON-FiNANCiAl highlighTS
10 New PointsofPresence
3,570 Total no. oftraininghours
87 PointsofPresence 91
Trees Savedby Paper Recycling
6 Mn CSR investment
(Rs.)
14,000Trees planted forleasesgiven
2.3 Mn Employee training investment
(Rs.)
1,203 No.ofemployees
6 No.ofnewproducts introduced

10
ALLIANCE FINANCE COMPANY PLC | ANNUAL REPORT 2015/16
TRiplE bOTTOm liNE AChiEvEmENTS
Goals aspect achievements – 2015/16
People Return on Investment Shareholders Pre-tax ROE : 20.5%
People Development Employees Training investment : Rs. 2.7 MnNew Recruitments : 340
Improved quality of lifeCapacity Building
Customers Total number benefited : 133,984
Financial Inclusion Society CSR Investment : 6 MnNumber of EDS trainings conducted : 111Total number of EDS beneficiaries : 4,477
Profit Economic Value creation Economic Value created Total value : Rs. 1,560 Mn
Economic Value retention Economic Value retained Employee remuneration : Rs. 750.9 Mn
Government taxes : Rs. 353.2 Mn
Shareholder dividend : Rs. 70.4 Mn
Economic Value distribution
Economic Value distributed Allocation for Company expansion and growth : Rs. 384 Mn
Planet Reducing emissionAssist arresting global warming
Emission reduction/Cleaner and greener environment
Tree for a lease : Rs. 1.3 MnEco three wheeler : Rs. 0.3 Mn
Green financing solutionsEnergy conservation
Energy conservation Replacement of lighting system with LED bulbsEarth Hour celebration and 500 LED bulbs donation to Viharamahadevi park
Greener and Cleaner environment
Green Financing Hybrid and electric car leases at concessionary ratesLoans for Agriculture
11
ALLIANCE FINANCE COMPANY PLC | ANNUAL REPORT 2015/16
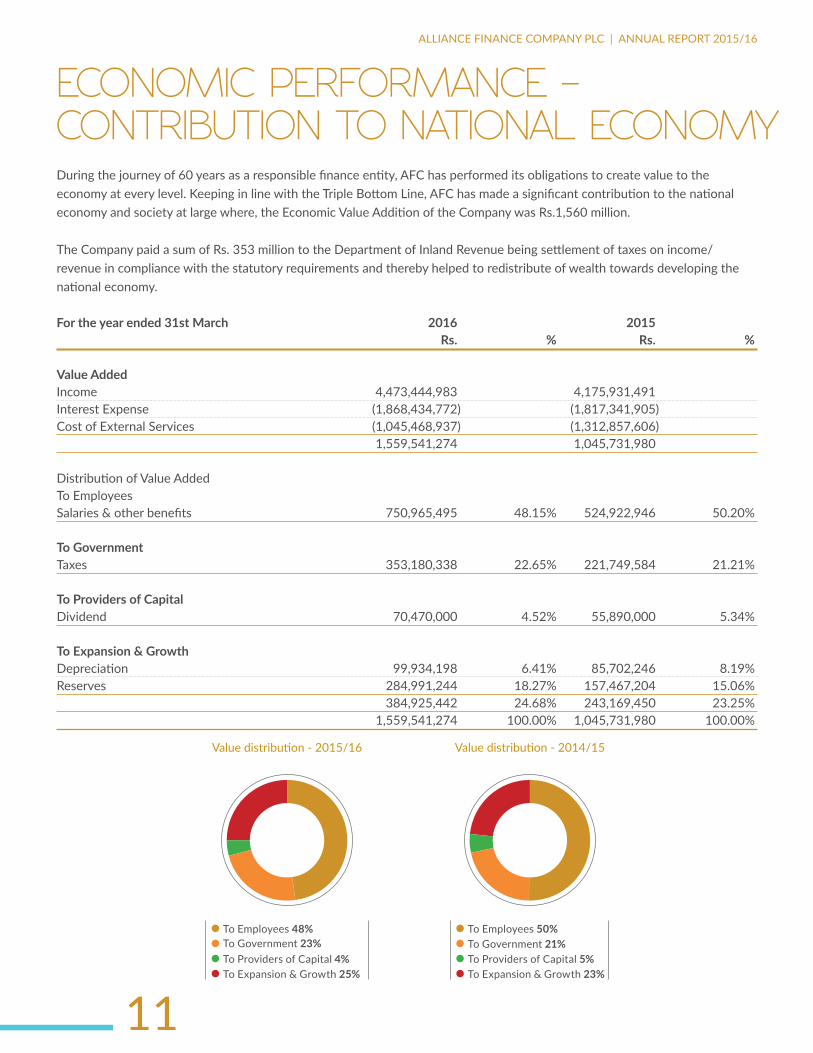
During the journey of 60 years as a responsible finance entity, AFC has performed its obligations to create value to the economy at every level. Keeping in line with the Triple Bottom Line, AFC has made a significant contribution to the national economy and society at large where, the Economic Value Addition of the Company was Rs.1,560 million.
The Company paid a sum of Rs. 353 million to the Department of Inland Revenue being settlement of taxes on income/ revenue in compliance with the statutory requirements and thereby helped to redistribute of wealth towards developing the national economy.
Fortheyearended31stMarch 2016 2015 Rs. % Rs. %
Value AddedIncome 4,473,444,983 4,175,931,491Interest Expense (1,868,434,772) (1,817,341,905)Cost of External Services (1,045,468,937) (1,312,857,606) 1,559,541,274 1,045,731,980
Distribution of Value AddedTo EmployeesSalaries & other benefits 750,965,495 48.15% 524,922,946 50.20%
To GovernmentTaxes 353,180,338 22.65% 221,749,584 21.21%
ToProvidersofCapitalDividend 70,470,000 4.52% 55,890,000 5.34%
ToExpansion&GrowthDepreciation 99,934,198 6.41% 85,702,246 8.19%Reserves 284,991,244 18.27% 157,467,204 15.06% 384,925,442 24.68% 243,169,450 23.25% 1,559,541,274 100.00% 1,045,731,980 100.00%
Value distribution - 2014/15
To Employees 50%To Government 21%To Providers of Capital 5%To Expansion & Growth 23%
Value distribution - 2015/16
To Employees 48%To Government 23%To Providers of Capital 4%To Expansion & Growth 25%
ECONOmiC pERFORmANCE – CONTRibuTiON TO NATiONAl ECONOmy

12
ALLIANCE FINANCE COMPANY PLC | ANNUAL REPORT 2015/16
The Deposit base surpasses a milestone of Rs.
100 Million
AFC moves into “Alliance House” – a
new, three-storied complex which is
today a well-known landmark in the city
milESTONES
AFC was incorporated on 18th
July 1956 at No. 43, Campbell Place
Colombo 8 with the motto “Earn before
you spend & Others before self”
The Company’s shares quoted in the
Colombo Brokers’ Association
Deposit base surpasses Rs.
One million
Acquired “Arpico Finance”
AFC purchases the land and buildings at
No. 84 Ward Place Colombo 7
Commemorated the Company’s
Silver Jubilee
1993
19941956 1965
1967
1969
19811959
13
ALLIANCE FINANCE COMPANY PLC | ANNUAL REPORT 2015/16
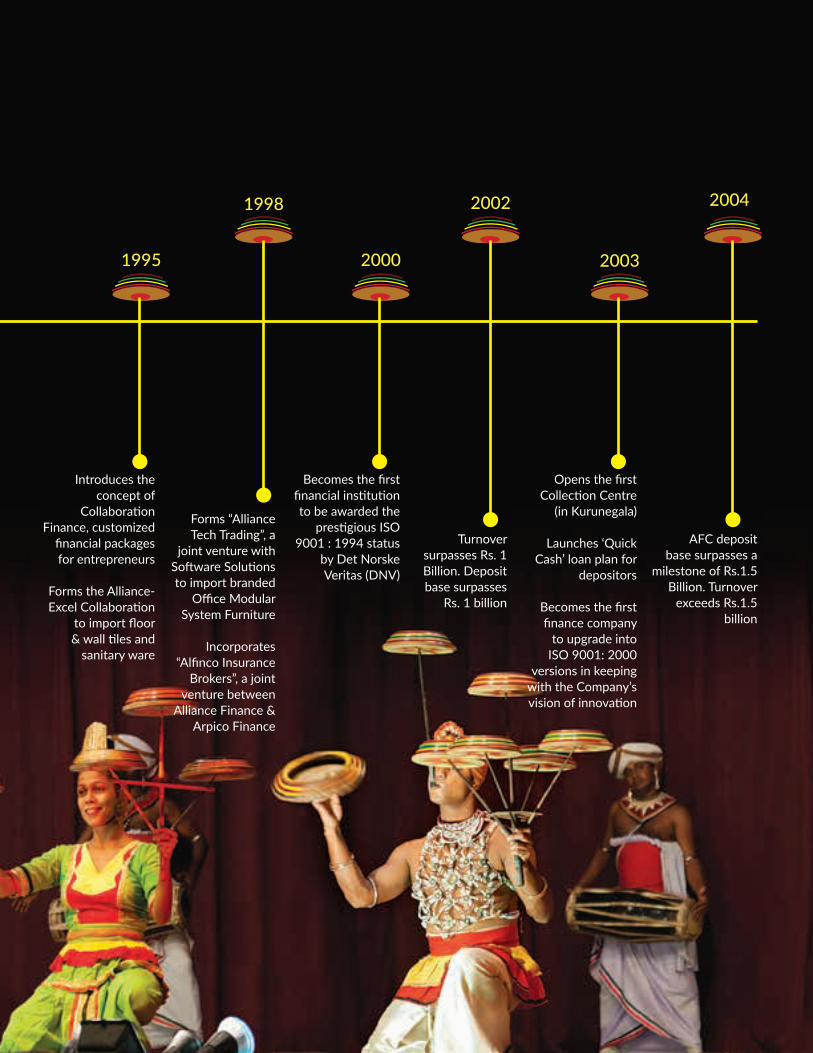
Introduces the concept of
Collaboration Finance, customized
financial packages for entrepreneurs
Forms the Alliance-Excel Collaboration
to import floor & wall tiles and
sanitary ware
Forms “Alliance Tech Trading”, a
joint venture with Software Solutions to import branded
Office Modular System Furniture
Incorporates “Alfinco Insurance
Brokers”, a joint venture between
Alliance Finance & Arpico Finance
Becomes the first financial institution to be awarded the
prestigious ISO 9001 : 1994 status
by Det Norske Veritas (DNV)
Turnover surpasses Rs. 1 Billion. Deposit base surpasses
Rs. 1 billion
Opens the first Collection Centre
(in Kurunegala)
Launches ‘Quick Cash’ loan plan for
depositors
Becomes the first finance company
to upgrade into ISO 9001: 2000
versions in keeping with the Company’s vision of innovation
AFC deposit base surpasses a
milestone of Rs.1.5 Billion. Turnover
exceeds Rs.1.5 billion
1995 2000
2002
2003
1998 2004

14
ALLIANCE FINANCE COMPANY PLC | ANNUAL REPORT 2015/16
Ms. Sonali de Silva, a
Non-Executive Director is
appointed as Chairperson on 31st May
2011
Alliance Finance becomes the Joint Winner (with
Peoples’ Leasing Company) of the Gold Award at
the National Business Excellence Award 2012
Also wins the overall Silver Award for “The Best
Management Practices” at the National Business Excellence Awards 2012
Becomes the first Sri Lankan company in the Banking
and Non-Banking Finance Sector to receive the
British Standard for BCMS Certification (Business
Continuity Management System)
The Company initiates a greater effort to
communicate its commitment to a Triple
Bottom Line philosophy, and thus a symbolic wave in colours of Blue, Green
and Orange is introduced to all its brand communiqué
signifying and reminding all stakeholders of its
commitment to PEOPLE, PLANET and PROFIT
The Company launches its first TV Commercial
milestones Contd.
Becomes the first finance company
to introduce Savings Accounts
Obtains ISO 9001 : 2000
certification for the Company’s
Motor Division, becoming the
second garage to be certified in Sri
Lanka
Celebrates the Company’s
Golden Anniversary.
Launches “Pride of Priority”,
a deposit scheme for
Senior Citizens with the offer
of an extra 1% interest
for their fixed deposits
The Company makes a new
addition to its product
portfolio with “Gold Loans”
The ISO certification
for Quality Management
System is upgraded to
the ISO 9001 : 2008 version
The Chairman and Joint
Managing Director Mr. Pratapkumar
de Silva retires from the
post of Joint Managing
Director and continues as
Chairman. Mr. Romani de
Silva continues as Deputy Chairman and takes
on the role of Managing
Director
2011
20122005
2009
201020082006

15
ALLIANCE FINANCE COMPANY PLC | ANNUAL REPORT 2015/16
In January, AFC becomes the first organization in Sri Lanka’s Finance and Non-
Banking Financial Sector to receive Certification for
BCMS (Business Continuity Management Systems) ISO
222301 : 012
Receives an international accolade for its Sustainable
Business products with a Merit Award at the Global Sustainable
Finance Conference held in Karlsruhe, Germany for the AFC
Ezy drive Green taxi service
Mr. Sunil Karunanayake is appointed as the Chairman of
AFC
AFC achieves its highest ever profit to date, with a Profit After
Tax of Rs. 511 Million and also records a net asset growth of
44%
The branch network is increased to 32 branches with a representation in every province
in Sri Lanka
Launches the Microfinance Division
In March, AFC was awarded the Asia Responsible Entrepreneurship Award for the Ezy
Drive gas taxi meter project at the award
ceremony held in New Delhi, India
AFC recorded the highest
investment of Rs. 10.6 Billion
AFC Chairman Mr. Sunil Karunanayake was awarded the Professional Excellence Award 2015 by the Institute of Certified Management Accountants of Sri Lanka (CMA) in recognition of his outstanding leadership capabilities
Successfully obtained the AFC’s inaugural foreign funding line from the prestigious Triodos Bank of
Netherlands. Along with that AFC also received its first FCY loan facility from Bangladesh as well
Microfinance SBU emerges as a dominant SBU in the Company structure, expanding its outreach by
completing 40 business locations
Introduced m-Cash pilot project in 15 branches for Microfinance clients, enabling a speedy recovery
process, facilitating efficiency
AFC took part in Rotary Sri Lanka’s One Million Trees Project, commenced in Kurunegala District as a step
forward in the “Tree for a Lease” initiative of the Company. Under the project, as of end-February 2016,
AFC had contributed 14,000 trees for 13,550 leases given during that period of the financial year
For the first time, AFC joins hands with Associated Motorways (Private) Limited (YAMAHA) to promote two
wheelers to prospective AFC customers
Completes the clearance of the drawbacks due to the Gold Loan industry crisis
2016
2013
2014
2015

16
ALLIANCE FINANCE COMPANY PLC | ANNUAL REPORT 2015/16
AwARdS, CERTiFiCATiONS, AFFiliATiONS ANd CREdiT RATiNg

17
ALLIANCE FINANCE COMPANY PLC | ANNUAL REPORT 2015/16
awarding Body awarded For award/accolade received Category Year
1 ICASL Annual Report Certificate of Recognition Non-Banking and Finance Sector 2015
2 EA Asia Responsible Entrepreneurship
Winner Green Leadership 2014
3 EOSD EZY Taxi Merit Certificate Best Innovation in Sustainable Financial Products and Services
2013
4 ICASL Annual Report Certificate of Recognition Non-Banking and Finance Sector 2013
5 DNV BCMS ISO 22301 Not Applicable 2013
6 NCCSL NBEA Gold - Joint winner Non-Banking and Finance Sector 2012
7 NCCSL NBEA Silver Performance Management Practices - Overall 2012
8 ICASL Annual Report Certificate of Recognition Non-Banking and Finance Sector 2012
9 BSI BCMS BS25999 Not Applicable 2012
10 NCCSL NBEA Silver Specialised Banking and Finance Sector 2011
11 ICASL Annual Report Certificate of Recognition Non-Banking and Finance Sector 2011
12 ICASL Annual Report Certificate of Recognition Non-Banking and Finance Sector 2010
13 ICASL Annual Report Certificate of Recognition Non-Banking and Finance Sector 2009
BSI - British Standards Institution EA - Enterprise Asia DNV - Det Norske VeritasEOSD - European Organisation for Sustainable DevelopmentICASL - Institute of Chartered Accountants of Sri LankaNCC - National Chamber of Commerce of Sri Lanka
Certifications• AFC is the first finance company in Sri Lanka to be awarded an ISO certification
• The Company became the first and the only finance company in Sri Lanka to be awarded ISO 22301 – the only accepted global standard for Business Continuity Management
Affiliations• Member of the Finance Houses Association of Sri Lanka
• Member of the Leasing Association of Sri Lanka
• Member of the Ceylon Chamber of Commerce
CreditRating• Rated BB+ (lka) by Fitch Ratings Lanka Limited
18
ALLIANCE FINANCE COMPANY PLC | ANNUAL REPORT 2015/16
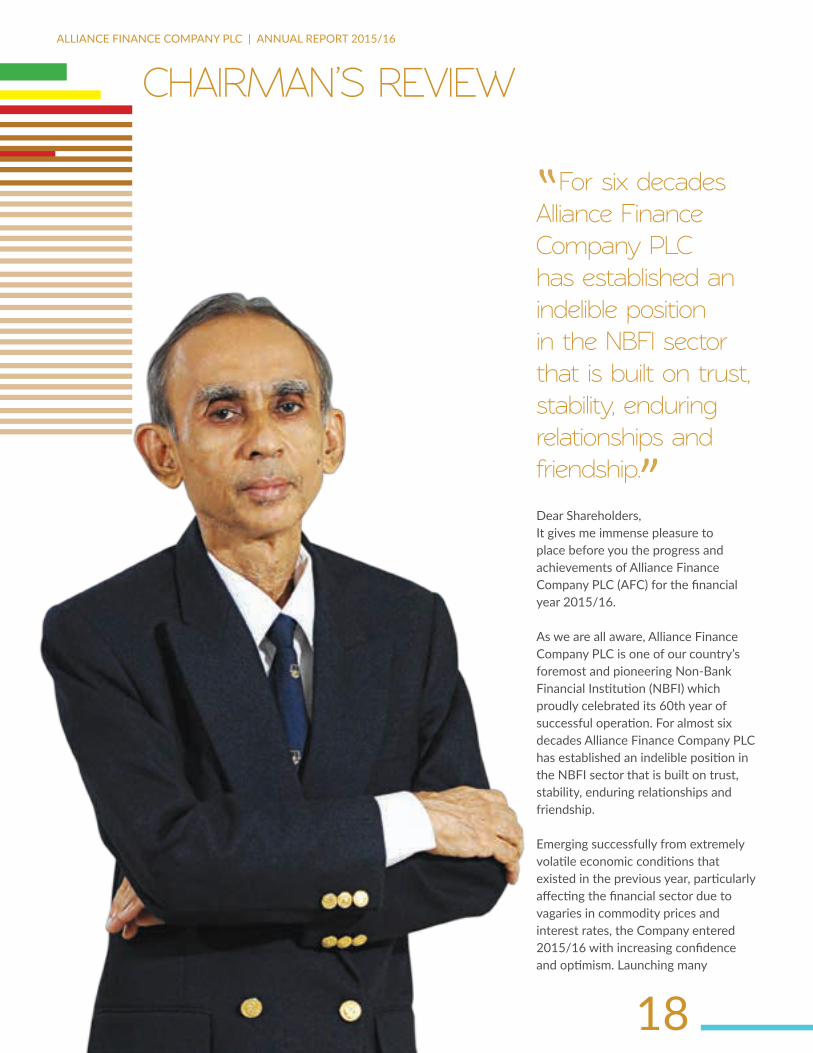
For six decades Alliance Finance Company plC has established an indelible position in the NbFi sector that is built on trust, stability, enduring relationships and friendship.
ChAiRmAN’S REviEw
Dear Shareholders,It gives me immense pleasure to place before you the progress and achievements of Alliance Finance Company PLC (AFC) for the financial year 2015/16.
As we are all aware, Alliance Finance Company PLC is one of our country’s foremost and pioneering Non-Bank Financial Institution (NBFI) which proudly celebrated its 60th year of successful operation. For almost six decades Alliance Finance Company PLC has established an indelible position in the NBFI sector that is built on trust, stability, enduring relationships and friendship.
Emerging successfully from extremely volatile economic conditions that existed in the previous year, particularly affecting the financial sector due to vagaries in commodity prices and interest rates, the Company entered 2015/16 with increasing confidence and optimism. Launching many
19
ALLIANCE FINANCE COMPANY PLC | ANNUAL REPORT 2015/16
The Company has achieved commendable results considering the challenges faced during the year. whilst focusing on major goals which include industry positioning, credit rating and brand value the Company was able to achieve its strategic objectives of profitability, growth and sustainability.
strategic, operational and structural improvements, the Company was able to almost double its profitability during the year under review and will now look for further consolidation in order to sustain progress into the future.
Global EconomyThe global economic environment reflected a mediocre outlook in 2015. Whilst growth in advanced economies has somewhat increased, albeit marginally, the slowdown in emerging markets was noticeable as a result of falling global trade volumes and the uncertainty surrounding the scope and depth of the economic downturn in China.
Overall, global growth recorded around 3.1% during the year 2015 and is projected to remain below 4% in 2016. Emerging markets registered a 4.0% growth, mainly driven by China and India whilst Russia’s negative growth due to the fall in oil prices brought down the overall numbers for these economies.
Sri Lankan Economy2015 was a year of significant change in the Sri Lankan political landscape with the arrival of a new President in January and subsequently a new Government in the second half of the year. As a result of such eventful happenings, the country grappled with the usual challenges faced by a new Government. Although the global economic crisis did affect the local economy to some extent, Sri Lanka managed to escape relatively unscathed, recording single digit inflation and a GDP growth of 4.8% for the year based on the new methodology for measuring GDP introduced during the year.
FinancialInstitutionSectorThe NBFI sector registered increased growth in assets and profitability, together with an expansion of branch and ATM networks. This was fuelled by the acceleration in loans and advances, in consumption activities driven by low interest rates and availability of relatively short-term funding from domestic and foreign sources. NBFIs were able to maintain adequate liquidity despite an increased reliance on short-term funding. Whilst profitability increased during 2015, the capital position remained well above the minimum regulatory requirement. The CBSL continued to introduce new prudent policy measures with a view to enhancing safety and soundness in the NBFI sector.
The introduction of regulations such as vehicle duties and a Loan To Value (LTV) ratio brought forward a new set of challenges to the NBFI sector during the year and companies were compelled to explore other avenues to increase their revenue. The low interest rate regime that was witnessed in the market enabled the sector to record a notable profit and maintain Non-Performing Loans at a manageable level. Further it is reported that credit has grown by 31.8% during the year 2015 compared to the previous year.
The drop in the global market price of gold that was prevalent in 2014/15 continued into 2015/16 resulting in a contraction of the Gold Loans portfolio across the NBFI sector. However, an increase in loans and advances took place in the sectors of construction, infrastructure, trading as well as financial and business services. Meanwhile, with Microfinance emerging

20
ALLIANCE FINANCE COMPANY PLC | ANNUAL REPORT 2015/16
as a key element in driving economic growth amongst rural communities, the NBFI sector is expected to continue to play a key role serving customers at the grass root level of the economy.
Year in ReviewThe Company has achieved commendable results considering the challenges faced during the year. Whilst focusing on major goals which include industry positioning, credit rating and brand value the Company was able to achieve its strategic objectives in profitability, growth and sustainability.
The importance of the Microfinance SBU was further highlighted during the year. Although the SBU remained one of the key drivers and expanded its outreach to 40 branches, in keeping with our balanced approach, the Company focused on maintaining a sustainable growth rather than proceeding with an overly-aggressive approach.
The Company continued its focus on reducing its Gold Loan Portfolio by disposing matured stock during the year and was successful in reducing its Gold Loan exposure to a mere 2%. The setback caused by the dependency on the exposure to Gold loans has duly been mitigated thereby bringing in a more conducive environment for future profitable growth.
AFC’s organizational structure was further strengthened with the appointment of highly-experienced individuals to spearhead development. During the year, we welcomed Mr. Mahinda Gunasekera to the Board as Director Sustainability. Mr. Gunasekera’s vast experience in the fields of SME finance, livelihood
development, Microfinance and agri business will allow us to introduce ground-breaking initiatives and respond positively to external dynamics. He will play a key role in the area of our Microfinance business with his proven experience and expertise in this vital sector. Meanwhile, Mr. Emmanuel Muttupulle, who retired from the Board on reaching the age of 70, continued to function in the capacity of Chief Operating Officer (COO) a vital strength at this juncture in AFC’s growth and development.
Our subsidiary company Alfinco Insurance Brokers registered a year of consistent performance whilst our associate Company Macbertan formed a Joint Venture with PidiLite of India, known to be the largest manufacturer of adhesives in Asia.
FinancialPerformanceThe Profit before Tax of AFC grew 91% YoY, from Rs.277 million to Rs.531 million, during the year under review whilst the Profit After Tax increased from Rs.203 million achieved in 2014/15 to Rs.415 million in the year under review. Total assets increased to Rs. 25,857 million from Rs. 19,910 million in the preceding year.
During the year, total disbursements aggregated to Rs.16,300 million a 56% increase compared to the previous year, due to improved credit demand in a lower interest regime. Both Gross and Net NPL ratios are below industry averages with the gross NPL ratio dropping to 2.46% (Industry –5.7%) and net NPL ratio dropping to 0.71% (Industry –1.6%).
Chairman’s Review Contd.
Future OutlookLooking ahead, your Company will continually strive to bring in results based on its triple bottom line approach. Stable government policies conducive to the development and stability of the industry will be expected from the government which in return will help us in our strategic direction resulting in profitability, growth and sustainability.
AcknowledgementsI would like to take this opportunity to convey my gratitude to the Board of Directors for their guidance and support extended throughout the year. The Deputy Chairman/ Managing Director Mr. Romani de Silva, with his visionary leadership, played a key role in helping the Company perform well during the year and I thank him for his unswerving efforts. I also wish to thank our loyal customers for continuing to trust in AFC and to our shareholders for being an integrated stakeholder group in the Company, even during the toughest of times. Last but not least, I would like to state my appreciation to the committed employees of the AFC family. Without their hard work, determination and pursuit of excellence, we would not have been able to achieve as much as we have and I look forward to working closely with them as we continue on this journey into the future.
Sunil KarunanayakeChairman
31st May, 2016Colombo

21
ALLIANCE FINANCE COMPANY PLC | ANNUAL REPORT 2015/16
mESSAgE FROm ThE SENiOR AdviSOR ANd pAST ChAiRmAN OF AlliANCE FiNANCE COmpANy plCIt is a poignant moment in time when a Company celebrates its Diamond Jubilee. Being an integral part of the Company since its humble beginnings in 1956 and witnessing its rise to the position it enjoys today as a trusted financial services provider, I am honored to share my thoughts on this occasion.
Foremost, is that the Company has achieved this milestone upholding intrinsic time tested values adopted by its founder Directors, Mr. Eardley de Silva, Mr. Fred Perera, Mr. Hayes Jayasundera, Mr. N.M. Appuhami and Mr. Heyward Fernando. Guided by an unwritten business philosophy and a Code of Ethics for which the Company is renowned the Company has steadfastly traveled on a long journey of six decades in an industry that has witnessed turbulent times. This journey bears testimony to the Company’s sustainability and the foresight of its leadership through three generations.
This would have not been possible without the unstinted support and loyalty of our employees who have come on board at varied times and faithfully served the Company. We are extremely grateful to four generations of loyal depositors and hirers who have trusted the Company and become a part of the Alliance Family which was built on the values of trust, friendship and innovation.
Whilst looking at the past and recalling the special moments witnessed along this journey, it is also a time to reflect on the future that lies ahead. I wish the Company and all its stakeholders continued success as it continues to move forward in this new era of challenges and opportunities in post war Sri Lanka.
Pratapkumar de SilvaFormer Chairman
guided by an unwritten business philosophy and a Code of Ethics for which the Company is renowned the Company has steadfastly traveled on a long journey of six decades in an industry that has witnessed turbulent times.

22
ALLIANCE FINANCE COMPANY PLC | ANNUAL REPORT 2015/16
dEpuTy ChAiRmAN/ mANAgiNg diRECTOR’S REviEw
Starting its journey from humble beginnings six decades ago, your Company has steadfastly contributed to the development of our country by faithfully serving four generations of loyal customers from all walks of life.
Dear Shareholders,I consider it a privilege to present to you the Annual Report of a unique Company that has concluded 60 years of successful business operations in Sri Lanka. Starting its journey from humble beginnings six decades ago, your Company has steadfastly contributed to the development of our country by faithfully serving four generations of loyal customers from all walks of life.
Built on a strong foundation of trust and powered by innovation, we have in recent times, formalized our core values which have been handed down through generations into a triple bottom line business philosophy that guides us towards inclusive and sustainable value creation across multiple stakeholder groups.
23
ALLIANCE FINANCE COMPANY PLC | ANNUAL REPORT 2015/16
On reaching our 60th year in business, i am pleased to announce that the profit before Tax of the Company increased from Rs.277 million to Rs.531 million during the year under review, which is a commendable growth of 91%
YearofSignificantChangeThe year 2015 brought forth monumental changes in Sri Lanka with the advent of a new Executive President in January 2015 followed by the installation of a new government in the same year. Despite such dramatic changes in the political landscape, the country progressed reasonably well to record a satisfactory GDP growth of 4.8%. Thus with the ill effects of the 30 year old national conflict well behind us, Sri Lanka is on its way to regaining its position of eminence as the ‘Pearl of the Indian Ocean’.
The Budget for 2016 has focused on promoting construction, facilitating competitive exports and developing tourism, health and education. Many initiatives have also been introduced to drive FDI’s into the country. As the new Government settles into its role of accelerating sustainable development whilst improving good governance, we are hopeful that the initiatives taken will be able to create the necessary infrastructure and bring in the much needed reforms along with consistent and stable policies. We are confident that the current strategies will serve as a catalyst to further increase much needed confidence levels amongst both local and foreign investors.
NBFI SectorDespite many policy changes affecting the industry during the year under review, the NBFI sector was able to perform creditably. Due to increases in duties on vehicles and the introduction of a 70% ceiling in the Loan to Value
(LTV) ratio, most companies in the NBFI sector have gradually commenced migrating towards products such as mortgage loans, business loans and other types of financial products and services. We believe that this is a step in the right direction as it would result in a greater contribution towards the development of the economy and a more diversified and balanced business portfolio for the sector. At Alliance, we are firmly of the view that the LTV ratio is necessary to prevent customers from becoming over-indebted and leading themselves and the country into a debt trap. We are also confident that such healthy measures will help prevent the formation of an asset bubble and will ensure the long-term sustainability of the industry and all its stakeholders in the longer term.
FinancialPerformanceHighlightsIt is against this backdrop that I take pleasure in reviewing the performance of your Company during the financial year 2015/16 and present to you our corporate goals and strategies which will guide us in facing the challenges in the times ahead.
FinancialPerformanceOn reaching our 60th year in business, I am pleased to announce that the Profit Before Tax of the Company increased from Rs.277 million to Rs.531 million during the year under review, which is a commendable growth of 91%, whilst the Profit After Tax more than doubled from Rs.203 million achieved in 2014/15 to Rs.415 million in the reported year. In 2015/16, total disbursements increased by 56%,

24
ALLIANCE FINANCE COMPANY PLC | ANNUAL REPORT 2015/16
deputy Chairman/ managing director’s Review Contd.
from Rs.10,471 million in 2014/15 to Rs.16,300 million, as a result of significant improvements made to our marketing operations.
The Microfinance SBU achieved a growth rate of 29%, from Rs.2,506 million in 2014/15 to Rs.3,244 million this year, which helped maintain this segment at 10% of the overall portfolio, thereby limiting our exposure and risk. With the 56% growth in total disbursements the Company’s total portfolio of advances recorded a growth of 28% as it moved up from Rs.15,424 million in 2014/15 to Rs.19,697 million in 2015/16.
Having successfully disposed most of its non-performing articles during the year, the Company also managed to further reduce the exposure of its aged gold loan portfolio to 2% from 5% recorded in 2014/15. Significant improvements were witnessed in both gross and net NPL ratios during the year mainly due to the disposal of most of the Company’s non-performing assets viz a viz the gold loan assets and the repossessed vehicle stocks. This resulted in a 62% reduction in the absolute NPL value reducing from Rs.1,280 million to Rs. 484 million during the financial year. Both NPL ratios are well below the industry ratio with our gross NPL ratio dropping to 2.46% (Industry – 5.7%) and net NPL ratio moving downwards to 0.71% (Industry – 1.6%).
The total assets increased from Rs.19,910 million in the preceding year to Rs. 25,857 million in the year under review recording a commendable growth of 30%.
The Company secured a BB + rating from Fitch Ratings Lanka Limited and the analysis provided in the Rating Report has been studied in detail by our Senior Management team. Many initiatives are being introduced to improve key drivers which in turn will enhance business performance and result in further improvements to our rating.
FundingAFC recognizes the importance of long term funding and the necessity to constantly address the inherent funding mismatch of the NBFI sector. Many years ago, as a result of this proactive thinking, an Assets and Liability committee was also set up in the Company and many initiatives were commenced to develop and diversify our sources of long term funding.
I am pleased to report that the Company was able to reach an important milestone during the year by obtaining two lines of foreign funding from Commercial Bank PLC- Bangladesh and from the Triodos Bank – Netherlands. The facility from Commercial Bank, Bangladesh was USD 6 million with a tenure of 1 year and the facility from the Triodos Bank was USD 5 million with a tenor of 3 years. The Triodos Bank has been voted as the world’s most sustainable Bank and granting of the facility was a result of
a strategic dialogue that was initiated several years ago. Both facilities were obtained under the relaxed exchange control programme offered through the External Borrowing Scheme introduced by the CBSL.
The Triodos Bank is an organization that invests globally in companies that achieve a best-in-class combination of social, environmental and economic performance. Therefore they follow a comprehensive research and selection process in order to clearly identify whether a company meets all their criteria prior to investing. The fact that Alliance Finance was able to meet such exacting standards speaks volumes of the international standards that we have achieved in terms of our approach to social, environmental and governance aspects.
Though market risk cannot be eliminated, the Treasury Division took calculated steps to manage such risks by changing the profile of the risks that were encountered. The division strives to manage the adverse effects of exchange rate risk arising out of foreign currency transactions in the most cost-efficient manner.
MicrofinanceIn keeping with our sustainability commitments and long term business strategy, we established the Microfinance SBU in 2013. The creation of this SBU has enabled the Company to extend its services to a wider segment of our society. As a socially responsible corporate entity, we consider Microfinance as a means
25
ALLIANCE FINANCE COMPANY PLC | ANNUAL REPORT 2015/16
of making a positive contribution to the lives of thousands of individuals with limited opportunities by affording them an opportunity to uplift their lives by providing access to credit and entrepreneurial skills.
We now have a Microfinance base of 66,455 customers. A majority of them are female entrepreneurs who are catered to by our fast-growing team of 316 Field Officers. The total Microfinance portfolio grew by 28% to register Rs.2.0 billion during the year under review. In keeping with the growth, through a comprehensive Entrepreneur Development Services (EDS) programme, we have also been able to impart financial and technical knowledge, thereby assisting these rural entrepreneurs to grow their businesses to greater heights.
Standing at approximately 10% of our total portfolio the Microfinance SBU has emerged as a significant SBU in the Company structure with a presence in 40 locations. The Company has however decided to focus on consolidating the existing branch network and expand with caution in this segment until a proper regulatory framework is introduced by the Authorities via the Central Bank or through a dedicated Microfinance regulatory body. The Government urgently needs to take steps to regulate NBFIs engaged in Microfinance thereby improving the quality and sustainability of the industry. The industry is suffering due to a multitude of reasons including poaching of employees, excessive competition to grant loans to the same
customer resulting in unsustainable multiple borrowings and the creation of over indebtedness which in turn would lead the customers, the sector and the country into a debt trap. As mentioned earlier we have capped our growth in this sector until we see improvements in the macro fundamentals of the industry. Recommendations and inputs for the setting up of an enabling regulatory framework has been given to the policy makers by the industry association – The FHA. We are hopeful that a practical regulatory framework and directions will be implemented soon in consultation with the industry.
Governance and Risk ManagementAn Enterprise Risk Management Framework was implemented in the previous financial year in order to facilitate robust governance and the effective management of risks. Spearheaded by the Chief Risk Officer, this framework continued to meet the Company’s needs and contributed to maintaining the quality of the portfolio during the year under review. A strong emphasis was also placed on the audit function given the fact that fraudulent activities are on the rise within the industry. We are confident that these proactive measures will help the Company significantly in its efforts to enhance the sustainability of its portfolio.
Standing at approximately 10% of our total portfolio the microfinance Sbu has emerged as a significant Sbu in the Company structure with a presence in 40 locations.

26
ALLIANCE FINANCE COMPANY PLC | ANNUAL REPORT 2015/16
A Greener CompanyAs one of the pioneering financial institutions to embrace the Triple Bottom Line philosophy in Sri Lanka, the Company strives to make a positive impact on the environment at every level. Some of the noteworthy initiatives carried out during the year are given below.
AFC embarked on a research to develop a kit to reduce threewheeler emissions by entering into a joint partnership agreement with Vialle of Netherlands, a leading LPG gas technology specialist in Europe. With the assistance of the Dutch government we will continue to progress in this project in the future.
AFC took part in a ’One Million Trees Project’ by the Rotary Club of Sri Lanka which commenced in the Kurunegala District. Through this project we hope to fulfil our pledge for the “Tree for a Lease” initiative of the Company. As of end February 2016, the Company had contributed to plant 14,000 trees for 13,550 leases given out during that period of the financial year. Validation of the process of this initiative is currently being carried out.
Earth Hour celebrations were carried out with the co-operation of the Colombo Municipal Council. This included an awareness walk and donation of 500 LED bulbs to illuminate the Viharamahadevi Park.
In March 2016, AFC took significant steps to increase its focus on energy conservation by making a pledge under the “AFC Green Pledge” to reduce the energy consumption of the Company by 5% by the end of the 2016/17 financial year.
TechnologicalDevelopmentsWe believe that Information Technology (IT) is a strategic asset in ensuring that each and every employee is enabled to perform at the highest level and deliver service excellence to the customer. As a result, the Company is constantly considering ways to improve the IT infrastructure within the organization. Some of the key initiatives carried out this year include upgrading the Company’s entire IT system with state-of-the-art hardware, commencement of online data replication to the Disaster Recovery (DR) site, establishment of an automated file approval process, utilization of SMS technology for customer communication and initiation of a Mobile Cash pilot project in 15 branches in collaboration with Mobitel.
HumanCapitalGrowthThe Company considers human capital to be one of its most important resources as it plays a key role in navigating AFC towards its vision. By creating a diverse, strong pool of talent, the Company strives to foster its human capital and considers it to be one of its key competitive advantages. Having surpassed the 1,000 employee mark in recent years, we now have 1,203 employees, a figure which was boosted by 340 new recruitments during the year mainly for the Microfinance SBU. The HR Department has placed great significance in ensuring that the Company attracts the right people with the right skills and attitude and providing them with an environment where they can perform, learn, grow and reach their full potential.
As one of the pioneering financial institutions to embrace the Triple bottom line philosophy in Sri lanka, the Company strives to make a positive impact on the environment at every level.
deputy Chairman/ managing director’s Review Contd.

27
ALLIANCE FINANCE COMPANY PLC | ANNUAL REPORT 2015/16
Way ForwardThe Company has mapped out a 3 year strategy outlining the Way Forward and lays emphasis on industry positioning, credit rating and brand value. Accordingly, the objectives and strategies are primarily based on achieving sustainable growth in a volatile environment.
The most vital development for the Company would be the formulation of stable, long-term policies for the industry. This would enable the Company to take calculated risks and make long-term plans. We see opportunities opening up for the SME sector and are in the process of acquiring the requisite skills to upgrade the Company’s expertise in this area even further. Overall, the approach will be one of steady growth as we consolidate our systems and processes on the back of strong growth and lay the necessary foundation to launch a more aggressive approach once definitive macro level policies are implemented hopefully in the not too distant future.
Against the backdrop of a highly competitive market, it is imperative that we constantly focus on ways of improving our existing product offerings whilst also creating new, innovative products to cater to the changing needs of today’s evolving customer. Therefore, we intend to come up with associated derivatives stemming from our core areas of transport and motor-related products.
PerformanceofSubsidiariesandAssociate CompaniesAlfinco Insurance Brokers (Pvt) Ltd
Alfinco Insurance Brokers recorded another year of steady performance. The Company, which acts as the agent and broker for the insurance business generated from the customers of Alliance Finance, played a more active role in order to bring in more business from our customers in addition to the motor business. Looking ahead, we believe that this approach would help to increase revenue from their portfolio. Considering the structural change within the Company during the last financial year the operations were consolidated and the internal processes strengthened positioning the Company to aggressively engage in marketing. The Company made a profit before tax of Rs. 23.3 million.
Macbertan (Pvt) Ltd
Our associate company Macbertan (Pvt) Ltd performed very well during the year. Macbertan formed a Joint Venture with Pidilite International PLC of India, known to be the largest manufacturer of adhesives in Asia. Macbertan has been the Distributor for Pidilite products in Sri Lanka over a long period and this JV was a natural progression of our partnership and underscored the trust placed on us by this giant in the adhesive industry. Under this newly-formed company, a new manufacturing plant will be setup in Sri Lanka. During the year under review, the product offering of Macbertan expanded providing customers with a wider choice of selection in the face of intense competition in the
core business of the Company. The extensive dealer network is being utilised to provide the hardware sector with complementary products. We have also setup a new production plant for a roofing product.
It is a considerable feat that the Company was able to increase its profitability from Rs. 30 million to Rs. 36 million in the face of intense competition. The success and the performance of the Company was made possible due to the excellent product mix and we are confident that given the current market potential and the diversified portfolio the profits of the Company should continue to rise sustainably.
AcknowledgementsOn this momentous occasion of the 60th anniversary of the Company, I would like to extent our deep appreciation to our Senior Advisor and former Chairman, Mr. Pratapkumar de Silva for completing six decades of association with our Company and the Finance Industry of Sri Lanka.
Over a period of six decades he has been instrumental in inculcating many of the time tested values in the Company which we continue to uphold. Inspired by the concept of “small is beautiful”, approximately 30 years ago, during his period of leadership as the Chairman and the Managing Director, he pioneered the concept of financial inclusion in the industry by providing credit to the marginalized segments of our society to purchase three-wheelers thus creating significant numbers of

28
ALLIANCE FINANCE COMPANY PLC | ANNUAL REPORT 2015/16
On our 60th anniversary it is my privilege to also place on record our sincere appreciation to the founding Chairman – late mr. Eardley de Silva and founding board members, late messrs, Fred perera, hayes Jayasundera, N.m. Appuhami and heyward Fernando. Their foresight, pioneering spirit and hard work paved the way for Alliance to reach the position of strength it enjoys in the industry today.
self-employment opportunities. This unique product has become a major source of revenue for the Company and continues to contribute significantly to our bottom line up to now. This successful strategy which was a result of his foresight also opened up many more lucrative financing opportunities which have since added much value to the Company and its smaller customers, whilst creating financial inclusion in Sri Lanka.
His association with the industry which also spans a period of 60 years saw him also serve on the Board of the Credit Information Bureau of Sri Lanka for a record period of 25 years as the nominee Director of the FHA and also as the Chairman of the FHA initially from 1970 to 1972 and again from 1988 to 1991. His continued advice and contributions are deeply appreciated and valued by me and the members of the Board. We wish him many more years of successful association with the Company as its Senior Advisor.
On our 60th anniversary it is my privilege to also place on record our sincere appreciation to the founding Chairman – late Mr. Eardley de Silva and founding Board members, late messrs, Fred Perera, Hayes Jayasundera, N.M. Appuhami and Mr. Heyward Fernando. Their foresight, pioneering spirit and hard work paved the way for Alliance to reach the position of strength it enjoys in the industry today. I would also like to place on record my appreciation to the successive Boards of Directors who played an important role in the progress of the Company.
As yet another financial year has drawn to a close, I would like to convey my sincere appreciation to the present Chairman Mr. Sunil Karunanayake and the Board of Directors of the Company for their continued support and astute guidance. I would also like to congratulate Mr. Karunanayake on being awarded the “Professional Excellence Award 2015” by the Institute of Certified Management Accountants of Sri Lanka (CMA) in recognition of his outstanding leadership capabilities.
I also wish to thank Mr. Emmanuel Muttupulle for his indelible contribution to the Company during his brief tenure on our Board. He joined the Board during the last financial year to serve in the capacity of Executive Director – Operations and retired on reaching the age of 70 years. However, the Company is fortunate to retain his services in the capacity of Chief Operating Officer (COO) where his vast knowledge and unparalleled experience in the field of finance will undoubtedly be an asset to me and my colleagues on the Board.
I would like to take this opportunity to also welcome Mr. Mahinda Gunasekera who joined the Board as Director Sustainability. Mr. Gunasekera holds a MBA, BSc in Agriculture and has undergone Microfinance Training from the University of Colorado, USA. He has spent the past three decades working in the fields of SME finance, livelihood development, Microfinance and agribusiness within Asia in countries such as Sri Lanka, Afghanistan, Bangladesh and Nepal. Further details on his extensive profile can be found in
deputy Chairman/ managing director’s Review Contd.

29
ALLIANCE FINANCE COMPANY PLC | ANNUAL REPORT 2015/16
the “Board of Directors” section of this Annual Report. His core strengths in SME Microfinance and Agriculture will be of great value to our Board as we prepare to take the Company forward in an era of SME and Agro based financial inclusion.
In recognition of his contribution to the marketing activities of the core business lines, Dr. Ajith Medis was invited to join the Board in August 2016. We recognize with gratitude his efforts in growing the portfolio with better credit quality whilst improving the processes for efficient delivery of our product offerings. Dr. Medis holds a doctorate in Strategy, MBA, BCom (Special), a Diploma in Marketing (CIM UK) and he is also a certified Management Accountant. He is also attached to the academia of the University of Kelaniya. Further details on his profile can be found in the “Board of Directors” section of this Annual Report. We are confident that he will drive marketing to achieve impressive bottom line results for the Company.
I would also like to convey my gratitude to the Governor, Directors and officials of the Central Bank of Sri Lanka for their valuable guidance and continual interactions. As in previous years, the CBSL annual audits carried out by teams of experienced professionals have contributed significantly to strengthen many aspects of the Company’s operations, improve efficiencies as well as compliance capabilities. A big “thank you” goes
out to them for their commitment in the greater interest of all stakeholder groups.
At this juncture, I wish to express my deep appreciation to the Alliance Family of employees for all their hard work and dedication throughout the year without which this commendable performance would not have been possible. My sincere thanks to our loyal depositors who have remained with us for four generations. I thank our ever-expanding base of customers for their continued patronage as well as all our shareholders for the trust placed in the Company.
It is clear that we are heading into another challenging year where the Company will be tested on many fronts. I am confident that our performance during this financial year will provide the perfect platform for us to aim for even greater heights during the years ahead as we strive to become one of Sri Lanka’s most respected and sustainable NBFIs.
Romani de SilvaDeputy Chairman/ Managing Director
31st May, 2016Colombo

30
ALLIANCE FINANCE COMPANY PLC | ANNUAL REPORT 2015/16
it’s not just our stakeholders, we believe in the perfect balance between people, the planet and the profit that we generate and we continue to follow through on sustainable methods which will take us to the future and beyond

31
ALLIANCE FINANCE COMPANY PLC | ANNUAL REPORT 2015/16

32
ALLIANCE FINANCE COMPANY PLC | ANNUAL REPORT 2015/16
mANAgEmENT diSCuSSiON & ANAlySiS
AFCSustainabilityApproachAs a Triple Bottom Line company, AFC operates with continuous and significant emphasis on economic, social and environmental sustainability on which the sustainability of the Company depends on. The core values of AFC is about managing and contributing towards the sustainability of these components mainly via creating and distributing economic value, serving our people and conserving nature. The entire business structure and the strategy is developed in line with the Triple Bottom Line philosophy, so that the core values are preserved and the role of the Company on ensuring economic, environmental and social sustainability continues.
ThestrategictriplebottomlineapproachofAFC
Profitability
Sustainability
Growth
People
Social sustainability related practices to ensure deriving a
material outcome.
Planet
Profit
Sustainability initiatives integrated with all business
operations.
AFC Strategy

33
ALLIANCE FINANCE COMPANY PLC | ANNUAL REPORT 2015/16
StakeholderEngagementApproachOurMajorStakeholders
Customers
Shareholders
Management
Employees
Regulators/ Government/
Rating agenciesAgents/ Dealers/ Value
chain connectors
Business Partners and
Suppliers
Subsidiaries/Associations
Depositors and Investors
General Public/
Communities/Well-wishers/
Media/Professional
bodies
Alliance Finance Company PLC
StakeholderMapping:Interest-PowerMatrix
Government/Regulatory Bodies/RatingAgencies
ShareholdersManagement
Depositors and investorsEmployees
Customers(Credit)
Dealers/Agents/ Valuechainconnectors
Interest
Influence/Power
GeneralPublic/Communities/Well
Wishers/Media/ProfessionalBodies
Subsidiaries/AssociationsBusiness Partners and Suppliers
Low
High
High
Low

34
ALLIANCE FINANCE COMPANY PLC | ANNUAL REPORT 2015/16
StakeholderEngagementProcess
y Meetings y Direct dialogue y Questionnaire
surveys y CRM system y Annual Report y Quarterly
financial statements y Field audits y Newsletters y Company
website y CSE website y Press releases y Social media y Company hotline y E-mail and other
correspondence
y Meetings y Direct dialogue y Questionnaire
surveys y CRM system y Field audits y Social media y Company hotline y E-mail and other
correspondence
InformtheBoardandtheManagementonthepriorities
Takeactionstorectify/address/adopttheissues/concerns/suggestions
Analysisofthefeedbackreceived
Identifysuggestions,issues/concerns
Prioritizeissues/concerns,needs,responses
StakeholderCommunication StakeholderFeedback
management discussion & Analysis Contd.
1. strategic gap analysis
Performed via direct interviews with the key Senior Managers. The content was refined with the feedback from the CXOs and the Directors.
2. Stakeholder feedback
A questionnaire survey was performed for major stakeholders namely, the employees, customers (loan, deposit and Microfinance) and suppliers.
Additional information was obtained from the recent customer satisfaction surveys, feedback received during meetings and direct dialogue with customers and employees.
Based on the results of the Strategic Gap Analysis, the aspects which require immediate responses have been identified and the necessary course of action has been planned and implemented where possible to address the prioritized issues. In addition to that, minor issues and issues that can be addressed over a period of time have also been identified. The action to be taken for such issues have been discussed and reviewed. The strategic gap analysis will be performed every quarter to identify the major opportunities and risks pertaining to the Company.
Stakeholder assessment is an ongoing process in the Company, where the findings are being incorporated into the regular decision making and to plan the long-term approaches that will be aligned to the Company’s Strategic Plan. In addition to the regular assessments, regular stakeholder feedback surveys also will be conducted to re-affirm the policy changes and course of action taken to address the issues in a systematic manner. The engagement actions also will be carried out with continuous refinement to obtain precise feedback, maintaining highest level of transparency and quality of information to ensure the process of engagement to be fortified further.
35
ALLIANCE FINANCE COMPANY PLC | ANNUAL REPORT 2015/16
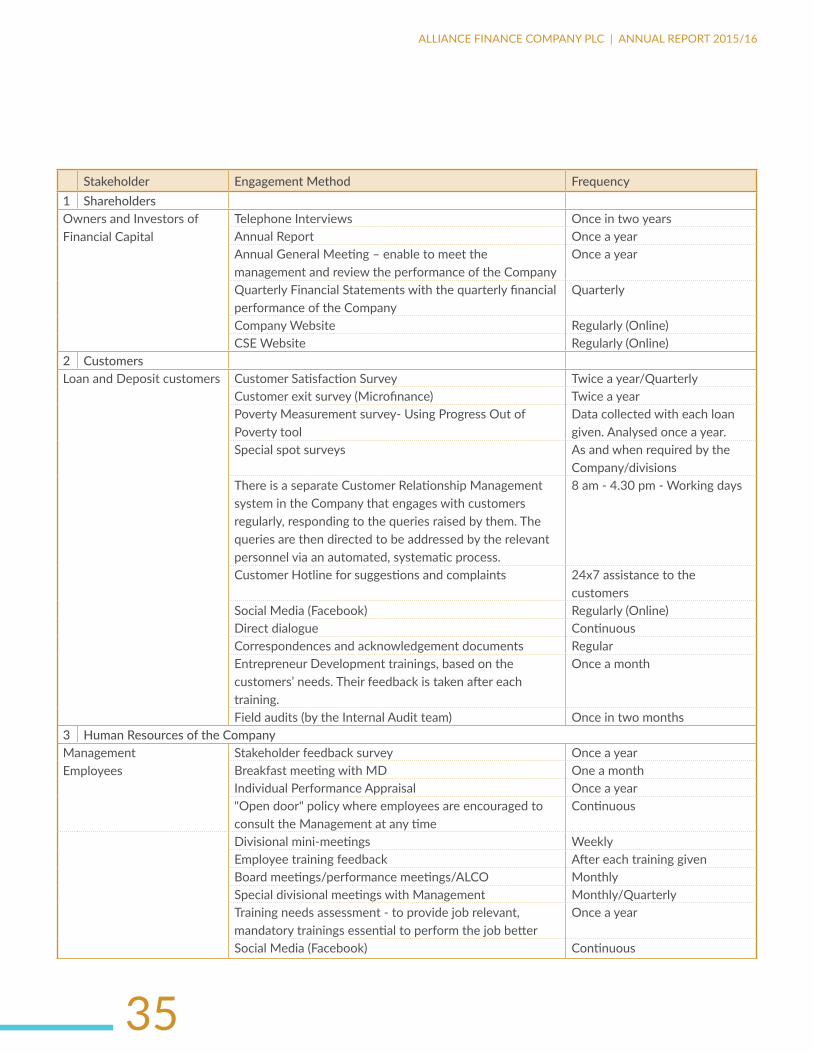
Stakeholder engagement Method Frequency1 shareholdersOwners and Investors of Financial Capital
Telephone Interviews Once in two yearsAnnual Report Once a yearAnnual General Meeting – enable to meet the management and review the performance of the Company
Once a year
Quarterly Financial Statements with the quarterly financial performance of the Company
Quarterly
Company Website Regularly (Online)CSE Website Regularly (Online)
2 CustomersLoan and Deposit customers Customer Satisfaction Survey Twice a year/Quarterly
Customer exit survey (Microfinance) Twice a yearPoverty Measurement survey- Using Progress Out of Poverty tool
Data collected with each loan given. Analysed once a year.
Special spot surveys As and when required by the Company/divisions
There is a separate Customer Relationship Management system in the Company that engages with customers regularly, responding to the queries raised by them. The queries are then directed to be addressed by the relevant personnel via an automated, systematic process.
8 am - 4.30 pm - Working days
Customer Hotline for suggestions and complaints 24x7 assistance to the customers
Social Media (Facebook) Regularly (Online)Direct dialogue ContinuousCorrespondences and acknowledgement documents Regular Entrepreneur Development trainings, based on the customers’ needs. Their feedback is taken after each training.
Once a month
Field audits (by the Internal Audit team) Once in two months3 Human resources of the Company Management Employees
Stakeholder feedback survey Once a yearBreakfast meeting with MD One a monthIndividual Performance Appraisal Once a year"Open door" policy where employees are encouraged to consult the Management at any time
Continuous
Divisional mini-meetings WeeklyEmployee training feedback After each training givenBoard meetings/performance meetings/ALCO MonthlySpecial divisional meetings with Management Monthly/Quarterly Training needs assessment - to provide job relevant, mandatory trainings essential to perform the job better
Once a year
Social Media (Facebook) Continuous

36
ALLIANCE FINANCE COMPANY PLC | ANNUAL REPORT 2015/16
Stakeholder engagement Method Frequency
4 agents/dealers/value chain connectors
Stakeholder feedback survey Once a year
The Customer Relationship Management system of the Company has a separate portal for the agents/dealers as well. The process of the dealer management is done via an automated system. Apart from above the CRM unit is available for additional assistance when needed.
Continuous
Dealer/agent point visits by branch staff Monthly
Dealer/agent point spot visits by Head Office staff Twice a year
5 Business Partners and Suppliers
Direct dialogue Regularly
Service quality surveys Once a year
Stakeholder feedback survey Once a year
Negotiation and problem solving dialogue As and when required
6 Regulatory bodies/government (Central Bank)
Regulators/Government Annual Review Once a year, full one month extensive engagement
Annual Review follow up meetings Once a year
Special meetings for regulatory clarifications and business needs
On a need basis
Periodic compliance reports Monthly/Quarterly
CSE website Regularly (Online)
Rating agencies Meetings On a need basis
7 General Public/Communities/ Media/Professional bodies/Well-wishers
Written/direct dialogue Continuous
Company hotline 24x7 assistance
Company website Continuous
Social Media (Facebook) Continuous
CSR initiatives Continuous
Press releases On a need basis
Subsidiaries or Associates Meetings Periodically
Collective activities conducted Annually
Company Website Continuous
Newsletters Once a year
management discussion & Analysis Contd.

37
ALLIANCE FINANCE COMPANY PLC | ANNUAL REPORT 2015/16
OurResponsestotheIdentifiedStakeholderExpectations DuringtheYear2015/16Stakeholder group Stakeholder expectations our response
Shareholders
Further improve the Company performance balancing with the Triple bottom line concept
The new three year strategic plan of the Company was prepared during the reporting year with goals, strategies and targets encompassing the triple bottom line concept of the Company
Continuous monitoring and improvement of the triple bottom line initiatives are ongoing The Company was able to achieve notable improvements in all aspects during the reporting year that are reported in detail in financial review (Pages 48-53), Social and Environmental Review (Pages 65-84) section in this report.
Increase the brand awareness and brand value of the Company
A number of initiatives had been undertaken on this and the details are reported under Customer and Product responsibility section in pages 72-73 in this report.
Cust
omer
s
Expand the accessibility via increased points of presence
Points of presence of both Core business and Microfinance has been increased. The details are in Branch Network section in pages 96-100 in this report.
Improve customer communication and feedback
There is a system in place for this in the Company. The customer feedback and complaint handling process is ongoing successfully. More details on this are in pages 69-70 of this report.
Offer transaction/process flexibility with improved facilities
Sri Lanka Inter-Bank payment system has been introduced to the customers during the reporting year.
M-cash facility was introduced for instalment payments for the Microfinance customers. More details on this are in page 92 of this report.
Introduce new products Company introduced six new products during the reporting year. More details on this are in Customer and product responsibility section in the pages 69-73 in this report.
Empl
oyee
s
Provide essential and relevant trainings
43 training programs were conducted for the staff based on their training needs identified via personal questionnaire survey. More details on this are in Human Capital section in the pages 78-79 in his report.
Provide new opportunities to develop the skills and job knowledge
The staff members were engaged in more trainings on soft skills development, afforded internal transfer opportunities, assigned special projects on marketing, energy and paper saving initiatives during the year. These will be continued in the future.
Adopt bottom to top approach in relevant planning processes
This was adopted in the preparation of the Company Strategic Plan and Operational Planning for the business units. This practice will continue in the future as well.

38
ALLIANCE FINANCE COMPANY PLC | ANNUAL REPORT 2015/16
Stakeholder group Stakeholder expectations our response
Agen
ts/d
eale
rs/
Valuechain
conn
ecto
rs
Improved efficiency and speed of processes and approvals of the related processes
CRM system facilitates these needs and it was further systematized in the reporting period. Other process improvements will be undertaken and the actions are ongoing to address them.
Attractive and speedy payment process
The actions are ongoing to address this and the process improvements will be addressed.
Busin
ess p
artn
ers a
nd
supp
liers
Complementary relationship management
This has been a regular practice and will be continued with further improvements in accountability, negotiation and loyalty.
Improved process efficiency This is an ongoing process and will be continued.
Increased emphasis on environmental and social sustainability/welfare
Many initiatives have been undertaken to generate both short term and long term safeguards to the environment as well as to the society. Further details are in the Social and Environmental Review in pages 65-84 The strategic actions for these areas are detailed in the new strategic plan of the Company for implementation in the near future.
GeneralPublic/Communities/
Media/ProfessionalBodies/Well
wishers
Improved brand awareness This has been addressed in various ways. The actions taken and future aspirations are reported under Customer and Product responsibility section in pages 69-73 in this report.
New products designed for different potential customer segments
The details on this are in Customer and product responsibility section in the pages 69-73 in this report.
Increase awareness on products and services
Promotional campaigns, Newspapers advertisements, Website and Social Media are used extensively to educate and increase awareness of the general public.
Supporting community welfare activities/Sponsorships
Many CSR activities have been conducted during the reporting year. More details on this are in Our Social Footprint section (pages 65-68) in this report.
management discussion & Analysis Contd.

39
ALLIANCE FINANCE COMPANY PLC | ANNUAL REPORT 2015/16
Materiality assessment / Materiality MatrixMateriality Assessment is about identifying the most important aspects relevant to AFC and its stakeholders. This assessment is carried out based on the most material aspects for the business and the stakeholders in terms of the economic, social and environmental aspects, as well as the magnitude of impact each aspects has on the business.
During this assessment process, the Company identified certain relevant topics and their impact on the entire organisation’s products, services, activities and relationships, irrespective of whether they occur internally or externally. The assessment was carried out by analysing the internal and external spheres of the business
in the current industry context as well as the aspect boundaries of the Company in order to identify the most crucial issues. Senior management was actively involved in analysing the level of materiality of the identified issues to stakeholders and the business. Additionally, the stakeholder assessments conducted during the year provided further insights into understanding and establishing the impact on the stakeholders in a more comprehensive manner.
The assessment helped AFC identify, understand and prioritize the most important economic, social and environmental aspects of the business and the stakeholders in order to improve the focus of the business. It also helped to reveal the different strategies the Company should undertake and to outline possible
changes to current strategies, so that they will be adapted to improve the Company’s responses and strategies for sustainability.
The identified aspects and boundaries were prioritised based on the level of significance of their economic, environmental and social impacts on the Company. The subsequent ranking is strictly determined based on its significance both to the stakeholders and to AFC’s economic, environmental and social sustainability.
This is the first time that AFC has undertaken a materiality assessment, and the Company wishes to continue the assessment in order to monitor the changes and emerging priorities that will enable the Company to better plan and manage the sustainable strategies.
1. Economic performance2. Market Presence3. Indirect economic impacts4. Energy5. Emissions6. Products and services7. Compliance8. Employment9. Labour/Management relations
10. Occupational health and safety11. Training and education12. Diversity and equal opportunity13. Labour practices grievance mechanisms14. Non- discrimination15. Freedom of association and collective
bargaining16. Forced or compulsory labour17. Human rights grievance mechanisms
18. Local communities19. Anti-corruption20. Anti-competitive behaviour21. Grievance mechanisms for impacts on
society22. Product and service labelling23. Marketing Communication24. Customer privacy25. Compliance
8
43 7
19 10 14
51 9 11
18 21 22 23 24
12
62 13
2015 25
16 17
EconomicEnvironmentSocial
High
High
Medium
Medium
Low
Low
Influenceonstakeholderassessmentanddecisions
TheMaterialityMatrix
SignificanceofimpactonAFC

40
ALLIANCE FINANCE COMPANY PLC | ANNUAL REPORT 2015/16
management discussion & Analysis Contd.
TheMaterialityAssessmentTable
StakeholdersMateriality (High/Medium/Low)
aspe
ct b
ound
ary
repo
rted
Cate
gory
aspe
cts
aFC
shar
ehol
ders
empl
oyee
s
Cust
omer
s
regu
lator
s
supp
liers
Busin
ess p
artn
ers
socie
ty an
d en
viro
nmen
t
Sign
ifica
nce
of
impa
ct o
n aF
C
Influ
ence
on
stak
ehol
der
asse
ssm
ent a
nd
decis
ions
Economic
1 Economic performance • • • • • • • H H Internal/External Yes
2 Market Presence • • • M L Internal Yes
3 Indirect economic impact • • • • • M M External Yes
Environmental
4 Energy • • M M Internal/External Yes
5 Emissions • • • • • H H External Yes
6 Products and services • • M L External Yes
7 Compliance • • • • M M Internal/External Yes
Social- Labour practices and decent work
8 Employment • • • • • H M Internal Yes
9 Labour/Management relations • • • • H H Internal Yes
10 Occupational health and safety • • • M M Internal Yes
11 Training and education • • • H H Internal/External Yes
12 Diversity and equal opportunity • • • H H Internal Yes
13 Labour practices grievance mechanisms • • • • M L Internal Yes
Social- Human rights
14 Non- discrimination • • M M Internal/External Yes
15 Freedom of association and collective bargaining • • M L Internal/
External Yes
16 Forced or compulsory labour • L L Internal/External Yes
17 Human rights grievance mechanisms • L L Internal/
External Yes
Social- Society
18 Local communities • • • • • H H External Yes
19 Anti-corruption • • • • M M Internal Yes
20 Anti-competitive behaviour • • • • M L Internal Yes
21 Grievance mechanisms for impact on society • • • • • H H External Yes
Social- Product responsibility
22 Product and service labelling • • • • H H External Yes
23 Marketing Communication • • • • • H H External Yes
24 Customer privacy • • • • • H H Internal/External Yes
25 Compliance • • • M L Internal/External Yes

41
ALLIANCE FINANCE COMPANY PLC | ANNUAL REPORT 2015/16
SupplyChainManagementTheAFCSupplyChainThe suppliers are an integral part of the business since the operations are heavily dependent upon their service provision to meet the expected quality and time lines. The supplier base of AFC mainly comprises of business partners, suppliers and service providers who provide financial support, material supplies, manpower and other services, thereby ensuring the smooth provision of our financial solutions to the final customer.
These business partners, service providers and suppliers play a key role in the customer value creation process of the Company through its value chain. Therefore, AFC considers it a highly important task to manage its supply chain well. The Supply Chain management process of AFC has three main areas; supplier selection, supplier management and supplier engagement.
AFC FinancialSolutions Customers
AFC supplier base
Locationoforigin
Localandforeign Local Local Localandforeign
Material/physicalassets suppliers Service Providers Manpower suppliers Othersuppliers
• Vehicle suppliers - Agents and importers
• Stationery suppliers
• Office furniture and fittings providers
• ICT service providers-Equipment, software, maintenance
• Utility Suppliers - Water, Electricity, Postal service
• Support service providers - Auditors, dealers, seizers, valuers, contractors, subsidiaries
• Food and Beverage suppliers - Events and occasions
• Advertising and media - Printers, designing agencies, website developers, journalists, newspaper agencies
• Transport and courier services - Office equipment transporters, couriers
• Manpower suppliers - consultants, security services, trainers, outsourced sundry workers
• Staff welfare service suppliers – Daily refreshment services, cleaning and janitorial services
• Financial suppliers-Banks, financial companies
• Office space providers - Landlords, renting agencies
• Maintenance and premises management - Waste management services, florists

42
ALLIANCE FINANCE COMPANY PLC | ANNUAL REPORT 2015/16
SupplierSelectionThe key criteria for supplier selection prior to procurement:
• Credibility • Experience of working with AFC• Ethical and responsible business
practices • Quality of service and timeliness• Added support provided during the
contract period• Cost
AFC, as a Triple Bottom Line-oriented company, seeks to work with like-minded suppliers and promote social business as well. Accordingly, AFC also provides opportunities for Micro and SME level service providers to link with AFC to promote and sell their products and render their services during special occasions.
Supplier Management AFC keeps in constant dialogue and provide feedback to its suppliers during the period of contract to ensure the expected service is gained with the desired quality and within the time period. The key aspects of supplier management are as follows.
• Prioritization of the supplier pool based on the selection criteria
• Provide clear instructions, guidelines or specifications on the required service
• Negotiation on cost, quality and deadlines
• Regular follow up and reminders • Ensure timely advances and
payments • Provide feedback during and after
the service
Supplier Engagement Throughout the period of contract with the suppliers the engagement is done in many modes. The objective of this process is to create a platform for both parties to understand each other better for efficient service exchange. The main modes used for engagement are;
• Structured open ended questionnaire - As a part of stakeholder assessment • Meetings • Site visits• Supplier events
Each year with the changing business needs and new developments, AFC joins hands with new business partners, service providers and suppliers. During this financial year several new parties joined the AFC supplier base from both local and foreign locations.
supplier category Location of origin
Funding partners Foreign/ Local
Vehicle suppliers Local
Advertising and media Local
Green financing business partners Foreign
The year was a significant period for the commencement of many sustainability related initiatives and establishing partners concerning the same. One of the new business partners of AFC included the Triodos Bank of Netherlands, whose main focus is on ethical and sustainable investments for social and environmental sustainability. AFC considers this as a significant union of two like-minded partners with mutual interest moving towards the sustainability mission of both companies.
The other partner is Vialle Alternative Fuel Systems B.V., another Netherlands-based alternative fuel technology company specializing in auto gas equipment. Vialle will be working closely with AFC to introduce alternative fuel technology to three-wheelers, to reduce running costs and environmentally-friendly.
During the period under review, AFC made no dealings with any supplier, business partner or service provider who had any allegation of human rights violations, usage of child labour, forced labour or any such unethical practice to the best knowledge of the Company.
management discussion & Analysis Contd.
43
ALLIANCE FINANCE COMPANY PLC | ANNUAL REPORT 2015/16
ReviewontheEconomic EnvironmentGlobal Economy Global economic growth slowed down to 2.4%, falling short of growth expectations during the year 2015. This was primarily caused by a continued deceleration of economic activity in emerging and developing economies fuelled by weakening commodity prices, global trade, and capital flows. However, the global economy is expected to bounce back, albeit marginally, by reaching the expected growth level of 2.9% in 2016. The anticipated growth rate would be supported by modest recovery in advanced economies and stabilization of activities amongst major commodity exporters despite substantial downside risks.
The US economy matched the global economic expansion by growing at a rate of 2.4% during the same period. This modest growth played a part in reducing the downturn in the country’s labour market and strengthened household and corporate finances. However, the economic powerhouse has not been immune to the negative shocks that have originated from global economic and financial market stress. Signs of weakness at the beginning of the year were concentrated in specific industrial sectors - manufacturing and those related to energy and mining - and in the external sector.
South Asia witnessed a more robust economic growth in comparison to the
lacklustre global performance, recording 7% for the year 2015. The region had a relatively low trade exposure to the gloomy economic climate experienced in emerging markets and benefited from the lower global energy prices as the region is known to be a net importer of oil. South Asia is expected to be a bright spot in the global economy in 2016 with a growth rate forecast of 7.3%. It is anticipated that India, the dominant economy in the region, will lead this upward trend with a projected growth rate of 7.8% for the year.
Meanwhile, the Europe and Central Asia region was slightly worse off than the global average recording an economic growth of 2.1%, a figure which is predicted to reach 3% in 2016. The dramatic drop in oil prices dampened the growth in Russian Federation’s economies. Middle East and North Africa region registered a growth rate of 2.5% during the year 2015. The region was also badly effected by the drop in world oil prices, whilst religious conflicts and prolonging of sanctions on the region’s major oil exporter – the Islamic Republic of Iran – also played their part in limiting economic growth. The growth rate is expected to reach 5.1% in 2016 mainly driven by expected suspension or removal of economic sanctions against Iran, thereby bringing an air of stability to the global oil prices. However, the region’s growth is at serious risks as the threat of an escalation of religious conflicts loom, whilst failure to improve living conditions could spark large-scale social unrest.
Sri Lankan EconomyThe Sri Lankan economy performed reasonably well by growing at a rate of 4.8% during the year 2015, a marginal drop from 4.9% (revised) recorded in 2014. Growth was hampered, especially during the first half of the year, due to the political instability and uncertain economic climate that prevailed in the island. Agriculture Sector contributed a growth of 5.5% and the Industry Sector recorded 3% whilst the Services Sector contributed 5.3%. The Industry Sector figure declined from last year whilst the other two sectors reported positive growth rates.
A slowdown in the growth of demand in Sri Lanka’s traditional export markets adversely impacted the growth of the export sector. Short-term capital outflows were experienced mainly due to the strengthening of the US economy. However, this effect was slightly negated by the lower international commodity prices.
By the year end 2015, the year-on-year headline inflation was recorded at 2.8% compared to 2.1% at the end of 2014. The core inflation grew from 0.8% in the beginning of the year up to 4.5% at the end of the year. Key drivers of inflation were the growth in credit extended to the private sector by banks and increased wages of the Government employees and employees of other sectors. Substantial gains on lower oil prices and the continued positive trend in Tourism Sector was negated by the slowing down in foreign worker remittances, decreasing net foreign inflows and capital outflows leading to a deficit in Balance of

44
ALLIANCE FINANCE COMPANY PLC | ANNUAL REPORT 2015/16
management discussion & Analysis Contd.
Payments (BOP). Efforts to reverse the downward trend in Government tax and non-tax revenues were moderately successful, but due to increase in the budgeted expenditure of the Government resulted in a deficit growth of 7.4% of GDP, as against the targeted deficit of 4.4%.
In addressing the adverse implications of growing demand pressure on the BOP, the Central Bank took early remedial action by imparting greater flexibility in the management of the exchange rate, enforcing the new macro prudential regulation of Loan-to-Value (LTV) ratio as a selective demand management instrument and tightening monetary policy by increasing the Statutory Reserve Requirement (SRR) and also later increasing the Central Bank’s policy interest rates.
NBFI Sector The NBFI Sector turned in a robust performance during the year 2015 showing expansion in business volume and outreach whilst highlighting the extended economic activities, appropriateness of policy initiatives and supportive regulatory and supervisory measures in place. By end 2015, this sector is made up of 46 LFCs and 7 SLCs boasts of a total network of 1,216 branches with emphasis placed on branches located outside the Western Province as shown by the 1:2 ratio (394 branches in Western Province vs 822 branches outside).
During 2015, Total Assets in the NBFI sector grew by 22.3% (Rs.181.6 billion) in comparison to the 19% growth (Rs.130 billion) growth in 2014. This was supported by a 44.6% (Rs.96.9 billion) increase in borrowings and a 16.1% (Rs.66.5 billion) increase in deposits. Throughout 2015, the sector witnessed a strong demand for credit on vehicle leasing and other secured loans. Loans and advances grew by 31.8% (Rs. 192.1 billion) to reach Rs. 795.8 billion at the end of the year, compared to a growth of 15.8% (Rs. 82.4 billion) during 2014. The investment portfolio, comprising investment in equities, capital market debt instruments, government securities and investment properties, recorded a negative growth of 9.2% in 2015 compared to 111.9% growth recorded in 2014.
During 2015, the NBFI sector registered a marginal increase in Profit After Tax of Rs.15.2 billion compared to the Rs.14.8 billion achieved in 2014. Although there were definite improvements in terms of the core business operations, a significant increase in operational costs dampened the profit margins across the sector. Higher yields in Microfinance and Finance Leasing resulted in the credit portfolio receiving a boost as the net income rose by 32% to Rs.82 billion. Meanwhile the profitability indicators of the sector - ROA and ROE - marginally decreased to 3% and 12.3%, respectively, in 2015 from 3.1% and 14.0% in 2014.
looking ahead to the rest of the year 2016, AFC is looking forward to a period of political stability as the new government takes on the challenge of bringing about accelerated economic growth. AFC is also hopeful that the microfinance Act, which will bring some much-needed regulations to the operations of the microfinance institutions (mFis) in the country, will be implemented during the year.
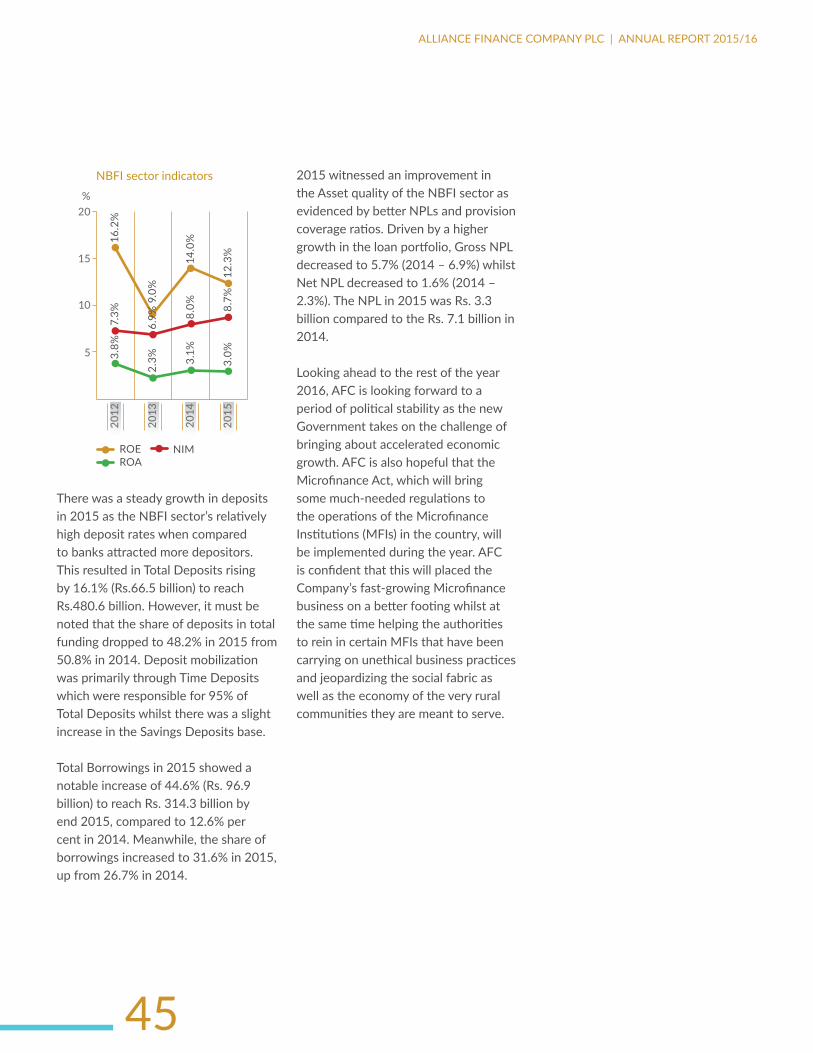
45
ALLIANCE FINANCE COMPANY PLC | ANNUAL REPORT 2015/16
5
10
15
20%
2012
2013
2014
2015
3.8%
7.3%
16.2
%
2.3% 3.
1%8.
0%14
.0%
3.0%
8.7%
12.3
%
NBFI sector indicators
ROEROA
NIM
6.9%
9.0%
There was a steady growth in deposits in 2015 as the NBFI sector’s relatively high deposit rates when compared to banks attracted more depositors. This resulted in Total Deposits rising by 16.1% (Rs.66.5 billion) to reach Rs.480.6 billion. However, it must be noted that the share of deposits in total funding dropped to 48.2% in 2015 from 50.8% in 2014. Deposit mobilization was primarily through Time Deposits which were responsible for 95% of Total Deposits whilst there was a slight increase in the Savings Deposits base.
Total Borrowings in 2015 showed a notable increase of 44.6% (Rs. 96.9 billion) to reach Rs. 314.3 billion by end 2015, compared to 12.6% per cent in 2014. Meanwhile, the share of borrowings increased to 31.6% in 2015, up from 26.7% in 2014.
2015 witnessed an improvement in the Asset quality of the NBFI sector as evidenced by better NPLs and provision coverage ratios. Driven by a higher growth in the loan portfolio, Gross NPL decreased to 5.7% (2014 – 6.9%) whilst Net NPL decreased to 1.6% (2014 – 2.3%). The NPL in 2015 was Rs. 3.3 billion compared to the Rs. 7.1 billion in 2014.
Looking ahead to the rest of the year 2016, AFC is looking forward to a period of political stability as the new Government takes on the challenge of bringing about accelerated economic growth. AFC is also hopeful that the Microfinance Act, which will bring some much-needed regulations to the operations of the Microfinance Institutions (MFIs) in the country, will be implemented during the year. AFC is confident that this will placed the Company’s fast-growing Microfinance business on a better footing whilst at the same time helping the authorities to rein in certain MFIs that have been carrying on unethical business practices and jeopardizing the social fabric as well as the economy of the very rural communities they are meant to serve.

46
ALLIANCE FINANCE COMPANY PLC | ANNUAL REPORT 2015/16
SWOT Analysis
strengths• 59+ years of steady growth backed by strong
corporate reputation• Strong and loyal deposit customer base• Open and friendly sub-culture• Highly-experienced Board of Directors as well as
a professional and competent senior management team
• Island-wide representation with well positioned points of presence
• Well-trained and longstanding loyal staff base• Core competencies related to financial business
Opportunities• Excellent marketing prospects due to the decades of
corporate image and reputation• Product diversification avenues for related and non-
related diversification • Enabling technological innovations available for
business improvements• Developing SME sector in the country • Business prospects in the international markets • Changing needs of different market segments
towards environment, health and fitness etc.• Prospects to introduce financing solutions for ‘green’
ventures/ renewable energy initiatives etc.
Weaknesses• Some processes are not optimized/high lead time
between processes• Ideas and opinions to improve the bottom line
stagnates in the middle level and does not reach the senior management
• Scope for further employee empowerment• Low advertising and brand promotions compared to
the peers immediately ahead of AFC
Threats• Fierce competition due to various financial
companies & Banks competing in the same market in Sri Lanka
• Changing government rules & regulations for the Leasing industry
• Political and policy changes that have an impact on social consumption patterns and different segment needs
• Fluctuation of Gold price• Interest rate fluctuation impacts both Gold Loan
&Leasing business• Changing thinking patterns/lifestyles of the emerging
customers• Aggressive promotions and marketing strategies of
competitors
management discussion & Analysis Contd.

47
ALLIANCE FINANCE COMPANY PLC | ANNUAL REPORT 2015/16
“Embracingtheopportunitiesandthreats”–Ourresponsesduringtheyear
Opportunities our response1 Excellent marketing prospects due to
the decades of corporate image and reputation
Use of the credibility factor in branding and promotions to attract and retain customers with increased loyalty to the CompanyConvince and attract potential like-minded business partners
2 Product diversification avenues for related and non- related diversification
Undertook related diversification by introducing six new products
3 Enabling technological innovations available for the business improvements
Adopted M-cash system for Microfinance repayment facilitation and minimize cash carrying riskAdopted SLIPs to further facilitate customersAssessments ongoing to purchase a new Management Information System that will enable the Company operations to move to the next level.
4 Developing SME sector in the country Introduced SME loan product 5 Business avenues in the international
markets Assessments on going for available international expansion opportunities.
6 Changing needs of different market segments towards environment, health and fitness etc.
Promoting electric cars and hybrids at concessionary ratesPreparations are underway to introduce alternative fuel based, low emission, technology for threewheelers.
7 Prospects to introduce financing solutions for ‘green’ ventures/ renewable energy initiatives etc.
One project was initiated to introduce alternative fuel technology for threewheelers to reduce emission and increase fuel efficiency. Research is underway to find more appropriate opportunities.
Threats our response1 Fierce competition due to various
financial companies & Banks competing in the same market in Sri Lanka
Undertook related product portfolio diversification Increased marketing and promotional efforts Strengthening of research and development aspects to identify better responses to market changes and emerging trends Research is ongoing for unrelated diversification avenues Actions will be taken to assess the possibility of overseas expansion
2 Changing government rules & regulations for the leasing industry
3 Political and policy changes that have an impact on social consumption patterns and different segment needs
Introduced six new products Research and assessments are ongoing to seize further opportunities resulting from emerging trends4 Changing thinking patterns/lifestyles of
the emerging customers5 Fluctuation of Gold price Scaled down the operations by reducing the exposure to 2%.
Stand alone business locations were also reduced further and they were amalgamated with the fully fledged branches at nearby locations.
6 Interest rate fluctuation impacts on both Gold Loan & leasing business
Strengthening of research and development aspects to find better responses to market changes and emerging trends
7 Aggressive promotions and marketing strategies of the competitors
Strengthening the promotional and marketing effortsDeveloping the Marketing staff by providing adequate training for capacity building Reinforcing the staff base with more experienced personnel to undertake the challenges
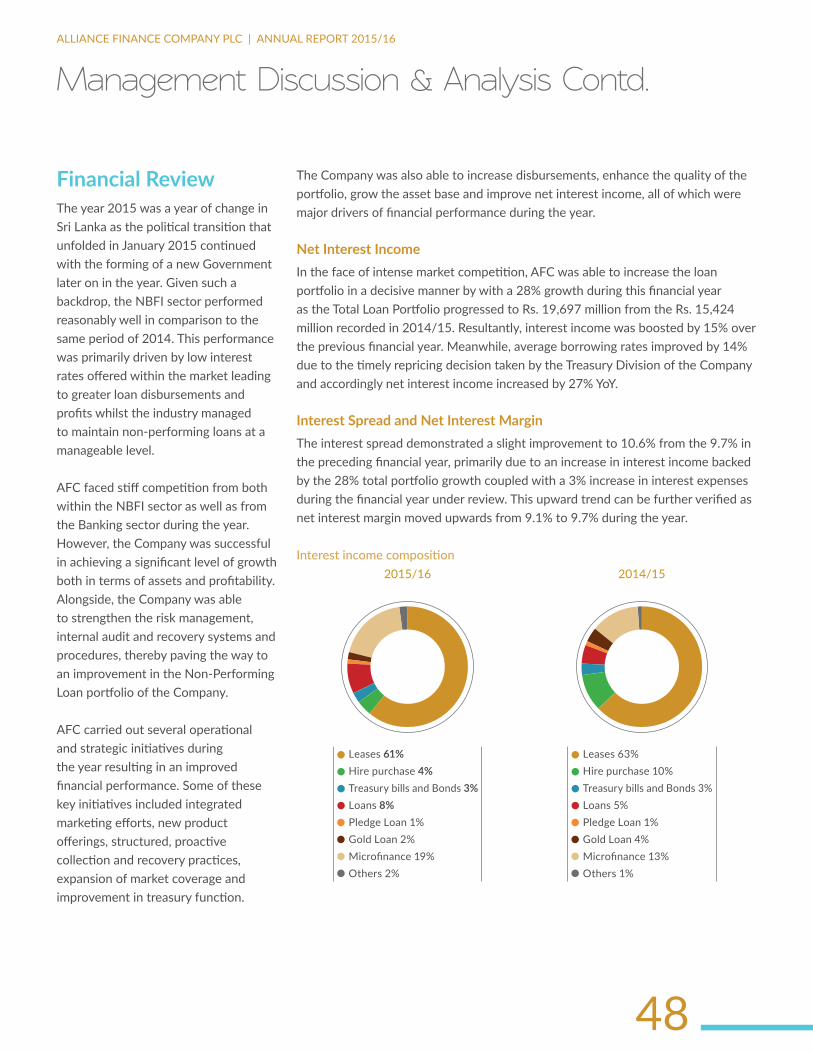
48
ALLIANCE FINANCE COMPANY PLC | ANNUAL REPORT 2015/16
Financial ReviewThe year 2015 was a year of change in Sri Lanka as the political transition that unfolded in January 2015 continued with the forming of a new Government later on in the year. Given such a backdrop, the NBFI sector performed reasonably well in comparison to the same period of 2014. This performance was primarily driven by low interest rates offered within the market leading to greater loan disbursements and profits whilst the industry managed to maintain non-performing loans at a manageable level. AFC faced stiff competition from both within the NBFI sector as well as from the Banking sector during the year. However, the Company was successful in achieving a significant level of growth both in terms of assets and profitability. Alongside, the Company was able to strengthen the risk management, internal audit and recovery systems and procedures, thereby paving the way to an improvement in the Non-Performing Loan portfolio of the Company.
AFC carried out several operational and strategic initiatives during the year resulting in an improved financial performance. Some of these key initiatives included integrated marketing efforts, new product offerings, structured, proactive collection and recovery practices, expansion of market coverage and improvement in treasury function.
The Company was also able to increase disbursements, enhance the quality of the portfolio, grow the asset base and improve net interest income, all of which were major drivers of financial performance during the year.
Net Interest Income In the face of intense market competition, AFC was able to increase the loan portfolio in a decisive manner by with a 28% growth during this financial year as the Total Loan Portfolio progressed to Rs. 19,697 million from the Rs. 15,424 million recorded in 2014/15. Resultantly, interest income was boosted by 15% over the previous financial year. Meanwhile, average borrowing rates improved by 14% due to the timely repricing decision taken by the Treasury Division of the Company and accordingly net interest income increased by 27% YoY.
Interest Spread and Net Interest Margin The interest spread demonstrated a slight improvement to 10.6% from the 9.7% in the preceding financial year, primarily due to an increase in interest income backed by the 28% total portfolio growth coupled with a 3% increase in interest expenses during the financial year under review. This upward trend can be further verified as net interest margin moved upwards from 9.1% to 9.7% during the year.
Interest income composition2015/16
Leases 61%Hire purchase 4%Treasury bills and Bonds 3%Loans 8%Pledge Loan 1%Gold Loan 2%Microfinance 19%Others 2%
Leases 63%Hire purchase 10%Treasury bills and Bonds 3%Loans 5%Pledge Loan 1%Gold Loan 4%Microfinance 13%Others 1%
2014/15
management discussion & Analysis Contd.
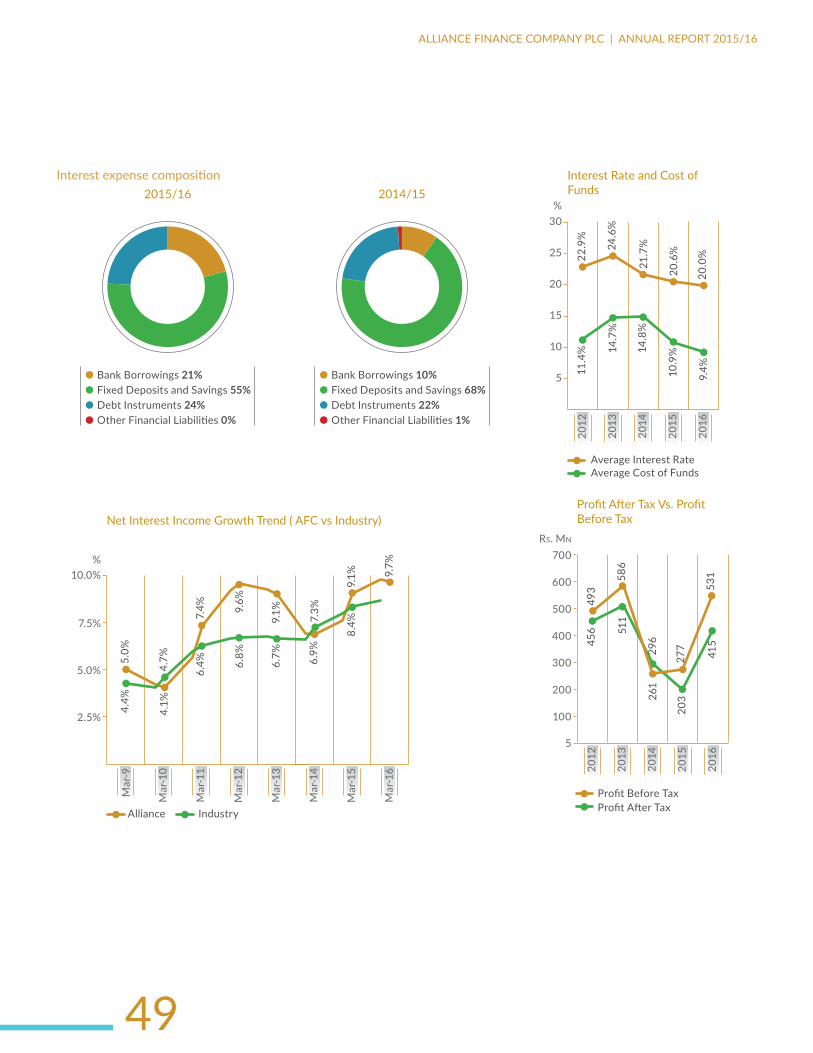
49
ALLIANCE FINANCE COMPANY PLC | ANNUAL REPORT 2015/16
Interest expense composition 2015/16
Bank Borrowings 21%Fixed Deposits and Savings 55%Debt Instruments 24%Other Financial Liabilities 0%
Bank Borrowings 10%Fixed Deposits and Savings 68%Debt Instruments 22%Other Financial Liabilities 1%
2014/15
Mar
-16
9.7%%
2.5%
5.0%
7.5%
10.0%
Mar
-9
Mar
-10
Mar
-11
Mar
-12
Mar
-13
Mar
-14
Mar
-15
Net Interest Income Growth Trend ( AFC vs Industry)
Alliance Industry
5.0%
4.4%
4.7%
4.1%
7.4% 9.
6%
9.1%
6.9%
9.1%
6.4% 6.
8%
6.7%
7.3%
8.4%
5
10
15
20
25
30%
2012
2013
2014
2015
2016
22.9
%11
.4% 14
.7%
14.8
%
10.9
%
9.4%
24.6
%
21.7
%
20.6
%
20.0
%
Interest Rate and Cost of Funds
Average Interest RateAverage Cost of Funds
5
100
300
700Rs. Mn
600
500
400
200
2012
2013
2014
2015
2016
Profit Before TaxProfit After Tax
Profit After Tax Vs. Profit Before Tax
456 51
1
261
203
415
531
27729
6
586
493

50
ALLIANCE FINANCE COMPANY PLC | ANNUAL REPORT 2015/16
management discussion & Analysis Contd.
ProfitabilityThe highly volatile economic environment prevalent in the country did not deter AFC from achieving a significant performance level during the year as the Company registered an impressive Post Tax Profit of Rs. 415 million, a remarkable 105% increase from the Rs. 203 million achieved in 2014/15. Several factors can be attributed to this notable hike in profit levels, mainly:
• Implementation of relatively aggressive strategies to boost the volumes of the core business
• Streamlining of funding sources
• Improving of the stability of the Microfinance business
• Curtailing expenditure on Gold Loan business
OperatingExpensesTotal operational expenses of the Company increased by 34% from Rs. 1,244 million in the previous year to Rs. 1,667 million in the year under review. This increase was fuelled by a 43% increase in personnel expenses and a 29% increase in other operating costs. The personnel expenses registered a Rs. 226 million increase as a result of new recruitments across the Company whilst, in keeping with the Company’s focus on enhancing human capital, remuneration and other incentives were also increased.
Furthermore, the audit cost of Rs. 1.86 million, a 34% growth over the previous year, and the increase in advertising and promotional costs by 16% to Rs. 62 million also increased the operational expenses.
Overall, the Company’s efficiency ratio showed an upward trajectory as it recorded 64% during the year as opposed to 52.8% in the previous financial year. The Company expects to improve the overall ratio in the next financial year, as output of the human capital invested during the latter part of 2015/16 is expected to yield favourable results halfway through the upcoming 12-month financial period.
OperationalExpenses
rs. MnFYe
2015/16FYe
2014/15 Growth %
Personnel expenses 751.0 524.9 43%
Depreciation of property & equipment
99.9 85.7 17%
Auditors fees and expenses 1.9 1.4 34%
Professional fees 8.1 5.0 62%
Office administration & establishment expenses
345.3 275.0 26%
Advertising & business promotion expenses
62.4 53.7 16%
Motor vehicle running & maintenance 315.7 234.2 35%
Impairment loss on unquoted securities
1.2 1.0 22%
Others 81.2 63.4 28%
Total 1,666.7 1,244.3 34%
Assets AFC’s Total Assets base rose by 30% to reach Rs. 25,857 million in the year under review, driven by aggressive disbursements together with market penetration strategies which were implemented by the Company during the year. Lease rental receivable and stock out on hire contributed 51% of the Total Assets base whilst Loans & Advances made up 22%. Moreover, a Return on Assets (PBT) figure of 2.3% in 2015/16 and 1.4% in 2014/15 meant that the efficiency of the assets utilization has risen by 62% during the reporting period.

51
ALLIANCE FINANCE COMPANY PLC | ANNUAL REPORT 2015/16
rs. Mn %
5,000
10,000
1
15,000
2
3
4
30,000
25,000
20,000
5
2012
2013
2014
2015
2016
Asset Base (Rs. Mn) ROA (%)
Asset base growth andreturn on assets
4.6% 3.
9%
12,6
54
17,4
92
18,7
26
19,9
10
25,8
27
1.4%
2.3%
1.4%
Assets composition 2015/16
Cash and Cash Equivalents 10%Property Plant & Equipments 6%Loans and Advances 22%Leasing 51%Hire Purchase and Consumer Durables 2%Investments 7%Trading Stocks 1%Other Assets 1%
Gross/NetNPLtrendoverlastfiveyear
%
15
20
5
10
2012
2013
2014
2015
2016
Gross NPLNet NPL
Gross and Net NPLs
2.5%
2.0%
18.2
%
8.3%
2.5%
0.5%
0.7%
15.4
%
5.2%
0.7%
DisbursementsandPortfolioThe Total Portfolio of the Company rose from Rs. 15,424 million in the previous financial year to end the current year on Rs. 19,697 million. This is a 28% growth and includes a 21% increase in Leasing and Hire Purchase and 28% increase of Microfinance over the same period last year. Further, the Company has successfully reduced the Gold Loan exposure to 2% by disposing of most of its non-performing articles.
The Total Portfolio growth was boosted by a 56% increase in overall disbursements when compared to 2014/15. The Company’s growth in disbursements includes increases of 52%, 205% and 29% in Leasing, Loans and Microfinance segments respectively.
Cash and Cash Equivalents 6%Property Plant & Equipments 6%Loans and Advances 19%Leasing 51%Hire Purchase and Consumer Durables 6%Investments 11%Trading Stocks 1%Other Assets 2%
Assets composition 2014/15
AssetQualityQuality of AFC’s assets is fundamentally reflected in the Non-Performing Loans (NPL) ratios achieved by the Company in the year under review. During the 12-month period, Gross NPL was reduced significantly to close the year on 2.46%, well below than industry average of 5.7% and a substantial drop from the 8.30% registered by the Company in the previous financial year. Similarly, Net NPL was as low as 0.71% in 2015/16, compared to 5.22% in 2014/15 and well below the industry average of 1.60%. These significant improvements witnessed in both Gross and Net NPL ratios during the year were mainly due to the disposal of most of the Company’s non-performing Gold Loan portfolio and the stock of repossessed vehicles. This resulted in a 62% drop in the absolute NPL value, reducing from Rs. 1,280 million to Rs. 484 million during reporting year.

52
ALLIANCE FINANCE COMPANY PLC | ANNUAL REPORT 2015/16
2016
2015
Portfolio composition
68%67%
2%8%
13%8%
2%5%
10%10%
4%1%
LeasingHire purchaseTerm Loans
Gold loansMicrofinance LoansOther Loans
rs. Mn
10,000
15,000
20,000
5,000
2012
2013
2014
2015
2016
Portfolio growth trend line for 5 years
10,2
84
14,2
99
14,4
04
15,4
24
19,6
96
TotalLiabilitiesIn a historic move that speaks volumes of the future direction of the Company, AFC was able to take advantage of prevalent low rate conditions in the international market and permission granted under liberalization of exchange control regulations by borrowing USD 10 million in total from two foreign sources - Triodos Bank of the Netherlands and Commercial Bank of Ceylon PLC of Bangladesh. The facility was obtained under the External Commercial Borrowing Scheme (ECBS) introduced by the Exchange Control Department of the Central Bank of Sri Lanka.
LiabilityGrowth
rs. MnFYe
2015/16FYe
2014/15GROWTH
%
Due to banks 8,329 2,929 184%
Due to customers 10,464 10,344 1%
Debt instruments issued and other borrowed funds
3,062 3,203 -4%
Other financial liabilities 884 701 26%
Other non financial liabilities 383 283 35%
Total Liabilities 23,070 17,460 32%
Additionally, Total Liabilities of the Company reached Rs. 23,123 million, an increase of 32% over the previous year. Of this figure, 45% and 36% have been accounted for by saving/customer deposits and bank liabilities respectively during the year under review.
Liability composition
36%
45%
13%4%
17%
59%
18%
4%2%
2%FYe2014/15
FYe2015/16
Due to banksDue to customersDebt instruments issued and other borrowed funds
Other financial liabilitiesOther non financial liabilities
ShareholderFundsTotal Shareholders’ Funds of AFC reached Rs. 2,734 million at the end of the financial year, a hike of 12% from the Rs. 2,449 million from 2014/15. This growth was triggered by a 36% increase in retained earnings. Moreover, buoyed by the positive performance, the Company was able to improve the post-tax Return On Equity (ROE) from 8.4% in the previous year to 16% in 2015/16.
During the reporting period, the Company’s Earnings Per Share (EPS) showed a significant 105% increase from Rs. 84 to Rs. 171.
management discussion & Analysis Contd.
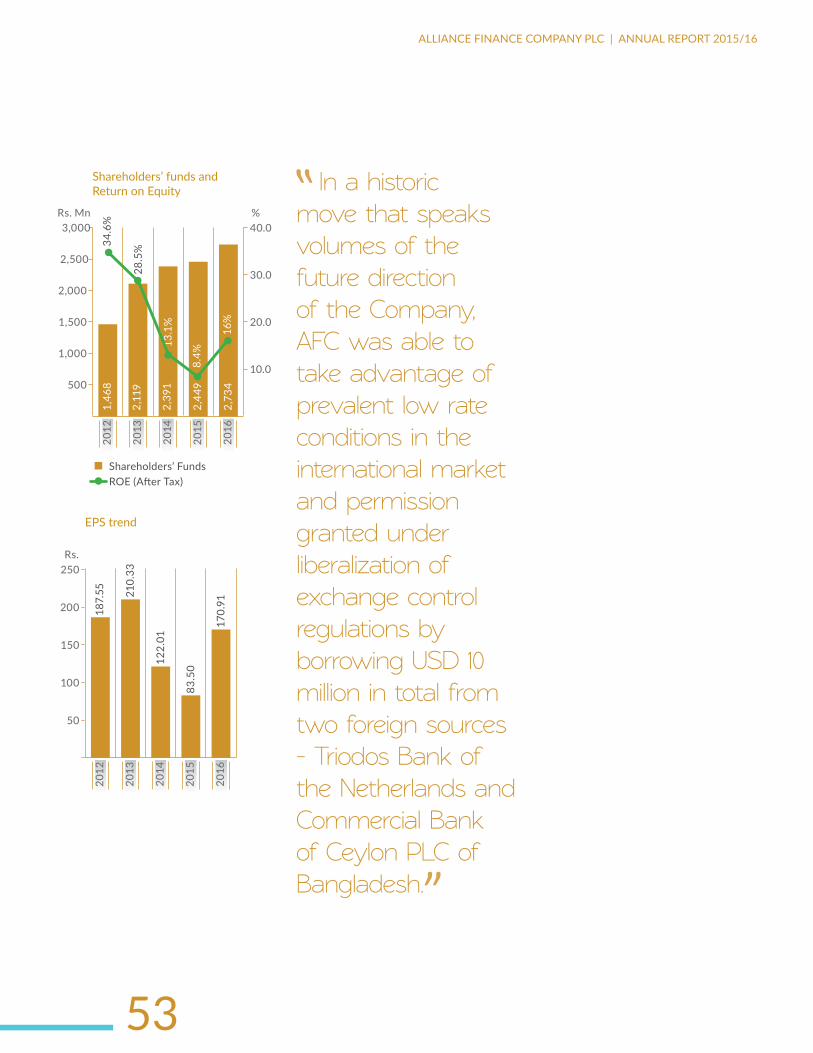
53
ALLIANCE FINANCE COMPANY PLC | ANNUAL REPORT 2015/16
Shareholders’ funds andReturn on Equity
50010.0
1,000
20.0
2,500
2,000
1,500
30.0
40.0
2012
2013
2014
2015
2016
Shareholders’ FundsROE (After Tax)
34.6
%1,
468
2,11
9
2,39
1
2,44
9
2,73
4
28.5
%
13.1
%
8.4%
16%
3,000rs. Mn %
50
100
150
200
250
2012
2013
2014
2015
2016
EPS trend
187.
55
210.
33
122.
01
83.5
0
170.
91
rs.
in a historic move that speaks volumes of the future direction of the Company, AFC was able to take advantage of prevalent low rate conditions in the international market and permission granted under liberalization of exchange control regulations by borrowing uSd 10 million in total from two foreign sources - Triodos bank of the Netherlands and Commercial bank of Ceylon plC of bangladesh.

54
ALLIANCE FINANCE COMPANY PLC | ANNUAL REPORT 2015/16
OperationsReviewAFCOperationalStructureThe operational structure of AFC consists of four strategic business units and a support services division, which overlooks the operations of nine support services as, depicted below.
AFC Operational Structure
Regional Financial Services
Microfinance Gold Loans Deposit
Alliance Finance Company PLC
Treasury HR IT and MIS Recoveries Audit Legal Risk
Management Finance Administration
Support Services
Total InvestmentsRs. 16,300 Million
Non-Performing Loan Ratio
2.46%
Profit Before Tax Rs. 531 Million
Total Lending Portfolio
Rs.19,697Million
Deposit Base Rs. 10,344 Million
Leasing and Hire Purchase
Rs. 13,958 Million
Microfinance
Rs. 2,012 Million
Gold Loans
Rs. 368 Million
Equipment Financing
Rs. 475 Million
Personal Loans
Rs. 76.8 Million
Other Loans
Rs. 3,153 Million
Gold Loan Portfolio
Rs. 368 Million
AFC Operational Performance Highlight
Thecustomerbase
2013/14 2014/15 2015/16
Total Customer base 118,990 132,993 133,984
Deposits 10,711 10,203 9,804
Microfinance 19,494 55,791 66,455
RFS and other 88,785 66,999 57,725
management discussion & Analysis Contd.

55
ALLIANCE FINANCE COMPANY PLC | ANNUAL REPORT 2015/16
regional Financial services (RFS)OverviewThe Regional Financial Services SBU undertakes the core business of AFC which includes activities relating to all lending products except Microfinance due to the specialized nature of its operations. Microfinance has been operating as a separate SBU since 2014. The primary lending products of RFS include:
1. Leasing and Hire Purchase2. Pledge Loans3. Term Loans4. Quick Cash 5. Equipment Financing
The total lending portfolio registered a growth of 33% to reach Rs. 17.3 billion, despite a challenging operating environment. Similar to the previous year, the major portion of the portfolio was leasing accounting for 78% of the total RFS portfolio in the current year. During the year under review term loans and other lending products increased to 15% and 4% respectively compared to 10% and 1% in the previous year.
2016
2015
Portfolio composition
78%
3%15%
80%
9%
10%4%
1%
LeasingHire purchase
Term LoansOther
New regulations, such as those related to vehicle duties and Loan to Value (LTV) ratio of vehicles as well as rising exchange rates, affected the NBFI and Finance sector negatively. However, it
must be noted that although the new regulations suppressed the overall volume increase during the year, on a more positive note, it contributed towards the reduction of the risk of the Company. Meanwhile, heightened competition from other NBFIs as well as from banks meant that margins were affected as companies battled to sustain and grow.
During the year, the Company took several positive steps to lessen the impact of policy changes on the growth of the business. One of the key strategic initiatives was to diversify the product mix in order to generate higher returns and this instrumented the following new products to be introduced to the product portfolio.
• SME Loans• Soft Collateral Business Loans• Harvest Pledge Loans• Registered 2 wheeler leasing • Agriculture Machinery leasing • Equipment financing
To support the roll-out of the new strategy, impactful yet cost-effective marketing and promotional campaigns were carried out in different parts of the island, targeting various customer segments in a focused manner. The campaigns had a positive outcome as the new products gained traction amongst the target audience providing an optimistic outlook for the new financial year. In parallel with such marketing efforts, the recovery aspects were also given special attention thereby helping to lessen the impact of the turbulent market and sustain the growth momentum of the Company.
rs. Mn
10,000
15,000
20,000
5,000
2012
2013
2014
2015
2016
Portfolio trend ofRFS SBU
9,00
0 11,5
62
11,5
56 13,0
36
17,3
18
The portfolio of the RFS SBU has continued in an upward trend reaching 17.3 billion compared to 13 billion previous year amounting to a 33% growth. The collection this year of 57% and NPL ratio of 2.4% portray a significant achievement for AFC this year. Simultaneously the investments have increased from 8 billion form previous year to 13 billion this year achieving a growth of 64%.
3,000
50
6,000
12,000
9,000
15,000
2012
2013
2014
2015
2016
RFS disbursements 2015/16
6,39
5
6,35
8
4,74
6
7,96
4
13,0
57rs. Mn

56
ALLIANCE FINANCE COMPANY PLC | ANNUAL REPORT 2015/16
The planning and execution of the recovery processes was given a timely boost as the Company strengthened its recovery practices and motivated recovery staff to perform at a consistently high level whilst maintaining a professional approach at all times. Similarly, although the Arrears Ratio of more than two rentals was 25% at the beginning of the financial year, by the end of the year it had dropped drastically to register less than 8.7%. This was another notable achievement during the year.
Leasing and Hire PurchaseOverviewWith unparalleled domain knowledge and expertise in the finance and motor sectors, AFC Leasing and Hire Purchase provides both corporates and individuals with tailor-made solutions to suit their requirements, presenting them with the opportunity to obtain unregistered vehicles, registered vehicles and a wide range of consumer durables ranging from refrigerators and washing machines to home furniture.
TargetsandachievementsAFC faced another challenging year with competition increasing due to a greater number of players in the NBFI sector as well as the threat posed by banks entering into product segments such as Leasing and Hire Purchase.
Key Objective for 2015/16 Progress/Status
Reduce exposure to threewheelers and increase more fourwheeler financing
2014/15 Threewheeler proportion - 49%Fourwheeler proportion - 44%
2015/16Threewheeler proportion - 42%Fourwheeler proportion - 55%
Enhance focus on hybrid and electric vehicles
Electric cars - 2%Hybrid cars - 43%(Out of total 4 wheelers portfolio)
Initiate equipment financing Completed
The change in the Government and uncertain regulations played their part in making the task before the Company even more formidable. However, despite these obstacles, AFC was able to achieve a 21 % growth year-on-year in its Leasing and Hire Purchase portfolio. Meanwhile, Leasing continued to make up the largest share of the total lending portfolio recording 68%, a slight increase from the 67% recorded in 2014/15.
The significance of Hire Purchase in the lending portfolio continued to decline for yet another year as driving the Leasing business was given more priority. Hire Purchasing was discouraged due to tax reforms imposed last year where leasing VAT was removed. As a result, the Hire Purchase portfolio declined to Rs. 475 million from Rs.1,179 million recorded in the preceding financial year and the Hire Purchase customer base dropped to 1,498 from 1,781 in 2014/15.
RFS lending portfolio composition 2015/16
Mortgage 9%Loan 7%Equipment 1%Two wheelers 3%Threewheelers 34%Fourwheelers 46%Fourwheelers (Land Vehicles) 0%
RFS lending portfolio composition 2014/15
Mortgage 2%Loan 4%Equipment 1%Two wheelers 7%Threewheelers 45%Fourwheelers 41%Fourwheelers (Land Vehicles) 0%
management discussion & Analysis Contd.

57
ALLIANCE FINANCE COMPANY PLC | ANNUAL REPORT 2015/16
Fourwheeler portfolio has increased notably during 2015/16 whilst a key feature was the decline in the two wheeler category. This was mainly due to the Company holding back on branding and promotion until it built its infrastructure to cater to this segment which includes building its HR capacity, branding and promotion as well as strategic partnerships to strengthen the offer. In 2015/16 this will be completed and there are many initiatives planned in terms of marketing and promotions to attract more customers for this vehicle asset class.
Vehicle portfolio composition by type - 2015/16
Two wheelers 3%Three wheelers 42%Four wheelers 55%
Vehicle portfolio composition by type - 2014/15
Two wheelers 7%Three wheelers 49%Four wheelers 44%
Pledge LoansAFC Pledge Loans are primarily granted to meet short-term working capital financing needs of its corporate customers. Whilst flexibility in repayment is one of the unique features of Pledge Loans they are generally offered for a period less than one year.
Key Objective for 2015/16 Progress/Status
Develop the loan product with more concentrated marketing efforts
Enhanced the product promotion methods resulting in an impressive growth of 594%
In the past Pledge Loans were primarily granted for vehicle traders, however, commencing from 2015/16 onwards, the product expanded to cover agricultural harvest stocks as well. Whilst this is keeping in line with the Government’s drive to provide a helping hand to the Agriculture sector of Sri Lanka, it will also help AFC attract a different customer segment, moving away from the corporate customers in urban and suburban parts of the country. The Company believes that this will provide a much-needed boost to meet the financial needs of the farming community in the rural parts of the island.
During the period under review, the Pledge Loan portfolio increased by 594% to reach Rs. 668.6 million from Rs. 96.3 million in 2014/15.

58
ALLIANCE FINANCE COMPANY PLC | ANNUAL REPORT 2015/16
Term loans AFC offers a range of term loan products targeting different customer groups. Amongst them are personal loans, mortgage loans and soft collateral business loans.
Key Objective for 2015/16 Progress/Status
Promote Personal Loans (Platinum Advance)
The promotion and marketing was carried out in a more conservative manner through the Equipment Financing and Personal Loans Division. Growth of the product during the year was 17% amounting to Rs. 76.8 million.
At the end of the reporting year the Term Loan portfolio accounted for 15% of the total RFS lending portfolio of Rs. 17.2 billion.
Quick CashQuick Cash is a product designed to meet the immediate cash requirements of the depositors, where the Company provides up to 90% of the deposit value as credit.
Key Objective for 2015/16 Progress/Status
Aggressive promotion of the product Promotions were carried out resulting in a growth of 2% during the year
AFC Quick Cash portfolio has marginally increased by 2% during the reporting year to Rs. 81.0 million compared to Rs. 79.5 million in the previous year.
equipment FinancingEquipment Financing is a new sub division that is operating under the RFS SBU. Equipment Finance is the result of the efforts made by AFC to introduce more innovative financial solutions to the customer whilst also diversifying its portfolio and thereby reducing the Company’s risk exposure. The focus of this division is solely on financing different types of equipment and machinery products by providing leasing facilities for them. At the end of the reporting year, the division held a portfolio of Rs. 89.1 million.
Future Focus• RFS will strive to achieve both the investment target and profit target by way
of increasing efficiencies, managing costs and driving more business across all product offerings.
• Emphasis will be placed on increasing collections across all lending products.
management discussion & Analysis Contd.
• AFC understands how vital training and development is to enhance the skills and knowledge of its human capital whilst also being a contributing factor in reducing employee turnover. Hence, carefully-planned training and development programmes will be implemented for employees at all levels of RFS.
• The Company will strive to improve the rating given by Fitch Ratings Lanka by way of consistent improvement across the RFS SBU.
• The Gold Loan product offering will be fine-tuned and developed under RFS and made into a dynamic, stable offering that will eventually bring back profits to the Company.
• By maintaining a close relationship with the customer and following various other mechanisms, a close scrutiny will be maintained to identify customers’ changing needs and other market situation dynamics so that products can be fine-tuned to meet these requirements and thereby product diversification will be achieved through new product offerings. This would also increase the product mix of the Company, reduce risk and enhance the future outlook.
• RFS’s in-depth knowledge of the market it operates in will be used to develop new, innovative ideas for marketing its product portfolio. This will grant the SBU the opportunity to devise effective ways to reach out to existing and prospective customers.

59
ALLIANCE FINANCE COMPANY PLC | ANNUAL REPORT 2015/16
The main products offered by this SBU are:• Microfinance Loans (for income generation purposes)
• Micro SME Loans
• Personal Loans
• Micro Leasing
• Plantation Loans
TargetsandachievementsThe year can be termed as one that showed sustainable, moderate growth whilst making a significant impact in the lives of the customers. AFC implemented a well-planned, focused effort that helped the Company’s Microfinance team to reach out to customers efficiently.
Key Objective for 2015/16 Progress/Status
Strengthen the internal processes and controls
Stepstakeninclude:Consultancy and technical assistance obtained to improve operational processes• Monitoring tools developed• Operations manual upgraded• Supervisory team formed and employed for quality
assurance• Scoring system developed and monitored by the
internal audit team
Managing the operations related specific risk
A special in-house audit team comprising of 18 members was established. Each branch was audited four times during the year. Systematic processes have been implemented to follow up on the audit findings and monitoring mechanisms to rectify any lapses uncovered
Obtain international rating
ß+ Rating was received from M-CRIL for complying with client protection principles and social performance standards
The Microfinance portfolio remained steady at Rs. 2.0 billion with a growth of 28% in comparison to the 160% growth of the preceding financial year.
Such reduced growth was well in line with the plan set out by AFC at the beginning of the financial year. The plan emphasized on curtailing the rapid growth recorded in the previous financial year, mainly taking into account the uncertainty of the economic landscape which meant greater industry risks and vulnerabilities.
Microfinance OverviewAFC ventured into Microfinance by establishing the Microfinance SBU under the umbrella of Alliance Finance Company PLC in 2013. This expansion was a part of the Company’s quest to become one of the most sought after financial institutions in the country whilst keeping with its sustainability commitments as a responsible corporate citizen of Sri Lanka. The launch of this SBU was a historic milestone of the Company and gave great impetus to the Company’s ambitious expansion strategy.
As the first financial institution in Sri Lanka to adopt the Triple Bottom Line concept, the commencement of Microfinance operations enabled the Company to provide services to the less fortunate segments of society. It is well known that a large segment of the Sri Lankan population live in the rural areas and have low access to formal financial services. Through this new SBU, AFC was able to reach out to these segments and provide them with micro loans at reasonable rates, thereby empowering grassroot level entrepreneurs and eventually generating new employment opportunities. The trickle down effects of this effort has resulted in economic development in most parts of the country where Microfinance facilities are easily accessible.

60
ALLIANCE FINANCE COMPANY PLC | ANNUAL REPORT 2015/16
Additionally, there were concerns pointed out by the rating agencies to limit AFC’s portfolio exposure considering the risks of the business and the industry conditions, to which AFC responded with this relatively cautious approach.
During the year under purview, the processes of the Microfinance Division were consolidated and the anticipated branch network expansion was completed. Along with this, relevant audit processes were reinforced taking into account the industry risk as mentioned above.
The Company also needed to align itself to face the numerous challenges arising from within the industry as well as the community as a result of unethical business practices of some of the competitive organizations which has resulted in a negative perception created amongst the community about LFCs. The slowing down of the rate of growth allowed the Company to take stock of the ground situation and understand the intricacies of the customer and the industry in a better manner prior to mapping out the approach to face such challenging circumstances. This approach was further fortified by adopting global best practices and international standards set forth by CGAP Foundation, the global body that seeks to advance financial inclusion amongst the poor, to revitalize internal processes and improve KPIs to deliver better outcomes.
During the year the total Microfinance disbursements were Rs.3,244 million compared the Rs.2,506 million the preceding year. Although the gross NPL ratio has increased to 3.1% during the year from 1.0% in the previous year, it still remains well below the industry average. The total number of loans disbursed as at 31st March was 146,336 with a cumulative investment of Rs.6.48 billion from inception.
nos
65,000
70,000
55,000
60,000
2014
/15
No. of Loans given toExisting Business
No. of Loans given to New Business
Loans for existing and new businesses
1,94
357
,676
2015
/16
3,93
863
,501
Loan cycle-wise active borrowers
Cycle 1 63%Cycle 2 29%Cycle3 8%
AFC’s Microfinance activities are mainly concentrated outside the Western Province in the rural areas of the country where marginalized groups with limited access to formal finances reside.
During the year, the SBU was able to establish 3,000 centres, which are the direct interaction points for the customers as well as points of presence and provide services to 66,455 active borrowers. Of this figure, the customer base outside the Western Province increased slightly to 76.7% from 73.8% in 2014/15. The Company recruited a large number of staff members to the SBU during the year. There are 316 Field Executives as at 31st March 2016 compared to 188 in the previous period, whilst the case load was 241.
management discussion & Analysis Contd.
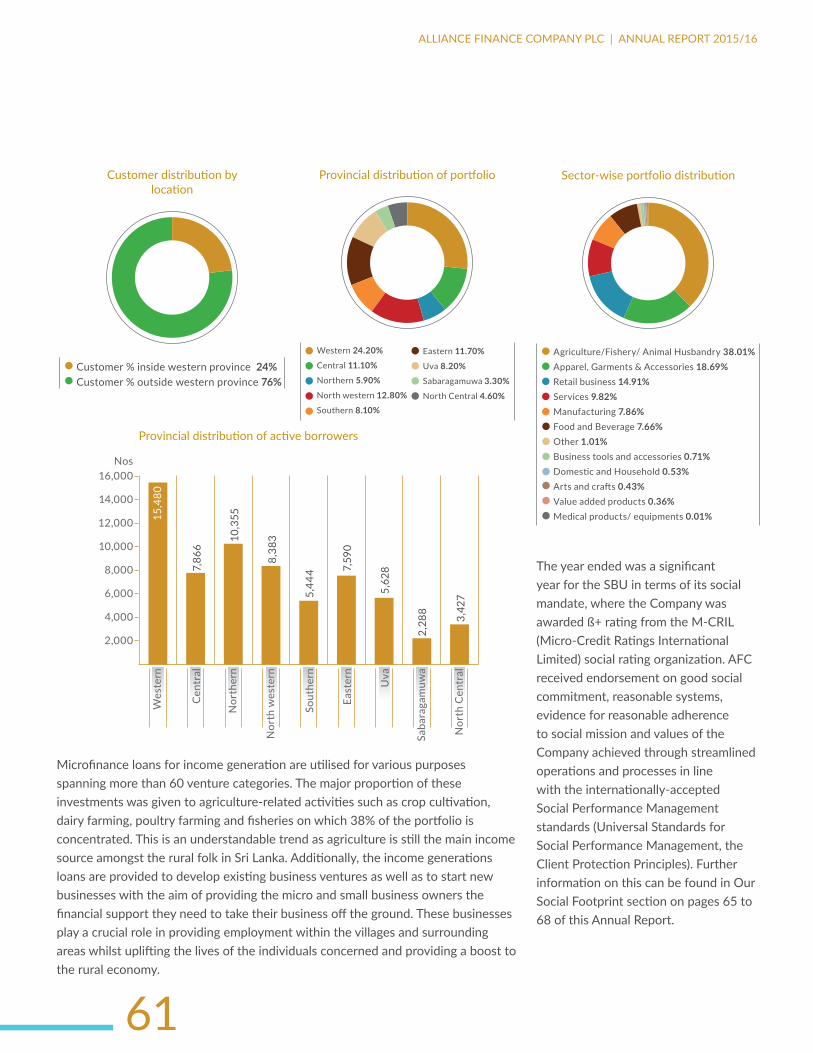
61
ALLIANCE FINANCE COMPANY PLC | ANNUAL REPORT 2015/16
Customer distribution by location
Customer % inside western province 24%Customer % outside western province 76%
Provincial distribution of portfolio
Western 24.20%Central 11.10%Northern 5.90%North western 12.80%Southern 8.10%
Eastern 11.70%Uva 8.20%Sabaragamuwa 3.30%North Central 4.60%
nos
8,000
6,000
4,000
2,000
12,000
10,000
16,000
14,000
nor
ther
n
nor
th w
este
rn
sout
hern
east
ern
uva
Wes
tern
Cen
tral
saba
raga
muw
a
nor
th C
entr
al
Provincial distribution of active borrowers
15,4
80
7,86
6
10,3
55
8,38
3
5,44
4 7,59
0
5,62
8
2,28
8
3,42
7
Microfinance loans for income generation are utilised for various purposes spanning more than 60 venture categories. The major proportion of these investments was given to agriculture-related activities such as crop cultivation, dairy farming, poultry farming and fisheries on which 38% of the portfolio is concentrated. This is an understandable trend as agriculture is still the main income source amongst the rural folk in Sri Lanka. Additionally, the income generations loans are provided to develop existing business ventures as well as to start new businesses with the aim of providing the micro and small business owners the financial support they need to take their business off the ground. These businesses play a crucial role in providing employment within the villages and surrounding areas whilst uplifting the lives of the individuals concerned and providing a boost to the rural economy.
Sector-wise portfolio distribution
Agriculture/Fishery/ Animal Husbandry 38.01%Apparel, Garments & Accessories 18.69%Retail business 14.91%Services 9.82%Manufacturing 7.86%Food and Beverage 7.66%Other 1.01%Business tools and accessories 0.71%Domestic and Household 0.53%Arts and crafts 0.43%Value added products 0.36%Medical products/ equipments 0.01%
The year ended was a significant year for the SBU in terms of its social mandate, where the Company was awarded ß+ rating from the M-CRIL (Micro-Credit Ratings International Limited) social rating organization. AFC received endorsement on good social commitment, reasonable systems, evidence for reasonable adherence to social mission and values of the Company achieved through streamlined operations and processes in line with the internationally-accepted Social Performance Management standards (Universal Standards for Social Performance Management, the Client Protection Principles). Further information on this can be found in Our Social Footprint section on pages 65 to 68 of this Annual Report.

62
ALLIANCE FINANCE COMPANY PLC | ANNUAL REPORT 2015/16
management discussion & Analysis Contd.
Future Focus AFC plans to optimise the use of mobile technology by promoting the use of mobile money for the Microfinance recovery process. The Company believes that this will provide added convenience to customers as well as AFC employees. Customers can eliminate the risk of carrying cash to make payments whilst also saving time by transferring the necessary funds quickly through this technology. AFC employees will be able to efficiently monitor this and manage the recovery process.
Plans are being made to expand the current 3,000 points of presence in terms of centres to 10,000 centres by 2017/18. This would add greater convenience to the existing customer base whilst taking the Company’s Microfinance products to the most remote parts of the island where poverty is prevalent, granting opportunities for the communities to access funds, start businesses and map a path to a better quality of life.
AFC also intends to expand its network by way of Virtual Branches. A virtual branch covers an area where loans will be promoted but will have no physical branch and the staff handling that area will operate from the closest physical branch. Initially, 100 virtual locations will be established over the next two years. This will further enhance the Company’s chances of reaching out to the rural areas and marginalized communities.
Having been recognized for the standard set by its social mandate, the onus will be on AFC to maintain such exacting standards and further improve them whilst balancing the growth of its Microfinance network. Through stringent monitoring systems and processes, special attention will be given to ensure that the highest standards are maintained at all times at every level of the organization so that the Company is on par with global best practices.
AFC will strive to be an exemplary knowledge centre by adopting and demonstrating international best practices for the business and continuing to focus on its social performance management and environmental sustainability management.
The emphasis on moderate growth will continue into the foreseeable future as the Company reinforces its position in the market and prepares for future expansion once the necessary legal framework is implemented in the country by virtue of the Microfinance Act and other supporting legislation.
The drive to maintain NPLs below the industry average will continue along with a focus to maintain the quality of the Microfinance portfolio.
Gold loansOverviewAFC Gold Loans are a short-term facility secured against gold jewellery. With several unique features, the product caters to diverse customer needs. Customers are provided with much convenience, flexibility and easy access for this facility.
With the market for gold continuing on the downward trend, which started during the 2014/15 financial year due to which the Company took a strategic decision to divest 64% of its Gold Loan portfolio curtailing its exposure to losses stemming from depressed gold prices.
TargetsandachievementsWhilst recognizing the importance of introducing a range of innovative financial products that would be more attuned to the evolving needs of the customer, AFC also took a strategic decision to further reduce its exposure to the Gold Loan portfolio during the year under review. This change in the product mix is bound to have a significant impact on profitability and long-term direction of the Company.

63
ALLIANCE FINANCE COMPANY PLC | ANNUAL REPORT 2015/16
Key Objective for 2015/16 Progress/Status
Rationalize the product portfolio During the year 03 standalone Gold Loan Centres were closed down and 17 were amalgamated with the RFS and MF branches in the vicinity
Reduce exposure to Gold Loan portfolio
Exposure was successfully reduced to 2%
Resultantly, the total Gold Loan portfolio was scaled down to Rs. 368 million at the end of the reporting year, a significant decline of 55% during the year. Furthermore, Gold Loan exposure was reduced to 2% by disposing most of the non-performing articles attached to the Division.
At the outset of the current financial year, AFC operated with 16 standalone Gold Loan branches and shut down operations of five of these branches during the year as part of the business streamlining initiative of the Company. In addition to the 16 standalone branches, 17 branches were jointly operating with the RFS and MFS branches by the end of the financial year. Staff count of the entire Gold Loan Division stood at 96.
Deposits OverviewAFC Deposits encompasses Fixed Deposits and Savings Accounts, providing customers the opportunity to earn attractive interest rates. The Company provides the added convenience of enabling customers to grow their savings automatically by linking Fixed Deposits with Savings Accounts. Fixed Deposits’ period ranges from 1 to 60 months whilst Savings Accounts cater to the needs of different customer segments via regular savings, Sisu Hapannu Savings, Three Wheeler Savings and Senior Citizens Savings.
TargetsandachievementsDespite low interest rates, intense competition and uncertainty in the financial markets and in the country in general, AFC managed to maintain a renewal ratio of 80% which is an impressive achievement. The Deposits team was instrumental in harnessing the confidence of customers by providing them a professional service at all times. This invariably resulted in a positive perception of the Company amongst the deposit customer base, which helped in minimizing withdrawals.
500
1,500
1,000
3,000
2,500
2,000
2012
2013
2014
2015
2016
Gold loan portfolio1,
284
2,73
7
2,24
3
812
368
rs. Mn
Future FocusAFC intends to introduced several initiatives to diversify the Company’s product offering during the coming year. The pawning product will be expanded to the entire AFC branch network thereby giving the Company the opportunity to reach large parts of the island and providing customer convenience. In parallel, marketing and promotional aspects of the division will be aligned to suit the new products being offered.

64
ALLIANCE FINANCE COMPANY PLC | ANNUAL REPORT 2015/16
Key Objective for 2015/16 Progress/Status
Boost deposit mobilization Deposit base growth rate for the year excluding Microfinance was -0.5%. Increased efforts are underway to further to improve the promotions.
The total deposit portfolio at the end of the year amounted to Rs. 10,464 million, a marginal decrease from the Rs.10,344 million recorded last year. In order to mitigate the maturity mismatch, the Company concentrated largely on long-term funding sources over short-term deposits.
Whilst the Term Deposit portfolio showed a slight dip to Rs.9,786 million from the Rs.9,950 million recorded in the previous year, the Savings portfolio showed an upward movement registering Rs.678 million against Rs.393 million compared to the previous year.
The total customer base excluding Microfinance dropped marginally to 9,804 from 10,559 registered in 2014/15. However the Microfinance customer base increased from 66,698 from the previous year to 107,420 in the current year, making the total customer base 117,202, which is a growth of 55%. The customer base of 9,804 at the end of the year comprised 3,966 fixed deposit customers, 5,816 savings customers excluding Microfinance customers.
A special fixed deposit facility for a period of 30 months was introduced and carried out during the year that drew a positive response from the customer base.
Future FocusPlans are being drawn up to provide greater convenience to the Company’s Savings customer base by introducing a series of strategically-located ATMs. Innovative branch level marketing campaigns will be carried out to further strengthen the deposit base by attracting new customers. Product branding will play a vital role in clearly communicating the strength and stability of the Company to the new target audience and to win their confidence in the NBFI sector that was lost due to negative incidents which took place in the recent past. As the Company’s product offering diversifies, cross selling will also be one avenue that is earmarked bolster the deposit base.
management discussion & Analysis Contd.
40,000
60,000
80,000
100,000
120,000
20,000
Fixe
d D
epos
its
savi
ngs
2014/15 2015/16
The customer base
4,69
3
3,96
6
66,6
98 107,
420
5,83
8
5,81
6
Mic
ro
savi
ngs
nos

65
ALLIANCE FINANCE COMPANY PLC | ANNUAL REPORT 2015/16
Social and Environmental ReviewDoing business whilst ensuring social and environmental sustainability is amongst the topmost priorities of the AFC mandate. As a responsible corporate citizen, in keeping with the corporate value of “Serve People – Conserve Nature”, the Company efforts in this regard are aligned towards a better society with reduced poverty, enhanced empowerment, improved quality of life and a healthy environment, becoming a business that operates with the best accepted, ethical business practices.
AFC also adopts industry best practices, standards and technology to improve transparency, accountability and efficiency, in the hope that benefits will be increased and the ripple effect of the outcomes will be received by society and the environment at large.
The total CSR expense was around Rs. 6 million during the year, out of which the highest proportion (36%) was incurred on environment protection activities.
our social Footprint Responsible FinancingLong term sustainability is the core determinant of the risk/ return preposition of our investments. We carefully select our investments to ensure that we only engage in socially responsible business ventures. Positive M-CRIL social business rating of our Microfinance business testifies to our commitment towards adhering to client protection principles and Universal Standards of Social Performance Management at all times.
These standards cover the aspects of responsible financing where transparency, accountability and ethical business practices are strongly intertwined with all aspects of business operations. These not only cover the clients of the business but also the employees, two of the most important stakeholders of the business.
CSR contribution
Sponsorship for Mr. Sachin Dias 12%Environmental Protection and enhancement 36%Donations and charities 17%EDS expenses 29%Special projects for child welfare 6%
The social rating evaluation criteria of M-CRIL
• Governance and strategy
• Monitoring social goals
• HR and responsibility to staff
• Client protection
• Depth of outreach
• Quality of service (Client awareness, feedback on products and client retention)
Sewing clothes - Vavuniya
AFC is chairing and hosting the Finance House Association subcommittee on Microfinance where we have pledged a code of ethics for Microfinance practitioners where they need to adhere to Client Protection Principles.
Empowering PeopleOur strength is our people. We believe that an open, inclusive and stimulating working environment with equal opportunities for career enrichment and enhancement is vital for our success. In this regard we strive to achieve a harassment free workplace and continuous improvement through coaching, training and development. During the year we have provided training opportunities for 35% percent of our employees investing over Rs. 2.3 million. Further details in this regard is included in the Human Capital section on pages 74 to 81.

66
ALLIANCE FINANCE COMPANY PLC | ANNUAL REPORT 2015/16
management discussion & Analysis Contd.
Casestudy:TheStoryofDilani“I joined the Alliance Microfinance programme in 2014, and one of my friends introduced me to the Company. I was interested in starting a small business for myself and with that intention I obtained a loan from the AFC Microfinance Programme. Under their EDS programme they provided us a slipper making training programme conducted by Ms. Swarnakanthi. This training sparked my interest and
I ventured into making ladies’ slippers. I think this was a good decision since I now possess a small shop selling the shoes manufactured by our own workers. I am ever so thankful to AFC for lending me a hand to start up my own business and showing me the way to use the loan in the best possible way through its capacity building programs. The main reason for my success today is the timely support and guidance given to me by AFC.
LED Bulb manufacturing - Kandy
LED Bulb manufacturing - Kandy
PromotingFinancialEmpowermentFinancial empowerment is a powerful tool used to fight poverty. We provide easy and close access to finances for the largely unreached masses at the bottom of the pyramid and also our free financial literacy programme for Microfinance customers enables them to make more prudent financial decisions. This is extremely important at this juncture as multiple borrowing and over-indebtedness of micro borrowers are a growing concern for all. During the year we have reached 66,461 people with access to finance and 231 people with our financial literacy training programme.
Training on financial literacy
CreatingEconomicOpportunitiesOur free Entrepreneur Development Service (EDS) provides a wide range of income generating and business expansion opportunities for our micro borrowers. During this year we have provided 112 such opportunities to 4,477 beneficiaries. This is a significant achievement compared to the previous year where the number of programs conducted were 23 for 783 beneficiaries. The EDS programs conducted during this financial year is given in the table, below.

67
ALLIANCE FINANCE COMPANY PLC | ANNUAL REPORT 2015/16
Training Programme category no. of programs No of beneficiaries
Dress making 17 498
Crop cultivation 14 557
Handbag production 14 411
Slipper production 10 350
Soft skills development 9 670
Animal Husbandry 8 361
LED bulb manufacture 8 280
Financial Literacy 5 231
Food processing 5 204
Dairy products 4 139
Joss stick and candle production
3 210
Tailoring 3 166
Business improvement 2 84
Handicraft 2 82
Beauty parlour/Saloon 2 37
Agri business 1 42
Joss stick production 1 41
Exposure visit 1 35
Slipper production 1 30
Food selling 1 26
Floriculture 1 23
Grand Total 112 4,477
ProvidingEmploymentforYouthWe consider that one of our responsibilities to society is to provide increased employment opportunities for rural youth without access to a regular job. During this year we have recruited 179 youth, mostly young school leavers of rural districts, and provided them with intensive training and then absorbed them into the permanent cadre of the Company.
Groomingtherisingstars–SponsorshipfortherisingyouthsportsstarSachinDiasAFC continued to support the rising badminton star Mr. Sachin Dias for the 3rd consecutive year. He has been the champion of many badminton tournaments held locally and has made it to the Sri Lanka national pool of badminton players, under the Sri Lanka Badminton Association (SLBA). He also won the Bronze medal (Mixed doubles)
at the Youth Olympics in 2014 and his achievements, include many other international tournament victories. He currently holds the 617th position in international badminton rankings and is training for the next Olympic Games.
A big constraint for rising sports champions like Sachin is sourcing funds to expand their horizons through exposure to as many national and international events as possible. Their talent development as well as their ranking depends on the international level exposure they possess. Thus AFC has lent a hand to this young badminton player to reach his potential and expand his sporting skills relieving him of the financial burdens. We consider that this contribution is not exclusively for Sachin but also for the success of badminton in Sri Lanka. AFC provides financial support for Sachin’s education, training, medical requirements, nutrition and participation in national and international tournaments. Notwithstanding all that, AFC has also given him the opportunity to join the AFC family as a staff member. With all the support given to this promising young sportsman, AFC’s desire is to witness him reach the pinnacle of success in the international badminton arena.
EducationalfacilitiesforunderprivilegedschoolchildrenThe Company lent a hand to the Sethmini CSR support Programme of Caritas, to provide essential school facilities to Srivani Tamil Maha Vidyalaya in Rathnapura. The

68
ALLIANCE FINANCE COMPANY PLC | ANNUAL REPORT 2015/16
management discussion & Analysis Contd.
goal of the project was to “improve educational facilities in order to create an educational environment at schools”. The total number of direct and indirect beneficiaries of this project is 867 and the contribution of AFC to this project was Rs. 350,000. The programme includes replenishing the school educational resources, repair or purchase of essential educational items, improvement of water supplies, improvement of sanitation facilities, development of library facilities and organizing seminars and workshops in schools that have not covered the syllabus due to the shortage of teaching staff.
The AFC Monaragala branch has successfully completed a renovation of a computer room and provided green boards and a water filter to the Sri Sumanajothi School of the Okkampitiya village in the Monaragala district which is one of the poorest and remote districts in Sri Lanka.
DonationsandCharitiesDuring the year the Company provided donations, charities and sponsorships for various religious organizations, government bodies, schools, children and elder homes, village projects etc. with the intention of supporting community welfare. Most of these donations and charities are annual allocations where AFC continues to support them for a long period of time.
Donating learning material to a School
These donations are also derived from the Development Fund of the Microfinance division, which is a special fund formulated to provide financial assistance for community welfare activities in working areas.
InstallationofRailRoadCrossingandRailSafetySignsThe private sector plays a key role in helping countries attain developmental goals and national priorities through partnerships and alliances with state and non-state institutions that lack sufficient funds.
In attempts to research ways to align private sector CSR efforts with national priorities for development, improving safety at unprotected rail road crossing was identified as a key area where the private sector could contribute according to the findings, given below:
• 775 unprotected level crossings in the country
• Many deaths and injuries taking place every year due to accidents related to unmanned level crossings
• Accidents - 66 accidents in 2009, 75 in 2010, 82 in 2011, 84 in 2012 and about 67 injuries in 2013
• 20 deaths in 2009, 11 in 2010, 18 in 2011 and 12 in 2012
• Average number of fatalities due to accidents at level crossings is around 15 deaths per year
With the intention of preventing these accidents, AFC contacted the Sri Lanka railway authorities, and the exact need was identified which requires drivers and pedestrians to be aware of ways to read warning lights where bell and light systems have already been installed, and to change people’s behaviour around railroad tracks and crossings.
Operation Lifesavers, an organization operating programs in the US, with a mission to end collisions, deaths and injuries at highway-rail gate crossings was able to reduce rail accidents by 35% in its first year of existence solely by raising public awareness about rail safety.
Alliance Finance Company has taken steps to develop rail crossing and train safety signage to help reduce rail accidents by raising public awareness through materials designed to match the Sri Lankan context. These signs were installed in different areas island-wide covering 20 rail crossing points.
Rail crossing warning boards

69
ALLIANCE FINANCE COMPANY PLC | ANNUAL REPORT 2015/16
Customer and Product ResponsibilityAs a company with 60 of years of experience in providing financial solutions to the population of Sri Lanka, AFC has an exceptional understanding on how to cater to the diverse needs of customers from all walks of life. The Company recognizes the that a loyal customer is a priceless asset and granted excellent service at all times. The Triple Bottom Line approach of the Company also highlights the emphasis on the special position for the customer, without whom the sustainability of the Company would not be possible. Therefore, managing the customer base in a responsible and ethical manner is the mandate of AFC whilst maintaining a transparent and accountable business complying with the Finance Business Act No.42 of 2011 and all relevant laws and regulations within the country.
Customer engagement
AFC continuously engages with customers to identify their needs, clarify their doubts and inquire into their grievances as it aims to provide them the best service. The engagement methods are two-fold.
individual approaches
engagement frequency Mass approaches
engagement frequency
Customer surveys Annually/Bi Annually Regularly
Social Media
Call centre 8 hours x 5 days CSR projects Periodically
Customer care unit
8 hours x 5 days Newspaper advertisements
Periodically
Follow up visits Regularly Press releases and articles
Periodically
Centre meetings (MF)
Weekly Promotional campaigns
As and when required
Open door policy As and when required
The Company recognizes the fact that a loyal customer is a priceless asset that must be given the best of service at all times. The Triple bottom line approach of the Company also highlights the special position taken by the customer, without whom the sustainability of the Company would not be possible

70
ALLIANCE FINANCE COMPANY PLC | ANNUAL REPORT 2015/16
Customer Relationship Management (CRM)
The CRM process of AFC covers the following areas:
• Customer complaint handling
• Customer inquiries handling and follow up
• Staff training on CRM
• Research on applied CRM in the Company
• Monitoring and evaluation
• Rectifying the weaknesses
LodgementofCustomerComplaints
Correction/CorrectiveAction
Reportonthestatus
Periodic Status Reports
Forward Complaints AGM Director
CustomerComplaintHandlingProcess
OperationalUnits/Department/Branches
Investigation
FormalLetters
Correction/CorrectiveAction
Mediation:FinancialOmbudsman/Central Bank
Review & Assessment
Meetings:OnetoOne
Customer Care Desk Structured Customer SatisfactionSurveys
In the above process, a significant emphasis is given to handling customer inquiries and follow up. A centralized Customer Care Desk at AFC Head Office is the initial customer interface is available for the customers to the purpose of lodging complaints. AFC also has an ‘open door’ policy and occupies a transparent process in handling customer complaints.
During the year under review, there were 71 customer complaints compared to 98 in the previous year. Managing all customer complaints in a fair and reasonable manner, AFC was able to address and resolve all complaints within the year.
Customer Satisfaction
AFC’s Quality Management and Customer Care Division conduct well-structured customer satisfaction surveys periodically for the RFS and the Deposit customers. Microfinance Division also conducts customer satisfaction surveys and exit surveys as well periodically to measure the satisfaction levels of the customers along with the reasons for dropout.
These surveys provide valuable insights to the customer needs, new product development ideas, promotional needs, CRM deficiencies, and need for process improvements as well. Therefore, the summary of the analysis of the surveys presented to the Board of Directors in addition as to the respective divisions for review and necessary remedial actions in areas requiring attention whilst maintaining the best practices.
The Product Offering
AFC is engaged in providing an array of financial services including Leasing, Hire Purchase, Gold Loans, Microfinance, Term & Personal Loans, Vehicle Hiring, Fleet Management, Trading and Deposit Mobilization.
management discussion & Analysis Contd.

71
ALLIANCE FINANCE COMPANY PLC | ANNUAL REPORT 2015/16
• Lending: Leasing, Hire Purchase, Microfinance, Gold Loans, Personal Loans, SME Loans, Equipment Leasing, Speed Cash
• DepositMobilization: Fixed Deposits, Savings Accounts
• WorkingCapital: Pledge Loans, Business Loans
• Transportsolutions: Vehicle Hiring
The above diagram portrays the entire product offering of AFC where the core products are Leasing and Hire Purchase, Microfinance and Deposit Mobilization.
Whilst re-launching Top Up Loans and Speed Cash products, the Company introduced the following new products and services during the year:
• SME Loans
• Harvest pledge loans
• Equipment financing
• Leasing for registered two wheelers
• Agri machinery loans
• Soft collateral business loans
All products are offered in compliance with relevant laws, regulations and standards in an ethical manner. A fast-growing network of 87 points of presence, including 40 Microfinance service points, spread across all 9 provinces of the island reaches out to thousands of AFC customers.
Deposits
Working CapitalFinance
Lending
TransportLe
asing
Hire Purch
ase
Gold Lo
an
Micr
ofi nance
Plati
num
Advance
Pledge Lo
an
Savings Accounts
Speed Cash
Fleet Management
Operati ng Lease
Hire Vehicles
service Quality
AFC strives to maintain the highest levels of service quality by adhering to local and international standards as well as industry best practices. With regard to Microfinance business, Client Protection Principles and Universal Standards of Social Performance Management are two international standards the Company endorses and complies with. Such adherence to international standards ensures responsible business operations including enhanced service quality that is in line with AFC’s Triple Bottom Line philosophy.
Numerous service quality oriented activities were carried out during the year. These include:
• Customer opinions and ideas
• Meetings
• Internal audit visits
• Customer satisfaction survey
• Customer exit survey – Microfinance
• Daily interactions
• Stakeholder engagement survey
• Staff training on customer care and relationship management
• The Call Centre provides customers advance notices on payments, providing them ample time to manage their repayments and thereby avoiding any consternation
• Website and social media tools to increase awareness and maintain transparency
• ‘Mystery Shopper’ initiative to spot check the current engagement levels and rectified the deficient areas

72
ALLIANCE FINANCE COMPANY PLC | ANNUAL REPORT 2015/16
management discussion & Analysis Contd.
Marketing Communication
Marketing, brand management and promotional campaigns are governed by the Business Development Division of the Company. The year under review saw a host of different promotional campaigns, events and initiatives being conducted geared to take the Company’s communication to the target audience in an efficient, cost-effective manner.
The Marketing Mix of the Company utilized the following methods for efficient communication.
• Events
• Social media
• Print media
• Website
• Direct marketing
• Banners, brochures and leaflets
• E-mail campaigns
• Door-to-door promotions
• Sponsorships
The leasing market has been extremely competitive with banks and finance companies alike striving to capture market share. AFC introduced a “Supiri Riya Pola”, an island-wide campaign during the year to promote the Company’s leasing product, whilst creating many tie-ups with reputed motor vehicle importers. Embracing this highly-segmented approach, the Company pursued a series of similar tie-ups during the year to promote AFC’s product range amongst the general population.
AFC Riya Pola AFC Riya Pola
AFC Riya Pola AFC Riya Pola
Strategic partnerships established with leading vendors across the country with a system monitored platform was a notable endeavour undertaken during the year. Whilst capitalizing on the growing demand for second-hand vehicles, these measures would provide the ideal position for AFC to explore the promising potential of the rural and semi urban markets, in the years ahead. Following the tie-in with the other strategic partners in the value chain, an increase was observed in customers seeking financing facilities for micro products. Structured products with value additions and tailor-made packages to suit varied client segments is yet another marketing initiative embarked on during the year.
Paper advertisements were a major information dissemination and promotion mode that was adopted during the year. Meanwhile, branch
re-branding was carried out both in and out of Colombo whilst the various AFC events conducted island-wide also boosted the Alliance Finance brand name.

73
ALLIANCE FINANCE COMPANY PLC | ANNUAL REPORT 2015/16
responsible and ethical Business Operations
Integrity, accountability and transparency are all key features in the way AFC conducts business operations. As a responsible corporate entity, the Company endeavours to build a business that upholds the highest standards of ethics and responsible financing.
Product and Service Labelling
Detailed attributes of the offered products, such as rates, fees, instalments, charges, are all disclosed to the customer before the transaction takes place so that potential customers can make an informed decision, considering the entire gamut of information made available. Similarly for Fixed Deposits, information such as interest rates and benefits are clearly displayed so that the customer has a clear understanding of AFC’s offering. AFC Microfinance Division discloses the nominal as well as effective interest rates to their customers as a measure of added transparency.
Customer Privacy
As all customer information is collected through Know Your Customer (KYC) forms, AFC has access to customers’ personal information. The Company respects the customers’ right to privacy and is fully committed to protect the confidentiality and security of their personal information. AFC has a policy of not using such information for any commercial purpose, without the consent of its customers in question. All employees are regularly made aware of their obligations in terms of protecting the privacy of customer information and are guided by the Company’s customer privacy policy. Punitive action will be taken on employees or any third party in the case of any breach or intentional losses arising from such misuse.
Relevant preventive measures are in place such as having frequent backups of all vital information as a part of its IT policy whilst information security and controls are also a key aspect of the Company’s risk management and internal control process.
Anti-corruption
There are well-established internal controls and operating procedures to prevent any corrupt, unlawful or improper activities or transactions from taking place and also to ensure that customers are protected from such unethical practices. In the AFC Code of Ethics, it is explicitly prohibited for employees to be involved in any form of bribery or corruption activity. All employees are made aware of the Code of Ethics during the Induction Programme conducted at the inception of their recruitment. All investigations and disciplinary procedures relating to corruption are handled in a formal and transparent manner and it is reinforced by incorporating same in the employment contracts. The Company has also inculcated a culture and a process to encourage whistle blowing, as a part of its effort towards exposing practises that could arise causing corruption.
Anti-competition
The Company closely follows the monetary policy and market conditions, changes and behaviours in designing and pricing the products. The pricing of the products are carried out in a manner not to enjoy undue advantage of the market conditions. Branding and promotional activities are also carried out in an ethical manner based on the qualitative aspects without focusing on the pricing attributes.
During the year under review, the Company was not charged and not subject to legal action regarding anti-competitive behaviour, anti-trust, monopoly practices or their outcomes.

74
ALLIANCE FINANCE COMPANY PLC | ANNUAL REPORT 2015/16
management discussion & Analysis Contd.
Human CapitalA strong and dedicated workforce is the heart of AFC without which the Company would not have succeeded for 60 years. We give utmost importance to have an enthusiastic and vibrant work teams at all levels. Accordingly, AFC has set aside a significant allocation of time and effort to create the HR policies and practices that enable the Company to attract and hire the best talent whilst developing and retaining them in the organization.
The Company recognizes that implementing HR best practices increases its probability of achieving these objectives. As a result, the Company has compiled a comprehensive set of policies which is used to handle all HR related matters. These policies outline procedures to be followed in relation to recruitment, training, professional and career development, professional conduct, promotion, succession and performance evaluation, amongst many others. The HR Policies are regularly reviewed so that AFC is able to provide an above-industry-standard offering to all employees, thereby increasing its chances of attracting and retaining the best talent.
All employees are given a set of well-defined Key Performance Indicators that are aligned to the Company’s strategic, corporate and operational objectives. This guarantees that when each employee achieves his/her KPIs, the Company as a whole is able to reap the benefits, together with the employees.
Employee Engagement AFC is of the strong belief that consistent, meaningful engagement with the employees is of paramount importance to the well-being of the Company. It ensures that the employees carry out their responsibilities in an efficient, professional manner whilst maintaining a consistently high quality. As a result, the Company engages with employees as follows:
engagement method Frequency
Management meetings and target evaluation meetings Monthly
Open door policy All the time
Performance appraisals Annually
Corporate Planning Annually
BCMS and ISO trainings Periodically
Intranet Regularly
E-mails and memos Regularly
Networking events Periodically
Internal training and development sessions Periodically
Branch/division level short meetings Periodically
Individual/ small group feedback sessions Regularly
Employee satisfaction survey Annually
Employee exit interviews As required
Employee Management At AFC, managing employees primarily focuses on creating a healthy work environment where employees:
• can perform at their optimum level• can continuously develop their knowledge• are presented with challenging tasks and projects• are rewarded and recognized for their achievements• are able to envision a clear career path
Therefore, the Company has outlined the following areas related to employees’ aspects and concerns as well as those of the organization.
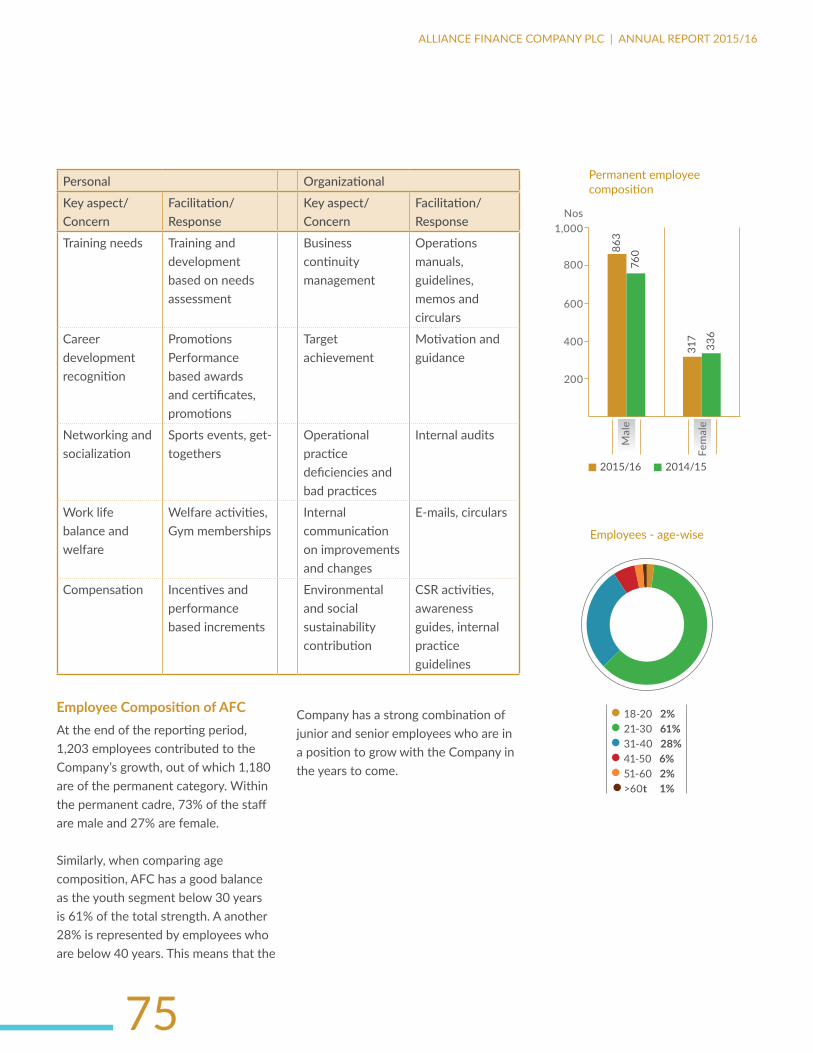
75
ALLIANCE FINANCE COMPANY PLC | ANNUAL REPORT 2015/16
Personal Organizational
Key aspect/Concern
Facilitation/response
Key aspect/Concern
Facilitation/response
Training needs Training and development based on needs assessment
Business continuity management
Operations manuals, guidelines, memos and circulars
Career development recognition
Promotions Performance based awards and certificates, promotions
Target achievement
Motivation and guidance
Networking and socialization
Sports events, get-togethers
Operational practice deficiencies and bad practices
Internal audits
Work life balance and welfare
Welfare activities, Gym memberships
Internal communication on improvements and changes
E-mails, circulars
Compensation Incentives and performance based increments
Environmental and social sustainability contribution
CSR activities, awareness guides, internal practice guidelines
EmployeeCompositionofAFCAt the end of the reporting period, 1,203 employees contributed to the Company’s growth, out of which 1,180 are of the permanent category. Within the permanent cadre, 73% of the staff are male and 27% are female.
Similarly, when comparing age composition, AFC has a good balance as the youth segment below 30 years is 61% of the total strength. A another 28% is represented by employees who are below 40 years. This means that the
Company has a strong combination of junior and senior employees who are in a position to grow with the Company in the years to come.
600
800
1,000nos
200
400
Mal
e
Fem
ale
2015/16 2014/15
Permanent employee composition
336
317
863
760
Employees - age-wise
18-20 2%21-30 61%31-40 28%41-50 6%51-60 2%>60t 1%

76
ALLIANCE FINANCE COMPANY PLC | ANNUAL REPORT 2015/16
management discussion & Analysis Contd.
The total workforce by employees and supervised workers
Employees 70%Supervisory Staff 30%
RecruitmentandRetentionAFC is an equal opportunity employer and therefore demonstrates no bias whatsoever towards any gender, ethnic group or religion in relation to recruitment. The Company’s HR policy clearly states that all new recruits to the organisation would be evaluated on their qualifications, experience, competencies and value creation ability for the job role in question. This is followed strictly giving all candidates equal opportunity for selection for a given job role as long as they meet the criteria for it. The Company follows the same approach in terms of employee retention.
As the Company continues to expand operations, the year has shown a steady rise in the number of employees. Total number of employees as at 31st March 2016 stood at 1,203, up from the 1,096 at the end of the 2014/15 financial year. There were 340 new recruits, out of which the majority (78%) were males, to suit the business segment they are to be deployed in.
The below table illustrates the composition of the permanent employee cadre of the Company in terms of the designations.
Grade Count
Directors 3
CXOs 3
Assistant General Managers
12
Senior Managers 7
Managers 50
Assistant Managers 94
Senior Executives 88
Executives 450
Junior Executives 443
Minors 14
Trainees 16
Grand Total 1180
The total employee composition and governance body composition by gender, age, religion and race are illustrated below.
Turnover composition - gender
Male 70%Female 30%
Employee composition and governance body composition by race
Muslim 1%Sinhala 85%Tamil 14%
The management always prefers to have a diversity in its workforce within the Company. In the current cadre, 75% employees are Buddhists whilst the rest belong to Christianity, Hinduism, Islam and Roman Catholicism.
Employees - religion-wise
Buddhist 75%Christian 3%Hindu 11%Islam 1%Roman Catholic 10%
As at 31st March 2016, there were 172 supervisory staff and 1,031 supervisees in the Company.

77
ALLIANCE FINANCE COMPANY PLC | ANNUAL REPORT 2015/16
Recruitment composition - age-wise
Below 20 Years 15%21-30 Years 70%31-40 Years 8%41-50 Years 2%Over 50 Years 5%
Recruitment Policy Diversity in employees brings with it different strengths to the organization and helps make the workforce a stronger collective unit. AFC is always willing to employ individuals from different geographical locations, religions, ethnic groups as it enables the employees better relate to the customers they service.
During the year, of the total cadre 40% of the employees were from the Western Province, whilst the 60% of the employees are equally distributed amongst all provinces of the country.
RemunerationPolicyRemuneration of all employees is strictly linked to the individual’s performance during a given period based on Key Performance Indicators (KPIs) communicated to the employee at the beginning of the said period.
To spearhead AFC’s future growth ambitions, it is imperative that the
Company attracts the best talent available in the market and also has in place relevant HR-related policies, systems and processes that is able to clearly identify and retain the best talent. As a policy, the Company offers a salary which is well-above the regulatory requirements at the entry level. Additionally, the Company also offers the following benefits.
nos
200
100
300
400
500
east
ern
saba
raga
muw
a
sout
hern
nor
th C
entr
al
Nor
th W
este
rn
Cen
tral
Wes
tern
nor
ther
n
uva
The total workforce by location
141
476
76
94 89
68
94 84 81
EmploymentBenefits• Enhanced 20% contribution to PF by
Employer• Incentives as entitled• Performance-based bonuses• Annual increments• Travelling/Fuel allowances • Mobile allowances as entitled• Gratuity• Medical scheme• Festival advances• Subscriptions for professional
associations• Educational expenses reimbursement• Staff Loans
The table below shows the ratio of basic salary and remuneration for women and men by employee category.
employment Type Count
Ratio - M :F
Director 3 1:0
CXO 3 1:0
Assistant General Manager
12 1:0
Senior Manager 7 91:9
Manager 55 81:16
Assistant Manager
97 92:8
Senior Executive
91 80:20
Executive 455 91:9
Junior Executive 446 65:35
Minor 18 88:12
Trainee 16 1:0
Grand Total 1,203

78
ALLIANCE FINANCE COMPANY PLC | ANNUAL REPORT 2015/16
management discussion & Analysis Contd.
EmployeePromotionAFC’s recruitment policy gives preference to internal recruitment in the event of a vacancy that needs to be filled. This is in line with the Company’s employee retention strategy where regular promotions have been identified as a key criterion in sustaining employee motivational levels.
During the year 2014/15, 71 employees were promoted from across the country, paving the way for them to move up the corporate ladder and realise their career goals.
The promotions of the Company during the year under purview is illustrated in the below table. As shown, 71 promotions had been granted to the employees in the Company during the year.
From To CountManager Senior Manager 1Assistant Manager Manager 9Senior Executive Assistant Manager 5Executive Assistant Manager 1Executive Senior Executive 20Junior Executive Senior Executive 3Junior Executive Executive 32Total 71
Training and Development Training and development is a key component of AFC’s HR Policy. The Company’s HR Division spearheads all training aspects on a regularly based on the Company’s expectations as well as the requirements from the management and relevant divisions. A comprehensive, systematic training and development plan that addresses all the skills gaps that have been identified is collated at the beginning of each year. This plan helps fulfil all the training needs of the employee and will provide them with all the necessary knowledge and skills to carry out their duties and responsibilities in a proper manner and contribute to the Company’s value creation process.
InductionProcessAll new recruits at AFC have to undergo an Induction Programme which provides them with valuable insights into the Company’s rich history, corporate culture, products and services as well as overall operational framework. The new employees are also familiarised with the Company’s Code of Conduct and are given a copy of the Employee Handbook that outlines all employment related procedures and staff entitlements.
MicrofinanceinFocusWith the Company’s greater emphasis on Microfinance in its business model, special attention is given to enhance the knowledge and service in Microfinance and raise it to international standards. Therefore, a comprehensive 3-month training programme has been introduced for all employees in the Microfinance cluster together with the Sri Lanka Institute of Credit Management. This Diploma programme is developed in the consultation with Microsave – an Indian based consultancy service specialised in Microfinance.
Training and Development Highlights
No. of staff that participated in training programs
423
No. of training programme conducted
43
Total Investment for the training programs as at 31st March 2016
Rs. 2.3 Mn
Total of training hours (Internal/External)
3,570
Average training hours per employee
8.4
Minor
JuniorExecutive
Executive
SeniorExecutive
Assistant Manager
Manager
Senior Manager
AGM
CXO
3
5
20
32
9
1
1

79
ALLIANCE FINANCE COMPANY PLC | ANNUAL REPORT 2015/16
The Company carried out a total of 43 training programs for the year with a greater emphasis on Business Operations and Marketing as well as Soft Skills Development. A total of 423 employees were trained through these programs during the year.
Average hours of trainings per year per employee, by gender and employee category
employment Type Training Hrs. Gender - M Gender - FDirector CXO 61.5 61.5 Assistant General Manager
308.85 284.85 24
Senior Manager 162.5 154.5 8Manager 1042.5 906.5 136Assistant Manager 668 546 122Senior Executive 314 226 88Executive 464 143 321Junior Executive 532 83 449Minor Junior Executive - Grade I
34 2 32
Trainee
During the year, the Company conducted a total of 43 training programs for 423 individuals at a total cost of Rs. 2.3 million. Total number of training hours totalled to 3,570 with the average training hours per employee recording 8.4 hours for the year.
Internal and External Training
internal External
Total no. of staff that participated in training programs
134 289
Total no. of training hours
850 2,720
Average of training hours
6.3 9.4
134 staff members received internal training totalling 850 hours whilst 289 staff members received a total of 2,720 training hours from external sources. This translated into an average of 6.3 hours of internal training per employee for the year as against 9.4 hours of external training.
MajorCategoriesofTrainingsOfferedTraining Category no. of programs No. of participants Business operations/ Marketing 8 108Business strategy 4 22Customer care 3 38HR 3 7IT/Software 2 57Business continuity management 2 25Soft skills development 7 16Other 14 150Total 43 423
Innovative thinking and product innovation workshop by Christopher Hier – 2015 April
Training by employee category
CXO 7%AGM 9%Sn. Manager 7%Manager 20%
Asst. Manager 15%Sn. Executive 13%Executive 16%Jn. Executive 10%

80
ALLIANCE FINANCE COMPANY PLC | ANNUAL REPORT 2015/16
management discussion & Analysis Contd.
Breakfast Meeting with MD
NewHRInitiativesAFC’s HR Division is constantly considering ways to enrich the working lives of employees. Some of the initiatives implemented in 2015/16 are given below.
HR Policy Revision
The following areas of the HR Policy were revised as part of an effort to boost employee welfare.
Funeral Support Policy
Funeral support policy was revised to improve the employee participation in welfare matters whilst also providing enhanced benefits
Vehicle Loan Policy
New vehicle loan policy was formulated and implemented during the year
360 Degree Evaluation Programme
360 feedback programme was launched as part of the emphasis on leadership development within the Group. Initially, this programme was initiated for senior management team covering CXOs and AGMs and will be extended to other employee levels in the coming financial year.
Employee Networking Events Staff Get-together events During the financial year under review, AFC continued with its tradition of providing employees the platform to interact with colleagues in other branches and departments through various events.
AFC Microfinance 2nd Anniversary Celebrations
AFCChristmasonWingsFor the first time in AFC’s history, a Christmas Carols evening and an Inter-Divisional Christmas Decoration Competition was held in December 2015. This was organized by the Sports Committee of the Company and drew a emphatic response from all divisions.
Christmas Carols
Decoration Competition
Breakfast Meeting with MD
This quarterly event is a forum that highlights the level of transparency that AFC believes in nurturing. At this event, a selected group of employees from across various divisions and branches of the Company are offered the chance to meet the Managing Director for an open discussion. They are given complete freedom to bring forward with new ideas and suggestions, air grievances and obtain clarifications. All matters are carefully noted down and appropriate follow-up actions are taken in a timely manner.
Breakfast Meeting with MD

81
ALLIANCE FINANCE COMPANY PLC | ANNUAL REPORT 2015/16
Talent Management Programme and Succession Planning Programme
During the year, the talent management and succession planning framework was presented to the Board of Directors for their valued feedback. Whilst the policy, process and related forms have been finalized, the said programme will be launched with talent review discussions from June 2016 onwards.
Automating Staff Performance Management system
The Automated PMS System module, which will help streamline and accelerate the performance management process within all divisions of the Company, was successfully tested during the year. It will be implemented in year 2016/17.
Introduction of Incentive Schemes
The following incentive schemes were introduced during the year to recognize employees with superlative contributions in achieving Company objectives.
Microfinance Monthly Performance Incentive Scheme
This covers employee categories of branch OICs and Field Executives.
RFS – Monthly Marketing Expense (Performance based)
Monthly marketing expenses are determined by individual performance linked to individual achievement of set financial targets and NPL.
AdherencetoBestPracticesAFC adheres to the global best practices with regard to employee welfare and adherence has been established as a key element in the policies of the Company. These best practices include those related to employee health and safety, fair compensation, non-discrimination, avoidance of workplace harassment, avoidance of forced labour and protection of human rights. All employees are bound to abide by these provisions given in the policies by written consent.
All employees are provided with an insurance cover to support them in the event of hospitalization. The Company also abides by all legal requirements governing employee management. One of these includes providing the required number of maternity leave. During the year, 19 female employees were on maternity leave and 74% reported back to work after completing their leave period.
All AFC offices are designed, constructed and maintained in a manner that takes into account ergonomic best practices, thereby guaranteeing employee safety inside the office premises.
All offices are equipped with fire prevention tools, accessories, extinguishers and have clearly marked emergency exits in the event of any emergency evacuation. An annual fire safety training including a fire drill is conducted for all employees to refresh their knowledge, awareness and readiness for emergencies. All offices are also equipped with First Aid and medication in the event of a medical emergency or injury.
During the year, there have been no incidents reported in terms of discrimination, freedom of association, child labour or forced labour, or any malpractices that threatens the security of the employees of the Company.

82
ALLIANCE FINANCE COMPANY PLC | ANNUAL REPORT 2015/16
management discussion & Analysis Contd.
Our Environmental Footprint - “Greener And Cleaner Environment”Our aim is to reduce the use of natural resources and seek greener alternatives that make our planet a better place to live in for our future generations. During this year we have undertaken several initiatives towards achieving this goal.
EnergyConservationGoing forward in line with the global movement for energy conservation, AFC has doubled its efforts to optimize energy usage by implementing various activities and practices. As a part of that initiative in November 2015, normal bulbs were replaced in selected places at the Head Office with LED bulbs to optimize energy usage. In addition, as a practice, AFC installed energy efficient air conditioners in the office premises in all its branches including the head office. In addition, in 2016 March AFC took a major step to increase its focus on energy conservation by making a pledge, referred to as the “AFC Green Pledge” to reduce the energy consumption of the Company by 5% by the end of 2016/17 financial year.
Another major activity AFC initiated during the year was the Earth Hour celebration with the cooperation of the Colombo Municipal Council. This event included an awareness walk and a
donation of 500 LED bulbs to light up the Viharamahadevi Park. In this instance too we made the Green Pledge signifying the contribution we would make to saving the environment.
• 20 deaths in 2009, 11 in 2010, 18 in 2011 and 12 in 2012
• Average number of fatalities due to accidents at level crossings is around 15 deaths per year
With the intention of preventing these accidents, AFC contacted the Sri Lanka railway authorities, and
it was identified that what is actually needed is to make drivers and pedestrians aware of how to read
warning lights where bell & light systems have already been installed, and to change people’s behavior
around railroad tracks and crossings.
Operation Lifesavers, an organization operating programs in the US, with a mission to end collisions,
deaths and injuries at highway-rail grade crossings was able to bring down rail accidents by 35% in its
first year of existence solely by raising public awareness about rail safety.
Alliance Finance Company has taken steps to develop rail crossing and rain safety signage to help
reduce rail accidents by raising public awareness through materials designed to match the Sri Lankan
context. These signs were installed in …………………………… areas covering …………… number of rail
crossing points.
Our environmental footprint - “Greener and cleaner environment”
Our aim is to reduce the use of natural resources and seek greener alternatives that make our planet
a better place to live in for our future generations. During this year we have undertaken several
initiatives towards achieving this goal.
Energy Conservation
Going forward in line with the global movement for energy conservation, AFC has doubled its efforts
to optimize energy usage by implementing various activities and practices. As a part of that initiative
in November 2015, normal bulbs were replaced in selected places at the Head Office with LED bulbs
to optimize energy usage. In addition to that, as a practice, AFC installs energy efficient air conditioners
in the office premises in all its branches including the head office. In addition, in 2016 March AFC took
a major step to increase its focus on energy conservation by taking a pledge, called the “AFC Green
Pledge” to reduce the energy consumption of the company by 5% by the end of 2016/17 financial
year.
AFC Pledge of the year
EnergyconsumptionWhilst implementing initiatives to optimize energy consumption, AFC also monitors on the usage of energy to monitor the consumption levels in order to identify more avenues to achieve the best energy saving methods. The frequently used of energy in the Company during day-to-day operations is electricity and fuel. Electricity is used in abundance to power up computers, photocopiers, printers and other appliances, for air conditioning and lighting. The energy consumption of the Company has been monitored during the year for the usage only at the Head Office.
2015/16 2014/15
Energy used within the Organization (Kwh) 404,723 Not monitored
Energy used outside the Organization (Kwh) Not monitored Not monitored
Total Energy usage (Kwh) 404,723 Not monitored
The fuel consumption of the Company has also been monitored during the year for the usage only at the Head Office. However measures were taken to monitor the usage at branches as well. The main items for consumption were client visits, business visits, traveling between branches, training visits and to power up generators.
2015/16 2014/15
Energy used within the Head Office of the Organization (Litres)
16,149 Not monitored
Energy used outside the Organization (Litres) Not monitored Not monitored
Total Energy usage in the Head Office (Litres) 16,149 Not monitored

83
ALLIANCE FINANCE COMPANY PLC | ANNUAL REPORT 2015/16
Climatechange/Globalwarming/EmissionsreductionThree Wheeler Emission reduction solution- In support of global efforts on decelerating global warming, AFC has embarked on research to develop a tool kit to reduce threewheeler emissions. We have entered into a joint partnership agreement with Vialle of Netherlands, a renowned emission reduction gas kit manufacturer in Europe, in July 2015 and three threewheeler units were sent from Sri Lanka and are being tested at the Vialle research division. If this partnership proves successful we will have a significant impact on emission and pollution in most major cities in South East Asia. In Sri Lanka alone there are 1.2 million three-wheelers polluting its major cities on a daily basis.
Carbon dioxide in the atmosphere
Carbon is released into the atmosphere when fossil fuels are burned
used in photosynthesis to produce carbohydrates
decaying plants produce
Carbon Dioxide in fossil fuels (coal+oil)
Carbon Dioxide in decaying matter and waste
carbon is released into the atmosphere during respiration
plants are eaten by animals
TreeforLeaseInitiativeIn order to minimize the indirect negative impact of our business solutions, we have embarked on a “Tree for a lease” project and during this year we have planted 14,000 long term forest trees that are of high carbon value in the catchment of the Daduru-oya reservoir. We will expand the project to cover over 100,000 plants during the next five years. Reforestation
not only purifies the air by absorbing large quantities of CO2 from the atmosphere but also replenishes natural resources, enriches soil, reduces erosion and enhances water retention of reservoirs and improves the micro-climate, making the future planet a cleaner and greener one.
EmissionreductionthroughchangedleasingmixThe leasing vehicle mix of AFC was largely composed of three wheelers in previous years. However, during the year 2015/16, the leasing mix has been intentionally changed providing priority to four wheelers and two wheelers. These efforts were supported by focused marketing and promotional strategies as well. As a result the vehicle mix has changed significantly.
When three vehicle types are considered, the emission levels are as follows, based on the emission test details available.
CO&CO2(%v/v)andHC(ppmv/v)ofdifferentvehicletypesatidlingandaccelerated
Vehicle Type idle HC idle Coidle Co2 acc HC acc Co
acc Co2
Motor Cars 288.5 1.03 13.47 216.41 0.95 13.86
Motor Cycles 1748.11 2.48 7.08 1456.67 2.55 7.13
Tricycles 2492.05 2.67 7.59 2091.63 2.75 7.80Source: Lakruwan, K.A.S. and Weerasinghe, T.K. 2013. A Study of Petrol Vehicle Emission Levels in Sri Lanka (Page 02). Environmental Studies Unit, Open University of Sri Lanka.
According to the study above the highest emission levels are from threewheelers and the lowest from fourwheelers when comparing the three types. Thus based on these results we can conclude that the changed vehicle mix of the Company has also made a significant contribution towards lowering emission levels. The changing vehicle mix is shown in the graph below. The Company’s strategy involves continuing to promote more two wheelers and four wheelers and to maintain a balanced mix, whilst introducing new green solutions for three wheelers as well.
2,000
4,000
6,000
8,000rs. Mn
Two
Whe
eler
s
Thre
e W
heel
ers
2014/15 2015/16
Vehicle leasing portfolio mix
860
483
5,18
6
7,86
0
5,79
6
5,89
6
Four
W
heel
ers

84
ALLIANCE FINANCE COMPANY PLC | ANNUAL REPORT 2015/16
MovingTowardsa“PaperlessOffice”The Company had undertaken many measures in the past year to reduce paper usage within the office.
1. Substitution of mailing 1st and 2nd reminder letter with SMS2. Customer document scanning instead of maintaining physical files3. Double side printing enabled printers4. Creating awareness in employees with regard to the efficient usage of paper
and the necessary to avoid unnecessary printing (A note on this is embedded in the AFC e mail signature)
5. Reducing the paper size of the letters sent to customers – In this way the paper usage for those letters are reduced by half
6. Paper recycling AFC has also taken steps to recycle the 5,370 kg of waste paper used during the
past year, thereby making a total environmental contribution/saving as follows.
• 91 fully grown Trees
• 9,424 litres of Oil
• 21,480 kWh of Electricity
• 170,659 litres of Water
• 16 cubic meters of Land filling
• Reduced greenhouse gas emission
management discussion & Analysis Contd.

85
ALLIANCE FINANCE COMPANY PLC | ANNUAL REPORT 2015/16
Support Servicesrecoveries A crucial aspect of the sustainability of an organization is the availability of a strong recovery process. Having a robust process is vital to maintain the NPL at low levels, especially in the face of uncertain economic situations and aggressive growth scenarios that occur on a periodic basis, which may result in the NPL spiking up to intolerable levels.
The Recoveries Division was established in the 2014/15 financial year as a separate functional unit that brought with it an integrated approach to the recovery process. During the course of its operational existence, the centralized recoveries function was able to successfully create greater value through specialization whilst allowing the branch offices to take pragmatic and prompt decisions with regard to certain aspects where they consider themselves to be better informed.
TheProcessWhilst regular reminders are sent to customers for loan repayments, there are occasions when the loan repayments are delayed to the point where it exceeds to 6 months in arrears. Such facilities are then directed to a special recovery unit. This unit is tasked with following up on rentals, issuance of letters of demand, investigations, re-scheduling of payments and, if required, repossession of assets.
When carrying out branch and staff appraisals, the Company takes into consideration the performance in terms of recoveries and non-performing portfolios. This is aligned with the incentive scheme which takes into account the recoveries and NPLs achieved during a designated period. Such an aligning of performance in terms of recoveries with KPIs outlined at the beginning of the year has many benefits. It helps to motivate the staff to achieve a higher level of performance whilst also encouraging the right mix of caution, discipline and professionalism in their day-to-day activities.
Managing Timely RecoveriesIn addition to recoveries and assessing the credit-worthiness of customers, Recovery Field Officers are also trained to establish strong, professional relationships with their customers. The Company believes that such bonds also play a key role in ensuring that customers make loan repayments on time. Along with this, the Company has implemented a robust monitoring system that is geared to identify facilities with greater chances for default. This allows the Company to make necessary adjustments and take adequate precautions to prevent these facilities from becoming non-performing ones.
For the Microfinance sector, where facilities of lesser value are granted to customers in rural areas, there continues to be a trend where such facilities are less prone to default. Whilst a number of reasons could be attributed to this trend, it has resulted in an exceptionally low level of NPLs in the Microfinance sector. However, it must be noted that servicing such a large base of Microfinance customers with relatively lower value facilities is a significant challenge for the Company’s staff due to the large volume of customers. This requires the Company to constantly make efforts to bolster and integrate the service to such customers in order to provide service excellence and maintain the low level of NPLs.
As a socially responsible organisation, the Company is confident that its approach of leveraging its strong relationships with customers and educating them on the importance of a sound credit history will continue to bring about positive results in the future.
TargetsandAchievements
Key Objective for 2015/16 Progress/Status
Reduction of NPL levels Achieved with merits. The current NPL ranges around 2.5% compared to 8.3% in the previous year
Implementation of a new MIS system in 2015/16 year
Will be developed along with the main system development.

86
ALLIANCE FINANCE COMPANY PLC | ANNUAL REPORT 2015/16
management discussion & Analysis Contd.
The year under review can be termed as one of the most successful years in the history of the Company in the context of recoveries. By using a carefully planned out, systematic approach, the Company was able to make huge strides in all areas of the Division’s activities.
KeyHighlightsoftheYear• Install a centralized Recovery
operation under the AGM’s purview to streamline operations and speed up the recovery process
• Introduced Regional Recovery Executives covering an island-wide branch network. This has helped establish a more coordinated, professional follow-up mechanism that is in keeping with the Division’s objectives.
• Established a proper recovery hierarchy to streamline recovery operations.
• Establish a professional Call Centre mechanism to introduce a customer friendly recovery process. This has resulted in the customers developing a more favourable perception of the Company.
• Advanced Call Centre software provided timely reminders in order to render the recovery process more efficient.
• Disposed of a large repossessed yard stock
• AFC’s continued focus on enhancing human capital resulted in the Recoveries Division was able to conduct several training / awareness programs to enhance recovery knowledge. Such training also helped
foster team spirit and boost motivational levels of the results-driven Recovery Team.
• Enhanced Recovery staff welfare via salary increments, incentives etc.
• Maintained 60-70 % Current Recovery Ratio
• Maintained Overall Recovery Ratio in the 50% range
• Maintained 2.5% NPL ratio
Future FocusWhilst considerable progress has been made on all fronts during the year, AFC will continue to strive to develop processes for speedy recovery actions via a synergistic approach that liaises with both Recoveries and Legal divisions as both divisions need to work closely to accelerate the recovery process. Additionally, the target would be to improve the current recovery ratio to 80% and maintain the overall recovery ratio to over 60% to be on par with market levels.
TreasuryEstablished in December 2014, the Treasury Division uses its internal expertise in reading the market, gaining market entry in a timely manner and availing itself of arbitrage opportunities thereby enabling the Company to improve its revenue. It is also tasked with increasing the sources of funding, with proprietary trading, as well as with managing the maturity mismatches arising from short-term financing to long-term lending in its attempt to sustain the Company’s margins. The Treasury Division is headed by an Assistant General Manager – Treasury, who is supported by an Assistant Manager – Treasury and two executives who conduct the operational aspects.
The Treasury function is overseen by the Assets and Liabilities Management Committee (ALCO) which holds the overall responsibility of managing the Assets and Liabilities of the Company. By providing the necessary information in relation to interest rates and carrying out liquidity gap analysis, stress testing on rate sensitive assets and liabilities as well as stress testing on liquidity gaps, the Treasury facilitates ALCO to discharge its duties effectively. The Company’s Asset and Liability Management (ALM) policy is approved by the ALCO and the Board of Directors, and is reviewed annually.
Targets and achievements
Key Objective for 2015/16 Progress/Status
Adoption of a fund transfer policy Completed
Pursuit of foreign funding Was successful in obtaining two funding facilities (Details below)

87
ALLIANCE FINANCE COMPANY PLC | ANNUAL REPORT 2015/16
Sourcing Foreign Currency FundingThe year under purview can be described as a period of remarkable success for the Division as it made significant progress in several areas. One of the key objectives set out for the Treasury Division at the beginning of the financial year was the optimisation of the Company’s funding mix. During the year, the Division was able to successfully acquire foreign funding amounting to a total of USD 10 million, a first for the Company. The large monetary value obtained clearly emphasizes the confidence that the two organizations that provided these loans have in the current operations of AFC and the future direction of the Company. The two loans include:
• USD 5 million from Commercial Bank of Ceylon PLC – Bangladesh
• USD 5 million from Triodos Bank – Netherlands. Triodos Bank is an organization that is stringent in investing in companies that achieve a best-in-class combination of social, environmental and economic performance. As a result they follow a comprehensive research and selection process in order to clearly identify whether a Company meets all their criteria prior to investing.
KeyHighlightsoftheYear• Successful implementation of Tenor
Based Funds Transfer Pricing Policy within the Company, paving the way to centralize the Interest Rate Risk and the Liquidity Risk to the Treasury Division
• Measurement and management of Interest Rate Risk, Liquidity Risk & Exchange Rate Risk of the Company after centralizing the said market risks
• Reduction of the liquidity mismatch in the short-term maturity bucket by 50%
• Corporate funding sought over short-term retail funding, reduction of liquidity & re-pricing mismatch in the Balance Sheet
• Joined the Sri Lanka Inter-Bank Payment System (SLIPS); the online interbank electronic fund transfer system catering mainly for low-value payments.
• The full benefit of the External Commercial Borrowing Scheme (ECBS) was utilized for the year under relaxation of Exchange Control Regulations. The USD 10 million per annum expired on 31st December 2015.
• Total Borrowings of the Company grew by Rs. 5,575 million.
• The Balance Sheet growth of Rs. 5,883 million during the year was mainly funded by Treasury funding sources
Future FocusEncouraged by its successful efforts during the financial year, the Company will continue to pursue foreign funding in order to boost AFC’s funding levels for investing in future expansions. As always, such sourcing will be carried out in a systematic manner in alignment with the Country’s Monetary Policy.
Whilst foreign funding is one avenue the Company is pursuing for increased funding levels, AFC understands the risks that such a move poses due to the volatile nature of foreign exchange rates. Therefore, there will be a concerted effort to improve the retail customers’ deposit base in order to reduce the concentration risk. Additionally, AFC intends to obtain longer term funding whenever such an opportunity presents itself, since as such funding will have a lesser impact on immediate cash flows.
Similarly, the Company will consider other mechanisms, such as carrying the optimum interest rate mismatch and effectively managing the exchange rate risk, during the year. All such mechanisms will ultimately ensure that there are sufficient funds for investing in current business units and any future expansions that are in the pipeline. These are areas that are vital for the Company’s sustenance in today’s fast-evolving, competitive business environment. As always, gearing the Balance Sheet optimizing the profitability of the Company will be carried out through the ALM and ALCO processes already in place.

88
ALLIANCE FINANCE COMPANY PLC | ANNUAL REPORT 2015/16
management discussion & Analysis Contd.
internal audit The Internal Audit Division was setup during the 2014/15 financial year in recognition of the need for a more in-depth approach to the vital aspect of internal control. The Division reports directly to the Board Audit Committee (BAC) and systematically carries out a comprehensive Internal Audit programme that includes audits
of the activities of all operational units of the Company across the various geographical regions. Periodical reviews of all Internal Controls are also an important responsibility of this division.
AuditApproachAFC has adopted a risk-based audit approach, following the best practices provided by the Institute of
Internal Auditors. The three-phased audit process consists of planning, performing and reporting. As a part of the audit plan, the Internal Audit Division has drawn its audit universe, which outlines all possible audits that emerge from the Company’s operating environment, strategic plan and internal processes.
InternalAuditreportingstructure
(15) (1)
(1) (6) (6)
(2) (2) (3) (4) (3)
HOD-IAD
BAC
Senior Executive Executive Junior
Executive HeadOffice RegionalOffice
Junior Executive
Junior ExecutiveExecutiveExecutiveAudit
Officer
MGR Audit -GRAMEENMGR Audit-RFS
89
ALLIANCE FINANCE COMPANY PLC | ANNUAL REPORT 2015/16
RoleoftheDivisionThe functions of the internal audit team encompass all operational levels of the Company and all branches. Such in-depth auditing is of paramount importance in evaluating the robustness of internal operations and in identifying any areas that need to be improved. These functions are given below.
• A thorough examination and evaluation of the adequacy and effectiveness of the internal control systems during various operations and activities of the Company
• A review of the application and effectiveness of risk management procedures and risk assessment methodologies during various operations and activities of the Company
• A review of the management and financial information systems, including the electronic information system
• A review of the accuracy and reliability of the Company’s accounting records and financial reports
• Testing of both transactions and functioning of specific internal control procedures at various departments, offices and branches
• An evaluation of the adherence to legal and regulatory requirements and approved policies and procedures
• An evaluation of the effectiveness of existing policies and procedures and the provision of recommendations for improvements
• An identification of opportunities for cost saving and making recommendations for improving cost efficiencies
• Examining to ensure that resources are acquired economically, used efficiently and safeguarded adequately in keeping with the Company culture
• The carrying-out of special investigations assigned by the Audit Committee as and when needed However, it must be noted that the head and staff of the Audit Department are not allowed to:
- Perform any operational duties for the Company outside Audit Division function.
- Initiate or approve accounting transactions external to the Audit Division.
- Direct the activities of any Company employee not employed by the Audit Division, except to the extent that such employees have been appropriately assigned to auditing teams or have been assigned to otherwise assist the internal auditors.
Audit ProcessIn line with the International Professional Practice Framework (IPPF), the audit methodology at AFC operates in two modes that is via ongoing monitoring and separate evaluations. As a part of on-going monitoring, the audit revolves around monitoring the effectiveness of internal controls
that include regular management, supervisory activities, comparisons and reconciliation. Separate evaluations seek to draw inferences about the consistency of the operation of controls through sample verifications.
TypesofAuditDetailed reviews Based on samplesAll major processes at a given location, such as branch operations are reviewed based on the samples selected using risk assessment.
limited reviews Based on samplesSelected major processes such as recoveries, collection and banking are reviewed based on the samples selected in accordance with risk assessment.
special audit reviewsSpecial audits are spontaneous in nature and are scheduled upon request by the Board of Directors or by situational factors that are discovered during risk assessments.
Below is a graphical presentation of the operational areas identified in each location that are covered in the AFC’s audit approach.
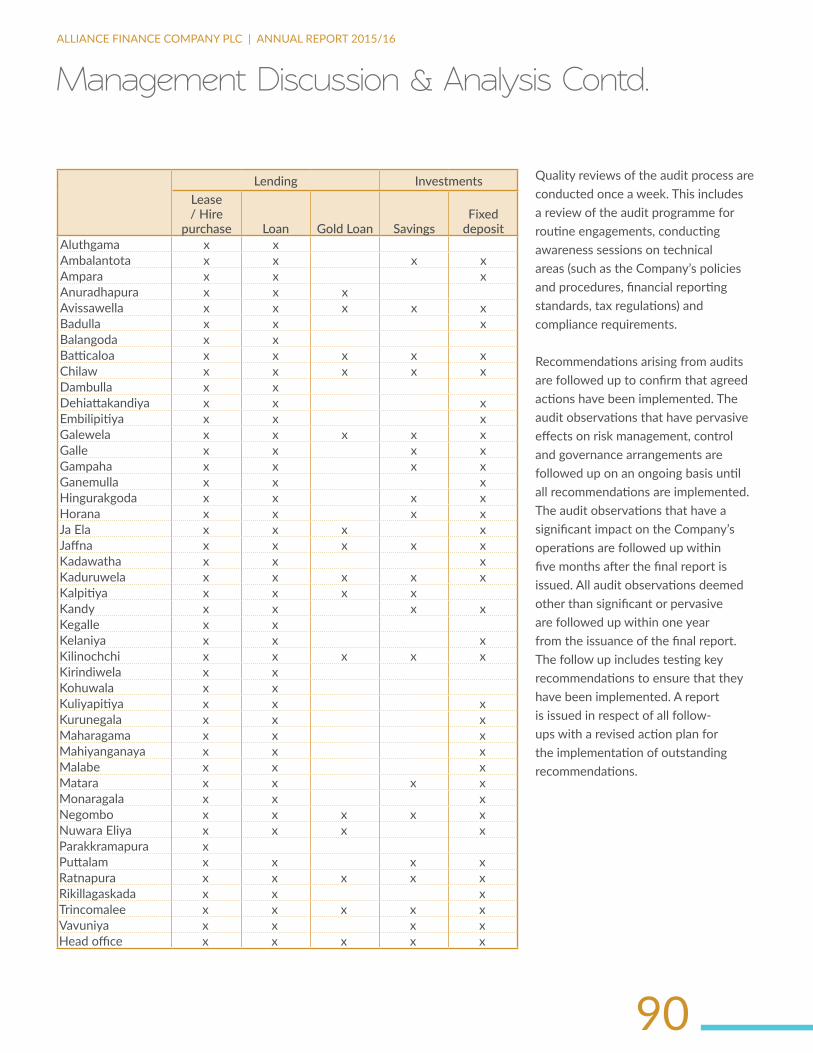
90
ALLIANCE FINANCE COMPANY PLC | ANNUAL REPORT 2015/16
management discussion & Analysis Contd.
lending investmentslease / Hire
purchase loan Gold loan savingsFixed
depositAluthgama x x Ambalantota x x x xAmpara x x xAnuradhapura x x x Avissawella x x x x xBadulla x x xBalangoda x x Batticaloa x x x x xChilaw x x x x xDambulla x x Dehiattakandiya x x xEmbilipitiya x x xGalewela x x x x xGalle x x x xGampaha x x x xGanemulla x x xHingurakgoda x x x xHorana x x x xJa Ela x x x xJaffna x x x x xKadawatha x x xKaduruwela x x x x xKalpitiya x x x x Kandy x x x xKegalle x x Kelaniya x x xKilinochchi x x x x xKirindiwela x x Kohuwala x x Kuliyapitiya x x xKurunegala x x xMaharagama x x xMahiyanganaya x x xMalabe x x xMatara x x x xMonaragala x x xNegombo x x x x xNuwara Eliya x x x xParakkramapura x Puttalam x x x xRatnapura x x x x xRikillagaskada x x xTrincomalee x x x x xVavuniya x x x xHead office x x x x x
Quality reviews of the audit process are conducted once a week. This includes a review of the audit programme for routine engagements, conducting awareness sessions on technical areas (such as the Company’s policies and procedures, financial reporting standards, tax regulations) and compliance requirements.
Recommendations arising from audits are followed up to confirm that agreed actions have been implemented. The audit observations that have pervasive effects on risk management, control and governance arrangements are followed up on an ongoing basis until all recommendations are implemented. The audit observations that have a significant impact on the Company’s operations are followed up within five months after the final report is issued. All audit observations deemed other than significant or pervasive are followed up within one year from the issuance of the final report. The follow up includes testing key recommendations to ensure that they have been implemented. A report is issued in respect of all follow-ups with a revised action plan for the implementation of outstanding recommendations.

91
ALLIANCE FINANCE COMPANY PLC | ANNUAL REPORT 2015/16
TargetsandAchievements
Key Objective for 2015/16 Progress/Status
Increase the scope of current audit monitoring system
Scope has been expanded in ongoing monitoring.
Launch regional audit offices
Virtual Regional Audit offices have been established for 07 regions for Microfinance.
The setting up of Regional Audit Offices in Kandy, Ambalangoda, Vavuniya, Anuradhapura and Badulla was a notable success that brought with it several benefits including the reduction of costs and the improvement of audit quality.
With the consultation of the corporate management, a Balanced Scorecard mechanism was introduced during the year in order to educate the Company personnel on the importance of an internal control system and to generate awareness of the serious impacts that could arise to the Company, Department or individual as a result of any violations that may occur.
The audit process was further enhanced to a level where it provides almost real-time reporting for several crucial, high risk areas. This provides the corporate management with the necessary up-to-date information to make better decisions.
iT and Knowledge Management AFC values information capability as a strategic asset, which is also the medium through which organisational knowledge is disseminated within the Company. The Company understands that the IT landscape changes at a rapid pace and therefore the IT Division is geared to make the necessary adjustments and improvements to keep the organisation abreast of the latest technologies and tools that would benefit both the employee and the customer.
Through the IT Division, AFC also has in place a dedicated team of analysts tasked with providing the information required for decision making. Additionally, the Company fosters a culture where employees are encouraged to provide new ideas and suggestions to improve the technology and knowledge base during one-to-one discussions and meetings with the senior management.
Information management plays a key role in the organisational learning process. As a part of the knowledge management process, employees are also encouraged to provide suggestions for improvements in their respective areas during their performance appraisals, which are then screened, evaluated and submitted for further consideration in preparing the annual plan. Knowledge Management and Information Security are also integral parts of the Company’s business continuity management plan.
KeyHighlights• Number of audits conducted during
the year
• RFS – 132 (RFS branches, Gold Loan Centres, Process audits)
• MF – 157
• The internal audit team has commenced setting up of regional virtual audit offices to improve audit quality and cost efficiencies. Accordingly, 5 audit offices in the following areas have already been set up:
• Kandy
• Vavuniya
• Ambalangoda
• Anuradhapura
• Badulla
Future FocusDuring the upcoming financial year, plans are underway to fine-tune the entire internal audit process further so that operations will be able to seek and acquire productive consultation as and when required. This would further enhance the internal audit process by bringing in trusted experts from outside the Audit Division or the Company.
Whilst the audit process continues to improve regularly, one of the main drawbacks continues to be the inability to share the audit observations on a real-time or close to real-time basis in order to assist the management to make key decisions based on these observations. In order to make this goal a reality, the Company is looking at ways to bring in technology that will play a role in taking this information sharing process to the next level.

92
ALLIANCE FINANCE COMPANY PLC | ANNUAL REPORT 2015/16
management discussion & Analysis Contd.
IT PolicyIn a systematic and coherent approach to collect, organise, summarise, analyse, and store data that provides useful insights and information, facilitating prompt and well informed decisions, the Company has drawn a comprehensive IT policy. This IT policy consists of a set of clear guidelines in relation to:
• Safety of software and hardware
• Information security and backup
• Monitoring and privacy
• Data retention
• Protecting Intellectual Property
• Fair use
This ensures that all relevant data has been stored and archived in a systematic manner so that it can be retrieved easily if required for management decisions, whilst the data storage and retrieval process continues to be monitored and strengthened.
In order to ensure IT security and soundness of IT security controls, the Company carries out periodical Information system audits. The last audit was held on the 25th of March 2016 and the next audit will be conducted on the 18th of April 2016 by TechCERT Company Limited.
AFC has laid the foundation and created the conditions to expand Information Communication Technology infrastructure needs in a manner that it could be scaled up or down to meet the immediate business need.
TargetsandAchievements
Key Objective for 2015/16 Progress/Status
Design and implement a new ERP system
Assessments were initiated during the year to find a suitable vendor to provide a state-of-the-art ERP system that can accommodate both core business and Microfinance
KeyHighlightsoftheYearAs a part of the Company’s capacity building exercise, AFC sees greater potential in using IT as a key driver of its new business strategy and is exploring means of using the latest IT platforms to provide faster, more convenient and superior customer service. Accordingly, during the year, AFC made a significant investment to strengthen its IT infrastructure.
• The entire AFC system operation has been upgraded to the BLADE CENTER / Virtualized environment which is a state-of-the-art technology that will make AFC’s IT infrastructure more robust, efficient and scalable.
• With the introduction of the BLADE SERVER Solution, AFC has commenced real-time replication of most of the applications by availing itself of a hot site at a remote location away from the
immediate hazards that may be prevalent in the primary site. The adopted technologies support the immediate continuity of all essential Company functions which have been automated in the event of a system failure or any natural disaster.
• AFC also commenced the process of upgrading the manual file approval process of Leasing/Hire Purchase operations to an Automated File Approval Process. This will ensure that customers enjoy a faster service as the internal approval process will be accelerated significantly, allowing the teams in all branch locations to provide feedback to the customer within a shorter period of time.
• The AFC Microfinance System has been integrated to Mobitel’s m-Cash facility. m-Cash is a service approved by the Central Bank of Sri Lanka and offered by Mobitel which provides customers with the facility to perform a wide array of financial transactions using their Mobitel phone anytime, anywhere. It is both easy to use and ensures the safety of their transactions. Using the m-Cash facility, AFC’s Microfinance customers can transfer their loan repayments directly to the Head Office in an easy and secure manner.
Future FocusAFC will continue to optimise the existing systems by improving the current Management Information System of the Company where necessary, especially in business intelligence. This will allow management to make timely, accurate decisions

93
ALLIANCE FINANCE COMPANY PLC | ANNUAL REPORT 2015/16
based on the information provided, thus boosting the probability of the success of such actions. Additionally, the Company will pursue the acquisition of new and advanced technologies in order to gain a competitive advantage by providing customers with greater convenience and excellence of service.
Given the global trend towards hacking and other similar security breaches, the Company will emphasize more on addressing growing information security concerns that are becoming increasingly widespread. The objective is to exceed the standards and expectations of information security and privacy set by the Central Bank of Sri Lanka and set the gold standard in such areas in the Sri Lankan financial sector.
AFC will continue to leverage technology in order to provide customers with a timely, reliable and consistent service, irrespective of the location of the customer, be it in the heart of the capital city or in the remotest parts of the island.
Business Development and Marketing The Marketing Division of AFC focuses on providing customer convenience through a variety of delivery channels and on taking the Company’s products and services to the customer in order to further enhance customer value. Over the years, this approach has served the organization well and the onus is always to build upon the Company’s rich history and heritage of shaping the finance industry in the country through innovation.
The Company’s steadfast enthusiasm for innovation and excellence has fuelled steady growth and success during the course of the 2015/16 financial year, duly supported by corporate and branch brand activities. Whilst all marketing activities conform to and even exceed all statutory requirements, a key area of focus was increasing branch business volumes and improving the profitability of branches which yielded significant results. Now more than 90% of branches are profitable.
The events and promotional initiative details are discussed under the heading “Marketing Communications” in the “Customer and Product Responsibility” section on pages 69 to 63 of this Annual Report.
The year 2015/16 will be recalled as another successful year for the marketing efforts of AFC. Several initiatives reaped positive results and contributed to enhancing the corporate image in the eyes of the customer base whilst also translating into financial rewards for the Company.
KeyHighlightsoftheYear• AFC developed regional-level
centralized marketing plans to provide a better impetus to marketing efforts in each region. Accordingly, carefully thought-out marketing campaigns were carried out throughout the year to maximise impact and deliver better results.
• Branch Corporate identity was formulated with a single visual presence during the year.
• New customer acquisitions continued at a steady pace throughout the year, fuelled by effective marketing campaigns that generated customer interest.
• Key business segments of AFC continued to demonstrate the upward trend witnessed in recent years.
• The Marketing Division, which is primarily based in the Head Office, liaised closely with regional offices and branches in order to obtain a better grasp of the products and services required island wide. Accordingly, marketing campaigns were localised to suit the language and culture of each region, thereby ensuring greater success.
• The Vehicle dealer network was strengthened and the overall business introducer channels were improved.
• Great emphasis was laid on strengthening relationships with existing customers whilst building a solid foundation with newly-acquired customers.
• Cost-effective marketing tools, such as “AFC E-alert” was introduced to update Customers on all events, notices and activities connected with Alliance Finance Co. PLC via SMS or email services.

94
ALLIANCE FINANCE COMPANY PLC | ANNUAL REPORT 2015/16
Future Focus• The Marketing Division has outlined
various steps that have to be taken to elevate the standard of marketing efforts further within AFC.
• All employees will be instilled with a thorough understanding of marketing-orientation. Business development and customer focus will be two important attributes that they will require in their day-to-day work at AFC.
• As media goes through a substantial transformation, especially due to the proliferation of social media tools, AFC will aggressively pursue an approach of leveraging these tools belonging to the new media in order to promote the Company’s products and services in a more cost-effective manner to both existing and prospective customers.
• Employees in the front line will continuously be trained in customer care so that customers’ needs are carefully considered and handled promptly and professionally at all times.
• All employees, especially those in direct contact with the customer, will be encouraged to foster their relationships with the customer base in a professional manner. This will allow the Company to diversify the customer base and offer products and services to new segments of society. Such close relationships will be utilised to increase awareness of the corporate brand which continues to reach new heights every year.
• Whilst the Company continues to excel on several fronts, there will be a renewed focus on translating such levels of excellence into tangible achievements by way of bagging more awards in annual award ceremonies organized by various organizations.
• Cross selling of AFC products and services from the existing customer base will be encouraged in order to maximise business volumes.
• AFC understands the need to connect with the needs of our customers from different parts of the island. As a result, there will be a greater effort to carry out industry-focused marketing campaigns targeting customers in different regions of the country.
• The Company will keenly follow the fast-changing market scenario in order to anticipate changes well in advance so that preventive action can be taken to maintain portfolio quality.
• AFC recognizes the importance of retaining loyal customers by giving them special attention at every instance they interact with the organization. As a result, such loyal customers will be well looked after by way of attractive reward schemes, sponsorships for events and invitations for special events amongst many other schemes.
• There will be a concerted effort to strengthen the brand image of AFC as the pioneer LFC in the country. Both mass media and the new
media will be used extensively to drive this powerful message to the target audience. Additionally, mass media and research will be used to determine the current awareness levels of the corporate brand.
• Company-related news and information will be disseminated methodically using public relations.
The Company intends to grow through deeper relationship with existing clients as their trusted financial solution provider by catering for growth whilst developing new targeted relationships to increase market penetration. With those initiatives in place, AFC will continue to increase their market share in each business line.
legalThe Legal Division works closely with the Recoveries Division in managing the recovery process in a professional manner at all times ensuring that AFC’s best interests are taken care of. The division’s primarily role is to drive the recovery of bad debts passed on by the Recoveries Division by filing legal action against the customer. Additionally, the division also undertakes a host of other functions such as providing legal opinions where necessary, drafting and attesting Mortgage Bonds, Lease Agreements or any other Notary related work and filing any other legal action to safeguard the Company’s best interests.
management discussion & Analysis Contd.

95
ALLIANCE FINANCE COMPANY PLC | ANNUAL REPORT 2015/16
Targetsandachievements
Key Objectives for 2015/16 Progress/Status
Reaching the collection target of Rs. 60 million
Achieved. (Written off – Rs.15 million, Provisioning – Rs.45 million) through court settlement and out-of-court settlements.
Writs to be executed per month for the value of Rs. 1 Million
Achieved and ongoing.
Legal action to be filed within 7-14 working days after been transferred to Legal Department
Achieved and ongoing.
Keyhighlightsoftheyear• The Division handled a legal portfolio of 1,823 contracts through in-house
lawyers by taking the necessary legal steps in a timely manner. Such prompt action aided in speeding up the recovery process which translated into a considerable amount of savings of legal expenses.
• 884 new actions (In District Court/Commercial High Court/Magistrate Court) filed during the year
Future FocusDue to long time lag for trials on DHP actions, the Legal Division has shifted attention to providing the option of out-of-court settlements to customers with the aim of fast tracking the recovery of Bad Debts. Along with this approach, there will be a concerted effort to work closely with the Recoveries Division to strengthen the recovery process in order to achieve the above objective.

96
ALLIANCE FINANCE COMPANY PLC | ANNUAL REPORT 2015/16
GeographicFootprintAFC’s further expanded its outreach by adding several Points of Presence during the year under review.
By the end of the financial year, AFC has a total of 87 Points of Presence including the service centres located in Colombo 07 and Rajagiriya.
37 fully-fledged branches
21 Microfinance service locations
16 Gold Loan centres
13 Collection centres
Out of the 87 Points of Presence, 61 are located outside the Western Province. Of these 61 locations, representing 50% (30 locations) in rural parts of the island where the Company strives to better the lives of the marginalized communities living in those areas through financial inclusion via Microfinance services.
The Microfinance Division has increased its outreach by completing a landmark 40 business locations including 21 dedicated Microfinance service centres and 10 centres which operated within to the fully-fledged branches.
Branch Composition
20
40
80
60
2012
2013
2014
2015
2016
28
0
11
25
34
4
26
8
35
16
19
10
37
21
16
13
100%
Fully pledged branchesMicrofinanceGold Loan centresCollection centres and other
JaffnaThirunaweli
Chankanai
ChawakachcheriChunnakam
Point PedroNelliady
Kilinochchi
Mulativu
Parakramapura Town
VavuniyaTrincomalee
Medawachchiya
Anuradhapura Kantale
Kalpitiya
Puttalam HingurakgodaGalgamuwa
Nikawaratiya
KuliyapitiyaKurunegala
KaduruwelaDambulla
Galewela
Matale
Kandy
RikillagaskadaNawalapitiya
Nittambuwa
Godakawela
Ratnapura
Homagama
Kaduwela
Avissawella
Nuwara Eliya
KegalleGaligamuwaNegombo
Ja-elaPugodaKirindiwelaKadawathaKandana
GanemullaGampaha
Kohuwala
Piliyandala
KelaniyaMaharagama Malabe Athurugiriya
PanaduraHorana
Aluthgama
Ambalangoda
Galle
Kalutara
ChilawDehiattakandiya
Batticaloa
Kaluvanchikudy
AmparaMahiyanganaya
Badulla
Bandarawela
WelimadaHattonMonaragala
Wellawaya
TissamaharamaEmbilipitiya
Ambalanthota
Balangoda
Matara
Akuressa
During the year, 14 Gold Loan branches were amalgamated with the fully-fledged branches rendering greater convenience to customers whilst increasing employee productivity and presenting them with the opportunity to engage in cross selling. Similarly, another 3 Gold Loan centres were amalgamated with Microfinance branches with the same objective.
Whilst 5 Gold Loan centres were ceased operations due to their low performance and the necessity to reduce operational costs, during the same period 5 new Microfinance business locations, 2 fully-fledged branches and 3 new collection centres have been established.
management discussion & Analysis Contd.
Deniyaya
H/O

97
ALLIANCE FINANCE COMPANY PLC | ANNUAL REPORT 2015/16
no Location Province address Telephone no Product Offer1 Head Office Western No. 84 Ward place Colombo
07011-2673673 Lease, Hire Purchase, Term Loans,
Deposits, Quick Cash, Microfinance 2 Dambulla Central 738, Anuradhapura Rd,
Dambulla066-5704707 Lease, Hire Purchase, Term Loans,
Deposits3 Galewela Central 10, Kurunegala Road,
Galewela066-5704705 Lease, Hire Purchase, Term Loans,
Deposits, Gold Loans4 Kandy Central 207, Katugastota Road,
Kandy081-5740800 Lease, Hire Purchase, Term Loans,
Deposits, Microfinance 5 Nuwara Eliya Central 08, Ramanathan Complex,
Park Road, Nuwara Eliya052-5720000 Lease, Hire Purchase, Term Loans,
Deposits, Gold Loans6 Rikillagaskada Central 48, Ragala Road,
Rikillagaskada081-5637513 Lease, Hire Purchase, Term Loans,
Gold Loans7 Matale Central 273, Trincomalee Street,
Matale.066-5679212 Gold Loans
8 Nawalapitiya Central No. 70/C, Gampola RD, Nawalapitiya
071-0201824 Microfinance
9 Hatton Central 68/4, Samupiyasa Bld, Hatton
051-5276620 Lease, Hire Purchase, Term Loans
10 Ampara Eastern No. 12/E/1 & 12/E/3, D S Senanayake Street, Ampara
063-5119595 Lease, Hire Purchase, Term Loans, Deposits, Microfinance
11 Batticaloa Eastern 267, Trincomalee Road, Batticaloa
065-5677513 Lease, Hire Purchase, Term Loans, Deposits, Gold Loans
12 Trincomalee Eastern 47, Central Road, Trincomalee
026-5676512 Lease, Hire Purchase, Term Loans, Deposits, Gold Loans, Microfinance
13 Dehiaththakandiya Eastern P30, New Town, Dehiaththakandiya
027-5678312 Lease, Hire Purchase, Term Loans
14 Kaluvanchikudy Eastern Hospital Rd, Kaluvanchikudy 071-0201828 Microfinance 15 Trincomalee Eastern 95/2, Beach Rd, Trincomalee 071-0201817 Microfinance 16 Kanthale Eastern 115, Main Street, Kanthale 071-0201830 Microfinance 17 Anuradhapura North Central 282/3, Maithripala
Senanayake Mw, Anuradhapura
025-5673342 Lease, Hire Purchase, Term Loans, Deposits, Gold Loans, Microfinance
18 Hingurakgoda North Central No. 11, Airport rd, Hingurakgoda
027-5678512 Lease, Hire Purchase, Term Loans
19 Parakramapura North Central 319/B, Padaviya, Parakramapura
025-5624812 Lease, Hire Purchase, Term Loans
20 Galgamuwa North Central 349,Anuradapura Rd, Galgamuwa
071-0201837 Microfinance
21 Chilaw North Western 29, Bridge Street, Chilaw 032-5745600 Lease, Hire Purchase, Term Loans, Deposits, Gold Loans, Microfinance
22 Kaduruwela North Western 894, Batticaloa Rd, Kaduruwela
027-5703333 Lease, Hire Purchase, Term Loans, Deposits, Gold Loans
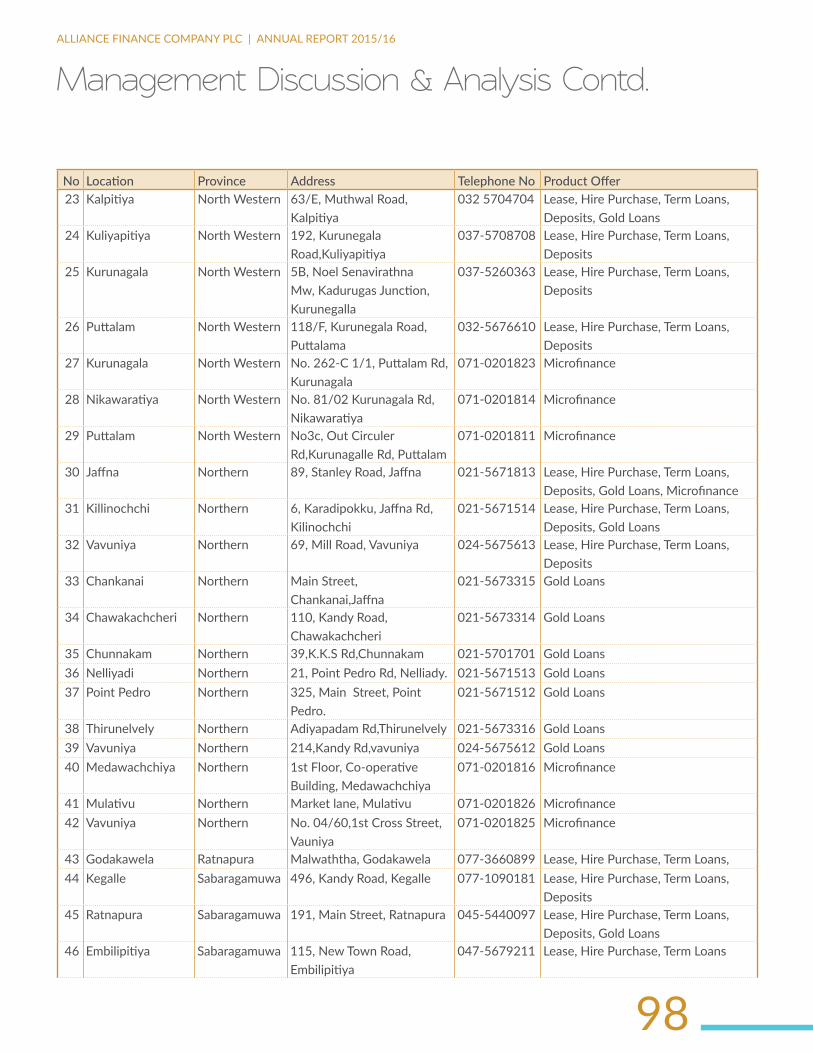
98
ALLIANCE FINANCE COMPANY PLC | ANNUAL REPORT 2015/16
no Location Province address Telephone no Product Offer23 Kalpitiya North Western 63/E, Muthwal Road,
Kalpitiya032 5704704 Lease, Hire Purchase, Term Loans,
Deposits, Gold Loans24 Kuliyapitiya North Western 192, Kurunegala
Road,Kuliyapitiya037-5708708 Lease, Hire Purchase, Term Loans,
Deposits25 Kurunagala North Western 5B, Noel Senavirathna
Mw, Kadurugas Junction, Kurunegalla
037-5260363 Lease, Hire Purchase, Term Loans, Deposits
26 Puttalam North Western 118/F, Kurunegala Road, Puttalama
032-5676610 Lease, Hire Purchase, Term Loans, Deposits
27 Kurunagala North Western No. 262-C 1/1, Puttalam Rd, Kurunagala
071-0201823 Microfinance
28 Nikawaratiya North Western No. 81/02 Kurunagala Rd, Nikawaratiya
071-0201814 Microfinance
29 Puttalam North Western No3c, Out Circuler Rd,Kurunagalle Rd, Puttalam
071-0201811 Microfinance
30 Jaffna Northern 89, Stanley Road, Jaffna 021-5671813 Lease, Hire Purchase, Term Loans, Deposits, Gold Loans, Microfinance
31 Killinochchi Northern 6, Karadipokku, Jaffna Rd, Kilinochchi
021-5671514 Lease, Hire Purchase, Term Loans, Deposits, Gold Loans
32 Vavuniya Northern 69, Mill Road, Vavuniya 024-5675613 Lease, Hire Purchase, Term Loans, Deposits
33 Chankanai Northern Main Street, Chankanai,Jaffna
021-5673315 Gold Loans
34 Chawakachcheri Northern 110, Kandy Road, Chawakachcheri
021-5673314 Gold Loans
35 Chunnakam Northern 39,K.K.S Rd,Chunnakam 021-5701701 Gold Loans36 Nelliyadi Northern 21, Point Pedro Rd, Nelliady. 021-5671513 Gold Loans37 Point Pedro Northern 325, Main Street, Point
Pedro.021-5671512 Gold Loans
38 Thirunelvely Northern Adiyapadam Rd,Thirunelvely 021-5673316 Gold Loans39 Vavuniya Northern 214,Kandy Rd,vavuniya 024-5675612 Gold Loans40 Medawachchiya Northern 1st Floor, Co-operative
Building, Medawachchiya071-0201816 Microfinance
41 Mulativu Northern Market lane, Mulativu 071-0201826 Microfinance 42 Vavuniya Northern No. 04/60,1st Cross Street,
Vauniya071-0201825 Microfinance
43 Godakawela Ratnapura Malwaththa, Godakawela 077-3660899 Lease, Hire Purchase, Term Loans, 44 Kegalle Sabaragamuwa 496, Kandy Road, Kegalle 077-1090181 Lease, Hire Purchase, Term Loans,
Deposits45 Ratnapura Sabaragamuwa 191, Main Street, Ratnapura 045-5440097 Lease, Hire Purchase, Term Loans,
Deposits, Gold Loans46 Embilipitiya Sabaragamuwa 115, New Town Road,
Embilipitiya047-5679211 Lease, Hire Purchase, Term Loans
management discussion & Analysis Contd.

99
ALLIANCE FINANCE COMPANY PLC | ANNUAL REPORT 2015/16
no Location Province address Telephone no Product Offer47 Balangoda Sabaragamuwa No. 141/A, Bans
Rathwaththa MW, Balangoda071-0201822 Lease, Hire Purchase, Term Loans,
Microfinance48 Galigamuwa Sabaragamuwa Galigamuwa Town,
Galigamuwa071-0201810 Microfinance
49 Ambalanthota Southern 127 A, Main Street, Ambalanthota
047-5703703 Lease, Hire Purchase, Term Loans, Deposits
50 Galle Southern 41 A, Sri Dewamiththa Mw, phiana Galle
091-5625262 Lease, Hire Purchase, Term Loans, Deposits
51 Matara Southern 276, Anagarika Dharmapala Mw, Nupe, Matara
041-5419677 Lease, Hire Purchase, Term Loans, Deposits
52 Aluthgama Southern No.124, Galle Road, Aluthgama
034-5703787 Lease, Hire Purchase, Term Loans, Deposits
53 Ambalangoda Southern No. 61/1, Elpitiya Road, Bogahawatte, Ambalangoda
071-0201818 Microfinance
54 Galle Southern No. 201, Wakwella Road, Galle
071-0201812 Microfinance
55 Akuressa Southern 93, Market Rd, Akuressa 071-0201835 Microfinance 56 Thissamaharamaya Southern 15/13, Multi-Purpose
Co-operative Society, Thissamaharamaya
071-0201838 Lease, Hire Purchase, Term Loans
57 Deniyaya Southern Edirisinghe Opticals, Deniyaya
041-5001500 Lease, Hire Purchase, Term Loans
58 Badulla Uva 49, Cocowatta Road, Badulla 055-5633512 Lease, Hire Purchase, Term Loans, Microfinance
59 Mahiyanganaya Uva 56, Ampara Road, Mahiyanganaya
055-5639612 Lease, Hire Purchase, Term Loans, Microfinance
60 Moneragala Uva 470 A, Hulandawa Junction, Monaragala
055-5747512 Lease, Hire Purchase, Term Loans
61 Bandarawela Uva 250, B/1, Badulla Road, Bandarawela
057-5119119 Lease, Hire Purchase, Term Loans
62 Welimada Uva No. 37/01, Hemapalamunidasa MW, Welimada
071-0201806 Microfinance
63 Wellawaya Uva No. 51, Ella RD, Wellawaya 071-0201819 Microfinance 64 Avissawella Western 49, Ratnapura Road,
Avissawella036-5704705 Lease, Hire Purchase, Term Loans,
Deposits, Gold Loans65 Gampaha Western 30, Yakkala Road, Gampaha 033-5673801 Lease, Hire Purchase, Term Loans,
Deposits, Microfinance 66 Ganemulla Western 291, Kadawatha Road,
Ganemulla033-5108108 Lease, Hire Purchase, Term Loans,
Deposits67 Horana Western 330, Panadura Road, Horana 034-5672613 Lease, Hire Purchase, Term Loans,
Deposits, Quick Cash

100
ALLIANCE FINANCE COMPANY PLC | ANNUAL REPORT 2015/16
management discussion & Analysis Contd.
no Location Province address Telephone no Product Offer68 Ja-Ela Western 60, Negombo Road, Ja-Ela 011-5234372 Lease, Hire Purchase, Term Loans,
Deposits, Microfinance 69 Kadawatha Western 433/A, Ganemulla Road,
Kadawatha011-5742742 Lease, Hire Purchase, Term Loans,
Deposits, Microfinance 70 Kelaniya Western 52, Thorana Junction, Kandy
Road, Kelaniya.011-5234913 Lease, Hire Purchase, Term Loans,
Deposits71 Maharagama Western 221/A, High Level Road,
Maharagama011-5219212 Lease, Hire Purchase, Term Loans,
Deposits72 Malabe Western 888, Athurugiriya road,
Malabe011-5927827 Lease, Hire Purchase, Term Loans,
Deposits73 Negombo Western 6 A, Station Road, Negombo 031-5677513 Lease, Hire Purchase, Term Loans,
Deposits, Gold Loans74 Kohuwala Western 178, Dutugemunu Street,
Kohuwala011-5888777 Lease, Hire Purchase, Term Loans,
Trading75 Athurugiriya Western 123/2, Kaduwela rd,
Athurugiriya.011-5230412 Gold Loans
76 Horana Western 89,Anguruwathota Rd,Horana
034-5672612 Gold Loans, Microfinance
77 Ja-Ela Western No. 34, Negambo Road,Ja-Ela.
011-5747519 Gold Loans
78 Kaduwela Western No497,Avissawella Rd,Kaduwela.
011-5747600 Gold Loans
79 Kandana Western 37,Negambo Rd,Kandana 011-5234813 Gold Loans80 Kelaniya Western No1004A,Vihara
mw,Kelaniya011-5747512 Gold Loans
81 Panadura Western 77,D.S.Senanayaka Rd,Panadura.
038-5673812 Gold Loans
82 Piliyandala Western No15,2nd Cross Rd,Piliyandala
011-5747515 Gold Loans
83 Homagama Western No. 200/A/1/1, High level Rd Galawilawatta, Homagama
071-1058701 Microfinance
84 Kaluthara Western No. 07,Galle Road, Kalamulla, Kaluthara
071-0201808 Microfinance
85 Nittambuwa Western No. 404/01, Negambo Rd, Nittambuwa
071-0201810 Microfinance
86 Kirindiwela Western No. 30, Veyangoda Road, Kirindiwela
033-2224144 Lease, Hire Purchase, Term Loans
87 Pugoda Western 98G 2/1, Mandawala Rd, Pugoda
071-0201834 Microfinance

101
ALLIANCE FINANCE COMPANY PLC | ANNUAL REPORT 2015/16
Gri indicator Description Page No. SectionsTraTeGY anD analYsisG4-1 Statement of the Chairman and the MD 18-29 Chairman and MD reviewORGANIZATIONAL PROFILEG4-3 Name of the organization 6 About the Company G4-4 Primary brands, products, and services. 70-71 Customer and Product
ResponsibilityG4-5 Location of the organization’s headquarters. 6 About this reportG4-6 Number of countries where the organization operates, and
names of countries where either the organization has significant operations
6 About this report
G4-7 Nature of ownership and legal form. Inner Back Cover
Corporate Information
G4-8 Markets served (including geographic breakdown, sectors served, and types of customers and beneficiaries)
54-64 Operations Review
G4-9 Scale of the organization 96 Geographic FootprintG4-10 Total workforce by employment type, employment contract and
region broken down by gender74-79 Human capital
G4-11 Percentage of total employees covered by collective bargaining agreements.
- Not reported
G4-12 The Supply chain of the organization 41-42 Supply chain managementG4-13 Significant changes during the reporting period regarding the
organisation’s size, structure, ownership or its supply chain41-4298
Supply chain management, Geographic Footprint
G4-14 How the precautionary approach or principle is addressed by the organization.
134-141, 126-133, 65-84
Risk management, Cop gov. Audit committee, Social and Our Environmental Footprint
G4-15 Externally developed economic, environmental and social charters, principles, or other initiatives to which the organization subscribes or which it endorses.
61, 65 Microfinance, Compliances
G4-16 Memberships of associations 17 Awards, Certifications, Affiliations and Credit Rating
gRi g4 iNdEx TAblE

102
ALLIANCE FINANCE COMPANY PLC | ANNUAL REPORT 2015/16
Gri indicator Description Page No. SectionIDENTIFIED MATERIAL ASPECTS AND BOUNDARIESG4-17 All entities included in the organization’s consolidated financial
statements or equivalent documents.6 About the report
G4-18 Process for defining report content 6 About the reportG4-19 39-40 Materiality Assessment G4-20 Materiality with the Aspect Boundary - Internal 39-40 Materiality Assessment G4-21 Materiality with the Aspect Boundary - External 39-40 Materiality Assessment G4-22 Restatements of information provided in previous reports, and the
reasons for such restatements.6 About the report
G4-23 Significant changes from previous reporting periods in the Scope and Aspect Boundaries.
39-40 Materiality Assessment
sTaKeHolDer enGaGeMenTG4-24 List of stakeholder groups 33 Stakeholder engagement
approachG4-25 Identification and selection of stakeholders with whom to engage. 34 Stakeholder engagement
approachG4-26 Organisation’s approach to stakeholder engagement including
frequency of engagement by type and by stakeholder group, and an indication of whether any of the engagement was undertaken specifically as part of the report preparation process
35-36 Stakeholder engagement approach
G4-27 Key topics and concerns that have been raised through stakeholder engagement, and how the organization has responded
37-38 Stakeholder engagement approach, Customer and product responsibility
REPORT PROFILEG4-28 Reporting period for information provided. 6 About the report G4-29 Date of most recent previous report 6 About the report G4-30 Reporting cycle 6 About the report G4-31 Contact point for questions regarding the report or its
contents7 About the report
G4-32 In accordance option 6 About the report G4-33 External Assurance 7 About the report (External
Assurance not obtained)GoVernanCeG4-34 Governance Structure 114-133 StewardshipeTHiCs anD inTeGriTYG4-56 Organisation’s values, principles, standards and norms of behaviour 114-133,
2-3Stewardship | Inner Front Cover | Vision, Mission and Core Values section | Customer and Product Responsibility
gRi g4 index Table Contd.
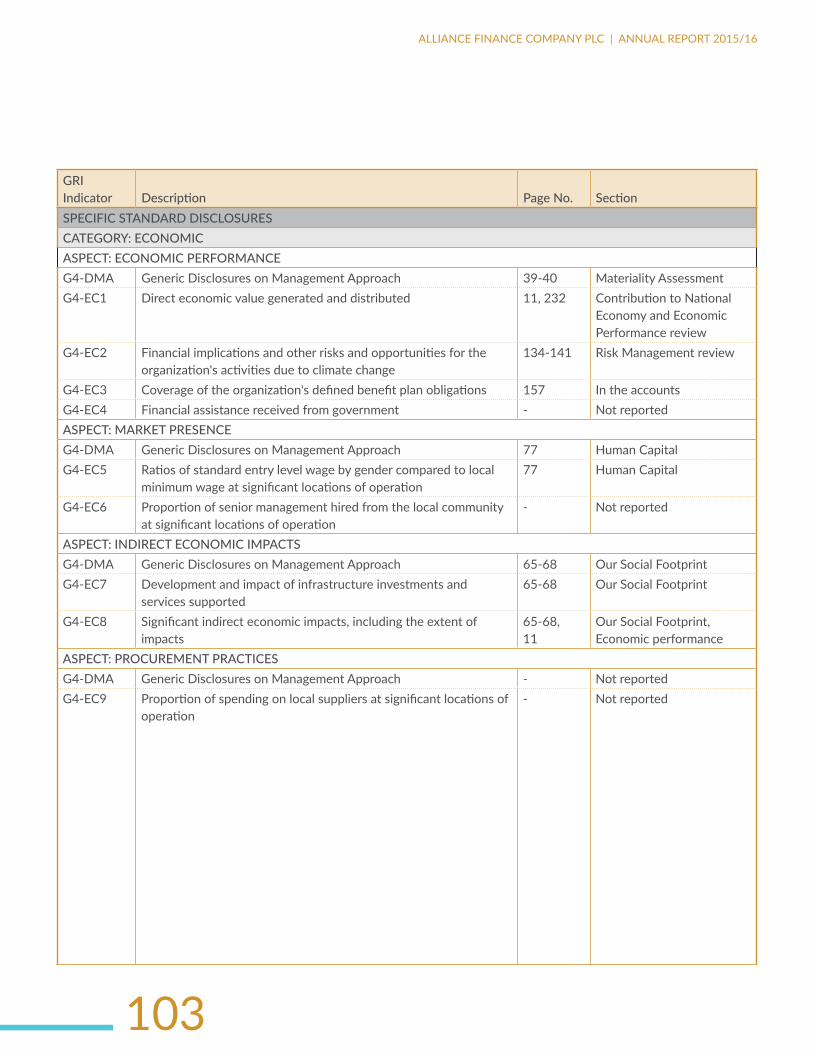
103
ALLIANCE FINANCE COMPANY PLC | ANNUAL REPORT 2015/16
Gri indicator Description Page No. SectionSPECIFIC STANDARD DISCLOSURESCaTeGorY: eConoMiCASPECT: ECONOMIC PERFORMANCEG4-DMA Generic Disclosures on Management Approach 39-40 Materiality AssessmentG4-EC1 Direct economic value generated and distributed 11, 232 Contribution to National
Economy and Economic Performance review
G4-EC2 Financial implications and other risks and opportunities for the organization's activities due to climate change
134-141 Risk Management review
G4-EC3 Coverage of the organization's defined benefit plan obligations 157 In the accountsG4-EC4 Financial assistance received from government - Not reportedASPECT: MARKET PRESENCEG4-DMA Generic Disclosures on Management Approach 77 Human CapitalG4-EC5 Ratios of standard entry level wage by gender compared to local
minimum wage at significant locations of operation77 Human Capital
G4-EC6 Proportion of senior management hired from the local community at significant locations of operation
- Not reported
ASPECT: INDIRECT ECONOMIC IMPACTSG4-DMA Generic Disclosures on Management Approach 65-68 Our Social FootprintG4-EC7 Development and impact of infrastructure investments and
services supported65-68 Our Social Footprint
G4-EC8 Significant indirect economic impacts, including the extent of impacts
65-68,11
Our Social Footprint, Economic performance
ASPECT: PROCUREMENT PRACTICESG4-DMA Generic Disclosures on Management Approach - Not reportedG4-EC9 Proportion of spending on local suppliers at significant locations of
operation- Not reported

104
ALLIANCE FINANCE COMPANY PLC | ANNUAL REPORT 2015/16
gRi g4 index Table Contd.
Gri indicator Description Page No. SectionCaTeGorY: enVironMenTalASPECT: MATERIALSG4-DMA Generic Disclosures on Management Approach - Not reportedG4-EN1 Materials used by weight or volume - Not reportedG4-EN2 Percentage of materials used that are recycled input materials - Not reportedASPECT: ENERGYG4-DMA Generic Disclosures on Management Approach 82-84 Our Environmental
FootprintG4-EN3 Energy consumption within the organization 82G4-EN4 Energy consumption outside of the organization 82G4-EN5 Energy intensity - Not reportedG4-EN6 Reduction of energy consumption 82 Our Environmental
FootprintG4-EN7 Reductions in energy requirements of products and services 82-83 Our Environmental
FootprintASPECT: WATERG4-DMA Generic Disclosures on Management Approach - Not reportedG4-EN8 Total water withdrawal by source - Not reportedG4-EN9 Water sources significantly affected by withdrawal of water - Not reportedG4-EN10 Percentage and total volume of water recycled and reused - Not reportedASPECT: BIODIVERSITYnot reportedG4-DMA Generic Disclosures on Management Approach - Not reportedG4-EN11 Operational sites owned, leased, managed in, or adjacent to,
protected areas and areas of high biodiversity value outside protected areas
- Not reported
G4-EN12 Description of significant impacts of activities, products, and services on biodiversity in protected areas and areas of high biodiversity value outside protected areas
- Not reported
G4-EN13 Habitats protected or restored - Not reportedG4-EN14 Total number of IUCN Red List species and national conservation
list species with habitats in areas affected by operations, by level of extinction risk
- Not reported

105
ALLIANCE FINANCE COMPANY PLC | ANNUAL REPORT 2015/16
Gri indicator Description Page No. SectionASPECT: EMISSIONSnot reportedG4-DMA Generic Disclosures on Management Approach 83 Our Environmental
FootprintG4-EN15 Direct greenhouse gas (GHG) emissions (Scope 1) - Not tracked G4-EN16 Energy indirect greenhouse gas (GHG) emissions (Scope 2) - Not tracked G4-EN17 Other indirect greenhouse gas (GHG) emissions (Scope 3) - Not tracked G4-EN18 Greenhouse gas (GHG) emissions intensity - Not tracked G4-EN19 Reduction of greenhouse gas (GHG) emissions 83-84 Our Environmental
FootprintG4-EN20 Emissions of ozone-depleting substances (ODS) - Not tracked G4-EN21 NOX, SOX, and other significant air emissions - Not tracked ASPECT: EFFLUENTS AND WASTEG4-DMA Generic Disclosures on Management Approach - Not reportedG4-EN22 Total water discharge by quality and destination - Not reportedG4-EN23 Total weight of waste by type and disposal method - Not reportedG4-EN24 Total number and volume of significant spills - Not reportedG4-EN25 Weight of transported, imported, exported, or treated waste
deemed hazardous under the terms of the Basel Convention Annex I, II, III, and VIII, and percentage of transported waste shipped internationally
- Not reported
G4-EN26 Identity, size, protected status, and biodiversity value of water bodies and related habitats significantly affected by the organization's discharges of water and runoff
- Not reported
ASPECT: PRODUCTS AND SERVICESG4-DMA Generic Disclosures on Management Approach - Not reportedG4-EN27 Extent of impact mitigation of environmental impacts of products
and services- Not reported
G4-EN28 Percentage of products sold and their packaging materials that are reclaimed by category
- Not relevant/Not reported
ASPECT: COMPLIANCEG4-DMA Generic Disclosures on Management Approach - Not reportedG4-EN29 Monetary value of significant fines and total number of non-
monetary sanctions for non-compliance with environmental laws and regulations
- Not reported

106
ALLIANCE FINANCE COMPANY PLC | ANNUAL REPORT 2015/16
gRi g4 index Table Contd.
Gri indicator Description Page No. SectionASPECT: TRANSPORTG4-DMA Generic Disclosures on Management Approach - Not reportedG4-EN30 Significant environmental impacts of transporting products and
other goods and materials for the organization's operations, and transporting members of the workforce
- Not reported
ASPECT: OVERALLG4-DMA Generic Disclosures on Management Approach 82-84 Our Environmental
FootprintG4-EN31 Total environmental protection expenditures and investments by
type65 Our Environmental
FootprintASPECT: SUPPLIER ENVIRONMENTAL ASSESSMENTG4-DMA Generic Disclosures on Management Approach - Not reportedG4-EN32 Percentage of new suppliers that were screened using
environmental criteria- Not reported
G4-EN33 Significant actual and potential negative environmental impacts in the supply chain and actions taken
- Not reported
ASPECT: ENVIRONMENTAL GRIEVANCE MECHANISMSG4-DMA Generic Disclosures on Management Approach - Not reportedG4-EN34 Number of grievances about environmental impacts filed,
addressed, and resolved through formal grievance mechanisms- Not reported
CaTeGorY: soCialSUB-CATEGORY: LABOUR PRACTICES AND DECENT WORKASPECT: EMPLOYMENTG4-DMA Generic Disclosures on Management Approach - Not reportedG4-LA1 Total number and rates of new employee hires and employee
turnover by age group, gender and region- Not reported
G4-LA2 Benefits provided to full-time employees that are not provided to temporary or part-time employees, by significant locations of operation
77 Human Capital
G4-LA3 Return to work and retention rates after parental leave, by gender 76, 81 Human CapitalASPECT: LABOUR/MANAGEMENT RELATIONSG4-DMA Generic Disclosures on Management Approach - Not reportedG4-LA4 Minimum notice periods regarding operational changes, including
whether these are specified in collective agreements- Not reported
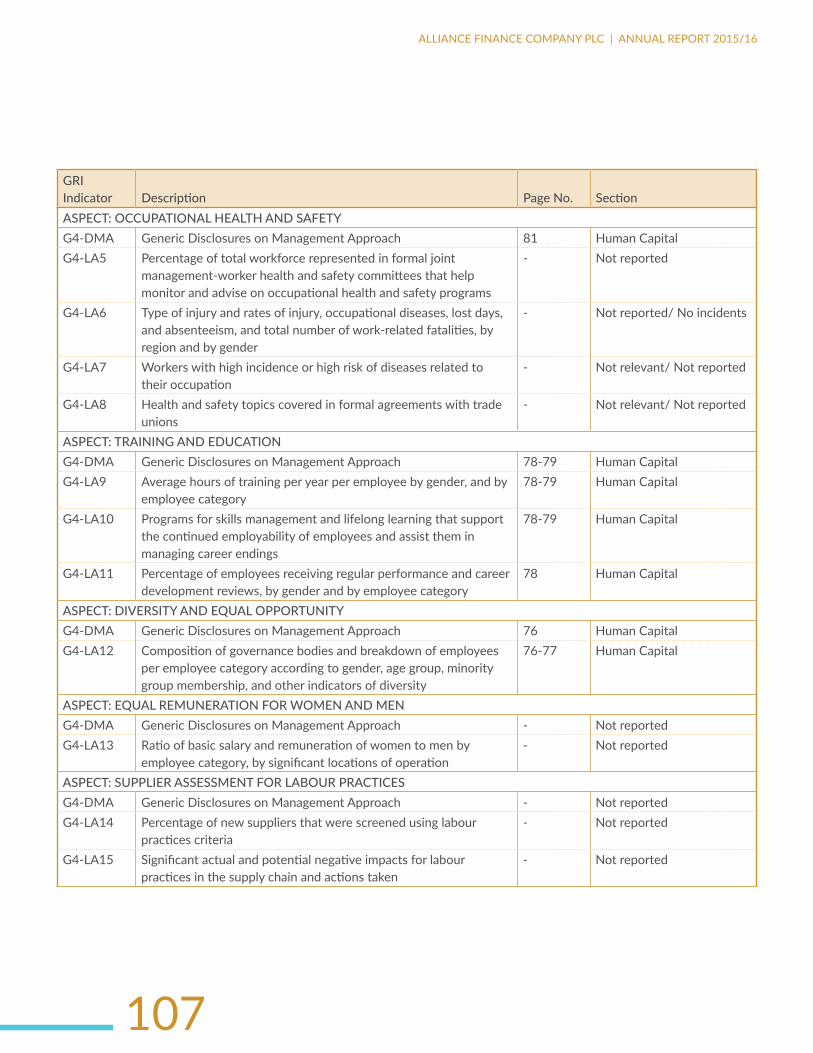
107
ALLIANCE FINANCE COMPANY PLC | ANNUAL REPORT 2015/16
Gri indicator Description Page No. SectionASPECT: OCCUPATIONAL HEALTH AND SAFETYG4-DMA Generic Disclosures on Management Approach 81 Human CapitalG4-LA5 Percentage of total workforce represented in formal joint
management-worker health and safety committees that help monitor and advise on occupational health and safety programs
- Not reported
G4-LA6 Type of injury and rates of injury, occupational diseases, lost days, and absenteeism, and total number of work-related fatalities, by region and by gender
- Not reported/ No incidents
G4-LA7 Workers with high incidence or high risk of diseases related to their occupation
- Not relevant/ Not reported
G4-LA8 Health and safety topics covered in formal agreements with trade unions
- Not relevant/ Not reported
ASPECT: TRAINING AND EDUCATIONG4-DMA Generic Disclosures on Management Approach 78-79 Human CapitalG4-LA9 Average hours of training per year per employee by gender, and by
employee category78-79 Human Capital
G4-LA10 Programs for skills management and lifelong learning that support the continued employability of employees and assist them in managing career endings
78-79 Human Capital
G4-LA11 Percentage of employees receiving regular performance and career development reviews, by gender and by employee category
78 Human Capital
ASPECT: DIVERSITY AND EQUAL OPPORTUNITYG4-DMA Generic Disclosures on Management Approach 76 Human CapitalG4-LA12 Composition of governance bodies and breakdown of employees
per employee category according to gender, age group, minority group membership, and other indicators of diversity
76-77 Human Capital
ASPECT: EQUAL REMUNERATION FOR WOMEN AND MENG4-DMA Generic Disclosures on Management Approach - Not reportedG4-LA13 Ratio of basic salary and remuneration of women to men by
employee category, by significant locations of operation- Not reported
ASPECT: SUPPLIER ASSESSMENT FOR LABOUR PRACTICESG4-DMA Generic Disclosures on Management Approach - Not reportedG4-LA14 Percentage of new suppliers that were screened using labour
practices criteria- Not reported
G4-LA15 Significant actual and potential negative impacts for labour practices in the supply chain and actions taken
- Not reported

108
ALLIANCE FINANCE COMPANY PLC | ANNUAL REPORT 2015/16
Gri indicator Description Page No. SectionASPECT: LABOUR PRACTICES GRIEVANCE MECHANISMSG4-DMA Generic Disclosures on Management Approach - Not reportedG4-LA16 Number of grievances about labour practices filed, addressed, and
resolved through formal grievance mechanisms- Not reported
suB-CaTeGorY: HuMan riGHTsASPECT: INVESTMENTG4-DMA Generic Disclosures on Management Approach - Not reportedG4-HR1 Total number and percentage of significant investment agreements
and contracts that include human rights clauses or that underwent human rights screening
- Not reported
G4-HR2 Total hours of employee training on human rights policies or procedures concerning aspects of human rights that are relevant to operations, including the percentage of employees trained
- Not reported
ASPECT: NON-DISCRIMINATIONG4-DMA Generic Disclosures on Management Approach 81 Human CapitalG4-HR3 Total number of incidents of discrimination and corrective actions
taken81 Human Capital
ASPECT: FREEDOM OF ASSOCIATION AND COLLECTIVE BARGAININGG4-DMA Generic Disclosures on Management Approach Not reportedG4-HR4 Operations and suppliers identified in which the right to exercise
freedom of association and collective bargaining may be violated or at significant risk, and measures taken to support these rights
Not reported
ASPECT: CHILD LABOURG4-DMA Generic Disclosures on Management Approach 81 Human CapitalG4-HR5 Operations and suppliers identified as having significant risk for
incidents of child labour, and measures taken to contribute to the effective abolition of child labour
81 Human Capital
ASPECT: FORCED OR COMPULSORY LABOURG4-DMA Generic Disclosures on Management Approach 81 Human CapitalG4-HR6 Operations and suppliers identified as having significant risk
for incidents of forced or compulsory labour, and measures to contribute to the elimination of all forms of forced or compulsory labour
81 Human Capital
ASPECT: SECURITY PRACTICESG4-DMA Generic Disclosures on Management Approach - Not reportedG4-HR7 Percentage of security personnel trained in the organization's
human rights policies or procedures that are relevant to operations- Not reported
gRi g4 index Table Contd.

109
ALLIANCE FINANCE COMPANY PLC | ANNUAL REPORT 2015/16
Gri indicator Description Page No. SectionASPECT: INDIGENOUS RIGHTSG4-DMA Generic Disclosures on Management Approach - Not reported /Not relevantG4-HR8 Total number of incidents of violations involving rights of
indigenous peoples and actions taken- Not reported /Not relevant
ASPECT: ASSESSMENTG4-DMA Generic Disclosures on Management Approach - Not reported G4-HR9 Total number and percentage of operations that have been subject
to human rights reviews or impact assessments- Not reported
ASPECT: SUPPLIER HUMAN RIGHTS ASSESSMENTG4-DMA Generic Disclosures on Management Approach - Not reported G4-HR10 Percentage of new suppliers that were screened using human
rights criteria- Not reported
G4-HR11 Significant actual and potential negative human rights impacts in the supply chain and actions taken
- Not reported
ASPECT: HUMAN RIGHTS GRIEVANCE MECHANISMSG4-DMA Generic Disclosures on Management Approach - Not reported G4-HR12 Number of grievances about human rights impacts filed, addressed,
and resolved through formal grievance mechanisms81 Human Capital
suB-CaTeGorY: soCieTYASPECT: LOCAL COMMUNITIESG4-DMA Generic Disclosures on Management Approach 69-73 Our Social FootprintG4-SO1 Percentage of operations with implemented local community
engagement, impact assessments, and development programs70 Our Social Footprint
G4-SO2 Operations with significant actual and potential negative impacts on local communities
70 Our Social Footprint
ASPECT: ANTI-CORRUPTIONG4-DMA Generic Disclosures on Management Approach 73 Customer and Product
ResponsibilityG4-SO3 Total number and percentage of operations assessed for risks
related to corruption and the significant risks identified- No incidents were reported
G4-SO4 Communication and training on anti-corruption policies and procedures
- Not conducted
G4-SO5 Confirmed incidents of corruption and actions taken 73 Customer and Product Responsibility
ASPECT: PUBLIC POLICYG4-DMA Generic Disclosures on Management Approach - Not reportedG4-SO6 Total value of political contributions by country and recipient/
beneficiary- Not reported

110
ALLIANCE FINANCE COMPANY PLC | ANNUAL REPORT 2015/16
Gri indicator Description Page No. SectionASPECT: ANTI-COMPETITIVE BEHAVIOURG4-DMA Generic Disclosures on Management Approach 73 Customer and Product
ResponsibilityG4-SO7 Total number of legal actions for anti-competitive behaviour, anti-
trust, and monopoly practices and their outcomes73 Customer and Product
ResponsibilityASPECT: COMPLIANCEG4-DMA Generic Disclosures on Management Approach 7 About this reportG4-SO8 Monetary value of significant fines and total number of non-
monetary sanctions for non-compliance with laws and regulations73, 81 Customer and Product
Responsibility,Human Capital
ASPECT: SUPPLIER ASSESSMENT FOR IMPACTS ON SOCIETYG4-DMA Generic Disclosures on Management Approach - Not reportedG4-SO9 Percentage of new suppliers that were screened using criteria for
impacts on society- Not reported
G4-SO10 Significant actual and potential negative impacts on society in the supply chain and actions taken
- Not reported
ASPECT: GRIEVANCE MECHANISMS FOR IMPACTS ON SOCIETYG4-DMA Generic Disclosures on Management Approach 70 Customer and product
responsibilityG4-SO11 Number of grievances about impacts on society filed, addressed,
and resolved through formal grievance mechanisms70 Customer and product
responsibilitySUB-CATEGORY: PRODUCT RESPONSIBILITYASPECT: CUSTOMER HEALTH AND SAFETYG4-DMA Generic Disclosures on Management Approach - Not reportedG4-PR1 Percentage of significant product and service categories for which
health and safety impacts are assessed for improvement- Not reported
G4-PR2 Total number of incidents of non-compliance with regulations and voluntary codes concerning the health and safety impacts of products and services during their life cycle, by type of outcomes
- Not reported
ASPECT: PRODUCT AND SERVICE LABELLINGG4-DMA Generic Disclosures on Management Approach 72 Customer and product
responsibilityG4-PR3 Type of product and service information required by the
organization's procedures for product and service information and labelling, and percentage of significant product and service categories subject to such information requirements
72 Customer and product responsibility
G4-PR4 Total number of incidents of non-compliance with regulations and voluntary codes concerning product and service information and labelling, by type of outcomes
- Not reported
G4-PR5 Results of surveys measuring customer satisfaction - Not reported
gRi g4 index Table Contd.

111
ALLIANCE FINANCE COMPANY PLC | ANNUAL REPORT 2015/16
Gri indicator Description Page No. SectionASPECT: MARKETING COMMUNICATIONSG4-DMA Generic Disclosures on Management Approach 70-71 Customer and product
responsibilityG4-PR6 Sale of banned or disputed products - Not reportedG4-PR7 Total number of incidents of non-compliance with regulations and
voluntary codes concerning marketing communications, including advertising, promotion, and sponsorship, by type of outcomes
- Not reported
ASPECT: CUSTOMER PRIVACYG4-DMA Generic Disclosures on Management Approach 73 Customer and product
responsibility G4-PR8 Total number of substantiated complaints regarding breaches of
customer privacy and losses of customer data73 Customer and product
responsibility ASPECT: COMPLIANCEG4-DMA Generic Disclosures on Management Approach 6, 73 About the report, customer
and product responsibility G4-PR9 Monetary value of significant fines for non-compliance with laws
and regulations concerning the provision and use of products and services
6, 73 About the report, customer and product responsibility

112
ALLIANCE FINANCE COMPANY PLC | ANNUAL REPORT 2015/16
Our impeccable flourish as weOur impeccable equilibrium helps us flourish as we assist those who are a part of our business to aspire to new horizons, while being financially secure.

113
ALLIANCE FINANCE COMPANY PLC | ANNUAL REPORT 2015/16

114
ALLIANCE FINANCE COMPANY PLC | ANNUAL REPORT 2015/16
bOARd OF diRECTORS
4. Mr. Sunil Karunanayake Chairman
1. Lt.Col.(Retd)A.R.Samarasinghe Independent Non-Executive
Director
3. Mr. Romani de Silva Deputy Chairman/ Managing Director
2. Mrs. R. N. Ponnambalam Non-Executive Director
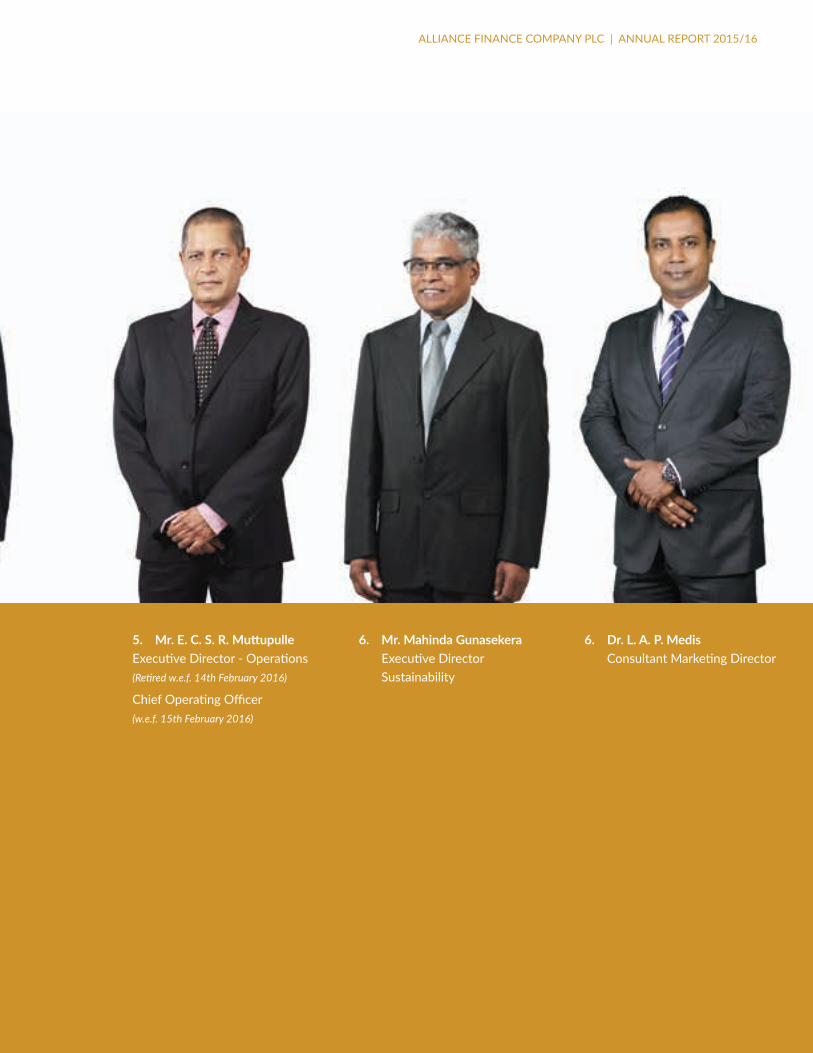
115
ALLIANCE FINANCE COMPANY PLC | ANNUAL REPORT 2015/16
5. Mr.E.C.S.R.MuttupulleExecutive Director - Operations(Retired w.e.f. 14th February 2016)
Chief Operating Officer(w.e.f. 15th February 2016)
6. Mr.MahindaGunasekera Executive Director Sustainability
6. Dr. L. A. P. Medis Consultant Marketing Director

116
ALLIANCE FINANCE COMPANY PLC | ANNUAL REPORT 2015/16
Mr. Sunil KarunanayakeChairman
He joined the Board on 26th January 2012 as an Independent Non-Executive Director and was appointed as the Chairman with effect from 1st June 2013. He is also the Chairman of the Audit Committee. Mr. Karunanayake is a Fellow Member of the Institute of Chartered Accountants (FCA), Chartered Institute of Management Accountants (FCMA) and also holds an MBA from the Institute of Management at the University of Sri Jayewardenepura. He counts over 30 years of experience in a leading multinational company. Mr. Karunanayake also serves as a Non-Executive Director on the Boards of Ceylon Grain Elevators PLC, Orient Garments PLC and Three Acre Farms PLC. He also functions as the Chairman of the Audit Committee in the said listed companies.
Mr. Romani de SilvaDeputy Chairman / Managing Director
A Fellow Member of the Institute of Credit Management, Sri Lanka, Mr.Romani de Silva holds Directorates in many companies. He possesses almost 30 years of experience in the finance Industry. He is the pioneer of Collaboration Financing, a unique financing concept designed to provide finance for entrepreneurs to expand businesses. The creation of this concept resulted in Alliance Finance becoming the first and only finance company in Sri Lanka to be awarded the ISO 9001 Certificate for designing business–specific financial solutions. He was also awarded two Bronze Awards for this innovation at Provincial and National Level at the “Sri Lanka Entrepreneur of the Year 2001” contest. He is a Life Member of the Sri Lanka Institute of Directors and the Chamber of Young Lankan Entrepreneurs.
Lt.Col.(Retd)A.R.SamarasingheIndependent Non-Executive Director
A retired Army Officer, having served for 20 years, he has had the opportunity of commanding two Reinforcement Battalions in the Infantry role and two Signals Regiments in its classic role of the Signals Corps and functions as an Enterprise Security Strategist. He holds a Bachelor’s degree in Information Technology from the University of Colombo and an MSc in Computer Science (Security) from University of Moratuwa.
Mrs. R. N. PonnambalamIndependent Non-Executive Director
She has held several senior management positions in large private sector entities. She has served as a Director of McLarens Holdings Ltd. and currently serves as the CEO/ Managing Director of Macbertan (Pvt) Ltd. and as a Non-Executive Director of Hotel Services (Ceylon) PLC & Amaya Leisure PLC. She has served in key roles in negotiating and securing international and local businesses and its development locally.
Mr.EmmanuelMuttupulleExecutive Director – Operations
(Retired w.e.f. 14th February 2016)Mr. Muttupulle has had a career spanning over 34 years in the financial arena. He is renowned in the industry for his notable accomplishments as a pioneer in USD denominated leases, securing USD denominated loans, introduction of securitization, Derivatives as Interest Rate Swaps. Although he is an Engineer by profession, his prowess has been in the field of finance where he has served in high ranking capacities in well-established companies overseas as well. Currently he serves the Company as the Chief Operating Officer.
He holds a BSc in Chemical Engineering - Glamorgan University, UK and MSc in Advanced Chemical Engineering & Biochemical Engineering - University College of Swansea, UK.
board of directors Contd.

117
ALLIANCE FINANCE COMPANY PLC | ANNUAL REPORT 2015/16
Mr.MahindaGunasekeraExecutive Director - Sustainability
Mahinda Gunasekera has 30+ years of experience in the fields of Microfinance, SME finance, livelihood development, and agribusiness in Sri Lanka, Afghanistan, Bangladesh and Nepal. In addition he has short term work experience in Tajikistan, Bangladesh, Philippines, Thailand, Japan, and the United States. Over that period he worked for large governmental organizations such as US Agency for International Development and undertook specialist assignments with the World Bank/ IFC, the Asian Development Bank and US based INGOs/ PVOs. He is an expert in the rural finance sector and SME sector development and was a long term MF and SME consultant as well. As a Banking and Finance Expert for ADB, he also has extensive experience in institutional, due-diligence and performance analysis of several dozens of Commercial Banks, Development Banks and MFIs in Asia.
He had been a Managing Director/CEO of three MFIs, one in Afghanistan and the other two in Sri Lanka. Mahinda holds an MBA, B. SC, Agriculture and Microfinance training from the University of Colorado, USA.
Dr. L. A. P. MedisConsultant Marketing Director
Dr. Ajith Medis has served AFC as Board Consultant Marketing prior to be appointed as Consultant Marketing Director in August 2016. He has considerable experience in the field of marketing and sales, which is his forte and has served in many different capacities in the NBFI sector. Currently he is attached to the academia of the University of Kelaniya. Training of staff in marketing is another one of his core strengths. Dr. Medis holds a doctorate in Strategy from Management and Science University, Malaysia, Bachelor of Commerce (Special) Honours Degree from the University of Kelaniya, Postgraduate Diploma in Marketing from CIM (UK), MBA from the University of Sri Jayewardenepura and is also a Certified Management Accountant of Australia.

118
ALLIANCE FINANCE COMPANY PLC | ANNUAL REPORT 2015/16
CORpORATE mANAgEmENT
1 2 3 4 5 67
1. Mr.SujithFernando Deputy Financial Controller - Corporate
Planning / Business Support
2. Mr.ChathuraGalhena Assistant General Manager - Internal
Audit
3. Mr.ElmoJayamaha Assistant General Manager - Personal
Loan & Equipment Finance
4. Mrs.ChampaNakandala Assistant General Manager - Deposit
5. Mr. Sanjaya Seneviratne Assistant General Manager - Treasury
6. Mr.MichaelBenedict Chief Risk Officer
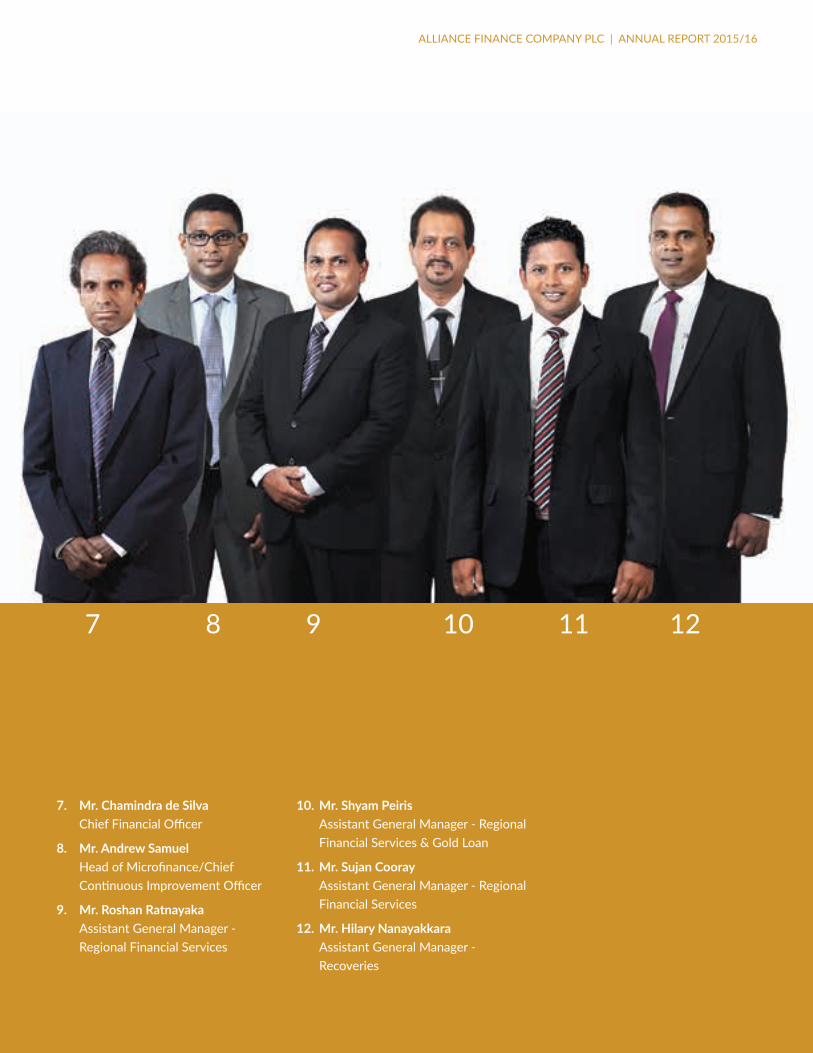
119
ALLIANCE FINANCE COMPANY PLC | ANNUAL REPORT 2015/16
7 8 9 10 11 12
7. Mr.ChamindradeSilva Chief Financial Officer
8. Mr. Andrew Samuel Head of Microfinance/Chief
Continuous Improvement Officer
9. Mr.RoshanRatnayaka Assistant General Manager -
Regional Financial Services
10.Mr.ShyamPeiris Assistant General Manager - Regional
Financial Services & Gold Loan
11. Mr. Sujan Cooray Assistant General Manager - Regional
Financial Services
12.Mr.HilaryNanayakkara Assistant General Manager -
Recoveries

120
ALLIANCE FINANCE COMPANY PLC | ANNUAL REPORT 2015/16
1 2 3 4 5 6
1. Mr.G.Mathieswarann Manager Management Information System
2. Ms. Asoki Ferdinands Senior Manager
3. Mrs.ChrishanthiWavita Senior Manager - Deposit
4. Mrs. Rose Peiris Manager - Finance
5. Mr. Ranil Perera Manager - Branch Operations &
Performance
6. Mr.UdayaSuranjith Regional Manager
SENiOR mANAgEmENT

121
ALLIANCE FINANCE COMPANY PLC | ANNUAL REPORT 2015/16
7 8 9 10 11 12
7. Mr.DillonThajudeen Senior Manager - Marketing & Deposit
8. Mr.S.S.Sathiyadaran I T Consultant
9. Mr.T.Kumarathas Act. Regional Manager - Microfinance
10.Mr.RohanSilva Asst. Manager Administration
11. Ms. Lolita Papalie Manager - Deposit
12. Mr. Saman Medagoda Regional Manager

122
ALLIANCE FINANCE COMPANY PLC | ANNUAL REPORT 2015/16
1234567
Senior management Contd.
13 14 15 16 17 18 19
13. Mrs.ThamaraRathnayaka Manager - Finance
14. Mr.ChamaraAsela Regional Manager
15 Mr. Isanka Gayan Regional Manager
16. Mr.DamindaMallawarachchi Manager - Human Resources
17. Mr.WasanthaMaldeniya Regional Manager
18. Mr.AchalaWanniarachchi Asst. Manager Legal
19. Mr.NohanKrishantha Act. Regional Manager - Microfinance

123
ALLIANCE FINANCE COMPANY PLC | ANNUAL REPORT 2015/16
20 21 22 23 24 25
20. Mr.SujithUdaraRanasinghe Regional Manager
21. Mr. Prasad Sanjeewa Regional Manager
22. Mr.M.B.Jayathilaka Regional Manager
23. Mr.LasanthaCandappa Regional Manager
24. Mr. Vidupriya Fernando Regional Manager
25. Mr. Lakmal Maniksagara Manager - Quality Management

124
ALLIANCE FINANCE COMPANY PLC | ANNUAL REPORT 2015/16

125
ALLIANCE FINANCE COMPANY PLC | ANNUAL REPORT 2015/16
Steady and strong, we have mapped out a careful strategy that sees us
supporting and encouraging the financial independence of Sri lankans
all over the island.

126
ALLIANCE FINANCE COMPANY PLC | ANNUAL REPORT 2015/16
PreambleThe Company adopted a self governance framework and adopted the ‘best practices’ that are followed in the area of Corporate Governance. The Company emphasises the need for full transparency and accountability in all its transactions, in order to protect the interests of all its stakeholders. The Board considers and acknowledges its responsibility toward the shareholders for creation and safeguarding of their wealth.
Thus the decision making process is formulated in a manner that considers the best interest of all our stakeholders in conducting its business affairs and internal matters. Our employees are guided by these principles.
As a listed and licensed Finance Company we have endeavoured to fulfil the requirements set out by the code of corporate governance as issued by the Central Bank of Sri Lanka.
Board’sRole,FunctionsandStructureIn accordance with the Good Governance practices the Board of Directors is duly constituted.
Our Board of Directors presently consists of two Independent Non-Executive Directors and two Non-Executive Directors and two Executive Directors:-1. Mr. S. Karunanayake – Chairman
(Independent Non-Executive appointed 1st July 2014)
2. Mr. R.K.E.P. de Silva – Deputy Chairman/Managing Director
3. Mr. E.C.S.R. Muttupulle – Executive Director Operations (appointed November 2014) and retired on 14th February 2016
4. Mrs. R.N. Ponnambalam – Non-Executive Director
5. Mr. A.R. Samarasinghe – Independent Non-Executive Director
6. Mr. J.M. Gunasekera – Executive Director Sustainability (appointed May 2015)
7. Dr. L.A.P. Medis - Consultant Director Marketing (Appointed August 2016) - Non-Executive
BoardCommitteesThe Company continues to be compliant and there are four Board Committees. The independence of the Audit Committee is maintained by the qualified Independent Non-Executive Chairman and the Independent Non-Executive Director who form the Audit Committee.
The Risk Management Committee operates under the Chairmanship of an Independent Non-Executive Director, a second Independent Non-Executive Director, Managing Director, Executive Director Sustainability, Chief Operating Officer, Chief Risk Officer, Chief Financial Officer, Chief Continuous Improvement Officer/ Head of Microfinance and key management personnel.
Detailed Reports on the entire operations of these committees are given separately in the Annual Report.
Additionally, the Remuneration Committee also appointed by Board comprises of three Non-Executive Directors, of whom two are independent. The scope of the Committee is to give expertise and guidance in the recruitment and remuneration of the Executive Directors and senior management,
review the remuneration processes and rewarding to ensure that the Company is keeping in line with market trends.
Related Party Transactions Committee was formed in December 2015 comprising of two Independent Non-Executive Directors and one Non-Executive Director to ensure compliance with the regulated governing related party transactions.
BoardMeetings/SecretariestotheBoardBoard Meetings are held every month and strategic matters, policies and key issues are deliberated on at the Board Meetings. Recommendations from the Board Committees are considered for implementation. Performance of the Company and its positioning in the industry and other related matters forms part of the agenda.
The Chairman gives direction at Board Meetings and encourages contributions from all Directors and expert advice is sought as and when necessary.
All documents including the Agenda are circulated well in advance to all Directors and provision has been made for Non-Executive Directors to include items to the Agenda. The discussions are further enhanced by presentations and supporting documents which helps the Directors in their deliberations and decision making process. A calendar of all meetings is drawn up to ensure maximum participation at meetings and the Notice for all Board Meetings is given at least 15 days prior to the holding of the meeting.
The Minutes of the Board Meetings are maintained by the Company Secretary and copies of same are circulated to the
CORpORATE gOvERNANCE

127
ALLIANCE FINANCE COMPANY PLC | ANNUAL REPORT 2015/16
Directors. Such Minutes are prepared in sufficient detail covering all aspects that led to the decision making, systems and controls and changes thereto, reports studied, matters analysed, and explanations and clarifications sought and decisions made. The Secretaries advice the Board on regulatory matters and provide all the secretarial functions to the Board.
The Board has delegated authority to the Managing Director and there are matters reserved for the Board of Directors. The matters reserved for the Board are considered on a timely and regular basis and special Board Meetings are convened when necessary to discuss matters of importance. At the Board Meetings the responsible officers are required to submit reports, compliance certificates and other material to support the dispensation of their duties.
name of Director
no. of Meetings
Held
no. of Meetings attended
Percentage of
attendance
Mr. S. Karunanayake 22 22 100%
Mr. R.K.E.P. de Silva 22 22 100%
Mrs. R.N. Ponnambalam 22 20 91%
Lt. Col. A.R. Samarasinghe 22 21 95%
Mr. E.C.S.R. Muttupulle (retired 14/02/2016)
19 19 100%
Mr. J.M. Gunasekara (Appointed June 2015) 16 16 100%
Dr. L.A.P. Medis (Appointed August 2016) - - -
KeyExecutivesDuring the year under review the Management Team was further strengthened to facilitate the growing business and in keeping with the growth plans of the Company. This is to further facilitate the achievement
of the Company’s corporate objectives and goals in the shorter term and in the longer term for strategic positioning. Areas that have potential for growth and diversified activities have also been addressed, where expertise has also been brought in.
Succession PlanningWhilst the Senior Management team is being strengthened to meet the growing needs and the corporate strategies in like manner the Board also gives due consideration to the sustainability of the Company. Key Management Personnel are afforded training and exposure to meet the demands of the socio economic aspects. Employees are groomed on an ongoing basis to reach their potential and succeed senior staff.
Regulatory Bodies and also to the shareholders. Public dissemination of information was also made with adequate disclosure.
Directors’ responsibility with regard to financial statements is given on page 149.
ShareIssues/InterimDividendsThere was no share issue during the year under review and there was an Interim Dividend of Rs.29/- per share paid in February 2016 and a final dividend of Rs.24/- has been recommended.
FutureIn a competitive environment the Board is of the belief that good governance is an essential tool for the well-being of the Company and all its stakeholders. The values of upholding good governance is nurtured and inculcated in our employees from entry level.
Corporate governance is the system by which companies are directed and controlled. Boards of Directors are responsible for the governance of their companies whilst the shareholders’ role is to appoint the Directors and the auditors and to satisfy themselves that an appropriate governance structure is in place. Corporate governance covers a wide range of issues and disciplines from secretarial and legal, through to business strategy, executive and non-executive management and investor relation, to accounting and information systems and remuneration.
We have enumerated below the extent of adherence by the Company to the Direction No.3 of 2008 issued by the Central Bank of Sri Lanka and also the Colombo Stock Exchange.
Accountability and DisclosureDuring the year under review the quarterly accounts and annual audited accounts were reviewed by the Audit Committee and also by the Board of Directors. All required disclosures have been complied with to the relevant

128
ALLIANCE FINANCE COMPANY PLC | ANNUAL REPORT 2015/16
Cse rule ref. status of adherencereasons for non Compliance
7.10 (1) Non-Executive Directors to be at least 2 or 1/3 of the total number of Directors whichever is higher.
Four Non-Executive Directors on the Board of the total Board of Directors of six.
Complied
7.10 (2) Independent Directors to be at least 2 or 1/3 of the total number of Non-Executive Directors
Two Directors are Independent of the four Non-Executive Directors.
Complied
Submission of Declaration Three Non-Executive Directors have furnished the required declaration.
Complied
7.10(3) a Names of Independent Directors Mr. Sunil Karunanayake Lt. Col. (Retd) A.R. Samarasinghe
Complied
7.10(3) b The criteria of independence has been met by both Independent Directors and there are no qualifying statements. Non of the Non-Executive Directors have served on the Board for over 9 years.
Complied
7.10(3) c Publish a resume of each Director on the Board.
Refer pages 116 and 117. Complied
7.10(3) d Appointment of new Director Two Directors were appointed on the Board and the necessary approvals were obtained and the required disclosures were made
Complied
7.10(5) Remuneration Committee
a) Composition Three Non-Executive Directors of which two are independent. The Chairman is an Independent Non-Executive Director
Complied
b) Functions Makes recommendations to the Board of proposed remuneration for Executive Directors and senior management.
c) Disclosures Names of the Directors of the Remuneration Committee is set out on page 245. Refer page 217 for aggregate remuneration paid to Directors and Key Management Personnel of the Company.
7.10(6) Audit Committee
a) Composition Comprises of two Independent Non-Executive Directors. The Chairman of the Committee is a member of ICASL.
Complied
b) Functions The Committee is assisted by internal and external auditors and secretaries and the functions is in keeping with the detailed outline given in the CBSL guidelines and CSE guidelines
c) Disclosures Refer page 126 for the names of Directors. The Audit Committee Report appears on pages 150 to 151
Corporate governance Contd.
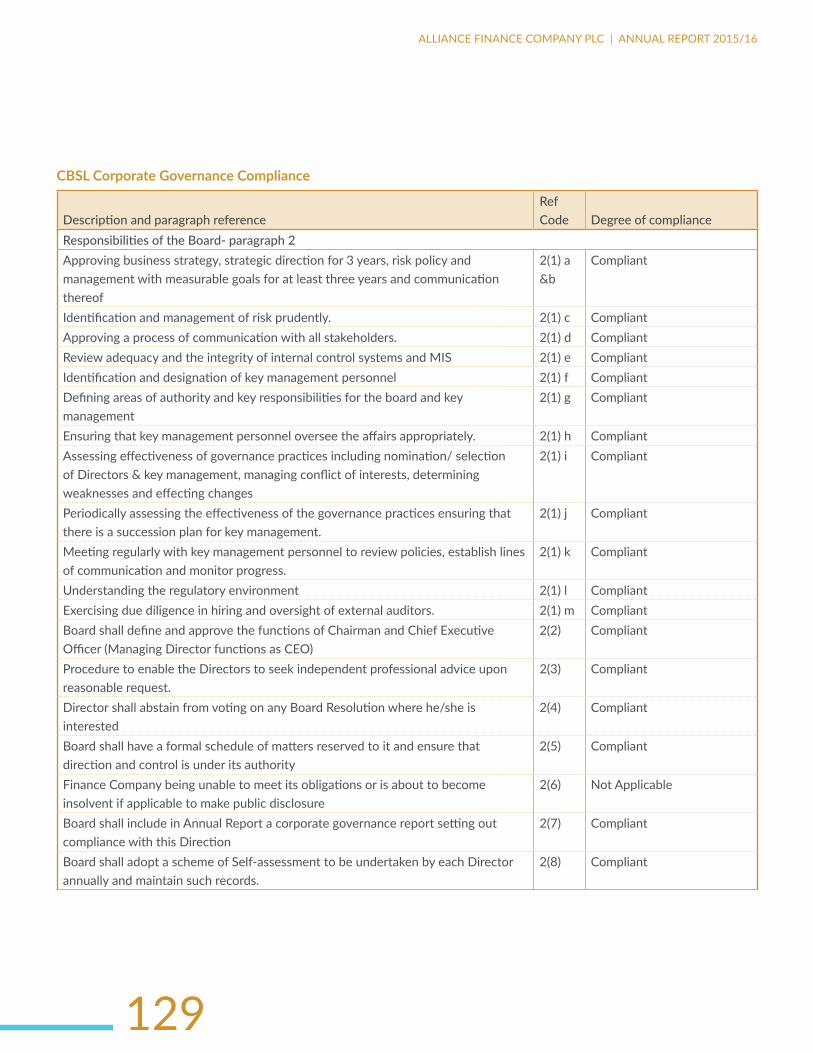
129
ALLIANCE FINANCE COMPANY PLC | ANNUAL REPORT 2015/16
CBSL Corporate Governance Compliance
Description and paragraph reference ref Code Degree of compliance
Responsibilities of the Board- paragraph 2 Approving business strategy, strategic direction for 3 years, risk policy and management with measurable goals for at least three years and communication thereof
2(1) a &b
Compliant
Identification and management of risk prudently. 2(1) c Compliant Approving a process of communication with all stakeholders. 2(1) d Compliant Review adequacy and the integrity of internal control systems and MIS 2(1) e Compliant Identification and designation of key management personnel 2(1) f Compliant Defining areas of authority and key responsibilities for the board and key management
2(1) g Compliant
Ensuring that key management personnel oversee the affairs appropriately. 2(1) h CompliantAssessing effectiveness of governance practices including nomination/ selection of Directors & key management, managing conflict of interests, determining weaknesses and effecting changes
2(1) i Compliant
Periodically assessing the effectiveness of the governance practices ensuring that there is a succession plan for key management.
2(1) j Compliant
Meeting regularly with key management personnel to review policies, establish lines of communication and monitor progress.
2(1) k Compliant
Understanding the regulatory environment 2(1) l Compliant Exercising due diligence in hiring and oversight of external auditors. 2(1) m Compliant Board shall define and approve the functions of Chairman and Chief Executive Officer (Managing Director functions as CEO)
2(2) Compliant
Procedure to enable the Directors to seek independent professional advice upon reasonable request.
2(3) Compliant
Director shall abstain from voting on any Board Resolution where he/she is interested
2(4) Compliant
Board shall have a formal schedule of matters reserved to it and ensure that direction and control is under its authority
2(5) Compliant
Finance Company being unable to meet its obligations or is about to become insolvent if applicable to make public disclosure
2(6) Not Applicable
Board shall include in Annual Report a corporate governance report setting out compliance with this Direction
2(7) Compliant
Board shall adopt a scheme of Self-assessment to be undertaken by each Director annually and maintain such records.
2(8) Compliant

130
ALLIANCE FINANCE COMPANY PLC | ANNUAL REPORT 2015/16
Description and paragraph reference ref Code Degree of compliance
Meetings of the board - Paragraph 3 Board shall meet twelve times in a financial year. 3(1) Compliant Arrangements for the Directors to add agenda items pertaining to the promotion of business and the management of risks.
3(2) Compliant. Agenda is circulated in advance permitting time for changes.
At least seven days notice for the regular board meetings and reasonable notice for other meetings.
3(3) Compliant
A Director shall attend at least two-thirds of the meetings and has not attended the immediately preceding three consecutive meetings
3(4) Compliant
Appointment of company secretary to handle statutory, regulatory and secretarial services.
3(5) Compliant
Preparation of the agenda for a board meeting by company secretary. 3(6) CompliantDirectors’ access to advice and services of the company secretary. 3(7) Compliant Maintenance of minutes of board meetings by the company secretary and make it available for inspection by any director.
3(8) Compliant
Recording of the Minutes of board meetings with sufficient detail to gather whether the Board acted with due care and prudence in performing its duties
3(9) Compliant
Composition of the Board - Paragraph 4 Directors on Board shall not be less than 5 and not more than 13 4(1) Compliant Period of service of a director other than an Executive Director shall not exceed nine years.
4(2) Compliant
Number of Executive Directors shall not exceed one-half of the number of Directors on the Board.
4(3) Compliant. Of the six members on the Board four are Non-Executive Directors
The Number of Independent Non-Executive Directors of the Board shall be at least one fourth of the total number of Directors.
4(4) Compliant. Two Directors are Independent Non-Executive.
Alternate Director 4(5) There are no Alternate Directors
Non-executive Directors shall have necessary skills and experience on strategy, performance and resources.
4(6) Compliant
Quorums for Board Meeting one half are Non-Executive Directors. 4(7) CompliantThe Independent Non-Executive Directors shall be expressly identified in all corporate communications and in the annual corporate governance report.
4(8) Compliant
A formal and transparent procedure for the appointment of new directors and for their orderly succession.
4(9) Compliant
All Directors appointed during the year retire at the Annual General Meeting following the appointment.
4(10) Compliant
If a Director resigns or is removed from office the Board shall announce to the shareholders and notify the Director of the Department of Supervision of Non-Bank Financial Institutions.
4(11) Compliant
Corporate governance Contd.

131
ALLIANCE FINANCE COMPANY PLC | ANNUAL REPORT 2015/16
Description and paragraph reference ref Code Degree of compliance
Criteria to assess the fitness and propriety of directors- Paragraph 5 A person over the age of 70 years shall not be a director. 5(1) CompliantA director shall not hold office as a director or other equivalent position in more than 20 companies/ societies/ body corporate nor in 10 specified business entities.
5(2) Compliant
Delegation of functions – Paragraph 6 Board shall not delegate any matters to anyone so as to significantly hinder or reduce the ability of the Board to discharge its functions.
6(1) Compliant
Board shall review the delegation process periodically 6(2) CompliantThe Chairman and the Chief Executive Officer – Paragraph 7 Separation of the roles of Chairman and Chief Executive Officer (Managing Director) 7(1) CompliantThe Chairman shall be an Independent Non-Executive Director. 7(2) Compliant Disclosures in the Annual Corporate Governance Report the relevant details of the Chairman and Chief Executive officer (Managing Director)
7(3) Compliant
Chairman shall provide leadership to the Board, ensure effective discharge of responsibilities and all issues are discussed in a timely manner.
7(4) Compliant
Responsibility of the Chairman for either the preparation or delegating the preparation of agenda to the company secretary.
7(5) Compliant
The information to be disseminated to the Directors prior to the Board Meetings 7(6) CompliantChairman shall encourage directors to make a full and active contribution and ensure that the Board acts in the best interest of the company.
7(7) Compliant
Chairman shall facilitate effective contribution by non-executive Directors and constructive relationships amongst directors
7(8) Compliant
Chairman shall not engage in direct supervision of key management personnel or any other executive duties.
7(9) Compliant
Chairman shall ensure that appropriate steps are taken for the effective communication with shareholders and the views of the shareholders are communicated to the Board
7(10) Compliant
The Chief Executive Officer (MD) shall function as the apex executive in charge of the finance company’s day to day management of the finance company’s operations and business
7(11) Compliant
Board appointed Committees – Paragraph 8 Company shall have at least two board committees (Audit & Risk) reporting directly to the Board.
8(1) Compliant
Audit Committee 8(2) Chairman shall be a Non- Executive Director with an accounting Qualification 8(2) a Compliant. Mr. Sunil
Karunanayake - ACMA (UK), FCA
Members shall be Non- Executive Directors. 8(2)b Compliant

132
ALLIANCE FINANCE COMPANY PLC | ANNUAL REPORT 2015/16
Description and paragraph reference ref Code Degree of compliance
Shall make recommendations about the appointment of auditors, service period, audit fee, period of an engagement of an audit partner and the application of accounting standards.
8(2)c Compliant.
Review the effectiveness of audit process and monitor the external auditors’ independence and objectivity.
8(2)d Compliant. Management letter is directed to the Board.
Develop a policy for non audit work 8(2)e Compliant. Non audit assignments were not given to external auditors.
Shall have authority to set the scope for the annual audit and assess the compliance, preparation of the financials in accordance with accounting principles
8(2)f Compliant.
Review the financial statements of the Company and ensure integrity of the annual report and financials prepared focus on major judgemental areas, changes in accounting policies and practices, significant adjustments arising from audit, going concern assumption, compliance with relevant accounting and legal requirements
8(2)g Compliant.
To discuss matters relating to the interim and annual audits 8(2) h Compliant Review the Management Letter 8(2)i Compliant Internal Audit Function 8(2)
j&o Compliant. Covered in a separate report
To meet with the External Auditors once in 6 months 8(2)l Compliant. Annual Report to disclose activities of the Audit Committee, Audit Committee meetings and attendance of each individual member.
8(2)m & p
Compliant
The Secretary shall record and keep detailed minutes. 8(2)n Compliant Review arrangements for employees to raise concerns in confidence about financial reporting and internal control and ensure fair and independent investigation and appropriate follow up action.
8(2)q Compliant
Risk Management Committee 8(3) Consists of one Non-Executive Directors, MD, ED, COO, CRO, CFO, CCIO and Key management personnel.
8(3)a Compliant
Assess all risks on a monthly basis using risk indicators and MIS. 8(3)b Compliant Review adequacy and effectiveness of all management committees and the management of risks.
8(3)c Compliant
The actions to mitigate the effects of specific risks if such risks are beyond the internal policy or regulatory limits.
8(3)d Compliant
Shall meet at least quarterly to assess risk management and BCP. 8(3)e Compliant Submit risk assessment report within a week of each meeting for board review and specific directions.
8(3)g Compliant
Establish compliance function with a Compliance Officer to report about compliance with laws, rules, regulations & directions etc.
8(3)h Compliant
Corporate governance Contd.

133
ALLIANCE FINANCE COMPANY PLC | ANNUAL REPORT 2015/16
Description and paragraph reference ref Code Degree of compliance
Related party transactions – Paragraph 9 Board shall avoid any conflict of interest from any transaction with any person and particularly with persons considered as related parties.
9(2) Compliant.
Board shall ensure that the company does not engage in transactions which would grant a related party “more favourable treatment” than is accorded to other constituents.
9(4) Compliant.
Disclosures - Paragraph 10 A statement to the effect that audited financial statements are prepared in line with applicable accounting standards and regulatory requirements.
10(2) a Compliant
A report by the Board that the financial reporting system has been designed to provide a reasonable assurance regarding the reliability and the preparation of financial statements is in accordance with the relevant accounting standards and regulatory requirements.
10(2) b Compliant.
External Auditor’s Certification on the effectiveness of the Internal Control Statement
10(2)c Compliant
Details of the Directors including names, transactions with the company. 10(2) d Compliant. Fees and remuneration paid by the company to the Directors in aggregate. 10(2) e Compliant Net accommodation outstanding in respect of each category of related parties and net accommodation outstanding as a percentage of the finance company’s capital funds.
10(2) f Compliant
Aggregate values of remuneration paid and transactions with its key management set out by broad categories such as remuneration paid, accommodation granted and deposits or investments.
10(2) g Compliant
A report setting out details of compliance with prudential requirements, regulation, laws, internal controls and measures to rectify non-compliances, if any.
10(2) h Compliant. Directors, auditors, internal control, audit and risk committees and governance reports form part of this requirement.
The external auditors certification of compliance with the Act, rules and directions issued by the Monetary Board
10(2) j Compliant
Our External Auditors certify that the disclosures and the related content in the Corporate Governance Report is consistence with the Corporate Governance Direction No.3 of 2008 issued by the Central Bank of Sri Lanka.
(Sgd)ALLIANCE MANAGEMENT SERVICES (PVT) LTDSecretaries31st May, 2015

134
ALLIANCE FINANCE COMPANY PLC | ANNUAL REPORT 2015/16
RiSk mANAgEmENT
The continued volatility in the global economic landscape in recent years and the subsequent failures of large corporates in different parts of the world clearly highlights the importance of Risk Management. It is very clear that Risk Management has fast become an essential ingredient for corporate governance and long-term sustainability of an organization. Therefore, comprehensive and continuously improving Risk Management practices provide a company with the capacity to respond to numerous environmental and operational uncertainties with greater assurance and approach the future with confidence.
AFC and Risk Management As a fast-growing organization that is also a leader in the NBFI sector, risk management philosophy is an strategic important priority l at AFC. The Company has clearly understood the importance of adopting a robust risk management process and embarked on an Enterprise Risk Management framework that encompasses its entire operation.
The implementation of this risk management framework commenced in the 2014/15 financial year with the appointment of the Chief Risk Officer(CRO) resulting in a significant level of improvement in this area .
The Board Risk Committee, entrusted with the continuous monitoring of the effectiveness of the Company’s risk management activities, took charge of steering this initiative. The aim of the risk management framework is to provide a consistent approach to risk by assuring that risk management practices are applied consistently across the Company, encouraging every employee at every level to understand
their role and to participate in the process. The framework also provides a clear and step-by-step approach to recognise, define, assess and treat risks with a set of policies and procedures that ensures constant monitoring and reporting; thereby enabling the Board to discharge their duty more proactively. GoalandObjectivesoftheEnterpriseRiskManagementProgramme1. To provide a policy and an organisational structure for the management of risks
that each division of AFC assumes in its activities.2. To define risk management roles and responsibilities within AFC and outlining
procedures to mitigate risks.3. To ensure consistent and acceptable management of risks throughout the
business.4. To define a reporting framework to ensure communication of necessary risk
management information to senior management and personnel engaged in risk management activities.
5. To constantly adapt to the changing risk management needs of AFC, whilst maintaining control of the overall risk position.
6. To detail the approved methods for risk assessment.7. To implement a system that ensures that risk management information is
captured, monitored and reported efficiently.
Risk Management Framework
5. TAKE ACTIONIdentity treatment strategies
Prepare action planImplement action plan
1.ESTABLISHTHECONTEXTObjectives
ValuesEnvironment
2.INDENTIFY RISKWhat can go wrong?How can it happen?
3. ANALYSE RISKSReview existing controls.
Determine the likelihood and impact of each major risk
4. EVALUATE & PRIORITIES RISKSEstablish the level of risk.
Decide one acceptance or action.Set action priorities.CO
NTI
NU
AL C
OM
MU
NIC
ATIO
N
6. M
ON
ITO
R A
ND
REV
IEW

135
ALLIANCE FINANCE COMPANY PLC | ANNUAL REPORT 2015/16
Risk Governance Structure
RiskOversightStructureThe ultimate responsibility for risk management including deciding on the risk appetite, communicating risk strategy and approving policies for the effective management of risk, remains within the mandate of the Board of
Directors. However, the Company has been able to operationalise the risk management process by implementing a clearly-defined risk oversight and reporting structure consisting of three lines of defence.
1. 1st Line of Defence - Daily Risk Management
2. 2nd Line of Defence - Risk Management Committee
3. 3rd Line of Defence - Board Audit and Risk Committee
AuditCommittee
Internal Audit
BoardofDirectors
Managing Director
ChefRiskOfficer
Risk Management Department
Credit Committee
Credit Risk
Asset and Liability Managementcommittee
Liquidity Risk Market Risk
IT Steering Committee
IT Risk ReputationalRisk
CSR Committee
OperationalRisk
Board Risk Management Committee
Compliance Department
Members
Risk
RiskscoreCard,RiskMeetingMinutes
RiskSheet
Monthly,Quarterly,Annually
Quarterly,Monthly
Monthly,WhenRequired
AppropriateMembersofBoardofDirectors
ExecutiveLevelMembers/AllHeadsofDivisions
Risk Management Committee2ndofDefence
Divisional Level Risk Coordinator
BoardRiskCommittee2ndLineofDefense
Daily Risk Management1stLineofDefence
MeetingFrequently Related Document
RISK STRUCTURE & LINE OF DEFENSE

136
ALLIANCE FINANCE COMPANY PLC | ANNUAL REPORT 2015/16
FirstLineofDefenceComprising of Divisional Heads and Risk Coordinators, the First Line of Defense will be primarily responsible for daily risk management at the operational level, with sufficient flexibility to manage risks as they deem to fit and in a manner that is consistent with Company-wide standards and policies. The risk owners within their respective operating domains are responsible for the effective implementation of internal controls and for the provision of useful management information relating to risks. Divisional Heads and Risk Coordinators are tasked with identifying and escalating key risks to the Management Risk Committee (MRC) that forms the Second Line of Defense.
SecondLineofDefenseThe Second Line of Defense of AFC is the Management Risk Committee (MRC). The primary role of the MRC is to provide guidance and create a framework, within which the divisions can operate in, and to identify and report on Company-wide risks. MRC consolidates risks across the organisation and escalates them as necessary to the Third Line of Defense.
The primary tasks of MRC include:• Providing the necessary advisory and training support
• Risk monitoring
• Ensuring consistency in dealing with risks across the Company
• Regulatory compliance
ThirdLineofDefenseThe Third Line of Defense is the Board of Directors of the Company, specifically the Board Risk Committee and the Audit Committee. As part of their mandate, they are responsible for ensuring that the Company’s overall risk management process, including the internal audit, external audit and all other internal control functions, are sound and operate as designed.
LinesofDefense
1stDaily Risk Management
2ndManagement Risk Committee
3rdBoard Audit and Risk Committee
Divisional Heads and Coordinators
Risk Management Committee comprising CXo level and all Divisional Heads independent assurance by BoD
• Risk Ownership• Effective Internal Controls• Useful Risk Management reports for
decision making
• Risk Advisory• Risk Training• Risk Monitoring• Regulatory Compliance
• Overall functions and effectiveness of Risk Management
• Internal Audit
• External Audit
• Investigations
These 3 lines of defense in their respective roles are expected to reinforce each other in the implementation and strengthening of AFC’s risk management framework.
Board Risk Management Committee(BRMC)Appointed by the Board of Directors, the Board Risk Management Committee (BRMC) is delegated with the responsibility of identifying principal risks within the Company and ensuring the implementation of appropriate systems to manage those risks.
BRMC is also entrusted with the responsibility of reporting the enterprise risk management matters to the Board of Directors as well as for responding to any queries put forward by them. Improvements to the AFC’s Enterprise Risk Management Framework, including the adoption of appropriate risk management policies, procedures and measurement parameters fall within the scope of BRMC.
Risk management Contd.

137
ALLIANCE FINANCE COMPANY PLC | ANNUAL REPORT 2015/16
ManagementRiskCommittee(MRC)Chief Financial Officer (CFO), Chief Continuous Improvement Officer (CCIO), Chief Risk Officer (CRO) and Heads of Divisions (HOD), collectively form the Management Risk Committee (MRC). The MRC is responsible for risk management within their spheres of operation, including reviewing of existing unit risk profiles, action plans and identification of potential risks. MRC is also responsible for organizing annual divisional level workshops/brainstorming sessions to discuss risk matters and to draw action plans for current & potential risks thereby ensuring that risk assessment is explicitly performed during the strategic planning exercise.
RiskManagementCoordinationUnit (RMCU)The Risk Management Coordination Unit (RMCU) serves as the secretariat to, and assists MRC in carrying out its risk management responsibilities. The scope of RMCU includes facilitating the enhancement of risk policies and procedures as necessary, consolidating risk information and monitoring the status of risk management activities across the Company, providing ongoing support to CRO and MRC, and enabling the conduct of strategic risk assessments at the Company level.
Risk CoordinatorsThe Risk Coordinators appointed by the respective HODs act as the risk management secretariat for their respective divisions. Risk Coordinators assist HODs in fulfilling their risk
management responsibilities by organising and facilitating periodic meetings, where status of risk profile, consensus on risk matters and actions submitted to MRC are discussed and deliberated.
Together with the Human Resources Division, the Risk Coordinators also provide assistance to HODs to compile risk profiles, coordinate with RMCU on risk awareness and conduct training activities at divisional level. They also liaise with RMCU to be on top of recent developments in risk management and update MRC on related risks in their respective divisions.
ManagementThe detailed line of accountability for risk management is aligned with AFC’s management structure ensuring that risks are primarily managed at where they reside. All approvals, responsibilities and accountabilities applicable to the identification, evaluation, management, and reporting of Company’s risks are attributed to the CXOs and HODs.
RiskIdentificationandToleranceAs part of AFC’s Enterprise Risk Management Framework, risk implications of both existing and proposed activities, projects, investments, systems, and procedures are identified, evaluated and documented, together with the recommended internal controls to mitigate those risks. The Risk Owners are accountable for all aspects of each of the identified risks including assessing, evaluating, monitoring, reporting and controlling. The responsibility for the adequacy of control of each risks fall within the scope of the designated Risk Owner, whilst the ultimate responsibility is in the hands of BRMC.
The process of risk treatments is reported by the respective Action Plan Owner to the Risk Owner on a regular basis. However, the MRC conducts this exercise annually or as the situation warrants. The First Line of Defense serves as the primary point of contact in gathering and assessing risk information at operational level.
All identified risks are analysed in terms of their potential impact and the likelihood of that risk materialising in the foreseeable future. Accountability is assigned to the person who is best able to make appropriate decisions depending on the individual’s level of competence, authority, responsibility and available resources to manage the risk in question. Key risks at operational level that could have far-reaching consequences for the Company are escalated for action by the MRC and the Chief Risk Officer.

138
ALLIANCE FINANCE COMPANY PLC | ANNUAL REPORT 2015/16
RiskCategorisationAFC classifies its risk portfolio broadly under 4 categories, enabling the Company to outline an appropriate course of action and specific treatment to manage and tackle each risk category.
1. Strategic2. Financial / Reporting3. Operations4. Compliance
Given below is a graphical illustration of different risks faced by the Company under each of the above categories.
RiskEvaluationThe Company weighs each of the identified risks against the likelihood of occurrence and potential impact, scored relative to each other against a fixed scale to assess their significance to the business in determining the effectiveness of internal controls.
GuidanceonLikelihoodRatings
scale Rating Explanation
4 Very High Is likely to occur (would be surprising if it did not)
3 High Will probably occur in most situations
2 Medium Might occur at some time
1 Very Low Could occur but is not expected t
RISK UNIVERSE
Financial/Reporting
AccountingandReporting
Market
Tax
Capital structure
Liquidity and Credit
Operations
SalesandMarketing
PhysicalAssets
Hazards
SupplyChain
People / HumanResources
InformationTechnology
Compliance
CodeofConduct
Regulatory
Legal
Market Dynamics
Planing & Resource allocations
Communicationand Investor
Governance
Mergers,Acquisition,Divestiture
MajorInitiatives
Strategic
Risk management Contd.
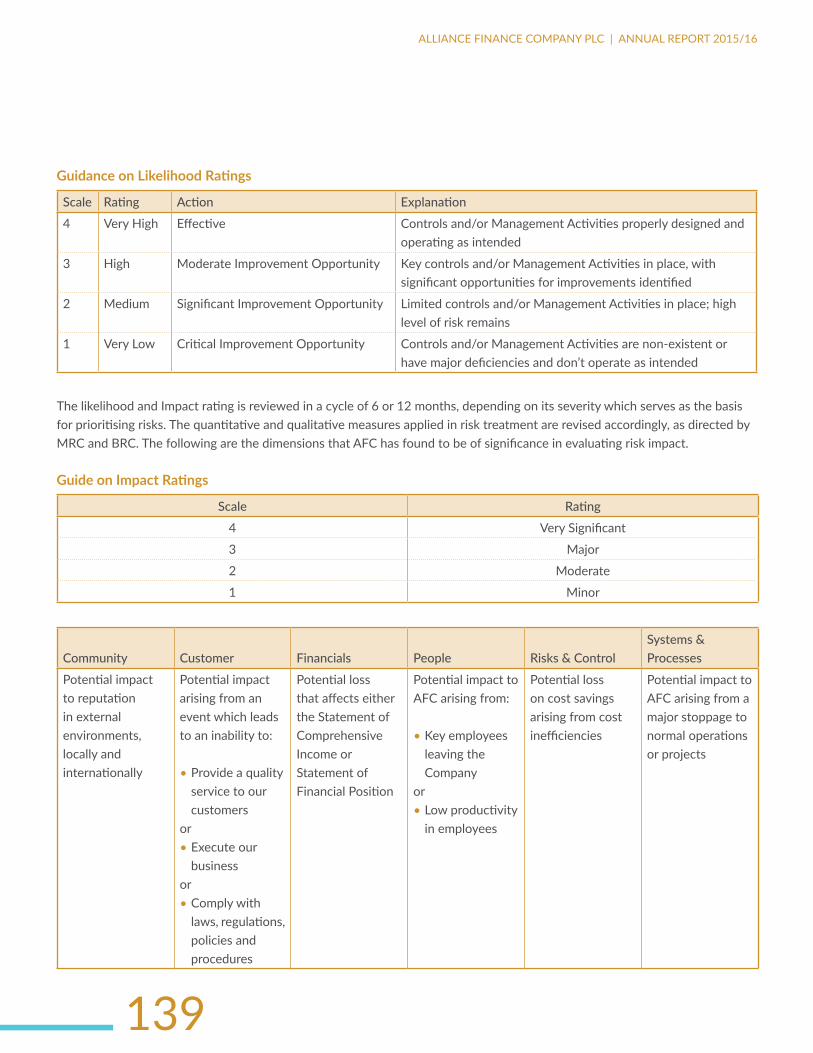
139
ALLIANCE FINANCE COMPANY PLC | ANNUAL REPORT 2015/16
GuidanceonLikelihoodRatings
scale Rating Action Explanation
4 Very High Effective Controls and/or Management Activities properly designed and operating as intended
3 High Moderate Improvement Opportunity Key controls and/or Management Activities in place, with significant opportunities for improvements identified
2 Medium Significant Improvement Opportunity Limited controls and/or Management Activities in place; high level of risk remains
1 Very Low Critical Improvement Opportunity Controls and/or Management Activities are non-existent or have major deficiencies and don’t operate as intended
The likelihood and Impact rating is reviewed in a cycle of 6 or 12 months, depending on its severity which serves as the basis for prioritising risks. The quantitative and qualitative measures applied in risk treatment are revised accordingly, as directed by MRC and BRC. The following are the dimensions that AFC has found to be of significance in evaluating risk impact.
GuideonImpactRatings
scale Rating
4 Very Significant
3 Major
2 Moderate
1 Minor
Community Customer Financials People Risks & ControlSystems & Processes
Potential impact to reputation in external environments, locally and internationally
Potential impact arising from an event which leads to an inability to:
• Provide a quality service to our customers
or• Execute our
businessor• Comply with
laws, regulations, policies and procedures
Potential loss that affects either the Statement of Comprehensive Income or Statement of Financial Position
Potential impact to AFC arising from:
• Key employees leaving the Company
or• Low productivity
in employees
Potential loss on cost savings arising from cost inefficiencies
Potential impact to AFC arising from a major stoppage to normal operations or projects

140
ALLIANCE FINANCE COMPANY PLC | ANNUAL REPORT 2015/16
Risk MapThe risk map of AFC gives a snapshot of the risks faced by the Company.
Like
lihoo
d
4 Legend:
3
2
1
1 2 3 4
Impact
R11
R5
R7 R2
Unchanged
R6
R3
R4
R10Worse
R3
New Risk
R1
R9
R10
Better
RiskTreatment/MitigationAFC has identified a range of options in treating or mitigating risks and follows a process of assessing those options, preparing risk treatment/mitigation plans and implementing those plans in drawing its risk treatment strategy.
The following diagram illustrates the various options followed by AFC in treating risks.
2Extraordinary
Events
3Operatingand
Compliance issues
1Enterprise
Wide Imperatives
4Irrelevant or insignificant
HighLow
High
LIKELIHOOD
I M P A C T
aVoiD•Divest•Prohibit•Stop
•Target•Screen•Eliminate
reTain
•Assept•Reprice •Self insure
•Offset •Plan
reDuCe •Disperse•Control
TransFer
•Insure•Reinsure•Hedge •Indemnity
•Securitise•Share•Outsource
Risk management Contd.
The First Line of Defense, consisting of all managers of the Company are primarily responsible for the treatment of risk exposures within their areas of operation, with the guidance of MRC and BRC as necessary to mitigate any material risks that arise.
With clearly defined responsibilities for treating risks, the Risk Owners are given clearly demarcated scope for action. Wherever the current controls are deemed ineffective to arrest risks and therefore warrant action, an appropriate control improvement action plan is in place, for each Division where the risks reside.
AFC does not believe in eliminating risk, but rather managing them consistently within levels considered acceptable by BRC.

141
ALLIANCE FINANCE COMPANY PLC | ANNUAL REPORT 2015/16
Risk MonitoringWith a view to establish an effective monitoring process, AFC has not set down any restrictions on the escalation process. The urgency of escalation for action will vary depending on the nature and criticality of the risk. Intervention by the higher management in the form of action or decision depends on whether;
1. Actions are urgently required and cannot be executed at the current level2. Additional resources are required that exceed lower level authority limits3. A decision must be made involving various divisions; and4. There is doubt as to whether accountability should be retained at the lower
level.
ReportingFrequencyandFormatRegular risk reporting is paramount for management information and business planning. Hence, a process of formal reporting highlighting significant risks is instituted at various levels of the organisation.
Risk information collected and aggregated at divisional levels are compiled and reported to MRC on a quarterly basis in the form of updated divisional risk profiles along with the relevant action plans, which are reviewed and deliberated at MRC meetings on a quarterly basis. MRC is responsible for consolidating all risks across the Company and identifying strategic risks to be escalated to BRMC.
RMCU coordinates quarterly reviews of the effectiveness of this policy together with the key management of AFC and submits a bi-annual Risk Management Report to BRMC, summarising the risks facing the organisation on the effectiveness of the controls and if any corrective measures are required.

142
ALLIANCE FINANCE COMPANY PLC | ANNUAL REPORT 2015/16
FiNANCiAl REpORTS

143
ALLIANCE FINANCE COMPANY PLC | ANNUAL REPORT 2015/16
Annual Report of the Directors 144Directors’ Statement on Internal Control Over Financial Reporting 148Directors’ Responsibility for Financial Reporting 149Report of the Audit Committee 150Independent Auditors’ Report 152Statement of Profit or Loss 153Statement of Comprehensive Income 154Statement of Financial Position 155Statement of Changes in Equity 156Statement of Cash Flows 157Significant Accounting Policies 158Notes to the Financial Statements 176Capital Adequacy Ratio 231

144
ALLIANCE FINANCE COMPANY PLC | ANNUAL REPORT 2015/16
ANNuAl REpORT OF ThE diRECTORS
The Board of Directors of Alliance Finance Company PLC is pleased to present the Annual Report of the Directors together with the Audited Statement of Accounts of the Company for the financial year ended 31st March 2016.
BoardofDirectorsStructureandChangesAs at the Balance Sheet date the Board was comprised of three Non-Executive Directors and two Executive Directors. The offices held by the Executives are Managing Director and Executive Director Sustainability. During the year under review, our Board was strengthened by the appointment of Mr. J. Mahinda Gunasekera, who has the expertise and experience in the Microfinance business both in Sri Lanka and overseas. The appointment was made in June 2015. Our Executive Director/Chief Operating Officer retired from his Directorship on 14th February 2016 as he reached 70 years. He continues to serve in the capacity of Chief Operating Officer. On 9th August 2016 Dr. L.A.P. Medis was appointed as consultant Director Marketing. Prior to his appointment he served as Consultant Marketing.
The profiles of the Directors appear on pages 116 to 117.
PrincipalActivitiesThe Company was able to build on its foundation of consolidation of the previous years and it has paved the way for the growth in the principal Lines of Business. Our core business witnessed a steady growth towards the latter part of the financial year whilst the Microfinance had a consistent growth over the year. Due to the uncertainty with regard to the price of gold, this portfolio grew moderately considering the risks it faced. The portfolio of lending products was diversified and new products were added.
The other sources of revenue remained part of the product portfolio namely, Consumer Durable Finance, Collaboration Finance, Import Finance, Real Estate, General Trading and Share Portfolio Management with contributions from some.
A noteworthy accomplishment was that the Company was able to borrow from two foreign sources, obtaining USD 5 million in January 2016 from TRIODOS BV, Netherlands and USD 5 million from Commercial Bank, Bangladesh.
Management Discussion and AnalysisAn in-depth analysis of the Company’s performance and attributes is extensively covered in this review with overall assessment of the Company’s financial position and performance during the year. Whilst comments
on the financial results and special events are also more comprehensively dealt with in the Managing Director’s Review (Pages 22 to 29), Financial Statements (Pages 152 to 231) and the Management Discussion and Analysis section of the report (Pages 32 to 100)
Risk Management ReviewThe Board of Directors reviewed this process and has taken measures to further strengthen it with an emphasis on the market-related impact in the changing market conditions affecting the industry at macro level due to policy changes. The impetus has produced results in the portfolios that are being grown which are robust with a better credit quality. Processes and systems too are being reviewed on a regular basis to identify solutions which are cost effective to build a sustainable business. Non-Financial factors are also being monitored and steps taken to mitigate such risks. A detailed overview of the process is set out in the integrated Risk Management Report on pages 134 to 141 of this Annual Report.
Corporate Governance The Board has complied with the requirements of the guidelines in the Central Bank Direction No.3 of 2008 and the subject is comprehensively covered in the Corporate Governance Report in the Annual Report and is on pages 126 to 133.
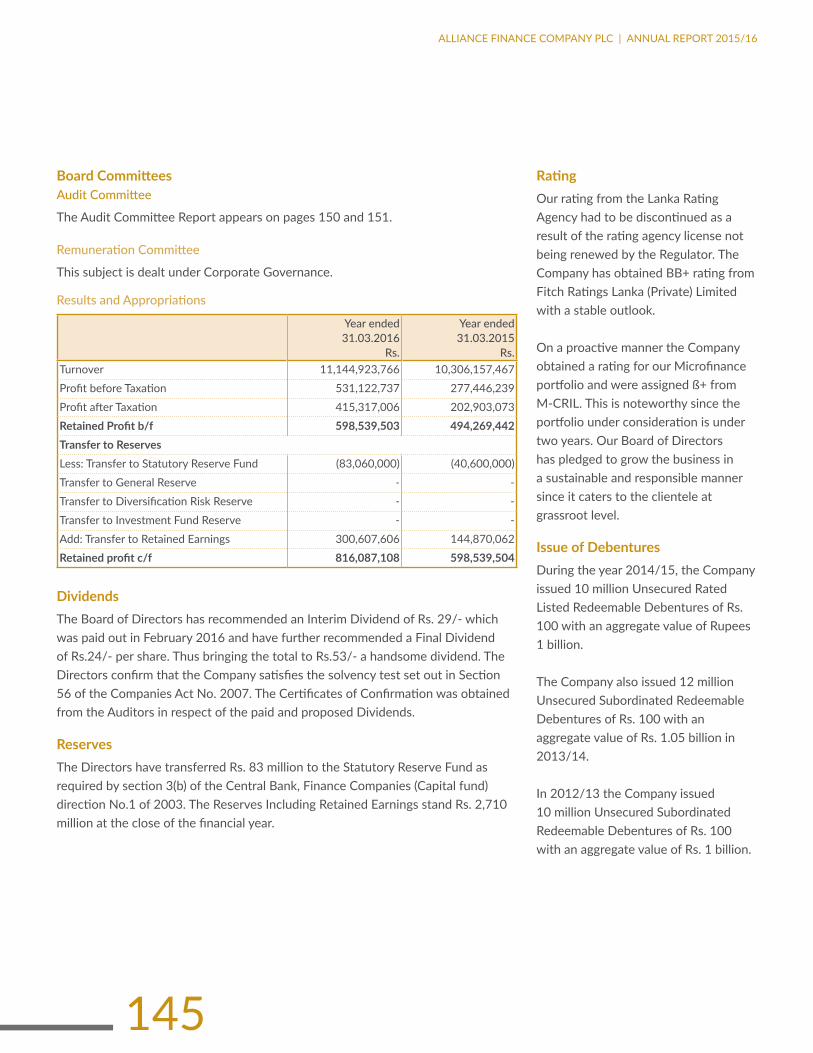
145
ALLIANCE FINANCE COMPANY PLC | ANNUAL REPORT 2015/16
BoardCommitteesAudit Committee
The Audit Committee Report appears on pages 150 and 151.
Remuneration Committee
This subject is dealt under Corporate Governance. Results and Appropriations
Year ended 31.03.2016
rs.
Year ended 31.03.2015
rs.Turnover 11,144,923,766 10,306,157,467Profit before Taxation 531,122,737 277,446,239Profit after Taxation 415,317,006 202,903,073RetainedProfitb/f 598,539,503 494,269,442TransfertoReservesLess: Transfer to Statutory Reserve Fund (83,060,000) (40,600,000)Transfer to General Reserve - -Transfer to Diversification Risk Reserve - -Transfer to Investment Fund Reserve - -Add: Transfer to Retained Earnings 300,607,606 144,870,062Retainedprofitc/f 816,087,108 598,539,504
DividendsThe Board of Directors has recommended an Interim Dividend of Rs. 29/- which was paid out in February 2016 and have further recommended a Final Dividend of Rs.24/- per share. Thus bringing the total to Rs.53/- a handsome dividend. The Directors confirm that the Company satisfies the solvency test set out in Section 56 of the Companies Act No. 2007. The Certificates of Confirmation was obtained from the Auditors in respect of the paid and proposed Dividends.
ReservesThe Directors have transferred Rs. 83 million to the Statutory Reserve Fund as required by section 3(b) of the Central Bank, Finance Companies (Capital fund) direction No.1 of 2003. The Reserves Including Retained Earnings stand Rs. 2,710 million at the close of the financial year.
RatingOur rating from the Lanka Rating Agency had to be discontinued as a result of the rating agency license not being renewed by the Regulator. The Company has obtained BB+ rating from Fitch Ratings Lanka (Private) Limited with a stable outlook.
On a proactive manner the Company obtained a rating for our Microfinance portfolio and were assigned ß+ from M-CRIL. This is noteworthy since the portfolio under consideration is under two years. Our Board of Directors has pledged to grow the business in a sustainable and responsible manner since it caters to the clientele at grassroot level.
IssueofDebenturesDuring the year 2014/15, the Company issued 10 million Unsecured Rated Listed Redeemable Debentures of Rs. 100 with an aggregate value of Rupees 1 billion.
The Company also issued 12 million Unsecured Subordinated Redeemable Debentures of Rs. 100 with an aggregate value of Rs. 1.05 billion in 2013/14.
In 2012/13 the Company issued 10 million Unsecured Subordinated Redeemable Debentures of Rs. 100 with an aggregate value of Rs. 1 billion.
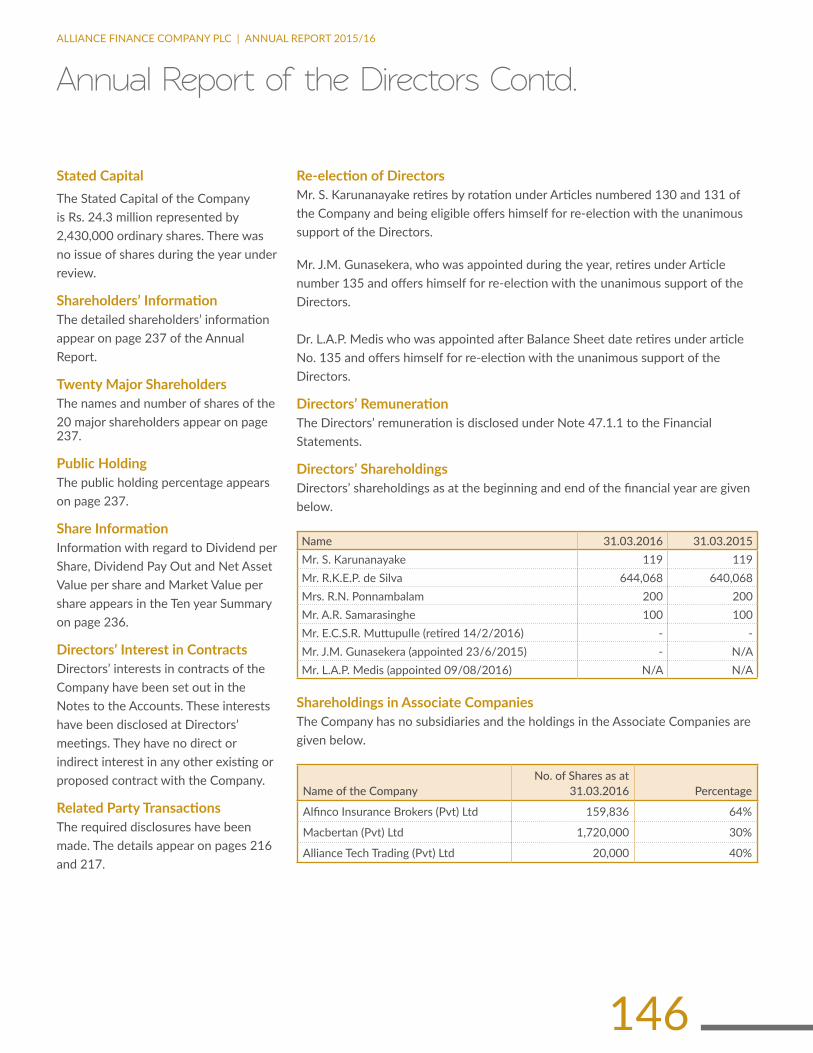
146
ALLIANCE FINANCE COMPANY PLC | ANNUAL REPORT 2015/16
Stated CapitalThe Stated Capital of the Company is Rs. 24.3 million represented by 2,430,000 ordinary shares. There was no issue of shares during the year under review.
Shareholders’InformationThe detailed shareholders’ information appear on page 237 of the Annual Report.
TwentyMajorShareholdersThe names and number of shares of the 20 major shareholders appear on page 237.
PublicHoldingThe public holding percentage appears on page 237.
ShareInformationInformation with regard to Dividend per Share, Dividend Pay Out and Net Asset Value per share and Market Value per share appears in the Ten year Summary on page 236.
Directors’ Interest in Contracts Directors’ interests in contracts of the Company have been set out in the Notes to the Accounts. These interests have been disclosed at Directors’ meetings. They have no direct or indirect interest in any other existing or proposed contract with the Company.
RelatedPartyTransactionsThe required disclosures have been made. The details appear on pages 216 and 217.
Re-electionofDirectorsMr. S. Karunanayake retires by rotation under Articles numbered 130 and 131 of the Company and being eligible offers himself for re-election with the unanimous support of the Directors.
Mr. J.M. Gunasekera, who was appointed during the year, retires under Article number 135 and offers himself for re-election with the unanimous support of the Directors.
Dr. L.A.P. Medis who was appointed after Balance Sheet date retires under article No. 135 and offers himself for re-election with the unanimous support of the Directors.
Directors’RemunerationThe Directors’ remuneration is disclosed under Note 47.1.1 to the Financial Statements.
Directors’ShareholdingsDirectors’ shareholdings as at the beginning and end of the financial year are given below.
name 31.03.2016 31.03.2015Mr. S. Karunanayake 119 119Mr. R.K.E.P. de Silva 644,068 640,068Mrs. R.N. Ponnambalam 200 200Mr. A.R. Samarasinghe 100 100Mr. E.C.S.R. Muttupulle (retired 14/2/2016) - -Mr. J.M. Gunasekera (appointed 23/6/2015) - N/AMr. L.A.P. Medis (appointed 09/08/2016) N/A N/A
ShareholdingsinAssociateCompaniesThe Company has no subsidiaries and the holdings in the Associate Companies are given below.
name of the Companyno. of shares as at
31.03.2016 Percentage
Alfinco Insurance Brokers (Pvt) Ltd 159,836 64%
Macbertan (Pvt) Ltd 1,720,000 30%
Alliance Tech Trading (Pvt) Ltd 20,000 40%
Annual Report of the directors Contd.
147
ALLIANCE FINANCE COMPANY PLC | ANNUAL REPORT 2015/16
EmployeeShareOwnershipThe Company has not implemented an Employee Share Ownership scheme.
PropertiesoftheCompanyThe value of freehold properties owned by the Company as at 31st March 2016 is included in the accounts at Rs. 618,393,993/- (31st March 2015 – Rs. 618,828,726) based on valuations undertaken by Mr. M.T.H. Farook, incorporated valuer and a fellow member of the institute of valuers (Sri Lanka) in the year 2012/13 and cost of subsequent improvements. The Directors are of the opinion that this value is not in excess of the current market value. The details are provided in the Note 29.6 to the Financial Statements.
DonationsThe Company donated a sum of Rs. 1,490,380 during the year under review.
AuditorsThe Auditors M/s. Baker Tilly Edirisinghe & Co. Chartered Accountants, of 45 Braybrooke Street Colombo 2, have audited the accounts as at 31st March 2016. The re-appointment rests in your hands. They have offered their services at an all-inclusive fee of Rs. 716,000 for the ensuring year.
(Sgd)ByOrderoftheBoardofDirectorsALLIANCE MANAGEMENT SERVICES (PVT) LTDSecretaries
31st May, 2016

148
ALLIANCE FINANCE COMPANY PLC | ANNUAL REPORT 2015/16
diRECTORS’ STATEmENT ON iNTERNAl CONTROl OvER FiNANCiAl REpORTiNgResponsibilityIn line with the section 10(2)(b) of the finance companies Direction no. 03 of 2008 as amended by the Direction no. 06 of 2013, the Board of Directors present this report on Internal Control over Financial Reporting.
The Board of Directors (“Board”) is responsible for the adequacy and effectiveness of the internal control mechanism in place at Alliance Finance Company PLC, (“Company”).
The Board has established an on-going process for the identifying, evaluating and managing the significant risks faced by the Company and this process includes the system of Internal Control over Financial Reporting. The process is regularly reviewed by the Board.
The Board is of the view that the system of Internal Control over Financial Reporting in place is sound and adequate to provide reasonable assurance regarding the reliability of financial reporting, and that the preparation of financial statements for external purposes is in accordance with relevant accounting principles and regulatory requirements.
The management assists the Board in the implementation of the Board’s policies and procedures pertaining to Internal Control over Financial Reporting. The management is continuously in the process of
enhancing the documentation of the system of Internal Control over Financial Reporting. In assessing the internal control system over financial reporting, identified officers of the Company collated all procedures and controls that are connected with significant accounts and disclosures of the financial statement of the Company. These in turn are being observed and checked by the Internal Audit Department of the Company for sustainability of design and effectiveness on an on-going basis.
The processes and procedures initially applied to adopt Sri Lanka Accounting Standards comprising LKAS and SLFRS were further strengthened during the year based on the feedback received from the Board audit committee, internal audit department, external auditors and the regulators. The Company is in the process of further upgrading the relevant processes embedding all requirements into existing process to comply with requirements, measurement, classification and disclosures required under the new Sri Lanka Accounting Standards, based on the recommendations made by the internal and external auditors. The Company has also recognized the need to further improve the automated financial reporting process to comply with these new requirements more effectively and efficiently.
ConfirmationsBased on the above process, the Board confirms that the financial reporting system of the Company has been designed to provide reasonable assurance regarding the reliability of financial reporting and the preparation of financial statements for external purposes and has been done in accordance with Sri Lanka Accounting Standards and regulatory requirements of the central bank of Sri Lanka.
ReviewoftheStatementbyExternal AuditorsThe external auditors have reviewed the above Directors’ Statement on internal control for the year ended 31st March 2016 and reported to the Board that nothing has come to their attention that the causes them to believe that the statement is inconstant with the understanding of the process adopted by the Board in the review of the design and effectiveness of the internal control system over the financial reporting of the Company.
Sunil KarunanayakeChairman- Board Audit Committee
Romani De SilvaManaging Director

149
ALLIANCE FINANCE COMPANY PLC | ANNUAL REPORT 2015/16
diRECTORS’ RESpONSibiliTy FOR FiNANCiAl REpORTiNgThe following statement sets out the responsibilities of the Directors in relation to the preparation and presentation of the Financial Statements of the Company as per Sections 148 (1) and 150 (1) of the Companies Act No. 07 of 2007.
Accordingly, the Directors confirm that the Company’s Financial Statements for the year ended 31st March 2016 are prepared in conformity with the requirements of the Sri Lanka Accounting Standards, the regulations and Directions of the Central Bank of Sri Lanka, the Listing Rules of the Colombo Stock Exchange and the Finance Business Act No. 42 of 2011. They believe that the Financial Statements present a true and fair view of the state of affairs of the Company at the end of the financial year.
The Directors also accept responsibility for the integrity and accuracy of the Financial Statements presented and confirm that appropriate accounting policies have been selected and applied consistently and reasonable and prudent judgment has been exercised so as to accurately report transactions.
The Directors have taken reasonable steps to ensure that the Company maintains adequate general supervision, control and administration of the affairs and business of the Company to safeguard the assets of the Company, to prevent, deter and detect fraud, to ensure the integrity, accuracy and safeguarding of operational and financial records.
The Directors confirm that to the best of their knowledge, all statutory payments due in respect of the Company as at the Balance Sheet date have been paid for, or where relevant, provided for.
The External Auditors, Messrs Baker Tilly Edirisinghe & Company, were provided with the opportunity to make appropriate inspections of financial records, Minutes of shareholders and Directors meetings and other documents and carry out review and sample check on the system of internal controls as they consider appropriate and necessary to enable them to form an opinion of the Financial Statements. The Report of the Auditors is set out on page 152.
By order of the Board
(Sgd)Alliance Management Services (Pvt) LtdSecretaries
31st May, 2016
150
ALLIANCE FINANCE COMPANY PLC | ANNUAL REPORT 2015/16
REpORT OF ThE AudiT COmmiTTEE
This report is provided by the Audit Committee, in respect of the financial year ended 31st March 2016. The Committee’s operation is guided by a detailed mandate that is approved by the Board which is detailed in the Terms of Reference. The Committee appointed by the Board and is comprised of two Independent Non-Executive Directors.
ExecutiveFunctionsThe Audit Committee has executed its duties and responsibilities during the financial year in accordance with its Terms of Reference and related to the matters of Company’s internal and external audit processes, financial reporting, risk assessment and internal controls over financial reporting and the internal audit process.
External Auditors and AuditDuring the year under review the committee, amongst other matters, considered the following:• approved the reappointment of
Baker Tilly Edirisinghe & Co., external auditors for the financial year ended 31 March 2017,
• approved the external auditors’ terms of engagement, the audit plan and budgeted audit fees payable;
• reviewed the audit and evaluated the effectiveness of the audit;
• obtained assurance from the auditors that their independence was not impaired;
• it was noted that non-audit services were not provided by the external auditors;
InRespectofFinancialStatements• examined and reviewed the interim
and annual financial statements as well as financial information disclosed to the public prior to submission and approval by the Board;
• reviewed reports on the adequacy of the portfolio and specific impairments and impairment of other assets, and the formulae applied in determining charges for and levels of portfolio impairments;
• ensured that the annual financial statements fairly present the financial position of the Company and of the group as at the end of the financial year and the results of operations and cash flows for the financial year and considered the basis on which the Company and the group was determined to be a going concern;
• considered the appropriateness of the accounting policies adopted and changes thereto;
• reviewed and discussed the external auditors’ audit report;
• considered and made recommendations to the Board on the interim final dividend payments to shareholders;
• noted that there were no material reports or complaints received concerning accounting practices, internal audit, internal financial controls, content of annual financial statements, internal controls and related matters.
InRespectofInternalControlandInternal Audit • reviewed and approved the annual
internal audit mandate and audit plan and evaluated the independence, effectiveness and performance of the internal audit department and compliance with its mandate;
• considered reports of the internal and external auditors on the group’s systems of internal control, including internal financial controls and maintenance of effective internal control systems;
• reviewed significant issues raised by the internal audit processes and the adequacy of corrective action in response to such findings;
• reviewed significant differences of opinion between the internal audit function and management and noted that there were none;
• assessed the adequacy of the performance of the internal audit function and adequacy of the available internal audit resources and found them to be satisfactory;
• received assurance that proper and adequate accounting records were maintained and that the systems that safeguard the assets had been fulfilled
• based on the above, the committee formed the opinion that at the date of this report there were no material breakdowns in internal control, including internal financial controls, resulting in any material loss to the group.
151
ALLIANCE FINANCE COMPANY PLC | ANNUAL REPORT 2015/16
REpORT OF ThE AudiT COmmiTTEE
The Internal Audit function is carried out by an Internal Audit Department and is headed by AGM Internal Audit who possesses the necessary experience and expertise.
In respect of legal and regulatory requirements, to the extent that they may have an impact on the financial statements: • monitored compliance with the
Companies Act, Finance Business Act and other relevant enactments;
• In respect of risk management and information technology
• considered and reviewed reports from management on risk management, including fraud risks and information technology risks as they pertain to financial reporting and the going concern assessment;
• that the controls were adequate to address all significant financial risks facing the business;
• considered the expertise, resources and experience of the finance function and the senior members of management responsible for this function and concluded that these were appropriate;
• Compliance with the Legal and Statutory Requirements
• Considered the compliance with the legal and statutory requirements and concluded that it had been complied with consistently and a timely manner.
MeetingsThe Audit Committee meets on a regular basis and is designed to facilitate and encourage communication amongst the Committee and to review the Internal Audit Reports and the replies matters relating to Financial reporting, risk management and internal controls. The Committee discussed with the Company’s internal auditors and the external auditor the overall scope and plans for their respective audits and also reviewed the financials.
AttendanceatMeetings
Meeting Held Meeting Present
Mr. S. Karunanayake 16 16
Lt.Col. Athula R. Samarasinghe
16 16
ConclusionBased upon the functions of the Audit Committee, it is satisfied that the Company is in conformity with the legal and statutory requirements and the implemented systems and controls are sufficient to ensure compliance with the best industry practices.
Sunil KarunanayakeChairmanAudit Committee

152
ALLIANCE FINANCE COMPANY PLC | ANNUAL REPORT 2015/16
iNdEpENdENT AudiTORS’ REpORT
TOTHESHAREHOLDERSOFALLIANCE FINANCE COMPANY PLCreport on the Financial statementsWe have audited the accompanying financial statements of Alliance Finance Company PLC, (“the Company”), and the consolidated financial statements of the Company and its subsidiaries (“Group”), which comprise the statement of financial position as at March 31, 2016, and the statement of profit or loss and comprehensive income, statement of changes in equity and, statement of cash flow for the year then ended, and a summary of significant accounting policies and other explanatory information.
Board’s responsibility for the Financial statementsThe Board of Directors (“Board”) is responsible for the preparation of these financial statements that give a true and fair view in accordance with Sri Lanka Accounting Standards, and for such internal control as Board determines is necessary to enable the preparation of financial statements that are free from material misstatement, whether due to fraud or error.
auditor’s responsibilityOur responsibility is to express an opinion on these financial statements based on our audit. We conducted our audit in accordance with Sri Lanka Auditing Standards. Those standards require that we comply with ethical requirements and plan and perform the audit to obtain reasonable assurance
about whether the financial statements are free from material misstatement.An audit involves performing procedures to obtain audit evidence about the amounts and disclosures in the financial statements. The procedures selected depend on the auditor’s judgment, including the assessment of the risks of material misstatement of the financial statements, whether due to fraud or error. In making those risk assessments, the auditor considers internal control relevant to the Company’s preparation of the financial statement that give a true and fair view in order to design audit procedures that are appropriate in the circumstances, but not for the purpose of expressing an opinion on the effectiveness of the Company’s internal control. An audit also includes evaluating the appropriateness of accounting policies used and the reasonableness of accounting estimates made by Board, as well as evaluating the overall presentation of the financial statements.
We believe that the audit evidence we have obtained is sufficient and appropriate to provide a basis for our audit opinion.
opinionIn our opinion, the consolidated financial statements give a true and fair view of the financial position of the Group as at March 31, 2016 and of its financial performance and cash flows for the year then ended in accordance with Sri Lanka Accounting Standards.
report on other legal and regulatory requirementsAs required by section 163(2) of the Companies Act No.07 of 2007, we state the following:
a) The basis of opinion and scope and limitations of the audit are as stated above.
b) In our opinion:• we have obtained all the
information and explanations that were required for the audit and , as far as appears from our examination, proper accounting records have been kept by the Company,
• the financial statements of the Company give a true and fair view of its financial position as at March 31, 2016, and of its financial performance and cash flows for the year then ended in accordance with Sri Lanka Accounting Standards,
• the financial statements of the Company and the Group comply with the requirements of Sections 151 and 153 of the Companies Act No. 07 of 2007.
Edirisinghe&Co.,Chartered Accountants
Colombo31-May-16

153
ALLIANCE FINANCE COMPANY PLC | ANNUAL REPORT 2015/16
STATEmENT OF pROFiT OR lOSS
Company GroupFortheFinancialyearended31stMarch 2016 2015 2016 2015 Notes Rs. Rs. Rs. Rs.
Gross Income 4 4,575,969,829 4,256,664,351 4,616,615,382 4,588,367,624
Interest income 4,088,411,305 3,570,390,145 4,090,199,942 3,575,628,564Interest expenses (1,868,434,772) (1,817,341,905) (1,868,434,772) (1,821,731,464)Net Interest Income 5 2,219,976,533 1,753,048,240 2,221,765,170 1,753,897,100
Fee and commission income 293,843,456 229,331,256 326,083,961 248,799,377Fee and commission expenses (102,524,846) (80,732,860) (102,534,576) (82,588,840)Net Fee and Commission Income 6 191,318,610 148,598,396 223,549,385 166,210,537
Net gain/(loss) from trading 7 19,100,295 46,210,376 25,118,643 47,990,393
Other operating income (net) 8 174,614,773 410,732,574 175,212,836 715,949,290
TotalOperatingIncome 2,605,010,211 2,358,589,587 2,645,646,034 2,684,047,320
Impairment (charges) / reversal for loans and other losses 9 (165,552,247) (398,338,720) (165,552,247) (398,338,720)Gold loan auction losses (168,622,218) (424,360,708) (168,622,218) (424,360,708)NetOperatingIncome 2,270,835,746 1,535,890,158 2,311,471,569 1,861,347,892
OperatingExpensesPersonnel expenses 10 (750,965,495) (524,922,946) (758,476,851) (528,957,748)Other operating expenses 11 (815,792,384) (633,633,874) (824,523,377) (646,246,049)Depreciation of property & equipment (99,934,198) (85,702,246) (101,019,509) (86,135,322)Total operating expenses (1,666,692,077) (1,244,259,066) (1,684,019,737) (1,261,339,119)OperatingProfitbeforeValueAddedTaxonFinancialServices 604,143,668 291,631,093 627,451,832 600,008,774Value Added Tax on Financial Services (84,125,542) (30,020,765) (84,125,542) (30,020,765)OperatingProfitafterValueAddedTaxonFinancialServices 520,018,126 261,610,328 543,326,290 569,988,009Share of profit from associates 14,258,539 15,835,911 14,258,539 15,835,911Loss on change of interest in associate (3,153,928) - (3,153,928) -ProfitbeforeTaxationfromOperations 531,122,737 277,446,239 554,430,901 585,823,920
Provision for income taxation 12 (115,805,731) (74,543,166) (122,106,751) (79,155,981)
Profitfortheperiod 415,317,006 202,903,073 432,324,150 506,667,939Profit attributable to :Equity holders of the Company 415,317,006 202,903,073 426,191,375 364,061,201Non controlling interest - - 6,132,776 142,606,738Profitfortheyear 415,317,006 202,903,073 432,324,150 506,667,939
Basic Earnings Per Share 13 171 83 175 150Dividend Per Share (Rs.) 14 29 23 29 23
Figures in brackets indicate deductions.Accounting policies & notes to accounts form an integral part of these Financial Statements.

154
ALLIANCE FINANCE COMPANY PLC | ANNUAL REPORT 2015/16
STATEmENT OF COmpREhENSivE iNCOmE Company GroupFortheFinancialyearended31stMarch 2016 2015 2016 2015 Rs. Rs. Rs. Rs.
Profit for the year 415,317,006 202,903,073 432,324,150 506,667,939
OtherComprehensiveIncomeOtherComprehensiveIncometobe ReclassifytoProfitorLossNet gains and losses on available-for-sale financial assets:Sri Lanka government securities (1,250,070) 9,398,622 (1,250,070) 9,398,622Equity securities - un quoted (14,366,292) 3,198,521 (14,366,292) 3,198,521Net other comprehensive income to be reclassified to profit or loss (15,616,362) 12,597,143 (15,616,362) 12,597,143
OtherComprehensiveIncomenottobe ReclassifiedtoProfitorLossActuarial gains /( losses ) on defined benefit plans 16,181,388 (23,230,242) 16,269,996 (23,187,317)Deferred tax effect on above (4,530,789) 13,797,230 (4,530,789) 13,868,194NetOtherComprehensiveIncomenotbeClassifiedto ProfitorLoss 11,650,599 (9,433,012) 11,739,207 (9,319,123)
TotalComprehensiveIncomefortheyear 411,351,244 206,067,204 428,446,996 509,945,959
Attributable to:Equity holders of the Company 411,351,244 206,067,204 422,282,272 367,331,482Non controlling interest - - 6,164,724 142,614,477TotalComprehensiveIncomefortheyear 411,351,244 206,067,204 428,446,996 509,945,959
Figures in brackets indicate deductions.Accounting policies & notes to accounts form an integral part of these Financial Statements.
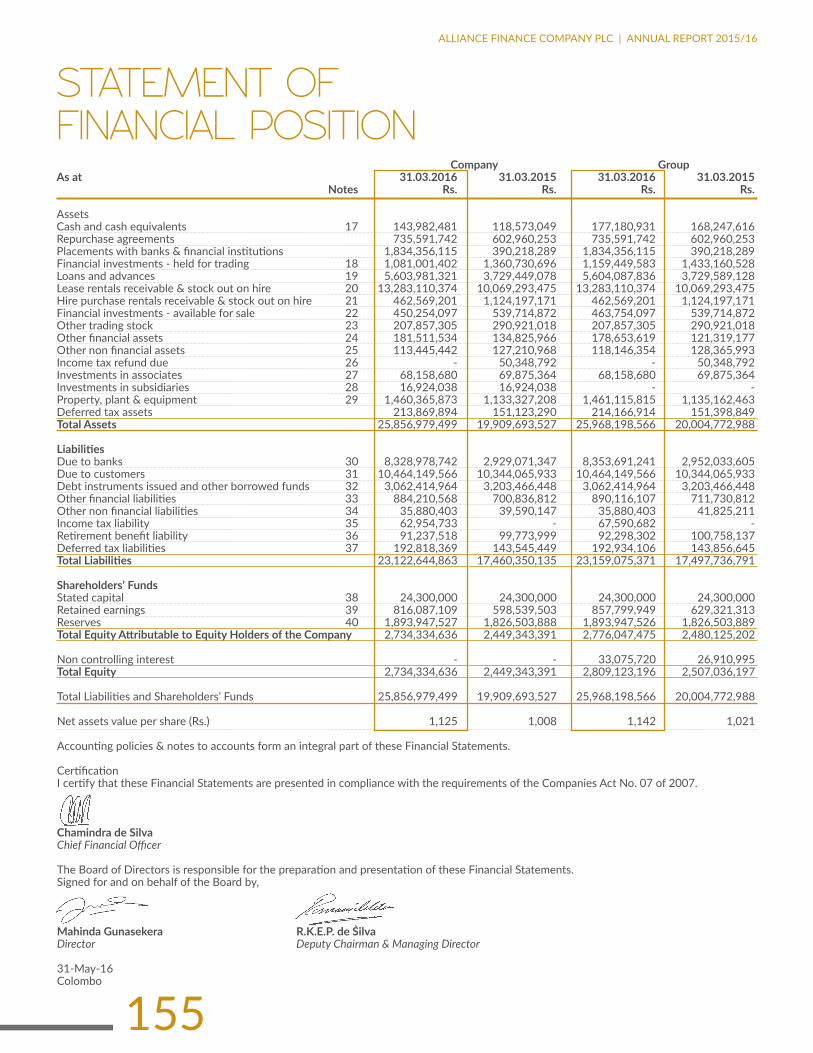
155
ALLIANCE FINANCE COMPANY PLC | ANNUAL REPORT 2015/16
STATEmENT OF FiNANCiAl pOSiTiON Company GroupAsat 31.03.2016 31.03.2015 31.03.2016 31.03.2015 Notes Rs. Rs. Rs. Rs.
AssetsCash and cash equivalents 17 143,982,481 118,573,049 177,180,931 168,247,616Repurchase agreements 735,591,742 602,960,253 735,591,742 602,960,253Placements with banks & financial institutions 1,834,356,115 390,218,289 1,834,356,115 390,218,289Financial investments - held for trading 18 1,081,001,402 1,360,730,696 1,159,449,583 1,433,160,528Loans and advances 19 5,603,981,321 3,729,449,078 5,604,087,836 3,729,589,128Lease rentals receivable & stock out on hire 20 13,283,110,374 10,069,293,475 13,283,110,374 10,069,293,475Hire purchase rentals receivable & stock out on hire 21 462,569,201 1,124,197,171 462,569,201 1,124,197,171Financial investments - available for sale 22 450,254,097 539,714,872 463,754,097 539,714,872Other trading stock 23 207,857,305 290,921,018 207,857,305 290,921,018Other financial assets 24 181,511,534 134,825,966 178,653,619 121,319,177Other non financial assets 25 113,445,442 127,210,968 118,146,354 128,365,993Income tax refund due 26 - 50,348,792 - 50,348,792Investments in associates 27 68,158,680 69,875,364 68,158,680 69,875,364Investments in subsidiaries 28 16,924,038 16,924,038 - -Property, plant & equipment 29 1,460,365,873 1,133,327,208 1,461,115,815 1,135,162,463Deferred tax assets 213,869,894 151,123,290 214,166,914 151,398,849Total Assets 25,856,979,499 19,909,693,527 25,968,198,566 20,004,772,988
LiabilitiesDue to banks 30 8,328,978,742 2,929,071,347 8,353,691,241 2,952,033,605Due to customers 31 10,464,149,566 10,344,065,933 10,464,149,566 10,344,065,933Debt instruments issued and other borrowed funds 32 3,062,414,964 3,203,466,448 3,062,414,964 3,203,466,448Other financial liabilities 33 884,210,568 700,836,812 890,116,107 711,730,812Other non financial liabilities 34 35,880,403 39,590,147 35,880,403 41,825,211Income tax liability 35 62,954,733 - 67,590,682 -Retirement benefit liability 36 91,237,518 99,773,999 92,298,302 100,758,137Deferred tax liabilities 37 192,818,369 143,545,449 192,934,106 143,856,645TotalLiabilities 23,122,644,863 17,460,350,135 23,159,075,371 17,497,736,791
Shareholders’FundsStated capital 38 24,300,000 24,300,000 24,300,000 24,300,000Retained earnings 39 816,087,109 598,539,503 857,799,949 629,321,313Reserves 40 1,893,947,527 1,826,503,888 1,893,947,526 1,826,503,889TotalEquityAttributabletoEquityHoldersoftheCompany 2,734,334,636 2,449,343,391 2,776,047,475 2,480,125,202
Non controlling interest - - 33,075,720 26,910,995Total Equity 2,734,334,636 2,449,343,391 2,809,123,196 2,507,036,197
Total Liabilities and Shareholders’ Funds 25,856,979,499 19,909,693,527 25,968,198,566 20,004,772,988
Net assets value per share (Rs.) 1,125 1,008 1,142 1,021
Accounting policies & notes to accounts form an integral part of these Financial Statements.
CertificationI certify that these Financial Statements are presented in compliance with the requirements of the Companies Act No. 07 of 2007.
ChamindradeSilvaChief Financial Officer
The Board of Directors is responsible for the preparation and presentation of these Financial Statements.Signed for and on behalf of the Board by,
MahindaGunasekera R.K.E.P.deSilvaDirector Deputy Chairman & Managing Director
31-May-16Colombo
STATEmENT OF COmpREhENSivE iNCOmE
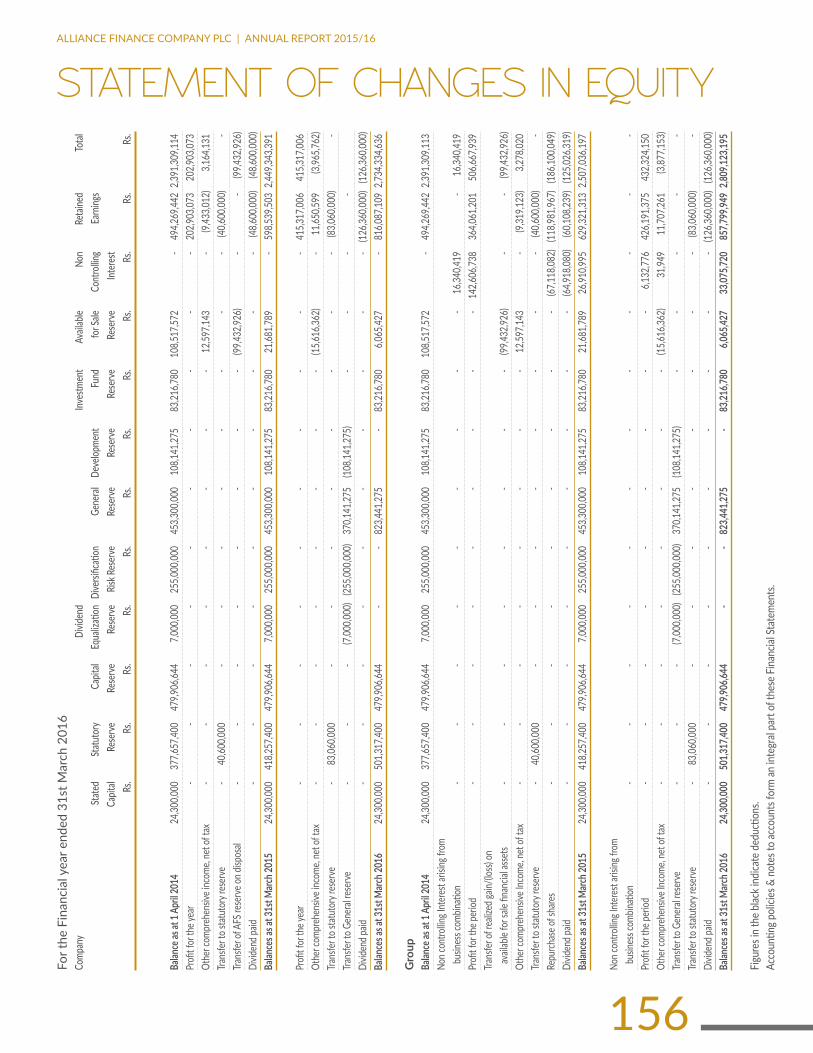
156
ALLIANCE FINANCE COMPANY PLC | ANNUAL REPORT 2015/16
STATEmENT OF ChANgES iN EQuiTyFo
r the
Fin
anci
al y
ear e
nded
31s
t Mar
ch 2
016
Comp
any
Di
viden
d
inves
tmen
t av
ailab
le no
n re
taine
d To
tal
St
ated
Statu
tory
Capit
al Eq
ualiz
ation
Dive
rsific
ation
Ge
neral
De
velop
ment
Fu
nd
for S
ale
Cont
rollin
g Ea
rning
s
Ca
pital
Rese
rve
Rese
rve
Rese
rve
Risk R
eser
ve
Rese
rve
Rese
rve
Rese
rve
Rese
rve
Inter
est
rs
. rs
. rs
. rs
. rs
. rs
. rs
. rs
. rs
. rs
. rs
. rs
.
Balanceasat1April2014
24
,300,0
00
377,6
57,40
0 47
9,906
,644
7,000
,000
255,0
00,00
0 45
3,300
,000
108,1
41,27
5 83
,216,7
80
108,5
17,57
2 -
494,2
69,44
2 2,3
91,30
9,114
Profi
t for
the y
ear
- -
- -
- -
- -
- -
202,9
03,07
3 20
2,903
,073
Othe
r com
preh
ensiv
e inc
ome,
net o
f tax
-
- -
- -
- -
- 12
,597,1
43
- (9,
433,0
12)
3,164
,131
Trans
fer to
statu
tory
rese
rve
- 40
,600,0
00
- -
- -
- -
- -
(40,60
0,000
) -
Trans
fer of
AFS
rese
rve o
n disp
osal
- -
- -
- -
- -
(99,43
2,926
) -
- (99
,432,9
26)
Divid
end p
aid
- -
- -
- -
- -
- -
(48,60
0,000
) (48
,600,0
00)
Balancesasat31stMarch2015
24,30
0,000
41
8,257
,400
479,9
06,64
4 7,0
00,00
0 25
5,000
,000
453,3
00,00
0 10
8,141
,275
83,21
6,780
21
,681,7
89
- 59
8,539
,503
2,449
,343,3
91
Profi
t for
the y
ear
- -
- -
- -
- -
- -
415,3
17,00
6 41
5,317
,006
Othe
r com
preh
ensiv
e inc
ome,
net o
f tax
-
- -
- -
- -
- (15
,616,3
62)
- 11
,650,5
99
(3,96
5,762
)Tra
nsfer
to st
atuto
ry re
serv
e -
83,06
0,000
-
- -
- -
- -
- (83
,060,0
00)
-Tra
nsfer
to G
ener
al re
serv
e -
- -
(7,00
0,000
) (25
5,000
,000)
370,1
41,27
5 (10
8,141
,275)
- -
- -
Divid
end p
aid
- -
- -
- -
- -
- -
(126,3
60,00
0) (12
6,360
,000)
Balancesasat31stMarch2016
24,30
0,000
50
1,317
,400
479,9
06,64
4 -
- 82
3,441
,275
- 83
,216,7
80
6,065
,427
- 81
6,087
,109
2,734
,334,6
36
Gro
upBalanceasat1April2014
24
,300,0
00
377,6
57,40
0 47
9,906
,644
7,000
,000
255,0
00,00
0 45
3,300
,000
108,1
41,27
5 83
,216,7
80
108,5
17,57
2 -
494,2
69,44
2 2,3
91,30
9,113
Non c
ontro
lling I
nter
est a
rising
from
b
usine
ss co
mbina
tion
- -
- -
- -
- -
- 16
,340,4
19
- 16
,340,4
19Pr
ofit f
or th
e per
iod
- -
- -
- -
- -
- 14
2,606
,738
364,0
61,20
1 50
6,667
,939
Trans
fer of
reali
zed g
ain/(l
oss)
on
ava
ilable
for s
ale fin
ancia
l ass
ets
- -
- -
- -
- -
(99,43
2,926
) -
- (99
,432,9
26)
Othe
r com
preh
ensiv
e Inc
ome,
net o
f tax
-
- -
- -
- -
- 12
,597,1
43
- (9,
319,1
23)
3,278
,020
Trans
fer to
statu
tory
rese
rve
- 40
,600,0
00
- -
- -
- -
- -
(40,60
0,000
) -
Repu
rchas
e of s
hare
s -
- -
- -
- -
- -
(67,11
8,082
) (11
8,981
,967)
(186,1
00,04
9)Di
viden
d paid
-
- -
- -
- -
- -
(64,91
8,080
) (60
,108,2
39)
(125,0
26,31
9)Balancesasat31stMarch2015
24,30
0,000
41
8,257
,400
479,9
06,64
4 7,0
00,00
0 25
5,000
,000
453,3
00,00
0 10
8,141
,275
83,21
6,780
21
,681,7
89
26,91
0,995
62
9,321
,313
2,507
,036,1
97
Non c
ontro
lling I
nter
est a
rising
from
b
usine
ss co
mbina
tion
- -
- -
- -
- -
- -
- -
Profi
t for
the p
eriod
-
- -
- -
- -
- -
6,132
,776
426,1
91,37
5 43
2,324
,150
Othe
r com
preh
ensiv
e Inc
ome,
net o
f tax
-
- -
- -
- -
- (15
,616,3
62)
31,94
9 11
,707,2
61
(3,87
7,153
)Tra
nsfer
to G
ener
al re
serv
e -
- -
(7,00
0,000
) (25
5,000
,000)
370,1
41,27
5 (10
8,141
,275)
- -
- -
-Tra
nsfer
to st
atuto
ry re
serv
e -
83,06
0,000
-
- -
- -
- -
- (83
,060,0
00)
-Di
viden
d paid
-
- -
- -
- -
- -
- (12
6,360
,000)
(126,3
60,00
0)Balancesasat31stMarch2016
24,300,000501,317,400
479,906,644
--
823,441,275
-83,216,780
6,065,427
33,075,720857,799,9492,809,123,195
Figu
res i
n th
e blac
k ind
icate
ded
uctio
ns.
Acco
untin
g pol
icies
& n
otes
to ac
coun
ts fo
rm an
inte
gral
part
of th
ese F
inan
cial S
tate
men
ts.
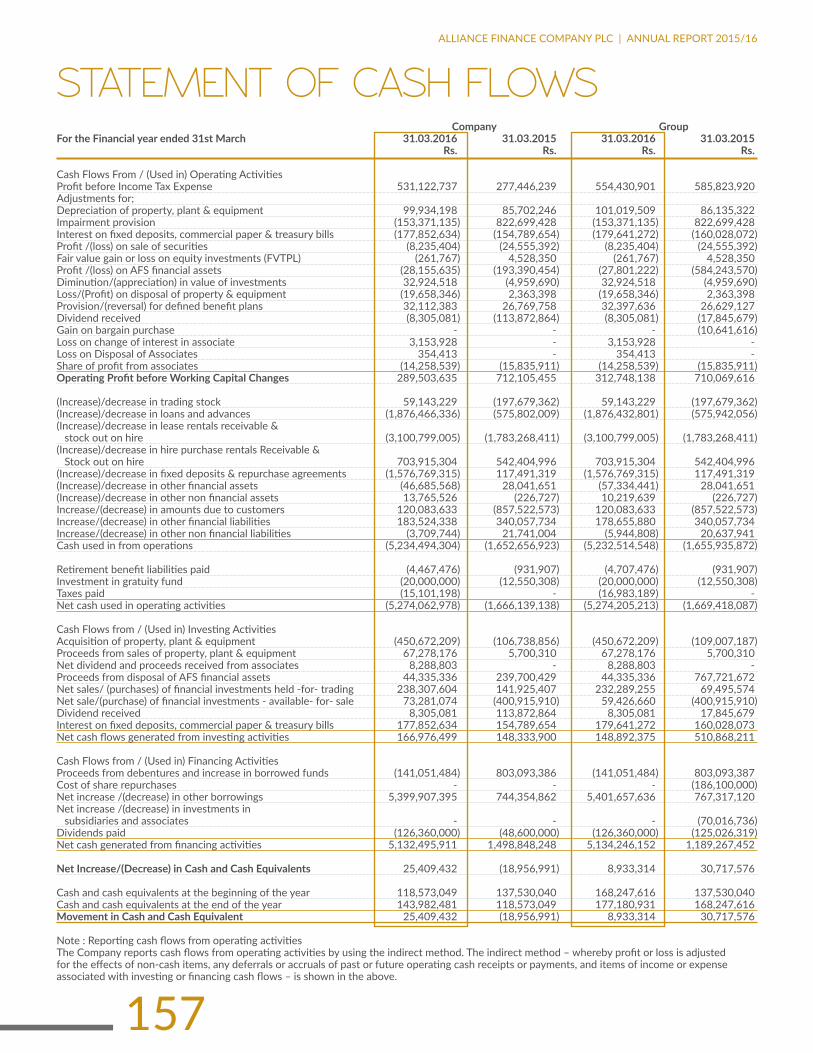
157
ALLIANCE FINANCE COMPANY PLC | ANNUAL REPORT 2015/16
Company GroupFortheFinancialyearended31stMarch 31.03.2016 31.03.2015 31.03.2016 31.03.2015 Rs. Rs. Rs. Rs.
Cash Flows From / (Used in) Operating ActivitiesProfit before Income Tax Expense 531,122,737 277,446,239 554,430,901 585,823,920Adjustments for;Depreciation of property, plant & equipment 99,934,198 85,702,246 101,019,509 86,135,322Impairment provision (153,371,135) 822,699,428 (153,371,135) 822,699,428Interest on fixed deposits, commercial paper & treasury bills (177,852,634) (154,789,654) (179,641,272) (160,028,072)Profit /(loss) on sale of securities (8,235,404) (24,555,392) (8,235,404) (24,555,392)Fair value gain or loss on equity investments (FVTPL) (261,767) 4,528,350 (261,767) 4,528,350Profit /(loss) on AFS financial assets (28,155,635) (193,390,454) (27,801,222) (584,243,570)Diminution/(appreciation) in value of investments 32,924,518 (4,959,690) 32,924,518 (4,959,690)Loss/(Profit) on disposal of property & equipment (19,658,346) 2,363,398 (19,658,346) 2,363,398Provision/(reversal) for defined benefit plans 32,112,383 26,769,758 32,397,636 26,629,127Dividend received (8,305,081) (113,872,864) (8,305,081) (17,845,679)Gain on bargain purchase - - - (10,641,616)Loss on change of interest in associate 3,153,928 - 3,153,928 -Loss on Disposal of Associates 354,413 - 354,413 -Share of profit from associates (14,258,539) (15,835,911) (14,258,539) (15,835,911)OperatingProfitbeforeWorkingCapitalChanges 289,503,635 712,105,455 312,748,138 710,069,616
(Increase)/decrease in trading stock 59,143,229 (197,679,362) 59,143,229 (197,679,362)(Increase)/decrease in loans and advances (1,876,466,336) (575,802,009) (1,876,432,801) (575,942,056)(Increase)/decrease in lease rentals receivable & stock out on hire (3,100,799,005) (1,783,268,411) (3,100,799,005) (1,783,268,411)(Increase)/decrease in hire purchase rentals Receivable & Stock out on hire 703,915,304 542,404,996 703,915,304 542,404,996(Increase)/decrease in fixed deposits & repurchase agreements (1,576,769,315) 117,491,319 (1,576,769,315) 117,491,319(Increase)/decrease in other financial assets (46,685,568) 28,041,651 (57,334,441) 28,041,651(Increase)/decrease in other non financial assets 13,765,526 (226,727) 10,219,639 (226,727)Increase/(decrease) in amounts due to customers 120,083,633 (857,522,573) 120,083,633 (857,522,573)Increase/(decrease) in other financial liabilities 183,524,338 340,057,734 178,655,880 340,057,734Increase/(decrease) in other non financial liabilities (3,709,744) 21,741,004 (5,944,808) 20,637,941Cash used in from operations (5,234,494,304) (1,652,656,923) (5,232,514,548) (1,655,935,872)
Retirement benefit liabilities paid (4,467,476) (931,907) (4,707,476) (931,907)Investment in gratuity fund (20,000,000) (12,550,308) (20,000,000) (12,550,308)Taxes paid (15,101,198) - (16,983,189) -Net cash used in operating activities (5,274,062,978) (1,666,139,138) (5,274,205,213) (1,669,418,087)
Cash Flows from / (Used in) Investing ActivitiesAcquisition of property, plant & equipment (450,672,209) (106,738,856) (450,672,209) (109,007,187)Proceeds from sales of property, plant & equipment 67,278,176 5,700,310 67,278,176 5,700,310Net dividend and proceeds received from associates 8,288,803 - 8,288,803 -Proceeds from disposal of AFS financial assets 44,335,336 239,700,429 44,335,336 767,721,672Net sales/ (purchases) of financial investments held -for- trading 238,307,604 141,925,407 232,289,255 69,495,574Net sale/(purchase) of financial investments - available- for- sale 73,281,074 (400,915,910) 59,426,660 (400,915,910)Dividend received 8,305,081 113,872,864 8,305,081 17,845,679Interest on fixed deposits, commercial paper & treasury bills 177,852,634 154,789,654 179,641,272 160,028,073Net cash flows generated from investing activities 166,976,499 148,333,900 148,892,375 510,868,211
Cash Flows from / (Used in) Financing ActivitiesProceeds from debentures and increase in borrowed funds (141,051,484) 803,093,386 (141,051,484) 803,093,387Cost of share repurchases - - - (186,100,000)Net increase /(decrease) in other borrowings 5,399,907,395 744,354,862 5,401,657,636 767,317,120Net increase /(decrease) in investments in subsidiaries and associates - - - (70,016,736)Dividends paid (126,360,000) (48,600,000) (126,360,000) (125,026,319)Net cash generated from financing activities 5,132,495,911 1,498,848,248 5,134,246,152 1,189,267,452
NetIncrease/(Decrease)inCashandCashEquivalents 25,409,432 (18,956,991) 8,933,314 30,717,576
Cash and cash equivalents at the beginning of the year 118,573,049 137,530,040 168,247,616 137,530,040Cash and cash equivalents at the end of the year 143,982,481 118,573,049 177,180,931 168,247,616MovementinCashandCashEquivalent 25,409,432 (18,956,991) 8,933,314 30,717,576
Note : Reporting cash flows from operating activitiesThe Company reports cash flows from operating activities by using the indirect method. The indirect method – whereby profit or loss is adjusted for the effects of non-cash items, any deferrals or accruals of past or future operating cash receipts or payments, and items of income or expense associated with investing or financing cash flows – is shown in the above.
STATEmENT OF CASh FlOwS
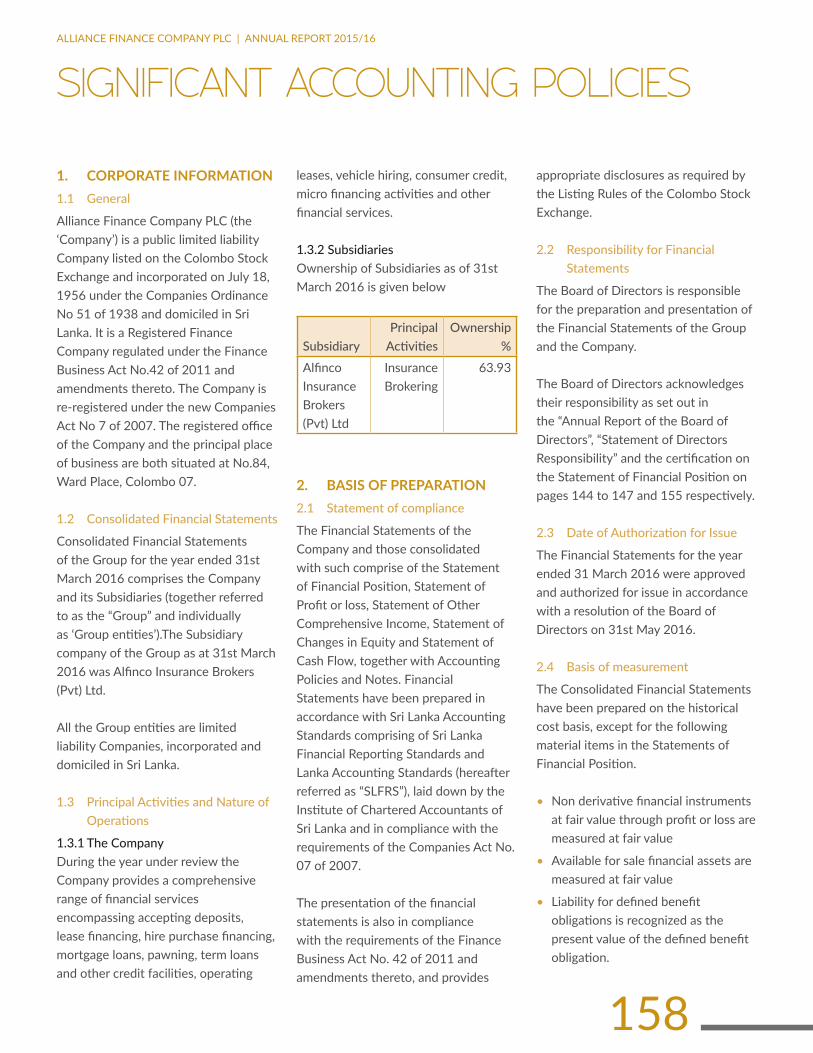
158
ALLIANCE FINANCE COMPANY PLC | ANNUAL REPORT 2015/16
1. CORPORATE INFORMATION1.1 General
Alliance Finance Company PLC (the ‘Company’) is a public limited liability Company listed on the Colombo Stock Exchange and incorporated on July 18, 1956 under the Companies Ordinance No 51 of 1938 and domiciled in Sri Lanka. It is a Registered Finance Company regulated under the Finance Business Act No.42 of 2011 and amendments thereto. The Company is re-registered under the new Companies Act No 7 of 2007. The registered office of the Company and the principal place of business are both situated at No.84, Ward Place, Colombo 07.
1.2 Consolidated Financial statements
Consolidated Financial Statements of the Group for the year ended 31st March 2016 comprises the Company and its Subsidiaries (together referred to as the “Group” and individually as ‘Group entities’).The Subsidiary company of the Group as at 31st March 2016 was Alfinco Insurance Brokers (Pvt) Ltd.
All the Group entities are limited liability Companies, incorporated and domiciled in Sri Lanka.
1.3 Principal Activities and Nature of Operations
1.3.1 The CompanyDuring the year under review the Company provides a comprehensive range of financial services encompassing accepting deposits, lease financing, hire purchase financing, mortgage loans, pawning, term loans and other credit facilities, operating
leases, vehicle hiring, consumer credit, micro financing activities and other financial services.
1.3.2 subsidiariesOwnership of Subsidiaries as of 31st March 2016 is given below
subsidiaryPrincipal
Activitiesownership
%
Alfinco Insurance Brokers (Pvt) Ltd
Insurance Brokering
63.93
2. BASIS OF PREPARATION2.1 statement of compliance
The Financial Statements of the Company and those consolidated with such comprise of the Statement of Financial Position, Statement of Profit or loss, Statement of Other Comprehensive Income, Statement of Changes in Equity and Statement of Cash Flow, together with Accounting Policies and Notes. Financial Statements have been prepared in accordance with Sri Lanka Accounting Standards comprising of Sri Lanka Financial Reporting Standards and Lanka Accounting Standards (hereafter referred as “SLFRS”), laid down by the Institute of Chartered Accountants of Sri Lanka and in compliance with the requirements of the Companies Act No. 07 of 2007.
The presentation of the financial statements is also in compliance with the requirements of the Finance Business Act No. 42 of 2011 and amendments thereto, and provides
appropriate disclosures as required by the Listing Rules of the Colombo Stock Exchange.
2.2 responsibility for Financial statements
The Board of Directors is responsible for the preparation and presentation of the Financial Statements of the Group and the Company.
The Board of Directors acknowledges their responsibility as set out in the “Annual Report of the Board of Directors”, “Statement of Directors Responsibility” and the certification on the Statement of Financial Position on pages 144 to 147 and 155 respectively.
2.3 Date of Authorization for Issue
The Financial Statements for the year ended 31 March 2016 were approved and authorized for issue in accordance with a resolution of the Board of Directors on 31st May 2016.
2.4 Basis of measurement
The Consolidated Financial Statements have been prepared on the historical cost basis, except for the following material items in the Statements of Financial Position.
• Non derivative financial instruments at fair value through profit or loss are measured at fair value
• Available for sale financial assets are measured at fair value
• Liability for defined benefit obligations is recognized as the present value of the defined benefit obligation.
SigNiFiCANT ACCOuNTiNg pOliCiES

159
ALLIANCE FINANCE COMPANY PLC | ANNUAL REPORT 2015/16
• Land and buildings which are measured at cost at the time of acquisition, subsequently measured at revalued amounts, which are the fair values at the date of revaluation.
2.5 Functional and presentation currency
The Financial Statements are presented in Sri Lankan Rupees which is the Group’s functional and presentation currency. All financial information presented in Sri Lankan Rupees has been rounded to the nearest rupee, unless otherwise stated.
2.6 Presentation of financial statements
The Groups presents its Statement of Financial Position broadly in order that reflects their relative liquidity and maturity pattern. No adjustments have been made for inflationary factors affecting the Financial Statements. An analysis regarding recovery or settlement within 12 months after the reporting date (current) and more than 12 months after the reporting date (non–current) is presented in note 46 on pages 215 and 216.
2.7 Materiality & Aggregation
In compliance with LKAS 01 on Presentation of Financial Statements, each material class of similar items is presented separately in the Financial Statements. Items of dissimilar nature or functions are presented separately, unless they are immaterial.
Financial assets and financial liabilities are offset and the net amount reported in the Statement of Financial Position
only when there is a legally enforceable right to offset the recognized amounts and there is an intention to settle on a net basis, or to realize the assets and settle the liability simultaneously. Income and expenses are not offset in the Statement of Profit or loss unless required or permitted by any Accounting Standard or interpretations, and as specifically disclosed in the accounting policies.
2.8 Comparative Information
The comparative information is re-classified wherever necessary to conform to the current year’s presentation.
2.9 Use of significant accounting Judgments, Estimates and Assumptions
The preparation of the Consolidated Financial Statements in conformity with Sri Lanka Accounting Standards, requires management to make judgments, estimates and assumptions that affect the application of accounting policies and the reported amounts of assets, liabilities, income and expenses. Actual results may differ from these estimates.
Estimates and underlying assumptions are reviewed on an ongoing basis. Revisions to accounting estimates are recognised in the period in which the estimates are revised and in any future periods affected.
Information about critical judgments, estimates and assumptions in applying accounting policies that could have
a significant effect on the Financial Statements of the Group are as follows:
2.9.1 Going ConcernThe Directors have made an assessment of its ability to continue as a going concern and are satisfied that it has the resources to continue in business for the foreseeable future. Furthermore, the Directors are not aware of any material uncertainties that may cast significant doubt upon the Group’s ability to continue as a going concern and they do not intend either to liquidate or to cease operations of the Group. Therefore, the Financial Statements continue to be prepared on a going concern basis.
2.9.2 Useful life-time of the Property and equipment
The Group review the residual values, useful lives and methods of depreciation of assets at each reporting date. Judgement of the management is exercised in the estimation of these values, rates, methods and hence they are subject to uncertainty.
2.9.3 impairment losses on loans and Advances (Leases, Hire Purchase & Other Loans)
The Group review its individually significant loans and advances at each reporting date to assess whether an impairment loss should be provided for in the Statement of Profit or Loss. In particular, management’s judgment is required in the estimation of the amount and timing of future cash flows when determining the impairment loss. These estimates are based on assumptions about a number of factors
160
ALLIANCE FINANCE COMPANY PLC | ANNUAL REPORT 2015/16
and actual results may differ, resulting in future changes to the impairment allowance made.
Loans and advances that have been assessed individually and found to be not impaired or not individually significant and all individually insignificant loans and advances are then assessed collectively, to determine whether provision should be made due to incurred loss events for which there is objective evidence, but the effects of which are not yet evident.
The collective provision for groups of homogeneous loans is established using statistical methods or, a formula approach based on historical loss rate experience, using the statistical analysis of historical data on delinquency to estimate the amount of loss. Management applies judgement to ensure that the estimate of loss arrived at on the basis of historical information is appropriately adjusted to reflect the economic conditions and product mix at the reporting date. The loss rates are regularly benchmarked against actual loss experience.
In assessing the need for collective loss provision, management considers factors such as credit quality ( such as loan to collateral ratio, level of restructured performing loans, level of arrears, credit utilization etc.) portfolio size, judgements on the effect of concentration of risks and economic factors (including levels of unemployment, inflation, interest rates).
2.9.4 impairment of available for sale investments
The Group reviews its debt securities classified as available for sale investments at each reporting date to assess whether they are impaired. This requires similar judgment as applied on the individual assessment of loans and advances.
The Group also records impairment charges on available for sale equity investments when there has been a significant or prolonged decline in the fair value below their cost. The determination of what is ‘significant’ or ‘prolonged’ requires judgment. In making this judgment, the Group evaluates, amongst other factors, historical share price movements, duration and extent up to which the fair value of an investment is less than its cost.
2.9.5 TaxationThe Group is subject to income taxes and other taxes including VAT on financial services. Significant judgement was required to determine the total provision for current, deferred and other taxes pending the issue of tax guidelines on the treatment of the adoption of SLFRS in the Financial Statements and the taxable profit for the purpose of imposition of taxes. Uncertainties exist, with respect to the interpretation of the applicability of tax laws, at the time of the preparation of these financial statements. The Group recognized assets and liabilities for current, deferred and other taxes based on estimates of whether
additional taxes will be due. Where the final tax outcome of these matters is different from the amounts that were initially recorded, such differences will impact the income, deferred and tax amounts in the period in which the determination is made.
2.9.6 Deferred Tax AssetsDeferred tax assets are recognised in respect of tax losses to the extent that it is probable that future taxable profits will be available against which such tax losses can be set-off. Judgement is required to determine the amount of deferred tax assets that can be recognised, based on the likely timing and level of future taxable profits, together with the future tax-planning strategies.
2.9.7 Defined Benefit PlansThe cost of defined benefit plans are determined using actuarial valuations. An actuarial valuation involves making various assumptions which may differ from actual developments in the future. These include the determination of the discount rate, future salary increases, mortality rates etc. Due to the complexity of the valuation, the underlying assumptions and their long term nature, a defined benefit obligation is highly sensitive to changes in these assumptions. All assumptions are reviewed at each reporting date.
In determining the appropriate discount rate, management considers the interest rates of Sri Lanka Government bonds with extrapolated maturities corresponding to the expected duration
Significant Accounting policies Contd.

161
ALLIANCE FINANCE COMPANY PLC | ANNUAL REPORT 2015/16
of the defined benefit obligation. The mortality rate is based on publicly available mortality tables. Future salary increases are based on expected future inflation rates and expected future salary increase rate of the Group.
2.9.8 Fair Value of Property and equipment
The Land and Buildings of the Group are reflected at fair value. The Group engaged independent valuation specialist to determine fair value of land and building. When current market prices of similar assets are available, such evidences are considered in estimating fair values of these assets.
2.9.9 Fair Value of Financial instrumentsThe determination of fair values of financial assets and financial liabilities recorded on the Statement of Financial Position for which there is no observable market price are determined using a variety of valuation techniques that include the use of mathematical models. The Group measures fair value using the fair value hierarchy that reflects the significant of input used in making measurements.
2.10 Events after the Reporting Period
Events after the reporting period are those events, favourable and unfavourable, that occur between the reporting date and the date when the Financial Statements are authorized for issue.
3. SUMMARY OF SIGNIFICANT ACCOUNTING POLICIES
The significant accounting policies applied by the Group in preparation of the Financial Statements are included below. The accounting policies set out below have been applied consistently to all periods presented in these Financial Statements of the Group, unless otherwise indicated.
3.1 Basis of Consolidation
The Group’s Financial Statements comprise consolidation of the Financial Statements of the Company and its Subsidiaries in terms of the Sri Lanka Accounting Standard – SLFRS 12 (Consolidation Financial Statements).
3.1.1 Business Combinations and Goodwill
Business combinations are accounted for using the acquisition method as per the requirements of Sri Lanka Accounting Standard – SLFRS 03 (Business Combinations.)
The Group measures goodwill at the acquisition date as the fair value of the consideration transferred including the recognised amount of any non-controlling interests in the acquiree, less the net recognised amount (generally fair value) of the identifiable assets acquired and liabilities assumed, all measured as of the acquisition date. When the excess is negative, a bargain purchase gain is recognised immediately in profit or loss.
The Group elects on a transaction-by-transaction basis whether to measure non-controlling interest at its fair value, or at its proportionate share of the recognized amount of the identifiable net assets, at the acquisition date.
The consideration transferred does not include amounts related to the settlement of pre-existing relationships. Such amounts are generally recognised in profit or loss.
Transactions costs, other than those associated with the issue of debt or equity securities, that the Group incurs in connection with a business combination are expensed as incurred.
3.1.2 subsidiariesSubsidiaries are those enterprises controlled by the Company. Control exists when the Company (the Parent) holds more than 50% of the voting rights and/or has the power, directly or indirectly, to govern the financial and operational policies of an enterprise to obtain benefits from its activities.
The Financial Statements of Subsidiaries are fully consolidated from the date on which control is transferred to the Company and continue to be consolidated until the date when such control ceases. The Financial Statements of the Company’s Subsidiaries are same reporting year as per the Company.

162
ALLIANCE FINANCE COMPANY PLC | ANNUAL REPORT 2015/16
The cost of an acquisition is measured at fair value of the consideration, including contingent consideration, given on the date of transfer of title. The acquired identifiable assets, liabilities and contingent liabilities are measured at their fair values at the date of acquisition. Subsequent to the initial measurement the Company continues to recognize the investments in Subsidiaries at cost.
The total assets and liabilities of the Subsidiaries as at the reporting date are included in the Consolidated Statements of Financial Position. The total profit or loss for the year of the Subsidiaries is included in the Consolidated Statements of Profit or Loss.
The non-controlling interest is presented in the Consolidated Statements of Financial Position within equity; separately form the equity attributable to the equity holders of the Company. Non-controlling interest in the profit or loss of the Group is disclosed in the Consolidated Statement of Comprehensive Income. Total Comprehensive income is allocated to the owners of the parent and to the non-controlling interests even if this results in the non-controlling interests having a deficit balance.
Where Subsidiaries have been acquired or sold during the year, their operating results have been included from the date of acquisition or to the date of disposal.
Upon the loss of control, the Group derecognized the assets and liabilities of the Subsidiary, any non-controlling interests and the other components of equity related to the Subsidiary. Any surplus or deficit arising on the loss of control is recognized in the Statement of Changes in Equity. If the Group retains any interest in the previous Subsidiary, then such interest is measured at fair value at the date that control is lost. Subsequently it is accounted for as an equity-accounted investee or in accordance with the Group’s accounting policy for financial instruments depending on the level of influence retained.
3.1.3 associates and Jointly Controlled Entities
Associates are those entities which the Group has significant influence, but not control or power to govern the financial and operating policies of the entities so as to obtain benefits from their activities.
The Group Financial Statements include the Group’s share of the total recognized gains and losses of associates on an equity accounted basis, from the date that significant influence commences until the date that significant influence ceases.
Accordingly, under the Equity Method, investment is Associates are carried at cost plus post-acquisition changes in the Group’s share of net assets of the Associates and are reported as a separate line item in the Statement of Financial Position. The Statement
of Profit or Loss reflects the share of current year’s profit or loss of the Associates.
When the Group and associate’s share of losses exceed the carrying amount of the associate, the carrying amount is reduced to nil and recognition of further losses discontinued except to the extent that the Group has incurred obligations or has made payments on behalf of the Investee.
Jointly controlled entities are those entities where the Group has entered into a contractual agreement to share the control over strategic, financial and operating decisions relating to economic activities of the entities through unanimous consent of other parties sharing control.
3.1.4 Transactions Eliminated on Consolidation
Intra-group balances and any income and expenses arising from intra- group transactions are eliminated in preparing the Consolidated Financial Statements. Unrealized losses are eliminated in the same way as unrealized gains, except that they are only eliminated to the extent that there is no evidence of impairment.
3.2 Foreign Currency Transactions and Balances
Monetary assets and liabilities denominated in foreign currencies have been translated into local currency as per the exchange ruling at the date of the Statement of Financial Position
Significant Accounting policies Contd.

163
ALLIANCE FINANCE COMPANY PLC | ANNUAL REPORT 2015/16
whilst all non-monetary items are reported at the rate prevailing at the time transactions were affected.
3.3 Cash and Cash equivalents
Cash and cash equivalents comprise cash in hand, balances with banks, and money at call & short notice.
For the purpose of cash flow statement, cash and cash equivalents consist of cash in hand and deposits in banks net of outstanding bank overdrafts. Investments with short maturities i.e. three months or less from the date of acquisition are also treated as cash equivalents.
They are brought to Financial Statements at their face values or the gross values, where appropriate. Cash and cash equivalents are carried at amortized cost in the Statement of Financial Position.
3.4 Financial Instruments – Initial Recognition and Subsequent Measurement
Financial assets within the scope of LKAS 39 are classified as loans and advances, financial investments held to maturity, financial investments available-for-sale, financial investments held for trading or financial assets held for trading pledged as collateral as appropriate. The group determines the classification of its financial assets at initial recognition.
3.4.1 Date of RecognitionAll financial assets and liabilities except ‘Regular way traders’ are initially recognised on the trade date, i.e., the date that the Group becomes a party to the contractual provisions of the instrument. ‘Regular ways trades’ mean purchases or sales of financial assets that require delivery of assets within the time frame generally established by regulation or convention in the market place.
3.4.2 Initial Measurement of Financial instruments
The classification of financial instruments at initial recognition depends on their purpose and characteristics and the management’s intention in acquiring them. All financial instruments are measured initially at their fair value plus transaction costs, except in the case of financial assets and financial liabilities recorded at fair value through profit or loss.
Transaction cost in relation to financial assets and financial liabilities at fair value through profit or loss are dealt with through the Statement of Profit or Loss.
3.4.3 Non-derivative Financial AssetsThe Group recognizes non-derivative financial assets by the following four categories:
• Financial assets at fair value through profit or loss
a) Held for trading; orb) Designated at fair value through
profit or loss
• Held-to maturity investments
• Loans and receivables
• Available-for-sale financial investments
Subsequent measurement of financial assets depends on their classification.
3.4.3.1 Financial Assets at Fair Value through Profit or LossA financial asset is classified as fair value through profit or loss if it is held for trading or is designated at fair value through profit of loss.
a) FinancialAssetsHeldforTradingFinancial assets are classified as held for trading if they are acquired principally for the purpose of selling or repurchasing in the near term or holds as a part of a portfolio that is managed together for short-term profit or position taking.
Financial assets held for trading are recorded in the Statement of Financial Position at fair value. Changes in fair value are recognized in ‘Net trading income’. Interest income on financial assets held for trading are recognised under ‘Interest Income’ and dividend income is recorded in ‘Other Operating Income’ according to the terms of the contract, or when the right to the payment has been established.
164
ALLIANCE FINANCE COMPANY PLC | ANNUAL REPORT 2015/16
Financial assets held for trading includes instruments such as Government and other debt securities and equity instrument that have been acquired principally for the purpose of selling or repurchasing in the near term.
b) Financial assets designated at fair value through profit or loss (FVTPL)
Financial assets may be designated by management at fair value through profit or loss in the following circumstances:
• The designation eliminates or significantly reduces the inconsistent treatment that would otherwise arise from measuring the assets or recognizing gains or losses on them on a different basis or
• The assets are part of a group of financial assets, financial liabilities or both, which are managed and their performance evaluated and reported on a fair value basis.
Financial assets at fair value through profit or loss are recorded in the Statement of Financial Position at fair value. Changes in fair value are recorded in ‘Net gain or loss on financial instrument designated at fair value through profit or loss. Interest earned or incurred is accrued in ‘Interest income’ using the effective interest rate (EIR), whilst dividend income is recorded in ‘Other operating income’ when the right to the payment has been established.
3.4.3.2 Held-to-maturity Financial InvestmentsHeld-to-maturity financial investments are non–derivative financial assets with fixed or determinable payments and fixed maturities, which the Group has the intention and ability to hold to maturity.
Subsequent to initial recognition, held to maturity financial investments are measured at amortised cost using the Effective Interest Rate (EIR), less impairment. Amortised cost is calculated by taking into account any discount or premium on acquisition and fees that are an integral part of the EIR. The amortisation is included in ‘Interest income’ in the Statement of Profit or Loss. The losses arising from impairment of such investments are recognised in the Statement of Profit or Loss line ‘Impairment gain/(loss) on financial investment’.
If the Group were to sell or reclassify more than an insignificant amount of held to maturity investments before maturity (other than in certain specific circumstances), the entire category would be tainted and would have to be reclassified as Available-for-sale. Furthermore, the Group would be prohibited from classifying any financial asset as held to maturity during the following two years.
The Group has not designated any financial instrument as Held-to-Maturity Financial Investment.
3.4.3.3 Due from Banks and Loans and Receivables from CustomersDue from banks and loans & receivables from customers include non – derivative financial assets with fixed or determinable payments that are not quoted in an active market.
‘Due from banks and loans and receivables from customers’ include Loans and Advances and Lease Receivables of the Group.
After initial measurement, amounts ‘Due from banks’ and ‘Loans and receivables from customers’ are subsequently measured at amortised cost using the EIR, less provision for impairment. Amortised cost is calculated by taking into account any discount or premium on acquisition and fees and costs that are an integral part of the EIR. The amortisation is included in ‘Interest income’ in the Statement of Profit or Loss. The losses arising from impairment are recognised in the Statement of Profit or loss in ‘Impairment charges on loans & other losses’.
3.4.3.4 Available for Sale Financial InvestmentsAvailable for sale investments include equity and debt securities. Equity investments classified as available for sale are those which are neither classified as held for trading nor designated at fair value through profit or loss. Debt securities in this category are intended to be held for an indefinite period of time and may be sold in response to needs for
Significant Accounting policies Contd.

165
ALLIANCE FINANCE COMPANY PLC | ANNUAL REPORT 2015/16
liquidity or in response to changes in the market conditions. The Group has not designated any loans or receivables as available for sale. After initial measurement, available for sale financial investments are subsequently measured at fair value.
Unrealised gains and losses are recognised directly in equity through Other Comprehensive Income in the ‘Available for sale reserve’. When the investment is disposed of, the cumulative gain or loss previously recognised in Equity is recognised in the Statement of Profit or Loss in ‘Other operating income’. Where the Group hold more than one investment in the same security, they are deemed to be disposed of on a first–in first–out basis. Interest earned whilst holding available for sale financial investments is reported as Interest Income using the EIR. Dividends earned whilst holding available for sale financial investments are recognised in the Statement of Profit or Loss as ‘other operating income’ when the right to receive the payment has been established. The losses arising from impairment of such investments are recognised in the Statement of Profit or Loss in ‘Impairment losses on financial investments’ and removed from the ‘Available for sale reserve’.
3.4.4 ‘Day 1’ Profit or LossWhen the transaction price differs from the fair value of other observable current market transactions in the same instrument, or based on a valuation technique whose variables include
only data from observable markets, the Group immediately recognises the difference between the transaction price and fair value (a ‘Day 1’ profit or loss) in ‘Net trading income’.
3.4.5 Reclassification of Financial instruments
The Group may reclassify financial assets (other than those designated at FVTPL upon initial recognition), in certain circumstances:
• out of the ‘held for trading’ category and into the ‘available for sale’or ‘loans and receivables’, or ’held to maturity’ categories.
• out of the ‘available for sale’ category and into the ’loans and receivables’, ‘held for trading category’ or ‘held- to-maturity’.
Reclassifications are recorded at fair value at the date of reclassification, which becomes the new amortised cost. For a financial asset with a fixed maturity reclassified out of the ’available for sale’ category, any previous gain or loss on that asset that has been recognised in Equity is amortised to profit or loss over the remaining life of the asset using the EIR. In the case of a financial asset does not have a fixed maturity, the gain or loss is recognised in the profit or loss when the financial asset sold or disposed of. Any difference between the new amortised cost and the expected cash flows is also amortised over the remaining life of the asset using the EIR. If the asset is subsequently determined to be impaired, then the amount
recorded in equity is recycled to the Statement of Profit or Loss.
Out of the ‘held for trading’ category and into the ‘loans and receivables’ category if it meets the definition of loans and receivables and the Group has the intention and ability to hold the financial asset for the foreseeable future or until maturity. If a financial asset is reclassified, and if the Group subsequently increases its estimates of future cash receipts as a result of increased recoverability of those cash receipts, the effect of that increase is recognised as an adjustment to the EIR from the date of the change in estimate.
Reclassification is at the election of management, and is determined on an instrument by instrument basis.
3.4.6 Derecognition of Financial AssetsA financial asset (or, where applicable a part of a financial asset or part of a group of similar financial assets) is derecognised when:
• The rights to receive cash flows from the asset have expired
• The Group has transferred its rights to receive cash flows from the asset or has assumed an obligation to pay the received cash flows in full without material delay to a third party under a ‘pass–through’ arrangement; and either:
• The Group has transferred substantially all the risks and rewards of the asset; or

166
ALLIANCE FINANCE COMPANY PLC | ANNUAL REPORT 2015/16
• The Group has neither transferred nor retained substantially all the risks and rewards of the asset, but has transferred control of the asset.
On derecognition of a financial asset, the difference between the carrying amount of the asset, and consideration received and any cumulative gain or loss that had been recognised in the Other Comprehensive Income is recognised in the profit or loss.
When the Group has transferred its rights to receive cash flows from an asset or has entered into a pass–through arrangement, and has neither transferred nor retained substantially all of the risks and rewards of the asset nor transferred control of the asset, the asset is recognised to the extent of the Group’s continuing involvement in the asset. In that case, the Group also recognises an associated liability.
The transferred asset and the associated liability are measured on a basis that reflects the rights and obligations that the Group has retained. Continuing involvement that takes the form of a guarantee over the transferred asset is measured at the lower of the original carrying amount of the asset and the maximum amount of consideration that the Group could be required to repay.
3.4.7 impairment of Financial assetsThe Group assesses at each reporting date, whether there is any objective evidence that a financial asset or a group of financial assets is impaired. A financial asset or a group of financial
assets is deemed to be impaired if, and only if, there is objective evidence of impairment as a result of one or more events that have occurred after the initial recognition of the asset (an ‘incurred loss event’) and that loss event (or events) has an impact on the estimated future cash flows of the financial asset or the group of financial assets that can be reliably estimated.
3.4.7.1 Loans, advances to customers, leases and hire purchasesLosses for impaired loans are recognised promptly when there is objective evidence that impairment of a loan or portfolio of loans has occurred. Impairment allowances are calculated on individual loans and for groups of loans, this is done collectively. Impairment losses are recorded as charges to the Statement of Profit or Loss. The carrying amount of impaired loans on the reporting date is reduced through the use of impairment allowance accounts. Losses expected from future events are not recognised.
Individually assessed loans & advances, leases and hire purchases
For all loans that are considered individually significant, the Group assesses on a case-by-case basis at each end of the reporting date whether there is any objective evidence that a loan is impaired. The criteria used to determine that there is such objective evidence includes:
• known cash flow difficulties experienced by the borrower;
• past due contractual payments of either principal or interest;
• breach of loan covenants or conditions;
• the probability that the borrower will enter bankruptcy or other financial realisation; and
• a significant downgrading in credit rating by an external credit rating agency.
For those loans where objective evidence of impairment exists, impairment losses are determined considering the following factors:
• Group’s aggregate exposure to the customer;
• the viability of the customer’s business model and their capacity to trade successfully out of financial difficulties and generate sufficient cash flow to service debt obligations;
• the amount and timing of expected receipts and recoveries;
• the complexity of determining the aggregate amount and ranking of all creditor claims and the extent to which legal and insurance uncertainties are evident;
• the realisable value of security and likelihood of successful repossession; and
• the likely deduction of any costs involved in recovery of amounts outstanding;
• Impairment losses are calculated by discounting the expected future cash flows of a loan at its original effective interest rate and comparing the present value with the loan’s current carrying amount. The impairment allowances on individually significant accounts
Significant Accounting policies Contd.

167
ALLIANCE FINANCE COMPANY PLC | ANNUAL REPORT 2015/16
are reviewed more regularly when circumstances require. This normally encompasses re-assessment of the enforceability of any collateral held and the timing and amount of actual and anticipated receipts. Individually assessed impairment allowances are only released when there is reasonable and objective evidence of a reduction in the established loss estimate.
Collectivelyassessedloans,advances,leasesandhirepurchasesImpairment is assessed on a collective basis in two circumstances:
• to cover losses which have been incurred but have not yet been identified on loans subject to individual assessment; and
• for homogeneous groups of loans that are not considered individually significant.
IncurredbutnotyetidentifiedimpairmentIndividually assessed loans for which no evidence of loss has been specifically identified on an individual basis are grouped together according to their credit risk characteristics for the purpose of calculating an estimated collective loss. This reflects impairment losses that the Group has incurred as a result of events occurring before the reporting date, which the Group is not able to identify on an individual loan basis, and that can be reliably estimated. These losses will only be individually identified in the future. As soon as information becomes available which identifies losses on individual
loans within the group, those loans are removed from the group and assessed on an individual basis for impairment.
The collective impairment allowance is determined after taking into account:
• historical loss experience in portfolios of similar credit risk; and
• management’s experienced judgment as to whether current economic and credit conditions are such that the actual level of inherent losses at the end of the reporting date is likely to be greater or less than that suggested by historical experience.
Homogeneousgroupsofloans,advances,leasesandhirepurchasesStatistical methods are used to determine impairment losses on a collective basis for homogeneous groups of loans. Losses in these groups of loans are recorded on an individual basis when individual loans are written off, at which point they are removed from the group.
Following method is used to calculate historical loss experience on a collective basis:
- Net flow Rate methodUnder this methodology the movement in the outstanding balance of customers in to bad categories over the periods are used to estimate the amount of loans that will eventually be written off as a result of the events occurring before the end of the reporting date which the Group is not able to identify
on an individual loan basis, and that can be reliably estimated.
Under above methodology, loans are grouped into ranges according to the number of days in arrears and statistical analysis is used to estimate the likelihood that loans in each range will progress through the various stages of delinquency, and ultimately prove irrecoverable.
Current economic conditions and portfolio risk factors are also evaluated when calculating the appropriate level of allowance required covering inherent loss.
These additional macro and portfolio risk factors may include:
• Recent loan portfolio growth and product mix,
• Unemployment rates, Gross Domestic Production (GDP) growth, inflation
• Exchange rates, interest rates
• Changes in government laws and regulations
Write-offofloans,advances,leasesandhirepurchasesLoans, advances, leases and hire purchases (and the related impairment allowance accounts) are normally written off, either partially or in full, when there are no realistic prospects of recovery. Where such balances are secured, these are generally after receipt of any proceeds from the realisation of security.

168
ALLIANCE FINANCE COMPANY PLC | ANNUAL REPORT 2015/16
ReversalsofimpairmentIf the amount of an impairment loss decreases in a subsequent period, and the decrease can be related objectively to an event occurring after the impairment was recognised, the excess is written back by reducing the impairment allowance account accordingly. The write-back is recognised in the Statement of Profit or Loss.
3.4.7.2 Available for sale financial investmentsFor available for sale financial investments, the Group assesses at each reporting date whether there is objective evidence that an investment is impaired. In the case of debt instruments classified as available for sale, the Group assesses individually whether there is objective evidence of impairment.
However, the amount recorded for impairment is the cumulative loss measured as the difference between the amortised cost and the current fair value, less any impairment loss on that investment previously recognised in the Statement of Profit or loss. Future interest income is based on the reduced carrying amount and is accrued using the rate of interest used to discount the future cash flows for the purpose of measuring the impairment loss.
The interest income is recorded as part of ‘Interest and similar income’. If, in a subsequent period, the fair value of a debt instrument increases and the increase can be objectively related to a credit event occurring after the
impairment loss was recognised in the Statement of Profit or Loss, the impairment loss is reversed through the Statement of Profit or Loss.
In the case of equity investments classified as available for sale, objective evidence would also include a ‘significant’ or ‘prolonged’ decline in the fair value of the investment below its cost. Where there is evidence of impairment, the cumulative loss measured as the difference between the acquisition cost and the current fair value, less any impairment loss on that investment previously recognised in the Statement of Profit or Loss is removed from equity and recognised in the Statement of Profit or Loss. Impairment losses on equity investments are not reversed through the Statement of Profit or Loss; increases in the fair value after impairment are recognised in Other Comprehensive Income.
3.4.7.3 Held-to-maturity financial assetsAn impairment loss in respect of held-to-maturity financial assets measured at amortised cost is calculated as the difference between its carrying amount and the present value of estimated future cash flows discounted at the asset’s original EIR and is recognized in profit or loss. Interest on impaired assets continues to be recognized through the unwinding of discount. When a subsequent event caused the amount of impairment loss to decrease, the decrease in impairment loss is reversed through profit or loss.
3.4.8 Collateral valuationThe Group seeks to use collateral, where possible, to mitigate its risks on financial assets. The collateral comes in various forms such as cash, securities, letters of credit/guarantees, gold, real estate, receivables, and other non-financial assets. The fair value of collateral is generally assessed, at a minimum, at inception and based on the guidelines issued by the Central Bank of Sri Lanka.
Non-financial collateral, such as real estate, is valued based on data provided by third parties such as independent valuers and other independent sources.
3.4.9 Collateral repossessedThe Group’s policy is to determine whether a repossessed asset is best used for its internal operations or should be sold. Assets determined to be useful for the internal operations are transferred to their relevant asset category at the lower of their repossessed value or the carrying value of the original secured asset.
3.4.10 repurchase agreementSecurities purchased under agreements to resell at a specified future date are not recognised in the Statement of Financial Position. The consideration paid, including accrued interest, is recorded in the Statement of Financial Position, within ‘Other Financial Assets, reflecting the transaction’s economic substance as a loan by the Group. The difference between the purchase and resale prices is recorded in ‘Net interest income’ and is accrued over the life of the agreement using the EIR.
Significant Accounting policies Contd.
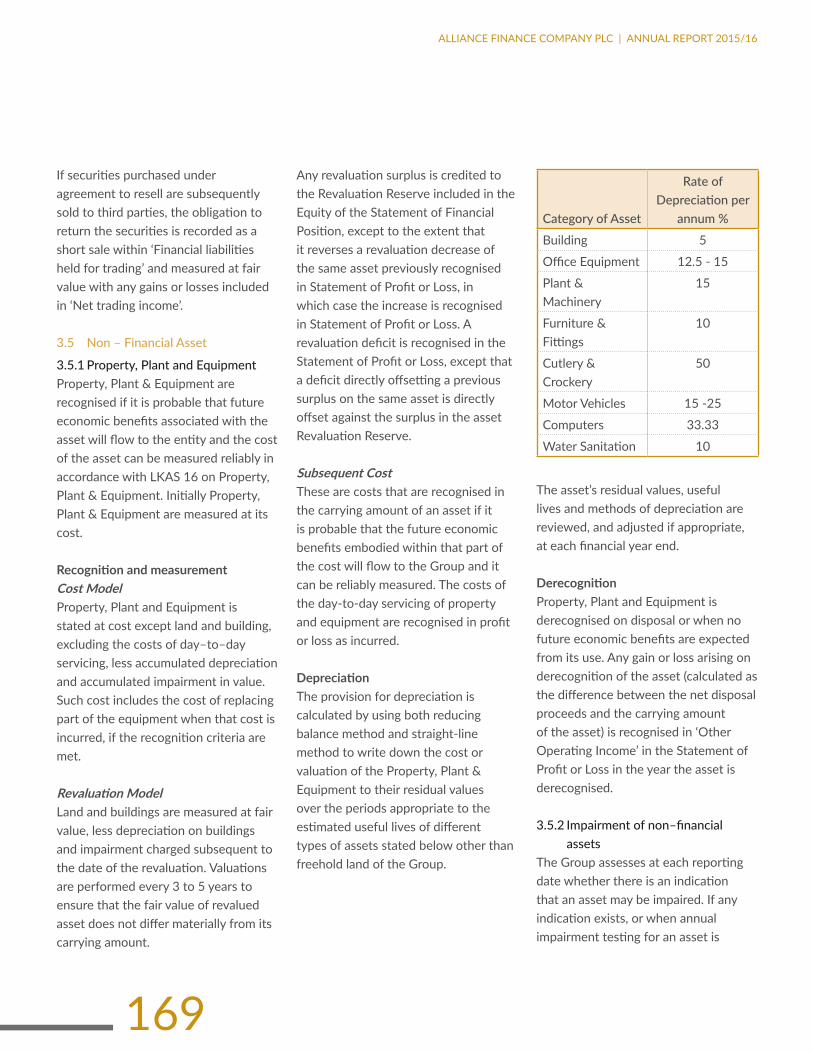
169
ALLIANCE FINANCE COMPANY PLC | ANNUAL REPORT 2015/16
If securities purchased under agreement to resell are subsequently sold to third parties, the obligation to return the securities is recorded as a short sale within ‘Financial liabilities held for trading’ and measured at fair value with any gains or losses included in ‘Net trading income’.
3.5 non – Financial asset
3.5.1 Property, Plant and EquipmentProperty, Plant & Equipment are recognised if it is probable that future economic benefits associated with the asset will flow to the entity and the cost of the asset can be measured reliably in accordance with LKAS 16 on Property, Plant & Equipment. Initially Property, Plant & Equipment are measured at its cost.
RecognitionandmeasurementCost ModelProperty, Plant and Equipment is stated at cost except land and building, excluding the costs of day–to–day servicing, less accumulated depreciation and accumulated impairment in value. Such cost includes the cost of replacing part of the equipment when that cost is incurred, if the recognition criteria are met.
RevaluationModelLand and buildings are measured at fair value, less depreciation on buildings and impairment charged subsequent to the date of the revaluation. Valuations are performed every 3 to 5 years to ensure that the fair value of revalued asset does not differ materially from its carrying amount.
Any revaluation surplus is credited to the Revaluation Reserve included in the Equity of the Statement of Financial Position, except to the extent that it reverses a revaluation decrease of the same asset previously recognised in Statement of Profit or Loss, in which case the increase is recognised in Statement of Profit or Loss. A revaluation deficit is recognised in the Statement of Profit or Loss, except that a deficit directly offsetting a previous surplus on the same asset is directly offset against the surplus in the asset Revaluation Reserve.
Subsequent CostThese are costs that are recognised in the carrying amount of an asset if it is probable that the future economic benefits embodied within that part of the cost will flow to the Group and it can be reliably measured. The costs of the day-to-day servicing of property and equipment are recognised in profit or loss as incurred.
DepreciationThe provision for depreciation is calculated by using both reducing balance method and straight-line method to write down the cost or valuation of the Property, Plant & Equipment to their residual values over the periods appropriate to the estimated useful lives of different types of assets stated below other than freehold land of the Group.
Category of asset
rate of Depreciation per
annum %
Building 5
Office Equipment 12.5 - 15
Plant & Machinery
15
Furniture & Fittings
10
Cutlery & Crockery
50
Motor Vehicles 15 -25
Computers 33.33
Water Sanitation 10
The asset’s residual values, useful lives and methods of depreciation are reviewed, and adjusted if appropriate, at each financial year end.
DerecognitionProperty, Plant and Equipment is derecognised on disposal or when no future economic benefits are expected from its use. Any gain or loss arising on derecognition of the asset (calculated as the difference between the net disposal proceeds and the carrying amount of the asset) is recognised in ‘Other Operating Income’ in the Statement of Profit or Loss in the year the asset is derecognised.
3.5.2 Impairment of non–financial assets
The Group assesses at each reporting date whether there is an indication that an asset may be impaired. If any indication exists, or when annual impairment testing for an asset is

170
ALLIANCE FINANCE COMPANY PLC | ANNUAL REPORT 2015/16
required, the Group estimates the asset’s recoverable amount. An asset’s recoverable amount is the higher of an asset’s or CGU’s fair value less costs to sell and its value in use. Where the carrying amount of an asset or CGU exceeds its recoverable amount, the asset is considered impaired and is written down to its recoverable amount. In assessing value in use, the estimated future cash flows are discounted to their present value using a pre–tax discount rate that reflects current market assessments of the time value of money and the risks specific to the asset. In determining fair value less costs to sell, an appropriate valuation model is used. These calculations are corroborated by valuation multiples, quoted share prices for publicly traded subsidiaries or other available fair value indicators.
For assets, an assessment is made at each reporting date as to whether there is any indication that previously recognised impairment losses may no longer exist or may have decreased. If such indication exists, the Group estimates the asset’s or CGU’s recoverable amount. A previously recognised impairment loss is reversed only if there has been a change in the assumptions used to determine the asset’s recoverable amount since the last impairment loss was recognised. The reversal is limited so that the carrying amount of the asset does not exceed its recoverable amount, nor exceeds the carrying amount that would have been determined, net of depreciation, had no impairment loss been recognised for the asset in prior
years. Such reversal is recognised in the Statement of Profit or Loss.
3.6 Finance and Operating Leases
The determination of whether an arrangement is a lease or it contains a lease, is based on the substance of the arrangement and requires an assessment of whether the fulfilment of the arrangement is dependent on the use of a specific asset or assets and the arrangement conveys a right to use the asset.
3.6.1 Finance leaseAgreements which transfer to counterparties substantially all the risks and rewards incidental to the ownership of assets, but not necessarily legal title, are classified as finance leases. When the Group is a lessor under finance leases the amounts due under the leases, after deduction of unearned charges, are included in ‘Loans and advances to Group’s or ‘Loans and advances to customers’, as appropriate. The finance income receivable is recognised in ‘Net Interest Income’ over the periods of the leases so as to give a constant rate of return on the net investment in the leases.
When the Group is a lessee under finance leases, the leased assets are capitalised and included in ‘Property, Plant and Equipment’ and the corresponding liability to the lessor is included in ‘Other Liabilities’. A finance lease and its corresponding liability are recognised initially at the fair value of the asset or, if lower, the present value of the minimum lease payments. Finance charges payable are recognised
in ‘Net Interest Income’ over the period of the lease based on the interest rate implicit in the lease so as to give a constant rate of interest on the remaining balance of the liability.
3.6.2 Operating LeaseAll other leases are classified as operating leases. When acting as lessor, the Group includes the assets subject to operating leases in ‘Property, Plant and Equipment’ and accounts for them accordingly. Impairment losses are recognised to the extent that residual values are not fully recoverable and the carrying value of the assets is thereby impaired. When the Group is the lessee, leased assets are not recognised on the Statement of Financial Position. Rentals payable and receivable under operating leases are accounted for on a straight-line basis over the periods of the leases and are included in ‘General and administrative expenses’ and ‘Other Operating Income’, respectively.
3.7 Financial Liabilities
3.7.1 Initial recognition and measurement
Financial liabilities within the scope of LKAS 39 are classified as due to customers (Deposits), due to banks, debt issued and other borrowed funds and other financial liabilities as appropriate. The Group determines the classification of its financial liabilities at initial recognition.
The Group classifies financial liabilities as other financial liabilities in accordance with the substance of the contractual arrangement and the definitions of financial liabilities.
Significant Accounting policies Contd.

171
ALLIANCE FINANCE COMPANY PLC | ANNUAL REPORT 2015/16
The Group recognizes financial liabilities in the Statement of Financial Position when the Group becomes a party to the contractual provisions of the financial liability.
3.7.2 Financial Liabilities at Fair Value through Profit or Loss (FVTPL)
Financial liabilities at FVTPL include financial liabilities held-for-trading and financial liabilities designated as such upon initial recognition as at fair value through profit or loss. Subsequent to initial recognition, financial liabilities at FVTPL are measured at fair value, and changes there in recognized in the Statement of Profit or Loss.
Upon initial recognition, transaction cost are directly attributable to the acquisition are recognized in Statement of Profit or Loss as incurred. The criteria for designation of financial liabilities at FVTPL upon initial recognition are the same as those of financial assets at FVTPL. The Group has not designated any financial liabilities upon initial recognition as at fair value through profit or loss.
3.7.3 Other Financial LiabilitiesOther financial liabilities including Due to Customers (Deposits), Due to Banks, Debt issued and Other Borrowed Funds. Other financial liabilities are initially measured at fair value less transaction cost that are directly attributable to the acquisition and subsequently measured at amortised cost using the EIR method.
Amortised cost is calculated by taking into account any discount or
premium on the issue and costs that are an integral part of the EIR. The EIR amortisation is included in ‘Interest Expenses’ in the Statement of Profit or Loss.
3.7.4 Derecognition of Financial Liabilities
A financial liability is derecognised when the obligation under the liability is discharged or cancelled or expired. Where an existing financial liability is replaced by another from the same lender on substantially different terms, or the terms of an existing liability are substantially modified, such an exchange or modification is treated as a derecognition of the original liability and the recognition of a new liability. The difference between the carrying value of the original financial liability and the consideration paid is recognised in Statement of Profit or Loss.
3.8 Provisions
Provisions are recognised when the Group has a present obligation (legal or constructive) as a result of a past event, and it is probable that an outflow of resources embodying economic benefits will be required to settle the obligation and a reliable estimate can be made of the amount of the obligation. The amount recognised is the best estimate of the consideration required to settle the present obligation at the Reporting date, taking in to account the risks and uncertainties surrounding the obligation at that date. The expense relating to any provision is presented in the Statement of Profit or Loss net of any reimbursement.
3.9 Retirement Benefit Obligations
(i) Gratuity All the employees of the Group
are eligible for gratuity under the Payment of Gratuity Act No. 12 of 1983.
Employees those who have resigned or whose services are terminated other than by retirement are eligible to receive the terminal gratuity under the Payment of Gratuity Act No. 12 of 1983 at the rate of one half of the gross salary applicable to the last month of the financial year in which the employment is terminated or resigned, for each year of completed service, for those who have served in excess of 5 years.
The Group operates an approved non contributory Gratuity Fund to facilitate the Gratuity payments to the retiring employees of the Group. The Group determines the adequacy of gratuity liability in terms of Payment of Gratuity Act No.12 of 1983. In order to meet this liability, the Group carry forward a provision in the Statement of Financial Position, based on:
• Half a month’s salary of the last month’s salary of the financial year for each completed year of service for all permanent employees who complete service 5 to 10 years,
• One month’s salary of the last month’s salary of the financial year for each completed year of service for all permanent employees who complete service over 10 years but not exceeding 15 years,
• One and half month’s salary of the
172
ALLIANCE FINANCE COMPANY PLC | ANNUAL REPORT 2015/16
last month’s salary of the financial year for each completed year of service for all permanent employees who complete service over 15 years but not exceeding 25 years.
• Two months’ salary of the last month’s salary of the financial year for each completed year of service for all permanent employees who complete service over 25 years.
An actuarial valuation is carried out as every year end to ascertain the full liability under gratuity. The valuation was carried out as at 31st March 2016 by M/s Actuarial & Management Consultants (Pvt) Limited, a firm of professional actuaries based on the Projected Unit Credit Method recommended by the actuarial present value of the defined benefit obligation (PV-DBO) under the PUC method.
The subsidiary company provision has been made for retirement gratuities in conformity with LKRS 19 “Employee Benefits” and applied “Gratuity Formula” method (i.e. Projected unit credit method) to measure the post employment benefit obligation.
RecognitionofActuarialLosses/GainsThe Group recognised the total actuarial gain and losses that arise in calculating the Group’s obligation in respect of gratuity in other comprehensive income during the period which it occurs.
RecognitionofPastServiceCost(Applicableonlywhenaplanhasbeenchanged)Past Service Cost are recognized as an
expense on a straight line basis over the average period until the benefits become vested. If the benefits have already been vested, immediately following the instruction of, or changes to the plan, past service costs are recognized immediately.
ManagementoftheFund’sAssetsThe assets of the Gratuity Fund and the Employees’ Provident Fund are held separately from those of the Group and are independently administered by a separate management team appointed by the Group. As at 31st March 2016 fair value of plan assets is Rs. 117,058,229 /- (2015 - Rs. 78,968,050/-)
(ii) Defined contribution planThe Group also operates a defined contribution plan. The contribution payable to a defined contribution plan is in proportion to the services rendered to the Group by the employees and is recorded as an expense under ‘Personnel expenses’. Unpaid contributions are recorded as a liability.
TheGroupcontributestothefollowingSchemes:Employees’ Provident FundThe Parent Company and employees contribute 20% and 10% respectively of the employee’s monthly gross salary to the Employees’ Provident Fund.
The subsidiary company and employees contribute 12% and 8% respectively of the employee’s monthly gross salary to the Employees’ Provident Fund.
Employees’ Trust FundThe Group contributes 3% of the employee’s monthly gross salary excluding overtime to the Employees’ Trust Fund maintained by the Employees Trust Fund Board.
3.10 Taxation
As per the Sri Lanka Accounting Standard –LKAS 12 on ‘Income Taxes’ tax expense (Tax income) is the aggregate amount included in determination of profit or loss for the period in respect of current and deferred taxes. Income tax expense is recognised in the Statement of Profit or Loss except to the extent it relates to items recognised directly in Equity or in Other Comprehensive Income (OCI), in which case it is recognised in Equity or in OCI.
3.11 Current Taxation
Current tax assets and liabilities consist of amounts expected to be recovered from or paid to the Commissioner General of Inland Revenue in respect of the current year and any adjustment to tax payable in respect of prior years. The tax rates and tax laws used to compute the amount are those that are enacted or substantially enacted by the end of the reporting period. Accordingly, provision for taxation is made on the basis of the accounting profit for the year as adjusted for the taxation purpose in accordance with the provisions of the Inland Revenue Act No. 10 of 2006 and the amendments thereto.
Significant Accounting policies Contd.
173
ALLIANCE FINANCE COMPANY PLC | ANNUAL REPORT 2015/16
3.12 Deferred tax
(i) Deferred TaxationDeferred tax is provided using the liability method on temporary differences at the reporting date between the tax bases of assets and liabilities and their carrying amounts for financial reporting purpose.
Deferred tax assets are recognised for all deductible differences, carried forward of unused tax credits and unused tax losses, to the extent that it is probable that taxable profits will be available against which the deductible temporary differences and the carry forward of unused tax credits and unused tax losses can be utilised.
The carrying amount of a deferred tax asset is reviewed at end of the reporting period and reduced to the extent it is no longer probable that sufficient taxable profit will be available to allow all or part of the deferred tax asset to be utilised. Unrecognised deferred tax asset are reassessed at end of the reporting period and are recognise to the extent that is probable that future taxable profit will allow the deferred tax asset to be recovered.
Deferred tax assets and liabilities are measured at the tax rate that are expected to apply in the year when the assets are realised or the liabilities are settled, based on tax rates and tax laws that have been enacted or subsequently enacted at end of the reporting period.
Deferred tax assets and deferred tax liabilities are offset if a legally enforceable right exists to set off
current tax assets against current tax liabilities and the deferred taxes relate to the same taxable entity and the same taxation authority.
3.13 Value Added Tax on Financial Services (FVAT)
VAT on Financial Services is calculated in accordance with VAT Act No. 14 of 2002 and subsequent amendment thereto.
3.14 Crop Insurance Levy (CIL)
As per the provisions of the Section 14 of the Finance Act No.12 of 2013, the CIL was introduced with effect from April 01, 2013 and is payable to the National Insurance Trust Fund. Currently CIL is payable at 1% of the profit after tax.
3.15 Withholding Tax on Dividends
Withholding tax that arises from the distribution of dividends by the Group is recognised at the time the liability to pay the related dividend is recognised.
3.16 Commitment and Contingencies
Contingent liabilities are possible obligations whose existence will be confirmed only by uncertain future events or present obligations where the transfer of economic benefit is not probable or cannot be reliably measured. Contingent Liabilities are not recognized in the Statement of Financial Position but are disclosed unless its occurrence is remote. All discernible risks are accounted for in determining the amount of all known liabilities. Details of commitments and contingencies are given in Note 41
3.17 Recognition of Income and Expenses
Revenue is recognised to the extent that it is probable that the economic benefits will flow to the Group and the revenue can be reliably measured. The following specific recognition criteria must also be met before revenue is recognised.
3.17.1 Interest Income and ExpenseFor all financial assets measured at amortised cost, interest bearing financial assets classified as available for sale and financial instruments designated at fair value through profit or loss, interest income or expense is recorded using the EIR method. The EIR is the rate that exactly discounts estimated future cash payments or receipts through the expected life of the financial instrument or a shorter period, where appropriate, to the net carrying amount of the financial asset or financial liability.
The calculation takes into account all contractual terms of the financial instrument and includes any fees or incremental costs that are directly attributable to the instrument and are an integral part of the EIR, but not future credit losses. The carrying amount of the financial asset or financial liability is adjusted if the Group revises its estimates of payments or receipts. The adjusted carrying amount is calculated based on the original EIR and the change in carrying amount is recorded as ’Interest Income’ for financial assets and ’Interest Expense’ for financial liabilities.

174
ALLIANCE FINANCE COMPANY PLC | ANNUAL REPORT 2015/16
However, for a reclassified financial asset for which the Group subsequently increases its estimates of future cash receipts as a result of increased recoverability of those cash receipts, the effect of that increase is recognised as an adjustment to the EIR from the date of the change in estimate.
Once the recorded value of a financial asset or a group of similar financial assets has been reduced due to an impairment loss, interest income continues to be recognised using the rate of interest used to discount the future cash flows for the purpose of measuring the impairment loss.
3.17.2 Fee and Commission incomeThe Group earns fee and commission income from a diverse range of services it provides to its customers. Fee income can be divided into the following two categories:
a) Fee income earned from services that are provided over a certain period of time
Fees earned from services that are provided over a period of time are accrued over that period. These fees include commission income from asset management, custody and other management and advisory fees.
b) Fee income from providing transaction services
Fees arising from negotiating or participating in the negotiation of a transaction for a third party, such as the purchase or sale of business is recognized on completion of the underlying transaction. Fees or components of fees that are linked to
a certain performance are recognized after fulfilling the corresponding criteria.
3.18 Dividend income
Dividend income is recognised when the right to receive the payment is established. Usually, this is the ex-dividend date for equity securities. Dividends are presented in the ‘Other Operating Income’ in Statement of Profit or Loss.
3.19 net Trading income
Net trading income includes all gains and losses from changes in fair value and related dividends for financial assets and financial liabilities ‘held for trading’ other than interest income.
3.20 service income
Revenue from rendering of services is recognized in the accounting period in which the services are rendered or performed.
3.21 Dividends on ordinary shares
Dividends on ordinary shares are recognised as a liability and deducted from equity when they are approved by the Group’s shareholders. Interim dividends are deducted from equity when they are declared and no longer at the discretion of the Group. Dividends for the year that are approved after the reporting date are disclosed as an event after the reporting date.
3.22 other income
The recognition of other income is accounted based on accrual basis.
3.23 statement of Cash Flows
Statement of Cash Flows has been prepared using the ‘Indirect Method’, as stipulated in Sri Lanka Accounting Standard - LKAS 7 ‘Statement of Cash Flows’. Cash and Cash Equivalents comprise short term, highly liquid investments that are readily convertible to known amounts of cash and are subject to an insignificant risk of changes in value. The Cash and Cash Equivalent include cash in hand and balance in banks.
3.24 earnings per share
The Group presents basic earnings per share (EPS) data for its ordinary shares. Basic EPS is calculated by dividing the profit or loss attributable to ordinary shareholders of the Group by the weighted average number of ordinary shares outstanding during the period.
3.25 Operating Segments
A business segment is a distinguishable component of the Group, engaged in providing products or services subject to risks and returns that are different from those of other business segments. Operating results of those segments are reviewed regularly by the Board of Directors to make decisions about resources allocated to each segment and assess its performance, and for which discrete financial information is available.
The primary business format is based on the core business activities of the Group, namely, Lease, Hire Purchase & Consumer Durable, Loans, Pawning, Hiring of Vehicles, Investing in Shares,
Significant Accounting policies Contd.
175
ALLIANCE FINANCE COMPANY PLC | ANNUAL REPORT 2015/16
Investing in Government Securities, Collaboration Finance & Others.
The management uses its judgment in determining the compositions of these core business activities taking into account the objective of reporting financial information by segment as set forth in Sri Lanka Accounting Standard, SLFRS 8 “Operating Segments”, Segment Reporting and qualitative characteristics of financial statements as identified in the Framework for the Preparation and Presentation of Financial Statements.
The Group’s business activities are carried out in Sri Lanka. Consequently, the economic environment in which the Group operates in is not subject to risk and returns that are significantly different on a geographical basis. Hence, disclosure by geographical region has not been provided.
For the purpose of segment reporting disclosures, the information presented in respect of the Group’s business segments is based on the Group’s management and internal reporting structure.
Income recognized in Segments is income which is directly identified and reported in those Segments and expenses directly identified to a particular Segment are charged accordingly, and, expenses that cannot be directly identified to a particular Segment are allocated on bases decided by the management and applied consistently throughout the period.
Unallocated items mainly comprise of Head Office expenses.
Measurement of segments assets, liabilities, segment revenue and results are based on the accounting policies set out below. Segments revenue, results, assets and liabilities include items directly attributable to a segment as well as those that can be allocated on a reasonable basis. Segment capital expenditure is the total cost incurred during the period to acquire segments assets that are expected to be used for more than one accounting period.
3.26 New Accounting Standards issued but not Yet Effective
Standard issued but not yet effective up to the date of issuance of the Group’s financial statements are listed below. This listing is of standards issued, which the Group reasonably expects to be applicable at a future date. The Group intends to adopt those standards when they become effective.
(i) SLFRS 9 -Financial Instruments: Classification and Measurement
The objective of this Accounting Standard is to establish principles for the financial reporting of financial assets and financial liabilities that will present relevant and useful information to users of financial statements for their assessment of the amounts, timing and uncertainty of an entity’s future cash flows.
The improvements introduced by SLFRS 9 includes a logical model for classification and measurement, a single, forward-looking ‘expected loss’
impairment model and a substantially-reformed approach to hedge accounting.
An entity shall apply this SLFRS to all items within the scope of LKAS 39 ‘Financial Instruments: Recognition and Measurement’.
SLFRS 9 is effective for annual reporting periods beginning on or after 1st April 2018, with early adoption permitted.
(iii) SLFRS 15 ‘Revenue from Contracts with Customers’
This Accounting Standard establishes a comprehensive framework for determining whether, how much and when revenue is recognized. It replaces existing revenue recognition guidance, including LKAS 18-Revenue, LKAS 11-Construction Contracts and IFRIC 13-Customer Loyalty Programs.
This SLFRS will become effective from 1st April 2017 and shall be applied prospectively as of the beginning of the annual period in which it is initially applied. The disclosure requirements of this SLFRS need not to be applied comparative information provided for periods before initial application of this SLFRS.
The Company is currently in the process of evaluating the potential effect of these standards on its financial statements and the impacts of the adoption of these standards have not been quantified as at the reporting date.
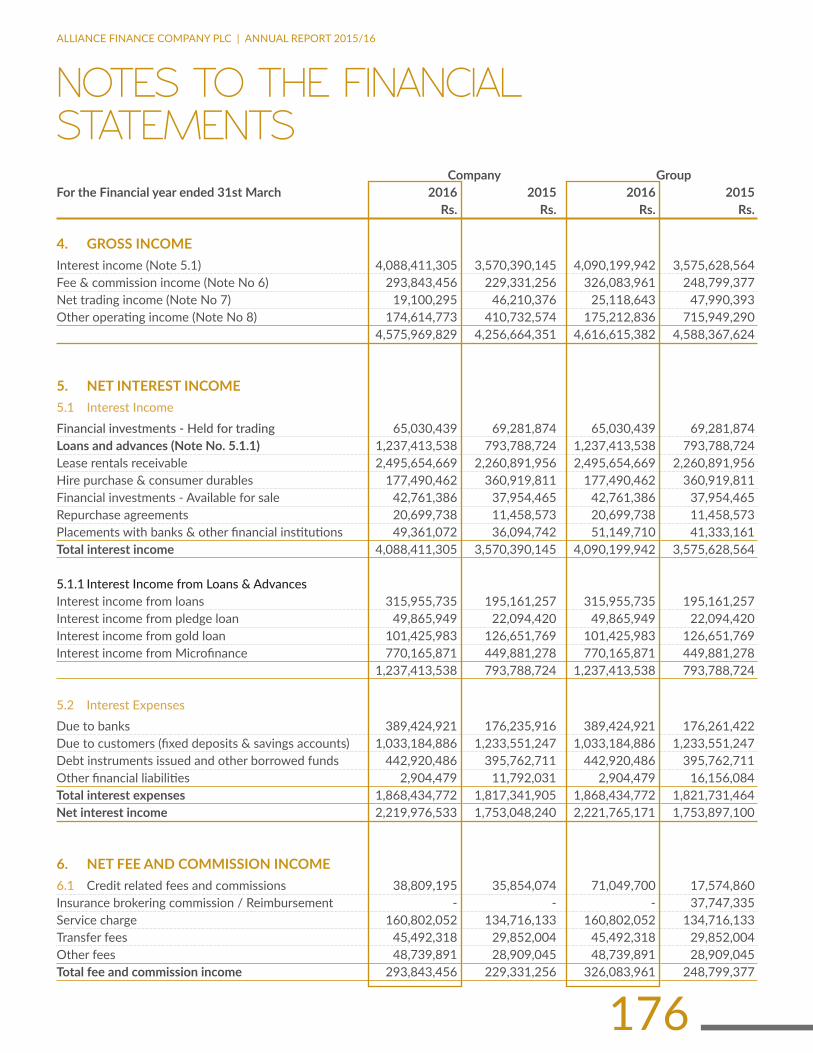
176
ALLIANCE FINANCE COMPANY PLC | ANNUAL REPORT 2015/16
Company GroupFortheFinancialyearended31stMarch 2016 2015 2016 2015 Rs. Rs. Rs. Rs.
4. GROSS INCOMEInterest income (Note 5.1) 4,088,411,305 3,570,390,145 4,090,199,942 3,575,628,564Fee & commission income (Note No 6) 293,843,456 229,331,256 326,083,961 248,799,377Net trading income (Note No 7) 19,100,295 46,210,376 25,118,643 47,990,393Other operating income (Note No 8) 174,614,773 410,732,574 175,212,836 715,949,290 4,575,969,829 4,256,664,351 4,616,615,382 4,588,367,624
5. NET INTEREST INCOME5.1 interest incomeFinancial investments - Held for trading 65,030,439 69,281,874 65,030,439 69,281,874Loans and advances (Note No. 5.1.1) 1,237,413,538 793,788,724 1,237,413,538 793,788,724Lease rentals receivable 2,495,654,669 2,260,891,956 2,495,654,669 2,260,891,956Hire purchase & consumer durables 177,490,462 360,919,811 177,490,462 360,919,811Financial investments - Available for sale 42,761,386 37,954,465 42,761,386 37,954,465Repurchase agreements 20,699,738 11,458,573 20,699,738 11,458,573Placements with banks & other financial institutions 49,361,072 36,094,742 51,149,710 41,333,161Total interest income 4,088,411,305 3,570,390,145 4,090,199,942 3,575,628,564
5.1.1 Interest Income from Loans & AdvancesInterest income from loans 315,955,735 195,161,257 315,955,735 195,161,257Interest income from pledge loan 49,865,949 22,094,420 49,865,949 22,094,420Interest income from gold loan 101,425,983 126,651,769 101,425,983 126,651,769Interest income from Microfinance 770,165,871 449,881,278 770,165,871 449,881,278 1,237,413,538 793,788,724 1,237,413,538 793,788,724
5.2 Interest ExpensesDue to banks 389,424,921 176,235,916 389,424,921 176,261,422Due to customers (fixed deposits & savings accounts) 1,033,184,886 1,233,551,247 1,033,184,886 1,233,551,247Debt instruments issued and other borrowed funds 442,920,486 395,762,711 442,920,486 395,762,711Other financial liabilities 2,904,479 11,792,031 2,904,479 16,156,084Total interest expenses 1,868,434,772 1,817,341,905 1,868,434,772 1,821,731,464Net interest income 2,219,976,533 1,753,048,240 2,221,765,171 1,753,897,100
6. NET FEE AND COMMISSION INCOME6.1 Credit related fees and commissions 38,809,195 35,854,074 71,049,700 17,574,860Insurance brokering commission / Reimbursement - - - 37,747,335Service charge 160,802,052 134,716,133 160,802,052 134,716,133Transfer fees 45,492,318 29,852,004 45,492,318 29,852,004Other fees 48,739,891 28,909,045 48,739,891 28,909,045Totalfeeandcommissionincome 293,843,456 229,331,256 326,083,961 248,799,377
NOTES TO ThE FiNANCiAl STATEmENTS

177
ALLIANCE FINANCE COMPANY PLC | ANNUAL REPORT 2015/16
Company GroupFortheFinancialyearended31stMarch 2016 2015 2016 2015 Rs. Rs. Rs. Rs.
6.2 Fee and Commission ExpensesBrokerage fees (79,956,558) (54,693,889) (79,956,558) (54,693,889)Credit related fees (22,568,288) (26,038,971) (22,578,018) (27,894,951)Totalfeeandcommissionexpenses (102,524,846) (80,732,860) (102,534,576) (82,588,840)Net Fee and Commission Income 191,318,610 148,598,396 223,549,385 166,210,537
7. NET GAINS /(LOSSES) FROM TRADINGProfit /(loss) on sale of financial investments held for trading 8,235,404 29,515,082 8,235,404 29,515,082Profit /(loss) on sale of foreign currencies (227,108) (7,274) (227,108) (7,274)Income from trust investment 43,754,750 21,230,918 49,773,098 21,230,918Fair value gain / (loss) on financial investments held for trading (32,662,751) (4,528,350) (32,662,751) (2,748,333) 19,100,295 46,210,376 25,118,643 47,990,393
8. OTHEROPERATINGINCOMEIncome from investment securities - other investments 8,305,081 113,872,864 8,305,081 17,845,679Profit/(loss) on disposal of property & equipment 19,658,346 (2,363,398) 19,658,346 (2,363,398)Profit on sale of vehicles 20,232,478 3,289,842 20,232,478 3,289,842Rental income from hiring vehicles 44,696,882 52,372,161 44,696,882 52,372,161Income from sale of tiles & furnitures 290,831 8,409,562 290,831 8,409,562Bad debt recoveries 28,062,262 5,355,628 28,062,262 5,355,628Income from disposal of AFS investments (Note No. 8.1) 28,155,635 193,390,454 27,801,222 584,243,570Loss on liquidation of associates (354,413) - - -Profit on sale of real estate - 338,700 - 338,700Gain on bargaining purchase - - - 10,641,616Others 25,567,671 36,066,761 26,165,734 35,815,930TotalOtherOperatingIncome 174,614,773 410,732,574 175,212,836 715,949,290
8.1 Net Gain /(Loss) From Disposal of available For sale Financial assets
Proceeds from disposal of available for sale financial assets 44,335,336 239,700,429 44,980,923 767,721,671Carrying value of available for sale financial assets disposed (30,549,631) (103,735,489) (30,549,631) (348,614,926)Transfer from available for financial assets reserve 14,369,930 57,425,514 14,369,930 165,136,825 28,155,635 193,390,454 27,801,222 584,243,570
During the year, the Company disposed of its shareholding of 852,603 shares in DFCC Vardhana Bank.

178
ALLIANCE FINANCE COMPANY PLC | ANNUAL REPORT 2015/16
Company GroupFortheFinancialyearended31stMarch 2016 2015 2016 2015 Rs. Rs. Rs. Rs.
9. IMPAIRMENTCHARGESFOR LOANSANDOTHERLOSSES
ImpairmentCharges/(WriteBack)Lease rentals receivable (113,017,894) (10,381,194) (113,017,894) (10,381,194)Hire purchase rentals receivable (42,287,334) (23,380,929) (42,287,334) (23,380,929)Loans and advances 1,934,093 59,236,449 1,934,093 59,236,449 (153,371,135) 25,474,326 (153,371,135) 25,474,326
BadDebtsWrittenoffLease rentals receivable 292,934,326 297,807,143 292,934,326 297,807,143Hire purchase rentals receivable 23,922,931 67,936,228 23,922,931 67,936,228Loans and advances 2,066,125 7,121,023 2,066,125 7,121,023 318,923,382 372,864,394 318,923,382 372,864,394 165,552,247 398,338,720 165,552,247 398,338,720
10. PERSONNELEXPENSESSalaries and bonus 577,616,878 381,556,209 583,423,600 384,976,018Gratuity charge/ (reversal) for the year 32,112,383 26,874,316 32,397,636 26,629,127Employer’s contribution to EPF 86,345,572 66,763,467 86,994,990 67,118,517Employer’s contribution to ETF 12,937,326 10,029,759 13,099,680 10,118,521Staff welfare 22,180,056 17,721,967 22,748,065 18,138,337Other allowances & staff related expenses 19,773,280 21,977,228 19,812,880 21,977,228 750,965,495 524,922,946 758,476,851 528,957,748
11. OTHEROPERATINGEXPENSES11.1 Auditors fees and expenses
Auditors fees 716,000 660,000 822,150 715,685Non audit fees and expenses 1,148,517 729,178 1,200,317 780,908Professional fees 8,085,877 4,986,033 8,698,677 14,430,658Office administration & establishment expenses 345,306,860 274,949,409 346,904,871 275,683,470Advertising & business promotion expenses 62,428,752 53,711,297 62,428,752 53,741,899Motor vehicle running & maintenance 315,722,661 234,261,510 318,033,148 236,126,789Impairment loss on unquoted securities 1,173,733 962,758 1,173,733 962,758Others 81,209,984 63,373,689 85,261,729 63,803,882 815,792,384 633,633,874 824,523,377 646,246,049
11.2 Depreciation / amortisation of property, plant and equipment 99,934,198 85,702,246 101,019,509 86,135,322
Notes to the Financial Statements Contd.
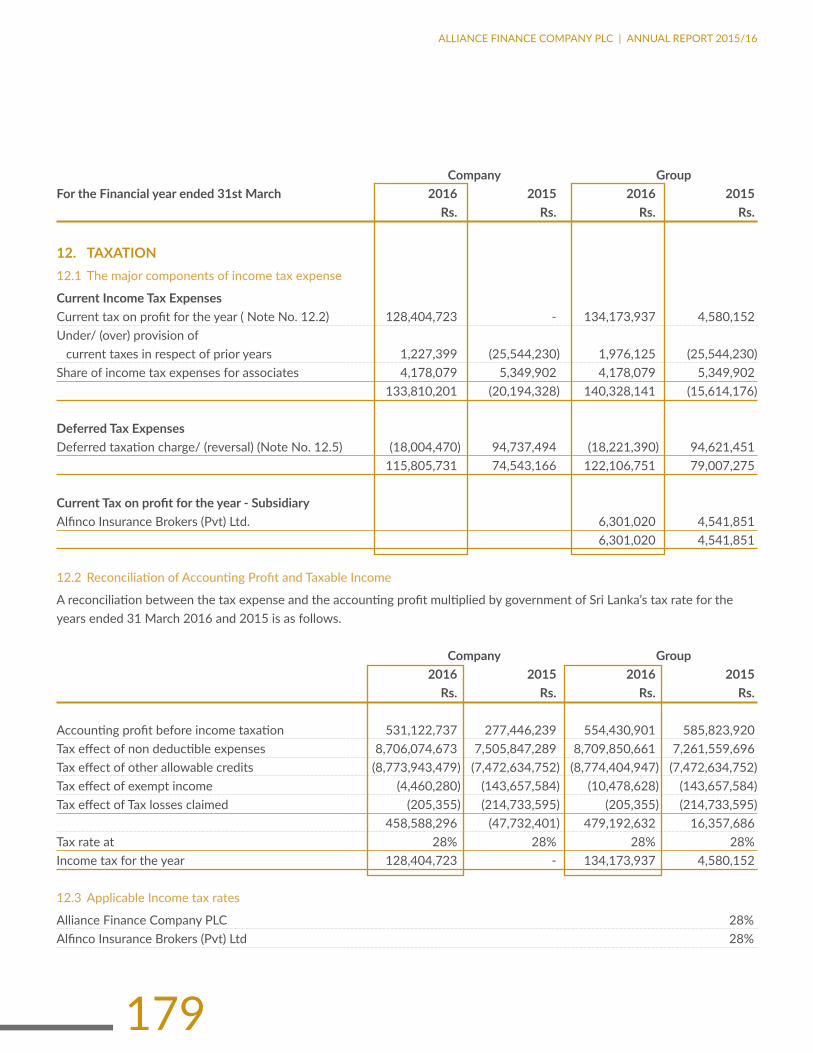
179
ALLIANCE FINANCE COMPANY PLC | ANNUAL REPORT 2015/16
Company GroupFortheFinancialyearended31stMarch 2016 2015 2016 2015 Rs. Rs. Rs. Rs.
12. TAXATION12.1 The major components of income tax expense
Current Income Tax ExpensesCurrent tax on profit for the year ( Note No. 12.2) 128,404,723 - 134,173,937 4,580,152Under/ (over) provision of current taxes in respect of prior years 1,227,399 (25,544,230) 1,976,125 (25,544,230)Share of income tax expenses for associates 4,178,079 5,349,902 4,178,079 5,349,902 133,810,201 (20,194,328) 140,328,141 (15,614,176)
DeferredTaxExpensesDeferred taxation charge/ (reversal) (Note No. 12.5) (18,004,470) 94,737,494 (18,221,390) 94,621,451 115,805,731 74,543,166 122,106,751 79,007,275
CurrentTaxonprofitfortheyear-SubsidiaryAlfinco Insurance Brokers (Pvt) Ltd. 6,301,020 4,541,851 6,301,020 4,541,851
12.2 Reconciliation of Accounting Profit and Taxable Income
A reconciliation between the tax expense and the accounting profit multiplied by government of Sri Lanka’s tax rate for the years ended 31 March 2016 and 2015 is as follows.
Company Group 2016 2015 2016 2015 Rs. Rs. Rs. Rs.
Accounting profit before income taxation 531,122,737 277,446,239 554,430,901 585,823,920Tax effect of non deductible expenses 8,706,074,673 7,505,847,289 8,709,850,661 7,261,559,696Tax effect of other allowable credits (8,773,943,479) (7,472,634,752) (8,774,404,947) (7,472,634,752)Tax effect of exempt income (4,460,280) (143,657,584) (10,478,628) (143,657,584)Tax effect of Tax losses claimed (205,355) (214,733,595) (205,355) (214,733,595) 458,588,296 (47,732,401) 479,192,632 16,357,686Tax rate at 28% 28% 28% 28%Income tax for the year 128,404,723 - 134,173,937 4,580,152
12.3 Applicable Income tax rates
Alliance Finance Company PLC 28%Alfinco Insurance Brokers (Pvt) Ltd 28%

180
ALLIANCE FINANCE COMPANY PLC | ANNUAL REPORT 2015/16
12.4 Notional Tax Credit for Withholding Tax on Government Securities on Secondary Market Transactions
The Inland Revenue Act No.10 of 2006, provided that a company which derives interest income from the secondary market transactions in Government Securities ( on or after April 1, 2002 ) would be entitled to a notional tax credit ( being one ninth of the net interest income ) provided such interest income forms part of the statutory income of the Company for that year of assessment.
Accordingly the net interest income earned from the secondary market transactions in Government Securities for the year, has been grossed up in the Financial Statements & the resulting notional tax credit amounts to Rs.13.60 million (2015 - Rs.11.9 million /-)
12.5 Deferred tax expense/(income )
The following table shows deferred tax expense recorded in the profit or loss due to changes in the deferred tax assets and liabilities.
Company Group 2016 2015 2016 2015 Rs. Rs. Rs. Rs.
Deferred Tax LiabilitiesDefined benefit obligation- Profit or Loss 2,390,215 3,581,334 2,194,756 3,581,334Other temporary differences - 53,913,123 - 53,913,123Accelerated depreciation - Leased assets 3,157,106 46,645,373 3,157,106 46,645,373Accelerated depreciation - Own assets - - (21,461) 116,043Lease rentals 90,877,487 3,528,952 90,877,487 3,528,952 96,424,808 107,668,783 96,207,888 107,784,826
Deferred Tax AssetsAccelerated depreciation - own assets 95,552,019 12,931,290 95,552,019 13,163,378Defined benefit obligation - profit /loss - 13,797,230 - 13,868,194Other temporary differences 14,346,470 - 14,346,470 - 109,898,489 26,728,520 109,898,489 27,031,572
Total Deferred tax expense / Reversal (13,473,681) 80,940,263 (13,690,601) 80,753,256Defined benefit obligation - Other Comprehensive Income (4,530,789) 13,797,230 (4,530,789) 13,868,194Deferred tax expense adjusted through profit or loss (18,004,470) 94,737,494 (18,221,390) 94,621,451
Notes to the Financial Statements Contd.
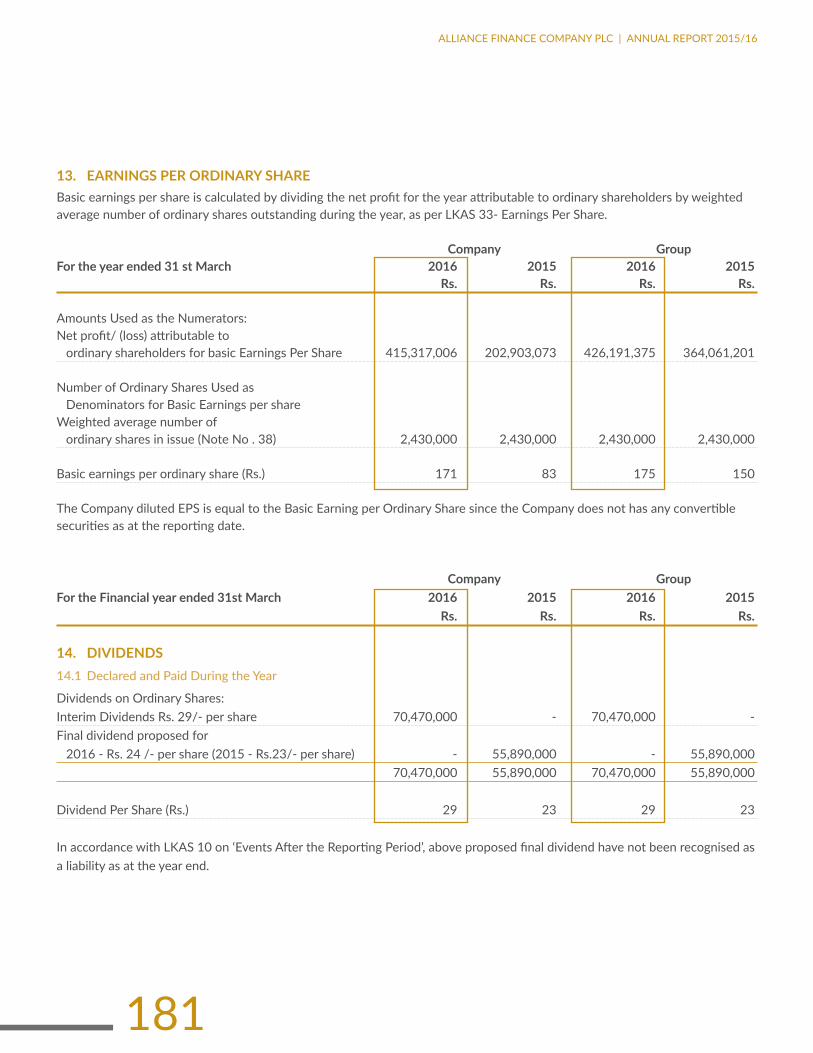
181
ALLIANCE FINANCE COMPANY PLC | ANNUAL REPORT 2015/16
13. EARNINGSPERORDINARYSHAREBasic earnings per share is calculated by dividing the net profit for the year attributable to ordinary shareholders by weighted average number of ordinary shares outstanding during the year, as per LKAS 33- Earnings Per Share.
Company GroupFortheyearended31stMarch 2016 2015 2016 2015 Rs. Rs. Rs. Rs.
Amounts Used as the Numerators:Net profit/ (loss) attributable to ordinary shareholders for basic Earnings Per Share 415,317,006 202,903,073 426,191,375 364,061,201
Number of Ordinary Shares Used as Denominators for Basic Earnings per shareWeighted average number of ordinary shares in issue (Note No . 38) 2,430,000 2,430,000 2,430,000 2,430,000
Basic earnings per ordinary share (Rs.) 171 83 175 150
The Company diluted EPS is equal to the Basic Earning per Ordinary Share since the Company does not has any convertible securities as at the reporting date.
Company GroupFortheFinancialyearended31stMarch 2016 2015 2016 2015 Rs. Rs. Rs. Rs.
14. DIVIDENDS14.1 Declared and Paid During the Year
Dividends on Ordinary Shares:Interim Dividends Rs. 29/- per share 70,470,000 - 70,470,000 -Final dividend proposed for 2016 - Rs. 24 /- per share (2015 - Rs.23/- per share) - 55,890,000 - 55,890,000 70,470,000 55,890,000 70,470,000 55,890,000
Dividend Per Share (Rs.) 29 23 29 23
In accordance with LKAS 10 on ‘Events After the Reporting Period’, above proposed final dividend have not been recognised as a liability as at the year end.

182
ALLIANCE FINANCE COMPANY PLC | ANNUAL REPORT 2015/16
15. NETASSETSVALUEPERORDINARYSHARE Company GroupAsat31stMarch 2016 2015 2016 2015 Rs. Rs. Rs. Rs.
AmountusedasthenumeratorTotal equity attributable to equity holders of the Company 2,734,334,636 2,449,343,391 2,776,047,475 2,480,125,202
NumberofordinarysharesusedasthedenominatorTotal number of ordinary shares 2,430,000 2,430,000 2,430,000 2,430,000
Net assets value per ordinary share 1,125 1,008 1,142 1,021
16. ANALYSIS OF FINANCIAL INSTRUMENTS BY MEASUREMENT BASISFinancial instruments are measured on an ongoing basis either at fair value or at amortised cost. The summary of Significant Accounting Policies describes how the classes of financial instruments are measured, and how income and expenses, including fair value gains and losses, are recognized. The following table analyses the carrying amounts of the financial instruments by category as defined in LKAS 39 on ‘Financial Instrument Recognition & Measurement’ under the headings of the Statement of Financial Position.
16.1 Company
Asat31stMarch2016 FairValue L&Rat AFSat Total Through Amortised FairValue ProfitorLoss Cost Rs. Rs. Rs. Rs.
Financial AssetsCash and cash equivalents - 143,982,481 - 143,982,481Repurchase agreements - 735,591,742 - 735,591,742Placements with banks & financial institutions - 1,834,356,115 - 1,834,356,115Financial investments - Held for trading 1,081,001,402 - - 1,081,001,402Loans and advances - 5,603,981,321 - 5,603,981,321
Notes to the Financial Statements Contd.

183
ALLIANCE FINANCE COMPANY PLC | ANNUAL REPORT 2015/16
16.1 Company (continued)
Asat31stMarch2016 FairValue L&Rat AFSat Total Through Amortised FairValue ProfitorLoss Cost Rs. Rs. Rs. Rs.
Lease rentals receivable & stock out on hire - 13,283,110,374 - 13,283,110,374Hire purchase rentals receivable & stock out on hire - 462,569,201 - 462,569,201Financial investments - Available for sale - - 450,254,097 450,254,097Other financial assets - 181,511,534 - 181,511,534Total Financial Assets 1,081,001,402 22,245,102,768 450,254,097 23,776,358,267
OtherFinancial Total Liabilitiesat amortisedcost Rs. Rs.
FinancialLiabilitiesDue to banks 8,328,978,742 8,328,978,742Due to customers 10,464,149,566 10,464,149,566Debt Instruments issued and other borrowed funds 3,062,414,964 3,062,414,964Other financial liabilities 884,210,568 884,210,568TotalFinancialLiabilities 22,739,753,840 22,739,753,840
Asat31stMarch2015 FairValue L&Rat AFSat Total Through Amortised FairValue ProfitorLoss Cost Rs. Rs. Rs. Rs.
16.2 CompanyFinancial AssetsCash and cash equivalents - 118,573,049 - 118,573,049Repurchase agreements - 602,960,253 - 602,960,253Placements with banks & financial institutions - 390,218,289 - 390,218,289Financial investments - Held for trading 1,360,730,696 - - 1,360,730,696Loans and advances - 3,729,449,078 - 3,729,449,078Lease rentals receivable & stock out on hire - 10,069,293,475 - 10,069,293,475Hire purchase rentals receivable & stock out on hire - 1,124,197,171 - 1,124,197,171Financial investments - Available for sale - - 539,714,872 539,714,872Other financial assets - 134,825,966 - 134,825,966Total Financial Assets 1,360,730,696 16,169,517,281 539,714,872 18,069,962,849

184
ALLIANCE FINANCE COMPANY PLC | ANNUAL REPORT 2015/16
OtherFinancial Total Liabilitiesat amortisedcost Rs. Rs.
FinancialLiabilitiesDue to banks 2,929,071,347 2,929,071,347Due to customers 10,344,065,933 10,344,065,933Debt Instruments issued and other borrowed funds 3,203,466,448 3,203,466,448Other financial liabilities 700,836,812 700,836,812TotalFinancialLiabilities 17,177,440,540 17,177,440,540
Asat31stMarch2016 FairValue L&R AFSat Total Through atAmortised FairValue ProfitorLoss Cost Rs. Rs. Rs. Rs.
16.3 GroupFinancial AssetsCash and cash equivalents - 177,180,931 - 177,180,931Repurchase agreements - 735,591,742 - 735,591,742Placements with banks & financial institutions - 1,834,356,115 - 1,834,356,115Financial investments - Held for trading 1,159,449,583 - - 1,159,449,583Loans and advances - 5,604,087,836 - 5,604,087,836Lease rentals receivable & stock out on hire - 13,283,110,374 - 13,283,110,374Hire purchase rentals receivable & stock out on hire - 462,569,201 - 462,569,201Financial investments - Available for sale - - 463,754,097 463,754,097Other financial assets - 178,653,619 - 178,653,619Total Financial Assets 1,159,449,583 22,275,549,818 463,754,097 23,898,753,498
OtherFinancial Total Liabilitiesat amortisedcost Rs. Rs.
FinancialLiabilitiesDue to banks 8,353,691,241 8,353,691,241Due to customers 10,464,149,566 10,464,149,566Debt Instruments issued and other borrowed funds 3,062,414,964 3,062,414,964Other financial liabilities 890,116,107 890,116,107TotalFinancialLiabilities 22,770,371,878 22,770,371,878
Notes to the Financial Statements Contd.

185
ALLIANCE FINANCE COMPANY PLC | ANNUAL REPORT 2015/16
Asat31stMarch2015 FairValue L&R AFSat Total Through atAmortised FairValue ProfitorLoss Cost Rs. Rs. Rs. Rs.
16.3 Group (Continued)
Financial AssetsCash and cash equivalents - 168,247,616 - 168,247,616Repurchase agreements - 602,960,253 - 602,960,253Placements with banks & financial institutions - 390,218,289 - 390,218,289Financial investments - Held for trading 1,433,160,528 - - 1,433,160,528Loans and advances - 3,729,589,128 - 3,729,589,128Lease rentals receivable & stock out on hire - 10,069,293,475 - 10,069,293,475Hire purchase rentals receivable & stock out on hire - 1,124,197,171 - 1,124,197,171Financial investments - Available for sale - - 539,714,872 539,714,872Other financial assets - 121,319,177 - 121,319,177Total Financial Assets 1,433,160,528 16,205,825,109 539,714,872 18,178,700,509
OtherFinancial Total Liabilitiesat amortisedcost Rs. Rs.
FinancialLiabilitiesDue to banks 2,952,033,605 2,952,033,605Due to customers 10,344,065,933 10,344,065,933Debt Instruments issued and other borrowed funds 3,203,466,448 3,203,466,448Other financial liabilities 711,730,812 711,730,812Total Financial Liabilities 17,211,296,798 17,211,296,798
Company GroupFortheFinancialyearended31stMarch2016 2016 2015 2016 2015 Rs. Rs. Rs. Rs.
17. CASHANDCASHEQUIVALENTSCash in hand 39,907,651 48,121,547 39,909,609 48,127,547Balances with banks 104,074,830 70,451,502 137,271,322 120,120,069 143,982,481 118,573,049 177,180,931 168,247,616

186
ALLIANCE FINANCE COMPANY PLC | ANNUAL REPORT 2015/16
Company GroupFortheFinancialyearended31stMarch2016 2016 2015 2016 2015 Rs. Rs. Rs. Rs.
18. FINANCIAL INVESTMENTS - HELDFORTRADING
Government of Sri Lanka treasury bills 583,697,462 503,673,554 583,697,462 503,673,554Quoted equity securities (Note 18.1) 198,773,769 217,682,266 198,773,769 217,682,266Investments in unit trusts (Note 18.2) 298,530,171 639,374,876 376,978,352 711,804,708 1,081,001,402 1,360,730,696 1,159,449,583 1,433,160,528
2016 2015 Company & Group Company & Group Noof Costof FairValue Noof Costof FairValue Shares Investment Shares Investment Rs. Rs. Rs. Rs.
18.1 Quoted Equities
Banks, Finance & InsuranceSeylan Bank PLC 136,525 15,020,785 11,741,150 126,525 13,636,915 12,652,500Seylan Bank PLC non voting 49,000 3,468,416 3,087,000 58,000 3,720,205 3,677,200People’s Leasing Company PLC 529,800 12,043,920 8,476,800 554,800 12,650,640 12,261,080Ceylinco Insurance PLC - non voting 1,500 602,749 1,173,000 1,500 602,749 937,500Sinhaputhra Finance PLC -preference 50,000 125,000 450,000 5,000 125,000 225,500Commercial Bank - non voting 77 8,954 8,701 77 8,954 10,102DFCC Bank PLC - - - 43,500 10,067,507 8,821,800Central Finance Co PLC 15,000 4,084,490 3,150,000 15,000 4,084,490 3,751,500Hatton National Bank PLC 30,071 6,904,933 5,993,150 15,000 3,503,808 3,330,000Nations Trust Bank PLC - - - 44,955 4,909,518 4,499,996Union Bank PLC 91,764 2,366,190 1,523,282 - -Merchant Bank of Sri Lanka PLC 385 718,750 3,927 - -Sanasa Development Bank 35,500 5,522,999 4,852,850 - - 50,867,186 40,459,860 53,309,786 50,167,178
Land & PropertyOverseas Realty (Ceylon) PLC - - - 237,716 4,405,141 5,586,326East West Properties PLC 1,867,153 28,371,773 25,206,566 96,136 1,359,219 1,153,632Housing Development - - - 101,200 7,449,197 6,072,000 28,371,773 25,206,566 13,213,557 12,811,958
Notes to the Financial Statements Contd.

187
ALLIANCE FINANCE COMPANY PLC | ANNUAL REPORT 2015/16
2016 2015 Company & Group Company & Group Noof Costof FairValue Noof Costof FairValue Shares Investment Shares Investment Rs. Rs. Rs. Rs.
Hotels&TravelsSigiriya Village Hotels PLC 64,902 6,779,287 3,822,728 64,902 6,779,287 3,829,218Ceylon Hotels Corporation PLC 50,900 2,139,964 1,221,600 50,900 2,139,964 1,510,488Mahaweli Reach Hotels PLC 71,928 2,970,734 1,625,573 71,928 2,970,734 1,201,240Taj Lanka Hotels PLC 17,800 997,893 416,520 17,800 997,893 466,360Serendib Hotels PLC -non voting 14,510 334,376 253,925 14,510 334,376 311,965Nuwara Eliya Hotels Company PLC 300 455,040 412,470 300 455,040 435,720Browns Beach Hotels PLC 100,000 2,231,637 3,260,000 159,462 3,558,612 3,986,550Stafford Hotels PLC 129,038 7,012,700 5,419,596 129,038 7,012,700 7,342,262Tangerine Beach Hotels PLC 7,516 630,813 501,317 7,516 630,813 593,764Crescat- Asian Hotels PLC 30,000 2,120,486 1,590,000 30,000 2,120,486 1,890,000MTD Walkers PLC 45,000 2,803,621 1,498,500 - -Hotel Sigiriya PLC 35,000 3,539,200 3,360,000 - - 32,015,751 23,382,229 26,999,905 21,567,567
ManufacturingCentral Industries PLC 100,000 11,764,452 8,580,000 900 95,561 76,410Tokyo Cement PLC - non voting 22,000 498,319 710,600 97,000 3,903,535 3,627,800Tokyo Cement PLC - - - 85,000 5,660,192 4,666,500Textured Jersey PLC - - - 474,118 11,149,027 11,426,244Kelani Tyres PLC - - - 108,291 7,499,742 8,446,698Singer Sri Lanka PLC 30,405 3,675,127 3,578,669 32,200 3,892,093 3,670,800Regnis Lanka PLC 100,000 12,317,694 14,620,000 - - -Lanka Aluminium Industries PLC 10,000 1,152,728 700,000 - -Alumex PLC 250,000 4,550,400 3,850,000 - -ACL Plastic PLC 2,120 372,999 328,600 - - 34,331,719 32,367,869 32,200,150 31,914,452
Investment TrustsRenuka Holdings PLC 674,529 23,042,074 14,232,562 169,529 6,363,482 4,746,812Lee Hedges PLC 54,540 16,714,244 20,485,224 54,540 16,714,244 21,543,300Renuka Holdings PLC - - - 505,000 16,678,591 14,140,000 39,756,318 34,717,786 39,756,317 40,430,112
DiversifiedHoldingsJohn Keells Holdings PLC 92 19,025 13,616 10,081 2,165,803 2,010,151Aitken Spence PLC 254,551 30,161,167 18,709,499 254,551 30,161,167 25,327,823Hayleys PLC 35,000 12,386,795 8,599,500 10,000 3,433,024 3,000,000Distilleries Lanka PLC - - - 21,871 5,196,740 5,259,976 42,566,987 27,322,615 40,956,734 35,597,950

188
ALLIANCE FINANCE COMPANY PLC | ANNUAL REPORT 2015/16
FortheFinancialyearended31stMarch 2016 2015 Company & Group Company & Group No.of Costof FairValue No.of Costof FairValue Shares Investment Shares Investment Rs. Rs. Rs. Rs.
18.1 Quoted equities continuedPlantationsKegalle Plantations PLC 37,100 8,266,496 2,251,970 37,100 8,266,496 3,183,180Horana Plantations PLC 25,000 1,873,625 422,500 25,000 1,873,625 562,500 10,140,121 2,674,470 10,140,121 3,745,680
Construction&EngineeringAccess Engineering PLC 21,500 500,038 447,200 51,600 1,460,393 990,720Colombo Dockyard PLC 6,580 1,232,107 711,298 6,213 1,169,204 1,028,252 1,732,145 1,158,498 2,629,597 2,018,972
Power & EnergyMackwoods Energy PLC 100,000 1,399,997 280,000 100,000 1,399,997 600,000Pan Asian Power PLC - - - 1,500,000 5,106,560 5,100,000Lanka IOC Co. PLC 25,000 1,302,426 812,500 60,000 3,424,530 2,418,000 2,702,423 1,092,500 9,931,087 8,118,000
MotorsDiesel & Motor Engineering PLC 17,500 19,143,781 9,619,750 17,500 19,143,781 11,025,000Colonial Motors PLC 2,285 800,794 205,650 2,285 800,794 285,397United Motors PLC 6,819 668,851 565,977 - - - 20,613,426 10,391,377 19,944,575 11,310,397
Total Investment 263,097,848 198,773,769 249,081,829 217,682,266
2016 2015Arranger No.ofUnits Cost FairValue No.ofUnits Cost FairValue (Initial (Initial Investment) Investment) Rs. Rs. Rs. Rs.
18.2 investments in unit TrustsCompanyCapital Alliance Pvt. Ltd - Corporate treasury fund 19,554,720 292,537,167 298,530,171 8,734,915 100,000,000 104,016,239Capital Alliance Pvt. Ltd - High yield fund - - - 36,188,244 500,000,000 510,080,538Asset Trust Management (Pvt) Ltd - - - 25,466 274,273 278,099First Capital Asset Management (Pvt) Ltd - - - 24,140 25,000,000 25,000,000 292,537,167 298,530,171 625,274,273 639,374,876
Notes to the Financial Statements Contd.

189
ALLIANCE FINANCE COMPANY PLC | ANNUAL REPORT 2015/16
2016 2015Arranger No.ofUnits Cost FairValue NoofUnits Cost FairValue (Initial (Initial Investment) Investment) Rs. Rs. Rs. Rs.
18.2 investments in unit Trusts
SubsidiaryCapital Alliance Pvt. Ltd - Corporate treasury fund 5,138,617 70,649,816 78,448,181 5,138,617 70,649,816 72,429,832 70,649,816 78,448,181 70,649,816 72,429,832 363,186,983 376,978,352 695,924,089 711,804,708
Company Group 2016 2015 2016 2015 Rs. Rs. Rs. Rs.
19. LOANS AND ADVANCESTerm loan receivable 2,597,028,565 1,283,975,970 2,597,028,565 1,283,975,970Gold loans 367,909,866 812,153,166 367,909,866 812,153,166Pledge loans 668,563,924 96,314,760 668,563,924 96,314,760Microfinance loans 2,011,667,242 1,575,997,029 2,011,667,242 1,575,997,029Loans against fixed deposits 80,958,989 79,498,872 80,958,989 79,498,872Staff loans (Note 19.3) 12,087,643 14,317,135 12,194,158 14,457,185Operating lease debtors 1,174,740 667,701 1,174,740 667,701 5,739,390,969 3,862,924,633 5,739,497,484 3,863,064,683Less : Allowance for impairment losses (Note 19.1 & 19.2) (135,409,648) (133,475,555) (135,409,648) (133,475,555)Net loans and advances 5,603,981,321 3,729,449,078 5,604,087,836 3,729,589,128
19.1 allowances for impairment losses
As at 1st April 133,475,555 74,239,105 133,475,555 74,239,105Charge / (Reversal) for the year 1,934,093 59,236,450 1,934,093 59,236,450As at 31st March 135,409,648 133,475,555 135,409,648 133,475,555
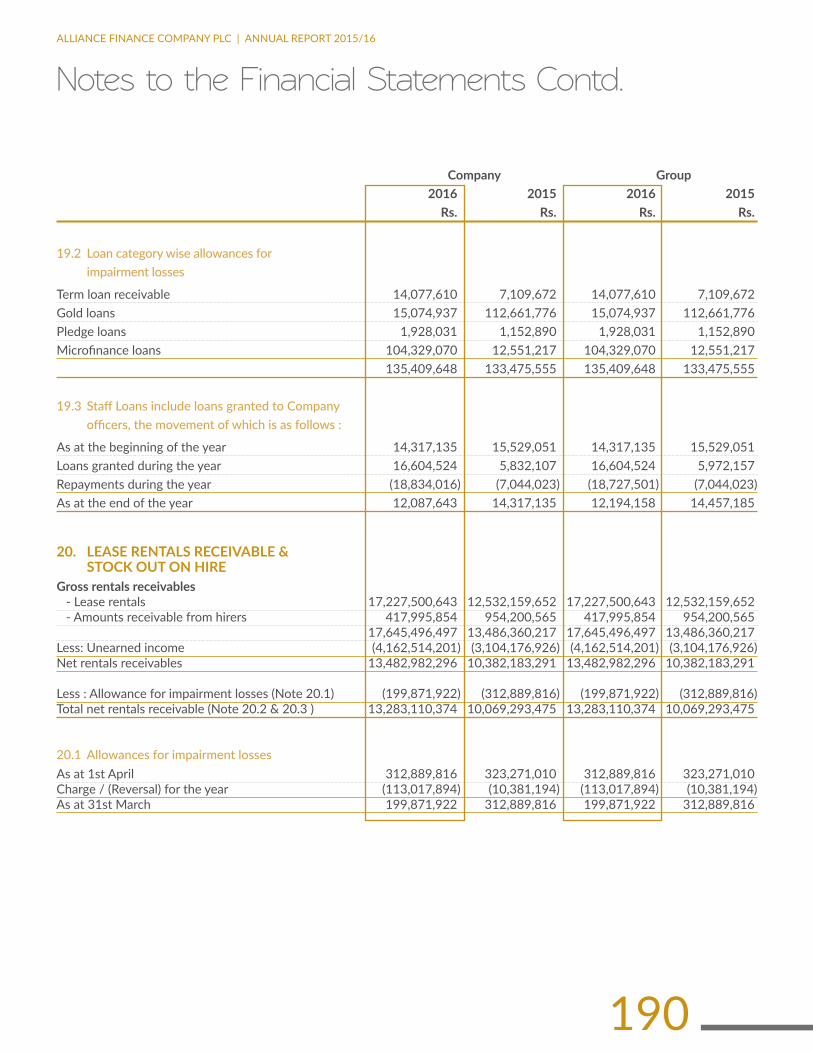
190
ALLIANCE FINANCE COMPANY PLC | ANNUAL REPORT 2015/16
Company Group 2016 2015 2016 2015 Rs. Rs. Rs. Rs.
19.2 loan category wise allowances for impairment losses
Term loan receivable 14,077,610 7,109,672 14,077,610 7,109,672Gold loans 15,074,937 112,661,776 15,074,937 112,661,776Pledge loans 1,928,031 1,152,890 1,928,031 1,152,890Microfinance loans 104,329,070 12,551,217 104,329,070 12,551,217 135,409,648 133,475,555 135,409,648 133,475,555
19.3 Staff Loans include loans granted to Company officers, the movement of which is as follows :
As at the beginning of the year 14,317,135 15,529,051 14,317,135 15,529,051Loans granted during the year 16,604,524 5,832,107 16,604,524 5,972,157Repayments during the year (18,834,016) (7,044,023) (18,727,501) (7,044,023)As at the end of the year 12,087,643 14,317,135 12,194,158 14,457,185
20. LEASERENTALSRECEIVABLE& STOCKOUTONHIRE
Gross rentals receivables - Lease rentals 17,227,500,643 12,532,159,652 17,227,500,643 12,532,159,652 - Amounts receivable from hirers 417,995,854 954,200,565 417,995,854 954,200,565 17,645,496,497 13,486,360,217 17,645,496,497 13,486,360,217Less: Unearned income (4,162,514,201) (3,104,176,926) (4,162,514,201) (3,104,176,926)Net rentals receivables 13,482,982,296 10,382,183,291 13,482,982,296 10,382,183,291
Less : Allowance for impairment losses (Note 20.1) (199,871,922) (312,889,816) (199,871,922) (312,889,816)Total net rentals receivable (Note 20.2 & 20.3 ) 13,283,110,374 10,069,293,475 13,283,110,374 10,069,293,475
20.1 allowances for impairment lossesAs at 1st April 312,889,816 323,271,010 312,889,816 323,271,010Charge / (Reversal) for the year (113,017,894) (10,381,194) (113,017,894) (10,381,194)As at 31st March 199,871,922 312,889,816 199,871,922 312,889,816
Notes to the Financial Statements Contd.

191
ALLIANCE FINANCE COMPANY PLC | ANNUAL REPORT 2015/16
20.2 Company & GroupAsat31stMarch2016 Withinoneyear 1-5years Over5years Total Rs. Rs. Rs. Rs.
Gross rentals receivables- Lease rentals 6,746,859,752 10,456,294,259 24,346,632 17,227,500,643- Amounts receivable from hirers 400,275,796 17,714,387 5,671 417,995,854 7,147,135,548 10,474,008,646 24,352,303 17,645,496,497Less: Unearned income (2,173,449,885) (1,988,212,266) (852,050) (4,162,514,201)Net rentals receivables 4,973,685,663 8,485,796,380 23,500,253 13,482,982,296
Less : Allowance for impairment losses (199,871,922)Total net rentals receivable 13,283,110,374
20.3 Company & GroupGross rentals receivables- Lease rentals 5,632,649,654 6,868,653,043 30,856,955 12,532,159,652- Amounts receivable from hirers 886,277,550 67,923,015 - 954,200,565 6,518,927,204 6,936,576,058 30,856,955 13,486,360,217Less: Unearned income (1,767,407,463) (1,334,407,054) (2,362,409) (3,104,176,925)Net rentals receivables 4,751,519,741 5,602,169,004 28,494,546 10,382,183,291
Less : Allowance for impairment losses (312,889,816)Total net rentals receivable 10,069,293,475
Lease rentals receivables include receivables amounting to Rs. 6,394,850,888 that have been assigned under a securitization funding arrangement.
Company GroupFortheFinancialyearended31stMarch 2016 2015 2016 2015 Rs. Rs. Rs. Rs.
21. HIREPURCHASERENTALSRECEIVABLE& STOCKOUTONHIRE
Gross rentals receivables- Hire purchase rentals 532,742,659 1,326,487,925 532,742,659 1,326,487,925- Amounts receivable from hirers 35,935,139 153,957,911 35,935,139 153,957,911 568,677,798 1,480,445,836 568,677,798 1,480,445,836Less: Unearned income (93,938,160) (301,790,894) (93,938,160) (301,790,894)Net rentals receivables 474,739,638 1,178,654,942 474,739,638 1,178,654,942
Less : Allowance for impairment losses (Note 21.1) (12,170,437) (54,457,771) (12,170,437) (54,457,771)Total net rentals receivable (Note 21.2 & 21.3) 462,569,201 1,124,197,171 462,569,201 1,124,197,171
21.1 allowance for impairment lossesAs at 1st April 54,457,771 77,838,700 54,457,771 77,838,700Charge / (Reversal) for the year (42,287,334) (23,380,929) (42,287,334) (23,380,929)As at 31st March 12,170,437 54,457,771 12,170,437 54,457,771

192
ALLIANCE FINANCE COMPANY PLC | ANNUAL REPORT 2015/16
Withinoneyear 1-5years Over5years Total Asat31stMarch2016 Rs. Rs. Rs. Rs.
21.2 Company & GroupGross rentals receivables- Hire purchase rentals 307,628,625 225,114,034 - 532,742,659- Amounts receivable from hirers 33,189,849 2,745,290 - 35,935,139 340,818,474 227,859,324 - 568,677,798Less: Unearned income (64,207,595) (29,730,565) - (93,938,160)Net rentals receivables 276,610,879 198,128,759 - 474,739,638
Less : Allowance for impairment losses (12,170,437)Total net rentals receivable 462,569,201
21.3 Company & GroupGross rentals receivables- Hire purchase rentals 650,715,250 675,772,675 - 1,326,487,925- Amounts receivable from hirers 146,054,588 7,903,323 - 153,957,911 796,769,838 683,675,998 - 1,480,445,836Less: Unearned income (180,986,084) (120,804,810) - (301,790,895)Net rentals receivables 615,783,754 562,871,188 - 1,178,654,942
Less : Allowance for impairment losses (54,457,771)Total net rentals receivable 1,124,197,171
Hire purchase receivables include receivables amounting to Rs. 254,473,530 that have been assigned under a securitization funding arrangement.
Company Group 2016 2015 2016 2015 Rs. Rs. Rs. Rs.
22. FINANCIAL INVESTMENTS - AVAILABLE FOR SALE
Government of Sri Lanka treasury bonds 438,251,912 495,274,211 438,251,912 495,274,211Unquoted equities (Note 22.1) 12,002,185 44,440,661 25,502,185 44,440,661 450,254,097 539,714,872 463,754,097 539,714,872
Notes to the Financial Statements Contd.
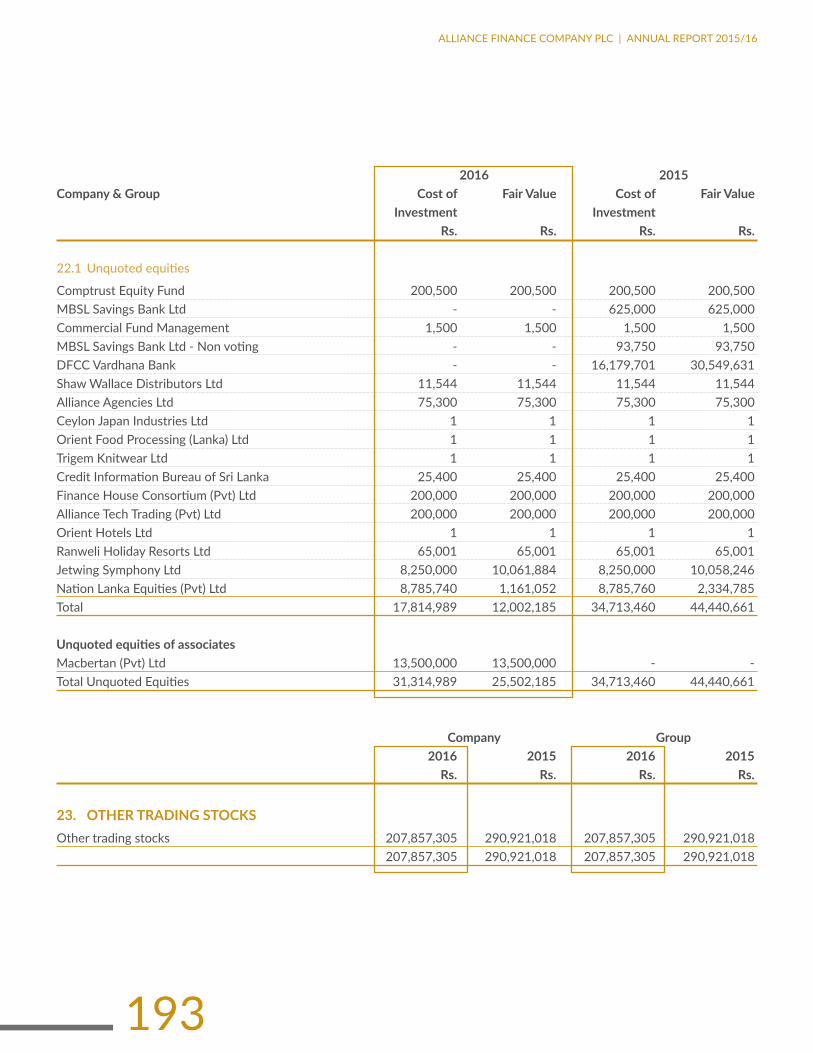
193
ALLIANCE FINANCE COMPANY PLC | ANNUAL REPORT 2015/16
2016 2015Company&Group Costof FairValue Costof FairValue Investment Investment Rs. Rs. Rs. Rs.
22.1 Unquoted equities
Comptrust Equity Fund 200,500 200,500 200,500 200,500MBSL Savings Bank Ltd - - 625,000 625,000Commercial Fund Management 1,500 1,500 1,500 1,500MBSL Savings Bank Ltd - Non voting - - 93,750 93,750DFCC Vardhana Bank - - 16,179,701 30,549,631Shaw Wallace Distributors Ltd 11,544 11,544 11,544 11,544Alliance Agencies Ltd 75,300 75,300 75,300 75,300Ceylon Japan Industries Ltd 1 1 1 1Orient Food Processing (Lanka) Ltd 1 1 1 1Trigem Knitwear Ltd 1 1 1 1Credit Information Bureau of Sri Lanka 25,400 25,400 25,400 25,400Finance House Consortium (Pvt) Ltd 200,000 200,000 200,000 200,000Alliance Tech Trading (Pvt) Ltd 200,000 200,000 200,000 200,000Orient Hotels Ltd 1 1 1 1Ranweli Holiday Resorts Ltd 65,001 65,001 65,001 65,001Jetwing Symphony Ltd 8,250,000 10,061,884 8,250,000 10,058,246Nation Lanka Equities (Pvt) Ltd 8,785,740 1,161,052 8,785,760 2,334,785Total 17,814,989 12,002,185 34,713,460 44,440,661
UnquotedequitiesofassociatesMacbertan (Pvt) Ltd 13,500,000 13,500,000 - -Total Unquoted Equities 31,314,989 25,502,185 34,713,460 44,440,661
Company Group 2016 2015 2016 2015 Rs. Rs. Rs. Rs.
23. OTHERTRADINGSTOCKSOther trading stocks 207,857,305 290,921,018 207,857,305 290,921,018 207,857,305 290,921,018 207,857,305 290,921,018

194
ALLIANCE FINANCE COMPANY PLC | ANNUAL REPORT 2015/16
Company GroupFortheFinancialyearended31stMarch 2016 2015 2016 2015 Rs. Rs. Rs. Rs.
24. OTHERFINANCIALASSETSCollaboration debtors 1,793,477 9,129,100 1,793,477 9,129,100Other receivables 179,718,057 125,696,866 176,860,142 112,190,077 181,511,534 134,825,966 178,653,619 121,319,177
Company GroupFortheFinancialyearended31stMarch 2016 2015 2016 2015 Rs. Rs. Rs. Rs.
25. OTHERNON-FINANCIALASSETSPre-paid expenses 104,987,803 115,605,921 104,987,803 115,605,921Stationery stock account 5,087,147 3,047,745 5,087,147 3,047,745VAT payables/recoverable 3,370,492 8,557,302 8,071,404 9,712,327 113,445,442 127,210,968 118,146,354 128,365,993
26. INCOME TAX REFUND DUEReceivable from Inland Revenue Department - 50,348,792 - 50,348,792 - 50,348,792 - 50,348,792
EquityMethod % Carrying Profit Dividend Changesof Adjustment Carrying Holding Value Share Received interest on Value 01.04.2015 Liquidation 31.03.2016 Rs. Rs. Rs. Rs. Rs. Rs.
27. INVESTMENT IN ASSOCIATESCompany and GroupMacbertan (Pvt) Ltd Note - a (i) 24.70% 63,271,188 10,080,460 (2,039,040) (3,153,928) 0 68,158,680Xesol (Pvt) Ltd 39.62% 6,604,176 - - - (6,604,176) - 69,875,364 10,080,460 (2,039,040) (3,153,928) (6,604,176) 68,158,680
Note - a (i)Alliance Finance Company PLC shareholding of Macbertan (Pvt) Ltd has changed from 30% to 24.71% during the year due to issue of new shares to other investors. Accordingly loss of Rs.3,153,928/- has been charged to the Profit & Loss.
Notes to the Financial Statements Contd.

195
ALLIANCE FINANCE COMPANY PLC | ANNUAL REPORT 2015/16
% Carrying Profit DividendDerecognition Transferto Carrying Holding Value Share Received ofAFS Subsidiary Value 01.04.2014 Reserve 31.03.2015 Rs. Rs. Rs. Rs. Rs. Rs.
27. INVESTMENT IN ASSOCIATES Contd.
Alfinco Insurance Brokers (Pvt) Ltd - Note a - (ii) 39.00% 58,203,474 1,946,725 (1,218,750) (42,007,411) (16,924,038) -Macbertan (Pvt) Ltd 30.00% 58,634,829 9,108,359 (4,472,000) - - 63,271,188Xesol (Pvt) Ltd 39.62% 6,604,176 - - - - 6,604,176 123,442,479 11,055,084 (5,690,750) (42,007,411) (16,924,038) 69,875,364
Note - a (ii)Alliance Finance Company PLC holding of Alfinco Insurance Brokers (Pvt) Ltd increased up to 64% in 30th September 2014,and it became a subsidiary and carrying value has been recognised as the cost of the subsidiary.
b) Cost Method 2016 2015 No.of Rs. Rs. Ordinary Costof Costof Shares Investment Investment Rs. Rs.
Xesol (Pvt ) Ltd 513,055 - 5,130,550Macbertan (Pvt) Ltd 1,720,000 17,200,000 17,200,000 17,200,000 22,330,550
c) Summary Financial information of the Investment in Associates 2016 2015 Rs. Rs.
Total assets 638,494,788 564,006,734Total liabilities 362,689,899 353,172,109Net assets 275,804,899 210,834,624Revenue 974,735,405 908,872,722Profits 36,266,083 30,361,195

196
ALLIANCE FINANCE COMPANY PLC | ANNUAL REPORT 2015/16
28. INVESTMENT IN SUBSIDIARIES Costof Investment PrincipalActivity %Holding Rs.
Alfinco Insurance Brokers (Pvt) Ltd Insurance Brokering 63.94% 16,924,038
Alfinco Insurance Brokers (Pvt) Ltd not quoted in Colombo Stock Exchange.
Alliance Finance Company PLC holding of Alfinco Insurance Brokers (Pvt) Ltd increased up to 64% in 30th September 2014, as a result carrying value of associate company transferred as a cost to the subsidiary.
Asat31stMarch 2016 2015 Rs. Rs.
28.1 Summarised Financial Information of Subsidiary
Alfinco Insurance Brokers (Pvt) LtdNet Operating income 40,645,551 442,638,352Less: Operating expenses (17,337,388) (34,606,098)Profit before taxes 23,308,163 408,032,254Less: Taxes (6,301,020) (6,418,179)Profit after tax 17,007,143 401,614,075
Assets 168,556,666 147,596,565Liabilities 76,844,071 72,979,720Equity 91,712,595 74,616,845
Notes to the Financial Statements Contd.

197
ALLIANCE FINANCE COMPANY PLC | ANNUAL REPORT 2015/16
Balance Additions Disposals Adjustments/ Balance Asat Transfers Asat GrossCarryingAmounts 01.04.2015 31.03.2016 Rs. Rs. Rs. Rs. Rs.
29. PROPERTY,PLANTANDEQUIPMENT29.1 Company
Cost/ValuationFreeholdAssetsLand 565,088,034 219,757,593 - - 784,845,627Buildings 55,111,229 82,369,547 - - 137,480,776Furniture & fittings 81,206,266 13,621,625 - (357,632) 94,470,259Equipment 232,289,839 38,245,038 (2,280,130) (588,000) 267,666,747Motor vehicles & accessories 318,440,408 8,686,000 (76,492,288) 24,278,116 274,912,236Computers 178,669,307 61,740,906 - 588,000 240,998,213Antiques 25,580 - - - 25,580Cutlery & crockery 133,419 - (133,419) - - 1,430,964,082 424,420,709 (78,905,837) 23,920,484 1,800,399,438
Assets on Finance LeaseMotor vehicles 76,866,071 - - - 76,866,071Computers - 26,251,500 - - 26,251,500 76,866,071 26,251,500 - - 103,117,571 1,507,830,153 450,672,209 (78,905,837) 23,920,484 1,903,517,009
DepreciationFreeholdAssetsLand - - - - -Buildings 5,260,938 2,515,395 - 167 7,776,500Furniture & fittings 24,282,223 6,266,145 - (13,203) 30,535,166Equipments 93,866,122 23,332,396 (1,212,405) 1,010,981 116,997,094Motor vehicles & accessories 115,467,824 23,661,178 (29,997,473) (1,213,031) 107,918,498Computers 122,745,099 38,215,163 - 219,406 161,179,668Antiques - - - - -Cutlery & crockery 72,815 7,635 (76,129) (4,321) - 361,695,021 93,997,912 (31,286,007) - 424,406,926
Assets on Finance LeaseMotor vehicles 12,807,924 3,748,661 - - 16,556,585Computers - 2,187,625 - - 2,187,625 12,807,924 5,936,286 - - 18,744,210 374,502,945 99,934,198 (31,286,007) - 443,151,136

198
ALLIANCE FINANCE COMPANY PLC | ANNUAL REPORT 2015/16
Balance Additions Disposals Adjustments/ Balance Asat Transfers Asat GrossCarryingAmounts 01.04.2015 31.03.2016 Rs. Rs. Rs. Rs. Rs.
29. PROPERTY,PLANTANDEQUIPMENT(contd.)29.1 Company (Continued)Net book valueLand 565,088,034 784,845,627Buildings 49,850,291 129,704,276Furniture & fittings 56,924,043 63,935,093Equipments 138,423,717 150,669,653Motor vehicles & accessories 202,972,584 166,993,738Computers 55,924,208 79,818,545Antiques 25,580 25,580Cutlery & crockery 60,604 - 1,069,269,061 1,375,992,512
Assets on Finance LeaseMotor vehicles 64,058,147 60,309,486Computers - 24,063,875 64,058,147 84,373,361Total Value of Depreciable Assets 1,133,327,208 1,460,365,873
29.2 GroupCost/ValuationFreeholdAssetsLand 565,088,034 219,757,593 - - 784,845,627Buildings 55,111,229 82,369,547 - - 137,480,776Furniture & fittings 81,485,624 13,621,625 - (357,632) 94,749,617Equipment 232,873,648 38,245,038 (2,280,130) (588,000) 268,250,556Motor vehicles & accessories 318,440,408 8,686,000 (76,492,288) 24,278,116 274,912,236Computers 180,074,471 61,740,906 - 588,000 242,403,377Antiques 25,580 - - - 25,580Cutlery & crockery 133,419 - (133,419) - - 1,433,232,413 424,420,709 (78,905,837) 23,920,484 1,802,667,769
Assets on Finance LeaseMotor vehicles 76,866,071 - - - 76,866,071Computers - 26,251,500 - - 26,251,500 76,866,071 26,251,500 - - 103,117,571 1,510,098,484 450,672,209 (78,905,837) 23,920,484 1,905,785,340
Notes to the Financial Statements Contd.

199
ALLIANCE FINANCE COMPANY PLC | ANNUAL REPORT 2015/16
Balance Additions Disposals Adjustments/ Balance Asat Transfers Asat Grosscarryingamounts 01.04.2015 31.03.2016 Rs. Rs. Rs. Rs. Rs.
29.2 Group (Continued)
DepreciationFreeholdAssetsLand - - - - -Buildings 5,260,938 2,515,395 - 167 7,776,500Furniture & fittings 24,343,510 6,335,266 - (13,203) 30,665,573Equipments 94,020,579 23,532,911 (1,212,405) 1,010,981 117,352,066Motor Vehicles & accessories 115,467,824 23,661,178 (29,997,473) (1,213,030) 107,918,499Computers 122,962,431 39,030,838 - 219,406 162,212,675Antiques - - - - -Cutlery & crockery 72,815 7,635 (76,129) (4,321) - 362,128,097 95,083,223 (31,286,007) - 425,925,313
Assets on Finance LeaseMotor vehicles 12,807,924 3,748,661 - - 16,556,585Computers - 2,187,625 - - 2,187,625 12,807,924 5,936,286 - - 18,744,210 374,936,021 101,019,509 (31,286,007) - 444,669,523
Net book valueLand 565,088,034 784,845,627Buildings 49,850,291 129,704,275Furniture & fittings 57,142,114 64,084,044Equipments 138,853,069 150,898,490Motor vehicles & accessories 202,972,584 166,993,737Computers 57,112,040 80,190,702Antiques 25,580 25,580Cutlery & crockery 60,604 - 1,071,104,316 1,376,742,455
Assets on Finance LeaseMotor vehicles 64,058,147 60,309,486Computers - 24,063,875 64,058,147 84,373,361Total Value of Depreciable Assets 1,135,162,463 1,461,115,815
29.3 During the financial year, the Company acquired Property, Plant & Equipment to the aggregate value of Rs.424,420,709/- (2015 - Rs.106,738,856/-) and payment made by cash.
29.4 There aren’t any temporarily idling assets as at 31st March 2016.
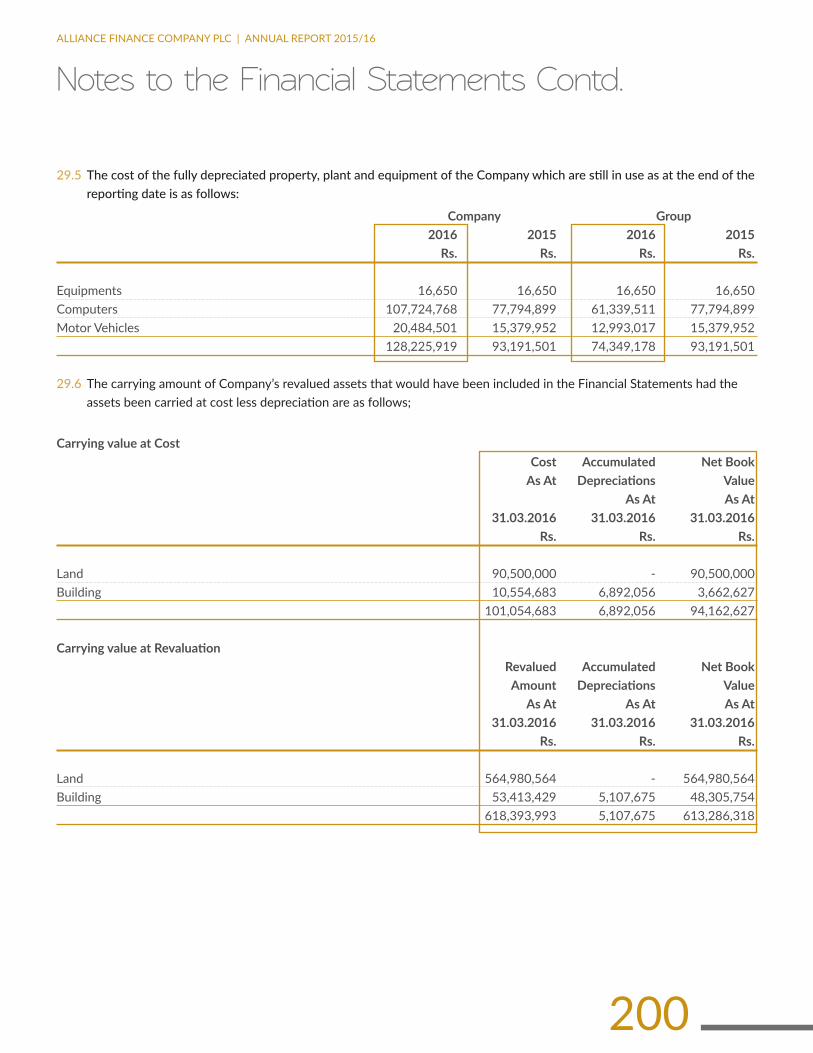
200
ALLIANCE FINANCE COMPANY PLC | ANNUAL REPORT 2015/16
29.5 The cost of the fully depreciated property, plant and equipment of the Company which are still in use as at the end of the reporting date is as follows:
Company Group 2016 2015 2016 2015 Rs. Rs. Rs. Rs.
Equipments 16,650 16,650 16,650 16,650Computers 107,724,768 77,794,899 61,339,511 77,794,899Motor Vehicles 20,484,501 15,379,952 12,993,017 15,379,952 128,225,919 93,191,501 74,349,178 93,191,501
29.6 The carrying amount of Company’s revalued assets that would have been included in the Financial Statements had the assets been carried at cost less depreciation are as follows;
Carrying value at Cost Cost Accumulated Net Book AsAt Depreciations Value As At As At 31.03.2016 31.03.2016 31.03.2016 Rs. Rs. Rs.
Land 90,500,000 - 90,500,000Building 10,554,683 6,892,056 3,662,627 101,054,683 6,892,056 94,162,627
CarryingvalueatRevaluation Revalued Accumulated Net Book Amount Depreciations Value As At As At As At 31.03.2016 31.03.2016 31.03.2016 Rs. Rs. Rs.
Land 564,980,564 - 564,980,564Building 53,413,429 5,107,675 48,305,754 618,393,993 5,107,675 613,286,318
Notes to the Financial Statements Contd.

201
ALLIANCE FINANCE COMPANY PLC | ANNUAL REPORT 2015/16
29.7 Details of Freehold Land and Buildings as at 31st March 2016
Location Extent Costor Building Costor Total Revaluationof Revaluationof Value Land Building (Purchases) Rs. (SquareFeet) Rs. Rs.
No 84 Ward Place Colombo - 7 37.33 P 275,000,000 6,967 21,877,050 296,877,050No. 199/11, Obesekara Crescent, Rajagiriya Road, Rajagiriya 165 P 206,250,000 16,508 13,150,000 219,400,000No.98, Ward Place, Colombo - 7 19.41 P 83,105,564 8,460 18,386,379 101,491,943No.152, Batapadura Watta Road, Siyambalagoda 28 P 625,000 - - 625,000No.720, Kotte Road, Rajagiriya 33.85 P 130,253,800 - - 130,253,800No.722, Kotte Road, Rajagiriya 23.26 P 89,503,792 16,660 81,850,207 171,353,999FreeholdLandandBuilding 784,738,156 135,263,636 920,001,792
Company Group 2016 2015 2016 2015 Rs. Rs. Rs. Rs.
30. DUETOBANKSBank overdrafts 234,247,782 434,274,099 258,960,281 457,236,357Securitised borrowings and other bank facilities (Note 30.1 & 30.2 ) 8,063,318,111 2,467,855,367 8,063,318,111 2,467,855,367Finance lease (30.3, 30.4) 31,412,849 26,941,881 31,412,849 26,941,881Total 8,328,978,742 2,929,071,347 8,353,691,241 2,952,033,605
As at Loans Interest Repayments As at Period Security 31.03.2015 Obtained Recognized 31.03.2016 SecuritisedBorrowings Rs. Rs. Rs. Rs. Rs.
30.1 Securitised Borrowings, Syndicated Loans and Other Bank FacilitiesCompany and GroupSeylan Bank Trust - 01 94,047,891 - 5,872,462 (99,920,353) - 36 Months Lease receivablesDeutsche Bank Trust - 25 7,232,960 - 58,912 (7,291,872) - 24 Months Lease receivablesDeutsche Bank Trust - 26 101,109,128 - 7,242,801 (96,280,690) 12,071,239 36 Months Lease receivablesDeutsche Bank Trust - 27 234,852,731 - 21,264,299 (136,760,609) 119,356,421 36 Months Lease receivablesDeutsche Bank Trust - 28 - 1,000,000,000 86,172,996 (150,993,469) 935,179,528 48 Months Lease/HP receivablesDeutsche Bank Trust - 29 - 400,000,000 24,331,106 (130,828,783) 293,502,323 36 Months Lease/HP receivablesDeutsche Bank Trust - 30 - 600,000,000 7,428,848 - 607,428,848 48 Months Lease receivables 437,242,710 2,000,000,000 152,371,424 (622,075,775) 1,967,538,359

202
ALLIANCE FINANCE COMPANY PLC | ANNUAL REPORT 2015/16
As at Loans Interest Repayments As at Period Security 31.03.2015 Obtained Recognized 31.03.2016 SecuritisedBorrowings Rs. Rs. Rs. Rs. Rs.
30.2 Direct Bank BorrowingsTerm LoansBOC Loan - 1,382,000,000 27,876,726 (12,515,493) 1,397,361,233 12 Months USD -Fixed depositsCargills Bank - 100,000,000 2,016,792 (2,016,792) 100,000,000 48 Months Lease receivablesCommercial Bank 149,985,007 150,000,000 4,833,696 (161,760,702) 143,058,001 36 Months Land & buildingDFCC Bank 67,499,991 - 5,599,187 (18,456,330) 54,642,848 96 Months Land & buildingDFCC Bank - PCI Loan 131,680,221 - 4,406,360 (19,916,269) 116,170,312 180 Months NilForeign currency Loan capital - Triodos - 718,950,000 16,601,441 - 735,551,441 36 Months MF micro receivableForeign currency Loan capital- Commercial Bank - 718,950,000 16,839,505 (12,364,505) 723,425,000 12 Months NilHatton National Bank 64,500,000 200,000,000 16,334,647 (125,804,647) 155,030,000 48 Months Lease/HP receivablesNDB Bank 300,000,000 1,100,000,000 11,069,452 (1,109,066,712) 302,002,740 03 Months Lease/HP receivablesPublic Bank 22,000,000 100,000,000 8,607,688 (36,019,491) 94,588,197 60 Months Lease receivablesPublic Bank - vehicle Loan 5,879,726 - 782,057 (6,661,783) - 60 Months 04 vehiclesReverse repo on treasury bills 200,307,055 440,000,000 4,039,533 (458,611,587) 185,735,001 30 Days Treasury bondsSampath Bank Loan 443,760,658 800,000,000 17,249,076 (676,441,081) 584,568,653 60 Months Lease/HP receivablesSeylan Bank - 500,000,000 15,639,652 (69,739,894) 445,899,758 48 Months Lease/HP receivablesUnion Bank 345,000,000 1,125,000,002 20,645,240 (1,145,645,249) 344,999,993 03 Months Lease receivablesUnion Bank - 765,000,000 19,554,451 (372,054,451) 412,500,000 12 Months MF receivables 1,730,612,658 8,099,900,002 192,095,503 4,227,074,986 5,795,533,177
Syndication loan 300,000,000 - 32,700,869 32,454,294 300,246,575 48 Months Lease/HP receivables
2,467,855,367 10,099,900,002 377,167,797 4,881,605,055 8,063,318,111
Asat Newfacilities Repayments Asat 01.04.2015 31.03.2016 Rs. Rs. Rs. Rs.
30.3 Finance lease
30.3.1 Company and group
Finance leases 26,941,881 26,251,500 (21,780,532) 31,412,849 26,941,881 26,251,500 (21,780,532) 31,412,849
Notes to the Financial Statements Contd.

203
ALLIANCE FINANCE COMPANY PLC | ANNUAL REPORT 2015/16
2016 2015 Rs. Rs.
30.4 Finance lease
Gross liability 35,130,889 29,494,869Less: Finance charges allocated for future periods (3,718,040) (2,552,988)Net liability 31,412,849 26,941,881
RepayablewithinoneyearGross liability 15,702,261 19,605,698Less: Finance charges allocated for future periods (2,034,873) (2,219,240)Net liability 13,667,388 17,386,458
RepayablewithinonetofiveyearsGross liability 19,428,628 9,889,171Less: Finance charges allocated for future periods (1,683,167) (333,748)Net liability 17,745,461 9,555,423
Company Group 2016 2015 2016 2015 Rs. Rs. Rs. Rs.
31. DUE TO CUSTOMERSFixed deposits 9,786,480,092 9,950,574,536 9,786,480,092 9,950,574,536Certificates of deposit 100,000 100,000 100,000 100,000Savings deposits 677,569,474 393,391,397 677,569,474 393,391,397 10,464,149,566 10,344,065,933 10,464,149,566 10,344,065,933
Company GroupFortheFinancialyearended31stMarch 2016 2015 2016 2015 Rs. Rs. Rs. Rs.
32. DEBT INSTRUMENTS ISSUED AND OTHERBORROWEDFUNDS
Commercial papers 126,630,566 - 126,630,566 -Secured debentures - Ceylon Assets Management Ltd - 34,000,000 - 34,000,000Unsecured debentures ( Note No 32.1 ) 2,935,784,398 3,169,466,448 2,935,784,398 3,169,466,448 3,062,414,964 3,203,466,448 3,062,414,964 3,203,466,448
32.1 unsecured debenturesFace value 2,804,450,488 3,051,970,488 2,804,450,488 3,051,970,488Accrued interest 131,333,910 117,495,960 131,333,910 117,495,960 2,935,784,398 3,169,466,448 2,935,784,398 3,169,466,448

204
ALLIANCE FINANCE COMPANY PLC | ANNUAL REPORT 2015/16
32.2 Quoted - DebenturesCompany and groupa) The debentures include 10,000,000 Unsecured Redeemable Subordinated Listed Rated Debentures of Rs. 100/- each
issued by the Company in 2012. The Debentures are quoted on the Colombo Stock exchange in November 2013. Debenture type C of 2,475,200 were redeemed during the financial year. Remaining debentures break up are given below.
Category Period Noof Face Interest Debentures ValueRs. payable RateofInterest
Type ‘ A ‘ 05 Years 7,524,700 752,470,000 Monthly Fixed - 20% per annumType ‘ D ‘ 04 Years 100 10,000 Annually Floating rate- equivalent to the one year treasury bill rate plus 3% 7,524,800 752,480,000
b) The debentures include 12,000,000 Unsecured Redeemable Listed Rates Subordinated Debentures of Rs. 100/- each issued by the Company in September 2013. The Debentures are quoted on the Colombo Stock exchange. Details are given below. Debenture type ‘D’ issued at discount basis.
Category Period Noof Face Interest Debentures ValueRs. payable RateofInterest
Type ‘ A ‘ 03 Years 4,036,000 403,600,000 Annually Fixed rate of 15.5% per annumType ‘ B ‘ 04 Years 1,682,000 168,200,000 Semi annually Fixed rate of 16% per annumType ‘ C ‘ 05 Years 3,510,000 351,000,000 Semi annually Fixed rate of 16.5% per annumType ‘ D ‘ 05 Years 2,772,000 129,170,488 Annually Zero coupon Debentures with an annually compounding AER of 16.5% 12,000,000 1,051,970,488
c) The debentures include 10,000,000 Unsecured Redeemable Listed Rated Debentures of Rs. 100/- each issued by the Company in December 2014. The Debentures are quoted on the Colombo Stock exchange. Details are given below.
Noof Face Interest Category Period Debentures ValueRs. payable RateofInterest
Type ‘ A ‘ 04 Years 2,000,000 200,000,000 Annually 9% per annumType ‘ B ‘ 05 Years 8,000,000 800,000,000 Annually 9.35% per annum 10,000,000 1,000,000,000
Company GroupFortheFinancialyearended31stMarch 2016 2015 2016 2015 Rs. Rs. Rs. Rs.
33. OTHERFINANCIALLIABILITIESAccrued expenses 118,516,728 70,041,841 118,516,728 72,085,746Others 765,693,840 630,794,971 771,599,379 639,645,066 884,210,568 700,836,812 890,116,107 711,730,812
34. OTHERNONFINANCIALLIABILITIESVAT payables 22,092,978 19,792,900 22,092,978 22,027,964Other taxes payables 13,787,425 19,797,247 13,787,425 19,797,247 35,880,403 39,590,147 35,880,403 41,825,211
Notes to the Financial Statements Contd.

205
ALLIANCE FINANCE COMPANY PLC | ANNUAL REPORT 2015/16
Company GroupFortheFinancialyearended31stMarch 2016 2015 2016 2015 Rs. Rs. Rs. Rs.
35. INCOME TAX LIABILITYReceivable from Inland Revenue Department (65,449,990) - (65,449,990) -Current tax liabilities 128,404,723 - 133,040,672 - 62,954,733 - 67,590,682 -
36. RETIREMENT BENEFIT OBLIGATIONSRetirementBenefitObligations-Gratuity36.1 liability recognized in the Balance sheetBalance at the beginning of the year 99,773,999 63,151,656 100,758,137 64,402,445Amount charged/(reversed) for the year (Note - 36.2) 15,930,995 50,104,558 16,127,641 49,837,907Transfer to gratuity trust fund (20,000,000) (12,550,308) (20,000,000) (12,550,308)Payments made during the year (4,467,476) (931,907) (4,587,476) (931,907)Balance at the end of the year 91,237,518 99,773,999 92,298,302 100,758,137
36.2 Amount Recognised in Profit or LossCurrent service cost for the year 22,055,492 20,559,150 22,247,891 20,237,123Interest cost for the year 19,208,727 13,702,545 19,301,582 13,779,384Expected return on plan assets (9,151,836) (7,387,379) (9,151,836) (7,387,379) 32,112,383 26,874,316 32,397,637 26,629,127
AmountRecognisedinOtherComprehensiveIncomeNet actuarial (gain)/ loss (16,181,388) 23,230,242 (16,269,996) 23,208,779
Amount Charged/(Reversed) for the year 15,930,995 50,104,558 16,127,641 49,837,907
36.3 AssumptionsDiscount rate 11% 10% 11% 11%Salary scale 10% 12% 10% 10%Mortality table A 67/70 A 67/70 A 67/70 A 67/70Staff turnover 15% 14% 15% 24%
Retirement age Normal retirement age, or age on valuation date, if greater.
An actuarial valuation of the gratuity was carried out as at 31st March 2016 by Actuarial & Management Consultants (Pvt) Limited, a firm of professional actuaries. The valuation method used by the actuary to value the Fund is the “Projected Unit Credit Method”, recommended by LKAS 19

206
ALLIANCE FINANCE COMPANY PLC | ANNUAL REPORT 2015/16
Company GroupFortheFinancialyearended31stMarch 2016 2015 2016 2015 Rs. Rs. Rs. Rs.
37. DEFERRED INCOME TAX ASSETS AND LIABILITIES
DeferredtaxliabilitiesBalance at 01st April 143,545,449 106,302,413 143,856,645 106,729,652Recognised in profit & loss 49,272,920 37,243,036 49,077,461 37,126,993Balance as at 31st March 192,818,369 143,545,449 192,934,106 143,856,645
DeferredtaxassetsBalance at 01st April 151,123,290 194,820,518 151,398,849 195,025,113Recognised in profit & loss 67,277,392 (57,494,458) 67,298,854 (57,494,458)Recognised in other comprehensive income (4,530,789) 13,797,230 (4,530,789) 13,868,194Balance as at 31st March 213,869,894 151,123,290 214,166,914 151,398,849Deferred tax liabilities/Asset (net) (21,051,525) (7,577,841) (21,232,808) (7,542,204)
37.1 Recognised Deferred Tax Assets and Liabilities
LiabilitiesAccelerated depreciation - Own assets - 44,761,673 115,737 45,072,869 - Leased assets 13,787,892 10,630,786 13,787,892 10,630,786Lease rentals 179,030,477 88,152,990 179,030,477 88,152,990 192,818,369 143,545,449 192,934,106 143,856,645
AssetsDefined benefit obligation 25,546,505 27,936,720 25,843,526 28,212,279Own assets 50,790,346 - 50,790,346 -Others 15,236,873 6,308,630 15,236,873 6,308,630Tax loss carried forward 122,296,169 70,855,222 122,296,169 70,855,222Unclaimed tax refunds - 46,022,718 - 46,022,718 213,869,894 151,123,290 214,166,914 151,398,849
38. STATED CAPITAL Company Group 2016 2015 2016 2015 Rs. Rs. Rs. Rs.
38.1 Issued and Fully Paid-Ordinary shares
Rs. 10/- each 2,430,000 ordinary shares 24,300,000 24,300,000 24,300,000 24,300,000 24,300,000 24,300,000 24,300,000 24,300,000
During the financial year the Company not issued shares through IPO, rights or bonus issue of shares
Notes to the Financial Statements Contd.
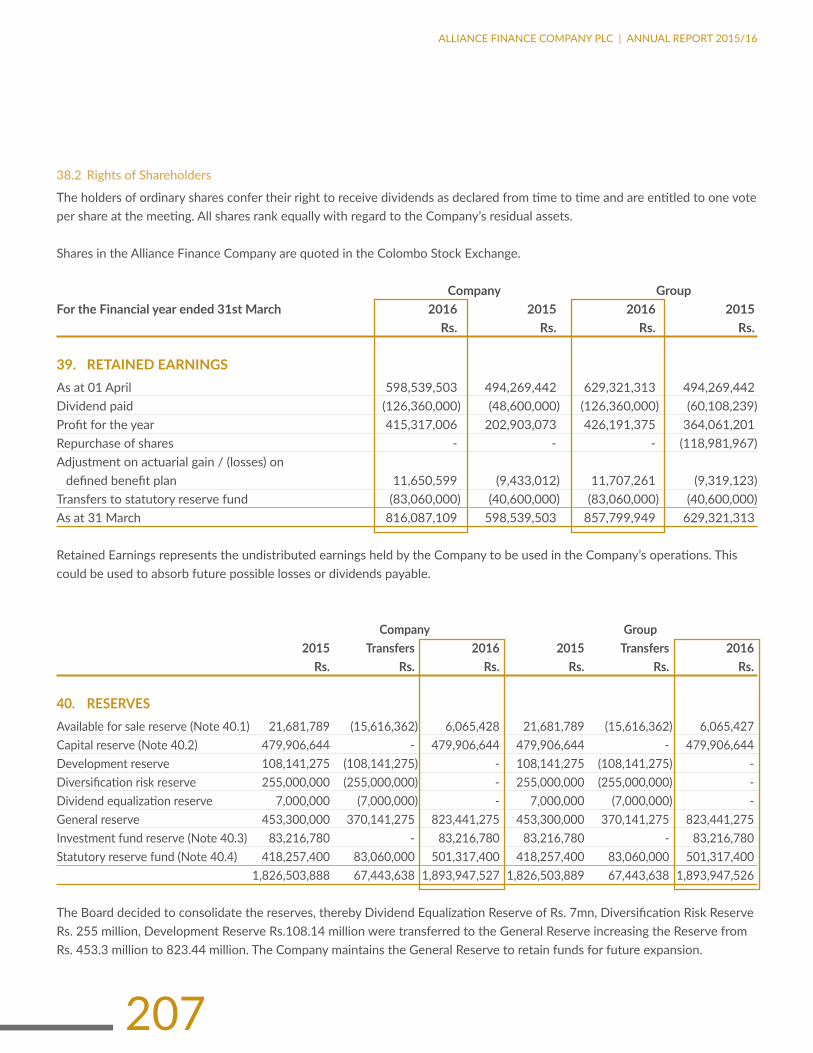
207
ALLIANCE FINANCE COMPANY PLC | ANNUAL REPORT 2015/16
38.2 rights of shareholders
The holders of ordinary shares confer their right to receive dividends as declared from time to time and are entitled to one vote per share at the meeting. All shares rank equally with regard to the Company’s residual assets.
Shares in the Alliance Finance Company are quoted in the Colombo Stock Exchange.
Company GroupFortheFinancialyearended31stMarch 2016 2015 2016 2015 Rs. Rs. Rs. Rs.
39. RETAINED EARNINGSAs at 01 April 598,539,503 494,269,442 629,321,313 494,269,442Dividend paid (126,360,000) (48,600,000) (126,360,000) (60,108,239)Profit for the year 415,317,006 202,903,073 426,191,375 364,061,201Repurchase of shares - - - (118,981,967)Adjustment on actuarial gain / (losses) on defined benefit plan 11,650,599 (9,433,012) 11,707,261 (9,319,123)Transfers to statutory reserve fund (83,060,000) (40,600,000) (83,060,000) (40,600,000)As at 31 March 816,087,109 598,539,503 857,799,949 629,321,313
Retained Earnings represents the undistributed earnings held by the Company to be used in the Company’s operations. This could be used to absorb future possible losses or dividends payable.
Company Group 2015 Transfers 2016 2015 Transfers 2016 Rs. Rs. Rs. Rs. Rs. Rs.
40. RESERVESAvailable for sale reserve (Note 40.1) 21,681,789 (15,616,362) 6,065,428 21,681,789 (15,616,362) 6,065,427Capital reserve (Note 40.2) 479,906,644 - 479,906,644 479,906,644 - 479,906,644Development reserve 108,141,275 (108,141,275) - 108,141,275 (108,141,275) -Diversification risk reserve 255,000,000 (255,000,000) - 255,000,000 (255,000,000) -Dividend equalization reserve 7,000,000 (7,000,000) - 7,000,000 (7,000,000) -General reserve 453,300,000 370,141,275 823,441,275 453,300,000 370,141,275 823,441,275Investment fund reserve (Note 40.3) 83,216,780 - 83,216,780 83,216,780 - 83,216,780Statutory reserve fund (Note 40.4) 418,257,400 83,060,000 501,317,400 418,257,400 83,060,000 501,317,400 1,826,503,888 67,443,638 1,893,947,527 1,826,503,889 67,443,638 1,893,947,526
The Board decided to consolidate the reserves, thereby Dividend Equalization Reserve of Rs. 7mn, Diversification Risk Reserve Rs. 255 million, Development Reserve Rs.108.14 million were transferred to the General Reserve increasing the Reserve from Rs. 453.3 million to 823.44 million. The Company maintains the General Reserve to retain funds for future expansion.

208
ALLIANCE FINANCE COMPANY PLC | ANNUAL REPORT 2015/16
Company Group 2016 2015 2016 2015 Rs. Rs. Rs. Rs.
40.1 available for sale reserve
Balance as at 01 April 21,681,789 108,517,572 21,681,789 108,517,572Sri Lanka government securities (1,250,070) 9,398,622 (1,250,070) 9,398,622Equity securities - un quoted (14,366,292) 3,198,521 (14,366,292) 3,198,521Transfer of realized gain/(loss) on available for sale financial assets - (99,432,926) - (99,432,926) 6,065,427 21,681,789 6,065,427 21,681,789
40.2 CapitalReserve-RevaluationReserve
The Capital Reserves represents the increase in the fair value of the land & buildings at the date of revaluation. The Company revalues its freehold lands and buildings in every three to five years, unless significant changes in fair values indicate it may be necessary to revalue freehold lands and buildings on an earlier date, to ensure that the carrying amounts do not differ materially from the fair values at the end of the reporting date.
The Company treats 50% of the revaluation surplus as supplementary capital in the Tier II Capital Base in the computation of the Risk Weighted Capital Adequacy Ratio in accordance with the Central Bank of Sri Lanka, Finance Companies (Risk Weighted Capital Adequacy Ratio) Direction No.2 of 2006.
40.3 InvestmentFundReserve
Investment fund reserve is a free reserve and have been added to core capital of the Company.
40.4 StatutoryReserveFund
20% of profits after tax of 2016 is transferred to the statutory reserve Fund to fulfil the minimum requirement of the Section 3 (b) of Finance Companies (Capital Funds) Direction No.1 of 2003. This balance in the Statutory Reserve Fund will be used only for the purposes specified in the Finance Business Act, No.42 of 2011.
41. COMPARATIVE FIGURESThe comparative information is re-classified where ever necessary to confirm with the current year’s classification in order to provide a better presentation.
StatementofProfit&Loss Presentationin Reclassification Presentationin 2015 2016 2016 Rs. Rs. Rs.
Impairment (charges) / reversal for loans and other losses 643,566,670 245,227,950 398,338,720Other operating expenses 812,766,631 179,132,758 633,633,873Gold loan auction losses - - 424,360,708 1,456,333,301 424,360,708 1,456,333,301
Notes to the Financial Statements Contd.
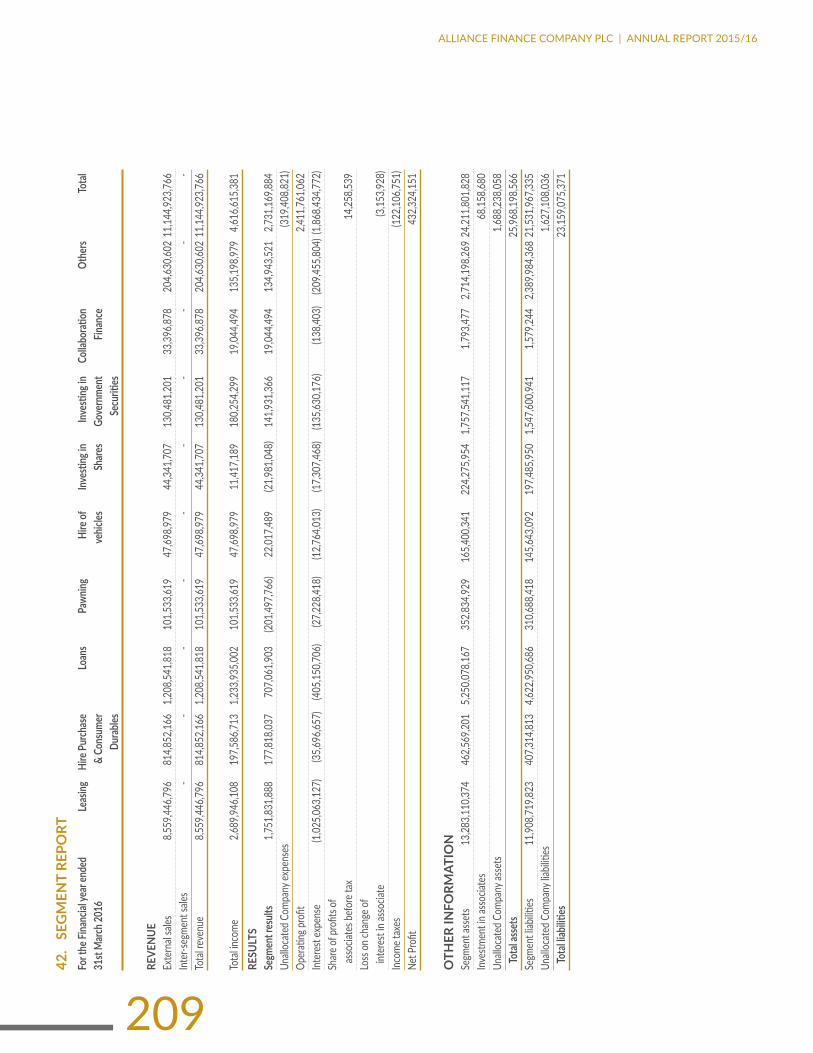
209
ALLIANCE FINANCE COMPANY PLC | ANNUAL REPORT 2015/16
42.
SEG
MEN
T RE
PORT
FortheFinancialyearended
LeasingHirePurchase
Loans
Pawning
Hireof
Investingin
Investingin
Collaboration
Others
Total
31stMarch2016
&Consumer
vehicles
Shares
Government
Finance
Durables
Securities
REVE
NUE
Exte
rnal
sales
8,5
59,44
6,796
81
4,852
,166
1,208
,541,8
18
101,5
33,61
9 47
,698,9
79
44,34
1,707
13
0,481
,201
33,39
6,878
20
4,630
,602
11,14
4,923
,766
Inter
-segm
ent s
ales
- -
- -
- -
- -
- -
Tota
l reve
nue
8,559
,446,7
96
814,8
52,16
6 1,2
08,54
1,818
10
1,533
,619
47,69
8,979
44
,341,7
07
130,4
81,20
1 33
,396,8
78
204,6
30,60
2 11
,144,9
23,76
6
Tota
l inco
me
2,689
,946,1
08
197,5
86,71
3 1,2
33,93
5,002
10
1,533
,619
47,69
8,979
11
,417,1
89
180,2
54,29
9 19
,044,4
94
135,1
98,97
9 4,6
16,61
5,381
RESU
LTS
Segm
ent r
esult
s 1,7
51,83
1,888
17
7,818
,037
707,0
61,90
3 (2
01,49
7,766
) 22
,017,4
89
(21,9
81,04
8)
141,9
31,36
6 19
,044,4
94
134,9
43,52
1 2,7
31,16
9,884
Unall
ocat
ed C
ompa
ny ex
pens
es
(3
19,40
8,821
)Op
erati
ng pr
ofit
2,4
11,76
1,062
Inter
est e
xpen
se
(1,02
5,063
,127)
(3
5,696
,657)
(4
05,15
0,706
) (2
7,228
,418)
(1
2,764
,013)
(1
7,307
,468)
(1
35,63
0,176
) (1
38,40
3)
(209
,455,8
04) (
1,868
,434,7
72)
Share
of pr
ofits
of
ass
ociat
es be
fore
tax
14
,258,5
39Lo
ss on
chan
ge of
i
nter
est i
n ass
ociat
e
(3,15
3,928
)Inc
ome t
axes
(122
,106,7
51)
Net P
rofit
432,3
24,15
1
OTHERINFORMATION
Segm
ent a
sset
s 13
,283,1
10,37
4 46
2,569
,201
5,250
,078,1
67
352,8
34,92
9 16
5,400
,341
224,2
75,95
4 1,7
57,54
1,117
1,7
93,47
7 2,7
14,19
8,269
24,2
11,80
1,828
Inves
tmen
t in a
ssoc
iates
68,15
8,680
Unall
ocat
ed C
ompa
ny as
sets
1,6
88,23
8,058
Totalassets
25,9
68,19
8,566
Segm
ent l
iabiliti
es
11,90
8,719
,823
407,3
14,81
3 4,6
22,95
0,686
31
0,688
,418
145,6
43,09
2 19
7,485
,950
1,547
,600,9
41
1,579
,244
2,389
,984,3
68 2
1,531
,967,3
35Un
alloc
ated
Com
pany
liabil
ities
1,627
,108,0
36 Totalliabilities
2
3,159
,075,3
71

210
ALLIANCE FINANCE COMPANY PLC | ANNUAL REPORT 2015/16
FortheFinancialyearended
LeasingHirePurchase
Loans
Pawning
Hireof
Investingin
Investingin
Collaboration
Others
Total
31stMarch2016
&Consumer
vehicles
Shares
Government
Finance
Durables
Securities
REV
ENU
EEx
tern
al sa
les
7,064
,493,9
27
1,398
,013,1
47
706,5
90,78
3 12
6,890
,596
52,79
1,722
63
1,604
,331
115,9
46,58
0 80
,867,7
98
128,9
58,58
3 10
,306,1
57,46
7Int
er-se
gmen
t sale
s -
- -
- -
- -
- -
-To
tal re
venu
e 7,0
64,49
3,927
1,3
98,01
3,147
70
6,590
,783
126,8
90,59
6 52
,791,7
22
631,6
04,33
1 11
5,946
,580
80,86
7,798
12
8,958
,583
10,30
6,157
,467
Tota
l inco
me
2,436
,263,9
38
381,1
16,29
0 70
7,729
,078
126,8
90,59
6 52
,791,7
21
631,6
04,33
1 13
7,177
,497
7,549
,292
107,2
44,88
2 4,5
88,36
7,625
RESU
LTS
Segm
ent r
esult
s 1,5
70,18
7,441
25
8,727
,376
452,4
09,11
6 (2
01,89
4,677
) 8,3
07,92
5 63
6,185
,719
132,0
63,87
6 7,5
49,29
2 10
5,309
,588
2,968
,845,6
56Un
alloc
ated
Com
pany
expe
nses
(577
,126,1
83)
Oper
ating
profi
t
-
2,391
,719,4
74Int
eres
t exp
ense
(9
80,96
5,717
) (1
09,52
0,979
) (2
95,13
1,631
) (6
8,145
,503)
(2
1,438
,474)
(2
5,536
,410)
(1
56,06
0,289
) (8
89,37
1)
(164
,043,0
90) (
1,821
,731,4
64)
Share
of pr
ofits
of
ass
ociat
es be
fore
tax
15
,835,9
11Inc
ome t
axes
(79,1
55,98
1)Ne
t Pro
fit
50
6,667
,939
OTH
ER IN
FORM
ATIO
NSe
gmen
t ass
ets
10,06
9,293
,475
1,124
,197,1
71
3,029
,430,0
37
699,4
91,39
0 22
0,058
,947
262,1
22,92
7 1,6
01,90
8,018
9,1
29,10
0 1,6
83,84
8,877
18,6
99,47
9,942
Inves
tmen
t in A
ssoc
iates
and
Sub
sidiar
ies
69
,875,3
64Un
alloc
ated
Com
pany
asse
ts
1,235
,417,6
83To
tal a
sset
s
2
0,004
,772,9
88Se
gmen
t liab
ilities
8,8
22,59
7,326
97
2,962
,657
2,621
,890,8
69
605,3
91,13
5 19
0,455
,147
226,8
60,40
0 1,3
86,40
8,649
7,9
00,99
3 1,4
57,32
6,276
16,2
91,79
3,451
Unall
ocat
ed C
ompa
ny lia
biliti
es
1,2
05,94
3,341
Tota
l liab
ilities
1
7,497
,736,7
91
Notes to the Financial Statements Contd.
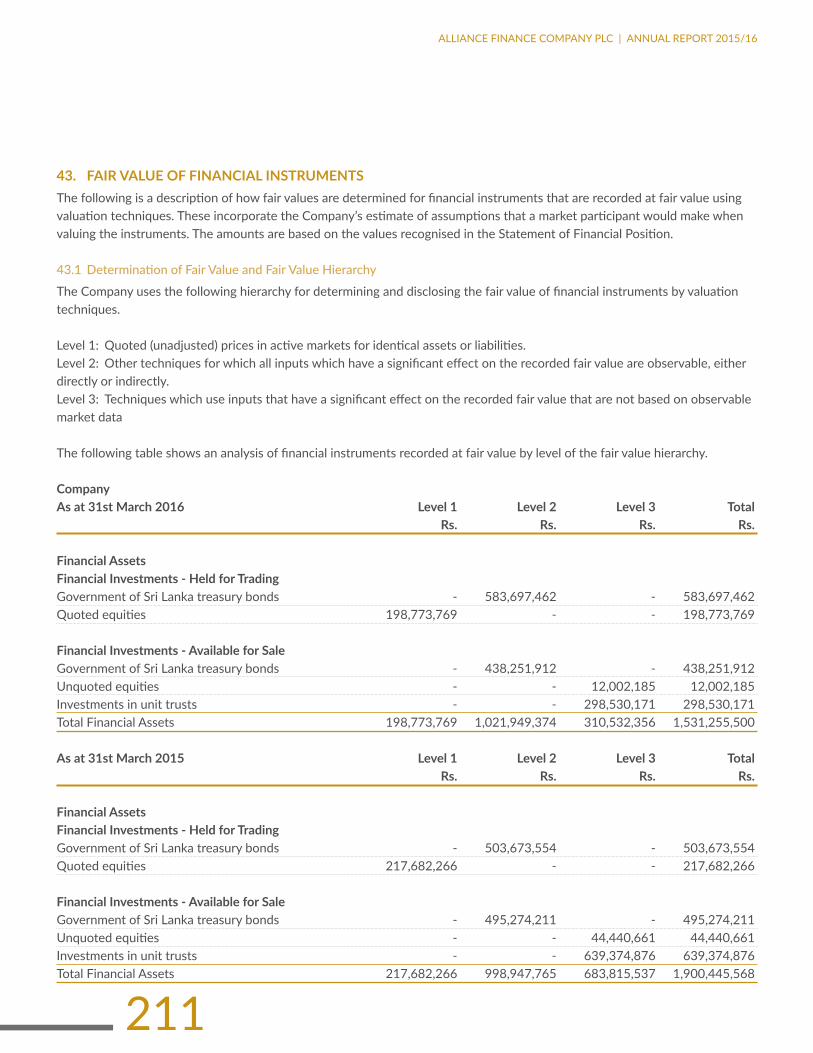
211
ALLIANCE FINANCE COMPANY PLC | ANNUAL REPORT 2015/16
43. FAIR VALUE OF FINANCIAL INSTRUMENTSThe following is a description of how fair values are determined for financial instruments that are recorded at fair value using valuation techniques. These incorporate the Company’s estimate of assumptions that a market participant would make when valuing the instruments. The amounts are based on the values recognised in the Statement of Financial Position.
43.1 Determination of Fair Value and Fair Value Hierarchy
The Company uses the following hierarchy for determining and disclosing the fair value of financial instruments by valuation techniques.
Level 1: Quoted (unadjusted) prices in active markets for identical assets or liabilities.Level 2: Other techniques for which all inputs which have a significant effect on the recorded fair value are observable, either directly or indirectly.Level 3: Techniques which use inputs that have a significant effect on the recorded fair value that are not based on observable market data
The following table shows an analysis of financial instruments recorded at fair value by level of the fair value hierarchy.
CompanyAsat31stMarch2016 Level1 Level2 Level3 Total Rs. Rs. Rs. Rs.
Financial AssetsFinancialInvestments-HeldforTradingGovernment of Sri Lanka treasury bonds - 583,697,462 - 583,697,462Quoted equities 198,773,769 - - 198,773,769
FinancialInvestments-AvailableforSaleGovernment of Sri Lanka treasury bonds - 438,251,912 - 438,251,912Unquoted equities - - 12,002,185 12,002,185Investments in unit trusts - - 298,530,171 298,530,171Total Financial Assets 198,773,769 1,021,949,374 310,532,356 1,531,255,500
Asat31stMarch2015 Level1 Level2 Level3 Total Rs. Rs. Rs. Rs.
Financial AssetsFinancialInvestments-HeldforTradingGovernment of Sri Lanka treasury bonds - 503,673,554 - 503,673,554Quoted equities 217,682,266 - - 217,682,266
FinancialInvestments-AvailableforSaleGovernment of Sri Lanka treasury bonds - 495,274,211 - 495,274,211Unquoted equities - - 44,440,661 44,440,661Investments in unit trusts - - 639,374,876 639,374,876Total Financial Assets 217,682,266 998,947,765 683,815,537 1,900,445,568

212
ALLIANCE FINANCE COMPANY PLC | ANNUAL REPORT 2015/16
GroupAsat31stMarch2016 Level1 Level2 Level3 Total Rs. Rs. Rs. Rs.
Financial AssetsFinancialInvestments-HeldforTradingGovernment of Sri Lanka treasury bills - 583,697,462 - 583,697,462Quoted equities 198,773,769 - - 198,773,769
FinancialInvestments-AvailableforSaleGovernment of Sri Lanka treasury bills - 438,251,912 - 438,251,912Unquoted equities - - 25,502,185 25,502,185Investments in unit trusts - - 376,978,352 376,978,352Total Financial Assets 198,773,769 1,021,949,375 402,480,537 1,623,203,681
Asat31stMarch2015 Level1 Level2 Level3 Total Rs. Rs. Rs. Rs.
Financial AssetsFinancial Investments - Held for TradingGovernment of Sri Lanka treasury bills 503,673,554 - 503,673,554Quoted equities 217,682,266 - - 217,682,266
FinancialInvestments-AvailableforSaleGovernment of Sri Lanka treasury bills - 495,274,211 - 495,274,211Unquoted equities - - 44,440,661 44,440,661Investments in unit trusts - - 711,804,708 711,804,708Total Financial Assets 217,682,266 998,947,765 756,245,369 1,972,875,399
43.2 Determination of Fair Value and Fair Value Hierarchy
Set out below is the comparison, by classes, of the carrying amounts of fair values of the Company’s financial instruments that are not carried at fair value in the Financial Statements. This table does not include the fair values of non- financial assets and non- financial liabilities.
Notes to the Financial Statements Contd.
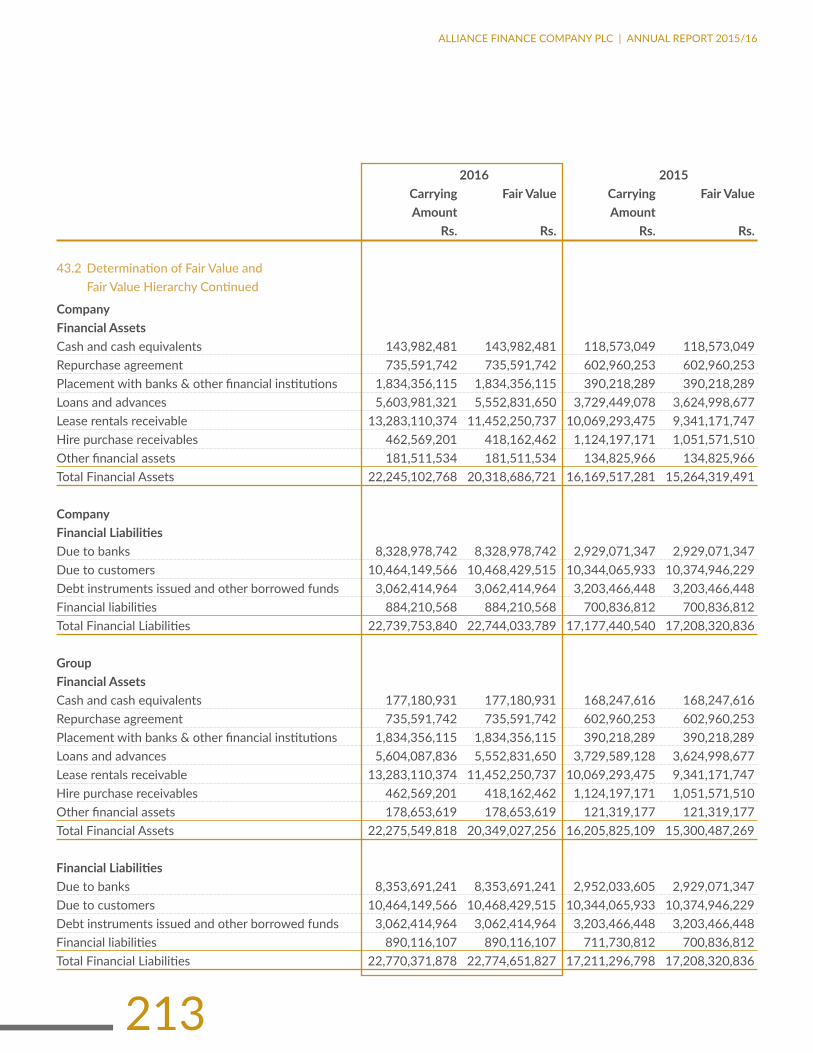
213
ALLIANCE FINANCE COMPANY PLC | ANNUAL REPORT 2015/16
2016 2015 Carrying Fair Value Carrying Fair Value Amount Amount Rs. Rs. Rs. Rs.
43.2 Determination of Fair Value and Fair Value Hierarchy Continued
Company Financial AssetsCash and cash equivalents 143,982,481 143,982,481 118,573,049 118,573,049Repurchase agreement 735,591,742 735,591,742 602,960,253 602,960,253Placement with banks & other financial institutions 1,834,356,115 1,834,356,115 390,218,289 390,218,289Loans and advances 5,603,981,321 5,552,831,650 3,729,449,078 3,624,998,677Lease rentals receivable 13,283,110,374 11,452,250,737 10,069,293,475 9,341,171,747Hire purchase receivables 462,569,201 418,162,462 1,124,197,171 1,051,571,510Other financial assets 181,511,534 181,511,534 134,825,966 134,825,966Total Financial Assets 22,245,102,768 20,318,686,721 16,169,517,281 15,264,319,491
CompanyFinancialLiabilitiesDue to banks 8,328,978,742 8,328,978,742 2,929,071,347 2,929,071,347Due to customers 10,464,149,566 10,468,429,515 10,344,065,933 10,374,946,229Debt instruments issued and other borrowed funds 3,062,414,964 3,062,414,964 3,203,466,448 3,203,466,448Financial liabilities 884,210,568 884,210,568 700,836,812 700,836,812Total Financial Liabilities 22,739,753,840 22,744,033,789 17,177,440,540 17,208,320,836
GroupFinancial AssetsCash and cash equivalents 177,180,931 177,180,931 168,247,616 168,247,616Repurchase agreement 735,591,742 735,591,742 602,960,253 602,960,253Placement with banks & other financial institutions 1,834,356,115 1,834,356,115 390,218,289 390,218,289Loans and advances 5,604,087,836 5,552,831,650 3,729,589,128 3,624,998,677Lease rentals receivable 13,283,110,374 11,452,250,737 10,069,293,475 9,341,171,747Hire purchase receivables 462,569,201 418,162,462 1,124,197,171 1,051,571,510Other financial assets 178,653,619 178,653,619 121,319,177 121,319,177Total Financial Assets 22,275,549,818 20,349,027,256 16,205,825,109 15,300,487,269
FinancialLiabilitiesDue to banks 8,353,691,241 8,353,691,241 2,952,033,605 2,929,071,347Due to customers 10,464,149,566 10,468,429,515 10,344,065,933 10,374,946,229Debt instruments issued and other borrowed funds 3,062,414,964 3,062,414,964 3,203,466,448 3,203,466,448Financial liabilities 890,116,107 890,116,107 711,730,812 700,836,812Total Financial Liabilities 22,770,371,878 22,774,651,827 17,211,296,798 17,208,320,836

214
ALLIANCE FINANCE COMPANY PLC | ANNUAL REPORT 2015/16
FAIR VALUE OF FINANCIAL INSTRUMENTS (Contd.)
FairValueofFinancialAssetsandLiabilitiesnotCarriedatFairValueThe following describes the methodologies and assumptions used to determine the fair values for those financial instruments which are not already recorded at fair value in the Financial Statements.
AssetsforwhichFairValueApproximatesCarryingValue“For financial assets and financial liabilities that have a short term maturity (original maturities less than a year), it is assumed that the carrying amounts approximate their fair values. This assumption is also applied to fixed deposits, certificate of deposits and savings deposits without a specific maturity.Long term deposits accepted from customers for which periodical interest is paid and loans and advances granted to customers with a variable rate are also considered to be carried at fair value in the books.“
Fixed Rate Financial Instruments“Carrying amounts are considered as fair values for short term credit facilities. Loans and Advances with fixed interest rates were fair valued using market rates at which fresh loans were granted during the fourth quarter of the reporting year. Conversely, fixed deposits with original tenors above one year and interest paid at maturity were discounted using current market rates offered to customers during the fourth quarter of the reporting year. For quoted debt issued the fair value are determined based on quoted market prices“
44. COMMITMENTS AND CONTINGENCIESIn the normal course of the business, the Company makes various commitments and incurs certain contingent liabilities. No material losses are anticipated as a result of these transactions.
There were no capital commitments or contingent liabilities as at the end of the reporting date which requires separate disclosure to these Financial Statements.
44.1 Litigations Against the Company
Litigation is a common occurrence in the Finance Industry due to the nature of the business undertaken. The Company has formal controls and policies for managing legal claims. No material losses are anticipated as a result of there transactions
45. EVENTSAFTERTHEREPORTINGPERIODSubsequent to the reporting date, no circumstances have arisen which would required adjustment to or disclosure in the Financial Statements.
Notes to the Financial Statements Contd.
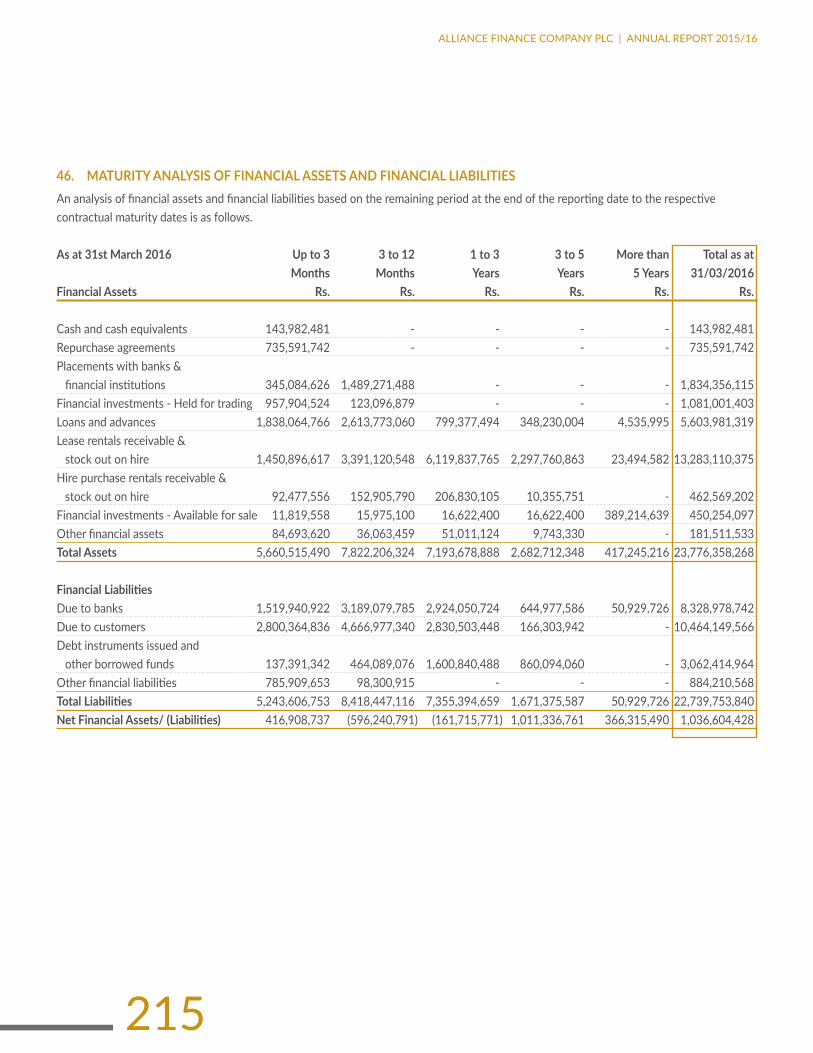
215
ALLIANCE FINANCE COMPANY PLC | ANNUAL REPORT 2015/16
46. MATURITY ANALYSIS OF FINANCIAL ASSETS AND FINANCIAL LIABILITIESAn analysis of financial assets and financial liabilities based on the remaining period at the end of the reporting date to the respective contractual maturity dates is as follows.
Asat31stMarch2016 Upto3 3to12 1to3 3to5 Morethan Totalasat Months Months Years Years 5Years 31/03/2016 Financial Assets Rs. Rs. Rs. Rs. Rs. Rs.
Cash and cash equivalents 143,982,481 - - - - 143,982,481Repurchase agreements 735,591,742 - - - - 735,591,742Placements with banks & financial institutions 345,084,626 1,489,271,488 - - - 1,834,356,115Financial investments - Held for trading 957,904,524 123,096,879 - - - 1,081,001,403Loans and advances 1,838,064,766 2,613,773,060 799,377,494 348,230,004 4,535,995 5,603,981,319Lease rentals receivable & stock out on hire 1,450,896,617 3,391,120,548 6,119,837,765 2,297,760,863 23,494,582 13,283,110,375Hire purchase rentals receivable & stock out on hire 92,477,556 152,905,790 206,830,105 10,355,751 - 462,569,202Financial investments - Available for sale 11,819,558 15,975,100 16,622,400 16,622,400 389,214,639 450,254,097Other financial assets 84,693,620 36,063,459 51,011,124 9,743,330 - 181,511,533Total Assets 5,660,515,490 7,822,206,324 7,193,678,888 2,682,712,348 417,245,216 23,776,358,268
FinancialLiabilitiesDue to banks 1,519,940,922 3,189,079,785 2,924,050,724 644,977,586 50,929,726 8,328,978,742Due to customers 2,800,364,836 4,666,977,340 2,830,503,448 166,303,942 - 10,464,149,566Debt instruments issued and other borrowed funds 137,391,342 464,089,076 1,600,840,488 860,094,060 - 3,062,414,964Other financial liabilities 785,909,653 98,300,915 - - - 884,210,568TotalLiabilities 5,243,606,753 8,418,447,116 7,355,394,659 1,671,375,587 50,929,726 22,739,753,840NetFinancialAssets/(Liabilities) 416,908,737 (596,240,791) (161,715,771) 1,011,336,761 366,315,490 1,036,604,428
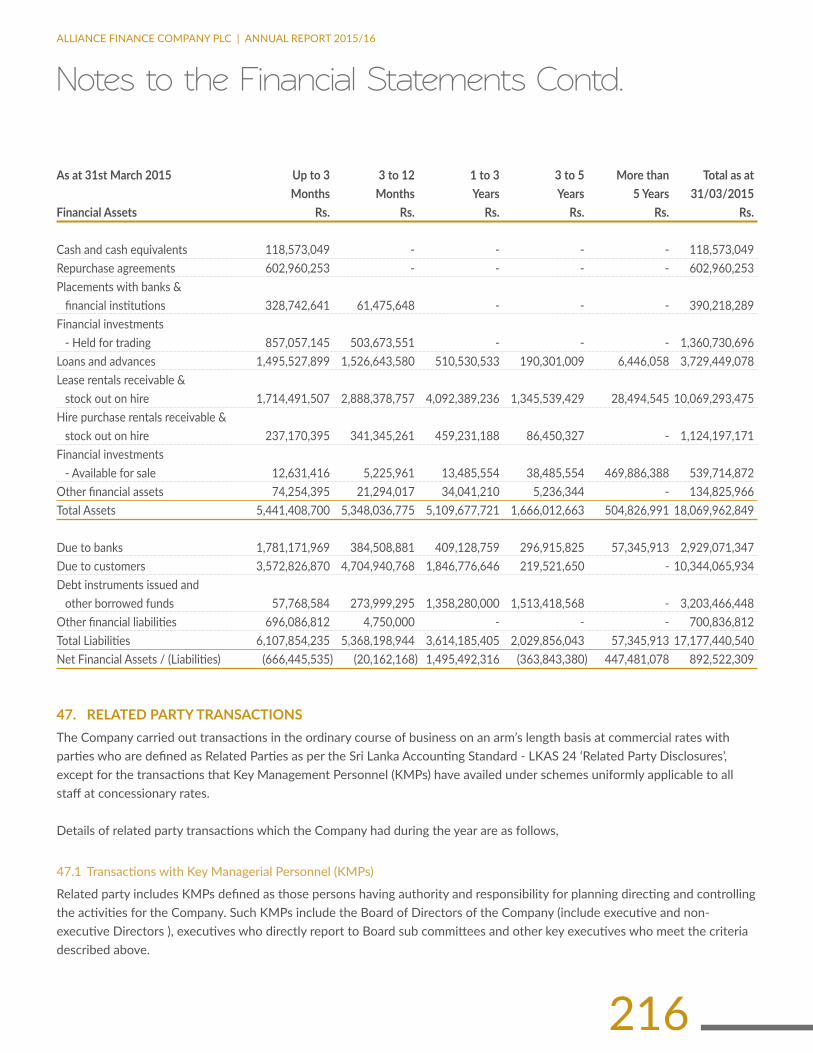
216
ALLIANCE FINANCE COMPANY PLC | ANNUAL REPORT 2015/16
Asat31stMarch2015 Upto3 3to12 1to3 3to5 Morethan Totalasat Months Months Years Years 5Years 31/03/2015 Financial Assets Rs. Rs. Rs. Rs. Rs. Rs.
Cash and cash equivalents 118,573,049 - - - - 118,573,049Repurchase agreements 602,960,253 - - - - 602,960,253Placements with banks & financial institutions 328,742,641 61,475,648 - - - 390,218,289Financial investments - Held for trading 857,057,145 503,673,551 - - - 1,360,730,696Loans and advances 1,495,527,899 1,526,643,580 510,530,533 190,301,009 6,446,058 3,729,449,078Lease rentals receivable & stock out on hire 1,714,491,507 2,888,378,757 4,092,389,236 1,345,539,429 28,494,545 10,069,293,475Hire purchase rentals receivable & stock out on hire 237,170,395 341,345,261 459,231,188 86,450,327 - 1,124,197,171Financial investments - Available for sale 12,631,416 5,225,961 13,485,554 38,485,554 469,886,388 539,714,872Other financial assets 74,254,395 21,294,017 34,041,210 5,236,344 - 134,825,966Total Assets 5,441,408,700 5,348,036,775 5,109,677,721 1,666,012,663 504,826,991 18,069,962,849
Due to banks 1,781,171,969 384,508,881 409,128,759 296,915,825 57,345,913 2,929,071,347Due to customers 3,572,826,870 4,704,940,768 1,846,776,646 219,521,650 - 10,344,065,934Debt instruments issued and other borrowed funds 57,768,584 273,999,295 1,358,280,000 1,513,418,568 - 3,203,466,448Other financial liabilities 696,086,812 4,750,000 - - - 700,836,812Total Liabilities 6,107,854,235 5,368,198,944 3,614,185,405 2,029,856,043 57,345,913 17,177,440,540Net Financial Assets / (Liabilities) (666,445,535) (20,162,168) 1,495,492,316 (363,843,380) 447,481,078 892,522,309
47. RELATED PARTY TRANSACTIONSThe Company carried out transactions in the ordinary course of business on an arm’s length basis at commercial rates with parties who are defined as Related Parties as per the Sri Lanka Accounting Standard - LKAS 24 ‘Related Party Disclosures’, except for the transactions that Key Management Personnel (KMPs) have availed under schemes uniformly applicable to all staff at concessionary rates.
Details of related party transactions which the Company had during the year are as follows,
47.1 Transactions with Key Managerial Personnel (KMPs)
Related party includes KMPs defined as those persons having authority and responsibility for planning directing and controlling the activities for the Company. Such KMPs include the Board of Directors of the Company (include executive and non-executive Directors ), executives who directly report to Board sub committees and other key executives who meet the criteria described above.
Notes to the Financial Statements Contd.

217
ALLIANCE FINANCE COMPANY PLC | ANNUAL REPORT 2015/16
2016 2015 Rs. Rs.
47.1.1 Key Management Personnel CompensationKMP’s EmolumentsShort Term 84,371,090 79,377,030Long Term 13,112,120 15,894,378 97,483,210 95,271,408
Directors EmolumentsShort Term 26,435,032 24,450,140Long Term & Post employment benefits 25,950,390 6,123,000 52,385,422 30,573,140
47.1.2 Transactions, Arrangements and Agreements Involving KMPs, and their Close Family Members (CFMs)CFMs of a KMPs are those family members who may be expected to influence, or be influenced by, that KMP in their dealing with the entity. They may include KMPs domestic partner and children, children of the KMPs domestic partner and dependants of the KMP or the KMPs domestic partner.
Deposits and investments from key managerial personnel and their close family members are detailed below.
CompanyandGroup 2016 2015 Rs. Rs.
Fixed DepositsFixed Deposits Accepted during the year 16,599,946 2,933,137Fixed Deposits held at the end of the year 27,374,579 16,707,633Interest payable on Fixed Deposits 852,778 625,814Interest paid on Fixed Deposits 1,271,058 1,427,565
DebtInstrumentsIssuedandotherborrowedfundsDebentures 3,520,000 7,200,000

218
ALLIANCE FINANCE COMPANY PLC | ANNUAL REPORT 2015/16
47.1.3 Transaction, arrangements and agreements involving with Entities which are controlled, and /or jointly controlled by the KMP’s and their CFMs or shareholders
Company 2016 2015 NatureofTransaction NatureofTransaction/Facility Rs. Rs.
M/S. Alfinco Insurance Brokers (Pvt) Ltd. Fixed Deposits - 12,000,000 Commissions /reimbursements 35,694,720 35,598,484
M/S. Alliance Management Services (Private) Limited Fixed Deposits 2,917,916 2,261,470 Management fees 608,000 539,000
M/S. Alliance Travel Services Ltd Fixed Deposits 5,835,135 5,469,370
M/S Xesol (Pvt) Ltd Fixed Deposits - 12,226,970 Liquidation fees 6,249,763 -
M/S. Macbertan (Private) Limited Lease rentals receivable & Stock out on hire 865,397 2,430,806 Loan rentals receivable 1,223,478 1,896,874
M/S. Alliance Tech Trading (PVT) Ltd. Fixed Deposits 9,008,082 7,516,622
Virtusa Pvt. Ltd Software development fees 4,146,980 -Alliance Ventures Pvt Ltd Fixed Deposits 1,160,815 -
46.1.4 Parent and Ultimate Controlling PartyThe Company does not have an identifiable parent of its own.
48. RISK MANAGEMENT48.1 Introduction
Constantly assessing and being cognizant of the concept of risk is fundamental to the managerial philosophy of Alliance Finance Company PLC.
Consequent to the global, economic and financial crises, companies are placing greater emphasis on risk management by adopting comprehensive risk management framework to increasingly safeguard stakeholder interest . Due to diversified and geographic spread of the portfolio of businesses, Alliance Finance maintains a holistic risk management system that continuously monitors primary risk factors. Risk mitigation actions are also built in to the day - to day operations of the Company. The Company’s business divisions are closely monitored through a comprehensive computerized information system and employees, ranging from managerial credit and other officers, have been apprised and trained to adopt risk management practices as an integral part of their decision making.
Notes to the Financial Statements Contd.
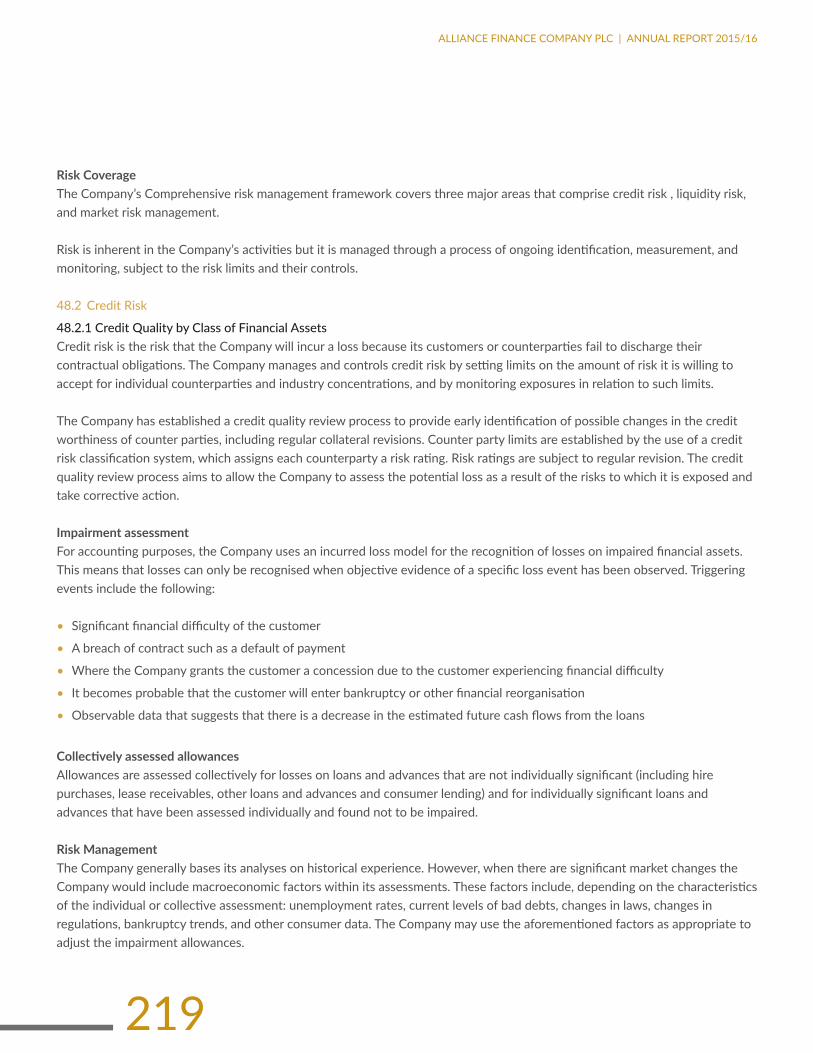
219
ALLIANCE FINANCE COMPANY PLC | ANNUAL REPORT 2015/16
Risk CoverageThe Company’s Comprehensive risk management framework covers three major areas that comprise credit risk , liquidity risk, and market risk management.
Risk is inherent in the Company’s activities but it is managed through a process of ongoing identification, measurement, and monitoring, subject to the risk limits and their controls.
48.2 Credit Risk
48.2.1 Credit Quality by Class of Financial assetsCredit risk is the risk that the Company will incur a loss because its customers or counterparties fail to discharge their contractual obligations. The Company manages and controls credit risk by setting limits on the amount of risk it is willing to accept for individual counterparties and industry concentrations, and by monitoring exposures in relation to such limits.
The Company has established a credit quality review process to provide early identification of possible changes in the credit worthiness of counter parties, including regular collateral revisions. Counter party limits are established by the use of a credit risk classification system, which assigns each counterparty a risk rating. Risk ratings are subject to regular revision. The credit quality review process aims to allow the Company to assess the potential loss as a result of the risks to which it is exposed and take corrective action.
Impairment assessmentFor accounting purposes, the Company uses an incurred loss model for the recognition of losses on impaired financial assets. This means that losses can only be recognised when objective evidence of a specific loss event has been observed. Triggering events include the following:
• Significant financial difficulty of the customer
• A breach of contract such as a default of payment
• Where the Company grants the customer a concession due to the customer experiencing financial difficulty
• It becomes probable that the customer will enter bankruptcy or other financial reorganisation
• Observable data that suggests that there is a decrease in the estimated future cash flows from the loans
CollectivelyassessedallowancesAllowances are assessed collectively for losses on loans and advances that are not individually significant (including hire purchases, lease receivables, other loans and advances and consumer lending) and for individually significant loans and advances that have been assessed individually and found not to be impaired.
Risk ManagementThe Company generally bases its analyses on historical experience. However, when there are significant market changes the Company would include macroeconomic factors within its assessments. These factors include, depending on the characteristics of the individual or collective assessment: unemployment rates, current levels of bad debts, changes in laws, changes in regulations, bankruptcy trends, and other consumer data. The Company may use the aforementioned factors as appropriate to adjust the impairment allowances.

220
ALLIANCE FINANCE COMPANY PLC | ANNUAL REPORT 2015/16
Allowances are evaluated separately at each reporting date with each portfolio. The collective assessment is made for groups of assets with similar risk characteristics, in order to determine whether provision should be made due to incurred loss events for which there is objective evidence, but the effects of which are not yet evident in the individual loans assessments. The collective assessment takes account of data from the loan portfolio (such as historical losses on the portfolio, levels of arrears, credit utilisation, loan to collateral ratios and expected receipts and recoveries once impaired) or economic data (such as current economic conditions, unemployment levels and local or industry–specific problems). The approximate delay between the time a loss is likely to have been incurred and the time it will be identified as requiring an individually assessed impairment allowance is also taken into consideration. Company’s management is responsible for deciding the length of this period, which can extend for as long as one year. The impairment allowance is then reviewed by credit management to ensure alignment with the Company’s overall policy.
CompanyAsat31stMarch2016 Notes Neither Past Total Past Due Due But Nor Impaired Not Impaired Rs. Rs. Rs.
Financial AssetsCash and cash equivalents 17 143,982,481 - 143,982,481Repurchase agreements 735,591,742 - 735,591,742Placements with banks & financial institutions 1,834,356,115 - 1,834,356,115Financial investments - Held for trading 20 1,081,001,402 - 1,081,001,402Loans and advances 21 4,590,510,686 1,013,470,637 5,603,981,323Lease rentals receivable & stock out on hire 22 7,134,074,132 6,149,036,242 13,283,110,374Hire purchase rentals receivable & stock out on hire 23 166,186,750 296,382,451 462,569,201Financial investments - Available for sale 24 450,254,097 - 450,254,097Other financial assets 26 181,511,534 - 181,511,534Total Financial Assets 16,317,468,939 7,458,889,330 23,776,358,269
48.2.1.1 Aging Analysis of past due (i.e. facilities in arrears of 1 day and above ) but not impaired loans by class of financial assets.
Past Due But Not Impaired Lessthan 31to 61to Morethan Total 30days 60days 90days 91days Rs. Rs. Rs. Rs. Rs.
Loans and Advances 623,100,616 186,977,101 48,012,596 155,380,324 1,013,470,637Lease rentals receivable & Stock out on hire 3,366,449,306 1,808,280,026 358,773,543 615,533,367 6,149,036,242Hire purchase rentals receivable & Stock out on hire 136,384,548 65,717,272 19,594,595 74,686,036 296,382,451 4,125,934,470 2,060,974,399 426,380,734 845,599,727 7,458,889,330
Notes to the Financial Statements Contd.

221
ALLIANCE FINANCE COMPANY PLC | ANNUAL REPORT 2015/16
GroupAsat31stMarch2016 Notes Neither Past Total Past Due Due But Nor Impaired Not Impaired Rs. Rs. Rs.
AssetsCash and cash equivalents 17 177,180,931 - 177,180,931Repurchase agreements 735,591,742 - 735,591,742Placements with banks & financial institutions 1,834,356,115 - 1,834,356,115Financial investments - Held for trading 18 1,159,449,583 - 1,159,449,583Loans and advances 19 4,590,510,686 1,013,577,152 5,604,087,838Lease rentals receivable & stock out on hire 20 7,134,074,132 6,149,036,241 13,283,110,373Hire purchase rentals receivable & stock out on hire 21 166,186,750 296,382,450 462,569,200Financial investments - Available for sale 22 463,754,097 - 463,754,097Other financial assets 24 178,653,619 - 178,653,619Total Financial Assets 16,439,757,655 7,458,995,842 23,899,632,497
48.2.1.2 Aging Analysis of past due (i.e. facilities in arrears of 1 day and above ) but not impaired loans by class of financial assets
Past Due But Not Impaired Lessthan 31to 61to Morethan Total 30days 60days 90days 91days Rs. Rs. Rs. Rs. Rs.
Loans and Advances 623,100,616 187,962,612 48,012,596 155,380,324 1,014,456,148Lease rentals receivable & Stock out on hire 3,366,449,306 1,808,280,026 358,773,543 615,533,367 6,149,036,242Hire purchase rentals receivable & Stock out on hire 136,384,548 65,717,272 19,594,595 74,686,036 296,382,451 4,125,934,470 2,061,959,910 426,380,734 845,599,727 7,459,874,841

222
ALLIANCE FINANCE COMPANY PLC | ANNUAL REPORT 2015/16
Creditrisk-CreditQualitybyclassofFinancialAssetsCompanyAsat31stMarch2016 Notes Neither Past Total Past Due Due But Nor Impaired Not Impaired Rs. Rs. Rs.
Financial AssetsCash and cash equivalents 17 118,573,049 - 118,573,049Repurchase agreements 602,960,253 - 602,960,253Placements with banks & financial institutions 390,218,289 - 390,218,289Financial investments - Held for trading 18 1,360,730,696 - 1,360,730,696Loans and advances 19 2,724,259,198 1,005,189,880 3,729,449,078Lease rentals receivable & stock out on hire 20 4,797,182,060 5,272,111,415 10,069,293,475Hire purchase rentals receivable & stock out on hire 21 366,076,036 758,121,135 1,124,197,171Financial investments - Available for sale 22 539,714,872 - 539,714,872Other financial assets 24 134,825,966 - 134,825,966Total Financial Assets 11,034,540,419 7,035,422,430 18,069,962,849
48.2.1.3 Aging Analysis of past due(i.e. facilities in arrears of 1 day and above ) but not impaired loans by class of financial assets
Past Due But Not Impaired Lessthan 31to 61to Morethan Total 30days 60days 90days 91days Rs. Rs. Rs. Rs. Rs.
Loans and Advances 755,349,119 74,185,888 39,107,766 136,547,108 1,005,189,880Lease rentals receivable & Stock out on hire 2,220,118,949 1,138,055,578 606,437,534 1,307,499,355 5,272,111,415Hire purchase rentals receivable & Stock out on hire 256,885,813 169,487,696 99,147,947 232,599,677 758,121,135 3,232,353,881 1,381,729,162 744,693,247 1,676,646,140 7,035,422,430
Notes to the Financial Statements Contd.

223
ALLIANCE FINANCE COMPANY PLC | ANNUAL REPORT 2015/16
GroupAsat31stMarch2015 Notes Neither Past Total Past Due Due But Nor Impaired Not Impaired Rs. Rs. Rs.
Financial AssetsCash and cash equivalents 17 168,247,616 - 168,247,616Repurchase agreements 602,960,253 - 602,960,253Placements with banks & financial institutions 390,218,289 - 390,218,289Financial investments - Held for trading 18 1,433,160,528 - 1,433,160,528Loans and advances 19 2,724,399,248 1,005,189,880 3,729,589,128Lease rentals receivable & stock out on hire 20 4,797,182,060 5,272,111,415 10,069,293,475Hire purchase rentals receivable & stock out on hire 21 366,076,036 758,121,135 1,124,197,171Financial investments - Available for sale 22 539,714,872 - 539,714,872Other financial assets 24 121,319,177 - 121,319,177Total Financial Assets 11,143,278,079 7,035,422,430 18,178,700,509
48.2.1.4 Aging Analysis of past due(i.e. facilities in arrears of 1 day and above ) but not impaired loans by class of financial assets
Past Due But Not Impaired Lessthan 31to 61to Morethan Total 30days 60days 90days 91days Rs. Rs. Rs. Rs. Rs.
Loans and Advances 755,349,119 74,185,888 39,107,766 136,547,108 1,005,189,880Lease rentals receivable & Stock out on hire 2,220,118,949 1,138,055,578 606,437,534 1,307,499,354 5,272,111,415Hire purchase rentals receivable & Stock out on hire 256,885,813 169,487,696 99,147,947 232,599,677 758,121,135 3,232,353,881 1,381,729,162 744,693,247 1,676,646,140 7,035,422,430

224
ALLIANCE FINANCE COMPANY PLC | ANNUAL REPORT 2015/16
48.2.2 Analysis of Risk Concentration48.2.2 industry analysisThe following table shows the risk concentration by industry for the components of the Statement of Financial Position.
sector wise Breakdown
Cash and Bank Balances
Financial investments -
Held for Tradingloans and advances
Financial investments -
available for sale
Other financial assets
Total Financial assets
Agriculture & Fishing - - 2,835,166,862 - - 2,835,166,862Construction - - 341,498,483 - - 341,498,483Food, Beverages & Tobacco
- - 2,792,910,944 - - 2,792,910,944
Financial Services 177,180,931 - 202,489,052 - 1,834,356,115 2,214,026,098Industry - - 62,703,030 - - 62,703,030Tourism - - 78,061,124 - - 78,061,124Government - 583,697,462 962,815,655 438,251,912 735,591,742 2,720,356,771Transport - - 4,446,160,219 - - 4,446,160,219Services - - 3,815,906,830 - 178,653,619 3,994,560,449Consumption - - 439,153,188 - - 439,153,188Other - 575,752,121 3,372,902,025 25,502,185 - 3,974,156,331Total 177,180,931 1,159,449,583 19,349,767,411 463,754,097 2,748,601,476 23,898,753,498
48.2.3 Risk limit control and mitigation policiesThe Company manages, limits and controls concentrations of credit risk wherever they are identified − in particular, to individual counterparties and groups, and to industries and countries.
The Company structures the levels of credit risk it undertakes by placing limits on the amount of risk accepted in relation to one borrower, or groups of borrowers, and to geographical and industry segments. Such risks are monitored on a revolving basis and subject to an annual or more frequent review, when considered necessary. Limits on the level of credit risk by product and industry sector are approved monthly by the Risk Commity.
Lending limits are reviewed in the light of changing market and economic conditions and periodic credit reviews and assessments of probability of default.
Notes to the Financial Statements Contd.

225
ALLIANCE FINANCE COMPANY PLC | ANNUAL REPORT 2015/16
Some other specific control and mitigation measures are outlined below:
CollateralThe Company employs a range of policies and practices to mitigate credit risk. The most traditional of these is the taking of security for funds advances, which is common practice. The Company implements guidelines on the acceptability of specific classes of collateral or credit risk mitigation. The principal collateral types for loans and advances are:
• Mortgages over residential properties.
• Charges over business assets such as premises, inventory and accounts receivable.
• Charges over financial instruments such as debt securities and equities.
Longer-term finance and lending to corporate entities are generally secured; revolving individual credit facilities are generally unsecured. In addition, in order to minimise the credit loss the Company will seek additional collateral from the counterparty as soon as impairment indicators are identified for the relevant individual loans and advances.
Collateral held as security for financial assets other than loans and advances depends on the nature of the instrument. Debt securities, treasury and other eligible bills are generally unsecured, with the exception of asset-backed securities and similar instruments, which are secured by portfolios of financial instruments.
48.3 Liquidity Risk & Funding Management
“Liquidity risk refers to the availability of sufficient cash balances to meet new lending targets as well as provide a flow of net liquid assets to meet contractual borrowings and other commitments. Liquidity risk is financial risk due to uncertain liquidity. An institution might lose liquidity if its credit rating falls, it experiences sudden unexpected cash outflows, or some other event causes counterparties to avoid trading with or lending to the institution. A firm is also exposed to liquidity risk if markets on which it depends are subject to loss of liquidity.
The Company maintains a portfolio of highly marketable and diverse assets that are assumed to be easily liquidated in the event of an unforeseen interruption of cash flow. The Company also has committed lines of credit that it can access to meet liquidity needs. In addition, the Company maintains the liquidity ratio prescribed by Central Bank of Sri Lanka.“
Liquidity risk management processThe Company’s liquidity management process, as carried out within the Company and monitored by a separate team in Company Treasury, includes:
Day-to-day funding, managed by monitoring future cash flows to ensure that requirements can be met. This includes replenishment of funds as they mature or are borrowed by customers.
Maintaining a portfolio of highly marketable assets that can easily be liquidated as protection against any unforeseen interruption to cash flow;
Monitoring the liquidity ratios of the Statement of Financial Position against internal and regulatory requirements; and
Managing the concentration and profile of debt maturities.
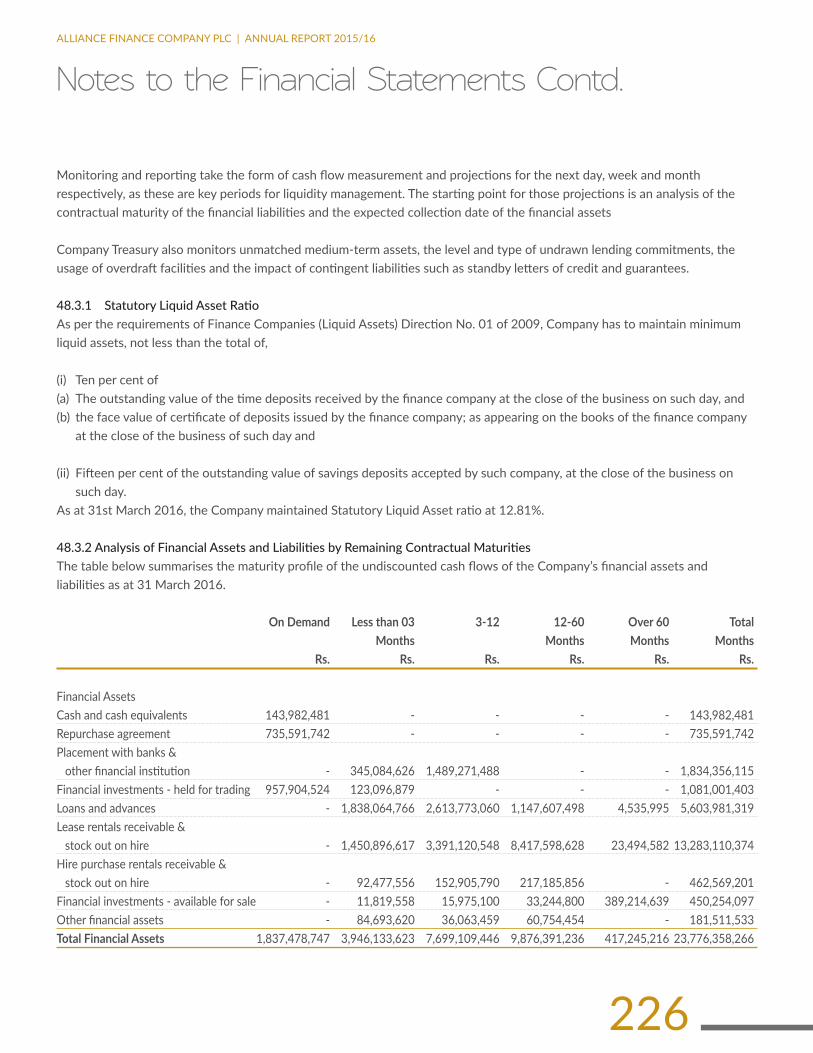
226
ALLIANCE FINANCE COMPANY PLC | ANNUAL REPORT 2015/16
Monitoring and reporting take the form of cash flow measurement and projections for the next day, week and month respectively, as these are key periods for liquidity management. The starting point for those projections is an analysis of the contractual maturity of the financial liabilities and the expected collection date of the financial assets
Company Treasury also monitors unmatched medium-term assets, the level and type of undrawn lending commitments, the usage of overdraft facilities and the impact of contingent liabilities such as standby letters of credit and guarantees.
48.3.1 Statutory Liquid Asset RatioAs per the requirements of Finance Companies (Liquid Assets) Direction No. 01 of 2009, Company has to maintain minimum liquid assets, not less than the total of,
(i) Ten per cent of(a) The outstanding value of the time deposits received by the finance company at the close of the business on such day, and(b) the face value of certificate of deposits issued by the finance company; as appearing on the books of the finance company
at the close of the business of such day and
(ii) Fifteen per cent of the outstanding value of savings deposits accepted by such company, at the close of the business on such day.
As at 31st March 2016, the Company maintained Statutory Liquid Asset ratio at 12.81%.
48.3.2 Analysis of Financial Assets and Liabilities by Remaining Contractual MaturitiesThe table below summarises the maturity profile of the undiscounted cash flows of the Company’s financial assets and liabilities as at 31 March 2016.
OnDemand Lessthan03 3-12 12-60 Over60 Total Months Months Months Months Rs. Rs. Rs. Rs. Rs. Rs.
Financial AssetsCash and cash equivalents 143,982,481 - - - - 143,982,481Repurchase agreement 735,591,742 - - - - 735,591,742Placement with banks & other financial institution - 345,084,626 1,489,271,488 - - 1,834,356,115Financial investments - held for trading 957,904,524 123,096,879 - - - 1,081,001,403Loans and advances - 1,838,064,766 2,613,773,060 1,147,607,498 4,535,995 5,603,981,319Lease rentals receivable & stock out on hire - 1,450,896,617 3,391,120,548 8,417,598,628 23,494,582 13,283,110,374Hire purchase rentals receivable & stock out on hire - 92,477,556 152,905,790 217,185,856 - 462,569,201Financial investments - available for sale - 11,819,558 15,975,100 33,244,800 389,214,639 450,254,097Other financial assets - 84,693,620 36,063,459 60,754,454 - 181,511,533Total Financial Assets 1,837,478,747 3,946,133,623 7,699,109,446 9,876,391,236 417,245,216 23,776,358,266
Notes to the Financial Statements Contd.

227
ALLIANCE FINANCE COMPANY PLC | ANNUAL REPORT 2015/16
OnDemand Lessthan03 3-12 12-60 Over60 Total Months Months Months Months Rs. Rs. Rs. Rs. Rs. Rs.
48.3.2 analysis of Financial assets and Liabilities by Remaining Contractual Maturities (Continued)
FinancialLiabilitiesDue to banks 246,374,222 1,273,566,700 3,189,079,785 3,569,028,309 50,929,726 8,328,978,742Due to customers 677,669,474 2,122,695,362 4,666,977,340 2,996,807,389 - 10,464,149,566Debt instruments issued and other borrowed funds - 137,391,342 464,089,076 2,460,934,547 - 3,062,414,964Other financial liabilities 618,731,643 167,178,010 98,300,915 - - 884,210,568Total Financial Liabilities 1,542,775,339 3,700,831,413 8,418,447,116 9,026,770,246 50,929,726 22,739,753,840
Total Net Financial Assets/(Liabilities) 294,703,408 245,302,210 (719,337,670) 849,620,990 366,315,490 1,036,604,426
AssetsheldformanagingliquidityriskThe Company holds a diversified portfolio of cash and high-quality highly-liquid securities to support payment obligations and contingent funding in a stressed market environment. The Company’s assets held for managing liquidity risk comprise:
• Cash and balances with central banks;
• Certificates of deposit;
• Government bonds and other securities that are readily acceptable in repurchase agreements with central banks; and
• Secondary sources of liquidity in the form of highly liquid instruments in the Company’s trading portfolios.
48.4 Market Risk
Market risk is the risk that the fair value or future cash flows of financial instruments will fluctuate due to changes in market variables such as interest rates, foreign exchange rates, commodity prices and equity prices. The Company classifies exposures to market risk into either trading or non–trading portfolios and manages each of those portfolios separately.
48.4.1 Interest Rate RiskInterest rate risk arises from the possibility that changes in interest rates will affect future cash flows or the fair values of financial instruments. The Board has established limits on the non–trading interest rate gaps for stipulated periods. The Company’s policy is to monitor positions on a daily basis and hedging strategies are used to ensure positions are maintained within the established limits.
48.4.2 Interest Rate SensitivityThe following table demonstrates the sensitivity to a reasonably possible change in interest rates, with all other variables held constant, of the Company’s Income Statement & Equity.

228
ALLIANCE FINANCE COMPANY PLC | ANNUAL REPORT 2015/16
Currency of Borrowings/ advance
Increase (Decrease) in basis points
2016
rs. Sensitivity of Profit or Loss
2016
rs. Sensitivity of Equity
2016
Long term loans linked to AWPLR
+100/ (-100) (21,156,993)/21,156,993 (21,156,993)/21,156,993
48.4.3 Interest Rate Risk Exposure on Non Trading Financial Assets & LiabilitiesThe table below analyses the Company’s interest rate risk exposure on financial assets & liabilities. The Company’s assets & liabilities are included at carrying amount and categorized by the earlier of contractual repricing or maturity dates.
Upto03 03-12 01-05 Over05 Noninterest Totalasat Months Months Years Years bearing 31/03/2016 Rs. Rs. Rs. Rs. Rs. Rs.
AssetsCash and Cash Equivalents - - - - 143,982,481 143,982,481Loans and Advances 1,838,064,766 2,613,773,060 1,147,607,498 4,535,995 - 5,603,981,319Lease rentals receivable & Stock out on hire 1,450,896,617 3,391,120,547 8,417,598,628 23,494,582 - 13,283,110,374Hire purchase rentals receivable & Stock out on hire 92,477,556 152,905,790 217,185,856 - - 462,569,201Financial Investments - Available for Sale - - - - 450,254,097 450,254,097Other financial assets - - - - 181,511,533 181,511,533Total Financial Assets 3,381,438,939 6,157,799,398 9,782,391,982 28,030,577 775,748,111 20,125,409,006
FinancialLiabilitiesDue to Banks 1,519,940,922 3,189,079,785 3,569,028,309 50,929,726 - 8,328,978,742Due to Customers 2,800,364,836 4,666,977,340 2,996,807,389 - - 10,464,149,566Debt Instruments Issued and Other borrowed funds 137,391,342 464,089,076 2,460,934,547 - - 3,062,414,964Other Financial Liabilities - - - - 884,210,568 884,210,568Total Financial Liabilities 4,457,697,100 8,320,146,201 9,026,770,245 50,929,726 884,210,568 22,739,753,840Interest Sensitivity Gap (1,076,258,161) (2,162,346,803) 755,621,737 (22,899,149) (108,462,456) (2,614,344,834)
48.5 Operational Risk
An operational risk is the risk arising from execution of a company’s business functions. The concept of operational risk is broad and focuses on the risks arising from the people, systems and processes through which a company operates. It also includes other categories such as fraud risks, regulatory and compliance risks, reputation and physical or environmental risks.
Notes to the Financial Statements Contd.

229
ALLIANCE FINANCE COMPANY PLC | ANNUAL REPORT 2015/16
49. CAPITALThe Company maintains an activity managed capital basis to cover risks inherent in the business and meet the capital adequacy requirements of Central Bank of Sri Lanka . The adequacy of the Company’s capital is monitored based on the measures, rules and ratios adopted by Central Bank of Sri Lanka.
Capital ManagementThe primary objective of Company’s capital management policy are to ensure that the Company complies with externally imposed capital requirements and healthy capital ratios in order to support its business and to maximize shareholders’ value.
The Company’s objectives when managing capital, which is a broader concept than the ‘equity’ on the face of the consolidated statement of financial position, are:
• To comply with the capital requirements set by the regulators of the financing markets where the entities within the Company operate;
• To safeguard the Company’s ability to continue as a going concern so that it can continue to provide returns for shareholders and benefits for other stakeholders; and
• To maintain a strong capital base to support the development of its business.
Capital adequacy and the use of regulatory capital are monitored daily by the Company’s management, employing techniques based on the guidelines developed by the Central Bank of Sri Lanka, for supervisory purposes. The required information is filed with the Authority on a quarterly basis.
The Company maintains a ratio of total regulatory capital to its risk-weighted assets above a minimum level agreed with the Authority which takes into account the risk profile of the Company.
The regulatory capital requirements are strictly observed when managing economic capital. The Company’s regulatory capital is managed by each month by board of directors and comprises two tiers:

230
ALLIANCE FINANCE COMPANY PLC | ANNUAL REPORT 2015/16
• Tier 1 capital
Tire 1’ Capital is capital which is permanently and freely available to absorb losses without a finance company being obliged to cease trading. An example of Tier 1’ Capital is the paid up ordinary share capital of a finance company. Tier 1’ Capital is important because it safeguards both the survival of a finance company and stability of the financial system.
• Tier2capital:
Tier 2 Capital is capital which generally absorbs losses only in the event of a winding up of a finance company, and so provides a lower level of protection for depositors and other creditors. Tier - 2’ Capital includes revaluation reserve, general provisions and hybrid capital instruments and approved subordinated term debts.
Equity Investments in Unconsolidated Financial and Banking subsidiaries are deducted from Tier 1 and Tier 2 capital to arrive at the Capital Base.
The risk weighted assets are measured using the Risk Weight % and Principal Amount of On Balance Sheet Items.
The table below summarises the composition of regulatory capital and the ratios of the Company for the years ended 31 March 2016 and 2015 During those two years, the Company has complied with all of the externally imposed capital requirements to which they are subject.
Notes to the Financial Statements Contd.

231
ALLIANCE FINANCE COMPANY PLC | ANNUAL REPORT 2015/16
CApiTAl AdEQuACy RATiO
CapitalBase 31.03.2016 31.03.2015 Rs. Rs.
Tier1:CoreCapitalIssued and Paid up Share Capital 350,000 350,000
Statutory Reserve Fund 501,317,400 418,257,400General Reserves 906,658,055 845,123,065Published Retained Profit 816,087,109 598,539,505Total Tier 1: Capital 2,224,412,564 1,862,269,970
Tire1:SupplementaryCapitalCapital Reserves (Revaluation ) 239,953,322 239,953,322Shares issued against Approved Reserves 11,975,000 11,975,000General Provisions - -Eligible Approved Unsecured Subordinated Term Debt 503,449,744 749,977,842Total Tier 2: Capital 755,378,066 1,001,906,164
DeductionsEquity Investments in unconsolidated banking and financial subsidiaries 50,867,186 53,309,786Capital Base 2,928,923,444 2,810,866,348
CapitalAdequacyRatio
Core Capital Ratio (Minimum 5%) Tier 1 Capital 100% 10.22% 10.68% Risk Weighted Assets
Total Risk Weighted Capital Base 12.90% 13.45% 16.32%Capital Ratio (Minimum 10%) Risk Weighted Assets
11
12
10
2014
/15
Core Capital Ratio
10.6
8%
2015
/16
10.2
2%
%
15
10
20
5
2014
/15
Total Risk Weighted Capital Ratio
16.3
2%
2015
/16
13.4
5%
%

232
ALLIANCE FINANCE COMPANY PLC | ANNUAL REPORT 2015/16
CONTRibuTiON TO NATiONAl ECONOmy
Sources of Income - 2015/16
Loans and Advances 28%Lease, Hire purchases and Consumer Durables 60%Government Securities 2%Placements with Banks & Financial Institutions 1%Other Investments 0%Net Fee and Commission Income 4%Other Income 4%
Utilization of Income - 2015/16
To Employees 17%To Suppliers 70%To Government 4%To Shareholders 9%
SourcesandUtilisationofIncome-CompanyFortheyearended31stMarch 2016 2015 Rs. % Rs. %
Sources of IncomeLoans and Advances 1,237,413,538 27.67% 793,788,724 19.02%Lease, Hire purchases and Consumer Durables 2,673,145,131 59.76% 2,621,811,767 62.79%Government Securities 107,791,825 2.41% 107,236,339 2.57%Placements with Banks & Financial Institutions 49,361,072 1.10% 36,094,742 0.86%Other Investments 20,699,738 0.46% 11,458,573 0.27%Net Fee and Commission Income 191,318,610 4.28% 148,598,396 3.56%Other Income 193,715,068 4.33% 456,942,950 10.94%Total Income 4,473,444,981 100.00% 4,175,931,491 100.00%
To EmployeesPersonnel Expenses 750,965,495 16.79% 524,922,946 12.57%
To suppliersInterest paid 1,868,434,772 41.77% 1,817,341,905 43.52%Other Expenses 815,792,384 18.24% 633,633,874 15.17%Depreciation 99,934,198 2.23% 85,702,246 2.05%Impairment for loans and other losses 334,174,465 7.47% 822,699,428 19.70% 3,118,335,818 69.71% 3,359,377,454 80.45%
To GovernmentValue added Tax & Other Taxes 84,125,542 1.88% 30,020,765 0.72%Income Tax 115,805,731 2.59% 74,543,166 1.79% 199,931,273 4.47% 104,563,931 2.49%
To ShareholdersDividends 126,360,000 2.82% 48,600,000 1.16%Invested in the business 277,852,395 6.21% 138,467,160 3.32% 404,212,395 9.04% 187,067,160 4.48% 4,473,444,981 100.00% 4,175,931,491 100.00%

233
ALLIANCE FINANCE COMPANY PLC | ANNUAL REPORT 2015/16
dEpOSiTORS iNFORmATiON
AnalysisofDepositBase(a) Value of Deposit Base and Certificate of DepositsValueofDeposits 2012 2013 2014 2015 2016 Rs.’000 Rs.’000 Rs.’000 Rs.’000 Rs.’000
Value of Term Deposits 6,419,122 8,611,827 10,746,932 9,723,254 9,524,730Value of Certificate of Deposits 52,228 51,035 6,206 84 84Value of Savings 100,267 104,566 168,436 393,517 677,534 6,571,617 8,767,428 10,921,574 10,116,855 10,202,348
(b) Rate of Interest Basis on Term Deposits Asat31stMarch2016 Asat31stMarch2015 No.of Value %of No.of Value %of Deposits Rs.’000 Total Deposits Rs.’000 Total
Less than 13% 8,780 8,900,604 93.45 9,277 8,021,007 82.49More than or equal to 13% and less than 15% 238 158,098 1.66 1,084 981,825 10.10More than or equal to 15% and less than 17% 321 225,640 2.37 562 385,635 3.97More than or equal to 17% and less than 19% 266 240,388 2.52 361 334,788 3.44More than or equal to 19% - - - - - -Total 9,605 9,524,730 100.00 11,284 9,723,254 100.00
Value of Term Deposits
2,000
4,000
10,000
8,000
6,000
2012
2013
2014
2015
2016
6,4
19
8,61
2
10,7
47
9,72
3
9,52
512,000rs. Mn
Value of Certificate of Deposits
10,000
20,000
50,000
40,000
30,000
2012
2013
2014
2015
2016
52,2
28
51,0
35
6,20
6
84 84
60,000rs. 000’
Value of savings
100,000
200,000
600,000
700,000
400,000
500,000
300,000
2012
2013
2014
2015
2016
100,
267
104,
566
168,
436
393,
517
677,
534
800,000rs. 000’
Deposit base rate wise - 2015/16
Less than 13% 93%More than or equal to 13% and less than 15% 2% More than or equal to 15% and less than 17% 2%More than or equal to 17% and less than 3%More than or equal to 0%
Deposit base rate wise- 2014/15
Less than 13% 82%More than or equal to 13% and less than 15% 10% More than or equal to 15% and less than 17% 4%More than or equal to 17% and less than 3%More than or equal to 0%

234
ALLIANCE FINANCE COMPANY PLC | ANNUAL REPORT 2015/16
(c) Capital Range on Term Deposits Asat31stMarch2016 Asat31stMarch2015 No.of Total % No.of Total % Deposits Deposits Deposits Deposits
1 - 100,000 2,669 144,434 2 3,236 176,933 2 100,000 - 250,000 1,808 319,791 3 2,219 394,904 4 250,001 - 500,000 1,797 729,380 8 2,144 865,651 9 500,001 - 750,000 581 366,295 4 755 477,396 5 750,001 - 1,000,000 913 866,107 9 1,035 983,805 10 Over 1,000,000 1,837 7,098,723 75 1,895 6,824,565 70 9,605 9,524,730 100 11,284 9,723,254 100
(d) Deposits Analysis Asat31stMarch2016 Asat31stMarch2015 Rs.’000 % Rs.’000 %
Individuals 8,596,407 84.26 8,705,018 86.04Shareholders 558,643 5.48 555,158 5.49Subsidiaries / Associate Companies 39,592 0.39 60,311 0.60Other Companies 250,509 2.46 284,565 2.81Pensions, Provident Funds, Clubs etc. 79,579 0.78 118,202 1.17Certificate of Deposits 84 0.00 84 0.00Savings 677,534 6.64 393,517 3.89 10,202,348 100.00 10,116,855 100.00
Deposit analysis - 2015/16
Individuals 84.26%Shareholders 5.48%Subsidiaries / Associate Companies 0.39%Other Companies 2.46%Pensions, Provident Funds, Clubs etc. 0.78%Certificate of Deposits 0.00% Savings 6.64%
Individuals 86.04%Shareholders 5.49%Subsidiaries / Associate Companies 0.6%Other Companies 2.81%Pensions, Provident Funds, Clubs etc. 1.17%Certificate of Deposits 0.00%Savings 3.89%
Deposit analysis - 2014/15
Capital Range of Term Deposits- 2015/16
1 - 100,000 2% 100,000 - 250,000 3%250,001 - 500,000 8% 500,001 - 750,000 4%750,001 - 1,000,000 9% Over 1,000,000 75%
1 - 100,000 2% 100,000 - 250,000 4%250,001 - 500,000 9% 500,001 - 750,000 5%750,001 - 1,000,000 10% Over 1,000,000 70%
Capital Range of Term Deposits- 2014/15
depositors information Contd.

235
ALLIANCE FINANCE COMPANY PLC | ANNUAL REPORT 2015/16
dEbENTuRE iNvESTOR iNdiCATORS 2014 2015 2016
Debt/equity ratio (times) 6.75 6.89 7.99Interest cover times 1.55 1.96 2.19Liquid assets ratio (%) 23.74 19.19 25.37
MarketValuePerDebentureDuringFinancialYear2015/16Debenture2012-2017MarketPrice(Rs.) Min Max LastTraded
3 Years - 18.5% p.a payable quarterly N/T N/T N/T5 Years - 20.0% p.a payable Monthly 99.99 117.50 117.50
Debenture2013-2018MarketPrice(Rs.) Min Max LastTraded
3 Years - 15.5% p.a payable semi annually N/T N/T N/T4 Years - 15.5% p.a payable semi annually 102.43 102.43 102.435 Years - 16.5% p.a payable semi annually N/T N/T N/T5 Years - 16.5% p.a payable @ maturity 76.14 76.14 76.14
Debenture2014-2019MarketPrice(Rs.) Min Max LastTraded
4 Years - 9.00% p.a payable annually N/T N/T N/T5 Years - 9.35% p.a payable annually N/T N/T N/T
8.00
7.50
6.50
7.00
8.50
6.00
Debt/equity ratio20
167.
99
2015
6.89
2014
6.75
Times
25.00
20.00
10.00
5.00
15.00
30.00
Liquid assets ratio
2016
25.3
7
2015
19.1
9
2014
23.7
4
%
2.00
1.50
0.50
1.00
2.50
Interest cover times
2016
2.19
2015
1.96
2014
1.55
Times
115
110
95
100
105
120
90
Debenture 2012-2017 market price (rs.) 5 years - 20.0% p.a payable monthly
last
Tr
aded
117.
50
Max
117.
50
Min
99.9
9
rs.
60
40
20
80
Debenture 2013-2018 market price (rs.) 5 years - 16.5% p.a payable @ maturity
last
Tr
aded
76.1
4
Max
76.1
4
Min
76.1
4
rs.
100
80
20
40
60
120
Debenture 2013-2018 market price (rs.) 4 years - 15.5% p.a payable semi annually
last
Tr
aded
102.
43
Max
102.
43
Min
102.
43
rs.

236
ALLIANCE FINANCE COMPANY PLC | ANNUAL REPORT 2015/16
TEN yEAR SummARy - COmpANy(In Rupees Million)For Year ended 31 March 2007 2008 2009 2010 2011 2012 2013 2014 2015 2016
OPERATING RESULTSIncome 769.61 973.07 1,346.86 1,527.78 1,869.41 2,270.91 3,487.97 3,837.89 4,175.93 4,473.44Profit before Tax 100.10 73.92 70.65 78.68 234.79 492.72 586.18 261.27 277.45 531.12Income Tax 32.57 (11.53) 9.08 10.83 50.00 36.98 75.06 (35.22) 74.54 115.81Profit after Tax 67.53 85.45 61.57 67.85 184.79 455.74 511.11 296.49 202.90 415.32
BALANCESHEETAssetsCash, Cash Equivalent & Deposits 91.32 73.03 79.51 237.16 467.29 527.37 1,043.08 1,248.20 1,111.75 2,713.93Receivables 193.20 397.94 845.99 947.59 705.37 1,220.85 1,126.05 1,350.21 1,101.92 592.37Stocks 2,646.36 3,315.36 3,492.58 3,628.76 5,775.25 9,366.68 13,477.41 12,997.64 14,440.63 19,292.47Investments 479.84 601.52 730.79 846.01 1,035.80 785.08 770.74 2,010.06 2,122.07 1,797.85Property,Plant & Equipment 612.96 665.81 679.32 654.63 623.25 754.01 1,074.24 1,120.35 1,133.33 1,460.37 4,023.67 5,053.66 5,828.19 6,314.14 8,606.97 12,653.99 17,491.52 18,726.47 19,909.69 25,856.98
LiabilitiesTerm Deposit 2,058.86 2,590.06 3,355.68 4,176.99 5,001.75 6,732.81 9,001.88 11,201.59 10,344.07 10,464.15Bank Overdraft/Loans 975.81 1,473.48 1,283.73 919.42 2,269.00 4,213.29 6,013.19 4,945.87 6,833.37 12,275.60Provisions & Other Liabilities 423.42 344.75 488.32 455.10 171.76 240.20 357.37 187.70 282.91 382.89 3,458.09 4,408.29 5,127.73 5,551.51 7,442.51 11,186.30 15,372.44 16,335.16 17,460.35 23,122.64Shareholders’ Funds 565.59 645.37 700.47 762.64 1,164.45 1,467.69 2,119.08 2,391.31 2,449.34 2,734.33
CHANGESINFINANCIALPOSITIONSources of FundsOperations 238.44 104.49 250.46 90.71 635.37 717.93 820.61 (904.12) 541.03 877.77Sale of Fixed Assets 36.34 26.27 15.64 57.56 69.87 59.98 36.01 21.44 8.06 47.62Term Deposits 350.57 455.60 765.62 821.31 830.05 1,731.06 2,269.07 2,199.71 (857.52) 120.08Bank Overdraft/Loans 278.47 334.39 (191.54) (180.26) 715.26 2,168.21 1,812.02 (1,103.21) 1,547.45 5,258.86Others (30.68) (53.38) (95.29) (66.04) (44.93) (50.95) (105.27) (165.36) (108.48) (153.38) 873.14 867.37 744.89 723.28 2,205.61 4,626.22 4,832.44 48.45 1,130.54 6,150.94
Application of FundsCapital Expenditure 183.26 137.93 97.75 82.82 84.86 237.85 158.35 137.36 106.74 450.67Portfolio Disbursements 806.57 939.73 683.78 301.11 2,190.98 4,169.62 4,654.30 20.34 1,071.33 5,952.84Deposits (65.84) (36.75) 28.59 (1.35) 3.72 (110.79) 10.17 66.37 400.92 (73.28)Income Tax 20.72 24.40 32.98 32.28 64.63 42.56 1.89 1.14 0.93 19.57Dividends 8.10 5.67 6.48 5.67 5.67 105.30 109.35 36.45 48.60 126.36Other (47.27) (58.53) (80.80) (40.30) (16.81) 164.93 (130.93) (199.30) (479.01) (350.63)Changes in available resources (32.40) (145.08) (23.89) 343.05 (127.43) 16.75 29.31 (13.93) (18.96) 25.41 873.14 867.37 744.89 723.28 2,205.61 4,626.22 4,832.44 48.45 1,130.54 6,150.94NO. OF SHARES 1,620,000 1,620,000 1,620,000 1,620,000 1,620,000 2,430,000 2,430,000 2,430,000 2,430,000 2,430,000
INDICATORS OF PERFORMANCEReturn on Shareholders Funds %(After Tax) 12.60 14.11 9.15 9.27 21.68 34.63 28.5 13.15 8.38 16.02Return on Total Assets %(After Tax) 1.88 1.88 1.13 1.12 2.52 4.29 3.39 1.64 1.05 1.81Earnings per Share Rs. 41.69 52.75 38.01 41.88 76.05 187.55 210.33 122.01 83.50 170.91Market Value per Share (Rs.) 210.00 175.00 175.00 419.00 850.10 630.00 800.10 769.80 770.00 740.00Price Earning Ratio 5.04 3.32 4.60 10.00 11.18 3.36 3.80 6.31 9.22 4.33Rate of Dividend % 35.00 40.00 35.00 35.00 275.00 450.00 400.00 200.00 230.00 290.00Dividend per Share (Rs.) 3.50 4.00 3.50 3.50 27.50 45.00 40.00 20.00 23.00 29.00Gross Dividend 5.67 6.48 5.67 5.67 44.55 109.35 97.20 48.60 55.89 70.47Dividend cover (times) 11.91 13.19 10.86 11.97 4.42 4.67 5.26 6.10 3.63 5.89Net Assets per share (Rs.) 349.13 398.37 432.39 470.77 581.34 603.99 872.04 984.08 1,007.96 1,125.24
MARKETVALUEPERSHAREDURINGTHEYEARENDEDHighest Value Recorded During the Year (Rs.) 248.75 235.00 220.00 485.00 1,100.00 824.90 702.00 820.00 929.00 1,000.00Lowest Value Recorded During the Year (Rs.) 140.00 168.00 175.00 185.00 700.00 516.00 849.00 730.00 810.00 732.00Market Value as at 31st March (Rs.) 210.00 175.00 175.00 419.00 850.10 630.00 800.10 769.80 770.00 740.00
FINANCIALHIGHLIGHTSAssets 4,424 5,054 5,828 6,314 8,607 12,654 17,492 18,726 19,910 25,857Liabilities 3,458 4,408 5,128 5,552 7,443 11,186 15,372 16,335 17,460 23,123Shareholders Funds 566 645 700 763 1,164 1,468 2,119 2,391 2,449 2,734

237
ALLIANCE FINANCE COMPANY PLC | ANNUAL REPORT 2015/16
ShAREhOldER iNFORmATiON
20MAJORSHAREHOLDERS31.03.2016 31.03.2015
no. name of shareholderno. ofshares % name of shareholder
no. ofshares %
1 Mr. R.K.E.P. de Silva 644,068 26.50 Mr. R.K.E.P. de Silva 644,068 26.502 Motor Service Station (Pvt) Ltd., 327,564 13.48 Motor Service Station (Pvt) Ltd., 327,564 13.483 Miss. D.M.E.P. Perera 182,181 7.50 Miss. D.M.E.P. Perera 182,181 7.504 Mr. R.K.E.P. de Silva &
Mr. J.E.P.A. de Silva 151,530 6.24 Mr. J.E.P.A. de Silva 151,530 6.24
5 Mr. D.F.W.S.K. Perera & Mr. D.F.W. Perera
99,630 4.10 Mr. D.F.W.S.K. Perera & Mr. D.F.W. Perera
99,630 4.10
6 Orient Hotels Ltd., 97,956 4.03 Orient Hotels Ltd., 97,956 4.037 Mr. N. Amarasinghe 74,340 3.06 Mr. N. Amarasinghe 74,340 3.068 Janashakthi PLC A/c No. 1 50,551 2.08 Janashakthi PLC., A/c No. 1 50,551 2.089 Mrs. S.E. Canekeratne 44,154 1.82 Mrs. S.E. Canekeratne 44,154 1.8210 Mr. D.L.S.R. Perera 39,920 1.64 Mr. D.L.S.R. Perera 39,920 1.6411 Mrs. S.R.L. Marcelline 36,936 1.52 Mrs. S.R.L. Marcelline 36,936 1.5212 Trading Partners (Pvt) Ltd. 30,020 1.24 Trading Partners (Pvt) Ltd. 27,429 1.1313 Seylan Bank PLC/Janashakthi Ltd., 27,287 1.12 Seylan Bank PLC/Janashakthi Ltd., 27,287 1.1214 Mrs. C.R. de Silva 27,000 1.11 Mrs. C.R. de Silva 27,000 1.1115 Mr. D.F.W. Perera 23,292 0.96 Mr. D.F.W. Perera 23,292 0.9616 Ms. D.D.P.T. Perera 21,460 0.88 Ms. D.D.P.T. Perera 21,460 0.8817 Mrs. P. Weththasinghe 21,397 0.88 Mrs. P. Weththasinghe 21,397 0.8818 Mrs. A.S. Wijewardena 19,440 0.80 Mrs. A.S. Wijewardena 19,440 0.8019 Mrs. L.S. Semage 17,958 0.74 Mrs. L.S. Semage 17,958 0.7420 Ms. D.C.M.A. Perera 17,000 0.70 Ms. D.C.M.A. Perera 17,000 0.70
1,953,684 80.40 1,951,093 80.29
DISTRIBUTIONOFSHARES 31stMarch2016 31stMarch2015Holdings No.of Total % No.of Total % Holders Holders
1 - 1,000 550 78,440 3.23 540 80,004 3.29 1,001 - 10,000 90 298,971 12.30 85 289,382 11.91 10,001 - 100,000 26 793,246 32.65 26 755,271 31.08 100,001 - 1,000,000 4 1,259,343 51.82 4 1,305,343 53.72Over 1,000,000 - - - - - - 670 2,430,000 100.00 655 2,430,000 100.00
The shares in the hands of the public 31.3.2016 were 1,305,573 representing 59.96% of the Issued Share Capital of the Company and as at 31.3.2015 were 1,457,503 representing 59.97% of the Issued Share Capital of the Company.
31stMarch2016 31stMarch2015Holdings No.of Total % No.of Total % Holders Holders
Institution 18 508,779 20.94 19 531705 21.88Individuals 652 1,921,221 79.06 636 1898295 78.12 670 2,430,000 100 655 2430000 100

238
ALLIANCE FINANCE COMPANY PLC | ANNUAL REPORT 2015/16
AAccountingPoliciesThe specific principles, bases, conventions, rules and practices adopted by a company in preparing and presenting Financial Statements
AccountingThe profit or loss for a period before deducting tax expense
AccrualBasisofAccountingThe effects of transactions and other events are recognised when they are occurred (and not as cash or its equivalent is received or paid) and they are recorded in the accounting records and reported in the financial statements of the periods to which they relate.
Amortisation(Depreciation)The systematic allocation of the depreciable amount of an asset over its useful life
CCarrying AmountThe amount at which an asset is recognized in balance sheet after deducting any accumulated depreciation (amortisation)and accumulated impairment losses
CashEquivalentsShort-term, highly-liquid investments that is readily convertible to known amounts of cash and which are subject to an insignificant risk of changes in value
ContingenciesConditions or situation at the balance sheet date and the financial effects of which are to be determined by the future events that may or may not occur
Corporate GovernanceThe process by which corporate entities are governed. It is concerned with the way in which power is exercised over the management and direction of entity, the supervision of executive actions and accountability of owners and others.
CosttoIncomeRatioPersonal and Other Non-Interest Expenses divided by the Net Interest Income & Non-Interest Income
Current TaxThe amount of tax payable in respect of taxable income for the period
DDealingSecuritiesMarketable securities that are acquired and held with the intention of reselling them in the short-term
DeferredtaxliabilitiesThe amounts of income tax payable in future periods in respect of taxable temporary differences
DefinedBenefitPlansRetirement benefit plans under which amounts to be paid as retirement benefits are determined by reference to a formula usually based on employees’ remuneration and completed years of service
DisbursementsAnother term for investments
DiscretionaryProvisionThis includes provision for bonuses and incentives
DividendsDistribution of profits to holders of equity investments, in proportion to their holdings of a particular class of capital
Dividend CoverProfit after tax divided by gross dividend. The ratio measures the number of times dividend is covered by current years’ distributable profits
Dividendpershare(DPS)Gross dividend divided by the number of shares in issues
glOSSARy
239
ALLIANCE FINANCE COMPANY PLC | ANNUAL REPORT 2015/16
EEarningsperShare(EPS)Profit for the period attributable to ordinary shareholders(the numerator) divided by the weighted average number of ordinary shares in issue during the period (the denominator)
EfficiencyRatioThe Non-Interest Expenses divided by total income
GGeneral ReservesReserves set aside for future
GrossNPA(NPL)RatioTotal non-performing accommodations (loans) after deducting for initial rentals received, unearned income, and interest in suspense, divided by gross accommodations (loans) after deducting for initial rentals received, unearned income and interest in suspense.
Gross DividendThe portion of profits distributed to the shareholders including the tax withheld
IImpairmentThis occurs when recoverable amount of asset declines below its carrying amount
InvestmentsValue of facilities granted during a specific period
InvestmentsSecuritiesSecurities acquired and held for yield or capital growth purposes; usually held to maturity
LLiquidityThe availability of sufficient funds to meet deposit withdrawals and other financial commitments as they fall due
Liquid AssetsCash and cash equivalents, repurchase agreements,placements in banks and other financial institutions and treasury bills
LiquidAssetsRatioLiquid assets as a percentage of total deposits
MMaterialityInformation is material if its non-disclosure could influence the economic decisions of users taken on the Financial Statements
MarketValueperShareMarket capitalization divided by the number of ordinary shares in issue
NNon-PerformingAccommodations(Advances/ Loans) -NPAAccommodations which are 180 days or more in arrears of due principal and/or interest payments
NetAssetsValueperShareShareholders’ funds excluding preference shares if any,divided by the number of ordinary shares in issue
NetNPARatioTotal non-performing accommodations excluding initial rentals received, unearned income, interest in suspense and provision for loan losses, divided by gross loans after deducting for initial rentals received, unearned income,interest in suspense and provision for loan losses
Net Interest IncomeThe difference between income earned from interest bearing assets and cost incurred on financial instrument/ facilities used for funding the interest bearing assets
Net Interest MarginNet interest income divided by total average assets
OOffBalanceSheetTransactionsTransactions that are not recognized as assets or liabilities in the balance sheet but which may give rise to contingencies and commitments

240
ALLIANCE FINANCE COMPANY PLC | ANNUAL REPORT 2015/16
glossary Contd.
PPortfolioTotal rentals and other receivables on loans and advances after deducting for unearned interest in suspense and initial rentals paid
PriceEarning(P/E)RatioThe market price of an ordinary share divided by the Earnings per Share
ProvisionforloanlossesAmounts set aside against possible losses on net receivable of facilities granted to customer as a result of them becoming party or wholly uncollectible
RReturn on Assets (ROA)Profit before tax expressed as a percentage of average total assets; used along with ROE as a measure of profitability and as a basis of intra-industry performance comparison
ReturnonShareholders’Fund/Equity (ROE)Profit before tax expressed as a percentage of average total assets; used as a measure of profitability and as a basis of intra-industry performance comparison
RevaluationRestatement of assets and liabilities
RateofDividendGross dividend as a percentage of total par value of shares
SSBUStrategic Business Unit
Segment RevenueRevenue reported in the Company’s income statement that is directly attributable to a segment and the relevant portion of the Company’s revenue that can be allocated on a reasonable basis to a segment
Shareholders’FundsShareholders’ Funds consist of issued and fully-paid ordinary share capital plus capital and revenue reserves
TTaxableProfit/(TaxLoss)The profit (loss) for a period, determined in accordance with the rules established by the taxation authorities, upon which the income tax is payable/(recoverable)
‘Tier 1’ CapitalCore capital representing permanent shareholders’ equity and reserves created or increased by appropriation of retained earnings or other surplus
‘Tier 2’ CapitalSupplementary capital representing revaluation reserve,general provisions and other capital instruments which combine certain characteristics of equity debt such as hybrid capital instruments and subordinated term debts
VValue AddedValue Added is the wealth created by providing services less cost of providing such services. The value added is allocated amongst the employees, the providers of capital and to the Government by way of taxes and retained for expansion and growth
241
ALLIANCE FINANCE COMPANY PLC | ANNUAL REPORT 2015/16
Notice is hereby given that the Sixtieth Annual General Meeting of Alliance Finance Company PLC, will be held on Thursday, 29th September 2016 at 3.00 p.m., at the Lakshman Kadiragarmar Institute for International Relations and Strategic Studies, “The Light House”, No.24, Horton Place, Colombo 7. The business to be brought before the Meeting will be:-
1. To receive and consider the Report of the Directors and the Statement of Accounts for the Financial Year ended 31st March 2016, with the Report of the Auditors thereon.
2. To declare a Dividend. 3. To re-elect a Director Mr. Sunil Karunanayake retires under Articles numbered 130 and 1314. To elect a Director Dr. L. Ajith Prasanna Medis retires under Article number 1355. To re-appoint Auditors to hold office until the next Annual General Meeting and to fix their remuneration.6. To authorize the Directors to determine and make donations.7. To consider any other business of which due notice has been given.
By order of the Board
(Sgd)ALLIANCE MANAGEMENT SERVICES (PRIVATE) LIMITED Secretaries
1st September 2016.
Note:(i) A member is entitled to appoint a proxy to attend and vote in his/her place.(ii) A proxy need not be a member of the Company.(iii) A member wishing to vote by proxy at the meeting may use the Form of Proxy enclosed and interpolate the words “right to
speak”.(iv) To be valid, the completed Form of Proxy must be lodged at Alliance Management Services (Pvt) Ltd, No.84, Ward Place,
Colombo 7, not less than 48 hours before the meeting. (v) Shareholders/Proxy holders are requested when attending the Annual General Meeting to bring with them their National
Identity Card or any other form of valid identification.(vi) Shareholders appointing proxies (other than Directors) to attend the meeting are requested to indicate the number of the
National Identity Card of the Proxy holder on the Form of Proxy. Only registered proxy holders will be permitted to attend the Annual General Meeting.
NOTiCE OF mEETiNg

242
ALLIANCE FINANCE COMPANY PLC | ANNUAL REPORT 2015/16
NOTES
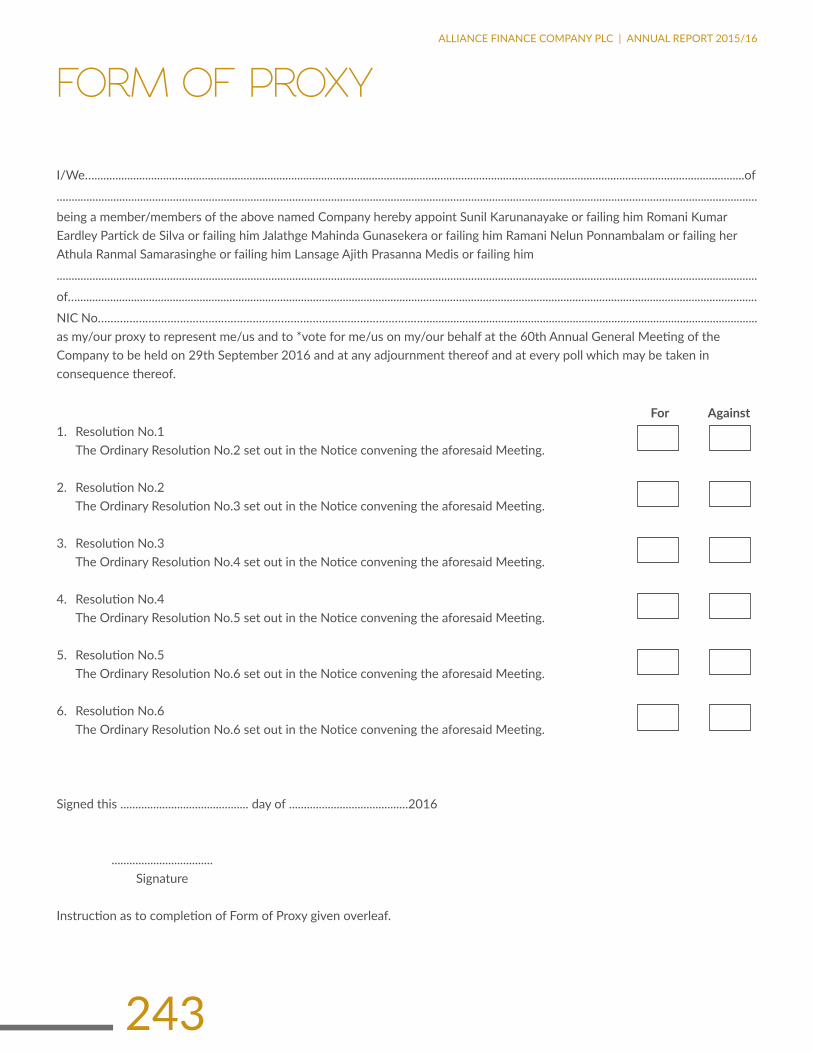
243
ALLIANCE FINANCE COMPANY PLC | ANNUAL REPORT 2015/16
FORm OF pROxy
I/We…..........................................................................................................................................................................................................................of
...........................................................................................................................................................................................................................................being a member/members of the above named Company hereby appoint Sunil Karunanayake or failing him Romani Kumar Eardley Partick de Silva or failing him Jalathge Mahinda Gunasekera or failing him Ramani Nelun Ponnambalam or failing her Athula Ranmal Samarasinghe or failing him Lansage Ajith Prasanna Medis or failing him
...........................................................................................................................................................................................................................................
of…....................................................................................................................................................................................................................................
NIC No…………………………………………………………………………………………….............................................................................................................. as my/our proxy to represent me/us and to *vote for me/us on my/our behalf at the 60th Annual General Meeting of the Company to be held on 29th September 2016 and at any adjournment thereof and at every poll which may be taken in consequence thereof.
For Against1. Resolution No.1 The Ordinary Resolution No.2 set out in the Notice convening the aforesaid Meeting.
2. Resolution No.2 The Ordinary Resolution No.3 set out in the Notice convening the aforesaid Meeting.
3. Resolution No.3 The Ordinary Resolution No.4 set out in the Notice convening the aforesaid Meeting.
4. Resolution No.4 The Ordinary Resolution No.5 set out in the Notice convening the aforesaid Meeting.
5. Resolution No.5 The Ordinary Resolution No.6 set out in the Notice convening the aforesaid Meeting.
6. Resolution No.6 The Ordinary Resolution No.6 set out in the Notice convening the aforesaid Meeting.
Signed this ........................................... day of ........................................2016
.................................. Signature
Instruction as to completion of Form of Proxy given overleaf.

244
ALLIANCE FINANCE COMPANY PLC | ANNUAL REPORT 2015/16
Form of proxy Contd.
InstructionsastocompletionoftheFormofProxy
1. A proxy holder need not be a member of the Company.
2. The full name and address of the proxy and of the shareholder appointing the proxy should be entered legibly in the Form of Proxy.
3. The completed Form of Proxy should be deposited at the office of the Secretaries, Alliance Management Services (Pvt) Ltd., 84, Ward Place, Colombo 7, 48 hours before the time appointed for the holding of the Meeting.
4. In the case of a Company or a Corporate Body, the Form of Proxy should be executed under its Common Seal in accordance with its Articles of Association.
Note:If you wish your proxy to speak and vote at the Meeting you should interpolate the words “to speak and” in the space indicated with an asterisk and initial such interpolation.

CORpORATE iNFORmATiON
NameoftheCompanyAlliance Finance Company PLC
Statutory StatusQuoted Public Limited Liability Company incorporate under the Companies Ordinance No.51 of 1938
Approvedandregisteredunderthe• Finance Business Act No. 42 of 2011
• Finance Leasing Act No. 56 of 2000
AnapprovedCreditAgencyunderthe• Mortgage Act No.6 of 1949
• Trust Receipt Ordinance No.12 of 1947
CompanyRegistrationNo.PQ 93
RegisteredOfficeAlliance HouseNo.84, Ward Place, Colombo 7Sri LankaTel: (+94) 11 2673673Fax: (+94) 11 2697205E-mail: [email protected]
BoardofDirectorsMr. Sunil Karunanayake - ChairmanMr. Romani de Silva - Deputy Chairman & Managing DirectorLt. Col. (Retd) A.R. Samarasinghe - Independent Non-Executive DirectorMrs. R.N. Ponnambalam - Non-Executive DirectorMr. E.C.S.R. Muttupulle (retired 14.02.2016)Mr. J.M. GunasekeraDr. L.A.P. Medis
Advisory CouncilMr. Pratapkumar de Silva FICM (SL), FICM (Eng.), JPMr. B. PonnambalamMrs. K.S.K. de SilvaMr. Abbas Akbarally (Chairman - Akbar Brothers Group of Companies)Mr. K. Kanaglsvaran LLB (London) of Lincoln’s Inn Barrister - (President’s Counsel)Mr. S.P. Morawake (Former Registrar of Companies)
AuditCommitteeMr. Sunil Karunanayake - ChairmanLt. Col. (Retd) A.R. Samarasinghe
RemunerationCommitteeLt. Col. (Retd) A.R. Samarasinghe - ChairmanMr. Sunil Karunanayake Mrs. R.N. Ponnambalam
RelatedPartyTransactionsCommitteeLt. Col. (Retd) A.R. Samarasinghe - ChairmanMr. Sunil Karunanayake Mrs. R.N. Ponnambalam
SubsidiariesAlfinco Insurance Brokers (Pvt) Ltd.
AuditorsM/s. Baker Tilly Edirisinghe & Co.Chartered AccountantsNo. 45 2nd FloorBraybrooke Street Colombo 2
Internal AuditorsKPMGChartered Accountants32A Mohamed Macan Marker MawathaP.O. Box 186Colombo 3
Legal ConsultantsGunawardena & Ranasinghe AssociatesSudath Perera Associates
SecretariesAlliance Management Services (Pvt) Ltd.No. 84 Ward PlaceColombo 7
BankersSampath Bank PLCSeylan Bank PLCPublic Bank BerhadPeople’s BankHatton National Bank PLCCommercial Bank PLCBank of CeylonNations Trust Bank PLCNDB Bank PLCDFCC Bank PLC
Produced by Copyline (Pvt) Ltd Printed by Gunaratne Offset Ltd

246
ALLIANCE FINANCE COMPANY PLC | ANNUAL REPORT 2015/16
Alliance Finance Co PLC, “Alliance House”, No 84, Ward Pl, Colombo 07, Sri Lanka.