Embed Size (px)
Citation preview
Key Points
Outside Market Influences
Record World Stocks
MY 2017/18 Grain Market Fundamentals
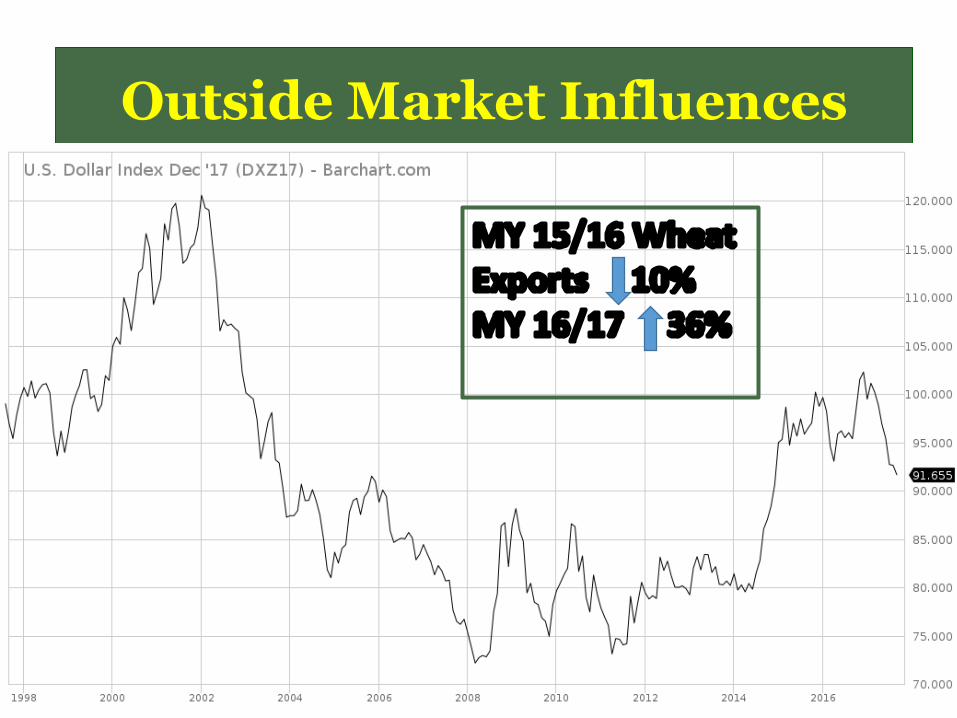
Outside Market Influences
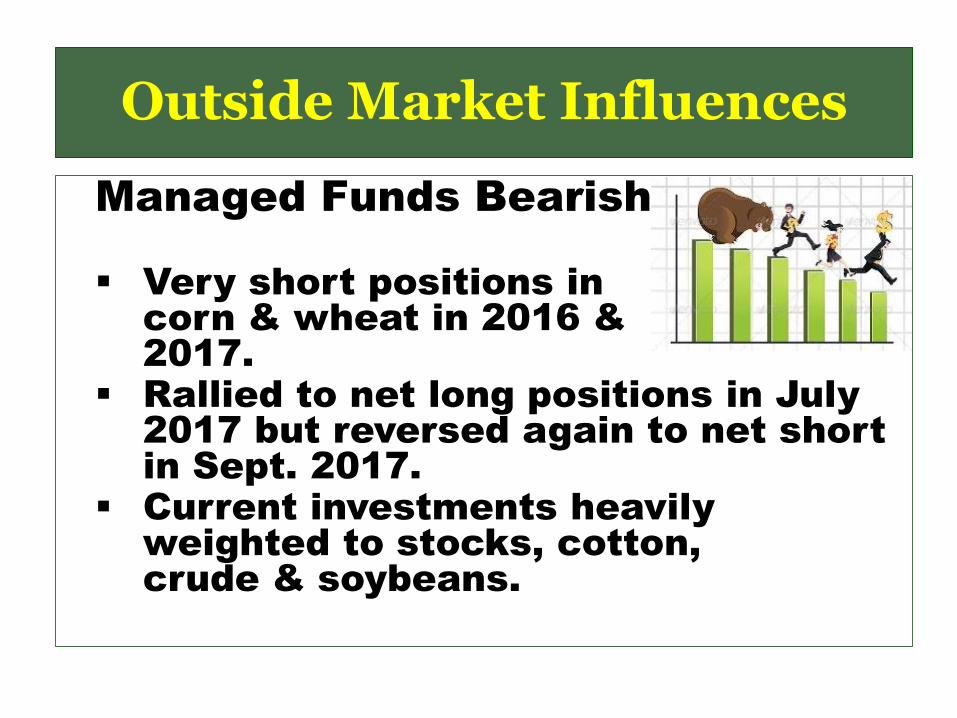
Managed Funds Bearish
Very short positions in corn & wheat in 2016 &2017.
Rallied to net long positions in July 2017 but reversed again to net short in Sept. 2017.
Current investments heavily weighted to stocks, cotton, crude & soybeans.
Outside Market Influences
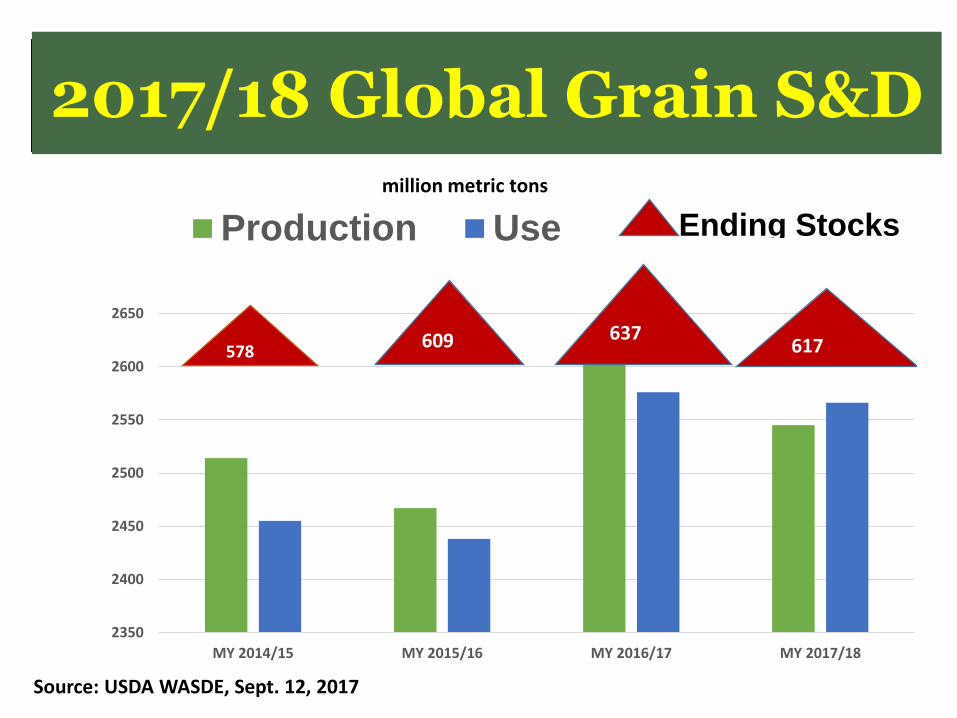
Grain Price Outlook2017/18 Global Grain S&D
2350
2400
2450
2500
2550
2600
2650
MY 2014/15 MY 2015/16 MY 2016/17 MY 2017/18
Production Use
578
Ending Stocks
609 637617
million metric tons
Source: USDA WASDE, Sept. 12, 2017
World & U.S. Supply & Demand (USDA WASDE, Apr 9, 2015)
World
Barley
U.S.
Barley
World
Corn
U.S.
Corn
World
Wheat
U.S.
Wheat
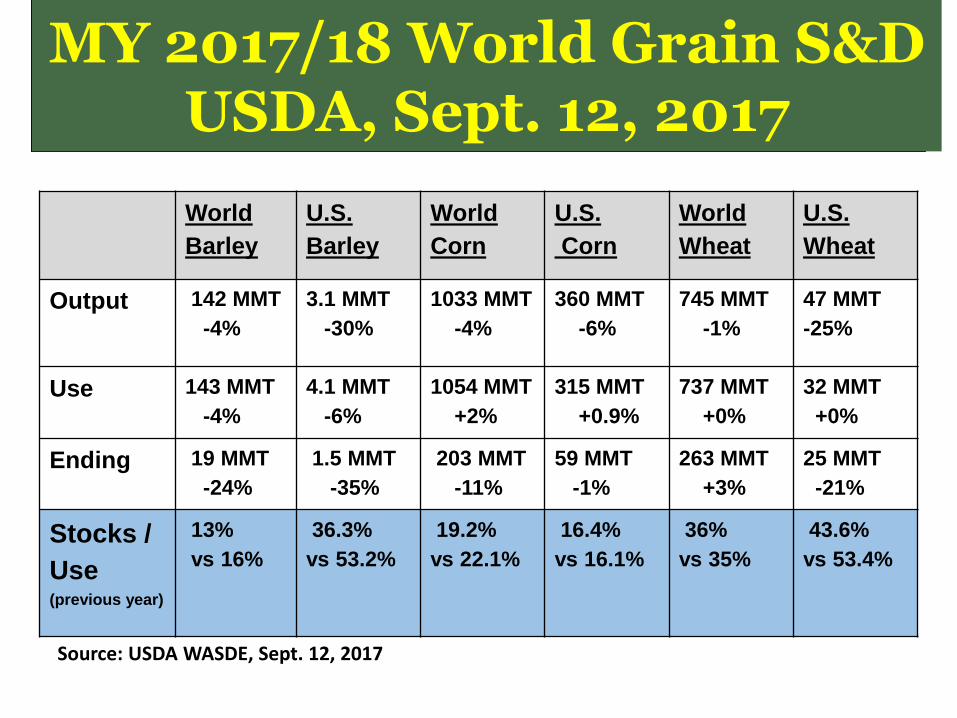
Output 142 MMT
-4%
3.1 MMT
-30%
1033 MMT
-4%
360 MMT
-6%
745 MMT
-1%
47 MMT
-25%
Use 143 MMT
-4%
4.1 MMT
-6%
1054 MMT
+2%
315 MMT
+0.9%
737 MMT
+0%
32 MMT
+0%
Ending 19 MMT
-24%
1.5 MMT
-35%
203 MMT
-11%
59 MMT
-1%
263 MMT
+3%
25 MMT
-21%
Stocks /
Use(previous year)
13%
vs 16%
36.3%
vs 53.2%
19.2%
vs 22.1%
16.4%
vs 16.1%
36%
vs 35%
43.6%
vs 53.4%
MY 2017/18 World Grain S&DUSDA, Sept. 12, 2017
Source: USDA WASDE, Sept. 12, 2017
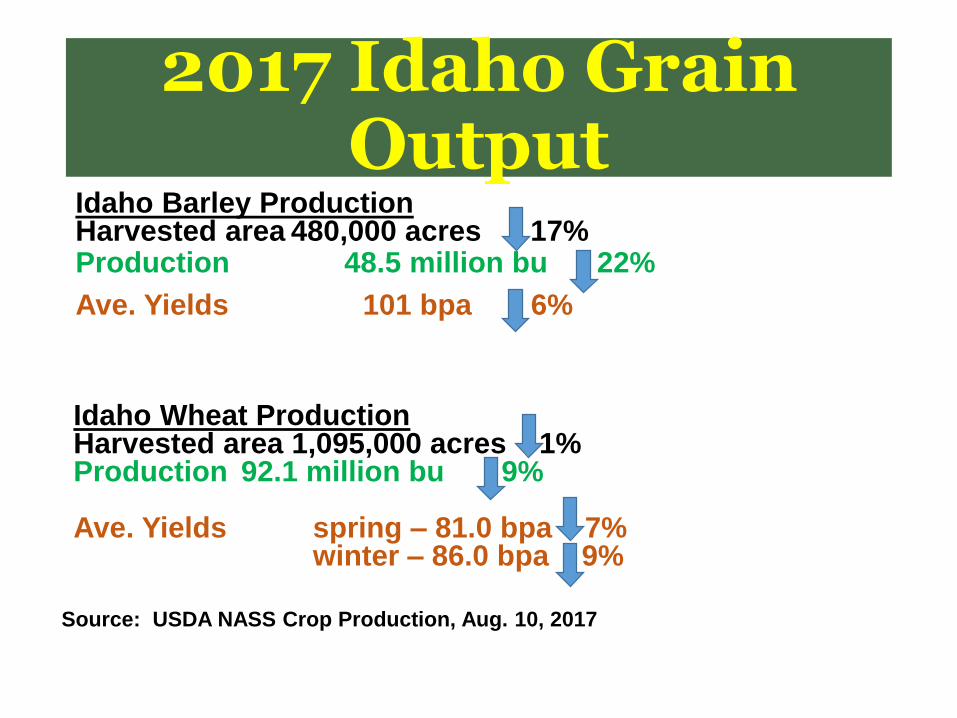
2017 Idaho Grain Output
Idaho Barley ProductionHarvested area 480,000 acres 17%Production 48.5 million bu 22%
Ave. Yields 101 bpa 6%
Idaho Wheat ProductionHarvested area 1,095,000 acres 1%Production 92.1 million bu 9%
Ave. Yields spring – 81.0 bpa 7%winter – 86.0 bpa 9%
Source: USDA NASS Crop Production, Aug. 10, 2017
Bigger 2015 U.S. production and burdensome carryover
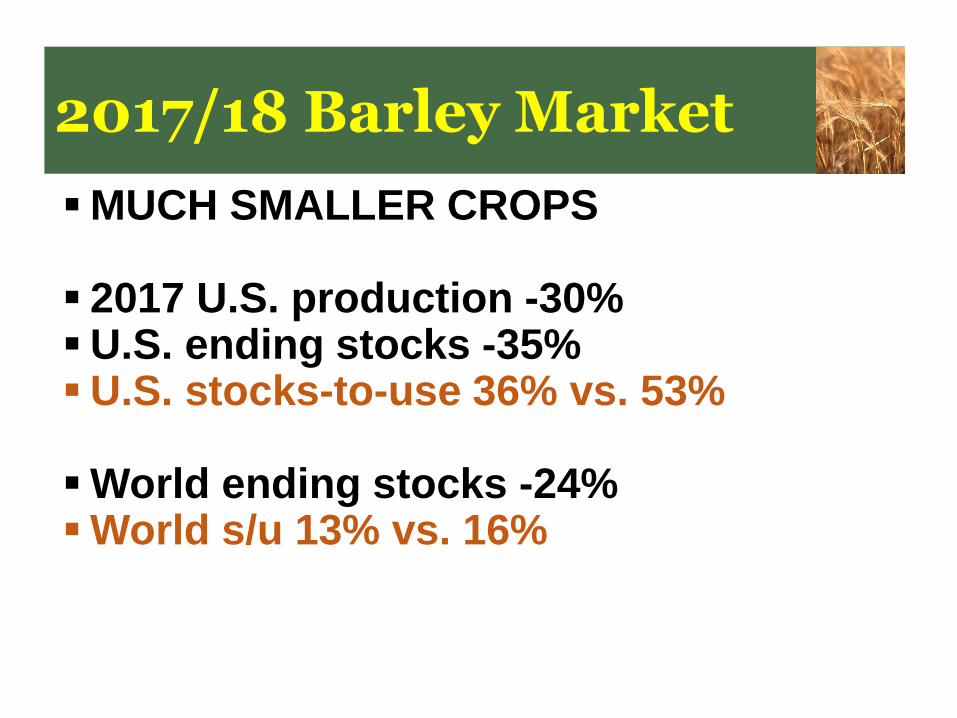
MUCH SMALLER CROPS
2017 U.S. production -30%U.S. ending stocks -35% U.S. stocks-to-use 36% vs. 53%
World ending stocks -24% World s/u 13% vs. 16%
2017/18 Barley Market
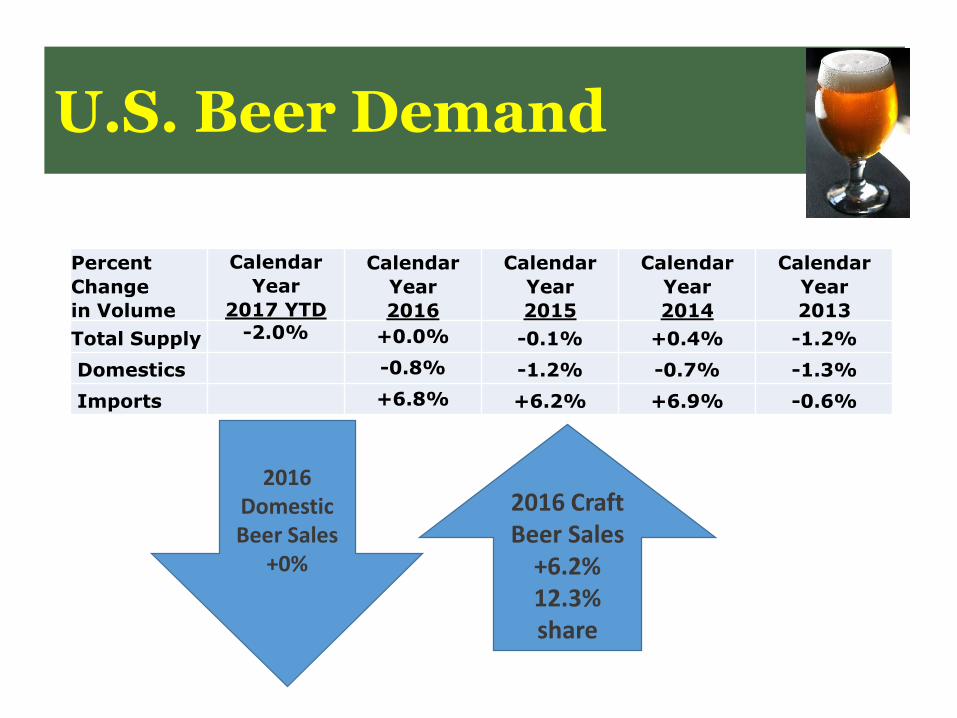
20U.S. Beer Demand
2016 Craft Beer Sales
+6.2%12.3% share
2016 Domestic Beer Sales
+0%
Percent
Change
in Volume
Calendar
Year
2017 YTD
Calendar
Year
2016
Calendar
Year
2015
Calendar
Year
2014
Calendar
Year
2013
Total Supply -2.0% +0.0% -0.1% +0.4% -1.2%
Domestics -0.8% -1.2% -0.7% -1.3%
Imports +6.8% +6.2% +6.9% -0.6%
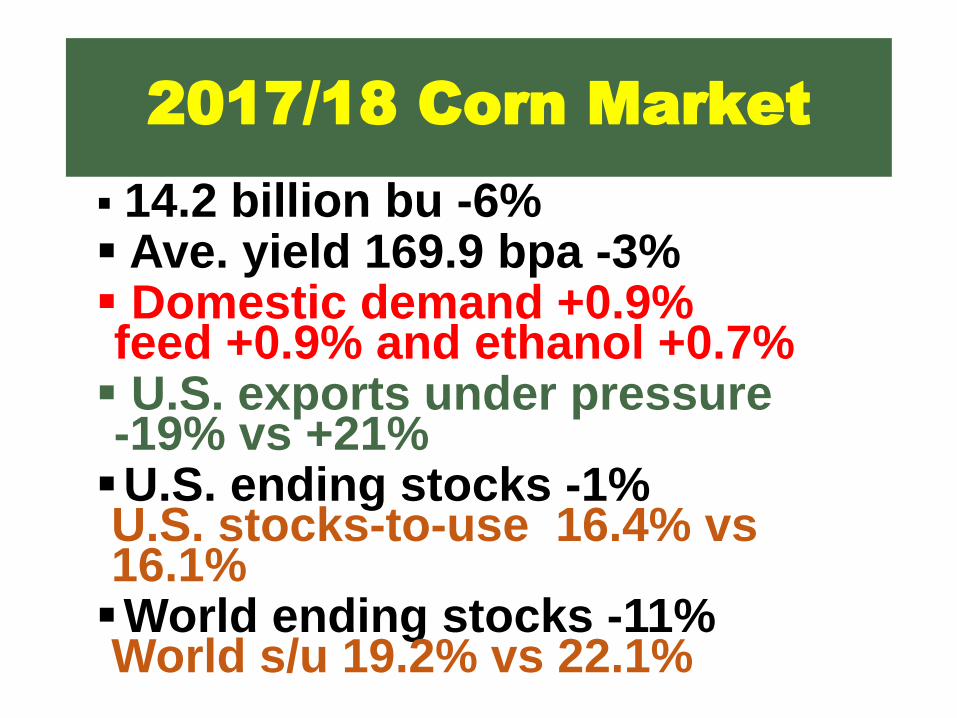
2017/18 Corn Market
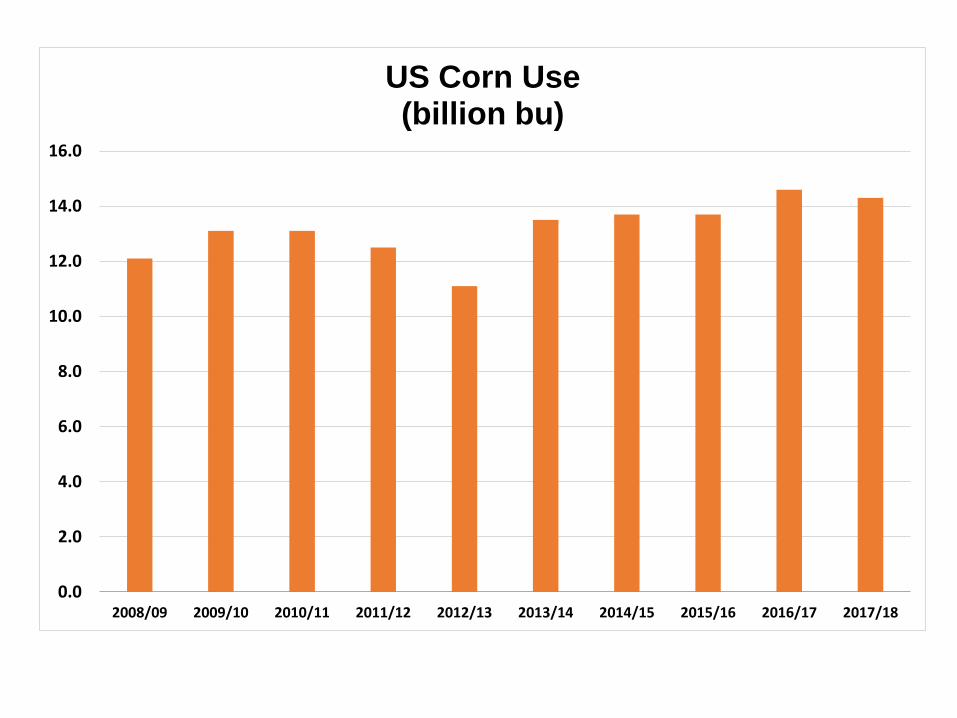
14.2 billion bu -6% Ave. yield 169.9 bpa -3% Domestic demand +0.9%feed +0.9% and ethanol +0.7% U.S. exports under pressure -19% vs +21%U.S. ending stocks -1% U.S. stocks-to-use 16.4% vs 16.1%World ending stocks -11% World s/u 19.2% vs 22.1%
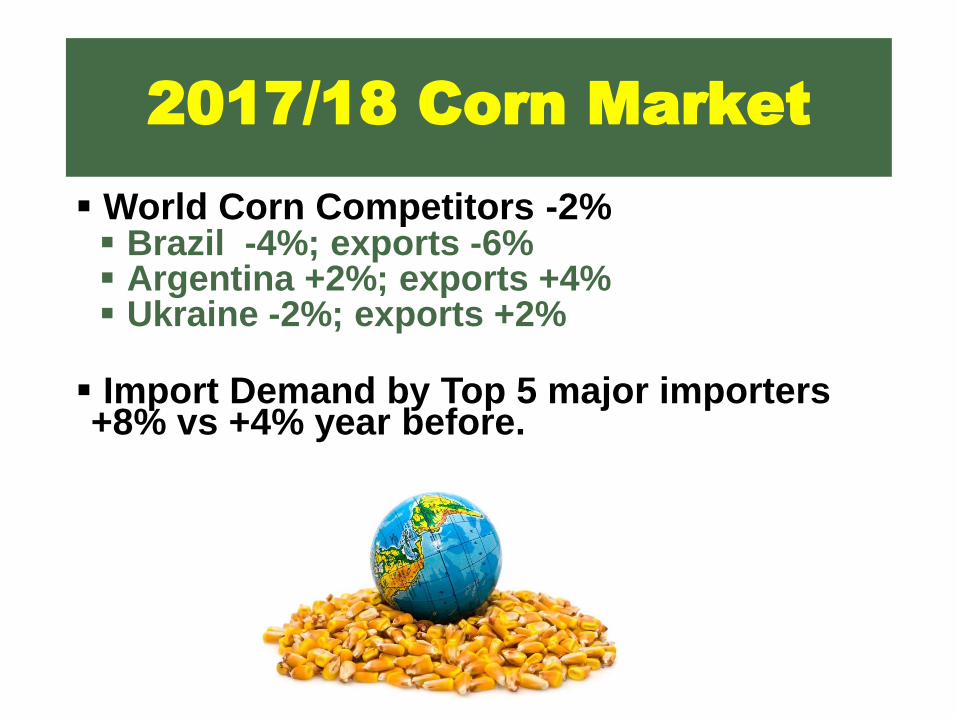
2017/18 Corn Market
World Corn Competitors -2% Brazil -4%; exports -6% Argentina +2%; exports +4% Ukraine -2%; exports +2%
Import Demand by Top 5 major importers +8% vs +4% year before.

0.0
5.0
10.0
15.0
20.0
25.0
2008/09 2009/10 2010/11 2011/12 2012/13 2013/14 2014/15 2015/16 2016/17 2017/180.0
200.0
400.0
600.0
800.0
1000.0
1200.0
Pe
rce
nt M
MT
World Corn Prod, Use, Stocks/Use
S/U ratio Use Prod
0.0
2.0
4.0
6.0
8.0
10.0
12.0
14.0
16.0
2008/09 2009/10 2010/11 2011/12 2012/13 2013/14 2014/15 2015/16 2016/17 2017/18
US Corn Use(billion bu)
$4.52
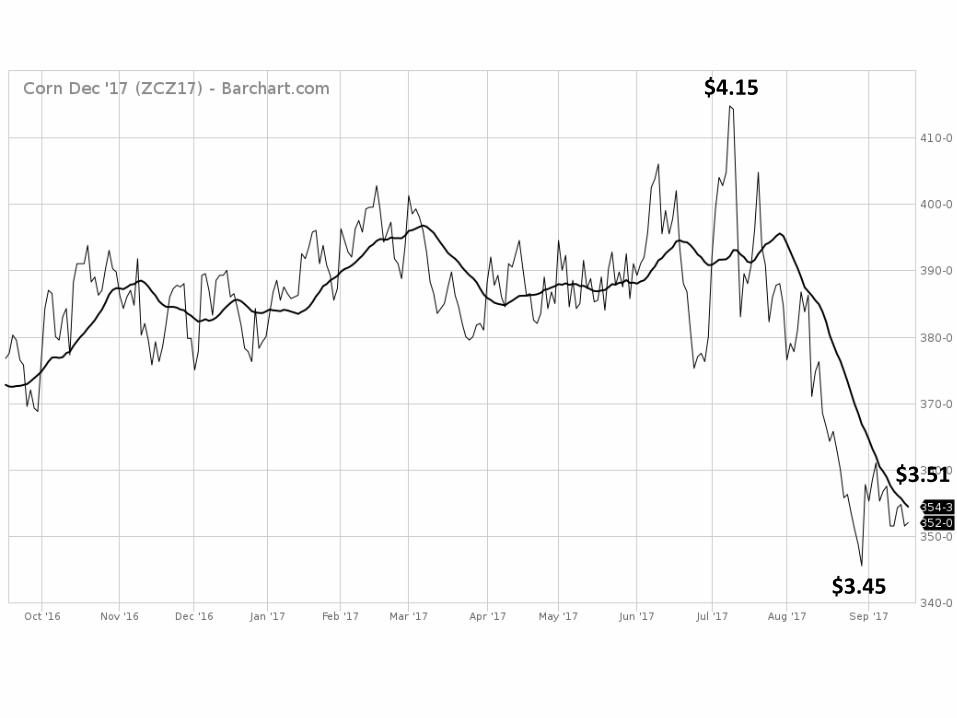
$3.45
$4.15
$3.51
2017/18 Wheat Market
Smaller U.S. crop 1.74 billion bu -25% U.S. Exports -8% vs +36%U.S. ending stocks -21% U.S. stocks-to-use 43.6% vs 53.4%
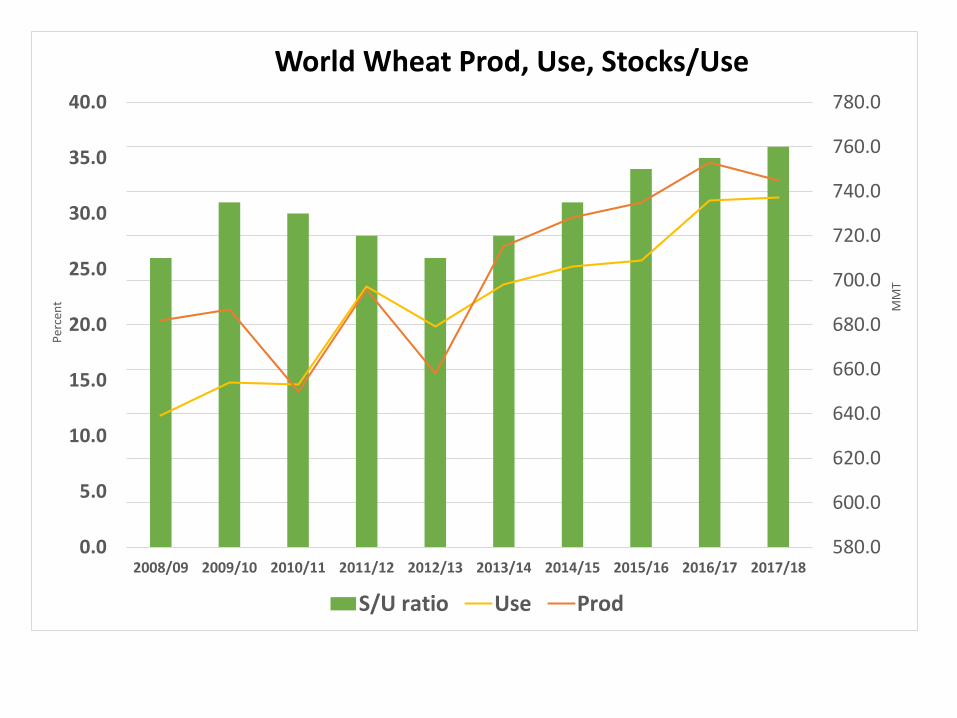
World ending stocks +3%World s/u 36% vs 35%
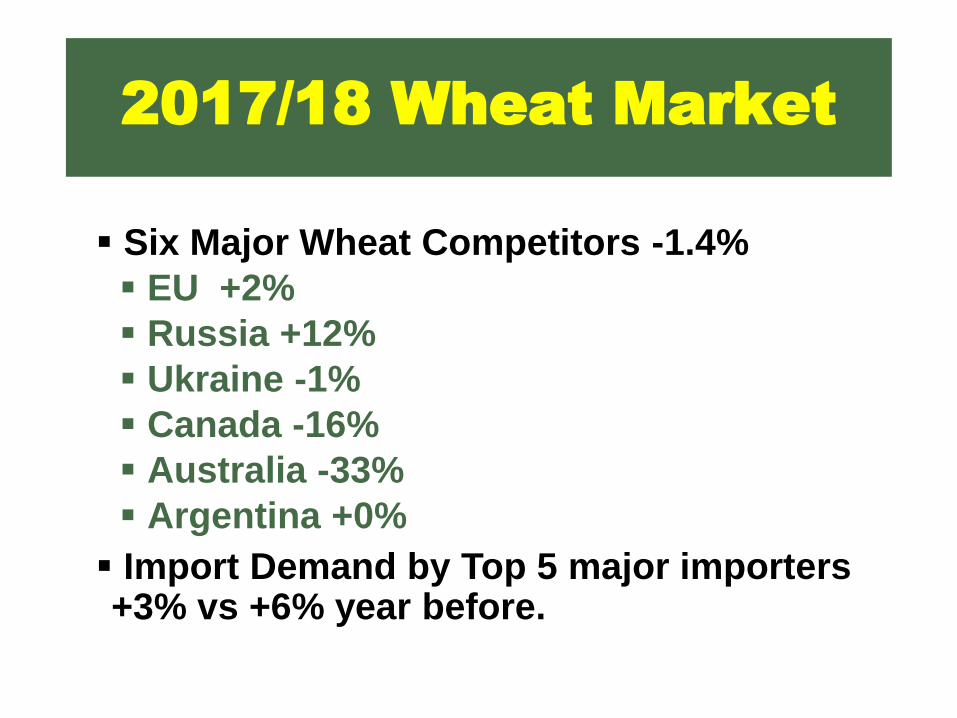
2017/18 Wheat Market
Six Major Wheat Competitors -1.4%
EU +2%
Russia +12%
Ukraine -1%
Canada -16%
Australia -33%
Argentina +0%
Import Demand by Top 5 major importers +3% vs +6% year before.
0.0
5.0
10.0
15.0
20.0
25.0
30.0
35.0
40.0
2008/09 2009/10 2010/11 2011/12 2012/13 2013/14 2014/15 2015/16 2016/17 2017/18580.0
600.0
620.0
640.0
660.0
680.0
700.0
720.0
740.0
760.0
780.0
Percent MMT
World Wheat Prod, Use, Stocks/Use
S/U ratio Use Prod
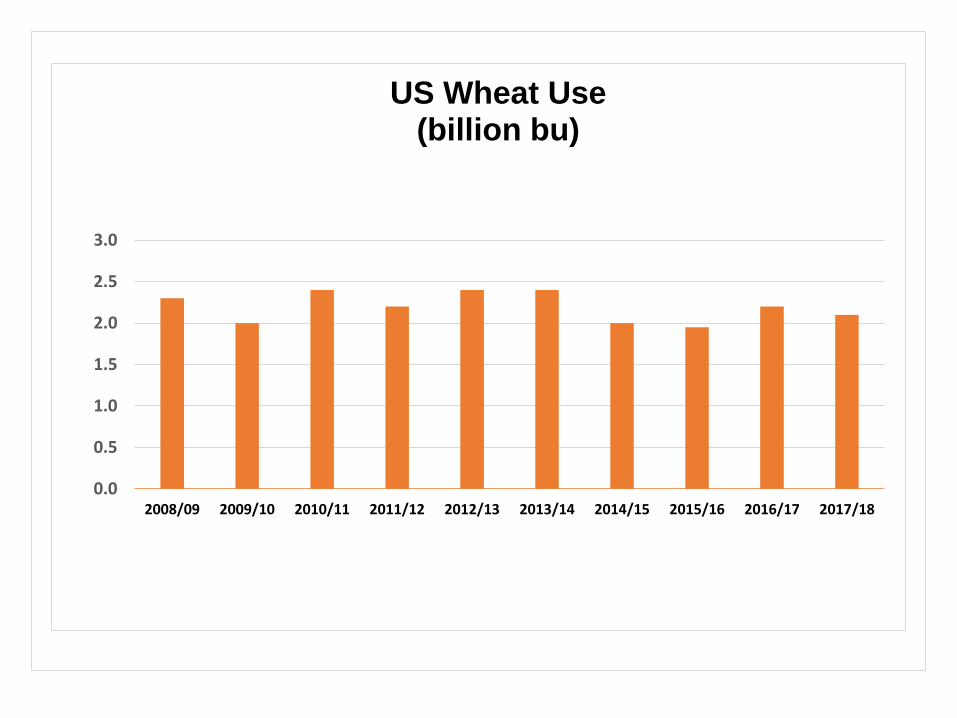
0.0
0.5
1.0
1.5
2.0
2.5
3.0
2008/09 2009/10 2010/11 2011/12 2012/13 2013/14 2014/15 2015/16 2016/17 2017/18
US Wheat Use(billion bu)
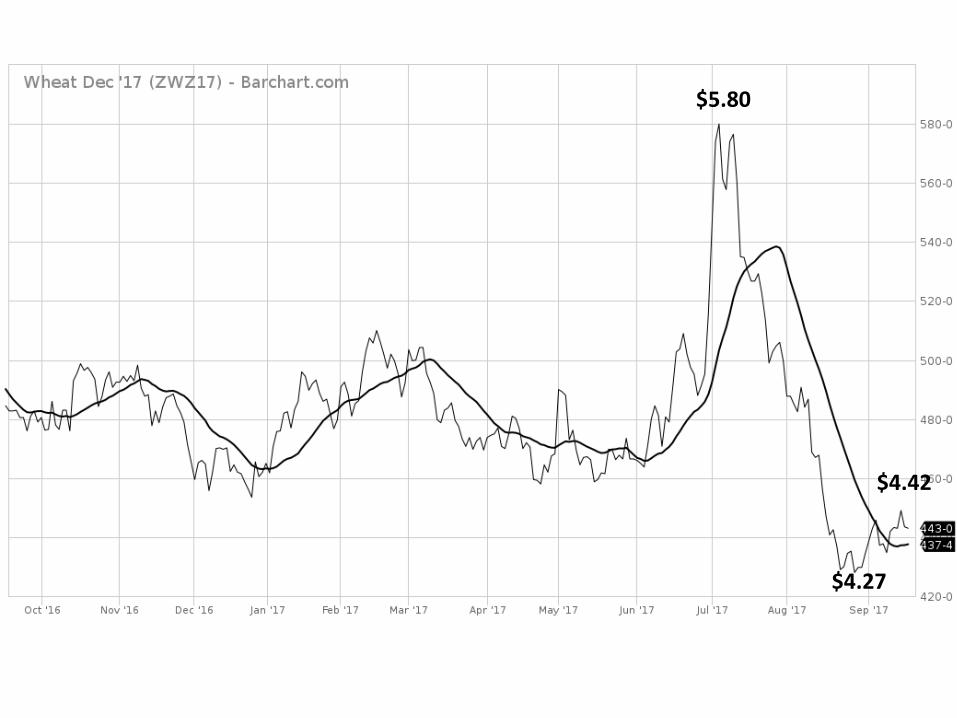
$5.80
$4.42
$4.27
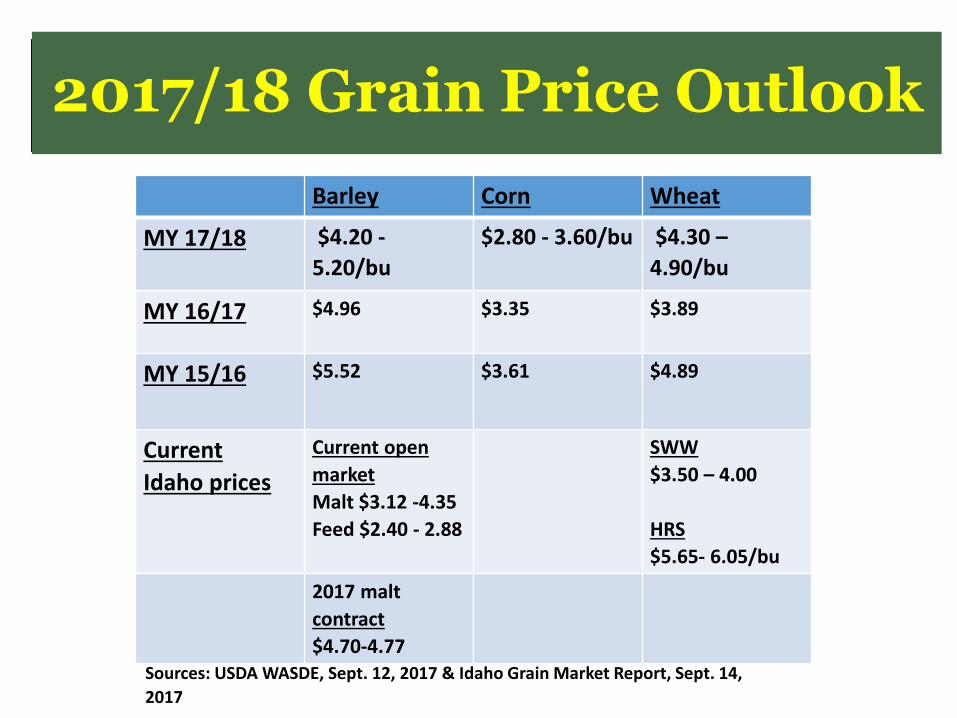
Grain Price Outlook2017/18 Grain Price Outlook
Barley Corn Wheat
MY 17/18 $4.20 -
5.20/bu
$2.80 - 3.60/bu $4.30 –
4.90/bu
MY 16/17 $4.96 $3.35 $3.89
MY 15/16 $5.52 $3.61 $4.89
Current
Idaho prices
Current open
market
Malt $3.12 -4.35
Feed $2.40 - 2.88
SWW
$3.50 – 4.00
HRS
$5.65- 6.05/bu
2017 malt
contract
$4.70-4.77Sources: USDA WASDE, Sept. 12, 2017 & Idaho Grain Market Report, Sept. 14,
2017
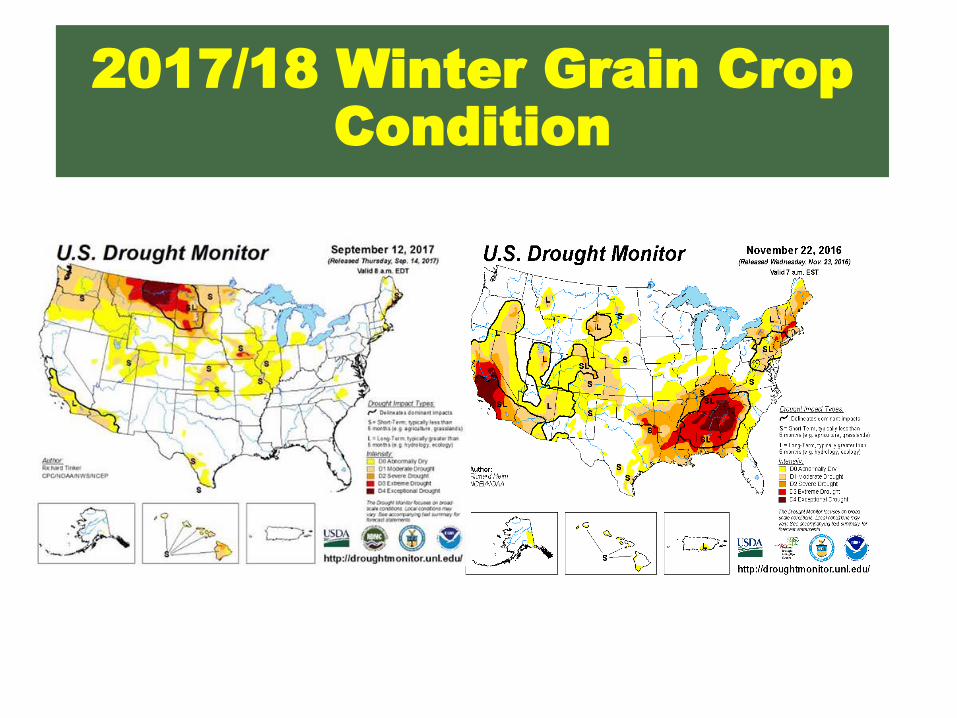
2017/18 Winter Grain Crop Condition
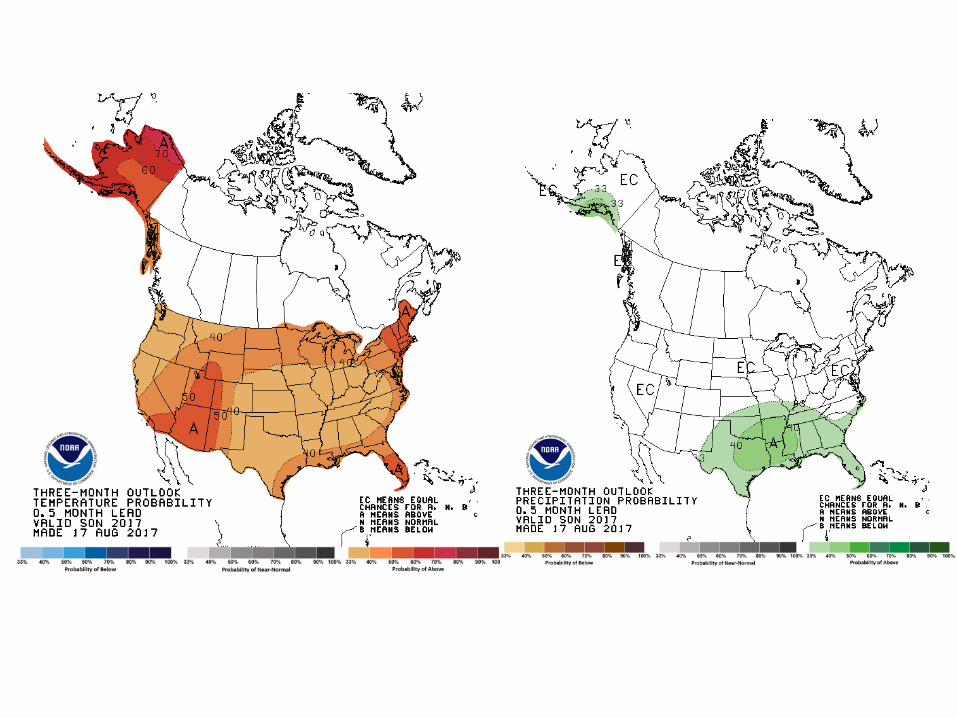
NWS BOISE
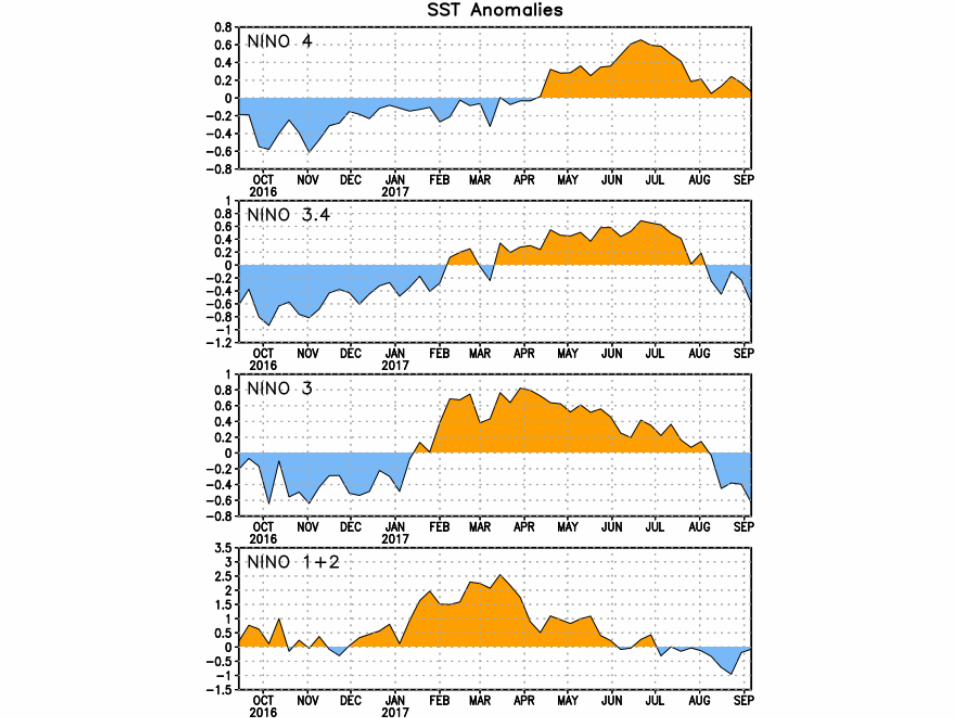
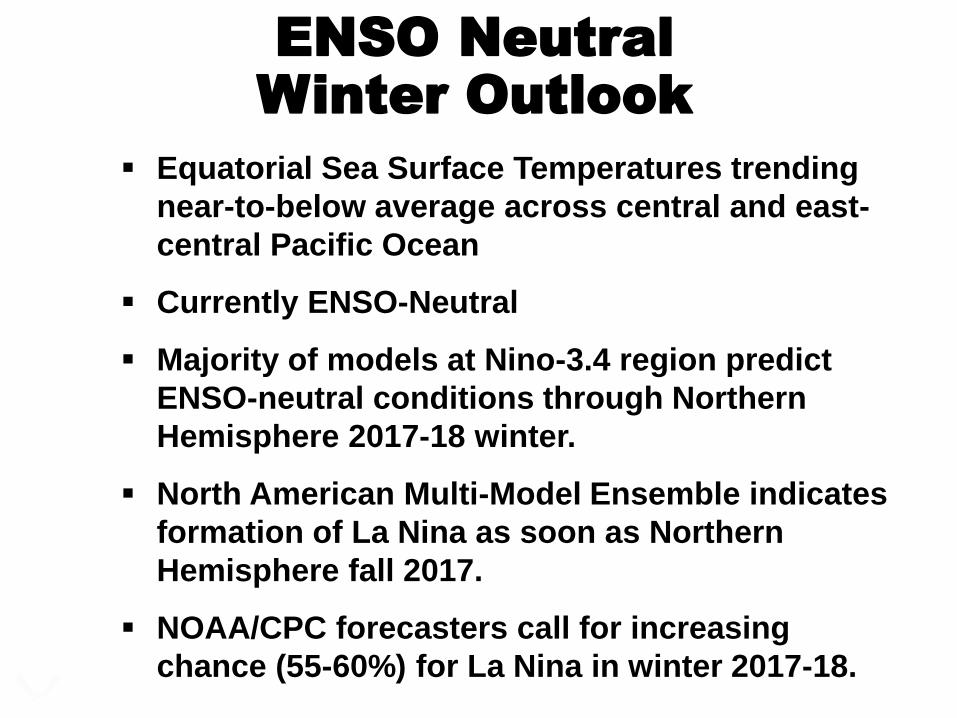
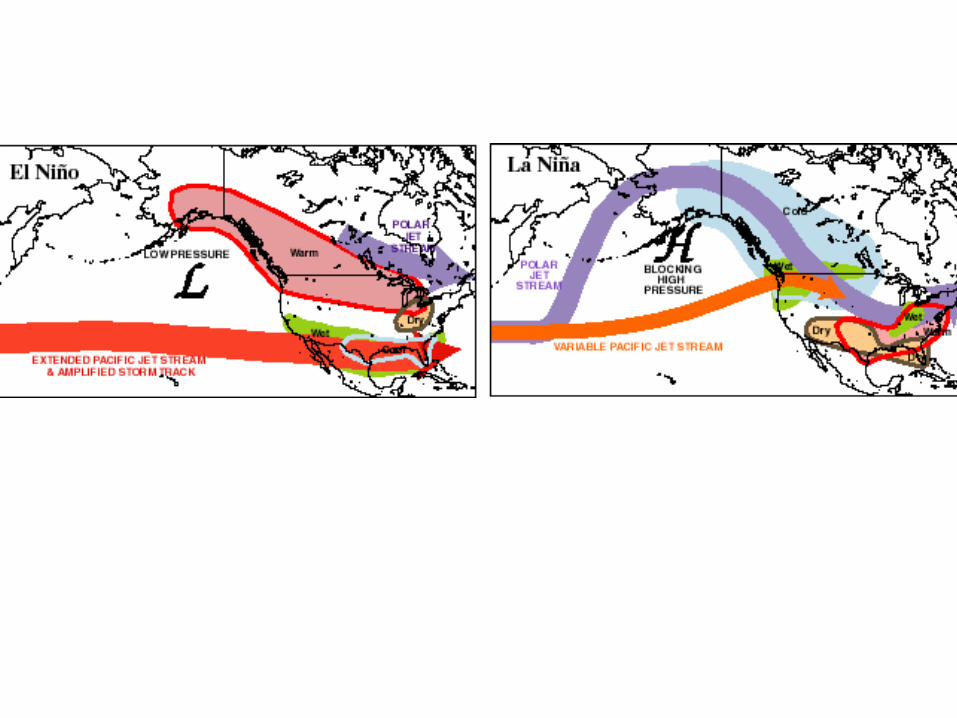
ENSO Neutral Winter Outlook
Equatorial Sea Surface Temperatures trending
near-to-below average across central and east-
central Pacific Ocean
Currently ENSO-Neutral
Majority of models at Nino-3.4 region predict
ENSO-neutral conditions through Northern
Hemisphere 2017-18 winter.
North American Multi-Model Ensemble indicates
formation of La Nina as soon as Northern
Hemisphere fall 2017.
NOAA/CPC forecasters call for increasing
chance (55-60%) for La Nina in winter 2017-18.
NWS BOISE
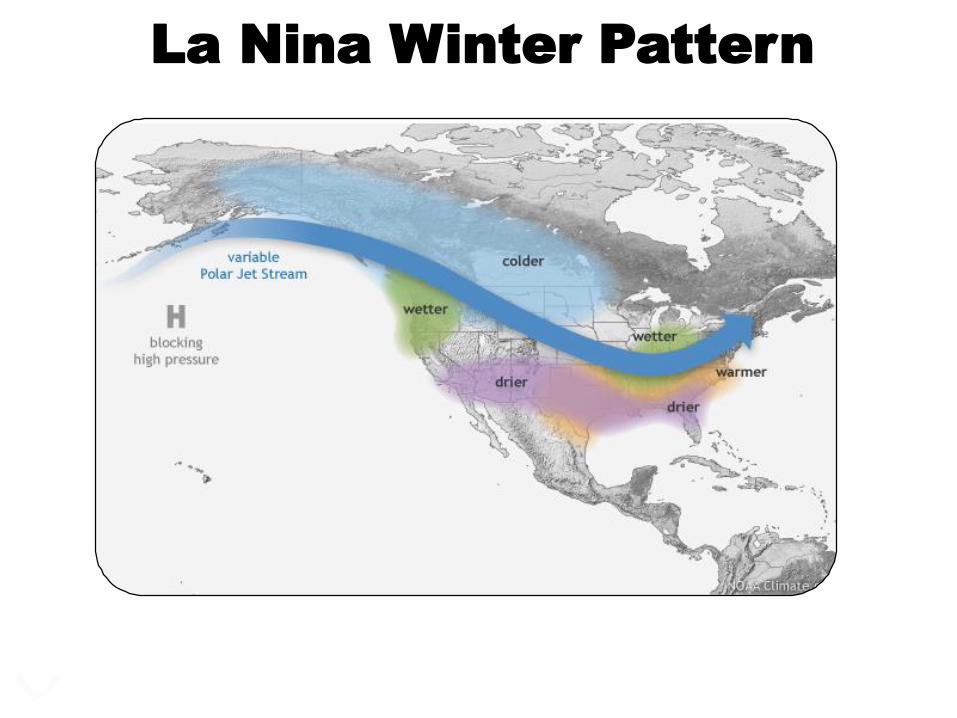
La Nina Winter Pattern


![TECHNICAL AND PARATECHNICAL SUPPORT POSITIONS ...appa.qc.ca/eng/pdf/ClasfSoutienAngloA[1].pdf · POSITIONS • ADMINISTRATIVE SUPPORT POSITIONS • LABOUR SUPPORT POSITIONS Management](https://img.dokumen.tips/doc/110x75/5f9b95c2bbb8722ae5540096/technical-and-paratechnical-support-positions-appaqccaengpdfclasfsoutienangloa1pdf.jpg)