Embed Size (px)
Citation preview

2017 Water Quality ReportWe met or surpassed all water quality requirements.
Our water is clean, safe, enjoyable, and affordable.
Our mission is to support public health and protect the environment.
Our vision is to achieve excellence and exceed customer expectations.
Annual Taste & Smell ChangesWater is safe despite natural, seasonal changes in aesthetics.
Timing: Spring through early summer.
Root Causes:Cold temperatures that last (Ex. Jan. 2018 storm/freeze).Certain harmless algae flourish, then smell/taste occurs when they decompose.
Rapid rise in temperature:Reservoir “flips” (cold water sinks, warm rises) and stirs up natural deposits.
Culprits: Harmless blue-green algae in Bushy Park Reservoir produce compounds that create earthy-musty taste and smell.GeosminFound in beets, providing their earthy flavor.Relatively easy to neutralize or remove from drinking water.MIB (2-Methylisoborneol)Difficult to neutralize or remove.
Detection:Our labGas chromatograph/mass spectrometer (GC/MS).Taste/sniff panel: Our noses are very well trained, often comparable to GC/MS results.CustomersSome people can detect beginning at 5 parts per trillion (ppt).Many people can detect at 15 ppt or above.
Our Remedy:Powdered activated carbonSame product in your water pitcher/refrigerator filter.We add it during the water treatment process.Absorbs odiferous compounds, then filtered out.Costly, but customer satisfaction is our priority.We begin to add carbon when treated water reaches 15 ppt for either compound, or when customer complaints become frequent.
Home Remedies:Refrigerate before consuming, or add ice.Use water pitchers or refrigerator filters with carbon filters.
Concerns:Customer Service: (843) 727-6800 І [email protected]
The sources of drinking water, both tap water and bottled water, include rivers, lakes, streams, ponds, reservoirs, springs, and wells.
As water travels over land and into waterways, it dissolves natural minerals and picks up substances from animals or human activity.
To protect public health, water treatment plants reduce contaminants to safe levels established by regulations.
Microbes, such as viruses and bacteria, may come from septic systems, livestock, pets and wildlife.
Organic compounds, including synthetic and volatile organics, which are by-products of industrial processes and petroleum production, can also come from gas stations, runoff, and septic systems.
Inorganic compounds, such as salts and metals, which can be naturally occurring or the result of storm water runoff, industrial or domestic wastewater discharges, oil and gas production, mining, or farming.
Radioactive compounds can be naturally occurring or the result of oil and gas production and mining activities.
Pesticides and herbicides may come from agriculture, runoff, and residential uses. NOTE: None were found in our source water or treated water when we tested for more than 250 of them in 2017. See website for complete list at www.charlestonwater.com
Possible Contaminants in Source Water
Water CharacteristicsThese parameters below affect aesthetics, such as taste, odor, hardness, etc. The EPA has established secondary standards for some of these parameters, which are recommended guidelines.
Parameter 2017 Average Highest Level Recommended by EPA
Chloride 16 ppm 250 ppmColor 2 PCU 15 PCUIron <0.10 ppm 0.3 ppmManganese <0.05 ppm 0.05 ppmTotal Dissolved Solids (TDS) 102 ppm 500 ppmSodium 11 ppm
No Standard
Alkalinity 29 ppmConductivity 186 umhos/cmHardness 56 ppm (3.27 gpg)Ortho-phosphate 1.1 ppmSilica 6.0 ppmTemperature 69.8˚F (21˚C)Abbreviations: ppm: Parts per million PCU: Platinum Cobalt Units gpg: Grains per gallon umhos/cm: Micromohs/cm
Message from the EPASome people may be more vulnerable to contaminants in drinking water than the general population. Immuno-compromised persons, such as persons with HIV/AIDS or other immune system disorders, persons with cancer undergoing chemotherapy, persons who have undergone organ transplants, some elderly and some infants can be particularly at risk from infections. These people should seek advice from their health care providers. EPA/CDC guidelines on appropriate means to lessen the risk of infection by Cryptosporidium and other microbial contaminants are available from the Safe Drinking Water Hotline (1-800-426-4791).
Our drinking water was tested more than 20,000 times for over 150 substances and parameters.
2017 Water Quality ResultsWe met or surpassed all water quality requirements.
DefinitionsMaximum Contaminant Level Goal (MCLG) The level of a contaminant in drinking water below which there is no known or expected risk to health. MCLGs allow for a margin of safety.
Maximum Contaminant Level (MCL) The highest level of a contaminant that is allowed in drinking water. MCLs are set as close to the MCLGs as feasible using the best available treatment technology.
Action Level (AL)
The concentration of a contaminant, which, if exceeded, triggers treatment or other requirements that a water system must follow.
Treatment Technique (TT) A required process intended to reduce the level of a contaminant in drinking water.Maximum Residual Disinfectant Level (MRDL)
The highest level of disinfectant allowed in drinking water. There is convincing evidence that addition of a disinfectant is necessary for control of microbial contaminants.
Maximum Residual Disinfectant Level Goal (MRDLG) The level of a drinking water disinfectant below which there is no known or expected risk to health. MRDLGs do not reflect the benefits of the use of disinfectants to control microbial contamination.
Constituent Maximum Contaminant Level (MCL) set by EPA Maximum Contaminant Level Goal (MCLG) Actual Level in 2017 Possible Sources in WaterRequired ReportingTurbidityA measure of the amount of suspended particles in the water (cloudiness); an indicator of overall water quality and filtration effectiveness.
Requires a specific treatment technique; 95% of monthly samples must be less than 0.3 NTU N/A
0.12 NTU Highest level detected100% of monthly samples met the limit
Range: 0.05 - 0.12Soil runoff
CryptosporidiumA parasite spread through human and animal waste that causes gastrointestinal illness.
None Zero Cryptosporidium oocysts per 1 liter of water
Zero Cryptosporidium oocysts per 1 liter of water Human and animal sources
GiardiaA parasite spread through human and animal waste that causes gastrointestinal illness. None Zero Giardia cysts
per 1 liter of waterZero Giardia cysts per 1 liter of water Human and animal sources
Detected in Our Water Only compounds listed in this table were found in our water, and all were detected at levels below the regulatory limit.CopperA metal widely used in household plumbing that may corrode into water.
90th percentile of all samples collected must be less than the 1.3 ppm action level 1.3 ppm
0.06 ppm* (No samples exceeded the action level)
Range: 0 to 0.12 ppmCorrosion of household plumbing materials
LeadA metal no longer used in water pipes, but may be present in plumbing fixtures or old pipes; may corrode into water.
90th percentile of all samples collected must be less than the 15 ppb action level 0 ppb
90th percentile = 1.3 ppb* (No samples exceeded the action level)
Range: 0 to 3.1 ppbCorrosion of household plumbing materials
Nitrate/NitriteNitrates and nitrites are nitrogen-oxygen compounds that can become a source of pollution in the form of unwanted nutrients.
10 ppm 10 ppm 0.10 ppm Runoff from fertilizers
FluorideA substance that is naturally occurring in some water sources, particularly groundwater. It is also added to drinking water to help prevent tooth decay.
4 ppm 4 ppm0.14 ppm in source water
0.61 ppm in finished waterRange <0.10 to 0.61 ppm
Naturally occurring in source water and adjusted during treatment to prevent tooth decay.
Chlorine DioxideA disinfection agent added in small amounts to protect against microbes.
800 ppb 800 ppb 100 ppbRange: 0 to 100 ppb Added for disinfection
Chloramine ResidualA compound of chlorine and ammonia added in small amounts to treated water to protect against microbes.
4 ppm MRDL 4 ppm MRDLG 2.63 ppm Running Annual AverageRange: 2.2 – 3.0 ppm Added for disinfection
Total Trihalomethanes (Stage 2)Stage 2 of the Disinfectants and Disinfection Byproducts Rule requires the locational running annual average (LRAA) for each sampling location to be below the MCL. CWS has eight sampling locations.
Locational Running Annual Average must be below 80 ppb N/A Highest level detected: 22.46 ppb
Range: 3.55 – 22.46 ppb Byproduct of disinfection
Total Haloacetic Acids (Stage 2) Stage 2 of the Disinfectants and Disinfection Byproducts Rule requires the locational running annual average (LRAA) for each sampling location to be below the MCL. CWS has eight sampling locations.
Locational Running Annual Average must be below 60 ppb N/A Highest level detected: 31.11 ppb
Range: 6.37 – 31.11 ppb Byproduct of disinfection
ChloriteA byproduct formed when chlorine dioxide is used to disinfect water.
1 ppm 1.0 ppm Highest level detected: 1.0 ppmRange: 0.13 – 1.0 ppm Byproduct of disinfection
Total Organic Carbon (TOC)The measure of organic substances in a body of water, mostly from naturally occurring sources such as plant material. TOC provides a measurement for the potential formation of disinfection byproducts.
No MCL; EPA requires a specific treatment technique. Required % removal varies from 35% - 55% TOC removal, depending on
source water quality
Removal ratio RAA = 1.39Removal Range: 54% to 63.9%
60.5 % removedNaturally present in the environment
Total Coliform BacteriaA group of bacteria whose presence in water indicates possible contamination with soil or waste from warm blooded animals.
Presence of coliform bacteria greater than or equal to 5% of monthly samples 0%
1.9% highest % of positive monthly samplesRange: 0 – 1.9%
All repeat samples were satisfactoryNaturally present in the environment
*Results are from 2015. EPA requires testing for copper and lead once every three years. Visit the Water Quality Reports page on our website for complete test results that include the compounds NOT detected in our water.
Abbreviations: ppm: Parts per million (mg/L) ppb: Parts per billion (ug/L) LRAA: Locational Running Annual Average RAA: Running Annual Average NTU: Nephelometric Turbidity Units
Inor
ganic
Com
poun
dsDi
sinfec
tant
sDi
sinfec
tion B
ypro
ducts
Orga
nic Co
mpo
unds
/ Ba
cteria
Published June, 2018Designed by Julie Larson
The Bushy Park Reservoir, our primary water source.
Source Water ProtectionTo raise awareness about preventing water pollution, SC DHEC identifies potential sources of contamination for each drinking water source in the state. www.scdhec.gov/HomeAndEnvironment/Water/SourceWaterProtection/
How You Can HelpStormwater runoff pollutes local waterways.
• Pick up the poop! Pet waste adds bacteria and excess nutrients, which contribute to algae growth that chokes out plants and wildlife.
• Don’t over-fertilize your lawn. It washes into storm drains, streams, rivers and oceans.• No dumping in storm drains. They empty directly into a waterway. • Proper disposal of oils, paints, and other chemicals.
Service InterruptionsWater Outage NotificationWe always notify impacted customers before we work on water mains. We knock on doors, use door hangers, post signs in neighborhoods, or use out-call technology. Major outages are posted on our homepage, social media channels our automated phone system at (843) 727-6800, and shared with media when appropriate.
Water Main Repairs · Most take a few hours. · Planned repairs and maintenance are scheduled during off-peak water demand.
Discolored WaterIt’s not harmful, just let your cold water faucet run until clear.You may have it when we work on a water main in your area. Mineral deposits build up on pipe walls can dislodge and dissolve when pressure changes. We do our very best to prevent it by flushing the system via nearby fire hydrants, which also scours away mineral deposits.
Boil Water AdvisoriesA precautionary measure advising people to boil tap water before use.They’re issued after an event that could allow bacteria to enter the water distribution system, such as a large water main break, a widespread loss of system pressure, or a natural disaster.It takes at least 16 hours to get bacteria test results back, so a boil water advisory is issued until test results say the water is safe. Boiling water for at least one minute kills any bacteria present.We post info on our website, Twitter, Facebook, phone system, we make out-dial phone calls and use electronic sign boards - all in addition to notifying news media.We rarely issue boil water advisories because our crews quickly isolate broken water mains by closing valves, fixing, flushing, and disinfecting the pipe before putting it back into service. This prevents contamination from soil and bacteria, which is why boil water advisories are not issued after routine water main repairs.
Quick Facts: Million Gallons a Day (MGD)
58 MGDAverage volume of treated water
96 MGDWinter Storm Grayson (Jan., 2018)
Extended freeze. Many broken water mains.
105.5 MGDRecord volume (Dec., 1989)
Extended freeze. Many broken water mains.
115.4 MGDSC DHEC permitted volume
Fluoride Position StatementAdopted by the Board of Commissioners October 24, 2017
The Charleston Water System (CWS) supports the recommendations of the World Health Organization, American Medical Association, Canadian Medical Association, Centers for Disease Control and Prevention (CDC), American Dental Association, Canadian Dental Association, South Carolina Dental Association and other professional organizations in the medical community, for the proper fluoridation of public water supplies as a public health benefit. We also support regular scrutiny of the most current peer reviewed research on fluoride and the positions of the medical and dental community.
We adjust the naturally occurring level of fluoride in our drinking water in a responsible, effective, and reliable manner that includes monitoring and controlling fluoride levels as mandated by state and/or federal laws, regulations and recommendations. We carefully monitor and adjust potable water to achieve the scientifically recommended concentration of fluoride for protection against dental caries, which is 0.7 parts per million. Our annual cost for this program is about $110,000, which equates to $0.25 per person across the approximately 450,000 people in our water service area.
The CWS participates in the fluoridation of water under the guidance of the South Carolina Department of Health and Environmental Control (SCDHEC), Oral Health Division. SCDHEC coordinates their program in conjunction with the CDC and the U.S. Department of Health and Human Services.
If there are questions regarding these programs, please contact:SCDHECDivision of Oral Health2100 Bull Street, Columbia, S.C. 29201P: (803) 898-9577F: (803) 898-2065
JBC
Joint Base Charleston
(JBC)
Mount Pleasant
Folly Beach
Seabrook Island
Kiaiwah Island
Sullivan’s Island
Isle of Palms
Dorchester County
Century Aluminum
Dorchester County
Johns Island
Charleston
Daniel IslandNorth Charleston
James Island
Ravenel
Hollywood
Meggett
Ladson
Hanahan
Goose Creek
Cainhoy
Retail Service
Wholesale Service
Hanahan Water Treatment Plant
Service AreaWater
facebook.com/charlestonwater
@ChasWaterSystem
Speakers BureauTopics tailored for your school or community group.Questions/additional copies: Communications Manager: (843) 727-7146En español:Este informe contiene información muy importante sobre su agua beber. Tradúzcalo ó hable con alguien que lo entienda bien.
Charleston Water SystemWe’re a publicly owned water and wastewater utility. We provide clean drinking water to more than 450,000 people in the greater Charleston area, including direct retail service to 120,000 homes and businesses and wholesale water service to neighboring utilities and municipalities. Our public water system identification number is 1010001.
Youtube.com/CharlestonWater*Our water treatment video is awesome!
*Position statement for unregulated contaminants coming soon.
Alum(Coagulants)
Lime(pH Adjustment)
Chlorine
Chlorine Dioxide(disinfectant)
Chlorine Dioxide(disinfectant)
Fluoride (dental health)
Orthophosphate(lead & copper control)
Coagulation/Flocculation
Water AnthraciteSandGravel
Finished Drinking Water
Powdered activated carbon(taste & smell control)
Enters HWTP
Exits HWTP
Polymer(�oc aid)
Homes
Businesses
Edisto River
Chloramine (disinfectant)
Sedimentation
Clear Wells
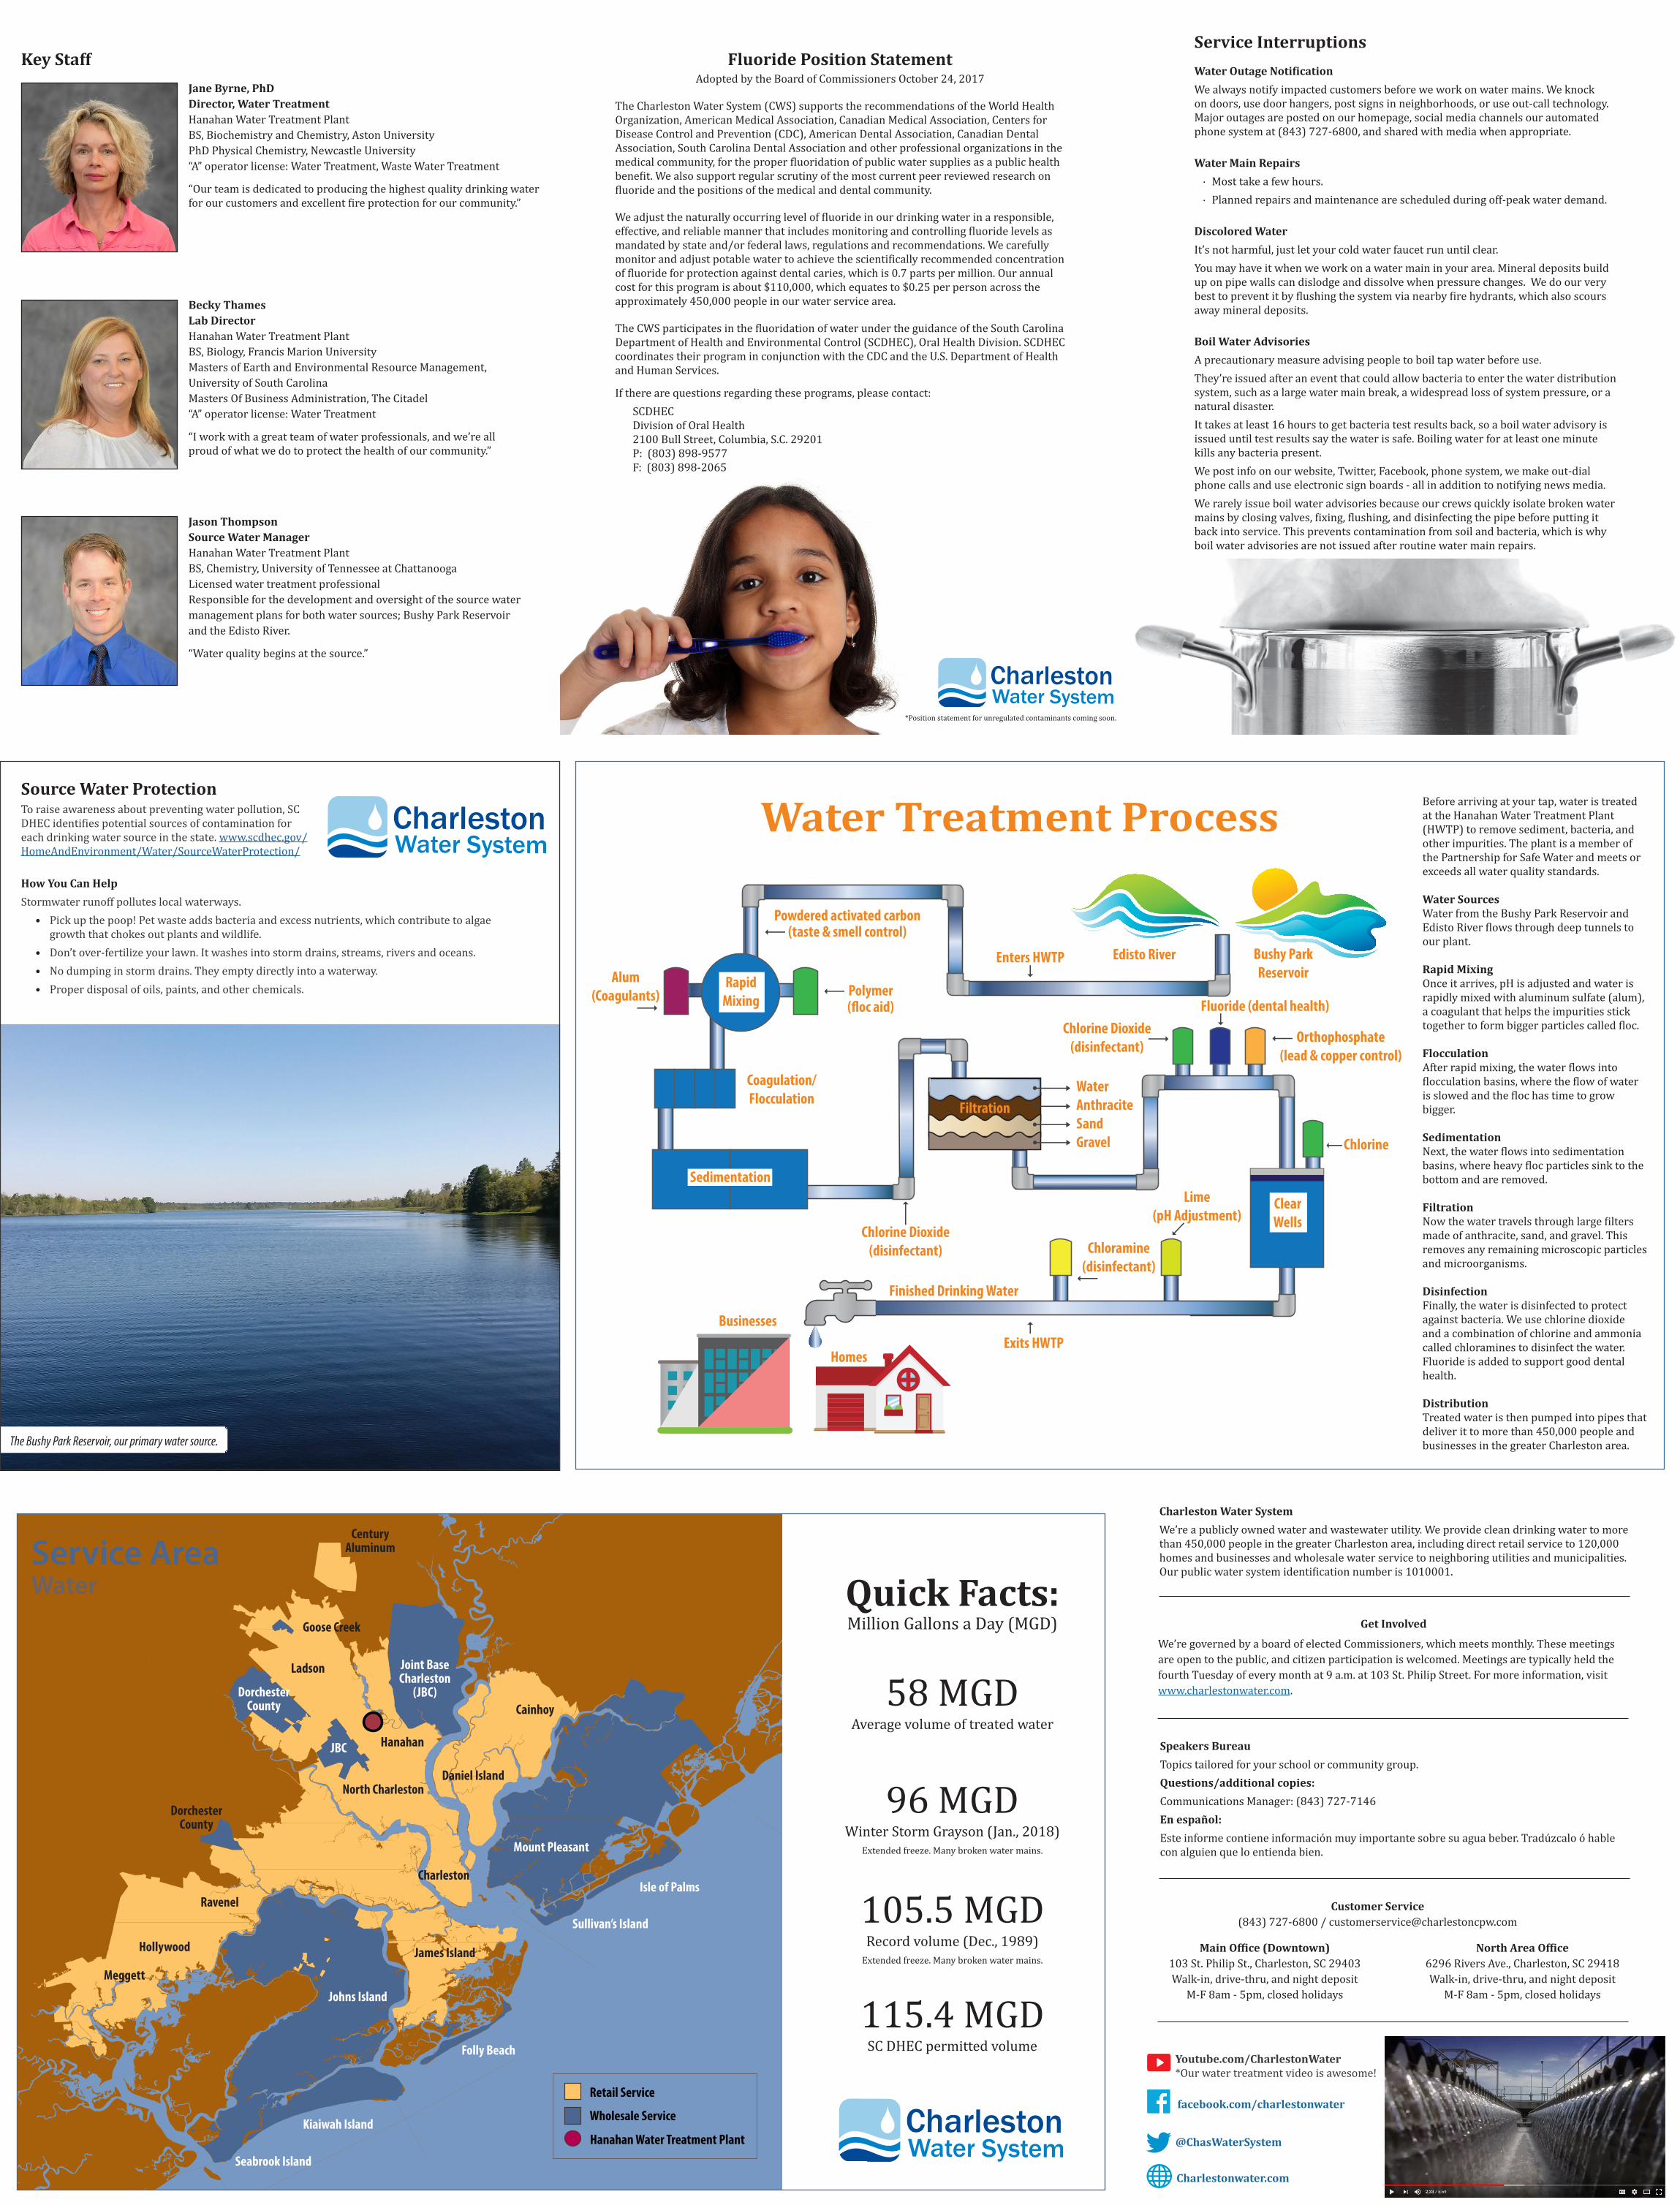
Water Treatment Process
Bushy Park Reservoir
Filtration
Before arriving at your tap, water is treated at the Hanahan Water Treatment Plant (HWTP) to remove sediment, bacteria, and other impurities. The plant is a member of the Partnership for Safe Water and meets or exceeds all water quality standards.
Water SourcesWater from the Bushy Park Reservoir and Edisto River flows through deep tunnels to our plant.
Rapid MixingOnce it arrives, pH is adjusted and water is rapidly mixed with aluminum sulfate (alum), a coagulant that helps the impurities stick together to form bigger particles called floc.
FlocculationAfter rapid mixing, the water flows into flocculation basins, where the flow of water is slowed and the floc has time to grow bigger.
SedimentationNext, the water flows into sedimentation basins, where heavy floc particles sink to the bottom and are removed.
FiltrationNow the water travels through large filters made of anthracite, sand, and gravel. This removes any remaining microscopic particles and microorganisms.
DisinfectionFinally, the water is disinfected to protect against bacteria. We use chlorine dioxide and a combination of chlorine and ammonia called chloramines to disinfect the water. Fluoride is added to support good dental health.
DistributionTreated water is then pumped into pipes that deliver it to more than 450,000 people and businesses in the greater Charleston area.
Customer Service(843) 727-6800 / [email protected]
North Area Office6296 Rivers Ave., Charleston, SC 29418Walk-in, drive-thru, and night deposit
M-F 8am - 5pm, closed holidays
Main Office (Downtown)103 St. Philip St., Charleston, SC 29403Walk-in, drive-thru, and night deposit
M-F 8am - 5pm, closed holidays
Get Involved
We’re governed by a board of elected Commissioners, which meets monthly. These meetings are open to the public, and citizen participation is welcomed. Meetings are typically held the fourth Tuesday of every month at 9 a.m. at 103 St. Philip Street. For more information, visit www.charlestonwater.com.
Key Staff
Charlestonwater.com
Becky ThamesLab DirectorHanahan Water Treatment Plant BS, Biology, Francis Marion UniversityMasters of Earth and Environmental Resource Management, University of South CarolinaMasters Of Business Administration, The Citadel“A” operator license: Water Treatment
“I work with a great team of water professionals, and we’re all proud of what we do to protect the health of our community.”
Jane Byrne, PhDDirector, Water TreatmentHanahan Water Treatment Plant BS, Biochemistry and Chemistry, Aston UniversityPhD Physical Chemistry, Newcastle University“A” operator license: Water Treatment, Waste Water Treatment
“Our team is dedicated to producing the highest quality drinking water for our customers and excellent fire protection for our community.”
Jason ThompsonSource Water ManagerHanahan Water Treatment Plant BS, Chemistry, University of Tennessee at ChattanoogaLicensed water treatment professionalResponsible for the development and oversight of the source water management plans for both water sources; Bushy Park Reservoir and the Edisto River.
“Water quality begins at the source.”