Embed Size (px)
Citation preview

2017 Supportive
Housing Working
Group Illinois Housing Task Force
Report on activities and recommendations
January 2017

2017 Supportive Housing Working Group
SHWG 1
Executive Summary
While the State, primarily the Illinois Housing Development Authority (IHDA), has funded permanent
supportive housing (PSH) since the late 1980s, there has been a major focus since 2003 on the need for
development, operating costs (including rental assistance), and services funding to be coordinated to
ensure the success of PSH over the long term. Earlier PSH funding concentrated on homeless and
related special needs populations. Also during that time, Illinois carried out major efforts to rebalance
long-term care, especially for persons with disabilities.
PSH is a combination of affordable housing and supportive services designed to help vulnerable
individuals and families attain stable housing and use it as a platform for health, recovery, and
personal growth. Federal agencies including the Center for Medicare and Medicaid Services and the
U.S. Department of Housing and Urban Development (HUD) have recognized the importance of PSH
as a tool to comply with the United States Supreme Court decision in Olmstead v. L.C. The State of
Illinois has also made PSH a priority tool to rebalance the long term care expenses in Medicaid and as
part of the settlement of three Olmstead-based lawsuits: Colbert v. Rauner, Williams v. Rauner, and
Ligas v. Norwood.
Despite this momentum, Illinois still has an unmet need for PSH. The Supportive Housing Working
Group estimates that the State needs twice as many units as it currently has to have enough physical
infrastructure (typically scattered-site and apartment units) to house every eligible individual that is
currently in need. There is an even greater need to preserve and increase capacity for supportive services
and rental assistance infrastructure at existing PSH properties.
The Illinois Housing Task Force, having last released a Supportive Housing Working Group report in
2008, decided to re-establish the Working Group to produce a new report that reflects the environment
in 2016.
As such, this report defines PSH, provides information on current inventory and unmet need,
compares PSH versus institutional costs, identifies potential resources to create PSH, and proposes
production goals as well as strategies to improve PSH.

2017 Supportive Housing Working Group
SHWG 2
Acknowledgements Special thanks to the Supportive Housing Working Group members who participated in the creation of
the report. This report is the result of everyone’s knowledge, skills, and hard work.
Name Organization
Adam Ballard Access Living
Marca Bristo Access Living
Wayne Smallwood Affordable Assisted Living Coalition
Robert Vickery Aftercare Services Division, Department of Juvenile Justice (IDJJ)
Arturo Bendixen AIDS Foundation of Chicago
Jennifer Hill Alliance to End Homelessness in Suburban Cook County
David Brint Brinshore Development
Dawni Freeman Brinshore Development
Katie Tuten Catholic Charities
Martha McCauley City of Chicago Department of Family and Support Services
Tracy Sanchez City of Chicago Department of Planning and Development
Cary Steinbuck City of Chicago Department of Planning and Development
Betsy Benito Corporation for Supportive Housing
Shelly Perkins DeKalb County Housing Authority
Angelia Smith Ford Heights Community Service Organization
Michael Goldberg Heartland Housing
Lisa Kuklinski Heartland Housing
Deborah Grant Illinois Department of Public Health (DPH)
Alesia Hushaw Housing Authority of Cook County (HACC)
Richard Monocchio Housing Authority of Cook County (HACC)
Samantha Olds Frey Illinois Association of Medicaid Health Providers (IAMHP)
Lee Ann Osipchak Illinois Collaboration on Youth (ICOY)
Sheila Romano Illinois Council on Developmental Disabilities (ICDD)
John Cheney-Egan Illinois Department of Children and Family Services (DCFS)
Xadrian McCraven Illinois Department of Corrections (DOC)
Edward Ortega Illinois Department of Corrections (DOC)
Jean Summerfield Illinois Department of Healthcare and Family Services (DHFS)
Lore Baker Illinois Department of Human Services (DHS)
Jamie Ewing Illinois Department of Human Services (DHS)

2017 Supportive Housing Working Group
SHWG 3
The Illinois Housing Development Authority, primarily via the Office of Housing Coordination Services
(OHCS), served as staff to the Supportive Housing Working Group and participated in the drafting of this
report.
Name Organization
Dave Adden Division of Developmental Disabilities (DD), IDHS
Reta Hoskin Division of Developmental Disabilities (DD), IDHS
James Johnson III Division of Family and Community Services (DFCS), IDHS
Donna O'Connor Williams Consent Decree, Division of Mental Health (DMH), IDHS
Brenda Hampton Williams Consent Decree, Division of Mental Health (DMH), IDHS
Lou Hamer Division of Rehabilitation Services (DRS), IDHS
Emanuel Johnson Illinois Department of Veterans' Affairs (IDVA)
Evan Chears Illinois Department on Aging (DoA)
Pamela Orr Illinois Department on Aging (DoA)
Dena Bell Illinois Facilities Fund (IFF)
Andrea Traudt Inouye Illinois Housing Council (IHC)
Michael Wallace Illinois Joining Forces (IJF)
Mark Angelini Mercy Housing Lakefront
Nancy Firfer Metropolitan Planning Council (MPC)
King Harris Metropolitan Planning Council (MPC)
Marisa Novara Metropolitan Planning Council (MPC)
Camille Dorris Southern Illinois Coalition for the Homeless
Brenda Bruner Springfield Housing Authority
Jackie Newman Springfield Housing Authority
David Rosa St. Leonard's Ministries
Dave Lowitzki Supportive Housing Providers Association (SHPA)
David Esposito Thresholds
Jeremy Yost Yost Management

2017 Supportive Housing Working Group
SHWG 4
Table of Contents
Executive Summary ................................................................................................................................................1
Acknowledgements ................................................................................................................................................2
Permanent Supportive Housing: What it is and Who it Serves .....................................................................5
Defining Permanent Supportive Housing .......................................................................................................5
Defining Supportive Housing Populations .....................................................................................................5
Current Inventory ...................................................................................................................................................9
Permanent Supportive Housing ........................................................................................................................9
Other Types of Housing with Supportive Services ......................................................................................10
The Unmet Need for Permanent Supportive Housing ..................................................................................12
Keeping Unmet Need in Perspective ..............................................................................................................14
Comparing Operating Costs: Permanent Supportive Housing vs. Institutions .......................................16
Total Costs of Permanent Supportive Housing .............................................................................................16
Total Costs for Institutionalization .................................................................................................................19
Production Goals for Permanent Supportive Housing .................................................................................24
The Five-Year Production Goal .......................................................................................................................24
Potential resources to create PSH ....................................................................................................................26
Strategies for Improving Permanent Supportive Housing ..........................................................................29
APPENDIX I: Methodology for Inventory and Unmet Need, Key Terms .................................................38
APPENDIX II: ACRONYMS ..............................................................................................................................46
APPENDIX III: SUMMARY OF PUBLIC HOUSING AUTHORITIES SURVEY RESULTS ................47
APPENDIX IV: POSSIBLE PSH RESOURCES, FULL CHARTS ................................................................48
APPENDIX V: WORKS CITED .........................................................................................................................49

2017 Supportive Housing Working Group
SHWG 5
Permanent Supportive Housing: What it is and Who it Serves
The concept of permanent supportive housing (PSH) was originally developed by advocates and
providers serving homeless populations and now receives significant federal funding from HUD for
special needs populations. The success of the PSH model is well-documented through formal research,
and as a result the types of special needs populations proven to benefit from PSH have expanded.
Thus, the Working Group’s members sought to establish definitions of key terminology to make clear
what the group considered PSH to be and which populations could benefit from PSH.
Defining Permanent Supportive Housing
PSH is for people who need supportive services to access and maintain affordable housing, are
experiencing or at risk of homelessness, are living with disabilities, and/or are experiencing or at risk of
institutionalization.
HOUSING:
• Permanent (not time-limited, not transitional);
• Affordable (typically rent-subsidized or otherwise targeted to the extremely-low-income who make 30% of the area’s median income or below); and
• Independent (tenant holds the lease with normal rights and responsibilities).
SERVICES:
• Flexible (responsive to tenants’ needs and desires);
• Voluntary (participation is not a condition of tenancy); and
• Sustainable (focus of services is on maintaining housing stability and good health).
Defining Supportive Housing Populations
The need for a disabling condition is the underlying factor for PSH. Below is a comprehensive list of
populations in Illinois who can benefit from PSH:
People experiencing chronic homelessness:
• “An individual or family which is homeless and resides in a place not meant for human habitation, a safe haven, or in an emergency shelter, and has been homeless and residing in such a place.
• For at least one year or on at least four separate occasions in the last three years for a total of one year.

2017 Supportive Housing Working Group
SHWG 6
• The individual or family must also have a head of household with a diagnosable substance use disorder, serious mental illness, developmental disability, post-traumatic stress disorder, cognitive impairments resulting from a brain injury, or chronic physical illness or disability.”1
People experiencing homelessness:
• “Individuals and families who lack a fixed, regular, and adequate nighttime residence or an individual who resided in an emergency shelter, a place not meant for human habitation or who is exiting an institution where he or she temporarily resided;
• Individuals and families who will imminently lose their primary nighttime residence;
• Unaccompanied youth and families with children and youth who are defined as homeless under other federal statutes who do not otherwise qualify as homeless under this definition; and
• Individuals and families who are fleeing, or are attempting to flee, domestic violence, dating violence, sexual assault, stalking, or other dangerous or life-threatening conditions that relate to violence against the individual or a family member.”2
Persons at risk of homelessness:
• “Any individual or family that has income below 30 percent of median income for the geographic area;
• Has insufficient resources immediately available to attain housing stability; and
• (i) Has moved frequently because of economic reasons; (ii) is living in the home of another because of economic hardship; (iii) has been notified that their right to occupy their current housing or living situation will be terminated; (iv) lives in a hotel or motel; (v) lives in severely overcrowded housing; (vi) is exiting an institution; or (vii) otherwise lives in housing that has characteristics associated with instability and an increased risk of homelessness.”3
Persons affected by HIV/AIDS (experiencing or at-risk-of homelessness);
Youth experiencing or at-risk of homelessness:
• Individuals 18 years or younger that participate in youth aging out of the Department for Children
and Family Services (DCFS) child welfare programs and
• Individuals 25 years or younger that participate in homeless youth programs.
Veterans (experiencing or at risk of homelessness);
1 The Homeless Emergency Assistance and Rapid Transition to Housing (HEARTH) Act. 2009. The McKinney-Vento Homeless Assistance Act as amended by S. 896. Sec. 103 [42 USC 11302]. General definition of homelessness individual. Retrieved online, https://www.hudexchange.info/resources/documents/HomelessAssistanceActAmendedbyHEARTH.pdf 2 The Homeless Emergency Assistance and Rapid Transition to Housing (HEARTH) Act. 2009. The McKinney-Vento Homeless Assistance Act as amended by S. 896. Sec. 103 [42 USC 11302]. General definition of homelessness individual. Retrieved online, https://www.hudexchange.info/resources/documents/HomelessAssistanceActAmendedbyHEARTH.pdf 3 Ibid 2
2017 Supportive Housing Working Group
SHWG 7
The State of Illinois has been implementing transition responses to three American Disabilities
Act (ADA)/Olmstead-related court consent decrees, per the following:
• Colbert consent decree class members: “All Medicaid-eligible adults with disabilities, who are being, or may in the future be, unnecessarily confined to Nursing Facilities located in Cook County, Illinois, and who with appropriate supports and services may be able to live in a Community-Based Setting.”4
• Williams consent decree class members: “All Illinois residents who are eighteen (18) years old or older and who: have a Mental Illness; are institutionalized in a privately owned Institute for Mental Diseases; and, with appropriate supports and services, may be able to live in an integrated community setting .”5 ;
• Ligas consent decree class members: “Adult individuals in Illinois with developmental disabilities who qualify for Medicaid Waiver services, who reside in [Intermediate Care Facilities for Developmental Disabilities] ICF/DD with nine or more residents or live in family homes, and who affirmatively request to receive Community-Based Services or placement in a Community-Based Setting.”6
Other persons with disabilities who are inappropriately institutionalized: On June 22, 1999, the
United States Supreme Court held in Olmstead v. L.C. that unjustified segregation of persons with
disabilities constitutes discrimination in violation of Title II of the Americans with Disabilities Act. The
Court held that people with disabilities have a right to receive State-funded supports and services in the
community rather than institutions.
Other persons with physical, mental, or developmental disabilities not a part of the three
consent decree classes described above:
• Serious Mental Illness (SMI): SMI includes a list of mood and schizophrenic disorders, along with other qualifying items, in order to be treated by DHS-Division of Mental Health (DMH).7
• Disability: a physical or mental impairment that substantially limits one or more major life activities of such individual; a record of such an impairment; or being regarded as having such an impairment. Major life activities include but are not limited to, caring for oneself, performing manual tasks, seeing, hearing, eating, sleeping, walking, standing, lifting, bending, speaking, breathing, learning, reading, concentrating, thinking, communicating, and working. Major life activity also includes the operation of a major bodily function, including but not limited to, functions of the immune system, normal cell growth, digestive, bowel, bladder, neurological, brain, respiratory, circulatory, endocrine, and reproductive functions.8
• Developmental disability: “a disability which is attributable to: (a) an intellectual disability, cerebral palsy, epilepsy or autism; or (b) any other condition which results in impairment similar to that caused by an intellectual disability and which requires services similar to those required
4 Lenil Colbert, et al. v. Pat Quinn, et al. 2011. Consent Decree, December 21. Section III. Class definition. Retrieved online, https://www.illinois.gov/aging/CommunityServices/colbert%20v.%20quinn/Documents/colbert_consent_decree.pdf 5 Ethel Williams, et al. v. Pat Quinn, et al. 2010. Consent Decree, September 29. Section III. Class definition. Retrieved online, http://www.dhs.state.il.us/OneNetLibrary/27897/documents/Mental%20Health/LegalDocs/EnteredWilliamsConsentDecree.pdf 6 Stanley Ligas, et al. v. Julie Hamos, et al. 2011. Consent Decree, June 15. Section III. Class definition. Retrieved online. 7 77 Illinois Administrative Code, Public Health. Chapter I, Section 300.4000. According to the Williams Consent Decree. 8 Americans with Disabilities Act. 1990. As Amended. Chapter 126. Section 121012. Definition of Disability. Retrieved online.

2017 Supportive Housing Working Group
SHWG 8
by persons with an intellectual disability. Such disability must originate before the age of 18 years, be expected to continue indefinitely, and constitute a substantial disability.”9
• Intellectual disability: “significantly sub-average general intellectual functioning which exists concurrently with impairment in adaptive behavior and which originates before the age of 18 years.”10
Re-Entry Population (experiencing or at risk of homelessness): persons recently residing in State
correctional facilities and local jails who are on parole or are discharged from correctional facilities.
9 State of Illinois. ND. “Mental Health and Developmental Disabilities.” Section 405 ILCS 5, Mental Health and Developmental Disabilities Code. Retrieved online. 10 Ibid 9.
2017 Supportive Housing Working Group
SHWG 9
Current Inventory
Permanent Supportive Housing
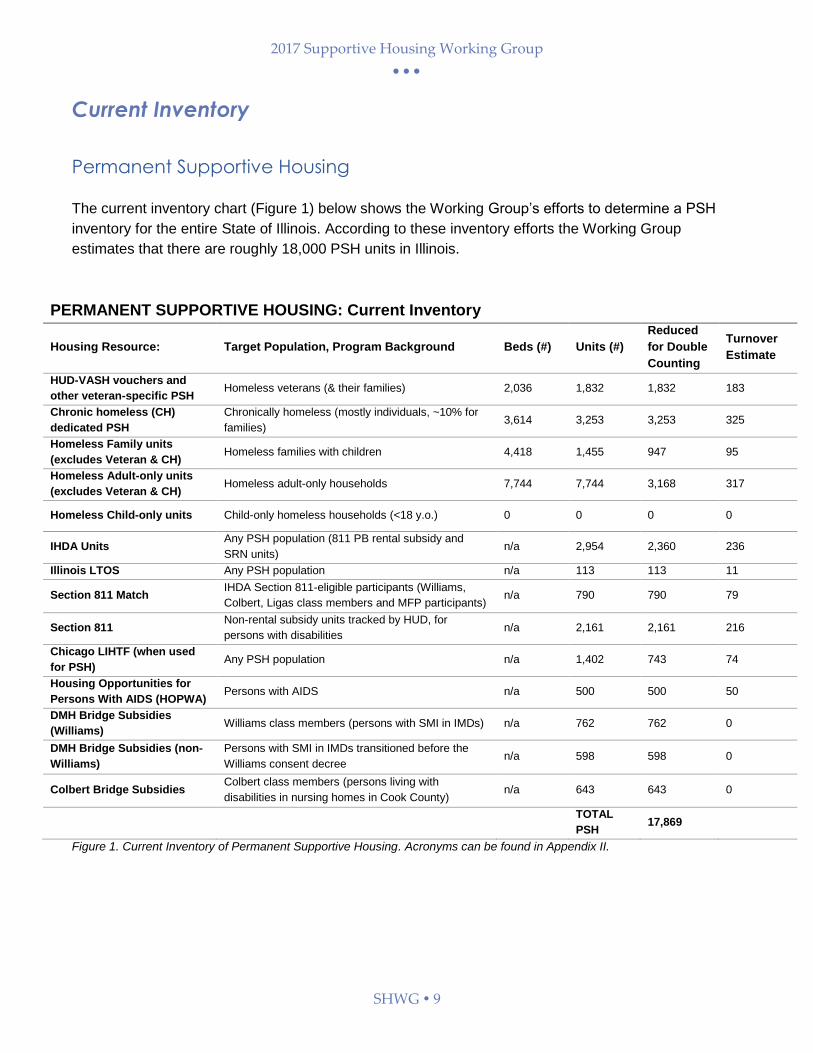
The current inventory chart (Figure 1) below shows the Working Group’s efforts to determine a PSH
inventory for the entire State of Illinois. According to these inventory efforts the Working Group
estimates that there are roughly 18,000 PSH units in Illinois.
PERMANENT SUPPORTIVE HOUSING: Current Inventory
Housing Resource: Target Population, Program Background Beds (#) Units (#)
Reduced
for Double
Counting
Turnover
Estimate
HUD-VASH vouchers and
other veteran-specific PSH Homeless veterans (& their families) 2,036 1,832 1,832 183
Chronic homeless (CH)
dedicated PSH
Chronically homeless (mostly individuals, ~10% for
families) 3,614 3,253 3,253 325
Homeless Family units
(excludes Veteran & CH) Homeless families with children 4,418 1,455 947 95
Homeless Adult-only units
(excludes Veteran & CH) Homeless adult-only households 7,744 7,744 3,168 317
Homeless Child-only units Child-only homeless households (<18 y.o.) 0 0 0 0
IHDA Units Any PSH population (811 PB rental subsidy and
SRN units) n/a 2,954 2,360 236
Illinois LTOS Any PSH population n/a 113 113 11
Section 811 Match IHDA Section 811-eligible participants (Williams,
Colbert, Ligas class members and MFP participants) n/a 790 790 79
Section 811 Non-rental subsidy units tracked by HUD, for
persons with disabilities n/a 2,161 2,161 216
Chicago LIHTF (when used
for PSH) Any PSH population n/a 1,402 743 74
Housing Opportunities for
Persons With AIDS (HOPWA) Persons with AIDS n/a 500 500 50
DMH Bridge Subsidies
(Williams) Williams class members (persons with SMI in IMDs) n/a 762 762 0
DMH Bridge Subsidies (non-
Williams)
Persons with SMI in IMDs transitioned before the
Williams consent decree n/a 598 598 0
Colbert Bridge Subsidies Colbert class members (persons living with
disabilities in nursing homes in Cook County) n/a 643 643 0
TOTAL
PSH 17,869
Figure 1. Current Inventory of Permanent Supportive Housing. Acronyms can be found in Appendix II.

2017 Supportive Housing Working Group
SHWG 10
For each housing resource, the following components are included to calculate units currently in the
PSH stock:
• Beds/Units: Bed counts are primarily used for Continuum of Care (CoC) homeless housing inventory purposes. Unit count reflects the number of apartments available. Since several beds can be in each unit, the unit count will be lower than the bed count.
• Double counting: Many affordable housing resources overlap with one another, as affordable housing is often developed with layers of financing administered by different levels of government and different types of organizations. Each group may count a unit it partially fund or administer. In creating this inventory, the Working Group attempted to remove double counting by accounting for the relationship between the various funding sources. Note: The total of the “Reduce for Double Counting” column in the chart above is important as it presents an estimated unduplicated count of PSH units statewide, as units that are counted in other rows are subtracted from the total.
• Turnover estimate: Across the State, according to supportive housing experts participating in this Working Group, a 10% turnover rate is common for PSH (this figure is an estimate and is discussed on page 11 in detail). This turnover estimate implies that for every ten units, one unit will have a tenant move out and will become available for a new tenant during the course of each year. The 10% estimated rate is applied to each type of housing resource and thus contributes to the total inventory of available PSH.
Other Types of Housing with Supportive Services
The Working Group has identified other housing types that do not fit within its definition of PSH but do
provide housing with supportive services. Many of these are not counted because they are time limited
services (i.e. the supportive services or the housing itself is only available for a limited amount of time)
that provide a transition to other affordable or market-rate housing. Others are not counted because
they do not offer services. See Figure 2 for an inventory of these other types of housing with supportive
services.
OTHER SUPPORTIVE HOUSING
Housing Resource: Target Population Beds (#)
Units (#)
Rapid Re-Housing Homeless Families and Adults, up to 24 mo. 976 432
Other permanent housing Homeless-dedicated, no services 272 118
Transitional housing Homeless Families and Adults, up to 24 mo. 6,977 3,913
Safe Haven Homeless adults with SMI 80 80
Family Unification Program Vouchers
Ongoing housing voucher w/ <18 mo. services, for child-welfare involved families, sometimes unacc. youth
n/a 1,393
IDOC PRG program units Those on parole in need of supportive housing n/a 12
Section 202 Elderly population, including those who need supportive services n/a 4,285

2017 Supportive Housing Working Group
SHWG 11
Figure 2 Inventory for Other Housing with Supportive Services. Acronyms can be found in Appendix II.
The Importance of Public Housing Authorities
Data collection efforts of the Working Group included outreach to Public Housing Authorities and their
programs. IHDA partnered with the Illinois Chapter of the National Association of Housing and
Redevelopment Officials (NAHRO) and the Illinois Association of Housing Authorities (IAHA) to conduct
a statewide Public Housing Authority (PHA) survey on local housing authority programs, policies, and
initiatives.
A total of 59 completed surveys were received from among the 110 PHAs in Illinois. The responses
represent a diverse geographic range of Illinois’ counties and regions. A full summary of the survey
results are included in Appendix III of this report.

2017 Supportive Housing Working Group
SHWG 12
The Unmet Need for Permanent Supportive Housing
There will always be a need for PSH, as the populations addressed by this housing type are extremely
vulnerable. The Working Group sought to understand how close the State as a whole is to addressing
the total need for PSH within Illinois.
The Working Group examined each of the sub-populations at a point-in-time and used this data (from a
variety of sources) to determine an estimated unmet need for the State. Some populations are more
fluid during a year compared to others, illustrating some of the flaws with point-in-time analysis. Taking
into account the current turnover units that would be available during the year for each population, the
Working Group derived an estimate of the number of units needed to provide PSH every year to
address the statewide need.
The components used in this calculation are as follows:
• Universe: For each subpopulation, the calculation started with a universe of persons in that subpopulation.
• Multipliers: A multiplier was considered in order to convert a point-in-time count of persons in each subpopulation into an annual number, if applicable. Some of the figures in the Universe column are already annual or cumulative figures, and in those cases, the multiplier was 1.0). A multiplier greater than 1.0 indicates that, over the course of the year, more people use that same bed or unit than at a point in time. For example, if 100 beds are used by 150 people annually, the multiplier would be 1.5.
• Percent Who Need PSH: calculated based on population-specific information and observations made during program implementation serving these populations, described further below on page 12.
• Estimate of Need: multiplies the universe by the multiplier value and the percentage that need PSH in order to calculate the number of units required to meet the need for this special needs population.
• PSH Inventory Turnover: an estimate of turnover of the relevant inventory. (Please Note: For units which are population-specific, the number of turnover units is shown within that population’s row. For units that serve a more general population, those remaining turnover units are shown in aggregate in the bottom row.)
• Unmet Need: After subtracting turnover units, the resulting unmet need calculation for each special needs population indicates how many additional PSH units would need to be created to address the needs of each group.
Figure 3 presents the results, by population, of these calculations.
For further explanation of the methodology for these unmet need calculations, please refer to Appendix
I. While the Working Group made every effort to collect quality data from various State agencies,
nonprofit organizations, and HUD, some variances in data quality and other limitations are noted in the
Appendix.
2017 Supportive Housing Working Group
SHWG 13
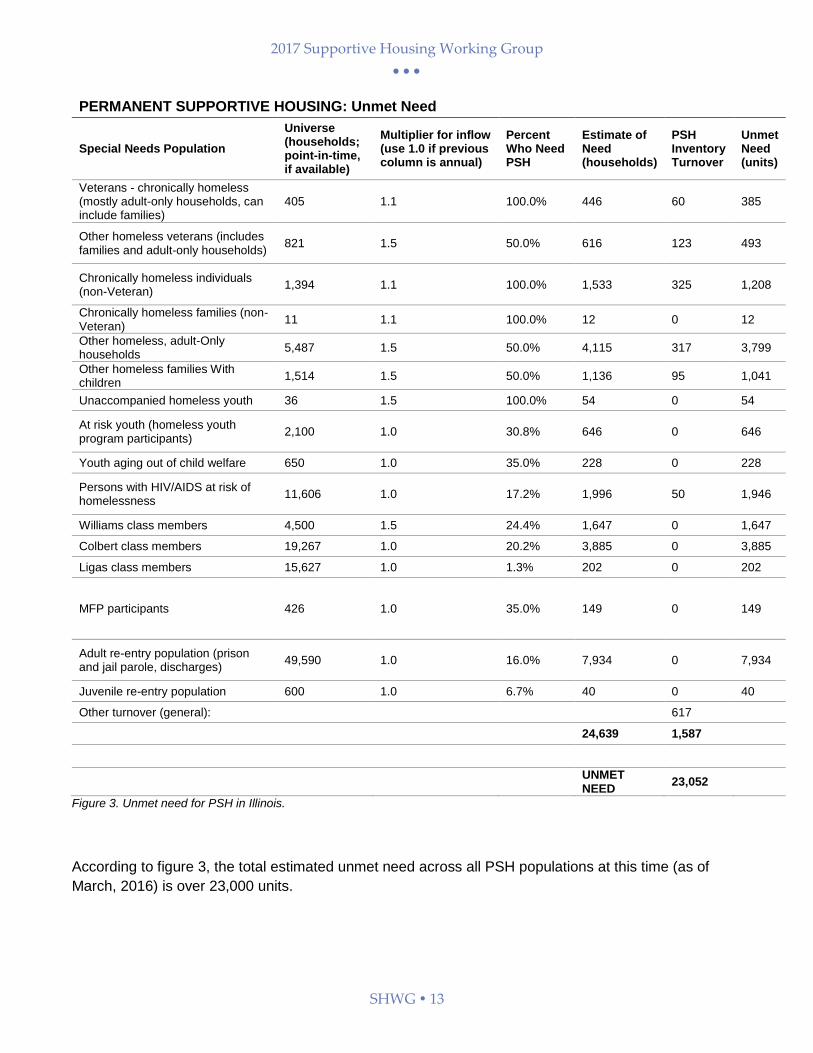
PERMANENT SUPPORTIVE HOUSING: Unmet Need
Special Needs Population
Universe (households; point-in-time, if available)
Multiplier for inflow (use 1.0 if previous column is annual)
Percent Who Need PSH
Estimate of Need (households)
PSH Inventory Turnover
Unmet Need (units)
Veterans - chronically homeless (mostly adult-only households, can include families)
405 1.1 100.0% 446 60 385
Other homeless veterans (includes families and adult-only households)
821 1.5 50.0% 616 123 493
Chronically homeless individuals (non-Veteran)
1,394 1.1 100.0% 1,533 325 1,208
Chronically homeless families (non-Veteran)
11 1.1 100.0% 12 0 12
Other homeless, adult-Only households
5,487 1.5 50.0% 4,115 317 3,799
Other homeless families With children
1,514 1.5 50.0% 1,136 95 1,041
Unaccompanied homeless youth 36 1.5 100.0% 54 0 54
At risk youth (homeless youth program participants)
2,100 1.0 30.8% 646 0 646
Youth aging out of child welfare 650 1.0 35.0% 228 0 228
Persons with HIV/AIDS at risk of homelessness
11,606 1.0 17.2% 1,996 50 1,946
Williams class members 4,500 1.5 24.4% 1,647 0 1,647
Colbert class members 19,267 1.0 20.2% 3,885 0 3,885
Ligas class members 15,627 1.0 1.3% 202 0 202
MFP participants 426 1.0 35.0% 149 0 149
Adult re-entry population (prison and jail parole, discharges)
49,590 1.0 16.0% 7,934 0 7,934
Juvenile re-entry population 600 1.0 6.7% 40 0 40
Other turnover (general): 617
24,639 1,587
UNMET NEED
23,052
Figure 3. Unmet need for PSH in Illinois.
According to figure 3, the total estimated unmet need across all PSH populations at this time (as of
March, 2016) is over 23,000 units.
2017 Supportive Housing Working Group
SHWG 14
Keeping Unmet Need in Perspective
Presenting the inventory and need into subcategories does not suggest that PSH should be developed
separately for each subpopulation. PSH should not segregate people with disabilities or prescribe
consumer choice. While some existing funding sources target specific subgroups, the Working Group
calls for PSH that can flexibly serve a variety of needs. The report does not tier specific subgroups due
to fair housing compliance concerns.
In addition to deriving an unmet need estimate, The Working Group wishes to recognize that Illinois has
made significant progress in developing PSH units.
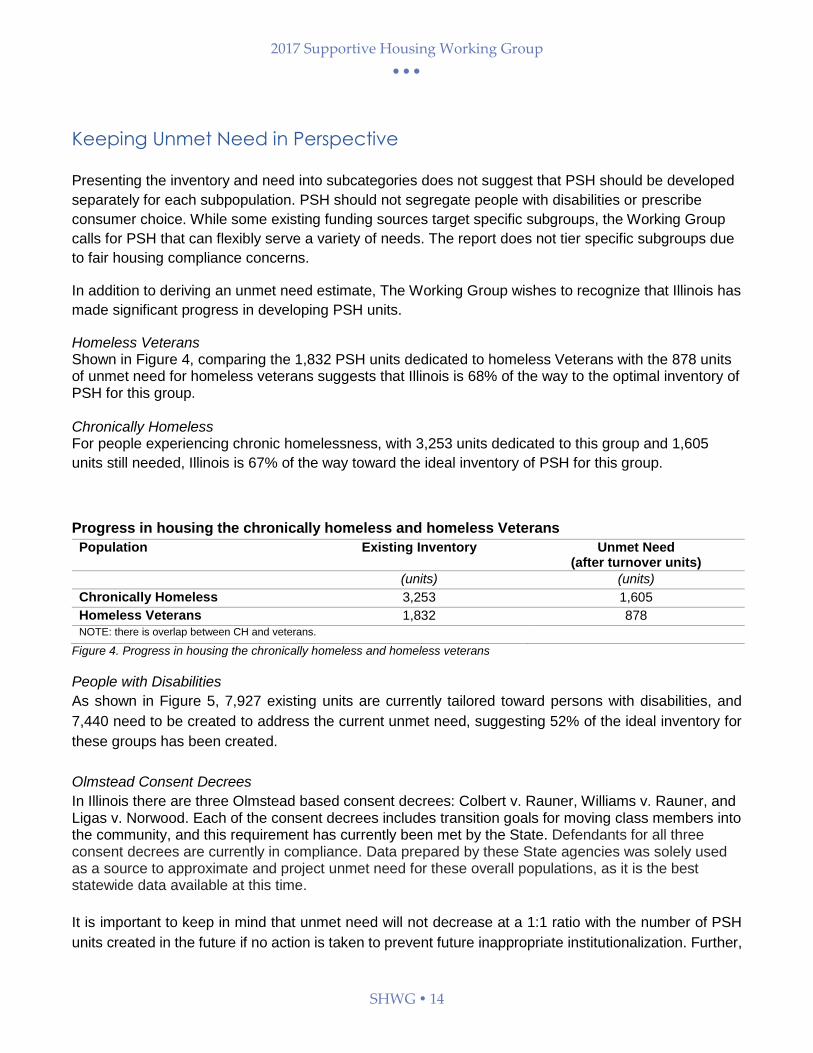
Homeless Veterans Shown in Figure 4, comparing the 1,832 PSH units dedicated to homeless Veterans with the 878 units of unmet need for homeless veterans suggests that Illinois is 68% of the way to the optimal inventory of PSH for this group. Chronically Homeless For people experiencing chronic homelessness, with 3,253 units dedicated to this group and 1,605
units still needed, Illinois is 67% of the way toward the ideal inventory of PSH for this group.
Progress in housing the chronically homeless and homeless Veterans
Population Existing Inventory Unmet Need (after turnover units)
(units) (units)
Chronically Homeless 3,253 1,605
Homeless Veterans 1,832 878
NOTE: there is overlap between CH and veterans.
Figure 4. Progress in housing the chronically homeless and homeless veterans
People with Disabilities
As shown in Figure 5, 7,927 existing units are currently tailored toward persons with disabilities, and
7,440 need to be created to address the current unmet need, suggesting 52% of the ideal inventory for
these groups has been created.
Olmstead Consent Decrees
In Illinois there are three Olmstead based consent decrees: Colbert v. Rauner, Williams v. Rauner, and Ligas v. Norwood. Each of the consent decrees includes transition goals for moving class members into the community, and this requirement has currently been met by the State. Defendants for all three consent decrees are currently in compliance. Data prepared by these State agencies was solely used as a source to approximate and project unmet need for these overall populations, as it is the best statewide data available at this time.
It is important to keep in mind that unmet need will not decrease at a 1:1 ratio with the number of PSH
units created in the future if no action is taken to prevent future inappropriate institutionalization. Further,

2017 Supportive Housing Working Group
SHWG 15
the units created need to be sufficiently targeted to ensure they meet the areas of greatest need described
in this report. Because of the urgency of working toward full compliance with the Olmstead-related
consent decrees in Illinois, this report places a high priority on reaching 100% of the units needed for
people with disabilities who are or could be inappropriately institutionalized.
Progress in Housing All PSH Populations
Population Existing Inventory
Unmet Need Turnover Remaining Unmet Need
Progress
(units) (units) (units) (units) (percent)
Homeless 9,942 8,558 920 7,638 57%
Populations living with a disability
7,927 8,107 667 7,440 52%
Subtotal 17,869 16,665 1,587 15,078 54%
Re-Entry 0 7,975 0 7,975 0%
Total 17,869 24,639 1,587 23,053 44%
Figure 5. Progress in housing all PSH populations
Re-Entry Population
PSH is shown to reduce recidivism among people leaving the correctional system, which leads to
significant potential cost savings when future jail or prison stays are prevented. These relative costs are
discussed in Comparing Operating Costs: PSH vs. Institutions. Because of the overlap between
disability, homelessness, and involvement with the criminal justice system, any PSH strategy must pay
attention to addressing criminal history as a barrier. It should be noted that the significant number
identified as the universe (49,590) represents the total potential PSH needed by the re-entry population.
A separate study of this population has been recommended to more accurately determine actual PSH
needs, as well as identify other barriers, e.g., employment.
Although some temporary options exist for re-entering citizens, there are no PSH options specific to
them, and the unmet need is relatively high—7,975 units (shown in Figure 5). While other PSH can be
used for people re-entering the community from the correctional system, the potential barrier of a
criminal background creates can be significant and will be addressed separately in the Strategies for
Improving Permanent Supportive Housing section.

2017 Supportive Housing Working Group
SHWG 16
Comparing Operating Costs: Permanent Supportive Housing vs. Institutions
The Working Group asserts that community-based PSH is more cost-effective than any institutional
setting per person or unit. In reaching this conclusion, the Working Group examined the highest amount
for each of the three components of PSH (operating costs, rental assistance, and supportive services).
After calculating a higher amount for each of these components of PSH (per unit/person) and comparing
to the average costs for many types of institutions (per person) it is evident that living in PSH in the
community costs 27-49% less than any of these institutional settings.
Highest PSH Cost
Institution Costs
Savings Per Unit Per Year
Percentage Saved
$27,600 $38,268 (prisons) $10,668 27% $39,739 (IMDs) $12,139 31% $52,083 (nursing homes) $24,483 47% $52,195 (jails) $24,595 47% $54,097 (ICF/DD) $26,497 49%
Figure 6. Total Operating Costs of Permanent Supportive Housing.
Note: This does not included development costs and explanation provided on following page.
Total Costs of Permanent Supportive Housing
Figure 6 illustrates the Working Group’s estimated per unit PSH cost (based on a high estimate of
operating, rental assistance, and supportive service costs) to total $27,600 per unit.
The cost of developing and operating PSH is based on three cost categories:
1) Development costs;
2) Annual operating costs (including rental assistance); and,
3) Supportive service costs for the residents.
Supportive housing differs from traditional affordable housing because of the addition of supportive
services, which require dedicated, sustainable funding sources. New developments require service
funding commitments during project financing or before units are filled with tenants. In the case of
leasing partnerships with no new capital development, services are needed to access the rental
assistance resources and to stay stably housed.
Development Costs
Housing development involves two separate costs: acquisition and development. Acquisition costs
involve the funds needed to purchase the property (with or without a building). Development costs
involve hard costs (e.g., physical construction materials, construction labor) and soft costs (e.g.,

2017 Supportive Housing Working Group
SHWG 17
architecture and engineering fees, taxes and permit fees) to construct or rehabilitate a building. These
costs are accumulated during the construction period.
The Illinois Housing Development Authority (IHDA) is the largest financer of PSH in Illinois. The
Working Group analyzed IHDA’s multifamily financing approvals from 2009 to present in an attempt to
determine a reasonable per-unit cost for Permanent Supportive Housing. The per unit cost average
from 2014 is $224,268, and in 2015 it was $262,922. This increase of roughly $38,000 per unit
oversimplifies the nuance of developing different types of units, but it speaks to increasing costs across
the board. Existing IHDA data suggests that $300,000 per unit is a reasonable estimate of PSH per
unit cost. This estimate is generally based on new construction and would be presumably less for
rehabbed units - exceptions could be costs related to acquisition, historic preservation, accessible
design, and lead-based paint remediation. The following assumptions were used in deriving this
estimate:
Total development cost per unit was used.
Financing approvals (IHDA Board Approved, not closed) from 2014 and 2015 were used - these
two years were chosen as the basis for this estimate because they are thought to be more
indicative of current development costs of regulated affordable housing).
Cost estimates were based entirely on Multifamily per unit costs, acknowledging the common
occurrence that PSH units are often if not usually part of developments that have a variety of
unit sizes and eligible populations.
As the State builds its supportive housing capacity and infrastructure, it is not appropriate to include
development costs in a cost-by-cost comparison between community-based housing and institutions.
Even though this per unit development cost estimate is a useful tool in discussing the cost of PSH,
there is no clear cost comparison to be drawn in the development of institutional housing for PSH
populations. Many institutions were physically constructed years ago, and acquisition and construction
costs for these facilities are not publicly available.
Operating Costs
Operating costs include: ongoing maintenance, utilities, insurance, taxes, administrative expenses, and
personnel expenses.
In this report, the operating costs were based on IHDA’s per unit operating cost ranges in the Low
Income Tax Credit Qualified Allocation Plan. These ranges, shown in Figure 7, are based on in-depth
market analysis. The lowest operating cost is $2,500 in the non-metro area, and the highest operating
cost is $7,500 in the City of Chicago.11,12
11 Operating costs can go above this $7,500 maximum IHDA provides, but projects must receive an exception to be approved. 12 Illinois Housing Development Authority. 2016 Per Unit Operating Expense Range. 2015. Fact Sheet. Retrieved online.

2017 Supportive Housing Working Group
SHWG 18
Project Type City of Chicago Metro Other Metro Non-Metro Operating Costs for Non-Elderly Units
$4,500-$7,500 $3,750-$6,000 $2,750-$5,000 $2,500-$4,100
Figure 7. Operation Costs for Permanent Supportive Housing
Rental/Operating Assistance Rental costs vary based on the type of unit that is created and how it is created. Regardless of what
type of unit an individual rents, the individual ideally pays no more than 30% of his/her income toward
rent. In Illinois, an extremely low income (30% area median income (AMI)) for a one-person household
can fall between $12,200 and $17,950. Someone living in Illinois at 15% of AMI would have an annual
income range somewhere between $6,100 and $8,950. Individuals can afford rental units which utilize
Fair Market Rent only if a subsidy is available.
Average Rental Costs (Per Month)
Cook and Surrounding Counties
Admin Costs: Cook and Surrounding
Rest of Illinois
Admin Costs: Rest of IL
Transition and Pre-Tenancy Costs (One-Time)
Fmr $1,001 $100 $534 $53.40 n/a
Bridge Subsidy (Colbert) $800 $80 n/a n/a $4,000
Bridge Subsidy (Williams) $591 $59 n/a n/a $2,800
811 Subsidy $600 $48 $200-$600 $32 n/a
RHSP (Chicago) $690 $69 n/a n/a n/a
Figure 8. Average Rental Assistance Costs for Permanent Supportive Housing
Service Costs The costs of supportive services will vary based on the type of household, staff caseload, and funding
source. For example, some Illinois service funding is based on Medicaid billing that involves rate
standards for the type of staff delivering a service, and rates may or may not cover the actual cost for
services. Other Illinois service funding can be grant-based and also may not fully cover the cost of the
services. There are various levels of cost for different ways of delivering supportive housing services.
Service Costs Cost per Person
Case management with low-need and high-case load $2,500 Intensive case management with high-need and low-case load $4,500
Case management with clinical services for high-need and low-case load $3,500 Clinical social services for high-need and low-case load $7,000
Figure 9. Supportive Services Costs for Permanent Supportive Housing

2017 Supportive Housing Working Group
SHWG 19
According to a 2011 analysis by the Center for Housing and Health in Chicago, supportive housing
agency costs can be impacted by types of services, the intensity of case management, and the level for
need for the population being served. As shown in Figure 9, in the instance of case management for
low-need populations (where there is a high case-load), the costs are approximately $2,500 per
person.
High-need populations receiving Intensive Case Management (ICM), which results in smaller caseloads
of around 15 people, costs $4,500 per person. In case management with clinical services for high-
need and low case load (15-30 per case-load), costs for case management come to $3,500 per person
with an additional $7,000 in clinical social services.13,14
Persons living with a physical disability and in need of home-based services may have much higher
case management costs, at an average of $21,500 per person per year.15 However, this program
includes Medicaid waiver program services and not just PSH housing-related supportive service costs,
so it is not a comparable cost to the case management numbers used in Figure 9.
See Figure 6: The total cost of $27,600 per unit is an estimated per-unit PSH cost (based on a
high estimate of operating, rental assistance, and supportive service costs).
Total Costs for Institutionalization
Institutions include jails, prisons, State Operated Developmental Centers (SODCs), Institutes for Mental
Disease (IMDs), nursing facilities, and Intermediate Care Facilities for Developmental Disabilities
(ICF/DDs). As discussed above, many of these institutions were developed years ago and cannot be
directly compared on the development cost side. Still, institutions maintain operating and services costs
each year.
Institutions Annual cost per person per year
Prisons $38,268 IMDs $39,739
Nursing Facilities $52,083 Jails $52,195
ICF/DD $54,097 Figure 10. Total Cost for Institutions.
13 Bendixen, Arturo. 2014. “Saving $9 Million in Medicaid Dollars with 225 Supportive Housing Units.” Program Evaluation. Chicago: Center
for Housing and Health. Print. 14Bendixen, Arturo, et al. 2014. “Together4Health Member Supportive Housing Models and Costs 2014.” Chicago: Center for Housing and
Health and T4H Service Provider Constituency Group. Print. 15 State of Illinois Department of Human Services, Division of Rehabilitation Services. N.d. Average per person annual cost for case
management services for persons with physical disability in need of home-based services.

2017 Supportive Housing Working Group
SHWG 20
Provided in Figure 10 are the costs to operate and provide all services in these institutions, per year
and per person. These services that incorporate all PSH costs and some institutional costs also include
Medicaid-reimbursable costs, which are not included in PSH costs.
The Working Group’s assumptions regarding the costs associated with specific institutional settings are
discussed below.
Incarceration Costs
In 2010, a report by the Vera Institute of Justice entitled The Price of Prisons: What Incarceration Costs
Taxpayers examined the costs states incur by housing large prison populations. According to their
analysis of the Illinois Department of Correction’s (IDOC) prison budget and other costs associated to
the Illinois prison system, the cost for each inmate was $38,268 per person per year.16 When looking
at Illinois jails, at populations with mental illness have shown costs amounting to $52,195 per person
per year.17
State Licensed Institutes for Mental Disease
The federal government will not provide Medicaid funds as match for these types of facilities, resulting
in the State having to pay 100% of all costs allocated with IMDs. The State of Illinois’ average cost for
housing people in state-licensed Institutes for Mental Disease (IMDs) in Illinois is $39,739 per person
per year.18
State Licensed Nursing Facilities
Illinois has approximately 1,200 long-term care facilities serving more than 100,000 residents, from the
young to the elderly.19 The cost of state licensed nursing facilities is $52,083 per person per year.20
Intermediate Care Facilities for Developmental Disabilities
The Illinois Department of Human Services provides rate information for Developmental Disabilities
Providers and costs for ICF/DD. For facilities 17 beds or more, it costs about $53,111 per person per
year. For ICF/DD facilities with 16 beds or fewer, it costs about $47,610 per person per year, and for
those with four and six beds, it costs about $72,894/year per person. When you calculate the average
daily rate for all ICF/DD, the amount is $54,097 per person per year.21
State Operated Developmental Centers
At SODCs in Illinois, the daily Medicaid reimbursement rate average over the last four years is $640 per
person. When projected over the course of a year, institutional living in these centers costs the state
$233,757 per person per year.22 The services and infrastructure needed to move people from SODCs
into the community are not the same as those needed for other special needs populations, they are
16 The Vera Institute. 2012. “The Price of Prisons: What Prison Costs Tax Payers.” 40 State Fact Sheets. Retrieved online. 17 Sykes, Bryan L, PhD. 2014. “Cost Savings when People Access the Right To Counsel Within 24 Hours of Arrest.” First Defense Legal Aid.
Retrieved online. 18 Illinois Department of Public Health website. Nursing Homes. Retrieved online. 19 Illinois Department of Healthcare and Family Services Bureau of Rate Development Analysis. 2014. “Medicaid Rate List for Nursing
Facilities.” Retrieved online. 20 Ibid 19 21 Illinois Department of Human Services. 2015. “ICFDD - LTD Rates Update.” Retrieved online, http://
www.dhs.state.il.us/page.aspx?item=54920 22 Division of Developmental Disabilities. 2015. “Medicaid Daily rates for State-Operated Developmental Centers,” Department of Human
Services, State of Illinois. November 19. Developmental Disabilities Reports. Retrieved online.

2017 Supportive Housing Working Group
SHWG 21
more extensive and expensive than typical supportive services. Past efforts to transition this population
have found costs can be cut in half, which would save about $116,000 per person. This move to the
community is still more cost-efficient than keeping people in institutions. For this reason, this type of
institution is not included in the cost comparison.
Cost of Chronic Homelessness
On any given night, approximately 13,777 people are experiencing homeless and 1,799 individuals are
experiencing chronic homelessness in Illinois.23 Chronic homelessness is defined as an individual or
family that is homeless and resides in a place not meant for human habitation, a safe haven, or in an
emergency shelter. They have been homeless and residing in such a place for at least one year or on
at least four separate occasions in the last three years totaling one year. These individuals commonly
have a combination of mental health problems, substance use disorders, and medical conditions that
worsen over time and often lead to an early death.
Many individuals experiencing homelessness cycle in and out of the hospital because of untreated
mental illness and end up in nursing homes or other institutions because hospitals do not want to
discharge these individuals back into homelessness. Based on data from the Illinois Department of
Human Services-Division of Mental Health, approximately 80 percent of individuals hospitalized for
psychiatric crises are screened for the next level of care and referred to institutional care in nursing
homes, most often because not enough community mental health treatment services are available.
Cases of inappropriate institutionalization can have enormous costs for the state, at an estimated $8.1
million per year.24 Because of their risk for being institutionalized inappropriately, those experiencing
chronic homelessness can be considered an Olmstead population, a distinction made by the U.S.
Supreme Court that gives them a right to community-based housing.
Without connections to the right types of housing options and services, chronically homeless individuals
cycle in and out of hospitals, detox programs, jails, prisons, and psychiatric institutions – all at high
public expense due to their frequent use of Medicaid. While studies have shown a wide range of costs
associated with high frequency chronically homeless populations, the cost is believed to fall somewhere
between $30,000 to $50,000 per person per year.25 Since many of these costs are already incorporated
in other institutional costs provided, these numbers are not included in the chart for cost comparison.
PSH costs less than institutional living
Even with conservative estimates for costs related to rental assistance, operating expenses and
services, PSH demonstrates significant cost savings, totaling hundreds of millions of dollars each year.
As shown in Figure 10, the costs of serving people in permanent supportive housing compared to more
restrictive and more expensive settings in Illinois.
State-Specific Cost Savings with PSH
23 Department of Housing and Urban Development. 2015. “Annual Homeless Annual Report (AHAR) to Congress.” Retrieved online. 24 O’Donnell, Heather. 2013. “The Path Forward: Investing in the Illinois Community Mental Health System. Policy Brief.” Chicago: Thresholds Retrieved online. 25 United States Interagency on Council on Homelessness. 2016. “Ending Long-Term Homelessness for People with Complex Needs.” Fact Sheet. Retrieved online.

2017 Supportive Housing Working Group
SHWG 22
The State of Illinois often receives no matching federal funds for jails, state prisons, and IMDs.
Community-based PSH benefits from funding and rental assistance funding from federal resources that
can help spread the cost-burden to resources outside of the state. Federal sources that help to fund
construction of supportive housing include: HOME, National Housing Trust Fund, and LIHTC. Many
rental assistance programs, like the 811 PRA, Section 8 Housing Choice Vouchers (HCVs) and
Continuum of Care rental assistance, are also funded by the federal government. Many supportive
services and some transition costs may potentially be considered billable under Medicaid, according to
recent guidance from CMS about pre-tenancy and tenancy supportive services. Meanwhile, the primary
financial burden of institutions and bridge subsidies used to transition consent decree populations to
community living are borne by the State.
The qualitative impact of PSH
Beyond the cost benefits of PSH, the Working Group asserts that living in supportive housing instead of
institutional settings has tangible benefits to residents that are difficult to quantify.
Autonomy
Living in one’s own home offers privacy and security, with the ability to lock one’s door. In congregate
settings or group living, individuals lack privacy and control around personal space.
Increased responsibility
PSH carries with it a 12-month lease which must be maintained by the resident. The responsibility of
paying monthly rent and procuring and maintaining one’s own home and lifestyle provides a sense of
accomplishment and ownership, which helps residents invest in their communities.
Flexibility of time
In congregate settings, whether in an institution or other non-PSH setting, what someone does with
their time can be programmed and must fit the schedule of the group; it is not individualized. In
supportive housing, a person has more flexibility and autonomy in making choices about how time is
used and prioritized.
Employment
In supportive housing, people have greater ability to connect to the working world and a greater ability
to accommodate various shifts of a job. In institutional settings, work may be connected only to one
source, like an agency. It may be less integrated into mainstream or competitive employment, and
hours may be restricted due to scheduling of the agency/site where the person is residing. Likewise, it
is difficult to maintain a job while experiencing homelessness.
Re-establish connections with family, friends, and community
While living in supportive housing, tenants may visit with family and friends when they desire and not
just during visiting hours. While abiding by a traditional lease, tenants of supportive housing tend to
host friends and family and reestablish connections in their lives that are difficult to maintain while living
in more restricted settings or while homeless.
Home management
In supportive housing, a tenant has more control over furnishings including: choice of colors, bedding,
and decorations, as well as other things that express an individual’s life and personality that are often

2017 Supportive Housing Working Group
SHWG 23
taken for granted. In temporary or institutional settings, both space and rules regarding decorations limit
this level of independence.
Money management
In supportive housing, a tenant typically pays 30% of income towards housing costs (rent and utilities)
and spends the remaining 70% as needed. The tenant is assisted in accessing other income sources
when eligible. In other settings, there is very little to no personal income or its use is dictated by
institutionally set priorities.

2017 Supportive Housing Working Group
SHWG 24
Production Goals for Permanent Supportive Housing
There are two ways to make units available to individuals in need of PSH. These are creating new units
through: new construction, rehab, adding rental subsidies and services to existing rental housing stock,
filling turnover units that become available; and leasing new units throughout the year. The Working
Group argues that dramatically increasing the production of supportive housing through development
and rental assistance programs is necessary to better address current and future needs.
The Working Group intends to set a production goal for the next five years as a general goal to rally
statewide financers and providers. These goals are established to maintain what the Working Group
asserts is an obtainable five-year goal. Annual estimates of production are included in this assessment,
although the Working Group recognizes that all estimates are rooted in assumptions regarding the
continuance of existing funding and establishment of new funding streams for PSH. As a result, the
estimates should be revisited on an annual basis in the Working Group’s parent organization – the
Illinois Housing Task Force.
The Five-Year Production Goal
By accounting for turnover and creating new units each year, data in Figure 11 suggests the cumulative
number of units available for occupancy over the next five years will be roughly 13,000 units. Each year
in this table shows the current inventory of existing units, how many new units will be built, and how
many turnover units will be available from that current inventory (10% of that current inventory number).
The total units made available each year through turnover (or unit creation) will help house new
persons who were previously not seeing their need for PSH met. With new units being built each year,
the current inventory increases, resulting in increases the number of turnover units. Over the next five
years, the Working Group sets a goal for Illinois to create 4,600 new PSH units, and the turnover units
available over five years adds up to 8,700 units. It should be noted the difficulty in capturing data on
unassisted leased units. One possible avenue to capture part of the number is through the local
Continuum of Care agencies.

2017 Supportive Housing Working Group
SHWG 25
Goal Production and
Turnover Year 1 Year 2 Year 3 Year 4 Year 5 Total Units
Current Inventory 15,86638 16,466 17,266 18,366 19,466 -
New Units 600 800 1,000 1,100 1,100 4,600
Turnover units
(10% of current inventory)
1,587 1,647 1,727 1,827 1,937 8,725
Total Units Available for
New Occupancy 2,187 2,447 2,727 2,927 3,037 13,325
Figure 11. Goal Number of New PSH Units and Existing Units Being Provided to New Users**26
This production model shows a gradual increase of new units created annually, in order to produce the
goal of 4,600 new units. These new units can be created through new construction, rehab of existing
housing, and rental subsidies placed on existing rental housing units to make them affordable.
Projecting existing funding levels of PSH funding into the future bears the risk that funding may
decrease over time. Also, higher funding levels can be offset by anticipated cost increases.
In the past five years, Continua of Care have produced about 800-900 units, a rate that is assumed to
continue for the next 5 years.27 With an average of 170 units per year, projecting out that same rate for
the next five years, produces about 850 units (shown in Figure 12). Additionally, IHDA is the only other
guaranteed entity to produce new units in the next five years. To determine a realistic estimate of how
many units IHDA can develop in the next five years, the report looks at the past seven years of IHDA
data on Board-approved developments and determines how much supportive housing was created
compared to all other units. Based on this ratio of PSH units to total affordable units, it is determined
300 new units could be produced each year for the next five years.
By projecting historical production numbers for PSH into the future (shown in Figure 12), the Working
Group estimates that about 2,350 new units would be created over the next five years without a
significant infusion of additional resources. This is roughly half of the Working Group’s goal of
producing 4,600 new PSH units. Strategies to increase this rate of production are presented in the
Strategies for Improving Permanent Supportive Housing section of this report.
26 The current inventory is 15,866 in this chart because the bridge subsidies used for non-Williams persons, Williams class members, and Colbert class members are not renewable subsidies and cannot be counted as permanent resources for persons after current recipients no longer need them. Therefore, the current inventory number in Figure 1 (17,867) must take out 2,001 units out to have 15,866 reusable PSH units in the future. 27 U.S. Department of Housing and Urban Development. 2010. “HUD’s 2010 Continuum of Care Homeless Assistance Programs Housing Inventory Chart Report.”

2017 Supportive Housing Working Group
SHWG 26
Estimated Likely
Production and Turnover
Year 1
Year 2
Year 3
Year 4
Year 5
Total Units
IHDA new units 300 300 300 300 300 1,500
CoC new units 170 170 170 170 170 850
Total New Units
2,350
Figure 12. Estimated Likely Projected Number of New PSH Units and Existing Units Being Provided to New Users (based on historic production numbers)
Potential resources to create PSH
To produce any new units and create new PSH within existing housing, it is important to be aware of
the existing resources that can fund PSH. Figures 13 and 14 highlight show the variety of federal, state,
and local funding resources available to produce PSH units. These funds are listed by entity providing
the funding and then by how the funds are dispersed (acquisition of land, new construction, rehab,
building operation, rental assistance, and supportive services) and who is eligible (all supportive
housing population or specific, targeted population(s)). A more detailed version of this chart is available
in Appendix IV, Potential Funding PSH Resources.

2017 Supportive Housing Working Group
SHWG 27
Federal Government Programs
Acquisition New
construction Rehab Operations
Rental Assistance
Supportive Services
All SH populations
Targeted SH populations
(list all)
Community Development Assistance Program (CDAP)
X X
Community Development Block Grant (CDBG)
X X X
Community Services Block Grant Program (CSBG)
X X X X
Continuum of Care Program X X X X X X X Homeless
Energy Efficiency Programs (DCEO)
X X X
Family Unification X X
Grant and Per Diem (GPD) Program for Homeless Veterans
X X Veterans
HOME Investments Partnership Program
X X X X X
Hope for Youth: YOUTHBUILD
X X X X X Youth
Housing Opportunities for Persons with AIDS
X X X X X Persons with
HIV/AIDS
HUD Section 203k X X
HUD/HFA Risk-Sharing Program
X X X
HUD - Veterans Affairs Supportive Housing (VASH)
X X Veterans
Illinois Home Weatherization Assistance Program
X X X
Lead-Based Paint Hazard Reduction Program
X X X X
Low Income Home Energy Assistance Program
X
Low Income Housing Tax Credits
X X X X
Multifamily Accelerated Processing-FHA Insurance Program
X X X X
National Housing Trust Fund X X X X X X
Public Housing Capital Fund X X X X X
Resident Opportunity and Self-Sufficiency Program
X X
Section 202 Supportive Housing for the Elderly
X X X X X Seniors
Section 8 Housing Choice Voucher
X X
Section 8 Mainstream X X Persons with Disabilities
Section 8 Moderate Rehabilitation SRO
X X Homeless
Section 811 Supportive Housing for Persons with Disabilities
X X X X X Persons with Disabilities
Tax-Exempt Financing Program
X X X
VA Supportive Services for Veteran Families (SSVF)
X X Veterans
Welfare-to-Work X X
Figure 13. Resources for acquisition, new construction, rehab, operations, rental assistance, supportive services, and which populations are
targeted for PSH from federal resources.

2017 Supportive Housing Working Group
SHWG 28
Figure 14. Resources for acquisition, new construction, rehab, operations, rental assistance, supportive services, and which populations are
targeted for PSH from state and private resources.
State Government Programs
Acquisition New
construction Rehab Operations
Rental Assistance
Supportive Services
All SH populations
Targeted SH populations (list
all)
Access to Capital Program
X X X
Affordable Housing Trust Fund
X X X X X
Assistance to the Homeless Fund
X X Homeless
Community Care Program
X X
Domestic Violence Program
X X
Emergency Food and Shelter Program
X X Homeless
Energy Efficiency Trust Fund
X X X
Homeless Prevention Program
X X
Home Services Program X X Persons with Disabilities
Homeless Youth Services Program
X X Persons with Disabilities
Housing Advocacy and Cash Assistance Program
X X X
Housing Initiative Weatherization Leveraging Program
X X X
Illinois Affordable Housing Tax Credit Program
X X X X
Illinois Finance Authority 501(c)(3) Bonds
X X X X
Illinois Finance Authority Multi-family Housing Bonds
X X X X
Rental Housing Support Program
X X
Supportive Housing Program
X X
Youth Housing Assistance Program
X Families at risk,
youth aging out of welfare
Private Programs Acquisition New
construction Rehab Operations
Rental Assistance
Supportive Services
All SH populations
Targeted SH populations (list
all)
Chicago Community Loan Fund
X X X X
Community Investment Corporation
X X X X
Corporation for Supportive Housing
X X
Federal Home Loan Bank - Affordable Housing Program
X X X X
Federal Home Loan Bank - Community Investment Cash Advance Program
X X X X
Homeownership Coalition for People with Disabilities
X X X X
Local Initiatives Support Corporation
X X X X

2017 Supportive Housing Working Group
SHWG 29
Strategies for Improving Permanent Supportive Housing
In order to create new PSH units, with the necessary rental assistance and supportive services
infrastructure, the Working Group looked at strategies stakeholders might face and how they could be
addressed. However, the immediate focus for Illinois and all of its PSH stakeholders should be to
preserve and properly fund all components of PSH units (affordable units, rental assistance and
supportive services) already in service.
To address this immediate focus, the Working Group should to utilize information from this report to
develop an action plan. The action plan process will also address these four key items and
recommendations:
1. Recommended methods for preserving and increasing PSH units.
2. Create fully accessible PSH units for persons with disabilities.
3. Create and properly fund a multi-year PSH expansion plan.
4. Enhance coordination among lenders and funders.
Each key item has a list of actions to immediately address the barriers outlined in the section. The
Working Group will continue to work on addressing these ideas and creating a long-term strategy to
provide the necessary PSH resources.
1. Recommended methods for preserving and increasing PSH units
While existing funding sources and strategies are vital to the production of PSH, more needs to be
done if Illinois hopes to meet its growing need. The Working Group explored additional strategies to
increase PSH unit production and recommended that the following methods be explored in greater
detail in future Annual Comprehensive Housing Plans where clear recommendations for the State of
Illinois and its partners can be further explored.
Preserving PSH
Loss of funding dollars, pressure from hot rental markets, gentrification trends, and the expiration of
affordability terms can threaten existing PSH. The Working Group recommends that preservation
strategies be expanded to help those in need of PSH units, including:
• A PSH preservation compact: Bringing together leaders from the public, private, and non-profit sectors to craft a vision for the State of Illinois that aims to preserve and expand PSH options;
• Secure and expand existing service dollars: The loss of State funds for services destabilizes existing service contracts for PSH providers and threatens to turn PSH into market-rate housing. Expanding service dollars could specifically involve changing Medicaid service definitions within the State Medicaid Plan (by plan amendment or waivers) for pre-tenancy and tenancy supports.

2017 Supportive Housing Working Group
SHWG 30
• Renewing expiring tax credit properties: The Low-Income Housing Tax Credit (LIHTC) program has been a significant source of new multifamily housing for more than 30 years. However, properties financed using the program become eligible to end the program’s rent and income restrictions. During the first 15 years of a LIHTC property’s compliance period, owners must report annually with LIHTC leasing requirements to both the Internal Revenue Service (IRS) and the State monitoring agency. After 15 years, the obligation to report to the IRS on compliance issues ends, and investors are no longer at risk for tax credit recapture. Without any efforts to preserve affordability or recapitalize new tax credits, expiring tax credit properties could be repositioned as market-rate units, depleting existing PSH inventory.
Ending the dual funding system
The Working Group recommends that a commitment to increase both supportive housing production
and funding be met with a corresponding commitment to reduce reliance on institutional settings. The
Working Group recommends that the State and its funded agencies work to reduce the volume of long-
term placements into nursing homes and that the State set a timeframe to transition general revenue
funding out of facilities and into systems that create supportive housing opportunities.
Pay for Success/Social Impact Bonds
The Working Group believes that Pay for Success (PFS) is a promising model for financing services
that can attract additional, non-traditional sources of funding with an approach to contracting that ties
payment for service delivery to the achievement of measurable outcomes. Most PFS models in the
United States are in demonstration stages, but successful examples in European settings suggest PFS
may be a valuable tool for addressing financial obstacles to PSH.
PFS initiatives can be devised to address pinpointed population needs where costs incurred by the
target population can be controlled through supportive housing, and could be scaled to serve more
people in the future through systematic change.
In a typical PFS contract, funding for services is provided by the investors, and the government then
pays investors if the service providers achieve their agreed-upon results. Typically, an independent
evaluator determines whether the agreed-upon outcomes have been met. Many PFS models utilize a
multi-year forecast of budgeting and cost savings/shifting for current business versus the new way of
delivering services.
Leveraging investment models
PSH stakeholders could pursue investment models that lower commitment of affordability (10 years)
but more deeply leverage the private market. PSH stakeholders could engage for-profit developers who
are interested in purchasing and managing/preserving existing affordable housing properties that have
lower but still significant affordability periods, such as 10-12 years. PSH stakeholders can also consider
tax incentives or other policies to encourage the retention of quality rental housing.
Explore scattered-site leasing partnership options
Such properties are essential to scattered-site leasing partnerships for supportive housing.
Reinvestment in existing buildings

2017 Supportive Housing Working Group
SHWG 31
The working group recommends determining how many PSH developments in Illinois are at risk due to
debt repayment. If this figure is large enough, it may be worthwhile exploring use of the State’s Long-
Term Operating Support program or its allocation of National Housing Trust Fund financing to reduce
the mortgage on existing affordable properties currently serving PSH populations.
Increase 30% AMI unit production
The Working Group recommends that IHDA and other affordable housing financing entities create
additional incentives to produce units that are affordable to households at 30% AMI. The populations
that benefit from PSH are typically extremely low income.
Explore modular homes, tiny homes, and pre-fabricated homes as a method to minimize development
costs
The Working Group asserted that non-traditional development trends could also be considered as a
method to address the increased need for supportive housing. The true cost of non-traditional
development models is not known and the success of these endeavors depends on organizations that
were not participating in the Working Group: zoning, financing authorities, and development standard
bearers.
Partnerships with PHAs
The Working Group asserts that PHAs play a critical role in serving some of Illinois neediest
populations. The results of the survey conducted of PHAs illustrates possible ways local programs,
policies and initiatives can strengthen, maintain, and expand permanent supportive housing options for
Illinois residents.28
Capital Bonds and Closing the Development Cost Gap
The State of Illinois funded affordable housing through IHDA in its last capital bill through the Build
Illinois Bond Program (BIBP). The Working Group suggests that future capital bills be used to provide
additional funding for PSH development.
Strengthen referral partnerships to ensure goals for populations
The Working Group recommends better utilization of the Pre-screening, Assessment, Intake and
Referral (PAIR) module in conjunction with: the current waiting list system for Section 811 and SRN
units, tracking Continuum of Care/PHA resources, training for referral points with services providers,
and ensuring there are services for supportive housing initiatives that are then tracked and measured.
28 For more information on how PHAs can increase preferences to certain populations or increase the number of project-based vouchers (which is an important tool for PSH populations), see the CSH toolkit at http://www.csh.org/phatoolkit.

2017 Supportive Housing Working Group
SHWG 32
2. Create fully accessible PSH units for persons with disabilities
The Supportive Housing Working Group believes there is a dearth of fully accessible PSH units for
people with disabilities. The Working Group further believes the need for housing stock that is
accessible to people with mobility, visual, and/or hearing impairment continues to be a significant
barrier to housing equality, especially among the populations that would benefit from PSH.
According to data from the American Communities Survey conducted by the Census Bureau in 2014,
the State of Illinois has substantial demand for accessible housing among adults across income levels.
People with mobility impairments make up 12.4 percent of all adults in Illinois ranging from 0-199
percent by ratio of income to the poverty level. In addition, 4 percent of adults in the same demographic
have a vision impairment, 4.4 percent have a hearing impairment, 7.5 percent have a cognitive
impairment, and 4.6% have self-care difficulty. As disabling conditions caused by aging intensify, the
need is projected to continue to increase.
Federal regulations require only 5 percent of all housing created with public funds be accessible to
those with mobility impairments, and 2 percent to be accessible to those with sensory disabilities
(hearing and vision), meaning the publicly-funded housing supply falls short of the likely demand.
Privately-funded housing has even lower accessibility requirements. IHDA requires developers make
10 percent of units accessible plus two percent sensory impaired, but the Working Group believes that
even this laudable effort falls short of the likely need.
In addition to the likely demand, discrimination in the rental market continues to be a pressing problem
for people with disabilities seeking affordable housing options. According to recent research by HUD’s
Office of Policy Development and Research, wheelchair users and people who are deaf or hard of
hearing are much more likely to encounter difficulty both in securing appointments to view available
rentals and in asking for necessary modifications than their non-disabled counterparts. This reality
makes PSH an attractive option for housing people with disabilities, provided that barriers to accessible
housing are actually addressed.
Ensure proper utilization of all accessible units
There is also a need for improved mechanisms to ensure that people who require accessibility features
be placed in accessible units ahead of those who do not need such features. Provisions must be made
to better match individuals’ accessibility needs with their housing.
Supportive housing stakeholders must take the lead on fixing this problem and ensure that everyone
has access to housing that meets their needs, not just services that do so.
Additional housing accessibility or accommodation barriers are distinct from built-in physical
accessibility. They are based on the support needs necessary for someone to access that unit. These
may be addressed through reasonable accommodations to rules, policies, or procedures, or reasonable
modifications to the common areas or the housing unit itself.
Reasonable accommodations for people with disabilities accessing PSH may include: flexible intake
hours, placing certain individuals impacted by paranoia or PTSD in units located at the beginning or
end of a hallway, accommodations to allow services on site, and exceptions for late rent payments

2017 Supportive Housing Working Group
SHWG 33
which may be due to when entitlements are received. These are just some of the many examples of
reasonable accommodation. Under the Fair Housing Act, the housing provider must allow reasonable
accommodations as long as doing so does not present an undue financial burden or fundamentally
alter the provider’s operations.
Reasonable modifications may include: additional grab bars in bathrooms, widened doorways, tinted
windows for people with environmental sensitivities, or padded walls in certain rooms to provide safety
for people with balance issues or repetitive behaviors related to various disabilities. These are just
some of the many examples of reasonable modification.
With respect to reasonable modifications, the Fair Housing Act requires the resident to pay for the
improvements. However, if the housing provider is a recipient of federal funds (such as a public housing
authority), another federal law, Section 504 of the Rehabilitation Act, requires the provider pay for the
improvements, unless the cost is unduly expensive and causes an economic hardship.
Intentionally addressing the issues raised above will set the Working Group report apart from other
strategic plans on the production of PSH. Ensuring that people with disabilities living in PSH are
matched with units that are usable and comfortable follows through on proactively addressing potential
fair housing-related concerns and establishes a better model for integrating people with disabilities into
all communities.
Require that all newly constructed PSH units be Type A accessible
It is recommended that all new developments in elevator buildings be built to Type A accessibility,
according to the International Building Code (IBC) (with general guidelines provided for under the Fair
Housing Act and defined by the Illinois Accessibility Code). Type A units provide a good combination of
built-in accessibility and adaptability for instances when certain accessible features are not needed (or
wanted) by a tenant. It has additional features that address wheelchair access and other needs built in
to the unit, such as wider doorframes and space to access unit features (such as the bathtub), with the
ability to adapt features later, if needed.
Requiring that all new construction follow Type A unit guidelines may add to the per-unit cost, but it
would be minimal. According to the 2011 Accessible Communities report issued by Metropolitan
Planning Council and the Harris Family Foundation, the Working Group estimates that a mandate for all
new construction units to be Type A would add about $5,000 cost per unit to the new units. It is not
intended for all units in a given building to be filled by people living with disabilities, but rather to
introduce the possibility that any units could accommodate a person in need of accessibility features, at
any point in time.
With these Type A cost increases, the Qualified Allocation Plan (QAP) would need to be amended to
make all new units receiving Low-Income Housing Tax Credit (LIHTC) funding Type A, so accessible,
supportive housing is on an equal playing field. If this is not possible, the QAP should have a built-in
safety clause so that those wanting to build supportive housing would not be penalized or lose points
for not having as many cost saving strategies in their development proposals as other applications
might have, due to the slightly higher Type A costs.

2017 Supportive Housing Working Group
SHWG 34
Create financial or competitive incentives to support creation of new fully- accessible units in scattered
site settings.
Maintaining or modifying the abandoned/foreclosed scattered-site housing provisions within the QAP
could allow developers to continue to create scattered site developments without committing to
purchase multiple sites in advance of funding.
Create databases which list available fully accessible dwelling units.
There is currently no public inventory available of all accessible housing in IHDA’s or the City of
Chicago’s portfolios, let alone accessible units created independently of these funders’ involvement.
Databases that are created should be utilized by property owners and managers to share information
not only about their accessible units’ existence but also their availability over time. There should be
requirements incorporated into funding agreements (including monitoring by funding agencies) to
ensure that this is being done, especially for turnover units.
Improve mechanisms for ensuring that people who need accessibility features are placed in accessible
units ahead of those who do not need such features.
By creating accessible unit-specific waiting lists, it will become more feasible to prioritize people who
need accessibility features for accessible units. State agency policies may need changes to make these
waiting lists effective. Additional education and outreach to landlords and property managers will help
them be aware of the new resource available to fill their units. This comprehensive effort will ensure
accessible units are truly offered to those who need the accessible features first.
3. Create and properly fund a multi-year PSH expansion plan
Get a legislative commitment at both the state and federal levels to not only preserve and maintain existing PSH programs, but to expand PSH programs. This will require advocates across the country to continue to present a strong long-term case for
funding. With more federal funding, State action can be expanded even further, serving even more
people. For example, the 2008 report from this Supportive Housing Working Group recommended that
HUD needed to commit $2.5 billion to supportive housing nationwide.
An annual $2.5 billion HUD commitment could net Illinois as much as $125 million per year, which
would be a 25 percent increase over its current federal allocation for supportive housing-related efforts.
Federal fiscal year 2015 funding was $1.9 billion nationally and $102 million in Illinois. It may be more
likely federal funds will increase once states and local communities prove it is an important initiative by
providing a local match and clear commitments to supportive housing.
Have the Supportive Housing Providers Association (SHPA) or another organization prepare a list of PSH units potentially in jeopardy. A statewide analysis is needed to provide a clear understanding of how many units are at risk of losing
supportive services funding or are in need of rehabilitation or refinancing to remain affordable. SHPA is
a statewide network of supportive housing providers that produces such types of analysis and reports,
and so it may have the relevant capacity and experience to create such a list.

2017 Supportive Housing Working Group
SHWG 35
Create a more formalized process to resolve “reasonable accommodations” disputes between tenants and landlords. Service providers need further clarification of what they can negotiate with landlords and how long the
process will take. Landlords need clarification of their deadlines for notifying applicants about their
reasonable accommodation requests. They also need to be aware of what they are required to do
under fair housing law.
To address these education and outreach issues, there needs to be a process clarifying the timeline
and components for a reasonable accommodation appeal. This could be a joint effort between housing
and service provider agencies and advocates.
Provide additional landlord training related to basic supportive housing opportunities and providing “reasonable accommodations” to meet the needs of people with disabilities. The struggle for PSH support in the private market is real. PHAs, State agencies complying with
Olmstead consent decrees, and other housing providers have difficulties finding landlords to participate
in their programs. Expanding and creating new landlord education and awareness campaigns is crucial
to addressing this issue. These campaigns could include training and certification programs on Section
504 compliance/Fair Housing, reasonable accommodations, participating in HCV, or any other State
program for participants with disabilities.
Housing providers can work with the Illinois Department for Human Rights (IDHR) and local fair housing
agencies to attend their trainings on these issues. Creating webinars or other sustainable materials can
ensure new landlords and property managers have the opportunity to continually learn as well.
Put additional focus on Fair Housing programs related to discrimination against the people with
disabilities.
Provide incentives and encouragement for all landlords to attend a Fair Housing program. Following
HUD’s release of its Affirmatively Furthering Fair Housing rule, Illinois will comply by providing an
assessment in the next five-year Consolidated Plans to HUD, due in late 2019. Complying with the
AFFH rule involves statewide policies, program considerations, education and awareness efforts, and
an evaluation of all these efforts to ensure improvement.
Build more alternative PSH housing models that are sensitive to community NIMBY (Not In My Back
Yard) issues and encourage local government regulatory change that supports an easier PSH
development process.
In order to increase the number of existing PSH rental units, PSH stakeholders need to become more
creative. For example, stakeholders can encourage local officials to change regulations that trigger a
special use permit when buildings have an on-site housing services office. Not requiring a special use
permit eases the development process and minimizes the risk for community opposition to housing
people with disabilities.
Expand the use of existing rental apartments in addition to new development projects which are
planned to have significant numbers of PSH units in them.

2017 Supportive Housing Working Group
SHWG 36
With many efforts in place to systematically require or encourage PSH in new developments and rehab
projects submitted for State funding, it is important to look into adding more supportive housing rental
subsidies and services to existing, private market rental units. Adding more PSH to existing rental
stock, for example, could include better prioritization of existing and creation of new rental subsidies.
4. Enhance coordination between lenders and PSH funders
PSH programs require that all sources of funding be in place in order to succeed. However, there is a
lack of coordination of federal, state, local, and private funding streams for PSH construction,
operations and services. A disconnect between programs forces providers to spend an excessive
amount of time on applications and configuring programs to meet the varied requirements of each
funding source. Even once the development is funded, implementation issues often arise due to this
lack of coordination.
Push for greater cooperation between funding entities at all governmental levels.
As an interim step, before an integrated application process is created, PSH stakeholders should push
for greater cooperation between funding entities at all governmental levels. The Statewide Housing
Coordinator is currently working on such coordination within in the State of Illinois and should be
actively supported by State agencies that fund and work with PSH-related programs. Coordination
needs to improve at the local level--amongst local Continua of Care and PHAs—and all the way up
through the State interagency leadership level. This need for coordination is actively evident in current
State Healthcare and Human Services Transformation initiatives and may become more prevalent as
these projects continue.
This improved coordination could include specific programming priorities, funding allocations, or other
policy changes that recognize the common goals of creating supportive housing opportunities. An
example of coordination is to release complementary funding priorities so that units and services can
match for priority populations.
Most importantly, this strategy should also involve streamlining supportive services initiatives, such as
Medicaid coverage, a possibility through the Healthcare and Human Services Transformation occurring
now across State agencies. This potential coverage of more supportive services under Medicaid is also
being encouraged through a federal technical assistance program called Innovations Accelerator
Program by the Centers for Medicare and Medicaid Services.
Agencies in the State and at the local level should be actively encouraged to create opportunities to
add supportive housing units to the pipeline and multi-year planning that can connect with active and
engaged referral sources.
Create an integrated application process to develop and maintain PSH units.
This strategy would entail one single application to get a multi-year commitment for operating and
service dollars (existing PSH units) and for construction, operating and service dollars (new units). By
combining all necessary funds to create a PSH unit, a single application would streamline the process
and lower the barriers to creating PSH for all types of organizations interested in development (non-

2017 Supportive Housing Working Group
SHWG 37
profits, PHAs, etc.). This type of single application may involve Notice of Funding Availability (NOFA)
documents from many levels of government.
At the federal level, this would require a joint NOFA or further actions for partnership between HUD and
HHS. At the State level, it would require a joint NOFA from IHDA, IDHS and possibly other State
agencies. There could be local level NOFAs as well, where applicable.
A multi-agency task force should be created or an existing group could engage all stakeholders in a
process to pave the way toward creating a single application in the long term. The strategy could also
entail using technology to electronically build applications in real time with approval and oversight built
in, as this could be a great step toward efficiency.
PHAs are often the largest source of subsidized housing for families and individuals who are homeless,
a key opportunity for increasing PSH at the local level. PHAs are able to use up to 20 percent of their
voucher quota for project-based vouchers (PBVs), which can provide operating support to PSH
developments. PHA’s must include a PBV proposal in their HUD-approved HCV plan in order to be able
to use PBVs. Project-based vouchers can support no greater than 30 percent of the units in a building
unless the building contains PSH units or serves seniors.
Evaluate current partnerships between local housing and service providers.
PSH stakeholders should refer to the PHA survey conducted by the Working Group (a summary of
survey findings are provided in Appendix III), in which over 50 percent of all PHAs in the State reported
on their current housing inventory, waiting list information, preferences, and plans for the future.
Looking at this and CoC data collected in 2015 will connect the two types of local organizations, which
might be dealing with similar issues, and the information can help State-level organizations build and
improve relations between them. Current efforts by the Statewide Housing Coordinator resulted in
several PHAs pledging resources in communities of preference for targeted, high-need populations.
This sort of partnership could continue to grow statewide. Assistance from the Regional HUD office
would also be extremely beneficial, as it is the monitoring agency for all Illinois PHAs and CoCs.
With active HUD support, get all PHAs operating in Illinois to participate in local Continua of Care.
This move would require cooperation among all of the Regional HUD Office Departments, including
Community Planning and Development (CPD), Public and Indian Housing (PIH), and Multi-Family (MF),
to help HUD better assist its local organizations in making similar connections.

2017 Supportive Housing Working Group
SHWG 38
APPENDIX I: Methodology for Inventory and Unmet Need, Key
Terms
Inventory chart terms
HUD-VASH vouchers and other Veteran-specific PSH
These resources are targeted towards homeless Veterans and their families. All homeless data is
obtained from the U.S. Department of Housing and Urban Development (HUD) agency’s January 2015
CoC Housing Inventory Count Report for Illinois29. It provides final housing inventory information for all
twenty Continua of Care in Illinois, as of January 2015.
While HUD-VASH and other veteran-specific PSH has 2,036 beds, some of these are for families, and
multiple beds are in family units. The number of units is assumed to be 90 percent of the number of
veteran beds to account for crossover into different counts, resulting in a unit count of 1,832. This
resource is not accounted for in any other part of the chart, and therefore, there is no reduction for
double counting. Turnover is estimated at 10 percent, and so there is an estimate of 183 turnover units
each year.
Chronic homeless dedicated PSH
These resources are targeted towards persons experiencing chronic homelessness. See page 5 for a
definition of chronic homelessness. While this housing resource has 3,614 beds, some of these are for
families, and multiple beds are in family units. Thus, the number of units is assumed to be 90% of the
number of chronic homeless beds, resulting in a unit count of 3,253. This resource is accounted for in
any other part of the chart, and therefore, there is no reduction for double counting. Turnover is
estimated at 10 percent, and so there is an estimate of 325 turnover units each year.
Family units (excludes veteran & chronically homeless)
These resources are targeted towards homeless families with children. The HUD 2015 CoC Housing
Inventory Count Report for Illinois includes the actual number of beds and units for families with
children. This housing resource has 4,418 beds and 1,455 units. Because some families are already
counted in the veteran and chronically homeless categories in the above rows, the unit count is
reduced by 10 percent to 937 units. Turnover is estimated at 10 percent, and so there is an estimate of
95 turnover units each year.
Adult-only units (excludes veteran and chronically homeless)
These resources are targeted towards adults only: single adults who are veterans or chronically
homeless are counted in the above rows. This housing resource has 7,744 beds which are mainly used
for single adults, and so the unit count is assumed to be 7,744 units. However, since some of these
29 Ibid 27

2017 Supportive Housing Working Group
SHWG 39
units are already counted in the veteran and chronically homeless categories, this unit count is reduced
by 41 percent, to reflect an actual count of 3,168 units. Turnover is estimated at 10%, so there is an
estimate of 317 turnover units each year.
Child-only units
These resources are targeted towards child-only homeless households, for those less than 18 years
old. There are no PSH units in Illinois that fit this category in HUD’s Housing Inventory Count for 2015.
Illinois Housing Development Authority (IHDA) units
IHDA units include all PSH units developed from 2009 to the present, dedicated by the developer with
both IHDA funds and outside funds at the time of project approval. PSH units on this list include
Statewide Referral Network units and Section 811 units, which receive funding from the HOME
Program, Low Income Housing Tax Credits (LIHTC), the Illinois Affordable Housing Trust Fund, and/or
other IHDA programs. IHDA units, as well as all other housing resources, do not count their housing in
beds. Double counting was determined by removing any units promised PHA vouchers at the time of
project approval, as these units were counted by CoCs which reduced inventory by about 17 percent.30
Data shows IHDA has 2,954 units, reduced by 17 percent to 2,360 PSH units. With a 10 percent
turnover rate, there is an estimate of 236 turnover units each year.
Illinois Long-Term Operating Support (LTOS)
The LTOS program is part of the Rental Housing Support Program (RHSP) intended for affordable
housing developments. The goal of the LTOS program is to increase the supply of affordable housing
to households earning at or below 30 percent of the area median income by providing a long-term, unit-
based rent subsidy. IHDA forecasts committing $9,060,651 to the RHS program in 2017.
Section 811 match
The Section 811 match initiative, also known as Public Housing Priority Preferencing, involves a few
larger Illinois PHAs committing a certain number of their vouchers to special needs populations also
eligible for Illinois’ Section 811 rental subsidies. These vouchers are used as rental assistance instead
of a Section 811 subsidy. The Statewide Housing Coordinator from the Illinois Department of Human
Services (DHS) collaborates with PHAs and tracks these commitments. As of March 1, 2016, a total
790 units were committed. These are not double counted elsewhere in the table, and so the unit count
remains at 790. With a 10 percent turnover rate, there is an estimated 79 turnover units each year.
Other Section 811
Before IHDA received HUD funding for Section 811 rental assistance, there were private developments
that received Section 811 funding across the State. According to IDHS’ Division of Mental Health
30 IHDA does not track non-IHDA funded subsidy or rental assistance units outside of its normal asset management procedures. Therefore, it can only be assumed that these supportive housing units are consistently or currently being used as supportive housing.

2017 Supportive Housing Working Group
SHWG 40
(DMH) who tracks these units reflect these projects. A total of 222 units are still being funded, with a 10
percent turnover rate and an estimate of 22 turnover units each year.
Chicago Low-Income Housing Trust Fund (CLIHTF)
The City of Chicago’s Low-Income Housing Trust Fund provides PSH to those in “homeless”
designated units. Since some of these units may also be counted by All Chicago, the City’s CoC, in its
Housing Inventory Count, the All Chicago inventory list and the CLIHTF development list for these units
were crosschecked. Any organizations on both lists were considered units double counted, reducing
the unit count by 53% to 743 units. With a 10% turnover rate, there is an estimated 74 turnover units
each year.
Housing Opportunities for Persons with AIDS (HOPWA)
The Housing Opportunities for Persons with AIDS (HOPWA) program provides PSH units to people
with HIV/AIDS. HUD provides funding for this program and tracks these units. As of 2015, there were
500 PSH units with no double counting. With a 10% turnover rate, there is an estimated 50 turnover
units each year.
DMH Bridge Subsidies (Williams)
Bridge subsidies are used as a rental subsidy until a more permanent subsidy is available, such as a
Housing Choice Voucher or Section 811. The subsidies are provided through the State of Illinois’
General Revenue Fund. DMH uses and tracks bridge subsidies for Williams class members, with a total
of 762 active subsidies as of March 1, 2016. There is no double counting. Due to the temporary nature
of this assistance, no turnover units are assumed; once a subsidy is no longer needed for a person it
will not transfer to another person.
DMH Bridge Subsidies (Non-Williams)
Bridge subsidies are used as a rental subsidy until a more permanent subsidy is available, such as a
Housing Choice Voucher or Section 811. It is provided through State of Illinois funding. DMH used
bridge subsidies before the Williams lawsuit began and continues to track these subsidies. As of March
1, 2016, 598 subsidies were in active use. Again, there is no double counting and no turnover units.
Bridge subsidies are allocated to specific tenants and are non-transferable. Once the original
tenant/subsidy recipient no longer needs the subsidy, it does not get recycled, thus the number of
subsidies in use will continue to decrease over time.
Colbert Bridge Subsidies (Colbert)
Bridge subsidies are used as a rental subsidy until a more permanent subsidy is available, such as a
Housing Choice Voucher or Section 811. They are provided through State of Illinois funding. The Illinois
Department on Aging (DoA) uses and tracks bridge subsidies for Colbert class members. The current
number of active bridge subsidies is 643. Again, there is no double counting and there are also no
turnover units. Bridge subsidies are allocated to specific tenants and are non-transferable. Once the
original tenant/subsidy recipient no longer needs the subsidy, it does not get recycled, thus the number
of subsidies in use will continue to decrease over time.

2017 Supportive Housing Working Group
SHWG 41
Unmet need chart terms
Other inventory and unmet need chart terms
Multiplier: considered in order to convert a point-in-time count of persons in each subpopulation into an annual number. Some of the figures in the Universe column are already annual or cumulative figures, and so a multiplier of 1.0 is used. A multiplier greater than 1.0 indicates that, over the course of the year, more people use that same bed or unit than at a point in time. The higher the multiplier, the more often the resources are used in a year. For example, there may be 100 beds, but if those beds are used by 150 people, the multiplier would be 1.5.
Percent who need PSH: calculated based on population-specific information and observations made during program implementation serving these populations, described further below.
Estimate of need: multiplies the universe by the multiplier value and the percentage of people that need PSH in order to calculate the number of units required to meet the need for this special needs population.
PSH Inventory Turnover: takes turnover estimates from the inventory calculations and subtracts these hypothetically available units from the unmet need. For units that are population-specific, the number of turnover units is shown within that population’s row. For units that serve a more general population, those remaining turnover units are shown in the bottom row. After subtracting turnover units, the resulting unmet need calculation for each special needs population indicates how many additional PSH units would need to be created to address the needs of each group.
Populations experiencing homelessness
The following populations experiencing or who are at risk of homelessness and apply similar
methodology to estimate unmet need, and so they will be explained together. They include: veterans
experiencing chronic homelessness; veterans experiencing non-chronic homelessness; individuals
experiencing chronic homelessness; families experiencing chronic homelessness; other persons
experiencing non-chronic homelessness; families experiencing non-chronic homelessness; and
unaccompanied youth experiencing homelessness. See Figure 6 for unmet need numbers for each of
these groups.
For all of these populations, the universe represents a point-in-time (PIT) count. PIT looks at how many
people are using services from organizations on one determined day of the year. This PIT count is
usually conducted by Continua of Care in January, the height of winter, to maximize the count of
potential people using indoor shelters and other resources. Multipliers are used for these populations,
ranging from 1.1 to 1.5, assuming the services are used by many before moving to PSH or other
permanent housing solutions, and usage can vary during the year. More static populations, like the
chronically homeless, have the lower multiplier. These multipliers do not go any higher than 1.5.
Empirically, the ratio of people experiencing homelessness annually compared to a point in time is
closer to 4.0 or 5.0. However, the more conservative multiplier of 1.5 is used because just over 50% of
homeless shelter guests quickly resolve their homelessness without further intervention, and even
2017 Supportive Housing Working Group
SHWG 42
among individuals who are eligible for PSH, not all will require this intervention. For the chronically
homeless subpopulations, 100 percent are assumed to need PSH as their needs are more demanding
and intensive. Among the remaining homeless subpopulations, 50% are assumed to need PSH.
Universe numbers are based on the HUD Point in Time (PIT) count for all Illinois CoCs in 2015.31
Other youth populations
At-risk youth and youth aging out of child welfare are at risk of experiencing homelessness. Their
universe populations are calculated based on annual participation in youth programs, as described
here. Since these are annual figures, a multiplier of 1.0 is used. Universe numbers were from the state-
funded homeless youth programs, subtracting about 250 who were already being counted in the youth
aging out of child welfare count, equaling a 2,100 universe population. The percentage that needs PSH
was estimated based on the number of people who are street outreach clients and those who are
pregnant or parenting: 646 people out of 2,100, or 30.8 percent. Since there are no turnover units
specific to this population, there is an estimated need for 646 units.
Youth aging out of child welfare were counted based on the Department for Children and Family
Services (DCFS) child welfare program and data tracking. With 650 youth served per year, the
multiplier remains at 1.0 because the number is already an annual figure. The percentage that needs
PSH used here is based on a Chapin Hall study, showing 35 percent of youth aging out of
homelessness will experience homelessness. With no turnover units specific to this population, there is
an estimated need for 228 units.32
Persons with HIV/AIDS at risk of homelessness
Persons with HIV/AIDS at risk of homelessness were counted through the Department of Public
Health’s (DPH’s) Ryan White Program Statewide Coordinated Statement of Need system. The Part B
clients are those who may receive PSH, based on their circumstances. However, clients who
participate in Part B are not all eligible for PSH; many just use medication assistance from DPH. Again,
this population has a relatively consistent universe of persons (based on the total number of Ryan
White Part B program participants) so the multiplier remains at 1.0. To calculate a percentage of need
for PSH, the report uses the number of people who received housing assistance (1,123) out of the
number of people at 30 percent AMI or below (6,530), calculating a 17.2% need for PSH. With 50
turnover units dedicated directly to this population, there is an estimated need for 1,946 units.
Consent decree populations
The three Olmstead-related consent decrees, Colbert, Williams, and Ligas, collect their data in a
different way from the Continua of Care. While people continue to join the classes, the universe
31 U.S. Housing and Urban Development Department. 2015. “HUD 2015 Continuum of Care Homeless Assistance Programs Homeless Populations and Subpopulations.” Retrieved online. https://www.hudexchange.info/resource/reportmanagement/published/CoC_PopSub_State_IL_2015.pdf 32 Chapin Hall. 2016. “Predictors of Homelessness during the Transition from Foster Care to Adulthood.” Found online, http://www.chapinhall.org/research/inside/predictors-homelessness-during-transition-foster-care-adulthood

2017 Supportive Housing Working Group
SHWG 43
populations remain relatively static.33 Rather than attempt to annualize a point-in-time figure, some of
the consent decree universes start with a cumulative figure.
Williams consent decree
Williams data was provided by DMH’s Williams project team. This data attempts to reflect how much of
the population is inappropriately institutionalized in Institutes for Mental Disease (IMDs) and might be
eligible for and need PSH. The universe value (a cumulative figure for each population) is 4,500, the
number of IMD beds in the State and the number agreed upon as the target population according to the
consent decree. Cumulatively, the consent decree class has included 6,734 persons since its beginning
(data collected as of March 1, 2016). Because the IMD population is more transient, with about 1.5
times as many people served as there are beds, a multiplier of 1.5 is used. While 3,004 people were
referred for transition, only half of them were actually eligible upon further review. Therefore, the
percentage of people who need PSH is calculated by looking at the number of people with successful
PSH transitions (1,521) out of the number approached for assessment (6,257). With 24.4% that need
PSH units and with no turnover units specific to this group, the unmet need for individuals who are
inappropriately institutionalized in IMDs is calculated to be 1,647 PSH units.
Colbert consent decree
Colbert data was provided by the DoA’s Colbert project team. This data attempts to reflect how much of
the population is inappropriately institutionalized in nursing home facilities and might be eligible for and
need PSH. The Colbert consent decree only covers Cook County, and all of its data reflects that
geographic restriction. The universe number is based on Cook County’s total current population in all
licensed nursing home beds as of March 1, 2016, which is 19,000. Due to fluctuations in estimates of
this data (which is not calculated by DoA) this number has not changed very much from that defined by
the consent decree, leaving the multiplier neutral at 1.0. The Percentage that needs PSH was
calculated by looking at how many people successfully transitioned to PSH or who are pending
transition with good prospects divided by the total number approached for assessment. The report uses
the number of people approached for assessment, which is 8,659 as of March 1, 2016, because not all
19,000 that could be in nursing home beds at a given time have been contacted, as many enter and
exit too quickly to be approached. With 20.2% that need PSH units and no turnover units, unmet need
for all potential individuals inappropriately institutionalized in nursing home facilities is calculated to be
4,033 PSH units.
Ligas Consent Decree
Ligas data was provided by the Department of Developmental Disabilities’s Ligas project team and the
Statewide Housing Coordinator’s PAIR Module Waitlist Coordinator. The universe number is the
number of people counted by the project team to be a part of the class as of March 1, 2016, which
totals 15,627 people. This class count is based on Ligas’ PUNS and ICF/DD lists, which are updated on
a constant basis but do not fluctuate enough to justify a larger multiplier than 1.0. Ligas does not collect
the same type of transition data that Colbert and Williams do. Compared to other subpopulations, less
33 While people continue to be placed in institutions, the number is slowly decreasing (according to Williams census data) and some of the decrees are required to address prevention of any future inappropriate institutionalization.

2017 Supportive Housing Working Group
SHWG 44
is known about the proportion of people with developmental disabilities who might be successful in PSH
according to this report’s definition.
In order to estimate PSH need from the Ligas data, the Working Group analyzed whether class
members are currently making the transition to independent housing. According to current numbers (as
of April 18, 2016) in the Pre-Screening, Assessment, Intake, and Referral (PAIR) module, a total of 74
Ligas class members are either on the Section 811 or the Statewide Referral Network (SRN) waiting
lists; one of those class members has already been placed in PSH. This is approximately 1.3% of the
5,724 class members who have been accepted for transition.
Since almost no Ligas Class Members are in PSH units at this time, and there are very few PSH
resources made available or advertised for this population, a conservative percentage was used. Using
this conservative percentage and with no turnover units specific to this population, it is estimated a total
of 202 new PSH units are needed for individuals with developmental disabilities inappropriately
institutionalized.
Money Follows the Person (MFP)
This population includes persons who are not part of the three consent decrees, who are
inappropriately institutionalized and who might still be eligible for, and need, PSH across the State.
However, the MFP program is designed to only track people who reach out and desire to participate in
the program, and so this program’s data does not reflect a comprehensive universe of inappropriately
institutionalized persons. Due to this difference in program implementation, the unmet need was
estimated by averaging annual numbers over the past five years of implementation.
The MFP data system is based on reporting requirements of the federal program. It does not capture
an explicit community transition recommendation or specific housing recommendation (e.g. PSH). The
data system captures four stages in the MFP process: Contact, Enrollment/Informed Consent
Signature, Pre-transition, and Transition. MFP-qualified community housing options into which
participants have transitioned are recorded and include two that are of some use as indicators here: (1)
apartment leased by participant and (2) home leased by participant. The MFP system does not capture
individual participant receipt of a Bridge Rent Subsidy or a federal Housing Choice Voucher.
MFP counts a total 426 people participating in the program on average per year, which is considered
the universe number. On average, 35% of those approved for transition moved into a leased apartment
or home; estimating an unmet need for 149 PSH units.
Persons experiencing re-entry
Adults re-entering the community from prisons and jails across Illinois also show a great need for PSH
as many of them experience serious mental illness (SMI) and/or other disabilities. The universe
population is the sum of the total number of people who exited the Illinois Department of Corrections
system (either parolees or discharged individuals) in 2015, which is 30,369, plus the average daily jail
population, 19,221, totaling 49,590. Since the DOC number is an annual figure, the multiplier remains
at 1.0. According to a US Department of Justice and Federal Bureau of Justice Statistics study based
on jail surveys in 1999, it is estimated 16% of jailed and imprisoned populations have SMI and would be
eligible and need PSH units. So, the percentage that needs PSH used was 16%, estimating a need for

2017 Supportive Housing Working Group
SHWG 45
7,934 PSH units34. It is important to note that virtually no PSH units are dedicated or allocated to this
population at this time, and so the unmet need is starting from zero, which may explain the large need
reflected in this value.
34 Ditton, PM. 1999. US Department of Justice, Federal Bureau of Justice Statistics. “Mental Health and Treatment of Inmates and Probationers.” Found online, http://www.bjs.gov/content/pub/pdf/mhtip.pdf
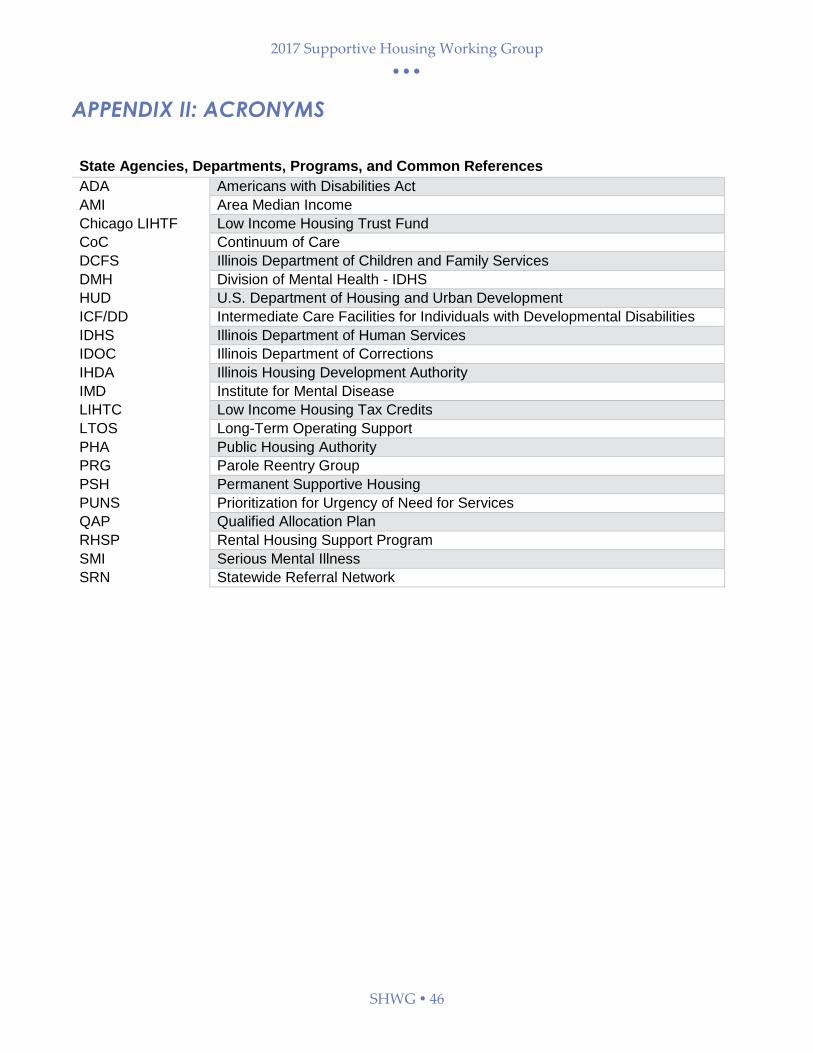
2017 Supportive Housing Working Group
SHWG 46
APPENDIX II: ACRONYMS
State Agencies, Departments, Programs, and Common References
ADA Americans with Disabilities Act
AMI Area Median Income
Chicago LIHTF Low Income Housing Trust Fund
CoC Continuum of Care
DCFS Illinois Department of Children and Family Services
DMH Division of Mental Health - IDHS
HUD U.S. Department of Housing and Urban Development
ICF/DD Intermediate Care Facilities for Individuals with Developmental Disabilities
IDHS Illinois Department of Human Services
IDOC Illinois Department of Corrections
IHDA Illinois Housing Development Authority
IMD Institute for Mental Disease
LIHTC Low Income Housing Tax Credits
LTOS Long-Term Operating Support
PHA Public Housing Authority
PRG Parole Reentry Group
PSH Permanent Supportive Housing
PUNS Prioritization for Urgency of Need for Services
QAP Qualified Allocation Plan
RHSP Rental Housing Support Program
SMI Serious Mental Illness
SRN Statewide Referral Network

2017 Supportive Housing Working Group
SHWG 47
APPENDIX III: SUMMARY OF PUBLIC HOUSING AUTHORITIES SURVEY
RESULTS
A summary of findings is listed here:
62.7% (37 out of 59) of PHAs indicated that they had housing choice voucher programs.
27% of PHAs indicated they had no elderly units/disabled units.
The total number of accessible units in PHAs indicated a disparity when compared to the PHAs
total units (10.3% of family-targeted units and 11.4% of the elderly/disabled units are accessible).
The most common lease up issue for PHAs was shortage of funding, followed by a lack of quality
units, and a lack of participating landlords.
7.3% of the total vouchers authorized by PHAs are project based vouchers.
30.5% (18 out of 59) of the PHAs have a project based voucher waiting list.
8.5% of the total persons on PHA waiting lists are persons with disabilities and 14.6% of the total
persons on the housing choice voucher waiting lists are persons with disabilities.
11.8% (7 out of 59) of the PHAs have open housing choice voucher waiting lists and most are in
rural areas or outside smaller metro areas (with Springfield being the exception).
83% (49 out of 59) answered that they had no plans to create supportive housing.
9 PHAs indicated they were interested in participating with 811 Match.
Disability preferences were a major part of the PHA survey:
50.8% of the PHAs indicated preferences in public housing;
28.8% of the PHAs indicated preferences in housing choice vouchers; and,
33.8% of the PHA’s indicated no preference for disability.
PHAs were also asked about homeless preferences;
37.2% of the PHAs indicated preferences in public housing;
18.6% of the PHAs indicated preferences in housing choice vouchers; and
42.3% of the PHAs indicated no preference for homeless
For the number of units for non-traditional affordable housing, PHAs indicated RAD units as the most
common, with 11,957 proposed Rental Assistance Demonstration (RAD) units and 2,847
existing/committed Rental Assistance Demonstration (RAD) units.

2017 Supportive Housing Working Group
SHWG 48
APPENDIX IV: POSSIBLE PSH RESOURCES, FULL CHARTS
The resource charts on the following pages break down the federal, state, and private program funds that
can be used for all stages of PSH creation: acquisition of property, new construction, rehab projects,
operation costs, rental assistance, and supportive services. Each table shows the program’s name,
whether it is a federally-, state-, or privately-sourced program, and which populations it may target and
can serve.
For most of the programs’ descriptions and history, please refer to the State of Illinois’ 5-Year
Consolidated Plan and the Illinois Annual Comprehensive Housing Plan. They can be found on the Illinois
Housing Development Authority’s website: https://www.ihda.org/about-ihda/state-housing-planning-
reports/

Acquisition At-risk-of Homelessness
Program Federal State Private
Experiencing
Chronic
Homelessness
VeteransFamilies (at-
risk)
Youth aging
out of
welfare
Other
Youth
Persons
Formerly
Incarcerated
Persons
with
HIV/AIDS
Community Development Block Grant (CDBG) X
Continuum of Care Program X
HOME Investment Partnerships Program X
Hope for Youth: YOUTHBUILD X O O
Housing Opportunities for Persons with AIDS X O
Low Income Housing Tax Credits X
Multifamily Accelerated Processing-FHA Insurance Program X
National Housing Trust Fund X
Public Housing Capital Fund X
Section 202 Supportive Housing for the Elderly X
Section 811 Supportive Housing for Persons with Disabilities X
Access to Capital Program X
Affordable Housing Trust Fund X
Energy Efficiency Trust Fund X
Housing Initiative Weatherization Leveraging Program X
Illinois Affordable Housing Tax Credit Program X
Illinois Finance Authority 501(c)(3) Bonds X
Illinois Finance Authority Multi-family Housing Bonds X
Chicago Community Loan Fund
Community Investment Corporation X
Corporation for Supportive Housing X
Federal Home Loan Bank-Affordable Housing Program X
Federal Home Loan Bank-Community Investment Cash Advance
ProgramX
Homeownership Coalition for People with Disabilities X
Local Initiatives Support Corporation X
X type of funding
Ofunding targeted
to these groups
population eligible

Acquisition Persons with disabilities
Program Federal State Private Williams Class Members
Colbert
Class
Members
Ligas Class
Members
Money Follows
the Person
Participants
Community Development Block Grant (CDBG) X
Continuum of Care Program X
HOME Investment Partnerships Program X
Hope for Youth: YOUTHBUILD X
Housing Opportunities for Persons with AIDS X
Low Income Housing Tax Credits X
Multifamily Accelerated Processing-FHA Insurance Program X
National Housing Trust Fund X
Public Housing Capital Fund X
Section 202 Supportive Housing for the Elderly X
Section 811 Supportive Housing for Persons with Disabilities X O O O O
Access to Capital Program X
Affordable Housing Trust Fund X
Energy Efficiency Trust Fund X
Housing Initiative Weatherization Leveraging Program X
Illinois Affordable Housing Tax Credit Program X
Illinois Finance Authority 501(c)(3) Bonds X
Illinois Finance Authority Multi-family Housing Bonds X
Chicago Community Loan Fund
Community Investment Corporation X
Corporation for Supportive Housing X
Federal Home Loan Bank-Affordable Housing Program X
Federal Home Loan Bank-Community Investment Cash Advance Program X
Homeownership Coalition for People with Disabilities X
Local Initiatives Support Corporation X
X type of funding
Ofunding targeted to
these groups
population eligible

New Construction At-risk-of Homelessness
Program Federal State Private
Experiencing
Chronic
Homelessness
VeteransFamilies (at-
risk)
Youth aging
out of welfare
Other
Youth
Persons
Formerly
Incarcerated
Persons
with
HIV/AIDS
Continuum of Care Program X
Energy Efficiency Programs (DCEO) X
Hope for Youth: YOUTHBUILD X O O
HUD\HFA Risk-Sharing Program X
Low Income Housing Tax Credits X
Multifamily Accelerated Processing-FHA Insurance Program X
National Housing Trust Fund X
Public Housing Capital Fund X
Section 202 Supportive Housing for the Elderly X
Section 811 Supportive Housing for Persons with Disabilities X
Tax-Exempt Financing Program X
Access to Capital Program X
Affordable Housing Trust Fund X
Energy Efficiency Trust Fund X
Housing Initiative Weatherization Leveraging Program X
Illinois Affordable Housing Tax Credit Program X
Illinois Finance Authority 501(c)(3) Bonds X
Illinois Finance Authority Multi-family Housing Bonds X
Chicago Community Loan Fund X
Community Investment Corporation X
Federal Home Loan Bank-Affordable Housing Program X
Federal Home Loan Bank-Community Investment Cash Advance
ProgramX
Local Initiatives Support Corporation X
X type of funding
Ofunding targeted to
these groups
population eligible
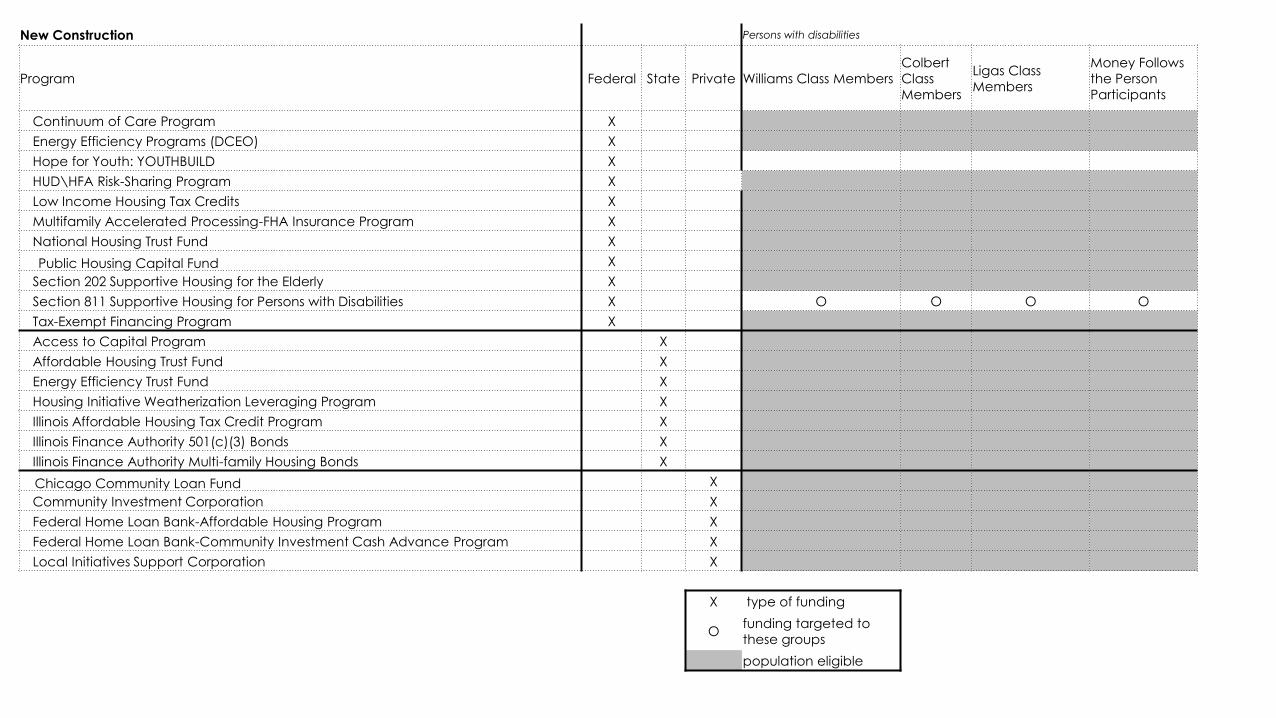
New Construction Persons with disabilities
Program Federal State Private Williams Class Members
Colbert
Class
Members
Ligas Class
Members
Money Follows
the Person
Participants
Continuum of Care Program X
Energy Efficiency Programs (DCEO) X
Hope for Youth: YOUTHBUILD X
HUD\HFA Risk-Sharing Program X
Low Income Housing Tax Credits X
Multifamily Accelerated Processing-FHA Insurance Program X
National Housing Trust Fund X
Public Housing Capital Fund X
Section 202 Supportive Housing for the Elderly X
Section 811 Supportive Housing for Persons with Disabilities X O O O O
Tax-Exempt Financing Program X
Access to Capital Program X
Affordable Housing Trust Fund X
Energy Efficiency Trust Fund X
Housing Initiative Weatherization Leveraging Program X
Illinois Affordable Housing Tax Credit Program X
Illinois Finance Authority 501(c)(3) Bonds X
Illinois Finance Authority Multi-family Housing Bonds X
Chicago Community Loan Fund X
Community Investment Corporation X
Federal Home Loan Bank-Affordable Housing Program X
Federal Home Loan Bank-Community Investment Cash Advance Program X
Local Initiatives Support Corporation X
X type of funding
Ofunding targeted to
these groups
population eligible

Rehabilitation At-risk-of Homelessness
Program Federal State PrivateExperiencing Chronic
HomelessnessVeterans Families (at-risk)
Youth aging
out of welfareOther Youth
Persons
Formerly
Incarcerated
Persons
with
HIV/AIDS
Community Development Block Grant (CDBG) X
Continuum of Care Program X
Public Housing Capital Fund X
Community Development Assistance Program X
Energy Efficiency Programs (DCEO) X
HOME Investment Partnerships Program X
Hope for Youth: YOUTHBUILD X O O
Housing Opportunities for Persons with AIDS X O O
HUD Section 203k X
HUD\HFA Risk-Sharing Program X
Illinois Home Weatherization Assistance Program X
Lead-Based Paint Hazard Reduction Program X
Low Income Housing Tax Credits X
Multifamily Accelerated Processing-FHA Insurance Program X
National Housing Trust Fund X
Section 202 Supportive Housing for the Elderly X
Section 811 Supportive Housing for Persons with Disabilities X
Tax-Exempt Financing Program X
Affordable Housing Trust Fund X
Energy Efficiency Trust Fund X
Assistance to the Homeless Fund X
Illinois Affordable Housing Tax Credit Program X
Illinois Finance Authority Multi-family Housing Bonds X
Illinois Finance Authority 501(c)(3) Bonds X
Chicago Community Loan Fund X
Community Investment Corporation X
Federal Home Loan Bank-Affordable Housing Program X
Federal Home Loan Bank-Community Investment Cash Advance ProgramX
Homeownership Coalition for People with Disabilities X
Local Initiatives Support Corporation X
X type of funding
Ofunding targeted to
these groups
population eligible

Rehabilitation Persons with disabilities
Program Federal State Private Williams Class Members
Colbert
Class
Members
Ligas Class MembersMoney Follows the
Person Participants
Community Development Block Grant (CDBG) X
Continuum of Care Program X
Public Housing Capital Fund X
Community Development Assistance Program X
Energy Efficiency Programs (DCEO) X
HOME Investment Partnerships Program X
Hope for Youth: YOUTHBUILD X
Housing Opportunities for Persons with AIDS X
HUD Section 203k X
HUD\HFA Risk-Sharing Program X
Illinois Home Weatherization Assistance Program X
Lead-Based Paint Hazard Reduction Program X
Low Income Housing Tax Credits X
Multifamily Accelerated Processing-FHA Insurance Program X
National Housing Trust Fund X
Section 202 Supportive Housing for the Elderly X
Section 811 Supportive Housing for Persons with Disabilities X O O O O
Tax-Exempt Financing Program X
Affordable Housing Trust Fund X
Energy Efficiency Trust Fund X
Assistance to the Homeless Fund X
Illinois Affordable Housing Tax Credit Program X
Illinois Finance Authority Multi-family Housing Bonds X
Illinois Finance Authority 501(c)(3) Bonds X
Chicago Community Loan Fund X
Community Investment Corporation X
Federal Home Loan Bank-Affordable Housing Program X
Federal Home Loan Bank-Community Investment Cash Advance Program X
Homeownership Coalition for People with Disabilities X
Local Initiatives Support Corporation X
X type of funding
Ofunding targeted to these
groups
population eligible

Operating Costs At-risk-of Homelessness
Program Federal State PrivateExperiencing Chronic
HomelessnessVeterans Families (at-risk)
Youth aging out
of welfareOther Youth
Persons
Formerly
Incarcerated
Persons
with
HIV/AIDS
Community Services Block Grant Program X
National Housing Trust Fund X
Continuum of Care Program X
Grant and Per Diem (GPD) Program for Homeless
VeteransX O
Hope for Youth: YOUTHBUILD X O O
Housing Opportunities for Persons with AIDS X O
Illinois Home Weatherization Assistance Program X
Lead-Based Paint Hazard Reduction Program X
Public Housing Operating Subsidy X
X type of funding
Ofunding targeted to
these groups
population eligible
Operating Costs Persons with disabilities
Program Federal State Private Williams Class Members
Colbert
Class
Members
Ligas Class
Members
Money Follows
the Person
Participants
Community Services Block Grant Program X
National Housing Trust Fund X
Continuum of Care Program X
Grant and Per Diem (GPD) Program for Homeless
VeteransX
Hope for Youth: YOUTHBUILD X
Housing Opportunities for Persons with AIDS X
Illinois Home Weatherization Assistance Program X
Lead-Based Paint Hazard Reduction Program X
Public Housing Operating Subsidy X
X type of funding
Ofunding targeted to
these groups
population eligible

Rental Assistance At-risk-of Homelessness
Program Federal State PrivateExperiencing Chronic
HomelessnessVeterans Families (at-risk)
Youth aging out
of welfareOther Youth
Persons
Formerly
Incarcerated
Persons
with
HIV/AIDS
Community Services Block Grant Program X
Continuum of Care Program X
HOME Investment Partnerships Program X
Housing Opportunities for Persons with AIDS X O
HUD-Veterans Affairs Supportive Housing (VASH) X O
Section 8 Moderate Rehabilitation SRO X
Family Unification X
Low Income Home Energy Assistance Program X
National Housing Trust Fund X
Section 202 Supportive Housing for the Elderly X
Section 8 Housing Choice Voucher X
Section 8 Mainstream X
Section 811 Supportive Housing for Persons with Disabilities X
VA Supportive Services for Veteran Families (SSVF) X O
Welfare-to-Work X
Affordable Housing Trust Fund X
Energy Efficiency Trust Fund X
Housing Advocacy and Cash Assistance Program X
Rental Housing Support Program X
Youth Housing Assistance X O O
X type of funding
Ofunding targeted to
these groups
population eligible

Rental Assistance Persons with disabilities
Program Federal State Private Williams Class Members
Colbert
Class
Members
Ligas Class
Members
Money Follows the
Person
Participants
Community Services Block Grant Program X
Continuum of Care Program X
Housing Opportunities for Persons with AIDS X
HOME Investment Partnerships Program X
HUD-Veterans Affairs Supportive Housing (VASH) X
Section 8 Moderate Rehabilitation SRO X
Emergency Shelter Grants Program X
Family Unification X
Low Income Home Energy Assistance Program X
National Housing Trust Fund X
Section 202 Supportive Housing for the Elderly X
Section 8 Housing Choice Voucher X
Section 8 Mainstream X
Section 811 Supportive Housing for Persons with Disabilities X O O O O
VA Supportive Services for Veteran Families (SSVF) X
Welfare-to-Work X
Affordable Housing Trust Fund X
Energy Efficiency Trust Fund X
Housing Advocacy and Cash Assistance ProgramX
Rental Housing Support Program X
Youth Housing Assistance X
X type of funding
Ofunding targeted to these
groups
population eligible

Support Services At-risk-of Homelessness
Program Federal State PrivateExperiencing Chronic
HomelessnessVeterans Families (at-risk)
Youth aging
out of welfareOther Youth
Persons
Formerly
Incarcerated
Persons
with
HIV/AIDS
Community Services Block Grant Program X
Continuum of Care Program X
Grant and Per Diem (GPD) Program for Homeless
VeteransX O
Hope for Youth: YOUTHBUILD X O O
Housing Opportunities for Persons with AIDS X O
Resident Opportunity and Self-Sufficiency Program X
Section 202 Supportive Housing for the Elderly X
Section 811 Supportive Housing for Persons with Disabilities X
VA Supportive Services for Veteran Families (SSVF) X O
Home Services Program X
Community Care Program X
Domestic Violence Program X
Emergency Food and Shelter Program X
Homeless Prevention Program X
Homeless Youth Services Program X
Housing Advocacy and Cash Assistance Program X
Supportive Housing Program X
Homeownership Coalition for People with Disabilities X
X type of funding
Ofunding targeted to
these groups
population eligible

Support Services Persons with disabilities
Program Federal State Private Williams Class Members
Colbert
Class
Members
Ligas Class
Members
Money Follows the
Person
Participants
Community Services Block Grant Program X
Continuum of Care Program X
Emergency Shelter Grants Program X
Grant and Per Diem (GPD) Program for Homeless
VeteransX
Hope for Youth: YOUTHBUILD X
Housing Opportunities for Persons with AIDS X
Resident Opportunity and Self-Sufficiency Program X
Section 202 Supportive Housing for the Elderly X
Section 811 Supportive Housing for Persons with Disabilities X O O O O
VA Supportive Services for Veteran Families (SSVF) X
Home Services Program X
Community Care Program X
Domestic Violence Program X
Emergency Food and Shelter Program X
Homeless Prevention Program X
Homeless Youth Services Program X
Housing Advocacy and Cash Assistance Program X
Supportive Housing Program X
Homeownership Coalition for People with Disabilities X
X type of funding
Ofunding targeted to these
groups
population eligible

2017 Supportive Housing Working Group
SHWG 49
APPENDIX V: WORKS CITED
These citations are numbered according to the footnotes in the main body of the report, before
appendices. Footnotes and references to previous citations are not included.
1. The Homeless Emergency Assistance and Rapid Transition to Housing (HEARTH) Act. 2009. The
McKinney-Vento Homeless Assistance Act as amended by S. 896. Sec.401. Definitions. Retrieved
online,
https://www.hudexchange.info/resources/documents/HomelessAssistanceActAmendedbyHEARTH.pdf
2. The Homeless Emergency Assistance and Rapid Transition to Housing (HEARTH) Act. 2009. The
McKinney-Vento Homeless Assistance Act as amended by S. 896. Sec. 103 [42 USC 11302]. General
definition of homelessness individual. Retrieved online,
https://www.hudexchange.info/resources/documents/HomelessAssistanceActAmendedbyHEARTH.pdf
4. Lenil Colbert, et al. v. Pat Quinn, et al. 2011. Consent Decree, December 21. Section III. Class
definition. Retrieved online,
https://www.illinois.gov/aging/CommunityServices/colbert%20v.%20quinn/Documents/colbert_consent_
decree.pdf
5. Ethel Williams, et al. v. Pat Quinn, et al. 2010. Consent Decree, September 29. Section III. Class
definition. Retrieved online,
http://www.dhs.state.il.us/OneNetLibrary/27897/documents/Mental%20Health/LegalDocs/EnteredWillia
msConsentDecree.pdf
6. Stanley Ligas, et al. v. Julie Hamos, et al. 2011. Consent Decree, June 15. Section III. Class
definition. Retrieved online,
http://www.dhs.state.il.us/OneNetLibrary/27896/documents/By_Division/Division%20of%20DD/LigasCo
nsentDecree061511.pdf
7. 77 Illinois Administrative Code, Public Health. Chapter I, Section 300.4000. According to the Williams
Consent Decree. Retrieved online,
http://www.ilga.gov/commission/jcar/admincode/077/077003000S40000R.html
8. Americans with Disabilities Act. 1990. As Amended. Chapter 126. Section 121012. Definition of
Disability. Retrieved online,
http://www.ada.gov/pubs/adastatute08.htm#12102
9. State of Illinois. ND. “Mental Health and Developmental Disabilities.” Section 405 ILCS 5, Mental
Health and Developmental Disabilities Code. Retrieved online,
http://www.ilga.gov/legislation/ilcs/ilcs5.asp?DocName=&ActID=1496&ChapterID=34&SeqStart=&SeqE
nd=&Print=True

2017 Supportive Housing Working Group
SHWG 50
12. Illinois Housing Development Authority. 2016 Per Unit Operating Expense Range. 2015. Fact
Sheet. Retrieved online,
http://www.ihda.org/wp-content/uploads/2016/03/2016_PerUnitOperatingExpenseRange.pdf
13. Bendixen, Arturo. 2014. “Saving $9 Million in Medicaid Dollars with 225 Supportive Housing Units.”
Program Evaluation. Chicago: Center for Housing and Health. Print.
14. Bendixen, Arturo, et al. 2014. “Together4Health Member Supportive Housing Models and Costs
2014.” Chicago: Center for Housing and Health and T4H Service Provider Constituency Group. Print.
15. State of Illinois Department of Human Services, Division of Rehabilitation Services. 2016. Average
per person annual cost for case management services for persons with physical disability in need of
home-based services. From DRS staff member, July.14. U.S. Department of Housing and Urban
Development. The Final FY 2016 Illinois FMR Summary. 2016. Retrieved online,
https://www.huduser.gov/portal/datasets/fmr/fmrs/FY2016_code/2016state_summary.odn
16. The Vera Institute. 2012. “The Price of Prisons: What Prison Costs Tax Payers.” 40 State Fact
Sheets. Retrieved online,
https://storage.googleapis.com/vera-web-assets/downloads/Publications/the-price-of-prisons-what-
incarceration-costs-taxpayers/legacy_downloads/the-price-of-prisons-40-fact-sheets-updated-
072012.pdf
17. Sykes, Bryan L, PhD. 2014. “Cost Savings when People Access the Right To Counsel Within 24
Hours of Arrest.” First Defense Legal Aid. Retrieved online,
http://www.first-defense.org/wp-content/uploads/2015/03/Cost-savings-report4.pdf
18. Illinois Department of Public Health website. Nursing Homes. Retrieved online,
http://www.dph.illinois.gov/topics-services/health-care-regulation/nursing-homes
19. Illinois Department of Healthcare and Family Services Bureau of Rate Development Analysis. 2014.
“Medicaid Rate List for Nursing Facilities.” Retrieved online,
https://www.illinois.gov/hfs/SiteCollectionDocuments/100114_rateilnf.pdf
21. Illinois Department of Human Services. 2015. “ICFDD - LTD Rates Update.” Retrieved online,
http://www.dhs.state.il.us/page.aspx?item=54920
22. Division of Developmental Disabilities. 2015. “Medicaid Daily rates for State-Operated
Developmental Centers,” Department of Human Services, State of Illinois. November 19.
Developmental Disabilities Reports. Retrieved online,
http://www.dhs.state.il.us/page.aspx?item=31193
23. US Department of Housing and Urban Development. 2015. “Annual Homeless Annual Report
(AHAR) to Congress.” Retrieved online,
https://www.hudexchange.info/resources/documents/2015-AHAR-Part-1.pdf

2017 Supportive Housing Working Group
SHWG 51
24. O’Donnell, Heather. 2013. “The Path Forward: Investing in the Illinois Community Mental Health
System. Policy Brief.” Chicago: Thresholds Retrieved online,
http://www.thresholds.org/wp-content/uploads/2013/11/Path-Forward_Investing-in-Illinois-Community-
Mental-Health_Final.pdf
25. United States Interagency on Council on Homelessness. 2016. “Ending Long-Term Homelessness
for People with Complex Needs.” Fact Sheet. Retrieved online,
https://www.usich.gov/resources/uploads/asset_library/Ending_Homelessness_for_People_Complex_N
eeds_FactSheet2016.pdf
27. U.S. Department of Housing and Urban Development. 2010. “HUD’s 2010 Continuum of Care
Homeless Assistance Programs Housing Inventory Chart Report.” Retrieved online,
https://www.hudexchange.info/resource/reportmanagement/published/CoC_HIC_CoC_CA-518-
2010_CA_2010.pdf
31. U.S. Housing and Urban Development Department. 2015. “HUD 2015 Continuum of Care
Homeless Assistance Pro-grams Homeless Populations and Subpopulations.” Retrieved online,
https://www.hudexchange.info/resource/reportmanagement/published/CoC_PopSub_State_IL_2015.pd
f
32. Chapin Hall. 2016. “Predictors of Homelessness during the Transition from Foster Care to
Adulthood.” Retrieved online,
http://www.chapinhall.org/research/inside/predictors-homelessness-during-transition-foster-care-
adulthood
34. Ditton, PM. 1999. US Department of Justice, Federal Bureau of Justice Statistics. “Mental Health
and Treatment of Inmates and Probationers.” Retrieved online,
http://www.bjs.gov/content/pub/pdf/mhtip.pdf