Embed Size (px)
Citation preview

2017 Session Revenue and Budget Outlook
Robert P. Vaughn, DirectorAnne E. Oman, Fiscal Analyst
House Appropriations Committee
November 15, 2016

2017 Session Revenue Forecast and Budget Outlook
• What are Key Economic Indicators Saying?
• Growing Disconnect Between Job Growth and Payroll Withholding
• FY 2016 Performance
• FY 2017 YTD Revenue Performance
• Revised General Fund Revenue Outlook: FY 2016-18 Biennium
• Budget Outlook: FY 2016-18 Biennium • FY 2017 Savings Plan• Additional Spending Pressures• FY 2018 Savings Options
1

A Look at GDP, ISM Index, and National Employment
2

Below Trend Growth Continues• The U.S. economy is growing, but since the end of the recession GDP growth is
less than half the rate it was from 1992 to 2001, and 75% of the pace from 2002 through 2007 – a new normal?• Third quarter 2016 GDP grew 2.9%
• ISM’s Report On Business shows the manufacturing sector growing faster in October, after contracting in August• New Orders, Production and Employment are growing
• U.S. Employment grew 161,000 in October, slightly below the 3 month average of 176,000. Nationally, unemployment rose to 5.0%, however, the high U6 employment rate and workforces participation rate mask the real number
• Companies continue to report record solid earnings• Consumers are spending, but not at the same pace, somewhat unexpectedly in
light of far lower gas prices• While the housing sector continues to improve, year-over-year growth rates have
slowed
3

Since Emerging from the Recession, the US Economy Has Downshifted…2016 Q2 GDP
Registered 1.4%, Can 2016 Q3 Shift Upward?
4
-4
-3
-2
-1
0
1
2
3
4
5
6
Recession
Recession
3.6% Average1992 - 2001
Recession
2.7% Average2002 - 2007 2.2% Average
2010 - 2015
Percent Annual GDP Growth
Percent

2016 GDP Grew 2.9% in Q3, For the Year GDP Stands At 1.7%
• The increase in real GDP in the third quarter reflected positive contributions from personal consumption expenditures (PCE), exports, private inventory investment, federal government spending, and nonresidential fixed investment
• Exports surged 10% over the previous quarter (soybeans), while consumer spending, which accounts for two-thirds of U.S. economic activity, increased at a 2.1% rate, down from 4.3% in the second quarter
• Negatives to GDP included residential fixed investment and state and local spending
5

ISM Remains Above 50% with 10 of 18 Industries Reporting Growth – Employment Index Jumped to
52.9%, After Being Below 50% Since June
6
40.0
45.0
50.0
55.0
60.0
65.0
2014-02-01 2014-05-01 2014-08-01 2014-11-01 2015-02-01 2015-05-01 2015-08-01 2015-11-01 2016-02-01 2016-05-01 2016-08-01
Composite New Orders Exports Employment Production

What Are Key Employment Indicators Showing?
• Private employers have added 15.5 million jobs to their payrolls in the 80 months since February 2010• Nonfarm payroll employment was 4.7 percent (6.5 million) higher in
October 2016 than it was at the start of the recession• Job creation has averaged 196,000 a month over the past 12
months, and 176,000 over the past three months. Even October’s 161,000 jobs is above what’s required to keep up with potential labor force growth
• Manpower's 2016 Q4 survey of 11,000 firms reveals 22% of employers expect to add workers, 6% expect to contract, and 69% of the firms plan no change in hiring• All four U.S. regions surveyed report a positive net employment outlook,
with the South reporting an employment outlook of +18%
7

While the U.S. Unemployment Rate Has Dropped, The Workforce Participation Rate is Slow to Recover
8
Source: Bureau of Labor Statistics
5.0
0.0
2.0
4.0
6.0
8.0
10.0
12.0
2007
-01-
0120
07-0
7-01
2008
-01-
0120
08-0
7-01
2009
-01-
0120
09-0
7-01
2010
-01-
0120
10-0
7-01
2011
-01-
0120
11-0
7-01
2012
-01-
0120
12-0
7-01
2013
-01-
0120
13-0
7-01
2014
-01-
0120
14-0
7-01
2015
-01-
0120
15-0
7-01
2016
-01-
0120
16-0
7-01
Unemployment Rate (Percent)
62.9
60.0
61.0
62.0
63.0
64.0
65.0
66.0
67.0
2007
-01-
0120
07-0
7-01
2008
-01-
0120
08-0
7-01
2009
-01-
0120
09-0
7-01
2010
-01-
0120
10-0
7-01
2011
-01-
0120
11-0
7-01
2012
-01-
0120
12-0
7-01
2013
-01-
0120
13-0
7-01
2014
-01-
0120
14-0
7-01
2015
-01-
0120
15-0
7-01
2016
-01-
0120
16-0
7-01
Participation Rate (Percent)

Percent Unemployed, Employed Part-Time for Economic Reasons, & Marginally Attached, All Remain Elevated at the Level of the 2001 Recession – This Dampens Wage Growth
9
Source: Bureau of Labor Statistics
10.4
17.1
9.5
2.0
4.0
6.0
8.0
10.0
12.0
14.0
16.0
18.0Percent
U-6 rate is defined as all unemployed as well as persons marginally attached to the labor force, plus total employed part time for economic reasons, as a percent of the labor force.

Share of Prime Working Age Employed is 2.3% Below Pre-Recession Levels. Increase of 2.9 Million Employed Would
Be Required To Reach the 2007 Peak
10
Source: Bureau of Labor Statistics
80.3
78.0
72.0
73.0
74.0
75.0
76.0
77.0
78.0
79.0
80.0
81.0
U. S. Employment Population Ratio, Age 25 to 54 Percent

A Look at Virginia:Are We Underperforming the Nation?
11

Based on Leading Indicators, Virginia Continues to Underperform the Nation, But is Improving
12
The Coincident Economic Activity Index includes four indicators: nonfarm payroll employment, the unemployment rate, average hours worked in manufacturing, and wages and salaries.
Source: Federal Reserve Bank of St. Louis.
145.00
150.00
155.00
160.00
165.00
170.00
175.00
180.00
US
Virginia

While Virginia’s Top Line Unemployment Rate Has Fallen Close to Pre-Recession Levels, the U-6
Rate Remains Elevated
9.3
3.8
0.0
2.0
4.0
6.0
8.0
10.0
12.0
14.0
2003
-10-
0120
04-0
1-01
2004
-04-
0120
04-0
7-01
2004
-10-
0120
05-0
1-01
2005
-04-
0120
05-0
7-01
2005
-10-
0120
06-0
1-01
2006
-04-
0120
06-0
7-01
2006
-10-
0120
07-0
1-01
2007
-04-
0120
07-0
7-01
2007
-10-
0120
08-0
1-01
2008
-04-
0120
08-0
7-01
2008
-10-
0120
09-0
1-01
2009
-04-
0120
09-0
7-01
2009
-10-
0120
10-0
1-01
2010
-04-
0120
10-0
7-01
2010
-10-
0120
11-0
1-01
2011
-04-
0120
11-0
7-01
2011
-10-
0120
12-0
1-01
2012
-04-
0120
12-0
7-01
2012
-10-
0120
13-0
1-01
2013
-04-
0120
13-0
7-01
2013
-10-
0120
14-0
1-01
2014
-04-
0120
14-0
7-01
2014
-10-
0120
15-0
1-01
2015
-04-
0120
15-0
7-01
2015
-10-
0120
16-0
1-01
2016
-04-
01
Quarterly Change (Percent)
U-6 Va. Unemploment Rate
U-6 rate is defined as all unemployed as well as persons marginally attached to the labor force, plus total employed part time for economic reasons, as a percent of the labor force.
13

Virginia’s Job Growth Had Under Performed the Nation Since May 2011 Before Accelerating In October of 2015
• In the Great Recession, Virginia’s job losses were not as severe as the nation’s -- Virginia’s loss equaled about 5.0% of total employment versus 6.3% nationally
• Initially after the recession, Virginia’s economy out-performed the U.S.
• Since May 2011, Virginia’s rate of job growth has been below the U.S. by 1.0%
• Virginia’s job growth was only 1.0% in FY 2015, and more than doubled to 2.3% in FY 2016, well above the “official” forecast of 1.5%
• Despite Virginia’s strong job’s growth, payroll withholding grew 2.4% versus the forecast of 4.1% for FY 16
• Since the recession through the end of FY 2016, Virginia’s employment has expanded by 259,500 jobs, however, there has been a realignment in the job mix
• Loss in Manufacturing and Construction and gains in lower paid administrative jobs in Professional and Business Services
14
-0.5
0.0
0.5
1.0
1.5
2.0
2.5
3.0
2011
-07-
01
2011
-10-
01
2012
-01-
01
2012
-04-
01
2012
-07-
01
2012
-10-
01
2013
-01-
01
2013
-04-
01
2013
-07-
01
2013
-10-
01
2014
-01-
01
2014
-04-
01
2014
-07-
01
2014
-10-
01
2015
-01-
01
2015
-04-
01
2015
-07-
01
2015
-10-
01
2016
-01-
01
2016
-04-
01
U.S.
Virginia
Percent Growth Year-Over-Year

The Realignment of Virginia’s Jobs
Construction and manufacturing jobs have been replaced by lower paying jobs
15

So Why Was There A Disconnect Between Job Growth and Payroll Withholding?
• Withholding taxes represents 63% of total general fund tax collections• Job growth and average wages and salaries serve as the proxy for withholding
• FY 2016 forecast called for job growth of 1.5% and average wage and salaries growth of 2.6%
• FY 2016 withholding forecasted at 4.1% growth, but grew 2.4% • It appears several factors are influencing actual collections versus the
forecast for payroll withholding:• Realignment in the type of jobs created
• Growth in Professional and Business Services, which have among the highest weekly wages, has been primarily in the lower paying administrative sector
• Anemic job growth in second half of FY 2016• Weakness in wage and salary growth• A decrease in the average weekly hours worked • Increase in the number of involuntary part-time workers
16

Change In Virginia JobsRecession versus Post Recession
17
-55 -35 -15 5 25 45 65 85
PBS (18%)
Manufacturing (6%)
Ed.& Health (13%)
Leisure & Hosp. (10%)
Trade,Trans & Utl. (17%)
Construction (5%)
Financial (5%)
Jobs in Thousands
Post Recession Recession
Recession – Dec. 2007 to June 2009 July 2009 to Aug. 2016

Growth In Post Recession Employment Has Been Focused on Lower Paid Sectors
• Since the recession, Virginia has shed 42,300 manufacturing jobs and 48,000 construction jobs
• Average value of $50,000 per year, exclusive of multiplier effect
• Post recession, Virginia has added 85,900 PBS jobs, 72,800 Education & Health, and 44,100 Leisure & Hospitality jobs
• Growth in PBS has been at the lower Administrative jobs, as opposed to the Professional & Technical jobs that dominated growth prior to 2010
• Health related jobs represents 83% of Ed. & Health category and accounts for 93% of job growth in that category, again job gains are focused on the lower end health care
• It takes approximately 3 Leisure & Hospitality jobs to replace each construction and manufacturing job in terms of lost wages
18
$48,849
$18,101
$36,457
$47,039
$48,443
$51,969
$54,366
$71,146
$10,000 $30,000 $50,000 $70,000 $90,000
Average All Jobs
Leisure & Hosp. (10%)
Trade,Trans & Utl. (17%)
Ed.& Health (13%)
Manufacturing (6%)
Construction (5%)
Financial (5%)
PBS (18%)
Average Annual Earnings

Professional & Business Services Equals 18% of Total Jobs and Accounts For 31% Of Post-Recession Job Growth.
Average Earnings Are 146% Of The State Average
• Professional and Technical Services represents 57% of all PBS jobs with an average salary of approximately $99,000
• Administration accounts for 32% of PBS employment with an average salary of $38,740
• During the recession Professional & Tech Services employment faired well, while Administration shed jobs
• Since 2010, most of the growth has been in the lower paid Administrative jobs• 52,300 Admin jobs compared to
33,900 Profession & Technical
19
-10.00%
-8.00%
-6.00%
-4.00%
-2.00%
0.00%
2.00%
4.00%
6.00%
8.00%
2005 2006 2007 2008 2009 2010 2011 2012 2013 2014 2015
Year over Year Percent Job GrowthProfessional & Technical and Administrative
Professional & Technical Administrative

Education & Health Comprises 13% of Total Jobs and Accounts For 26% Of Post-Recession Job Growth
• Ambulatory Health Care Services total 39.5% of all health care related jobs with an average salary of approximately $55,484
• Social Assistance accounts for 19% of health care related employment with an average salary of $25,168
• Nursing and Residential Care jobs account for 18% of health related jobs with an average salary of $29,536
20
0.00%
1.00%
2.00%
3.00%
4.00%
5.00%
6.00%
7.00%
8.00%
9.00%
10.00%
2005 2006 2007 2008 2009 2010 2011 2012 2013 2014 2015
Ambulatory health care services Nursing and residential care facilities
Social assistance
Year over Year Percent Job GrowthHealth Care and Social Assistance Services

Monthly Job Growth Decelerated The Second Half Of FY 2016
• Year over year job comparisons can give a false impression on how well the job market is performing
• While jobs grew 2.2% year over year, that figure masks the deceleration in monthly job growth
• In total, 73,400 jobs where added in FY 2016, however, 63,800 came in the first half, while in the second half Virginia added only 9,600 jobs
• 3 out of 6 months had negative monthly job growth
21
-15
-10
-5
0
5
10
15
20
25
FY 2016 Monthly Over Month Job Change
+9,600

FY 2016 Saw Wage Growth Dampento 2.3% Compared to 3.9% In FY 15
22
-4
-3
-2
-1
0
1
2
3
4
5
Month Over Month Percent Change In Average Wages
FY 2015 FY 2016

Average Work Week Has Declined, Primarily In Manufacturing and Construction. Involuntary Part-Time
Employment Remains Elevated (94,100) Since The Recession, and Is Up Nearly 13,000 Since January 2015
82,000
163,200
176,100
60,000
80,000
100,000
120,000
140,000
160,000
180,000
200,000
220,000Involuntary Part-time (4 Quarter Moving Average, Quarterly)
34.4
34.6
34.8
35
35.2
35.4
35.6
FY 2016: Average Weekly Hours
23

So If FY 2016 Was Part of the Realignment, Is FY 2017 the Reset Year?
24

September-Over-September Virginia Added 81,100 More Jobs
• Professional and Business Services accounted for 36% of Virginia’s job growth. Trade, Transportation and Utilities accounted for 23% and Education and Health 21.6%
• Northern Virginia accounts for 36.5% of Virginia’s total employment, however they gained 39.6% or 32,100 of the new jobs in the September-over-September period
• 55% of all PBS employment is in NoVa• It accounted for 60% of NoVa’s job gains
25
32.1
19.5
4.1 4.6
2
0
5
10
15
20
25
30
35
NoVa Richmond Hampton Rds Charlottesville Roanoke
Employment Change By MSA(Jobs in Thousands)

Professional & Business Services• Professional and Business Services represent 18.5% of Virginia’s employment, but accounts
for 28% of Northern Virginia’s employment• Two largest categories are Professional and Technical Services and Administration• The state average annual salary for Professional & Business Services is $71,146, which is
46% greater than the statewide average salary• Professional and Technical Services: $99,000 statewide average salary• Administrative Services: $38,740 statewide average salary
• Northern Virginia salaries are approximately 30% greater than the statewide average• Northern Virginia accounts for 67% of all Professional and Technical jobs
• Accounts for 39% of all Admin jobs
26
11,100
2,700
4,100
10,600
- 2,000 4,000 6,000 8,000 10,000 12,000
Professional & Technical (NoVa)
Professional & Technical (Rest of State)
Administrative (NoVa)
Administrative (Rest of State)
Professional & Business Services : Employment Change September over September

41,300 Jobs Have Been Created Since June• After a disappointing second half in FY
2016, Virginia has seen 4 months of job gains
• First quarter FY 17 +33,600. Gains included:
• Construction +3,200• Manufacturing +1,500• Professional and Business Services +8,700
• Professional & Technical +6,700• On a month over month basis, Virginia’s
rate of growth ranked 9th among states• In January Virginia ranked 34th
• The number of persons employed involuntarily part-time has declined to 162,300 for the 4th quarter of FY 2016
• Below the January 2015 level• Average weekly hours are up over the last 3
months, standing at 35.0 hours per week versus 34.8 in June
27
7.7
-15
-10
-5
0
5
10
15
20
Month Over Month January – September 2016
+33,600

Job Growth Fuels Wage Growth• First quarter 2016 saw an
increase of 2.4% in the average weekly wage
• However, Professional and Business Services saw an increase of 3.7% in average weekly wages
• Professional & Business Services represents 26% of Virginia’s wage base
28
2.4%
3.7%
0.0%
0.5%
1.0%
1.5%
2.0%
2.5%
3.0%
3.5%
4.0%
Total Average Wages Average Wage PBS
Avg. Wages: Percent Growth 2016 Q1 Over 2015 Q1

Manpower's 2016 Q4 Survey for Virginia Indicates Continued Hiring
• Employers in Virginia expect to hire at a respectable pace during Quarter 4 2016, according to the Manpower Employment Outlook Survey• From October to December, 24% of the companies interviewed plan to hire more
employees, while 6% expect to reduce their payrolls. Another 68% expect to maintain their current workforce levels and 2% are not certain of their hiring plans. This yields a Net Employment Outlook of 18%
• For the coming quarter, job prospects appear best in Construction, Durable Goods Manufacturing, Transportation & Utilities, Wholesale & Retail Trade, Professional & Business Services, Leisure & Hospitality, Other Services and Government
• Hiring in Nondurable Goods Manufacturing, Information, Financial Activities and Education & Health Services is expected to remain unchanged
29

FY 2016 Performance
30

FY 2016 Revenue Performance• When the budget was being considered last winter, FY 2016 revenues were running behind
the forecast, but coincident economic indicators made estimate seem achievable• After having reduced the forecast by $750.0 million during the fall forecasting process, the
Governor recommended no further reductions in his Mid-Session review• Shifted growth rates for specific sources, but bottom line forecast was unchanged
31
-10.0%
-2.6% 2.4%
0.5%
1.3% 1.6% 2.4%2.1%
2.7%
1.3%
1.9% 1.7%
-12%-10%-8%-6%-4%-2%0%2%4%6%8%
10%12%
Jul Aug Sep Oct Nov Dec Jan Feb Mar Apr May Jun
Growth in Total General Fund Revenue CollectionsFY 16 Monthly and Year-to-Date
Monthly Year-to-Date
Forecast 3.2%
Source: Virginia Department of Taxation

FY 2016 Revenue Performance• FY 2016 General Fund revenues rose by only 1.7%, falling short of the official forecast of 3.2%
growth by $268.9 million• Almost all of the shortfall was due to lower than expected withholding and sales tax collections
• These are the two largest sources, and also those most closely tied to current economic conditions
$15,767
$14,315$14,220
$15,041
$15,847
$16,685$16,411
$17,736
$18,040
12,000
13,000
14,000
15,000
16,000
17,000
18,000
19,000
2008 2009 2010 2011 2012 2013 2014 2015 2016
Actual GF Revenue Collections$ in Millions
1.3% 5.4%
5.3%-1.6%
32
-9.2% -0.7%5.8%
8.1%
Note: Figures include only GF revenues and excludes transfers. Source: Virginia Department of Taxation
1.7%Average growth since recession ended is 3.4%

Fiscal Year 2016 Revenues Finished $268.9 Million Below Forecast…
Major Sources Official Actual VarianceWithholding 62.8% $11,501.6 $11,306.3 ($195.3) 4.1 % 2.4 %0.0Nonwithholding 16.9 3,099.0 3,070.1 (28.9) 1.9 0.9Refunds (9.7) (1,777.6) (1,820.7) (43.1) 1.2 3.6
Net Individual 70.0% $12,823.0 $12,555.6 ($267.4) 4.0 % 1.8 %
Sales 18.4% $3,367.7 $3,295.9 ($71.9) 4.1 % 1.9 %Corporate 4.0 722.8 764.9 42.1 (13.1) (8.0)Wills (Recordation) 2.1 383.0 369.1 (13.9) 10.6 6.6Insurance 1.8 322.7 339.1 16.4 7.3 12.8All Other Revenue 3.8 689.8 715.5 25.7 (0.4) 3.3
Total Revenue 100.0% $18,309.0 $18,040.1 ($268.9) 3.2 % 1.7 %
A.B.C. Profits 0.5 $84.0 $84.0 $0.0 0.8 % 0.8 %366.7Sales Tax (0.375%) 1.9 366.7 366.7 0.0 4.1 4.1Transfers 1.1 121.3 121.3 0.0 (38.8) (38.8)
Total Transfers 3.5% $572.0 $572.0 $0.0 (9.8) % (9.8) %
Fiscal Year 2016As a % of Total Revenue
% Growth Over FY 15Official Actual
33

FY 2016 Revenue Performance by SourceWithholding Taxes: $195.3 million below forecast• Withholding taxes – which made up 63% of total revenues – grew 2.4% compared to a
forecast of 4.1%• In contrast, growth the prior year was 5.3%, but since 2010, average annual growth has been only 3.1%
• The proxies for this source - job growth and average wages – would have supported the FY 2016 forecast
• Jobs grew by 2.3% compared to 1.5% forecast• Average wages increased 2.3%, in line with the official forecast of 2.4%
• Disconnect appears attributable to the mix of jobs added to the economy• Saw fewer higher-wage jobs and expansion coming predominantly in lower wage sectors
Type of Job Number of Jobs % of Job Growth Avg. Weekly Wage
Low Wage 52,303 47.6% $367-$940
Medium Wage 40,972 37.3% $941-$1,513
High Wage 16,605 15.1% $1,514-$2,087
34
• The failure of the proxies to accurately project withholding growth has led the Department of Taxation to revisit its model, using fewer prior years of historic data, in an attempt to better reflect what appears to be a shift in Virginia’s economy

FY 2016 Revenue Performance by SourceSales Tax: $71.9 million short of forecast• Saw an AST-adjusted growth rate of 2.2%; almost 2 percentage
points below the economic-based forecast of 4.1% increase• Contraction was broad-based across the major retail sectors,
including department stores, grocery stores, restaurants, leisure and hospitality, and gasoline stations
• The proxy for this source - personal income growth - exceeded the forecast and increased 4.3%, and throughout the year reports of consumer confidence continuously improved
• Virginia and many states have been experiencing a growing disconnect between income growth and consumer spending
35

FY 2016 Revenue Performance by SourceRemaining Sources:• Payroll withholding and sales tax respectively accounted for 73%
and 27% of the revenue shortfall• Among all other sources, strengths in certain areas (corporate,
insurance premium taxes) offset weakness in other sources (recordation, and refunds)
• The shortfall would have been $183.0 million larger had the forecast not included a “collar” that capped nonwithholding collections at 16.14% of total revenues
36

FY 2017: YTD Performance
37

FY 2017 Performance Through October• Chapter 780 assumed a GF growth rate of 3.2% in FY 2017• Subsequent to the FY 2016 revenue shortfall, the mandatory
reforecasting process undertaken in August produced an interim forecast of 1.7% growth in the FY 2017
• This lowered the FY 2017 forecast by $564.4 million, reducing assumed GF revenues from $18.9 billion to $18.3 billion
• Through the first third of the fiscal year, revenues have increased 3.5% and are exceeding the revised forecast by 1.8 percentage points • Year-to-date strengths are in withholding, corporate and recordation taxes
• Greatest weakness has been the continued lagging sales tax collections
• Meeting the current forecast for FY 2017 requires growth of only 0.9% in the remaining 8 months of the fiscal year
38

FY 2017 Year-to-Date Performance General Fund Revenue Forecast for Fiscal Year 2017
Major Source
Ch. 780 Forecast
Revised AugustForecast
ActualPerformance
Through October
Growth Required Remainder of Year to
Meet Forecast
Withholding 4.0% 3.0% 4.3% 2.4%Nonwithholding 2.1% (1.2%) (0.2%) (1.5%)Refunds 6.6% 4.0% (4.0%) 5.1%
Net Individual 3.2% 1.8% 4.1% 0.8%
Sales 4.0% 2.6% (0.3%) 3.8%Corporate 5.9% (3.0%) 14.6% (7.4%)Wills (Recordation) 1.7% 5.5% 11.6% 2.3%Insurance 4.0% 1.3% -- --All Other Revenue (1.2%) (3.5%) (4.8%) (2.1%)
Total GF Revenues 3.2% 1.7% 3.5% 0.9%
39
Source: Virginia Department of Taxation.

Revised GF Revenue Outlook 2016 – 2018 Biennium
40

Fall Reforecasting Process• Although the FY 2016 shortfall mandated a revenue reforecast in August,
the Code-required Fall reforecasting process is currently underway• Joint Advisory Board of Economists (JABE) met November 9 to review
the latest economic assumptions and revised methodologies• Board includes economists from both private sector and academia; input from IHS
Markit and Moody’s Analytics• Department of Taxation and Secretary of Finance develop a revised forecast based
on input received• Governor’s Advisory Council on Revenue Estimates (GACRE) will meet
November 28• Cross section of leaders from Virginia business and industry, General Assembly
leadership• Members react to forecast developed by Governor’s staff and provide input on the
proposed forecast and predicted economic climate• Revisions to the Official forecast will be submitted with the Governor’s
proposed amendments to Chapter 780• Governor will present to Joint Money Committees on December 16
41

National Economic Outlook:Revisions to the 2016-18 Biennium
• Projections for the national economic picture have degraded since the Interim Forecast was developed based on IHS Markit’s May assessment
• Downward adjustments have been incorporated for all the key variables – GDP, total personal income, wage and salaries, and employment for both FY 2017 and FY 2018
Job Growth GDPTotal
Wage/Salary Income Growth
FY 2017IHS May 2016 Standard 1.7% 2.2% 4.8% 4.2%IHS October 2016 Standard 1.5% 1.7% 4.3% 3.8%
FY 2018IHS May 2016 Standard 1.1% 2.8% 5.1% 5.0%IHS October 2016 Standard 0.9% 2.3% 5.0% 4.7%
42
Projected National Economic Variables
Source: Virginia Department of Taxation

Virginia’s Economic Outlook:Revisions to the 2016-18 Biennium
• In contrast, projections on Virginia’s economic indicators have remained quite static over the past year• Slight upward adjustment to the employment forecast is offset by marginally reduced average wage
estimates in FY 2017• FY 2018 assumptions remain virtually unchanged
Job GrowthAvg
Wage/SalaryTotal
Wage/Salary Income Growth
FY 2017Chapter 780/Nov 2015 1.3% 2.9% 4.3% 3.8%Aug Official/May 2016 Standard 1.5% 2.7% 4.3% 3.8%IHS October 2016 Standard 1.5% 2.8% 4.4% 3.9%
FY 2018Chapter 780/Nov 2015 1.0% 3.0% 4.0% 4.2%Aug Official/May 2016 Standard 1.0% 3.0% 3.9% 4.2%IHS October 2016 Standard 1.0% 2.9% 3.9% 4.2%
43
Projected Economic Variables(National Forecast, adjusted for Virginia specific data)
Source: Virginia Department of Taxation
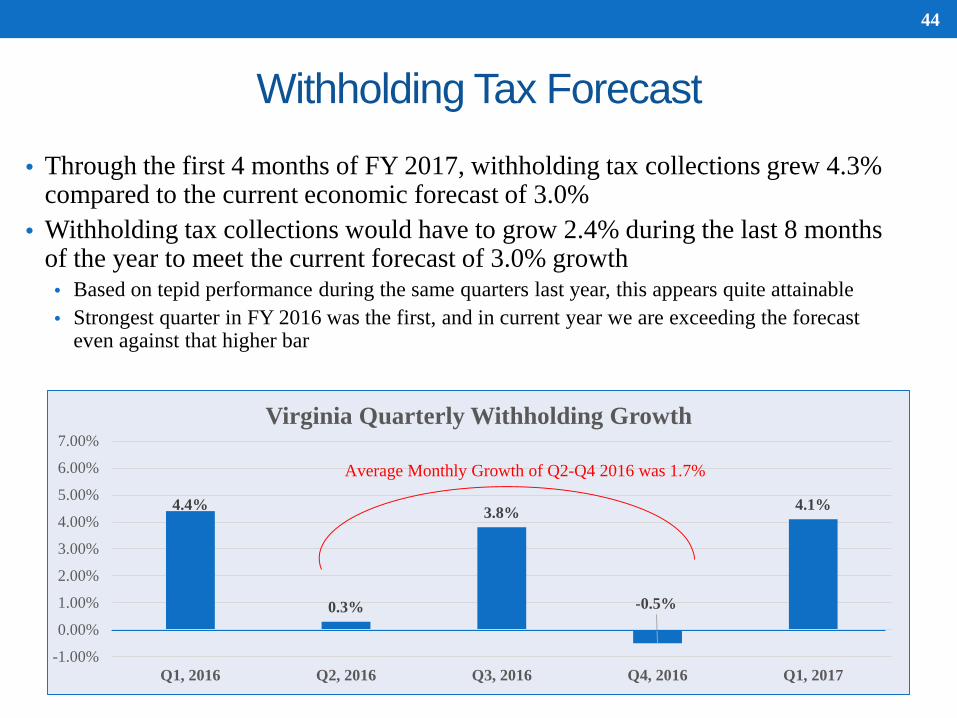
Withholding Tax Forecast
• Through the first 4 months of FY 2017, withholding tax collections grew 4.3% compared to the current economic forecast of 3.0%
• Withholding tax collections would have to grow 2.4% during the last 8 months of the year to meet the current forecast of 3.0% growth• Based on tepid performance during the same quarters last year, this appears quite attainable• Strongest quarter in FY 2016 was the first, and in current year we are exceeding the forecast
even against that higher bar
4.4%
0.3%
3.8%
-0.5%
4.1%
-1.00%
0.00%
1.00%
2.00%
3.00%
4.00%
5.00%
6.00%
7.00%
Q1, 2016 Q2, 2016 Q3, 2016 Q4, 2016 Q1, 2017
Virginia Quarterly Withholding Growth
Average Monthly Growth of Q2-Q4 2016 was 1.7%
44

Annual Growth in Withholding Tax Collections(FY 1991-2016)
45
3.8%
4.7%
8.0%
6.4%
6.6%
6.6%6.3%
10.6%
11.6%
10.3%
6.7%
2.7%
2.3%
7.2%
6.7%
7.2%
6.4%
4.3%
2.3%
0.4%
5.0%
4.2%
2.1% 2.3%
5.3%
2.4%
-1.00%
1.00%
3.00%
5.00%
7.00%
9.00%
11.00%
13.00%
1990
1991
1992
1993
1994
1995
1996
1997
1998
1999
2000
2001
2002
2003
2004
2005
2006
2007
2008
2009
2010
2011
2012
2013
2014
2015
2016
2017
Avg Growth FY 2001-2009
5.1%Avg Growth
FY 2010-20163.1%
Avg GrowthFY 1991-2000
7.5%
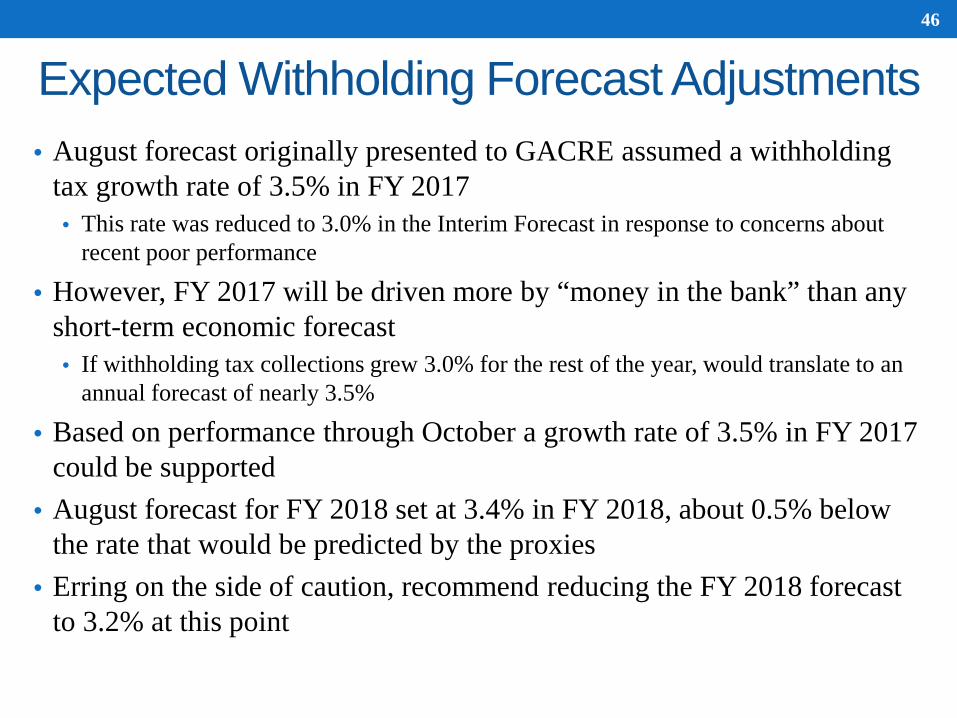
Expected Withholding Forecast Adjustments• August forecast originally presented to GACRE assumed a withholding
tax growth rate of 3.5% in FY 2017 • This rate was reduced to 3.0% in the Interim Forecast in response to concerns about
recent poor performance
• However, FY 2017 will be driven more by “money in the bank” than any short-term economic forecast• If withholding tax collections grew 3.0% for the rest of the year, would translate to an
annual forecast of nearly 3.5%
• Based on performance through October a growth rate of 3.5% in FY 2017 could be supported
• August forecast for FY 2018 set at 3.4% in FY 2018, about 0.5% below the rate that would be predicted by the proxies
• Erring on the side of caution, recommend reducing the FY 2018 forecast to 3.2% at this point
46

Expected Sales Tax Forecast Adjustments• Chapter 780 assumed sales tax growth of 4.0% in FY 2017 and 3.8% in
FY 2018• These were reduced to 2.6% and 2.9% respectively in the interim forecast• Through October, sales tax collections contracted 0.3%• Sales tax collections would have to grow 3.8% during the last 8 months of
the year to meet the current forecast• In light of the low sales tax collections in FY 2016 and poor year-to-date
performance, expect there will be substantial further reductions in this source in the final revised forecast
• Recommend lowering the forecast to1.6% in FY 2017 based on current performance, with no recommended changes to FY 2018 at this point
47

Why Has Sales Tax Growth Been So Anemic?• Like withholding tax collections, the proxy for sales tax collections -
personal income growth – has been a poor predictor of collections in recent years
• Current economic forecast is for total personal income to increase 3.9% in FY 2017 and 4.2% in FY 2018 but sales tax revenues have grown far more slowly
• Not just a Virginia trend, but seen nationallyWhat are some of the contributing factors?• Over half of personal consumption expenditures now are directed to
services• This includes “new” services like mobile phones, internet access, online media
access, etc.• Also reflects demographic shifts with baby-boomer generation spending less
on goods• More likely to be downsizing, not buying more household goods• Income directed toward services like medical care and travel/recreation
48

Why Has Sales Tax Growth Been So Anemic?Contributing factors (continued):• Even within expenditures for goods, ever increasing share is for non-
taxed goods• Growth in the TTF portion of sales tax – which still includes food – has grown an
average 0.9% faster each year over the last 10 years than the GF portion which excludes food sales
• Other policy decisions have excluded substantial components of retail sales from taxation – sales tax refunds have totaled $22.8 million year to date, largely reflecting data center exemptions
• Delayed household formation by the 25-35 year old cohort also depresses sales• Attributed to increasing weight of student loan debt on younger consumers, reducing
disposable income• Lower wages among this large age group
• High growth in untaxed internet sales
49

Total Sales Have Grown an Annual Average of 3.4% Since 2000…Internet Sales Have Increased an Average of 19.5%
50
0.0 1.0 2.0 3.0 4.0 5.0 6.0 7.0 8.0 9.02nd quarter 2016(p)
3rd quarter 20154th quarter 20141st quarter 2014
2nd quarter 20133rd quarter 20124th quarter 20111st quarter 2011
2nd quarter 20103rd quarter 20094th quarter 20081st quarter 2008
2nd quarter 20073rd quarter 20064th quarter 20051st quarter 2005
2nd quarter 20043rd quarter 20034th quarter 20021st quarter 2002
2nd quarter 20013rd quarter 20004th quarter 1999
E-Commerce as a Percentage of Total U.S. Retail Sales
Since 2000, E-Commerce sales have grown an average of 15.3% on a year-over-year quarterly basis and now comprise 8.6% of total Retail Sales
Source: Retail Indicators Branch, U.S. Census Bureau

Expected Forecast AdjustmentsCorporate Income Taxes:• Most difficult source to predict because collections impacted by complex tax planning
decisions made by large firms• Through October, collections have increased 14.6%, well ahead of the annual forecast
of a 3.0% decline• Prior to the August reforecast, assumed growth of 5.9% in FY 2017 • FY 2016 collections impacted by the full implementation of the single-sales factor, with source
contracting 8.0%• Tax reports that the YTD growth in corporate tax collections appear to be broad-based
across all sectors, mirroring strong Q3 earnings reports• September and October are significant months for corporate taxes, with the first estimated
payment being submitted in September for most corporations, and those with February through January fiscal years – largely retailers – filing in October
• Collections increased 10% for the month in September and 39.2% in October based on reduced refunds
• Need to wait and see November’s collections to complete the refund cycle• Based on the money in bank through the first 4 months, recommend increasing the
forecast for FY 2017 to 5.0%• Recommend no change in FY 2018, which currently assumes a contraction of 2.4%
51

Expected Forecast AdjustmentsNonwithholding:• The current interim forecast projects nonwithholding tax collections to decline 1.2% in
FY 2017 and increase 8.2% in FY 2018• The rates assumed in Chapter 780 were 2.1% growth in FY 2017 and 7.2% in FY 2018
• Year to date, nonwithholding collections have decreased by 0.2%, marginally ahead of the forecast
• The first estimated payment of the fiscal year was due in September, and monthly collections contracted 3.1% on a year-over-year basis
• Year-to-date S&P growth – which is a major factor in final payments - has been about 7% • Final payments make up about 40% of total collections for this source
• Growth in proprietors’ income, which drives a portion of estimated payments, is predicted to be less than 4%
• Because an average of 82% of nonwithholding taxes are collected in the last 8 months of the year, with 55% collected in the last quarter, it is too early to make adjustments• Better indication will be available after the next estimated payments are received in January and
could be addressed as part of the Mid-Session reforecast
52

Expected Forecast AdjustmentsRecordation:• Through October, collections have increased 11.6%, ahead of the forecast of
5.5% growth• About 85% of the collections have stemmed from sales versus re-financings
• National Association of Realtors reports both median and average home prices above pre-collapse levels for first time in 2017• Projected price growth of 7% in CY 2016, dropping to 4% in CY 2017 and 2.5% in CY 2018
• Volumes of both new and existing home sales anticipated to continue growing but at modest rates as younger cohorts continue to delay first home purchases
• According to the Virginia Association of Realtors, the third quarter of 2016 saw a 5.7% increase in residential home sales with median sales prices increasing about 2% on a year-over-year basis
• Could expect to see an upward adjustment to this source –• Anticipate growth of about 8% in FY 2017 • Slower growth in the range of 4% in FY 2018
53

Projected Growth Forecast for FY 2017 and FY 2018
Major SourcesInterim FY 2017
FY 2017HAC
Interim FY 2018
FY 2018HAC
Withholding 3.0% 3.5% 3.4% 3.2%
Nonwithholding -1.2% -1.2% 8.2% 8.2%
Refunds 4.0% 3.0% 3.9% 3.9%
Sales 2.6% 1.6% 2.9% 2.9%
Corporate -3.0% 5.0% -2.4% -2.4%
Recordation 5.5% 8.0% 0.0% 4.0%
Insurance 1.3% 1.3% 3.2% 3.2%
Total GF Resources* 1.6% 2.2% 3.6% 3.6%
54

Potential Net Adjustments to Revenue Forecast
• Assumed forecast revisions would increase the total available resources over the biennium by $226.3 million
• Proposed FY 2017 forecast adjustments would add a total of $114.4 million above the interim August forecast• Upward adjustments in withholding, corporate and recordation taxes as well as
reduced refund growth• These increases would be offset by proposed reductions to the sales tax forecast
• Forecast adjustments total $111.8 million in FY 2018 resulting predominantly from the higher FY 2017 base, not from assumed changes in the growth rates• Assumes 0.2% reduction in withholding tax forecast • Offset by assumed growth in recordation tax collections
55

Addressing the Biennial Revenue & Budgetary Shortfall
56

How Does FY 2016 Shortfall Impact FY 2017?
• Chapter 732 – the “Caboose Bill” contained an assumed $265.3million unappropriated balance to be carried forward into FY 2017
• The gap between FY 2016 forecast and actual revenues was almost identical to this amount,meaning that while we had a revenue shortfall in FY 2016, budgeted expenditures for thatyear did not exceed revenues collected
• This means that the $265.3 million carry forward balance embeddedin Chapter 780 is not available to support budgeted spending in FY2017
• In addition to budgetary reductions required to offset the revenuereforecast for the FY 2016-18 biennium, FY 2017 expenditures mustbe reduced further to address spending associated with the assumedbalance which is no longer available
57

Based on the Interim August Reforecast, the Total Projected Budgetary Shortfall Totals $1.5 Billion
FY 2016 Actual FY 2017 FY 2018 Biennial
TotalRevenue:
Revised Interim Forecast – Post-GACRE $18,040.1 $18,338.0 $19,000.4 $37,338.4Official Forecast - CHs 732 & 780 $18,309.0 $18,902.4 $19,633.1 $38,535.5
Actual/Projected Revenue Shortfall -$268.9 -$564.4 -$632.7 -$1,197.1
Change in Transfers -$10.4 -$17.7 -$21.6 -$39.3
Total Shortfall -$279.3 -$582.1 -$654.3 -$1,236.4
Shortfall Applied by Fiscal Year -$861.4 -$654.3 -$1,515.7
58

What is the Process for Addressing the Shortfall?
• The Code of Virginia requires the Governor to prepare a re-estimate of GF revenues if individual income, corporate income, and sales taxes are 1% or more below the budget estimate• The preliminary reforecast was issued in August when the Governor presented to
the Joint Money Committees• In the event of a reforecast, “Part 4” of the budget also requires the
Governor to withhold general fund spending authority to prevent expenditures in excess of anticipated revenues
• This authority is limited to the current fiscal year, and includes express limitations on total reductions by agency as set out in § 4-1.02 of the Appropriation Act• The Governor may not withhold allotments in excess of 15% for any one state or
non-state agency or institution• State agencies may not apportion a larger cut to a specifically named grantee in
excess of the proportional cut received by that agency
59

How The Governor Has Proposed Addressing the FY 2017 Shortfall
Type of Action Specific Action $ in Millions Subtotals
Actions based on revenue triggers
Transfer from Revenue Stabilization FundRemove December 1, 2016, pay increase
$392.3$125.1
$517.4
Use of FY 2016 Balances Agency “pledge” balancesGF Discretionary balances
$23.5$43.3
$66.8
Technical Adjustments Reduce assumed FY 17 carry-forward to FY 18Recognize excess FY 16 Lottery proceedsRecognize Lottery reforecast for FY 17Allocate unspent Lottery allocationsRecognize sales tax adjustment for Basic AidRecognize additional Literary Fund revenues
$70.0$33.2$5.3$8.6
$12.0$25.0
$154.1
Policy Changes Delay Phase-Out of ASTRecover NGF cost of VRS for Higher EdRetain Interest & Credit Card Revs. Higher Ed
$35.1$24.8$4.0
$63.9
Agency Budget Reductions
Across-the-board savings $73.0$73.0
GRAND TOTAL $875.2
60

Almost Half of FY 2017 Agency Savings are One-Time in Nature to Manage the Problem Short-Term…Longer-Term
Solutions Will be Left for FY 2018
Agency Savings by Category 2017 GFResources
2017 GF Approp.
Reduction
2017 Total Impact to
the GF
Transfer of NGF operating balances $16.7 $0.0 $16.7Supplant GF with NGF $0.0 $10.8 $10.8Revert GF Balances $0.0 $2.6 $2.6Turnover and Vacancy Savings $0.0 $5.6 $5.6Reduce or Delay New Spending $0.0 $15.5 $15.5Reduce discretionary expenses $0.2 $11.5 $11.7Reduce or eliminate current services $0.0 $6.4 $6.4Improved business practices and efficiencies $0.0 $2.0 $2.0Reduce personnel costs $0.0 $1.6 $1.6New Fees or Change to Existing Fees $0.1 $0.0 $0.0Totals $17.0 $56.0 $73.0
61
On-going Savings

Next Steps – The Path Ahead . . . • While the Governor has submitted his reduction plan for FY 2017, a number of
items contained within it will require approval of the General Assembly during the 2017 Session
• In addition to the already released savings plans, the Governor must propose options to close the FY 2018 revenue gap currently estimated at $654.3 million• This budgetary gap is increased by an additional $70.0 million based on the Governor’s proposal to
reduce the assumed carry-forward from FY 17 into FY 18 as part of the FY 17 reductions
• In addition, the results of the Fall revenue reforecast could result in adjustments to the assumed revenue forecast, and new spending requirements could further exacerbate the budget gap
• The Governor’s recommendations to address the FY 2018 shortfall, will be contained in his amendments to the FY 2016-18 budget submitted on December 16, 2016
62

Agency Budget Requests• As part of the annual budget development process, agencies are asked to submit
“decision packages” outlining their budget requests for the remainder of the biennium
• In October, agencies submitted preliminary general fund budget requests totaling $77.4 million in FY 2017, and $273.8 million in FY 2018
• The top 2 items make up more than 50% of total requests in FY 2017• $23.8 million for increased CSA costs and $15.7 million for increased inmate
medical care• In the second year, the requests are more disbursed, but the top 9 requests still
comprise more than half of the total• Again, forecast driven expenditures like CSA and inmate medical care are among the largest
requests, totaling $34.9 million and $14.2 million respectively• However, FY 2018 requests also include many discretionary requests in areas like higher
education and economic development• These amounts exclude items like the Medicaid forecast and any adjustments to K-
12 based on average daily membership updates, etc.
63

Agency GF Budget Requests by Secretariat
64
Amount Requested GF 2017 GF 2018
Leg/Judicial/Exec $300,000 $722,000Admin/Finance/Tech $2,030,417 $20,022,044Commerce & Trade $3,250,000 $8,217,840K-12 $0 $5,632,294Higher & Other Ed. $9,807,979 $75,748,049HHR $44,263,674 $124,559,425Ag & Natural Resources $53,477 $2,527,404Public Safety, Vets $17,649,475 $36,401,252TOTAL $77,355,022 $273,830,308
Note: Table excludes the Medicaid forecast and K-12 enrollment and other forecast adjustments

2016-18 Budget Drivers:HAC Staff Identified Mandatory/Statutory Items
GF $ in Millions FY 2017 FY 2018 Total
Medicaid Baseline Forecast 77.0 178.1 255.1
Comprehensive Services Act 23.8 34.9 58.7
DSS - Mandated Reinvestment in Child Welfare Services - 5.5 5.5
DBHDS-Special Hospitalization Costs at State MH Facilities 1.9 2.0 3.9
Involuntary Civil Commitment 0.3 0.3 0.6
Direct Inmate Health Care 15.7 14.2 29.9
DOC: Impact of FLSA Changes (Overtime Rule) 0.9 1.7 2.6
Backfill HAVA Funds - 2.8 2.8
Employee Health Insurance Premium Adjustment - 9.9 9.9
TOTAL - HAC Identified Mandatory/Statutory Drivers 119.6 249.4 369.0
65

Comparison of Available Resources To Identified Budget Drivers
$’s in millions FY 2017 FY 2018 BienniumRevenue Shortfall Based on August Forecast $861.4 $654.3 $1,515.7
Governor's FY 2017 Savings Plan ($875.2) $56.2 ($819.0)
Mandatory/Statutory Spending Drivers $119.6 $249.4 $369.0
Net Shortfall (based on current forecast)
$105.8 $959.9 $1,065.7
Additional Revs. From Potential Forecast Adjustments $114.4 $111.8 $226.2
Net Shortfall ($8.6) $848.1 $839.5
66

2017 Session: Options for Addressing the Remaining Shortfall
67

Options for Addressing the FY 2018 Shortfall• In addition to any across-the-board savings requested by the
Governor, there are a number of large dollar actions that could be taken to address the FY 2018 shortfall. Some of the major items, which total approximately $694.0 million, are listed below:• Use of Rainy Day Fund in FY 2018
• Estimated withdrawal of $392.3 in FY 2017, leaves approximately $225.0 million available for withdrawal in FY 2018 (Note: final amount dependent on changes to forecast)
• Funding Reserved for FY 2018 Portion of Planned Salary Increases• A total of $221.3 million was reserved in FY 2018 to fund the full-year component of
the salary adjustment planned for December 2016• Sweep GF Capital Cash Balances
• Approximately $140.0 million in cash balances from previously authorized projects remains; could swap out cash for debt or a portion thereof
• Accelerated Sales Tax - $25.0 million in second year could be generated by continuing in FY 2018 the Governor’s proposal to retain $2.5 million threshold
68

Options for Addressing the FY 2018 Shortfall• Major Savings Options (continued):
• Offset GF costs of Medicaid forecast with an estimated $26.8 million 2016 carry-forward balance in the Virginia Health Care Fund
• Transfers of $19.9 million from the OAG Consumer Enforcement Fund• Virginia’s share from the settlement with Volkswagen and Kia-Hyundai
• Require Higher Education to cover the NGF portion of the accelerated payback of the VRS deferral• DPB estimates this would generate $16.5 million
• Capture cash appropriated for maintenance reserve• $10.0 million
• Continue Governor’s proposal to retain higher education interest earnings• $4.0 million
• Revise Appropriation for HB 599 Allocations• Assumed 3.2% growth in 2016, level funded in FY 2018. Could generate savings of $5.2
million over biennium by level-funding allocations
• Across-the-board reductions• Revisit New Spending Contained in Chapter 780 for FY 2018
69

FY 2018 Agency Reduction Plans• In October the Governor issued 7.5% savings targets for all agencies
which, exclusive of higher education, total $79.1 million• The total value of exempted programs is $17.4 billion, leaving only
$1.1 billion for across-the-board reductions. The exemptions include: • Aid to localities: Direct Aid for Public Education, SOL support, Compensation
Board, aid to local libraries, PPTRA payments, local health department and social services funding, “599” funding
• HHR Programs: CSA, Medicaid, Children’s Health Insurance, DBHDS, Mental Health Treatment Centers, ID Training Centers, VCBR, TANF, foster care and adoption, auxiliary grants for aged, blind and disabled
• Economic Development Incentive Payments, Housing Trust Fund, Go Virginia, Higher Education Research Initiative, 2017 WQIF deposit, CRCF
• Large areas of Public Safety including operation costs for prisons, detention and diversion centers, inmate education, probation and parole offices, DJJ and State Police
• Debt Service and MELP payments
70

FY 2018 Agency Reduction Plans• The Governor issued separate 7.5% targets for higher education,
which total $114.1 million• DPB reports only items excluded from the GF calculation within
higher education were:• Financial aid, • Federal match for Cooperative Extension, and • Norfolk State University and Virginia State University
• By way of comparison, a total of about $77.0 million was provided directly to the colleges and universities in FY 2018 in Chapter 780 (exclusive of the research initiative)
71

FY 2018 Agency Reduction Plans• If the full 7.5% cut were applied against the non-exempt
agencies/programs and the institutions of higher education, this would generate only $193.2 million• This equates to 20% of the known revenue shortfall in FY 2018 based on the
current forecast• Does not even backfill requirements for known mandatory increases in budget
drivers in FY 2018 (outlined on slide 67)
• Will not be possible to close the gap without instituting targeted cuts against the programs excluded from the across-the-board reductions• This means that cuts to local aid, public education, HHR programs and public
safety will have to be considered
72

New FY 2018 Spending Contained in Chapter 780 Totaled $1.65 billion
73
Mandatory$905,881,641
55%
Compensation$221,281,279
13%
Discretionary$521,893,690
32%

Major New/Discretionary Spending in Chapter 780 Spending by Agency FY 2018Discretionary SpendingPublic Education $211,946,994 Higher Education $120,233,163 Health and Human Resources $76,395,670 Public Safety $47,355,939 Commerce and Trade $42,959,347 Ag and Natural Resources $22,343,000 General Government $659,577
Discretionary Total $521,893,690
Mandatory SpendingHealth & Human Resources $526,887,751 Public Education $280,944,357 State Employee Health Insurance $91,731,143 State Employee OPEB $6,318,390
Mandatory Total $905,881,641
Salary / Compensation Total $221,281,279
74
Challenges of the 2017 Session
• FY 2017 shortfall can be addressed with measures already announced, but solution relies heavily on one-time actions because the fiscal year is already underway
• Heavy lifting will be required to address FY 2018 shortfall
• Big unknown continues to be federal deficit reduction actions and the impact on Virginia• Budget agreement that put off reductions expires at close of federal fiscal
year 2017• How will new President and Congress impact BBA of 2015• Devil is in the details – still need to see how spending caps are applied
75

Appendix
76

Agency / Program Expenditure Description FY 2018Public Education
Reinstated Lottery Proceeds Fund Per Pupil Allocations $147,165,094 Fund COCA @ 10.60% for SOQ Funded Sopport Positions $17,401,152 Additional General Fund Revenue for Lottery PPA $10,000,000 Reduce Literary Fund Support for VRS $10,000,000 Expand At-Risk Add-On Range from 1%-12% to 1%-13% $7,092,036 New - Increase CTE Credentialing and Equipment Allocations $2,499,855 New - Alternative Tchr Compensation Approaches Competitive Grants $2,075,000 New - AY Gov's Schls - Incr Tuition 2.5% & Prov $50/Course/Student Add-on $1,680,704 DOE - One-time Funding to Expand Computer Adaptive Testing to 3-5 gr Math & 3-8 Reading $1,600,000 New - Provide VECF Funding for Pilot Progr of Public-Private Partnerships for Early Childhood Educ $1,500,000 New - VA Preschool Init PPA Incr from $6000 to $6125 $1,449,620 DOE - Add 8 FTEs to Support DOE Programs & School Divisions $1,038,076 New - Provide VECF Grant Funding to Comm Colleges for Skills of Early Educ Tuition $1,000,000 DOE - eMediaVA - Digital Content Dev & On-line Portal for Virtual Va $900,000 Inc Full-time Virtual K12 to 200 Slots & Add New Virtual Math Outreach Progs $828,000 New - STEM Progr/Research Study (VA Air & Space Cntr) $681,975 New - Computer Science Training to Teachers $550,000 Incr After-the-Bell School Breakfast Program Incentive $536,703 Incr Initiatives Providing Eff Discip & Alternatives to Suspension $500,000
Higher EducationHigher Ed Operating Support $61,700,000 Undergraduate Financial Aid $24,098,663 VRIC $14,000,000 Workforce Credential $8,500,000 Graduate Fin Aid $4,425,000 HE Interest Earnings $4,000,000 Cyber Security Initiatives (SCHEV, VT, VCCS) $2,652,000 SCHEV Initiatives (VLDS, Innovation Fund) $857,500
77
Highlighted New/Discretionary Major Spending by Agency

Highlighted New/Discretionary Major Spending by AgencyAgency / Program Expenditure Description FY 2018
Health and Human ResourcesDBHDS/DMAS - DOJ 355 additional ID/DD Waiver Slots, new positions, Rental Choice VA Subsidy $11,527,752 DMAS - comprehensive Medicaid substance use disorder treatment $8,376,260 DMAS - Restore 1.3% inflation for hospitals in FY 2017 $8,262,228 DMAS - Increase personal care rates 2% in FY 17 $7,972,821 DMAS - Restore 1.8% inflation for nursing facilities in FY 2018 $6,356,821 DMAS - Recognize 2016 inflation in future nursing facility rebasing $5,578,840 DMAS - Expand Eligibility to 80% for Waiver Svs. for Seriously Mentally Ill, effective FY 17 $3,782,618 DMAS - 11.5% incr Medicaid private duty nursing rates incr EPSDT, Tech Waiver (equalizes w/ I/DD Waivers) $2,757,484 DMAS - Local inpatient geriatric svs. & discharge asst progr at HGTC & Western State Hospital (WSH) $2,500,000 DMAS - Expand permanent supportive housing program $2,142,900 DMAS - Expand Prog. of Assertive Community Treatment (PACT) teams $2,000,000 DMAS - Expand child psychiatry and children's crisis response services $1,750,000 DSS - Expand foster care and adoption payments for youth ages 18-21 $1,469,698 DBHDS - Expand discharge assistance plan (DAP) funding $1,305,000 DMAS - Fund medical residencies through Medicaid $1,250,000 DSRS - Guardianship services for mentally ill and vulnerable adults $1,011,804 DSS - Increase support for local DSS eligibility workers $1,000,000 DMAS - Restore FY 2017 inflation for CHKD $726,894 DMAS - Increase payment rate by 15% for nursing Homes with special populations (Virginia Home) $619,511 DMAS - Eliminate Vital Records Automation Fund Transfer for Childhood Vaccines $518,421 DBHDS - Add direct care staffing to address increased high acuity admissions at WSH $515,337 CSA - Increase Funds for CSA Local Administration $500,000
78

Highlighted New/Discretionary Major Spending by AgencyAgency / Program Expenditure Description FY 2018
Public SafetyDOC: Open Culpeper Facility $21,744,762 HB 599 funding increase $5,551,177 DOC: New Security Staffing $4,000,000 DCJS: Mental health services in jails $2,500,000 State Police: New positions at Driver and Firearms Training Facility $2,500,000 State Police: Special operations division position $2,400,000 DOC: New mental health specialists at district probation offices $2,200,000 DCJS: Establish community corrections and pre-trial release programs in add’l areas $2,000,000 State Police: New cyber crime investigators $1,400,000 State Police: New information technology positions $1,100,000 DOC: Offset revenue loss from lower inmate telephone commission $1,000,000 Drug Court Funding $960,000
Commerce and TradeGo Virginia $30,225,000 VEDP Admin Funding $5,150,700 Housing Trust Fund $1,500,000 Brownsfield Restoration $1,500,000 Broadband Initiative $1,333,647 Virginia Business Ready Sites $1,250,000 Enterprise Zone Program $1,000,000 Additional Funding for CCAM $1,000,000 DHRM: Learning Management System $659,577
Ag and Natural ResourcesLand Conservation Funding (VDACS, DCR, DHR) $10,000,000 DGIF – Increase Sales Tax $5,000,000 DGIF – Watercraft Sales Tax $2,700,000 AFID Increase $1,220,000 Reforestation of Timberlands Match Increase $773,000 VDACS IT Systems Improvements $700,000 DCR Natural Area Preserves $500,000
79