Embed Size (px)
Citation preview

2017 HOUSTON
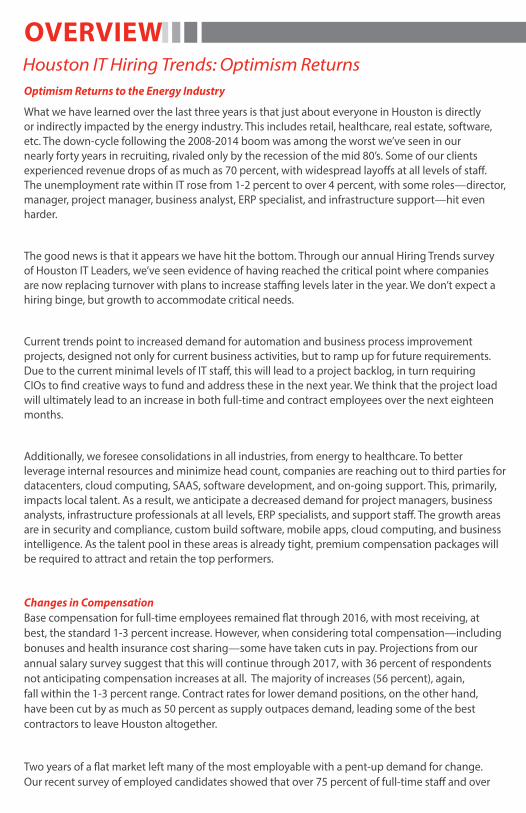
OVERVIEW
Optimism Returns to the Energy Industry
What we have learned over the last three years is that just about everyone in Houston is directly or indirectly impacted by the energy industry. This includes retail, healthcare, real estate, software, etc. The down-cycle following the 2008-2014 boom was among the worst we’ve seen in our nearly forty years in recruiting, rivaled only by the recession of the mid 80’s. Some of our clients experienced revenue drops of as much as 70 percent, with widespread layoffs at all levels of staff. The unemployment rate within IT rose from 1-2 percent to over 4 percent, with some roles—director, manager, project manager, business analyst, ERP specialist, and infrastructure support—hit even harder.
The good news is that it appears we have hit the bottom. Through our annual Hiring Trends survey of Houston IT Leaders, we’ve seen evidence of having reached the critical point where companies are now replacing turnover with plans to increase staffing levels later in the year. We don’t expect a hiring binge, but growth to accommodate critical needs.
Current trends point to increased demand for automation and business process improvement projects, designed not only for current business activities, but to ramp up for future requirements. Due to the current minimal levels of IT staff, this will lead to a project backlog, in turn requiring CIOs to find creative ways to fund and address these in the next year. We think that the project load will ultimately lead to an increase in both full-time and contract employees over the next eighteen months.
Additionally, we foresee consolidations in all industries, from energy to healthcare. To better leverage internal resources and minimize head count, companies are reaching out to third parties for datacenters, cloud computing, SAAS, software development, and on-going support. This, primarily, impacts local talent. As a result, we anticipate a decreased demand for project managers, business analysts, infrastructure professionals at all levels, ERP specialists, and support staff. The growth areas are in security and compliance, custom build software, mobile apps, cloud computing, and business intelligence. As the talent pool in these areas is already tight, premium compensation packages will be required to attract and retain the top performers.
Changes in CompensationBase compensation for full-time employees remained flat through 2016, with most receiving, at best, the standard 1-3 percent increase. However, when considering total compensation—including bonuses and health insurance cost sharing—some have taken cuts in pay. Projections from our annual salary survey suggest that this will continue through 2017, with 36 percent of respondents not anticipating compensation increases at all. The majority of increases (56 percent), again, fall within the 1-3 percent range. Contract rates for lower demand positions, on the other hand, have been cut by as much as 50 percent as supply outpaces demand, leading some of the best contractors to leave Houston altogether.
Two years of a flat market left many of the most employable with a pent-up demand for change. Our recent survey of employed candidates showed that over 75 percent of full-time staff and over
Houston IT Hiring Trends: Optimism Returns
90 percent of contractors are interested in new opportunities. This could well lead to the talent pool engaging in strategic repositioning—picking up new skills, seeking shorter commutes and increases in compensation. We advise our clients to consider the cost of retention versus the cost of turnover. In addition to compensation, a good retention strategy could include lower cost options such as working from home, increased free time and flexibility, new projects, and expressing appreciation for employee efforts and loyalty; an accommodating work environment can make a huge difference in employee retention.
One of the big challenges for CIOs will be budgetary pressure, despite a 33 percent increase in respondents reporting budget increases in 2017. The transition from building to sustaining has also caused unrest at the executive level with a high percentage interested in other options; however, a strong CIO business strategy can have a tremendous impact in repositioning companies for growth or sale.
We are living in interesting times, and what we have learned from the past is that Houston is a vibrant city with an entrepreneurial attitude. We have the largest port, medical center, and energy industry in the country. There is buzz about new builds for chemical and refineries, pipelines, manufacturing facilities, and being able to ramp up quickly for domestic oil & gas production. With the glut of premium office space, favorable tax rates, low cost of living, and a business-friendly city, we are in prime position to attract new business growth to our area.
How JDA Can Help With over 35 years of experience actively recruiting IT professionals in Houston, JDA is a great resource to identify the hidden job market for either full-time or contract positions.
For more information on how we can help you develop a great career, send a resume to [email protected].
We’re optimistic for the future. We look forward to working with you.
About the SurveyThe information gathered here was compiled from the responses of roughly 100 Houston-area IT managers, 60 percent of whom are the top IT person at their company. The turn-over statistics are from our candidate survey of close to 1000 employed workers.
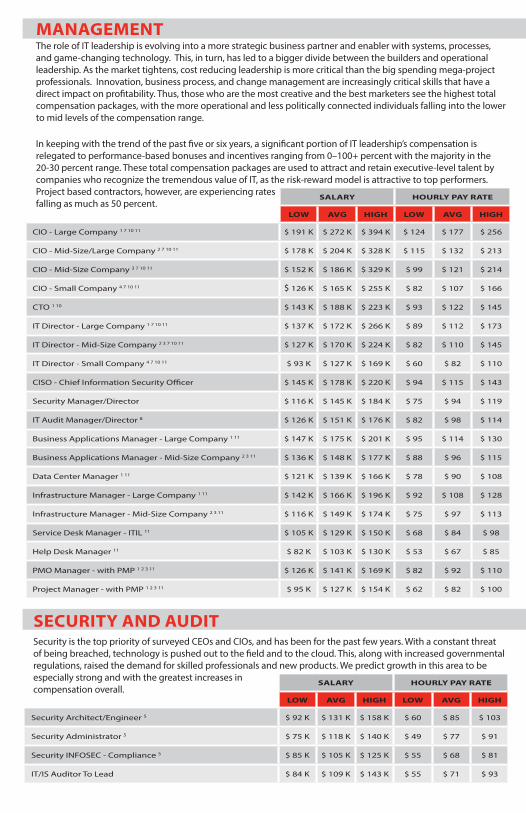
SALARY HOURLY PAY RATE
LOW AVG HIGH LOW AVG HIGH
CIO - Large Company 1 7 10 11 $ 191 K $ 272 K $ 394 K $ 124 $ 177 $ 256
CIO - Mid-Size/Large Company 2 7 10 11 $ 178 K $ 204 K $ 328 K $ 115 $ 132 $ 213
CIO - Mid-Size Company 3 7 10 11 $ 152 K $ 186 K $ 329 K $ 99 $ 121 $ 214
CIO - Small Company 4 7 10 11 $ 126 K $ 165 K $ 255 K $ 82 $ 107 $ 166
CTO 1 10 $ 143 K $ 188 K $ 223 K $ 93 $ 122 $ 145
IT Director - Large Company 1 7 10 11 $ 137 K $ 172 K $ 266 K $ 89 $ 112 $ 173
IT Director - Mid-Size Company 2 3 7 10 11 $ 127 K $ 170 K $ 224 K $ 82 $ 110 $ 145
IT Director - Small Company 4 7 10 11 $ 93 K $ 127 K $ 169 K $ 60 $ 82 $ 110
CISO - Chief Information Security Officer $ 145 K $ 178 K $ 220 K $ 94 $ 115 $ 143
Security Manager/Director $ 116 K $ 145 K $ 184 K $ 75 $ 94 $ 119
IT Audit Manager/Director 8 $ 126 K $ 151 K $ 176 K $ 82 $ 98 $ 114
Business Applications Manager - Large Company 1 11 $ 147 K $ 175 K $ 201 K $ 95 $ 114 $ 130
Business Applications Manager - Mid-Size Company 2 3 11 $ 136 K $ 148 K $ 177 K $ 88 $ 96 $ 115
Data Center Manager 1 11 $ 121 K $ 139 K $ 166 K $ 78 $ 90 $ 108
Infrastructure Manager - Large Company 1 11 $ 142 K $ 166 K $ 196 K $ 92 $ 108 $ 128
Infrastructure Manager - Mid-Size Company 2 3 11 $ 116 K $ 149 K $ 174 K $ 75 $ 97 $ 113
Service Desk Manager - ITIL 11 $ 105 K $ 129 K $ 150 K $ 68 $ 84 $ 98
Help Desk Manager 11 $ 82 K $ 103 K $ 130 K $ 53 $ 67 $ 85
PMO Manager - with PMP 1 2 3 11 $ 126 K $ 141 K $ 169 K $ 82 $ 92 $ 110
Project Manager - with PMP 1 2 3 11 $ 95 K $ 127 K $ 154 K $ 62 $ 82 $ 100
SALARY HOURLY PAY RATE
LOW AVG HIGH LOW AVG HIGH
Security Architect/Engineer 5 $ 92 K $ 131 K $ 158 K $ 60 $ 85 $ 103
Security Administrator 5 $ 75 K $ 118 K $ 140 K $ 49 $ 77 $ 91
Security INFOSEC - Compliance 5 $ 85 K $ 105 K $ 125 K $ 55 $ 68 $ 81
IT/IS Auditor To Lead $ 84 K $ 109 K $ 143 K $ 55 $ 71 $ 93
SECURITY AND AUDITSecurity is the top priority of surveyed CEOs and CIOs, and has been for the past few years. With a constant threat of being breached, technology is pushed out to the field and to the cloud. This, along with increased governmental regulations, raised the demand for skilled professionals and new products. We predict growth in this area to be especially strong and with the greatest increases in compensation overall.
MANAGEMENTThe role of IT leadership is evolving into a more strategic business partner and enabler with systems, processes, and game-changing technology. This, in turn, has led to a bigger divide between the builders and operational leadership. As the market tightens, cost reducing leadership is more critical than the big spending mega-project professionals. Innovation, business process, and change management are increasingly critical skills that have a direct impact on profitability. Thus, those who are the most creative and the best marketers see the highest total compensation packages, with the more operational and less politically connected individuals falling into the lower to mid levels of the compensation range. In keeping with the trend of the past five or six years, a significant portion of IT leadership’s compensation is relegated to performance-based bonuses and incentives ranging from 0–100+ percent with the majority in the 20-30 percent range. These total compensation packages are used to attract and retain executive-level talent by companies who recognize the tremendous value of IT, as the risk-reward model is attractive to top performers. Project based contractors, however, are experiencing ratesfalling as much as 50 percent.
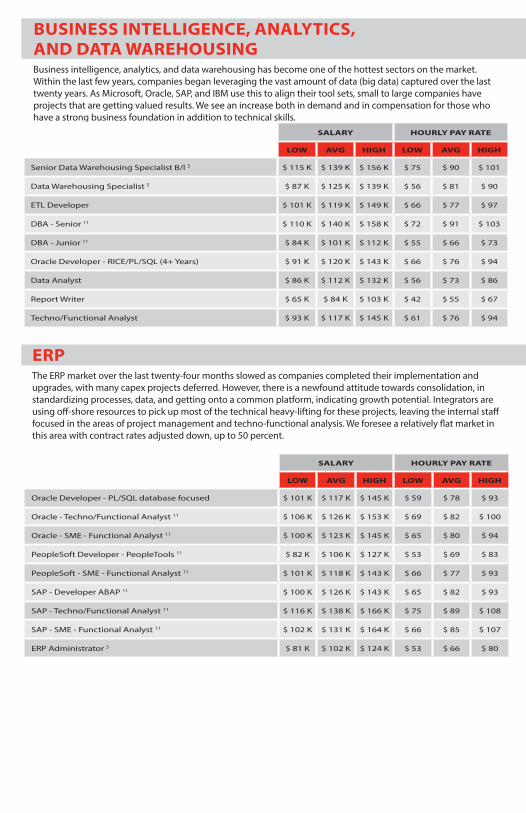
BUSINESS INTELLIGENCE, ANALYTICS, AND DATA WAREHOUSING Business intelligence, analytics, and data warehousing has become one of the hottest sectors on the market. Within the last few years, companies began leveraging the vast amount of data (big data) captured over the last twenty years. As Microsoft, Oracle, SAP, and IBM use this to align their tool sets, small to large companies have projects that are getting valued results. We see an increase both in demand and in compensation for those who have a strong business foundation in addition to technical skills.
SALARY HOURLY PAY RATE
LOW AVG HIGH LOW AVG HIGH
Oracle Developer - PL/SQL database focused $ 101 K $ 117 K $ 145 K $ 59 $ 78 $ 93
Oracle - Techno/Functional Analyst 11 $ 106 K $ 126 K $ 153 K $ 69 $ 82 $ 100
Oracle - SME - Functional Analyst 11 $ 100 K $ 123 K $ 145 K $ 65 $ 80 $ 94
PeopleSoft Developer - PeopleTools 11 $ 82 K $ 106 K $ 127 K $ 53 $ 69 $ 83
PeopleSoft - SME - Functional Analyst 11 $ 101 K $ 118 K $ 143 K $ 66 $ 77 $ 93
SAP - Developer ABAP 11 $ 100 K $ 126 K $ 143 K $ 65 $ 82 $ 93
SAP - Techno/Functional Analyst 11 $ 116 K $ 138 K $ 166 K $ 75 $ 89 $ 108
SAP - SME - Functional Analyst 11 $ 102 K $ 131 K $ 164 K $ 66 $ 85 $ 107
ERP Administrator 5 $ 81 K $ 102 K $ 124 K $ 53 $ 66 $ 80
ERPThe ERP market over the last twenty-four months slowed as companies completed their implementation and upgrades, with many capex projects deferred. However, there is a newfound attitude towards consolidation, in standardizing processes, data, and getting onto a common platform, indicating growth potential. Integrators are using off-shore resources to pick up most of the technical heavy-lifting for these projects, leaving the internal staff focused in the areas of project management and techno-functional analysis. We foresee a relatively flat market in this area with contract rates adjusted down, up to 50 percent.
SALARY HOURLY PAY RATE
LOW AVG HIGH LOW AVG HIGH
Senior Data Warehousing Specialist B/I 5 $ 115 K $ 139 K $ 156 K $ 75 $ 90 $ 101
Data Warehousing Specialist 5 $ 87 K $ 125 K $ 139 K $ 56 $ 81 $ 90
ETL Developer $ 101 K $ 119 K $ 149 K $ 66 $ 77 $ 97
DBA - Senior 11 $ 110 K $ 140 K $ 158 K $ 72 $ 91 $ 103
DBA - Junior 11 $ 84 K $ 101 K $ 112 K $ 55 $ 66 $ 73
Oracle Developer - RICE/PL/SQL (4+ Years) $ 91 K $ 120 K $ 143 K $ 66 $ 76 $ 94
Data Analyst $ 86 K $ 112 K $ 132 K $ 56 $ 73 $ 86
Report Writer $ 65 K $ 84 K $ 103 K $ 42 $ 55 $ 67
Techno/Functional Analyst $ 93 K $ 117 K $ 145 K $ 61 $ 76 $ 94
SALARY HOURLY PAY RATE
LOW AVG HIGH LOW AVG HIGH
Project/ Team Leader - Applications 1 2 3 11 $ 101 K $ 133 K $ 163 K $ 66 $ 86 $ 106
Enterprise/Applications Architect $ 108 K $ 144 K $ 170 K $ 70 $ 94 $ 110
Senior Developer/Team Lead 5 $ 107 K $ 145 K $ 155 K $ 69 $ 94 $ 101
Systems/Business Analyst 11 $ 87 K $ 123 K $ 145 K $ 56 $ 80 $ 94
SharePoint Developer (4-10 Years) $ 95 K $ 115 K $ 135 K $ 62 $ 75 $ 88
Developer - .NET (4-10 Years) 5 $ 93 K $ 125 K $ 148 K $ 61 $ 81 $ 96
Developer - JAVA (4-10 Years) 5 $ 84 K $ 108 K $ 140 K $ 55 $ 70 $ 91
Developer - C++ $ 84 K $ 117 K $ 136 K $ 55 $ 76 $ 89
Developer - Client Server (3+ Years) $ 73 K $ 97 K $ 126 K $ 47 $ 63 $ 82
Junior Developer (0-4 Years) 5 $ 62 K $ 86 K $ 109 K $ 40 $ 56 $ 71
Quality Assurance - Applications Testing $ 63 K $ 85 K $ 116 K $ 41 $ 55 $ 75
Quality Assurance - Team Lead/Manager $ 104 K $ 127 K $ 155 K $ 67 $ 83 $ 101
Entry-Level Applications - 4-Year Degree $ 45 K $ 53 K $ 75 K $ 29 $ 34 $ 49
Entry-Level Applications - 2-Year Degree $ 36 K $ 44 K $ 52 K $ 23 $ 29 $ 34
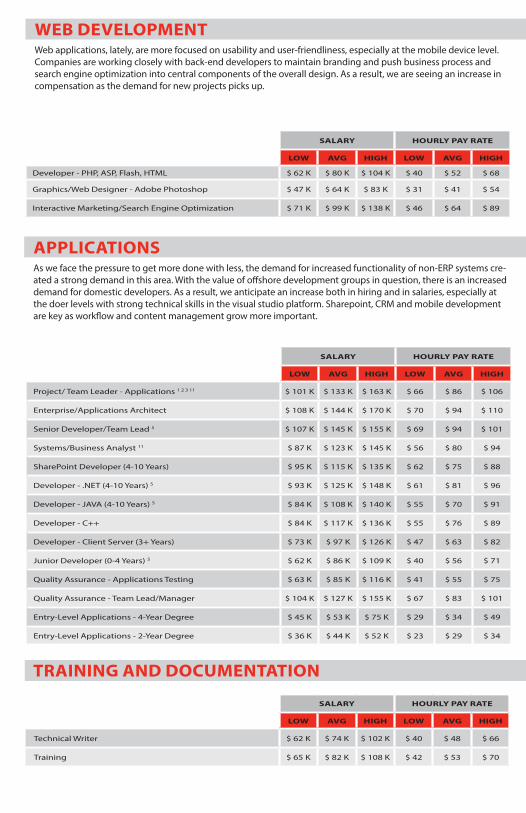
APPLICATIONS As we face the pressure to get more done with less, the demand for increased functionality of non-ERP systems cre-ated a strong demand in this area. With the value of offshore development groups in question, there is an increased demand for domestic developers. As a result, we anticipate an increase both in hiring and in salaries, especially at the doer levels with strong technical skills in the visual studio platform. Sharepoint, CRM and mobile development are key as workflow and content management grow more important.
SALARY HOURLY PAY RATE
LOW AVG HIGH LOW AVG HIGH
Developer - PHP, ASP, Flash, HTML $ 62 K $ 80 K $ 104 K $ 40 $ 52 $ 68
Graphics/Web Designer - Adobe Photoshop $ 47 K $ 64 K $ 83 K $ 31 $ 41 $ 54
Interactive Marketing/Search Engine Optimization $ 71 K $ 99 K $ 138 K $ 46 $ 64 $ 89
WEB DEVELOPMENTWeb applications, lately, are more focused on usability and user-friendliness, especially at the mobile device level. Companies are working closely with back-end developers to maintain branding and push business process and search engine optimization into central components of the overall design. As a result, we are seeing an increase in compensation as the demand for new projects picks up.
TRAINING AND DOCUMENTATION
SALARY HOURLY PAY RATE
LOW AVG HIGH LOW AVG HIGH
Technical Writer $ 62 K $ 74 K $ 102 K $ 40 $ 48 $ 66
Training $ 65 K $ 82 K $ 108 K $ 42 $ 53 $ 70

SALARY HOURLY PAY RATE
LOW AVG HIGH LOW AVG HIGH
Infrastructure Project Manager 1 2 3 11 $ 102 K $ 114 K $ 155 K $ 66 $ 74 $ 101
Communications Architect - CCIE 1 2 3 $ 110 K $ 135 K $ 162 K $ 72 $ 88 $ 105
Systems Network Engineer (10+ Years) $ 98 K $ 120 K $ 149 K $ 64 $ 78 $ 97
Communications - VoIP $ 82 K $ 109 K $ 135 K $ 53 $ 71 $ 88
UNIX/Linux Administrator $ 68 K $ 105 K $ 130 K $ 44 $ 68 $ 84
UNIX/Linux System Engineer 1 2 3 $ 87 K $ 119 K $ 150 K $ 56 $ 77 $ 98
2nd Level LAN Administrator (7+ Years) $ 77 K $ 100 K $ 127 K $ 50 $ 65 $ 83
1st Level LAN Administrator (2+ Years) $ 60 K $ 80 K $ 93 K $ 39 $ 52 $ 60
Entry-Level Infrastructure - 4-Year Degree $ 45 K $ 49 K $ 68 K $ 29 $ 32 $ 44
Entry-Level Infrastructure - 2-Year Degree $ 32 K $ 38 K $ 46 K $ 20 $ 25 $ 30
Default:
· Rates apply to greater Houston metropolitan area.
· Candidate has 4-year degree unless otherwise noted.
· Contract term of greater than 6 months.
· Highs and lows were eliminated in compiling the survey.
· A more detailed survey is available for executive compensation at www.jdapsi.com.
ASSUMPTIONS
SALARY HOURLY PAY RATE
LOW AVG HIGH LOW AVG HIGH
Help Desk - Level III Service Desk (7+ Years) $ 84 K $ 103 K $ 126 K $ 55 $ 67 $ 82
Help Desk - Level II Support (5-10 Years) 11 $ 68 K $ 85 K $ 99 K $ 44 $ 55 $ 64
Help Desk - Level I Support (0-10 Years) 11 $ 42 K $ 58 K $ 70 K $ 27 $ 38 $ 45
Software Support (2+ Years) 11 $ 50 K $ 73 K $ 95 K $ 32 $ 47 $ 62
Hardware Technician (1-5 Years) 11 $ 38 K $ 52 K $ 77 K $ 25 $ 34 $ 50
SERVICE DESK / HELP DESK / DESKTOP The entire framework of the service desk has shifted over the past few years as companies move activities either offshore to reduce cost or onshore to improve customer service. While these roles are being redefined, the push toward the use of structured methodologies such as ITIL and SLA’s has improved the processes; however the growth in this sector is leveling off. As a result, the demand and salaries for professionals at all levels in this sector have flattened.
INFRASTRUCTUREConsolidation, standardization, virtualization, cloud computing, storage, and demand for upgrades, both hardware and software, drive this area. We see this being flat this year as capex expenses get pushed back. Newer technolo-gies allow fewer people to support more users, leading the overall demand to emphasize a department centered on high skills and diversification. We see growth in consulting as the go to for big projects or new technology implementations.
Specific:
1. Large company is defined as greater than 100+ IT employees.
2. Mid/Large company is defined as 50-100 IT employees.
3. Mid-size company is defined as 10 to 49 IT employees.
4. Small company is defined as fewer than 10 IT employees.
5. Indicates hot skill – add 10 to 15 percent to salary (i.e.: Security, B/I, Mobile, engineering).
6. Excludes bonuses.
7. Top IT person.
8. Limited pool of candidates.
9. Team member.
10. Base compensation (Total = base + bonus + benefits).
11. Current contract market rates could drop up to 50 percent less.
5 REASONS TO CHOOSE JDA
JDA is Established: You will reap the benefits that come only from time - lots of experience and a great reputation in the industry.
JDA is Reliable: You will have continual, timely access to all JDA staff members.
JDA is Effective: You will be presented with the right professional matches in the least amount of time using our “industry-best” processes and procedures.
JDA is Knowledgeable: You will be provided with the information necessary to make smart staffing and career decisions in this ever-evolving IT employment market.
JDA is Friendly: You will like working with us because we enjoy what we do, and it is reflected in the level of service provided to you.
JDA Professional Services, Inc. is a Houston-based IT staffing firm specializing in the recruitment of strategic-technical to executive-
level professionals. We provide staffing solutions through full-time, contract, and project-based placements. Since 1981, we
have been helping companies build great IT departments while helping IT professionals find the right career opportunities.
CONTACT JDA [email protected]
PHONE 713.548.5400 FAX 713.548.5480
VISIT US ONLINE AT WWW.JDAPSI.COM