Embed Size (px)
Citation preview

2017 first quarter results
9 May 2017

E.ON fully on track for FY 2017 E.ON 2017 first quarter results
– EBIT1 below prior year mainly due to expected developments in commodity retail and non-core
+ Q1 not representative for FY 2017 performance
+ Lower interest accretion and tax rate compensate for operational drivers at Adj. Net Income1 line
+ Full year guidance for 2017 confirmed
+ Economic net debt improved by €1.6bn due to high cash flow and capital increase
Highlights
525
Adj. Net Income1
1.038
EBITDA1 EBIT1
1.517
Q1 2017
1. Adjusted for non operating effects
€ m
2

EBIT below prior year
60
Energy Networks Renewables
-512
Q1 2017 Preussen Elektra
-221
Corp. Functions & Other,
Consolidation
-90
1.038
-3
Customer Solutions
-258
Q1 2016 w/o div. operations
1.550
Divested Operations
-21
Q1 2016
1.571
EBIT1 Q1 2017 vs. Q1 2016 € m
1. Adjusted for non operating effects 3
E.ON 2017 first quarter results

Adjusted Net Income supported by lower accretion and taxes
EPS (€ per share)
Q1 2017 € m
0.26 525
843
Adjusted Net Income1
Minorities -108
Income Taxes -210
Profit before Taxes1
Other interest expenses
-20
Interest on fin. assets/
liabilities2
-175
Group EBIT1 1.038
~€ 20m improvement YoY
~€200m improvement due to significant lower accretion of nuclear provisions
Tax rate of 25% (vs. 33% in Q1 2016)
Unchanged to previous year
Adjusted net income is supported by lower nuclear accretion charges and taxes
1. Adjusted for non operating effects, 2. Without accretion of nuclear provisions 4
E.ON 2017 first quarter results

END improves €1.6 bn due to high cash flow and capital increase
-0.2-0.6
-4.0-4.0
0.8
Build & Sell/ Divestment
0.1
Capital Measures
1.4
Investments OCF
0.9
END FY 2016
-26.3
-0.9
-21.4
-24.7
-21.5
Change in AROs END Q1 2017
€ bn
END1 Q1 2017 vs. FY 2016
1. Economic net debt definition takes into account the decommissioning provisions calculated with a real discount rate of 0.0% as opposed to IFRS ARO’s.
Net financial position
Pension provisions
AROs
5
E.ON 2017 first quarter results

Outlook 2017 confirmed
EBIT1
Adj. Net Income1
Outlook 2017
1. Adjusted for non operating effects
€2.8-3.1 bn
€1.2-1.45 bn
+ Regulatory effects (e.g. NeMoG, pensions), lower maintenance costs
+ Tariff increase in Sweden
+ Positive development in CZ, HU/ normalization in Turkey
Effects for remainder of 2017
6
E.ON 2017 first quarter results
+ Omission of nuclear fuel tax payments
+ Operational improvements
– Lower hedging prices
– Asset retirement cost (ARC) effect
Energy Networks
Customer Solutions
+ Price increases in Germany & UK
+ Focus on sales and customer retention in UK
+ UK efficiency program
Renewables + Normalizing wind yields
– Arkona book gain in Q2 2016

Appendix

Financial Highlights
€bn Q1 2016 Q1 2017 % YoY
Sales 11.3 10.5 -7
EBITDA 1 2.0 1.5 -25
EBIT 1 1.6 1.0 -34
Adjusted net income 1 0.7 0.5 -20
OCF bIT 0.8 1.0 +33
Investments 0.6 0.6 +1
Economic net debt ² 26.3 24.7 -6
1. Adjusted for non operating effects, 2. Economic net debt as per 31 Dec 2016 and 31 Mar 2017; Economic net debt definition takes into account the decommissioning provisions calculated with a real discount rate of 0.0% as opposed to IFRS ARO’s 8
E.ON 2017 first quarter results

Cash conversion at 68% due to seasonal effects in Customer Solutions business
Q1 2017 € bn
Cash Adjustments
0.0
0.9
Interest Payments
Tax Payments
-0.1 -0.1
OCF bIT
1.0
Changes in WC
-0.5
OCF
-0.6
Capex
0.3
FCF EBITDA1
1.5
CCR2: 68%
1. Adjusted for non operating effects, 2. Cash Conversion Rate: OCF bIT / EBITDA 9
E.ON 2017 first quarter results
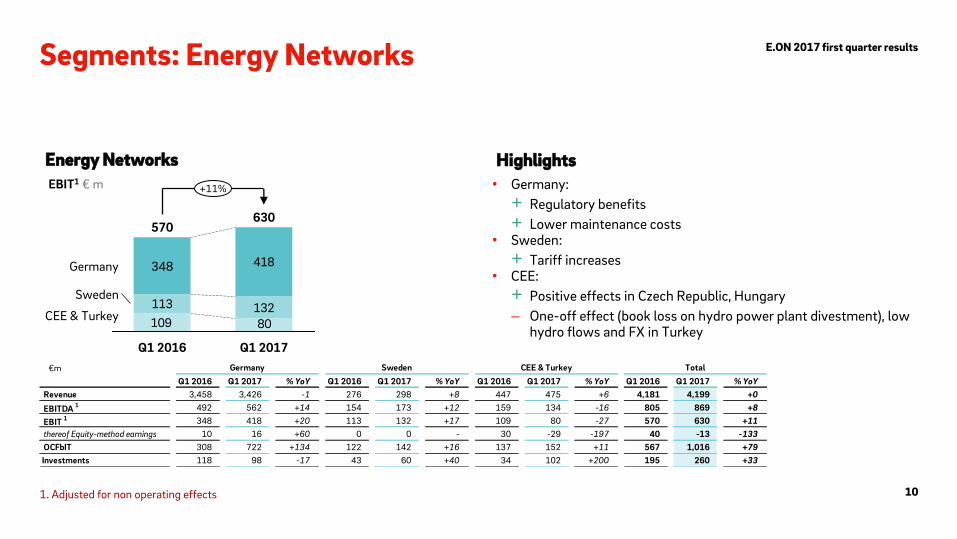
Segments: Energy Networks
• Germany:
+ Regulatory benefits
+ Lower maintenance costs • Sweden:
+ Tariff increases • CEE:
+ Positive effects in Czech Republic, Hungary
– One-off effect (book loss on hydro power plant divestment), low hydro flows and FX in Turkey
Energy Networks Highlights
113 13280109
418
+11%
CEE & Turkey
Sweden
Germany
Q1 2017
630
Q1 2016
570
348
1. Adjusted for non operating effects
EBIT1 € m
€m
Q1 2016 Q1 2017 % YoY Q1 2016 Q1 2017 % YoY Q1 2016 Q1 2017 % YoY Q1 2016 Q1 2017 % YoY
Revenue 3,458 3,426 -1 276 298 +8 447 475 +6 4,181 4,199 +0
EBITDA 1 492 562 +14 154 173 +12 159 134 -16 805 869 +8
EBIT 1 348 418 +20 113 132 +17 109 80 -27 570 630 +11
thereof Equity-method earnings 10 16 +60 0 0 - 30 -29 -197 40 -13 -133
OCFbIT 308 722 +134 122 142 +16 137 152 +11 567 1,016 +79
Investments 118 98 -17 43 60 +40 34 102 +200 195 260 +33
TotalGermany Sweden CEE & Turkey
10
E.ON 2017 first quarter results
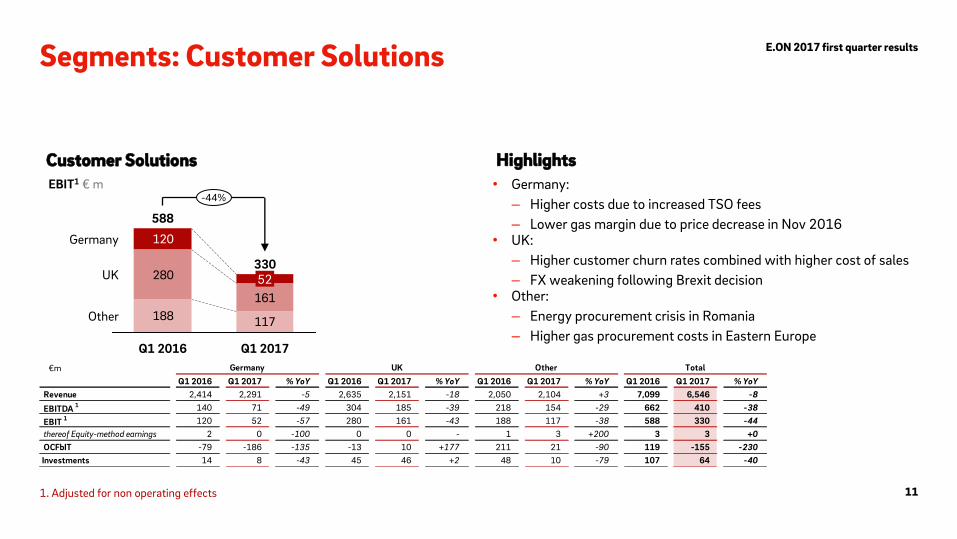
Segments: Customer Solutions
Customer Solutions Highlights
• Germany:
– Higher costs due to increased TSO fees
– Lower gas margin due to price decrease in Nov 2016 • UK:
– Higher customer churn rates combined with higher cost of sales
– FX weakening following Brexit decision • Other:
– Energy procurement crisis in Romania
– Higher gas procurement costs in Eastern Europe
188 117
280
161
120
-44%
Other
UK
Germany
Q1 2017
330 52
Q1 2016
588
EBIT1 € m
1. Adjusted for non operating effects
€m
Q1 2016 Q1 2017 % YoY Q1 2016 Q1 2017 % YoY Q1 2016 Q1 2017 % YoY Q1 2016 Q1 2017 % YoY
Revenue 2,414 2,291 -5 2,635 2,151 -18 2,050 2,104 +3 7,099 6,546 -8
EBITDA 1 140 71 -49 304 185 -39 218 154 -29 662 410 -38
EBIT 1 120 52 -57 280 161 -43 188 117 -38 588 330 -44
thereof Equity-method earnings 2 0 -100 0 0 - 1 3 +200 3 3 +0
OCFbIT -79 -186 -135 -13 10 +177 211 21 -90 119 -155 -230
Investments 14 8 -43 45 46 +2 48 10 -79 107 64 -40
TotalUKGermany Other
11
E.ON 2017 first quarter results

• Offshore:
– Low wind yields
– Adverse FX development following Brexit decision • Onshore:
+ COD of Colbeck’s Corner in May 2016
+ Higher Production of US wind farms
Segments: Renewables
Renewables Highlights
59 61
104 99
-2%
Offshore/Other
Onshore/Solar
Q1 2017
163 160
Q1 2016
EBIT1 € m
1. Adjusted for non operating effects
€m
Q1 2016 Q1 2017 % YoY Q1 2016 Q1 2017 % YoY Q1 2016 Q1 2017 % YoY
Revenue 196 188 -4 201 188 -6 397 376 -5
EBITDA 1 112 113 +1 143 136 -5 255 249 -2
EBIT 1 59 61 +3 104 99 -5 163 160 -2
thereof Equity-method earnings 11 11 +0
OCFbit 207 187 -10
Investments 241 251 +4
Onshore Wind / Solar Offshore Wind / Others Total
12
E.ON 2017 first quarter results

Segments: PreussenElektra
PreussenElektra Highlights
248
27
-89%
Q1 2017 Q1 2016
– Lower achieved power prices
– Lower volumes due to outages
– ARC Depreciation
Hedged Prices Germany (€/MWh) as of 31 March 2017
EBIT1 € m
1. Adjusted for non operating effects
€m
Q1 2016 Q1 2017 % YoY
Revenue 453 364 -20
EBITDA 1 270 74 -73
EBIT 1 248 27 -89
thereof Equity-method earnings 21 26 +24
OCFbIT 223 207 -7
Investments 4 5 +25
PreussenElektra
13
E.ON 2017 first quarter results
27
26
32
37
2017
2016
2019
2018
100%
94%
30%
100%

Adjusted Net Income
€m Q1 2016 Q1 2017 % YoY
EBITDA 1 2,012 1,517 -25
Depreciation/amortization -441 -479 -9
EBIT 1 1,571 1,038 -34
Economic interest expense (net) -422 -195 +54
EBT 1 1,149 843 -27
Income Taxes on EBT 1 -384 -210 +45
% of EBT 1 -33% -25% -
Non-controlling interests -107 -108 -1
Adjusted net income 1 658 525 -20
1. Adjusted for non operating effects 14
E.ON 2017 first quarter results

From EBITDA to Net Income
€m Q1 2016 Q1 2017 % YoY
EBITDA 1 2,012 1,517 -25
Depreciation/Amortization/Impairments -441 -479 -9
EBIT 1 1,571 1,038 -34
Economic interest expense (net) -422 -195 +54
Net book gains -4 52 +1,400
Restructuring -49 -94 -92
Mark-to-market valuation of derivatives 129 -308 -339
Impairments (net) -5 3 +160
Other non-operating earnings -50 394 +888
Income/Loss from continuing operations before income taxes 1,170 890 -24
Income taxes -413 -155 +62
Income/loss from discontinued operations, net 509 0 -100
Non-controlling interests 96 107 +11
Net income/loss attributable to shareholders of E.ON SE 1,170 628 -46
1. Adjusted for non operating effects 15
E.ON 2017 first quarter results

Cash effective investments by unit
1. Adjusted for non operating effects
€m Q1 2016 Q1 2017 % YoY
Energy Networks 195 260 +33
Customer Solutions 107 64 -40
Renewables 241 251 +4
Corporate Functions & Other 33 8 -76
Consolidation 1 0 -100
PreussenElektra 4 5 +25
Investments 581 588 +1
E.ON 2017 first quarter results
16
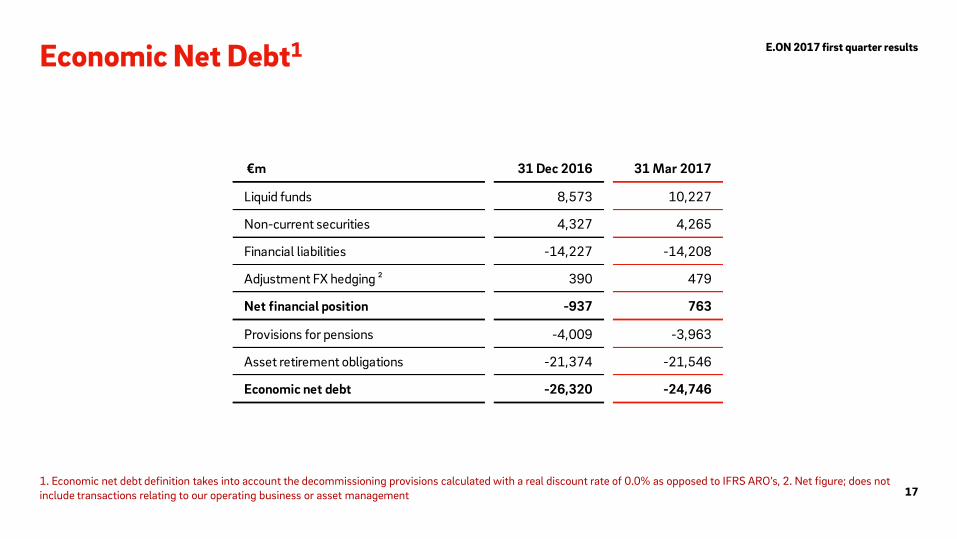
Economic Net Debt1
1. Economic net debt definition takes into account the decommissioning provisions calculated with a real discount rate of 0.0% as opposed to IFRS ARO’s, 2. Net figure; does not include transactions relating to our operating business or asset management
€m 31 Dec 2016 31 Mar 2017
Liquid funds 8,573 10,227
Non-current securities 4,327 4,265
Financial liabilities -14,227 -14,208
Adjustment FX hedging ² 390 479
Net financial position -937 763
Provisions for pensions -4,009 -3,963
Asset retirement obligations -21,374 -21,546
Economic net debt -26,320 -24,746
E.ON 2017 first quarter results
17

Economic interest expense (net)
€m Q1 2016 Q1 2017 Difference
(in € m)
Interest from financial assets/liabilities -168 -175 -7
Interest cost from provisions for pensions and similar provisions -22 -21 +1
Accretion of provisions for retirement obligation and similar provisions -226 -17 +209
Construction period interests¹ 10 8 -2
Other² -16 10 +26
Net interest result -422 -195 +227
1. Borrowing cost that are directly attributable to the acquisition, construction or production of a qualified asset. Borrowing cost are (virtual) interest costs incurred by an entity in connection with the borrowing of funds. (interest rate: 5.6%), 2. Includes mainly effects from tax related interest (in 2016) and interest rate changes of other long term provisions 18
E.ON 2017 first quarter results

≥2025
4.2
2024
0.1
2023
0.4
2022
0.1
2021
0.0
2019
1.1
2018
2.3
2017
2.7
1.4
2020
Other
YEN
USD
GBP
EUR
Financial Liabilities
Split Financial Liabilities Maturity profile (as of end Q1 2017)1
€ bn € bn
1. Bonds and promissory notes issued by E.ON SE, E.ON International Finance B.V. and E.ON Beteiligungen GmbH (fully guaranteed by E.ON SE) 19
E.ON 2017 first quarter results
31 Mar
2017
Bonds -11.9
in EUR -4.7
in GBP -4.0
in USD -2.8
in JPY -0.2
in other denominations -0.2
Promissory notes -0.4
Commercial papers 0.0
Other liabilities -1.9
Total -14.2

Executive compensation
Profit Group EBIT1 & EPS4
Cash Cash conversion
rate2 ≥ 80 %
Return ROCE3
8 – 10 %
Growth DPS
Capital structure Strong BBB / Baa
Dividend payout FY 2017: € 30ct (fixed)
Post 2017: 50 – 60 %4
E.ON FOCUS – medium-term framework
closely linked to EPS target achievement and relative TSR5 (in addition: Share ownership obligations)
E.ON Focus – Our basis for steering the company
E.ON KPIs without Uniper contribution, 1. Adjusted for extraordinary effects and divested operations, FY 2017 guidance range as basis for medium-term outlook, 2. OCFbIT divided by EBITDA, 3. Based on EBIT (= pre-tax), 4. Based on Adjusted Net Income, 5. Total Shareholder Return
20
E.ON 2017 first quarter results

E.ON Investor Relations contacts
T +49 (201) 184 2806 [email protected]
Alexander Karnick T+49 (201) 184 28 38
Head of Investor Relations [email protected]
Dr. Stephan Schönefuß T +49 (201) 184 28 22
Manager Investor Relations [email protected]
Martina Burger T +49 (201) 184 28 07
Manager Investor Relations [email protected]
Conny Ripphahn T +49 (201) 184 28 34
Manager Investor Relations [email protected]
E.ON 2017 first quarter results
21

Financial calendar & important links
Financial calendar
May 10, 2017 2017 Annual Shareholders Meeting
August 9, 2017 Interim Report II: January – June 2017
November 8, 2017 Interim Report III: January – September 2017
March 14, 2018 Annual Report 2017
May 8, 2018 Interim Report I: January – March 2018
Important links
Presentations https://www.eon.com/en/investor-relations/presentations.html
Annual Reports https://www.eon.com/en/investor-relations/financial-publications/annual-report.html
Interim Reports https://www.eon.com/en/investor-relations/financial-publications/interim-report.html
Shareholders Meeting https://www.eon.com/en/investor-relations/shareholders-meeting.html
Bonds / Creditor Relations https://www.eon.com/en/investor-relations/bonds.html
22
E.ON 2017 first quarter results

This presentation contains information relating to E.ON Group ("E.ON") that must not be relied upon for any purpose and may not be redistributed, reproduced, published, or passed on to any other person or used in whole or in part for any other purpose. By accessing this document you agree to abide by the limitations set out in this document as well as any limitations set out on the webpage of E.ON SE on which this presentation has been made available.
This document is being presented solely for informational purposes. It should not be treated as giving investment advice, nor is it intended to provide the basis for any evaluation or any securities and should not be considered as a recommendation that any person should purchase any shares or other securities.
This presentation may contain forward-looking statements based on current assumptions and forecasts made by E.ON management and other information currently available to E.ON. Various known and unknown risks, uncertainties and other factors could lead to material differences between the actual future results, financial situation, development or performance of the company and the estimates given here. E.ON does not intend, and does not assume any liability whatsoever, to update these forward-looking statements or to conform them to future events or developments.
Neither E.ON nor any respective agents of E.ON undertake any obligation to provide the recipient with access to any additional information or to update this presentation or any information or to correct any inaccuracies in any such information.
Certain numerical data, financial information and market data (including percentages) in this presentation have been rounded according to established commercial standards. As a result, the aggregate amounts (sum totals or interim totals or differences or if numbers are put in relation) in this presentation may not correspond in all cases to the amounts contained in the underlying (unrounded) figures appearing in the consolidated financial statements. Furthermore, in tables and charts, these rounded figures may not add up exactly to the totals contained in the respective tables and charts.
Disclaimer
23
E.ON 2017 first quarter results