Embed Size (px)
Citation preview

2017 ESG Survey
CALLAN INSTITUTE
Survey

1 2017 ESG Interest and Implementation Survey Knowledge. Experience. Integrity.
Table of Contents
Executive Summary 2
Key Findings 3
Respondent Overview 4
Defining ESG 5
ESG Factor Adoption Rates 6
ESG Implementation 12
Reasons For and Against ESG Factors 14
Conclusions 17
About the Authors 18
Disclosure 19

2 2017 ESG Interest and Implementation Survey Knowledge. Experience. Integrity.
Executive Summary
Introduction
ESG factor incorporation levels off after years of
steady growth
In August 2017, Callan conducted our fifth annual ESG survey. The results reflect input from 105
unique institutional U.S. funds with more than $1.1 trillion in assets.
Over the last five years, these surveys reveal that U.S.-based institutional investors have increasingly
incorporated environmental, social, and governance (ESG) considerations into their investment
decision-making process. After several years of education around ESG issues, in 2017 overall
incorporation rates held steady with the previous year at more than one-third of total funds.
Overall incorporation of ESG factors into investment decision-making plateaued at 37% of respondents
in 2017, on par with 2016 (37%) and up from 2013 (22%). This trend reflects changing survey
respondents over time (a larger portion of smaller and corporate funds responded in 2017 than in
previous years), as well as multiple years of investor education around ESG coming to fruition. Further
suggesting a plateau in adoption rates, 7% of respondent firms that have not yet incorporated ESG
factors into investment decisions were considering doing so in the future, down from 22% in 2016.
By fund type, we note a slight dip in the rate of ESG incorporation among corporate and endowment
funds compared to 2016 (likely due to sample changes over time) while other fund types saw a
continued rise in adoption:
– 35% of public funds indicated they incorporate ESG factors into the investment decision-making
process, up from 25% in 2016
– Foundations reported the highest rate of ESG incorporation at 56% in 2017 (vs. 48% in 2016)
The largest of funds (with $20 billion in AUM or more) continued to incorporate ESG factors into the
investment decision-making process at a much higher rate than their smaller counterparts: 78% for
the largest funds compared to 30% for the smallest funds ($500 million in assets or less).

3 2017 ESG Interest and Implementation Survey Knowledge. Experience. Integrity.
Callan’s fifth annual 2017 ESG Survey
reflects trends on ESG adoption for
U.S. institutional funds. The results
reflect input from 105 unique
institutional U.S. funds and trusts with
more than $1.1 trillion in assets.
Key Findings
Most frequently cited reason to
incorporate ESG:
My fund must consider ESG
factors as part of our
fiduciary responsibility
88% of corporate funds surveyed
incorporated ESG factors in
order to complete their
fiduciary duty
78% of largest funds
have incorporated ESG
factors into investment
decisions
50% of those who have
incorporated ESG
added language to
the investment
policy statement
7% of those who
have not yet
incorporated
ESG factors are
considering it
35% public funds
56% foundations
39% endowments
Increase in the rate of
ESG adoption since
inception of survey in
2013
68%
ESG incorporation by region
Pacific 53%
Northeast 44%
Central 32%
Southeast 21%
Mountain 20%
25% corporate
41% of respondents define ESG
using the literal definition,
implying an acceptance of
the definition provided by
managers hired

4 2017 ESG Interest and Implementation Survey Knowledge. Experience. Integrity.
Respondent Overview
Respondents by Fund Type
105 funds and trusts responded to the
survey; approximately one-third public funds,
one-third corporate funds, and one-third
endowments & foundations
>$1.1 trillion in total assets are
represented in this survey
43% of respondents are “small” funds with
$500 mm or less in assets; smaller funds are
less likely than their larger counterparts to adopt
ESG practices
<$500mm 43%
$500mm to $3bn 30%
$3bn to $20bn 18%
$20bn to $400bn 9%
Respondents by Fund Size
Public 33%
Corporate 31%
Endowments 18%
Foundations 17%

5 2017 ESG Interest and Implementation Survey Knowledge. Experience. Integrity.
Defining ESG
How Funds Define ESG
Did not define 50%
The literal definition of environmental, social, and governance 41%
A specific factor or mission for the fund 6%
A specific pillar (E, S, or G) 2%
Other 1%
Callan has found that definitions of ESG vary
widely in the industry. Logically, defining ESG is
often the first step many funds take in exploring
implementation.
50% of respondent firms did not define or attempt to
define ESG in 2017, up from 33% in 2016.
41% defined ESG using the literal definition of
environment, social, and governance
considerations, up from 35% in 2016.
Fewer funds (8%) defined ESG by a specific
pillar, factor, or mission than a year ago (17%),
suggesting broadening definitions of ESG
beyond individual issues that can be targeted for
divestment.

6 2017 ESG Interest and Implementation Survey Knowledge. Experience. Integrity.
ESG Factor Adoption Rates
Callan asked whether or not respondent funds have
“incorporated ESG factors into investment decision-
making.” This language is intentionally broad in order
to capture as many potential implementations as
possible that reflect the prevalence of ESG
considerations in the institutional investment arena.
Overall: The percentage of respondents in 2017 that had incorporated ESG factors into decision-
making leveled off at 37%, on par with 2016 (37%). This trend reflects changing survey respondents
over time (a larger portion of smaller and corporate funds responded in 2017 than previous years), as
well as multiple years of investor education around ESG coming to fruition.
By Fund Type: Foundations and endowments have been the greatest adopters of ESG compared
to other fund types over the last five years and in 2017 at 56% and 39%, respectively. Corporate funds
saw a decrease in ESG adoption year over year, from 30% in 2016 to 25% in 2017, but an overall
increase from 15% five years ago. Corporate defined benefit plans saw a modest dip in adoption from
29% in 2016 to 25% in 2017. This was after a leap from 7% in 2015, which Callan partially attributes
to the Department of Labor’s 2015 bulletin clarifying that investment strategies that consider ESG
factors can be in compliance with their fiduciary duty under ERISA. More than one-third of public funds
reported incorporating ESG (35%) in the 2017 survey, up from 25% in 2016.
By Fund Size: The majority (78%) of the largest respondents ($20 bn or greater) have
incorporated ESG factors into investment decisions. The largest funds have incorporated ESG factors
at the highest rate since the inception of the survey in 2013, while smaller funds are less likely to
make ESG considerations part of the investment process.
By Region: 2017 survey respondents were from across the U.S.: 36% Central, 26% Northeast,
18% Southeast, 15% Pacific, and 5% Mountain. The Pacific region had the highest percentage of
funds incorporating ESG factors at 53%, followed by the Northeast (44%) and Central (32%).
Looking Forward: Only 7% of respondents that have not yet incorporated ESG into investment
decision-making are considering doing so. This is less than one-third of the amount considering this
decision in 2016 (22%), suggesting many of the firms that have expressed interest in ESG are on the
path to implementation or have decided not to implement.

7 2017 ESG Interest and Implementation Survey Knowledge. Experience. Integrity.
ESG Factor Adoption Rates Overall
37% of respondents had incorporated
ESG factors into investment decisions in 2017,
on par with 2016. The 2017 survey reflects a
greater portion of responses from smaller funds
(<$500 mm) and corporate funds, which are
less likely than larger funds and other fund types
to incorporate ESG into the investment process.
Yes 37% No 60% Not sure 3%
2017: Does your fund incorporate ESG factors into investment decisions?
22%
26% 29%
37% 37%
2013 2014 2015 2016 2017
Funds that have incorporated ESG factors into investment decisions over time
68% increase in respondents that have incorporated
ESG factors into investment decisions from 2013
to 2017.

8 2017 ESG Interest and Implementation Survey Knowledge. Experience. Integrity.
Foundations
31% Foundations
35% Foundations
39% Endowments
53% Foundations
56%
Endowments
22% Endowments
34% Endowments
37% Foundations
48% Endowments
39%
Corporate
22% Public
22% Public
27% Corporate
30% Public
35%
Public
15% Corporate
15% Corporate
15% Public
25% Corporate
25%
2013 2014 2015 2016 2017
ESG Factor Adoption Rates by Fund Type
By fund type over last five years
56% of foundations have incorporated ESG factors
into investment decisions, the 2017 survey
found. Foundations have incorporated ESG
factors at a higher rate than all other fund types
in 4 out of the 5 years that Callan has fielded
this survey.
64% of foundations have incorporated ESG factors
into investment decisions in 2017 or are
considering doing so in the future.
35%
25%
39%
56%
25%
18%
Public Corporate Endowments Foundations Corp Defined Benefit
Corp Defined Contribution
2017 funds that are incorporating ESG factors into investment decisions
9 2017 ESG Interest and Implementation Survey Knowledge. Experience. Integrity.
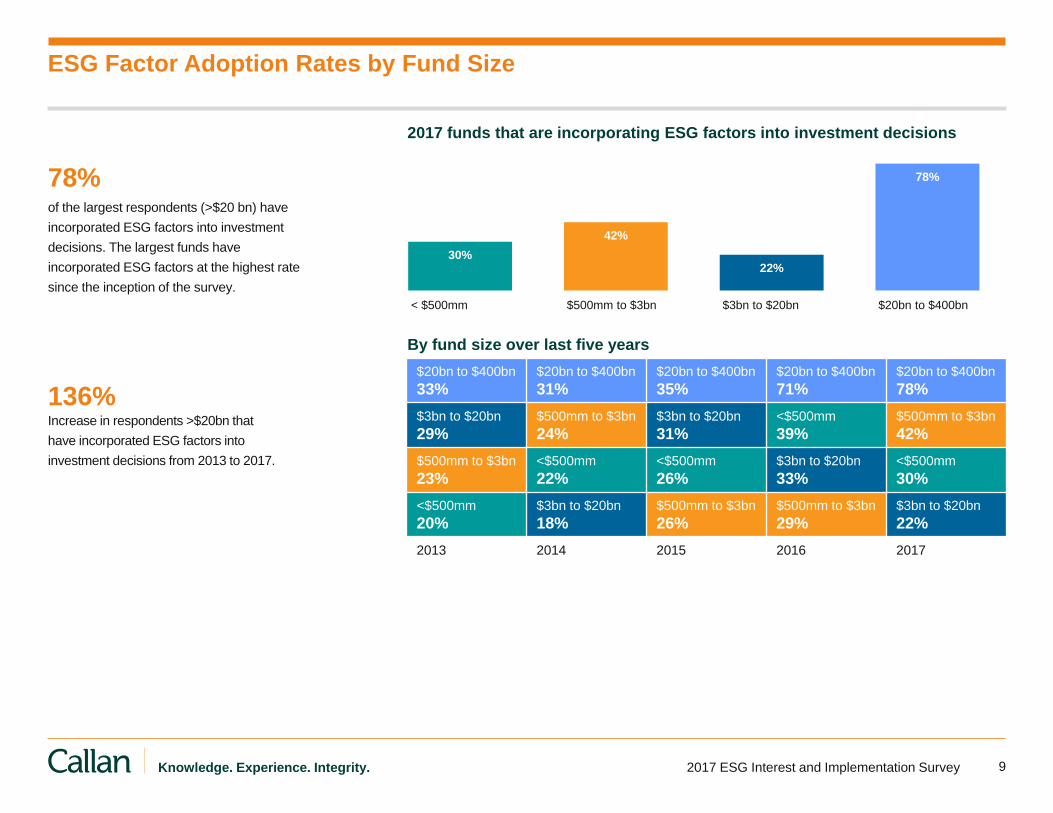
ESG Factor Adoption Rates by Fund Size
78% of the largest respondents (>$20 bn) have
incorporated ESG factors into investment
decisions. The largest funds have
incorporated ESG factors at the highest rate
since the inception of the survey.
30%
42%
22%
78%
< $500mm $500mm to $3bn $3bn to $20bn $20bn to $400bn
0%
5%
10%
15%
20%
25%
30%
35%
40%
45%
50%
55%
60%
65%
70%
75%
80%
85%
2017 funds that are incorporating ESG factors into investment decisions
By fund size over last five years
136% Increase in respondents >$20bn that
have incorporated ESG factors into
investment decisions from 2013 to 2017.
$20bn to $400bn
33% $20bn to $400bn
31% $20bn to $400bn
35% $20bn to $400bn
71% $20bn to $400bn
78%
$3bn to $20bn
29% $500mm to $3bn
24% $3bn to $20bn
31% <$500mm
39% $500mm to $3bn
42%
$500mm to $3bn
23% <$500mm
22% <$500mm
26% $3bn to $20bn
33% <$500mm
30%
<$500mm
20% $3bn to $20bn
18% $500mm to $3bn
26% $500mm to $3bn
29% $3bn to $20bn
22%
2013 2014 2015 2016 2017

10 2017 ESG Interest and Implementation Survey Knowledge. Experience. Integrity.
ESG Factor Adoption Rates by Region
2017 funds that are incorporating ESG factors in investment decisions by region
165% increase in rate of Pacific region
respondents that have incorporated
ESG factors into investment decisions
over a five-year period.
44%
21% 20%
32%
53%
Pacific (15 funds)
Mountain (5 funds*)
Central (37 funds)
Northeast (28 funds)
Southeast (19 funds)
2013 20% 2013
16%
2013 36%
2013 23%
2013 21%
2017 53%
2017 20%*
2017 32%
2017 44%
2017 21%
Pacific Mountain Central Northeast Southeast *Note the small sample size.
44%
21%
20%*
32%
53%

11 2017 ESG Interest and Implementation Survey Knowledge. Experience. Integrity.
ESG Factor Adoption Rates Looking Forward
If you have not incorporated ESG factors into investment decisions, are you
considering it?
Yes 7%
No 93%
Share of respondents that have not incorporated ESG factors into investment
decisions but are considering it (by fund type)
0% 6%
13%
20%
Public Corporate Endowments Foundations
0%
5%
10%
15%
20%
25%
70% decrease in the percentage of respondents
that are considering incorporating ESG
factors into investment decisions.

12 2017 ESG Interest and Implementation Survey Knowledge. Experience. Integrity.
ESG Implementation
Similar to ESG definitions, implementation strategies
vary substantially from fund to fund, as investors find
the approach that best accomplishes their unique
goals. Callan asked survey respondents that have
incorporated ESG factors into investment decisions
specifically how they had done so to gauge which
implementation strategies are most prevalent.
The top implementation method for survey respondents that are incorporating ESG into investment
decisions in 2017 was to add language to the investment policy statement (50%), which was also the
most common implementation method in 2016 (53%). Callan finds that adding language to investment
beliefs or policy statements is frequently a first step that many institutional investors take when
pursuing an integrated approach to incorporating ESG factors in investment decisions.
The next most prevalent implementations were:
– to communicate to their investment managers that ESG is important to the fund,
– to hire a manager that has incorporated ESG, and
– to incorporate a screening process and to communicate to investment managers that ESG is
important to the fund (42% each).
A negative screening process can address a specific issue (e.g., screen out investments related to
tobacco or fossil fuels), but positive screening is also becoming more prevalent (e.g., screen to include
only securities that have best practices in a specific sector). Engagement/proxy voting ranked fifth,
with 32% of investors utilizing this method. One-fifth of respondents (21%) indicate they are a
Principles for Responsible Investment (PRI) signatory, double the rate in 2016 (10%).

13 2017 ESG Interest and Implementation Survey Knowledge. Experience. Integrity.
ESG Implementation
50%
42%
42%
42%
32%
29%
26%
21%
21%
18%
16%
13%
Added language to investment policystatement
Communicated to investment managers thatESG is important to the fund
Hired a manager/strategy that hasincorporated ESG
Incorporated a screening process
Engaged with fund constituents and/or heldproxy votes
Added language to investment beliefs
Divested from a certain industry, sector, orother area
Became a Principles for ResponsibleInvestment (PRI) signatory
Scored investment managers using ESGmetrics
Hired a manager/strategy for impactinvesting
Explored or conducted carbon foot-printing,tracking, or other analysis
Other
Implementation methods for incorporating ESG factors into the investment decision-
making process
“Other” responses include:
“Divested [out] of industries with negative
environmental records”
“Adopted a five-year strategic plan for ESG
which includes KPIs, milestones, with
targets included in senior staff performance
targets”
“Use [consultant] on an ad hoc basis for
ESG analysis of managers”

14 2017 ESG Interest and Implementation Survey Knowledge. Experience. Integrity.
Reasons For and Against ESG
Reasons to Use ESG Factors
Reasons Not to Use ESG Factors
On the following page we show the motivations for incorporating ESG into investment decision-
making. The order of these factors has changed little over the past two years; the top reasons cited for
incorporating ESG factors into investment decisions in 2017 were:
– 47%: My fund must consider ESG factors as part of our fiduciary responsibility
– 42%: The fund’s investment policy statement dictates that we consider ESG factors
– 32%: We expect to achieve higher returns AND we expect to achieve an improved risk profile
Explicitly documenting ESG factors by way of the investment policy statement (IPS) was a common
implementation approach among all fund types except corporate funds. Half of public funds and
foundations and 43% of endowments indicated their IPS dictates that they consider ESG factors.
Ironically, only 13% of corporate funds’ IPS dictated that ESG factors should be considered even
though 88% of corporate respondents indicated they must consider ESG factors as part of their
fiduciary responsibility.
More than half (61%) of U.S. institutional investors that responded to our survey in 2017 have not
incorporated ESG factors into investment decision-making, in line with 2016 (60%). The most
common reason cited in 2017 was that the fund would not consider any factors that are not purely
financial in the investment decision-making process (41%).
The next most popular answer in 2017 was that the value proposition for ESG remains unclear (39%),
down from 63% in 2016. This was especially true among endowments (86%) that do not incorporate
ESG factors into investment decision making.

15 2017 ESG Interest and Implementation Survey Knowledge. Experience. Integrity.
42%
50%
50%
8%
17%
50%
88%
13%
25%
50%
25%
13%
29%
43%
29%
57%
14%
29%
30%
50%
10%
30%
50%
0%
Public Endowments
Corporate Foundations
Reasons for incorporating ESG factors into the investment decision-making process*
Reasons For and Against ESG
47%
42%
32%
32%
26%
26%
My fund must consider ESG factors as part of our fiduciary responsibility
The fund's investment policy statementdictates that we consider ESG factors
We expect to achieve an improved risk profile
Other
My fund has other goals besides maximizing risk-adjusted returns, and we believe that ESG
factors can help us attain these other goals
We expect to achieve higher returns over the long term
All respondents
“Other” responses include:
“Participants desire to incorporate”
“We believe it is an important
attribute for certain generations of
participants”
“Mission alignment with our
organization”
88% of corporate funds surveyed utilize
ESG factors in order to fulfill their
fiduciary duty.
More investors expect to improve
their fund’s risk profile by applying
an ESG lens in 2017 (32%) than
fiver years ago (17%).
* Multiple responses were allowed.

16 2017 ESG Interest and Implementation Survey Knowledge. Experience. Integrity.
41%
39%
38%
23%
23%
15%
11%
My fund will not consider any factors that are notpurely financial in our investment decision-making
It is unclear what the value proposition is
I have not seen ample research tying ESG factorsto outperformance
Benchmarking is too difficult (unclear how tomeasure financial and non-financial success)
I don’t know how ESG factors would fit in the fund's strategic asset allocation
We are currently considering incorporating ESG,but have not made our decision
Other
37%
26%
42%
11%
26%
0%
16%
54%
50%
42%
29%
21%
13%
4%
57%
86%
29%
57%
43%
43%
14%
17%
17%
50%
17%
17%
33%
17%
Reasons for NOT incorporating ESG factors into the investment decision-making process*
Reasons For and Against ESG
Public Endowments
Corporate Foundations All respondents More clarity Years of education around ESG by
movement proponents appears to
be paying off, as the percentage of
participants that were unclear of
the value proposition of
incorporating ESG factors declined
from 53% in 2013 to 39% in 2017.
However, for endowments this
remained the top reason for not
incorporating ESG factors.
* Multiple responses were allowed.

17 2017 ESG Interest and Implementation Survey Knowledge. Experience. Integrity.
Conclusions
The percentage of U.S. investors that have
incorporated ESG factors into decision-making has
leveled off at 37% in 2017, on par with 2016 (37%)
and up 68% relative to five years ago (22%).
Fund Type and Size Matter: Foundations and endowments have been the greatest adopters of
ESG compared to other fund types over the last five years and remained on top in 2017. One-quarter
of corporate funds and around one-third of public funds utilized ESG factors in some fashion in 2017,
and all fund types have seen increased adoption over the last five years. The larger the fund, the more
likely it was to incorporate ESG into investment decisions.
Implementation Varies: How to best implement ESG factors into investment decisions varies
substantially from fund to fund, as investors find the approach that best accomplishes their unique
goals. The top implementation methods in 2017 were:
– 50%: adding language to the investment policy statement
– 42%: communicating to their investment managers that ESG is important to the fund
– 42%: hiring a manager that has incorporated ESG
– 42%: incorporating a screening process and communicating to investment managers that ESG is
important to the fund
Perceptions Change: Years of education around ESG issues and increased awareness of the
vast options available to investors have changed how they think about the space. Today fewer investors
are unclear on ESG’s value proposition than five years ago (39% in 2017 vs. 53% in 2013), and more
expect to improve their fund’s risk profile by applying an ESG lens (32% in 2017 v. 17% in 2013).
Looking Forward: Climate change, fossil fuel-free investing, and the regulatory environment are
a few examples of ESG issues that have been covered by the press in recent years. While fewer
survey respondents in 2017 were considering new implementations of ESG in their investment
decision-making processes than previous years (7% vs. around one-fifth, historically), perceptions and
approaches to implementation have shifted over time. Callan will closely follow these trends as the
ESG landscape for data availability and factor integration continues to evolve.

18 2017 ESG Interest and Implementation Survey Knowledge. Experience. Integrity.
Shane Blanton is a Senior Analyst in Callan's Published Research Group covering business
analytics. He is responsible for data analysis and visualization to support Callan's research
endeavors. In addition, he is responsible for measuring and benchmarking Callan's communications
campaigns. Previously Shane was a member of the Analytical Solutions Group for three years,
training Callan's clients to use PEP software.
Prior to joining Callan, Shane worked as an Account Manager for an IC packaging manufacturer, and
also worked as a trading assistant to a proprietary options firm. Shane attended Carnegie Mellon
University, where he earned a B.S. in Business Administration.
Anna West is a Senior Vice President dedicated to Callan’s research and education initiatives. As
Director of the Callan Institute and Co-Manager of the Published Research Group, she oversees the
educational content presented at the Callan Institute workshops and conferences. She also works with
subject matter experts across Callan to produce white papers, surveys, charticles, and other research
for investors. As chair of Callan’s Environmental, Social, and Corporate Governance (ESG)
Committee, Anna covers ESG trends and developments. Anna is also a member of Callan's Emerging
and Minority, Women, or Disabled-owned Managers Committee and is chair of the Institute Advisory
Committee. She is a shareholder of the firm.
Anna joined Callan in August 2006. Prior to Callan, she worked for Vail Resorts, Inc. She earned an
MBA from the University of San Francisco and a BA in International Business and French from
Washington University.
About the Authors

19 2017 ESG Interest and Implementation Survey Knowledge. Experience. Integrity.
Disclosure
© 2017 Callan LLC
Certain information herein has been compiled by Callan and is based on information provided by a variety of sources believed to be reliable for which Callan has not necessarily
verified the accuracy or completeness of this publication. This report is for informational purposes only and should not be construed as legal or tax advice on any matter. Any
investment decision you make on the basis of this report is your sole responsibility. You should consult with legal and tax advisers before applying any of this information to your
particular situation. Reference in this report to any product, service or entity should not be construed as a recommendation, approval, affiliation or endorsement of such product,
service or entity by Callan. Past performance is no guarantee of future results. This report may consist of statements of opinion, which are made as of the date they are expressed
and are not statements of fact. Reference to or inclusion in this report of any product, service or entity should not be construed as a recommendation, approval, affiliation or
endorsement of such product, service or entity by Callan.
Callan is, and will be, the sole owner and copyright holder of all material prepared or developed by Callan. No party has the right to reproduce, revise, resell, disseminate externally,
disseminate to subsidiaries or parents, or post on internal web sites any part of any material prepared or developed by Callan without permission. Callan’s clients only have the right
to utilize such material internally in their business.

About Callan Callan was founded as an employee-owned investment consulting firm in 1973. Ever since, we have empowered institu-
tional clients with creative, customized investment solutions that are backed by proprietary research, exclusive data, and
ongoing education. Today, Callan advises on more than $2 trillion in total fund sponsor assets, which makes it among the
largest independently owned investment consulting firms in the U.S. Callan uses a client-focused consulting model to
serve pension and defined contribution plan sponsors, endowments, foundations, independent investment advisors, invest-
ment managers, and other asset owners. Callan has five offices throughout the U.S. For more information, please visit
www.callan.com.
About the Callan InstituteThe Callan Institute, established in 1980, is a source of continuing education for those in the institutional invest-ment community. The Institute conducts conferences and workshops and provides published research, surveys and newsletters. The Institute strives to present the most timely and relevant research and education available so our clients and our associates stay abreast of important trends in the investments industry.
For more information about this report, please contact: Your Callan consultant or Anna West at [email protected]
© 2017 Callan LLC

Corporate Headquarters
600 Montgomery StreetSuite 800San Francisco, CA 94111800.227.3288415.974.5060
www.callan.com
Regional Offices
Atlanta800.522.9782
Chicago800.999.3536
Denver855.864.3377
New Jersey800.274.5878
@CallanLLC Callan