Embed Size (px)
Citation preview

2
2017 Economic Impact Study Update
San Francisco International Airport
Prepared for City and County of San Francisco San Francisco Airport Commission
Prepared by Economic Development Research Group Inc
July 2017
This Page Left Blank Intentionally
TABLE OF CONTENTS Page
Executive Summary 1 Total Economic Contribution 1 Classification of Impacts 2 Approach 3
Introduction amp Overview 5Chapter 1Overview 6 Airside and Groundside Airport Jobs 9 Off‐Airport Jobs Serving Airport Travelers 9 Related Industries Jobs that Rely on Air Cargo 10
National Context 13Chapter 2Context The Vibrant Bay Area Economy 13 SFOrsquos Role in International Trade 15 Export Commodities 16 Import Commodities 17 Total Trade 20
Chapter 3 On‐Airport Impacts 23 Direct Employment 23 Business Sales and Payroll 24 Indirect and Induced Impacts 25 On‐airport Construction 27
Chapter 4 Visitor Spending 29 Visitor Spending 30 Jobs and Income Generated by Off‐Airport Visitor Spending 31 Indirect and Induced Impacts 32
Chapter 5 Impacts of Air Reliant Users (Freight Shippers) 35 The Role of SFO in Air Exports 35 International Exports 35 Domestic Exports 36 Economic Contribution of SFO to the Bay Area 37 Effects on Suppliers of Goods and Services 38
Chapter 6 Tax Impacts Generated by Activities at SFO 40 State and Local Tax Impacts 40 Federal Aviation Taxes 40
Chapter 7 Distribution of Impacts by Bay Area Counties 42 On‐Airport Effect among Bay Area Counties 42
Visitor Spending 44 Tax Impacts by Bay Area County 45
Appendix I Methodology for the Analysis of Overall Economic Impacts 48 Suppliers of Goods and Services (Indirect Multiplier Effects) 50 Re‐Spending of Worker Income (Induced Multiplier Effects) 50 Calculating the Domestic and International Values from Cargo Originating in the Bay Area and Shipped Through SFO 51 Major Sources of Data Used in this Study 52
Appendix II Summary of IMPLAN Sectoring 54
Appendix III SFO Tenant and Visitor Surveys 58
LIST OF TABLES Page
Table 1 Summary of Economic Impacts of SFO in the Bay Area 2
Table 2 Economic Contribution of SFO to the Bay Area 8
Table 3 Visitors to the San Francisco Region arriving through SFO (year ending June 2016) 10
Table 4 Airport Ranking for Top Three Exported Commodities by Percent of Total 11
Table 5 Air Value of US and Bay Area Export by Airport 2009‐2016 16
Table 6 Top Ten SFO Export Commodities by Air Value and Weight 2016 17
Table 7 Top Ten SFO Import Commodities by Air Value and Weight 2016 19
Table 8 Countries that Traded Commodities with Total Value More than $1 Billion in 2016 through SFO In Order of Value of Trade 21
Table 9 Direct Impacts of On‐Airport Tenants and Administrative Employees 24
25 Table 10 Direct Employment Labor Income and Business Revenues for Tenant and Administrative SFO
Table 11 Summary of Direct Indirect and Induced Economic Impacts of SFO in Bay Area 26
Table 12 Supplier of GoodsServices Industries (Indirect) 26
Table 13 Re‐Spending of Worker Income Industries (Induced) 27
Table 14 Sector Mapping 27
Table 15 Annual Average Impacts from SFO Construction on the Bay Area Economy 28
Table 16 Off‐Airport SFO Visitor Spending Inside and Outside of the Bay Area 30
Table 17 Breakdown of Total Visitor Spending Impacts 31
Table 18 Earnings and Sales per Worker 32
Table 19 Summary of Direct Indirect and Induced Economic Impacts of the Contribution of Visitor Spending in the Bay Area 33
Table 20 Top International Exported Industries 36
Table 21 Top Domestic Shipped Industries 36
Table 22 Economic Value of Domestic and International Exports Originating in the Bay Area via SFO38
Table 23 Impacts on Suppliers of Goods and Services (Indirect) by BEA Industry 39
Table 24 Estimated 2016 State and Local Tax Impacts (in $ millions) 40
Table 25 Estimated 2016 Federal Aviation Tax Revenues 41
Table 26 Employment and Labor Income Impacts of On‐airport Tenants by County 42
Table 27 Business Revenues Impacts of On‐airport Tenants by Bay Area County 43
Table 28 Economic Impacts of Visitor Spending by Bay Area County 44
Table 29 Tax Revenues by County for On‐airport Tenants 45
Table 30 Tax Revenues by County for Visitor Spending 46
Table 31 Industry Classification of On‐Airport Industries 55
Table 32 Industry Classification of Visitor‐Serving Industries 56
LIST OF FIGURES Page
Figure 1 International Exports Shipped from SFO and California by Industry Sector 11
Figure 2 Domestic Outbound Air Shipments from SFO
Figure 10 Percentage of the Bay Arearsquos Combined Domestic and International Exports Shipped via
12
Figure 3 Illustration of the Bay Area by County 14
Figure 4 Top Five Airports by Air Value of Exports to Asia 2009‐2016 20
Figure 5 Top Five Airports by Air Value per Ton of Exports to Asia 2009‐2016 20
Figure 6 Distribution of On‐Airport Tenants and Administrative Jobs 23
Figure 7 Percent of Relative Employment Labor Income and Revenues by Aggregated Sector on SFO24
Figure 8 Profile of Air Visitors Arriving via SFO by Place of Origin 29
Figure 9 Relative Spending of Visitors per Trip by Origin and Purpose 30
SFO 37
Figure 11 Employment Impacts on Suppliers of Goods and Services (Indirect) 38
Figure 12 Elements of Economic Impacts and Interrelationships 49
Figure 13 Methodology to Estimate Air Dependent Contribution to Bay Area Economy 52
EXECUTIVE SUMMARY
This study is an update to the 2016 Economic Impact Study of San Francisco International Airport (SFO or ldquothe Airportrdquo) and examines the Fiscal Year1 (FY) 20152016 impacts of the airport in the nine‐county Bay Area of Alameda Contra Costa Marin Napa San Mateo San Francisco Santa Clara Solano and Sonoma
SFO is the seventh leading passenger airport in the United States and the 16th largest air cargo airport2
In the FY 201516 nearly 440000 aircraft operations were conducted at the Airport serving over 514 million incoming and outgoing passengers and moving 383300 metric tons of cargo and 68200 metric tons of mail3
TOTAL ECONOMIC CONTRIBUTION
The total economic contribution of SFO to metropolitan San Francisco is the sum of the business activity directly associated with operation of SFO and the spending of its users as well as the additional business activity associated with orders to suppliers and re‐spending of worker income These various elements of economic impact are each defined and shown in Table 1
In 2016 SFO directly accounted for $84 billion in on‐airport business activity supporting nearly 43000 jobs at the Airport4 Off‐site business activities that depend directly on local air service for staff movements cargo deliveries or customer visits (visitor spending) together raise the direct airport economic contribution to the Bay Area to $357 billion in business sales with over 165000 jobs There are also spin‐off activities in the region (indirect and induced multiplier effects) associated with suppliers of goods and services to the directly affected businesses and the re‐spending of additional worker income on consumer goods and services Adding in these effects raises the total economic footprint of SFO in the Bay Area to over $625 billion in business sales including $209 billion in total payroll and over 300000 jobs in the region All dollar values are expressed in 2016 dollars
1 The Fiscal Year is defined as the period July 1st to June 30 of the following year 2 Based on data from Airports Council International (ACI) cited in the SFO Annual Report (2016) and the ACI 2015 North
American Airport Traffic Summary (Cargo) 3 Source wwwflysfocom 4 This total includes the Virgin America airline headquarters located in Burlingame CA and affiliated with SFO based on the
2015 survey
2017 Economic Impact Study of San Francisco International Airport 1
Table 1 Summary of Economic Impacts of SFO in the Bay Area
Impact Type
On‐airport
Employment
42828
Labor Income
$2670714000
Output
$8409265000
Visitor spending 96121 $3870828000 $10539626000
Aviation dependent exports 26078 $4023963000 $16721996000
Direct Total 165026 $10565505000 $35670887000
Suppliers of goods and services 50689 $4798113000 $12204072000
Re‐spending of income 84606 $5570121000 $14668593000
Total Impact 300322 $20933739000 $62543552000
Notes Includes impacts of temporary construction investment dollars rounded to the nearest thousand Columns may not add due to rounding
The economic activities generated by SFO also return significant tax revenues to the State of California the nine Bay Area counties and to the nation in terms of federal aviation taxes
The state and local tax revenues linked to operations at SFO totaled nearly $29 billion in FY 201516 including almost $16 billion from direct activities and close to $13 billion from purchases of supplier goods and services (tax impacts from indirect effects) and subsequent spending of worker income in the Bay Area (tax impacts from induced effects) Approximately $20 billion ($13 billion from direct activities) stem from on‐airport commerce and visitor spending while $872 million are attributable to air‐reliant shippers that use SFO for air freight ($280 million from direct economic activity)
In addition aviation operations at SFO generated $12 billion dollars in federal taxes including $419 million from taxes on international and domestic passengers and $791 million in US Customs revenue from international air freight shipments These tax revenues are remitted to the US Department of the Treasury and do not directly benefit the Bay Area or the State of California
CLASSIFICATION OF IMPACTS
The operation of SFO providing terminal and related services for air travelers and cargo movement is only a portion of the Airportrsquos contribution to the Bay Area economy Visitors from international and domestic locations use SFO to visit the Bay Area for leisure or business and their spending supports additional business activity within the region In addition companies in the region that produce manufactured and agricultural goods that are exported by air from SFO would be at a disadvantage without proximity to a major international airport Altogether these on‐ and off‐site business activities fall into five categories
Airport‐based economic activities (airport terminal‐related and tenants)
Off‐airport businesses serving airport travelers
Off‐airport businesses dependent on the Airport for cargo movement
Suppliers of goods and services to the Airport and air‐dependent business
Re‐spending of worker income (supported by airport‐based activities visitor spending air‐dependent businesses and suppliers of goods and services)
2017 Economic Impact Study of San Francisco International Airport 2
APPROACH
Findings in this study were developed by
1 Dividing airport employment into three categories 1) Updates from SFO for employment and labor income for airport employees and contractors 2) Updates from SFO for terminal concession revenues and these revenues were the basis for estimating direct employment and labor income for the concessions establishments and 3) data obtained from the 2015 tenant survey were used for the remaining on‐airport employment and labor income
2 Using the visitor intercept survey and methodology developed in 2015 with an updated number of enplanements
3 Adapting the Impact Analysis for Planning (IMPLAN) Modeling Package to the nine‐county Bay Area region IMPLAN was used to (a) develop a county‐specific economic profile of the Bay Area using data primarily from the US Department of Commerce (Bureau of Economic Analysis) and US Department of Labor to estimate jobs wages and labor income (direct effect) and (b) develop a model of the Bay Area to represent inter‐metropolitan flows of business sales This includes business orders to suppliers generated by on‐airport businesses off‐airport businesses serving airport visitors and airport‐reliant businesses (indirect effects) It also includes business sales generated by the spending of additional workersrsquo income on consumer purchases (induced effects) The 2015 IMPLAN package was substituted for the 2014 package used in the previous study
4 Utilizing data from SFO in conjunction with international data from the Foreign Trade Division of the US Census Bureau (packaged by WISERTrade) and domestic freight data from the Freight Analysis Framework (FAF) of the US Department of Transportation to develop an analysis of the role of air cargo shipments in the economies of the Bay Area
5 National and California state sources are used to identify aviation specific tax impacts and major state and local tax impacts State sources include the Governorrsquos Office the California State Controllerrsquos Office and the County of San Mateo Federal sources include the Federal Aviation Administration Bureau of Economic Analysis (BEA) and the US Census Bureau These sources are used independently and in conjunction with the IMPLAN tax module to estimate tax impacts generated by SFO aviation activity for federal revenues and state and local taxes by where the taxes are generated
2017 Economic Impact Study of San Francisco International Airport 3
This Page Left Blank Intentionally
2017 Economic Impact Study of San Francisco International Airport 4
CHAPTER 1 INTRODUCTION amp OVERVIEW
This 2017 Economic Impact Study Update Report (2017 Update) is a partial update of the 2016 Economic Impact Study of San Francisco International Airport (2016 Study) Although published in June 2017 data in this study was collected in 2016 As in the 2016 Study this update reflects the economic contribution of SFO in the nine Bay Area counties of Alameda Contra Costa Marin Napa San Mateo San Francisco Santa Clara Solano and Sonoma
Data updated to 2016 values include administrative employment information (jobs labor income and zip code of residence) contractors concession revenues enplanements and cargo shipments Data not updated and held constant with the 2016 Study are the portions of the previous study that were based on surveys including visitor spending per trip and tenant employment other than terminal concessions The latter primarily represents airlines and other airside components of SFO as well as federal employment on airport
Additionally the ldquoeconomic matrixrdquo behind the 2016 Study was updated The ldquoeconomic matrixrdquo reflects how industries buy and sell from each other and how households spend their income ndash these are the drivers of indirect and induced (or ldquomultiplierrdquo) impacts respectively The 2016 Study incorporated the IMPLAN LLC input‐output model from 2014 which was the most recent model year available when the study was underway (adjusted to reflect 2012 dollars) This update is based on the IMPLAN model of 2015 (adjusted to reflect 2016 dollars) A further adjustment was made in that induced effects (the impacts of spending of wages earned from direct and indirect activities) were adjusted to account for changes in the Bay Area from calendar 2015 through 2016 This ensures the update more accurately reflects the regional economy as it rebounds from the recent recession5
The new input‐output model reflects changes in how Bay Area industries rely on local suppliers for goods and services (which lead to indirect multiplier effects) and the extent of household spending remains in the Bay Area (which lead to induced multiplier effects) Several trends are particularly important as noted below
Less materials and supply purchases are now made locally Within optimized supply chains and globalization on the rise more material and supplier purchases are made outside regional boundaries These dollars that in previous years stimulated regional economic growth are now flowing outside the Bay Area economy
In the Computer and Other Electronics manufacturing industry 22 less purchases of materials and supplier were made within the Bay Area region
Productivity continues to rise for most industries (1‐7) with a large increase for aviation and airline services (10) Notable declines in productivity include Ground Transportation (‐22) likely driven by increased competition from Transportation Network Companies (TNC) and Freight Aviation (‐3) likely due to changes in supply chain or delivery models
On‐line and non‐store sales continue to expand with a 17 growth in business sales and 4 growth in employment since the last study
5 This update is based on the Quarterly Census of Employment and Wages (QCEW) published by the US Bureau of Labor Statistics for 2012‐2013 for the nine‐county region
2017 Economic Impact Study of San Francisco International Airport 5
SFO is a major economic engine for the Bay Area economy Despite drop‐offs in multiplier impacts total business revenues associated with the airport has increased from $617 billion to $625 billion Despite increased productivity per worker in the region for most industries employment has increased from 295000 to over 300000 However it must be emphasized that these findings represent a partial update of the 2016 Study and do not account for any changes in the levels of airside employment or in spending per visitor (although the numbers of visitors are adjusted)
An increase in on‐airport employment has been driven by both lower job‐to‐sales ratios and increased sales Since the last study sales to job ratios for retail sales declined from $129000 per job to $127000 per job and from $92000 per job to $73000 per job for Ground Transportation These declines resulted in a higher number of jobs for the same amount of revenues In addition there was a strong increase in revenues associated with Transportation Network Companies (TNC) since the last study which also contributed to higher job impacts (see Chapter 3 ldquoOn‐Airport Impactsrdquo)
Other notable differences compared to the 2016 Study include increases in on‐airport employment driven by lower sales to job ratios Since the last study sales to job ratios for retail sales dropped from $129000 per job to $127000 per job The business sales to job ratio for Ground Transportation declined precipitously from $92000 per job in the previous study to $73000 per job in this study This decline in productivity consequently results in a higher number of jobs further supported by the growth in business sales associated with Transportation Network Companies (TNC) (see Chapter 3 ldquoOn‐Airport Impactsrdquo)
OVERVIEW
This report provides study findings of the economic impacts of San Francisco International Airport (SFO) This chapter introduces the study provides an overview of the methodology used and summarizes the airportrsquos overall economic contribution to the nine‐county Bay Area
Chapter 2 reviews the economic context of SFO and the Bay Area Chapters 3 through 7 describe the findings of the economic impacts generated by SFO Chapter 3 reports in detail the impacts derived from airport‐based activities as well as the impacts of the airportrsquos construction Chapter 4 describes the impacts of Bay Area visitors who arrive through SFO and spend money in the region Chapter 5 reviews the economic contribution of shippers who transport their goods to international and domestic markets via SFO These shippers are air‐reliant meaning that their businesses rely on air‐freight Chapter 6 presents tax impacts of on‐airport activities and visitor spending including key federal aviation taxes and municipal county and state revenues Chapter 7 outlines the distribution of on‐airport and visitor spending impacts for each county in the Bay Area region
The operation of SFO providing terminal and related services for air travelers and cargo movement is only one part of the Airportrsquos total regional economic impact Airport‐dependent businesses and airline travelers visiting the area for business or leisure support additional business activity within the Bay Area Together these on‐ and off‐site business activities fall into five categories
Airport‐based economic activities (airport terminal‐related and tenants)
Off‐airport businesses serving airport travelers
Off‐airport businesses dependent on SFO for cargo movement
2017 Economic Impact Study of San Francisco International Airport 6
Suppliers of goods and services to SFO and air‐dependent business and to off‐airport businesses that serve visitors This activity is off‐airport in the Bay Area
Re‐spending of worker income (supported by airport‐based activities visitor spending air‐dependent businesses and suppliers of goods and services) Almost all re‐spending is off‐airport in the Bay Area
The total economic contribution of SFO is the sum of the business activity directly associated with operation of the Airport and the spending of its users as well as the additional business activity associated with orders to suppliers and re‐spending of worker income The sum of on‐airport activities at SFO visitor spending by air visitors to the Bay Area and regional exports supported by air cargo exceeds $356 billion in direct business sales which in turn support nearly 165000 direct jobs that generates a $105 billion payroll Table 2 summarizes the economic contribution of SFO to the Bay Area economy by impact category
2017 Economic Impact Study of San Francisco International Airport 7
Table 2 Economic Contribution of SFO to the Bay Area
Impacts Airport
Generated Visitor
Spending Air‐
Related Total Impact
Jobs Direct 42828 96121 26078 165026 Indirect 14974 15268 20448 50689 Induced 20008 26893 37706 84606 Total Jobs 77809 138282 84232 300322
Business Revenue ($ millions) Direct $8409 $10540 $16722 $35671 Indirect $3070 $3067 $6068 $12204 Induced $3921 $4560 $6187 $14669 Total Business Revenue $15400 $18167 $28977 $62544
Labor Income ($ millions) Direct $2671 $3871 $4024 $10566 Indirect $1302 $1234 $2262 $4798 Induced $1476 $1685 $2409 $5570 Total Labor Income $5449 $6790 $8695 $20934
Avg IncomeEmployee ($yr) Direct $62400 $40300 $154300 $64000 Indirect $86900 $80800 $110600 $94700 Induced $73800 $62700 $63900 $65800 Weighted Avg IncomeEmployee
$70000 $49100 $103200 $69700
Notes On‐airport impacts include on‐airport construction activities in 2016 Totals may not add due to rounding
Sources SFO Survey of SFO Tenants Survey of SFO Passengers US Department of Commerce data provided by MIG Inc (IMPLAN) and WISERTrade using data from the US Census Bureau Foreign Trade Division Calculations by EDR Group
In addition to direct impacts on the economy indirect multiplier effects are associated with suppliers of goods and services to directly affected businesses and induced multiplier impacts are generated by re‐spending of additional worker income on consumer goods and services Counting direct indirect and induced impacts SFOrsquos contribution to the Bay Area economy is over 300000 jobs and $625 billion in business revenues of which $209 billion is labor income (payroll) Appendix I summarizes the economic impact methodology
2017 Economic Impact Study of San Francisco International Airport 8
AIRSIDE AND GROUNDSIDE AIRPORT JOBS
Based on a 2015 airport‐wide survey and SFO data from FY 20152016 an estimated 42828 people work at SFO6 This total includes 14962 employees of passenger airlines that serve the Airport7 The breadth of jobs at SFO involves
Airlines both passenger and cargo activities
Air terminal operation including security building maintenance and facility management (construction also included)
Public agencies such as the FAA US Departments of Immigration and Naturalization Customs Agriculture Fish and Wildlife and Drug Enforcement Agency as well as Airport Administration (including police and fire departments)
Airline support services including catering in‐flight entertainment aircraft handling fueling and maintenance
Freight services including courier delivery customs broker and trucking
Concessions including restaurants retail stores and passenger services
Ground transportation services including rental car taxi and limousine service and bus companies
OFF‐AIRPORT JOBS SERVING AIRPORT TRAVELERS
For the fiscal year ending in June 30 2016 SFO served over 514 million passengers which included 256 million enplanements Enplanements include persons transferring from one flight to another en route to their final destinations residents of the Bay Area who are traveling and non‐residents returning home after visiting the San Francisco region
The visitor spending analysis in this report measures the extent that SFO facilitates money brought from outside the Bay Area and spent in the Bay Area to support jobs in the hospitality sectors of the regional economy Transferring passengers and local residents two classes of SFO passengers are excluded from this analysis While transferring passengers may make purchases at the Airport between flights this spending is accounted in the revenues of terminal tenants Thus including their purchases as ldquovisitor spendingrdquo would be a double count In addition off‐airport spending by residents traveling through SFO also does not count as a regional economic impact since residents spend most of their money in the Bay Area anyway Moreover as with transferring passengers money spent in the terminal is included in the analysis of on‐airport employment
Overall over 26 million international passengers 63 million non‐Californian and 12 million Southern California visitors came to the Bay Area via SFO (see Table 3) These visitors spent more than $105 billion in the bay area region on hotels food and beverage retail purchases entertainment and local travel (taxis car rental and public transportation)
6 Includes jobs associated with capital construction 7 Total on‐airport employment includes the Virgin America airline headquarters located in Burlingame CA affiliated with SFO
2017 Economic Impact Study of San Francisco International Airport 9
Table 3 Visitors to the San Francisco Region arriving through SFO (year ending June 2016)
Market Passengers
Domestic Origin and Destination at SFO 29504670 Enplaned Passenger at SFO 14752335 Percent of Enplaned Passengers who are Visitors 5135 Number of Visitors 7575496 Domestic Visitors by Origin Percent Originating in California 1633 Domestic Visitors Originating in California 1237222 Domestic Visitors Originating in Rest of US 6338274 International Visitors Arriving via US Flag Airlines Origin and Destination at SFO 2630232 Enplaned Passenger at SFO 1315116 Percent of Enplaned Passengers who are Visitors 4270 Number of Visitors 561598 International Visitors Arriving via Non‐US Flag Airlines Origin and Destination at SFO 6509654 Enplaned Passenger at SFO 3254827 Percent of Enplaned Passengers who are Visitors 6209 Number of Visitors 2020781 Total International Visitors (US Flag and Non‐US Flag) 2582379 Total Visitors 10157875
Note This table does not include travelers using SFO to connect from one flight to another
Sources SFO Traffic Statistics US DOT OampD Survey 2015 US DOT T‐100 Database IATA PaxIS Database US DOC International Air Travel Statistics 2015 US DOC National Travel and Tourism Office (NTTO)
RELATED INDUSTRIES JOBS THAT RELY ON AIR CARGO
In the calendar year 2016 commodities valued at roughly $268 billion were shipped to international and domestic destinations from SFO Of this total value about $168 billion originated in the Bay Area
Products originating in California and shipped internationally from SFO primary consist of technology goods Three commodity groups account for an estimated 83 of total value exported internationally which include electrical machinery industrial machinery (including computers) and optics and instruments with the remaining value spread cross aircraft manufacturing pharmaceutical products chemicals plastics and other commodities Figure 1 presents the value of California exports through SFO and all of California air exports This figure highlights that between 38 and 58 of Californiarsquos three leading exported commodities are shipped through SFO
2017 Economic Impact Study of San Francisco International Airport 10
Figure 1 International Exports Shipped from SFO and California by Industry Sector
Sources WISERTrade using data from the US Census Bureau Foreign Trade Division and the Freight Analysis Framework Calculations by EDR Group
Table 4 below presents how SFO ranks among the top five airports for these same three commodities groups previously mentioned SFO ranges between 8‐13 of national exports and ranks between second and sixth nationally for electric machinery industrial machinery (including computers) and opticalsurgical instrument exports
Table 4 Airport Ranking for Top Three Exported Commodities by Percent of Total
Electric Machinery Sound and TV Equip
Industrial Machinery (Incl Computers)
Optic Photo and Medic Surgical Instruments
Airport Total Airport Total Airport Total LAX 126 JFK 133 ORD 137 MSY 120 SFO 125 LAX 106 SFO 104 LAX 99 JFK 98 DFW 98 MIA 95 MSY 97 CLE 92 ORD 93 CLE 89 MIA 85 DFW 89 SFO 79 Total ($ millions) $89560 Total ($ millions) $65003 Total ($ millions) $59933
Source WISERTrade
In 2016 domestic outbound shipments from SFO totaled $83 billion and consisted primarily of electronics precision instruments pharmaceuticals motorized vehicles and machinery as shown in Figure 2
2017 Economic Impact Study of San Francisco International Airport 11
Figure 2 Domestic Outbound Air Shipments from SFO
Source FHWA Freight Analysis Framework (FAF)
2017 Economic Impact Study of San Francisco International Airport 12
CHAPTER 2 NATIONAL CONTEXT
The air transportation industry is a significant contributor to the US economy both in terms of output and employment In 2016 for instance the sector generated $1054 billion in gross domestic product (GDP) and was responsible for employing 437000 full‐time equivalent (FTE) workers in 20158 The role of air transportation extends well beyond industry operations alone however air travel indirectly stimulates both the global and national economy by facilitating trade and transporting passengers
San Francisco International Airport (SFO) is the largest airport in the Bay Area the seventh largest in the United States and the 21st largest in the world in terms of air‐passenger traffic9 When combined with Oakland International Airport and Mineta San Jose International Airport the three together constitute the sixth largest domestic passenger market in the US (as measured by enplanements)10 In FY 2016 SFO served 397 million total domestic passengers (enplaned and deplaned) capturing 65 of domestic Bay Area market share Meanwhile SFO had an international Bay Area market share of 93 with over 117 million international passengers served (enplaned and deplaned)11
This section outlines the role that SFO plays in facilitating domestic and international trade The role of SFO contributing to the regional economy as a domestic and international gateway for air cargo shipments from the Bay Area nine‐county region is presented in Chapter Six
CONTEXT THE VIBRANT BAY AREA ECONOMY
The 6900‐square mile nine‐county Bay Area (see Figure 3) is home to 77 million residents which accounts for 20 of Californiarsquos population12 The Bay Arearsquos population density of over 1100 people per square mile of land is more than four‐times the California average By itself the region would be the nationrsquos 13th most populous state falling between Washington at 73 million and Virginia at 84 million residents13 Moreover the per‐capita income of Bay Area residents is 42 above the California average and 58 above the national average14
8 US Department of Commerce Bureau of Economic Analysis Industry Economic Accounts Interactive Tables available at httpwwwbeagovindustryindexhtm as of May 2017 (National Data GDP amp Personal Income NIPA Table 65D FTE by Industry) GDP data is for 2016 while employment data is for 2015
9 2016 SFO Annual Report (2015 data) San Francisco CA San Francisco International Airport httpmediaflysfocoms3amazonawscommedia2016_Annual_Report_Finalpdf Airports Council International
10 Federal Aviation Administration Passenger Boarding (Enplanement) and All‐Cargo Data for US Airports 2015 11 2016 SFO Annual report SFOrsquos total Bay Area market share including both domestic and international passengers was 70
(or 514 million passengers) in FY2016 12 US Census 2016 13 Ibid 14 Based on data from the Bureau of Economic Analysis (BEA) in 2015
2017 Economic Impact Study of San Francisco International Airport 13
Figure 3 Illustration of the Bay Area by County
Source Data ndash RITA NTAD (National Transit Atlas Database) Graphic ndash EDR Group
Some of the largest and fastest growing companies in the country that make the region home fuel the economy of the Bay Area Twenty‐eight of the global Fortune 500 and 29 of the US Fortune 500 are headquartered locally Both of these groups represent more than $10 trillion in sales Since 2011 no Fortune 500 companies have relocated from the Bay Area and a new entrant data management and cloud services provider NetApp has joined the list Beyond just large companies the Bay Area is home to 25 of the Inc Fastest Growing 500 list collectively accounting for over $1 billion in sales The Bay Area is also home to three of the top ten global companies ranked by market capitalization including the two most valuable companies in the world Apple and Google If the Bay Area were a country it would be the 19th largest economy in the world with a gross regional product that falls between the gross domestic products of Turkey (18 among nations) and Switzerland (20)15
This generally high‐income level is supported by competitive economic strengths in the national and global economies The Bay Area is a national center for business innovation and technology while the city of San Francisco is one of the United Statesrsquo leading domestic and international tourist destinations Silicon Valley located in Santa Clara County is renowned as the countryrsquos technology (hardware and software) capital Other leading industries include financial activities pharmaceutical and medicine
15 Source Bay Area Council Economic Institute of the Bay Area Council Bay Area Fast Facts (wwwbayareaeconomyorg)
2017 Economic Impact Study of San Francisco International Airport 14
manufacturing professional scientific and technical services information services and higher education as well as hospitality related industries
These core strengths of the Bay Area economy have specialized air service needs that are served by San Francisco International Airport16 The high‐tech and pharmaceutical manufacturing knowledge based service sectors hospitality and agricultural industries rely on air services much more than other sectors for both passenger and cargo travel needs for the following reasons
Products produced tend to be high‐value delicate and time‐sensitive and need to be shipped by air Typically these are technology‐related products where value reflects high labor costs and precision manufacturing but may also be perishable agricultural products (including fish and meat)
Products that are heavy to ship but that carry a large return on transportation costs invested including just‐in‐time manufacturing and equipment needed to maintain high yielding production
Business and professional services depend on the sale of professional expertise which often requires travel to meet with clients and make presentations
Companies have statewide western national and even global business networks requiring frequent and often international travel between various offices
Airports serve resorts and tourist destinations
Producers of high‐tech products business services and computer‐oriented firms are among the industries that spend the most money on air services Most of these industries spend at least 40 more on air services than the average industry in the United States and a few spend 50 or more than the average of all industries in the United States17
SFOrsquoS ROLE IN INTERNATIONAL TRADE
Given its proximity to Asia markets SFO has historically played an important role in international trade Over the past decade the Airport experienced a trend in export activity like airports across the country (Table 5) From 2009 to 2016 the total air value of exports18 passing through SFO grew at an average annual rate of 35 from $21 billion to $268 billion The value of exports at all US airports (including SFO) rose from $3344 billion to $4370 billion or 39 annually during the same period
Despite being one of three commercial service airports within the region SFO now accounts for a majority of all export value that flies out of the Bay Area (Table 5) In 2016 Oakland International Airport exported $321 million worth of commodities with an annual average growth rate of 103 from 2009 to 2016 San Jose International Airport exported an air value of $390 million in 2014 and experienced an annual average growth rate of 56 from 2009 to 2014 The value of international air exports from San Jose International
16 The following is based on research conducted for Aviation Cooperative Research Program 03‐28 The Role of US Airports in the National Economy for the Transportation Research Board of the National Academies published as ACRP Report 132
17 Ibid 18 These are the value of the goods at the US port of export The value shall be the selling price (or the cost if the goods are
not sold) including inland or domestic freight insurance and other charges to the US seaport airport or land border port of export
2017 Economic Impact Study of San Francisco International Airport 15
rose from $106 billion in 2015 to $22 billion in 2016 an increase of 103 This rise in exports is driven primarily by aircraft and spacecraft exports which grew from $783 million in 2015 to $17 billion in 2016 However as of March 2017 only $85 million has been shipped indicating uncertainty whether additional exports will materialize throughout the year
Table 5 Air Value of US and Bay Area Export by Airport 2009‐2016
Airport 2009 2010 2011 2012 2013 2014 2015 2016
SFO $210 $274 $265 $261 $281 $274 $253 $268
SJC $03 $03 $03 $04 $05 $04 $11 $22 OAK $02 $02 $02 $02 $03 $04 $03 $03 Total from Bay Area International Airports
$215 $280 $270 $268 $289 $282 $266 $293
Source US Census Bureau Foreign Trade Division provided by WISERTrade
EXPORT COMMODITIES
While SFO serves as the gateway for a host of commodities the Airportrsquos top exports reflect the strengths of the Bay Area regional economy (Table 6) In 2016 electric machinery sound equipment and TV equipment exports alone were valued at $93 billion or over 35 of the total value exported through the Airport reflecting a resurgence in growth since the low value of $79 billion in exports in 2015 Other major commodities such as machinery and computers opticphotomedical instruments pharmaceutical aircraft manufacturing plastics and agriculture sector exports have been growing in both value and weight since 2009 By measure of air weight edible fruits and nuts topped the list of export commodities at SFO in 2016 at 28 thousand metric tons or 20 of the Airportrsquos total Industrial machinery (including computers) electric machinery and optic photo and medical instruments also constituted a significant share of the commodity weight exported on SFO flights in 2016 Since 2009 SFO has witnessed double‐digit growth in the export of meat exports by volume with an annual average increase of 204 over the past seven years
2017 Economic Impact Study of San Francisco International Airport 16
Table 6 Top Ten SFO Export Commodities by Air Value and Weight 2016
BY AIR VALUE
Rank Commodity Air Value (In $Ms)
Change (2009‐2016)
Annual Change (2009‐
2016) 1 Electronic Machinery SoundTV Equip $9326 6 09 2 Machinery and Computers $8096 57 67 3 OpticPhotoMedical Instruments $4741 26 34 4 Pharmaceutical Products $1480 81 89 5 Aircraft Spacecraft and Parts $530 10 14 6 Miscellaneous Chemical Products $467 ‐4 ‐05 7 Plastics $208 96 101 8 Edible Fruit and Nuts $174 55 65 9 Organic Chemicals $164 66 75 10 Tanning Dye Paint and Paint $132 21 28
All Others $1509 34 43
All Commodities $26828 28 36
BY AIR WEIGHT
Rank Commodity Air Weight (In 000s of Metric Tons)
Change (2009‐2016)
Annual Change
(2009‐2016) 1 Edible Fruit and Nuts 280 24 31 2 Machinery and Computers 271 17 23 3 Electric Machinery SoundTV Equip 184 7 10 4 OpticPhotoMedical Instruments 105 8 11 5 Vegetables Roots and Tubers 44 18 24 6 Articles of Iron or Steel 41 22 29 7 Plastics 40 5 06 8 Meat 36 267 204 9 Miscellaneous Chemical Products 33 ‐16 ‐25 10 Essential Oils Perfumes amp Cosmetics 25 ‐1 ‐02
All Others 1432 ‐1 ‐02 All Commodities 1433 1116 15
Source US Census Bureau Foreign Trade Division provided by WISERTrade
IMPORT COMMODITIES
SFO also serves as the entryway to the Bay Area for many commodity types (Table 7)19 Valued at $127 billion commodities in electric machinery soundTV equipment topped the Airportrsquos list of most valuable imports in 2016 These commodities when combined with those in the industrial machinery including computers optic photographic and medical instruments accounted for 79 of the Airportrsquos
19 US district and port data do not reflect state of origin or destination but indicate pass‐through location only There are no data available on state imports because it is impossible to tell the ultimate destination once goods enter the country
2017 Economic Impact Study of San Francisco International Airport 17
total import value in 2016 Pharmaceuticals chemical products pearlsstonesmetalscoins photo or cinema goods also constituted a significant portion of total import value at SFO last year while fish apparel plastics and vehicles comprised most of the Airportrsquos total import weight beyond typical electric‐related commodities
Pharmaceuticals experienced strong growth over the last seven years not only as an export commodity but also as an import to SFO (Table 7) Between 2009‐2016 the value of import commodities in this category grew by 620 or 326 annually up to $11 billion in 2016 All of the top commodity types by value increased over this period while apparel (not including knit) and vehicles declined in volume during the same period
2017 Economic Impact Study of San Francisco International Airport 18
Table 7 Top Ten SFO Import Commodities by Air Value and Weight 2016
BY AIR VALUE
Rank Commodity Air Value (In $Ms)
Change (2009‐2016)
Annual Change
(2009‐2016) 1 Electric Machinery SoundTV Equip $12703 51 61 2 Machinery and Computers $6990 19 26 3 OpticPhotoMedical Instruments $2269 55 65 4 Special Classification $1578 67 76 5 Pharmaceutical Products $1114 620 326 6 Miscellaneous Chemical Products $546 38 47 7 PearlsStonesMetalsCoins $213 21 27 8 Photo or Cinema Goods $198 61 70 9 Apparel (not including knit) $147 0 00 10 Vehicles (except rail or tramway) $144 88 94
All Others $1847 76 84 All Commodities $27749 48 57
BY AIR WEIGHT
Rank Commodity Air Weight (In 000s of Metric Tons)
Change (2009‐2016)
Annual Change
(2009‐2016) 1 Electric Machinery SoundTV Equip 385 34 43 2 Machinery and Computers 381 ‐10 ‐16 3 Fish Crustaceans and Aquatic 96 168 151 4 OpticPhotoMedical Instruments 84 11 15 5 Apparel (including knit) 56 27 34 6 Apparel (not including knit) 51 ‐4 ‐06 7 Plastics 45 64 74 8 Vehicles (except rail or tramway) 41 ‐2 ‐04 9 Special Classification 39 31 40 10 Furniture Bedding amp Lamps 37 395 257
All Others 432 79 87 All Commodities 1648 30 38
Source US Census Bureau Foreign Trade Division provided by WISERTrade Trade with Asia
SFO is a national gateway in terms of trade with Asia20 In 2016 the Airport was the third busiest in the nation in terms of trans‐pacific trade serving as the pass‐through port for $199 billion in total Asia export value which has grown from $154 billion in 2009 and peaked at $22 billion in 2013 (Figure 4) When measured by tonnage exported to Asia SFO ranked fourth among US airports each year since 2009 behind Chicago OrsquoHare International (ORD) Los Angeles International (LAX) and John F Kennedy International (JFK)
In 2016 Asia export value accounted for 74 of the Airportrsquos total export value This reliance on Asia exports has been consistent at SFO During the 2009‐2016 timeframe SFO and JFK alternated as the lead
20 Defined here as the Asia continent excluding the Middle East and Turkey
2017 Economic Impact Study of San Francisco International Airport 19
US airport in in terms of value per exported ton but in 2016 have both been surpassed by DFW as shown in Figure 5 Led by industrial machinery electrical machinery and optical instruments the value of exports to Asia through SFO averaged about $200000 per ton in 2016
Figure 4 Top Five Airports by Air Value of Exports to Asia 2009‐2016
Source US Census Bureau Foreign Trade Division provided by WISERTrade
Figure 5 Top Five Airports by Air Value per Ton of Exports to Asia 2009‐2016
Source US Census Bureau Foreign Trade Division provided by WISERTrade
TOTAL TRADE
In 2016 SFO facilitated nearly $546 billion of international trade (imports and exports) which required the transport of over 308000 metric tons of cargo The largest trading partners of US companies that
2017 Economic Impact Study of San Francisco International Airport 20
use SFO are in order of air value China Japan Malaysia Taiwan the Republic of Korea and Singapore Trade between the US and these six nations accounted for 70 of the value and 61 of tonnage of commodities moved through SFO As displayed in Table 8 the Airport enabled trade of a billion dollars or more with 12 different nations in 2016 and nine of them are in Asia Germany is the largest non‐Asia market connected through SFO
Table 8 Countries that Traded Commodities with Total Value More than $1 Billion in 2016 through SFO In Order of Value of Trade
Trading Partner Value of Trade 2016 (in $Mrsquos)
Percent of Total SFO Air Trade
Metric Tons 2016
Percent of Total
Tonnage China $11535 21 69938 23 Japan $6696 12 41294 13 Malaysia $6192 11 9601 3 Taiwan $5026 9 29460 10 Korea Republic Of $4913 9 23644 8 Singapore $4010 7 13958 5 Germany $2094 4 11614 4 Hong Kong $1628 3 9865 3 Thailand $1359 2 4773 2 Switzerland $1235 2 4691 2 Philippines $1118 2 2555 1 Ireland $1022 2 2627 1 Other (224 countries) $7749 14 84040 27 Total $54577 100 308060 100
Source US Census Bureau Foreign Trade Division provided by WISERTrade
2017 Economic Impact Study of San Francisco International Airport 21
This Page Left Blank Intentionally
2017 Economic Impact Study of San Francisco International Airport 22
CHAPTER 3 ON‐AIRPORT IMPACTS
DIRECT EMPLOYMENT
In 2016 nearly 41000 people were employed at SFO (excluding employment generated by temporary construction expenditures) according to data from the surveys of airport management and tenants In addition to 14900 employees of passenger airlines the Airport supports a wide variety of other aviation‐related jobs in transportation retail and government services These jobs involve
Freight services including dedicated cargo aviation courier delivery custom broker and trucking
Air terminal operations including security building maintenance and facility management
Airline support services including catering in‐flight entertainment aircraft handling fueling and maintenance
Concessionaire services including restaurants and retail stores
Ground transportation including rental car taxis and limousines
Figure 6 shows the distribution of jobs at SFO by major function Roughly 48 of airport jobs are directly aviation related which includes passenger and freight airlines and aviation support services (eg in‐flight catering firms and fixed‐base operators) The Airport Commission and contractors federal agencies such as the FAA and the TSA and other administrative functions account for 16 of on‐airport employment Terminal concessions account for 12 of employment while ground transportation also accounts for 18 of total full time and part time jobs
Figure 6 Distribution of On‐Airport Tenants and Administrative Jobs
Passenger Airlines 37
Admin Gov Security 16
Ground Transp 19
Terminal Concessions
12
Aviation Support 10
Rental car 5
Freight Transp 1
Sources Interviews of tenants and airport administration
2017 Economic Impact Study of San Francisco International Airport 23
BUSINESS SALES AND PAYROLL
In 2016 SFO business establishments generated $80 billion of business revenues (business sales and government budget expenditures) which included over $25 billion of payroll for nearly 40800 workers at the Airport (see Table 9)
Table 9 Direct Impacts of On‐Airport Tenants and Administrative Employees
Impact Type Employment Payroll Revenues
Direct Effect 40787 $2526045000 $8042483000
Note Data excludes on‐airport construction activities in 2016 Source Airport Tenant Survey and data from the US Department of Commerce aggregated through IMPLAN
Payroll was calculated from a hybrid of the survey responses and average revenues and wages per worker by economic sector in the Bay Area21 Findings from this analysis show that passenger airlines represent 37 of employment at SFO but also account for 45 of labor income earned by workers and 61 of revenues generated on the Airport Passenger Airlines was the only sector with a higher percentage of total labor income and productivity (revenues) than employment across all sectors as shown in Figure 7 Moreover the average payroll for on‐airport workers was $62000
Figure 7 Percent of Relative Employment Labor Income and Revenues by Aggregated Sector on SFO
70
0
10
20
30
40
50
60
Jobs Business Sales Labor Income
Passenger Admin Gov Ground Terminal Aviation Rental car Freight Other Airlines Security Transp Concessions Support Transp
Sources Interviews of tenants and airport administration US Department of Commerce data provided by IMPLAN Calculations by EDR Group
21 Survey respondents were asked for payroll When it was not provided the survey data were supplemented with US Department of Commerce data for appropriate industry sectors for each employer aggregated by the Minnesota IMPLAN Group (MIG Inc)
2017 Economic Impact Study of San Francisco International Airport 24
INDIRECT AND INDUCED IMPACTS
The direct economic activities at SFO lead to additional downstream impacts on suppliers as well as re‐spending of worker income To calculate the impacts of these effects indirect and induced multipliers were calculated for each of the categories listed in Table 10
Table 10 Direct Employment Labor Income and Business Revenues for Tenant and Administrative SFO
Classification of Activity by Sector Employment Payroll Revenues
Passenger Services amp Airport Administration
OtherNon‐Profit 93 $5449000 $12763000 StateLocal Government 93 $6998000 $15636000 Parking and Miscellaneous 232 $15853000 $30350000 Management MaintCleaning amp Facilities Services 339 $35846000 $79634000 Federal Government 1814 $223187000 $326720000 City of San Francisco Airport Commission 1998 $257567000 $300062000 Security Firms 2011 $101198000 $136874000 FBOs General Aviation and Aviation Services 4062 $180244000 $418961000 Airport Retail and Concessions 4904 $171696000 $626054000 Passenger Airlines 14962 $1148294000 $4896253000 Sub Total 30507 $2146332000 $6843307000
Freight Transportation Services Freight Airlines and Couriers 485 $31351000 $119587000
Passenger Ground Transportation Services LimosBusesVansTransit 2618 $85443000 $190926000 Taxi Cabs 2809 $91686000 $204877000 Transportation Network Companies (TNCs) 2131 $69544000 $155400000 Rental Car 2238 $101689000 $528386000 Sub Total 9375 $334665000 $1048981000
Total Airport‐Based 40787 $2526045000 $8042483000
Notes Data excludes on‐airport construction activities conducted in 2016 Dollars rounded to the nearest thousand Columns may not add due to rounding
Sources Interviews of tenants airport administration and US Department of Commerce data provided by IMPLAN Calculations by EDR Group
In 2016 the direct economic activities on‐airport generated an additional $67 billion in business revenues in the Bay Area (indirect and induced effects) supporting over 33000 additional jobs and $26 billion in labor income (payroll) The total economic contribution of on‐airport activity to the Bay Area is roughly $147 billion in revenues yielding nearly 74200 jobs and $52 billion in labor income for workers (see Table 11) Suppliers of goods and services generated approximately $29 billion in revenues over 14000 jobs and expended over $12 billion on payroll (indirect impacts) The re‐spending of labor income by workers on airport and supplier firms supported nearly 19000 additional Bay Area jobs with over $14 billion in payroll and $37 billion in new business sales
2017 Economic Impact Study of San Francisco International Airport 25
Table 11 Summary of Direct Indirect and Induced Economic Impacts of SFO in Bay Area
Economic Impacts Employment Payroll Revenues I Direct Impact Airport‐Driven Activity Airport‐Based 40787 $2526045000 $8042483000 II Indirect Impact Suppliers of Goods and Services Due to Airport and Related Activities 14330 $1252520000 $2947530000 III Induced Impact Re‐Spending of Worker Income Due to Airport and Related Activities 19047 $1415986000 $3758072000 Total Regional Impact 74164 $5194551000 $14748085000
Notes Dollars rounded to the nearest thousand Columns may not add due to rounding
Sources Interviews of tenants airport administration and US Department of Commerce data provided by IMPLAN Calculations by EDR Group
On‐airport businesses purchase supplies and services from the greater Bay Area economy which is highly concentrated in air‐reliant services22 transportation support other services and food and beverage industries which combined represent 71 of all supporting industries (Table 12) The wages spent by employees of on‐airport businesses for their daily living needs are primarily spent on service sectors food and beverages and retail which combine to be 74 of all purchases made within in the Bay Area economy as indicated in Table 13
Table 12 Supplier of GoodsServices Industries (Indirect)
Industry Employment of Total
Air‐reliant services 3042 21 Other Services 3017 21 Transportation Support 2951 21 Food amp Beverage 1128 8 Couriers 681 5 Wholesale Trade 602 4 State amp Local Government 499 3 Manufacturing 419 3 Construction 318 2 Banking amp Financial Services 269 2 All Others 1404 10 Total 14330 100
Sources US Department of Commerce data provided by IMPLAN Calculations by EDR Group
22 Air‐reliant services include architectural engineering business support computer systems design services facility support financial services management scientific technical services and consulting These sectors purchase large amounts of air transportation services Other Services include insurance rentalleasing building services landscaping waste management medical social and maintenance and repair A full listing is in Appendix I
2017 Economic Impact Study of San Francisco International Airport 26
Table 13 Re‐Spending of Worker Income Industries (Induced)
Industry Employment of Total
Services 6553 34 Food amp Beverage 2855 15 Reliant Services 2425 13 Retail 2277 12 Entertainment 734 4 Wholesale Trade 561 3 Banking amp Financial services 438 2 Manufacturing 292 2 State amp Local Government 253 1 All Others 2661 14 Total 19047 100
Sources US Department of Commerce data provided by IMPLAN Calculations by EDR Group
ON‐AIRPORT CONSTRUCTION
SFO provided a summary of all capital projects from FY 1314 to FY 1516 The summary of projects was provided in eight categories of expenditures including terminal airport support groundside environmental parking safety amp security airfield and utility improvements An analysis over multiple years is preferable to smooth‐out annual fluctuations that are typically seen in construction spending The objective of this approach is to estimate economic impacts of construction at SFO for a ldquotypical yearrdquo to mitigate the short‐term investment periods associated with single construction projects
Each type of expenditure is matched to the most appropriate industry sector in the IMPLAN modeling package as described in Table 14
Table 14 Sector Mapping
SFO Capital Construction Category IMPLAN Sector
Description
Terminal improvements Construction of nonresidential structures
Airport support improvements Facilities support services
Groundside improvements Maintenance and repair (roadway amp taxiway)
Environmental improvements
Maintenance amp Repair (nonresidential) Parking improvements
Safety amp security improvements
Airfield improvements
Utility improvements Water sewage and other systems
Source SFO and US Department of Commerce data provided by IMPLAN
2017 Economic Impact Study of San Francisco International Airport 27
After classifying each of the five expenditure categories into the corresponding IMPLAN sector these economic impacts of the capital investments were estimated for the nine Bay Area counties for an average year from FY 1314 ndash FY 1516 (Table 15)
Table 15 Annual Average Impacts from SFO Construction on the Bay Area Economy
Impact Type Employment Labor Income Expenditures Direct Effect 2041 $144669000 $366782000 Indirect Effect 644 $49244000 $122327000 Induced Effect 961 $60104000 $163281000 Total Effect 3645 $254017000 $652390000
Notes Dollars rounded to the nearest thousand Columns may not add due to rounding
Source Employment and Labor Income derived using IMPLAN
2017 Economic Impact Study of San Francisco International Airport 28
CHAPTER 4 VISITOR SPENDING
In the year ending June 2016 526 of domestic and international air travelers arriving at SFO were non‐residents visiting the region (representing 102 million of the 193 million origin and destination (OampD) enplanements at the Airport excluding connecting passengers) SFO traffic statistics and national data sets from the Department of Transportation show that that 26 of all visitors were international visitors 12 were Southern California residents served by four airports and 62 were visitors from other parts of the United States Surveys of air travelers indicate that 70 of visitors traveled for personal reasons to the Bay Area and 30 for business reasons The survey also shows that the trip purposes of domestic travelers are more likely to be business related than for international travelers (Figure 8)
Figure 8 Profile of Air Visitors Arriving via SFO by Place of Origin
Sources Visitor Survey Conducted by Polaris Inc SFO Traffic Statistics US DOT OampD Survey US DOT T‐100 Database IATA PaxIS Database US DOC National Travel and Tourism Office (NTTO) Calculations by EDR Group and ICF
2017 Economic Impact Study of San Francisco International Airport 29
VISITOR SPENDING
The survey of arriving visitors found that on average international visitors spend $1234 in the Bay Area and domestic US visitors spend $1024 per trip The breakdowns by trip origin and trip purpose (business or labor) are shown in Figure 9
Figure 9 Relative Spending of Visitors per Trip by Origin and Purpose
Sources Visitor Survey Conducted by Polaris Inc Calculations by EDR Group
Overall the off‐airport spending of the 102 million domestic and foreign visitors who arrived through SFO visitor amounted to nearly $111 billion of which approximately $105 billion was in the Bay Area and an additional $585 million was outside the Bay Area23 This encompasses spending on hotels food and beverage retail purchases entertainment and recreation and local travel (eg taxis car rental24 sight‐seeing trips and public transportation) The breakout of visitor spending by sector is shown in Table 16
Table 16 Off‐Airport SFO Visitor Spending Inside and Outside of the Bay Area
Sector Total within Bay Area Total Outside Bay Area Total
Accommodations $4515536000 $263822000 $4779358000 Food and Beverage $2407541000 $128195000 $2535735000 Retail $1769840000 $90393000 $1860234000 Entertainment $831216000 $44525000 $875740000 Car Rental $714078000 $50036000 $764114000 Ground Transportation $301415000 $7788000 $309203000 Total $10539626000 $584759000 $11124384000
Note Dollars are rounded to thousands
Sources SFO Traffic Statistics and national data sets from the Department of Transportation Visitor Survey Calculations by EDR Group
23 Visitor surveys conducted at SFO indicated if spending occurred within the Bay area or in surrounding counties 24 On‐airport car rentals are included in the On‐airport tenant estimates Car rentals off‐airport is included in the Visitor Spending
estimates
2017 Economic Impact Study of San Francisco International Airport 30
JOBS AND INCOME GENERATED BY OFF‐AIRPORT VISITOR SPENDING
The $111 billion spent in 2016 by visitors arriving through SFO supported over 138000 jobs within the Bay Area and an additional 8500 jobs supported by visitor spending outside the Bay Area in other counties in California
Table 17 Breakdown of Total Visitor Spending Impacts
Impact Type Employment Payroll Visitor Spending Total Visitor Spending Impacts in Bay Area Direct 96121 $3870828000 $10539626000 Indirect 15268 $1234317000 $3066523000 Induced 26893 $1685335000 $4560386000 Total 138282 $6790480000 $18166535000 Total Visitor Spending Impacts Outside of the Bay Area Direct 5731 $198297000 $584759000 Indirect 1185 $70593000 $205456000 Induced 1596 $79311000 $239010000 Total 8511 $348201000 $1029225000 Total Visitor Spending Impacts Due to SFO Direct 101852 $4069125000 $11124385000 Indirect 16452 $1304910000 $3271979000 Induced 28489 $1764646000 $4799396000 Total 146793 $7138681000 $19195760000
Notes Jobs include employees and proprietors Payroll includes wages profits and value of benefits
Sources Visitor Survey conducted by Polaris Inc SFO Traffic Statistics and national data sets from the Department of Transportation Calculations by EDR Group
The IMPLAN modeling package was tailored to the nine‐county Bay Area and the rest of California to calculate direct jobs and wages from visitor spending in the region and to capture spending in the remaining counties of California In the initial stage of the analysis spending profiles were developed as shown in Table 16 (lodging food and beverage entertainment retail and local ground transportation) were used in the initial stage of the analysis25 The first step was to apply business sales (the actual visitor spending) to worker ratios to estimate employment generated by visitor spending The second step involved applying payroll to worker ratios to these employment estimates to calculate the how much labor income is generated for each of the five categories of spending These ratios are summarized in Table 18 and the applied calculations are as follows
1 Step 1 Employment Generated by Visitor Spending = Visitor SpendingBusiness Sales per Worker (by sector)
2 Step 2 Labor Income Generated by Visitor Spending = Workers (calculated in Step 1 above) Labor Income per Worker (by sector)
25 IMPLAN packages data from federal agencies on a county basis including the US Department of Commerce and the US Department of Labor EDR Group developed the sectors that reflect visitor spending and aggregated the counties to build the Bay Area region and Outside‐Bay Area region
2017 Economic Impact Study of San Francisco International Airport 31
Table 18 Earnings and Sales per Worker
Sector Payroll per Worker
Sales per Worker
Ground Transportation $56195 $116579 Car Rental $45823 $233176 Accommodations $47874 $119611 Retail $41257 $83847 Entertainment $36507 $88861 Food amp Beverage $31016 $65252
Notes Payroll (labor income) includes wages and profits Retail Sales per worker are margined sales
Sources US Departments of Commerce of Labor data provided by IMPLAN Calculations by EDR Group
INDIRECT AND INDUCED IMPACTS
Activities serving air travelers or visitors outside of the Airport (see Table 16) also generate additional orders for goods and services from suppliers These include orders for
Fuel and maintenance services by off‐airport taxis rental cars tour buses and public transportation
Accounting fees paid by businesses in hospitality industries
Food products for off‐airport restaurants
Wholesale merchandise to be sold by off‐airport stores
Furniture and equipment for off‐airport hotels restaurants and stores
These orders in turn support additional employment and wages in the Bay Area Supplier orders support payroll to workers of these supplier businesses Workers then spent this income on consumer purchases such as
Retail purchases for consumer items such as food clothing home furnishings and cars
Purchases of health care and childcare services
Rent and mortgage payments and other housing costs
In 2016 the multiplier effects of spending by air visitors to the Bay Area generated an additional $76 billion in business revenues in the region supporting 42000 additional jobs and provided over $29 billion in total payroll expenditures
Including initial visitor spending indirect supplier purchases and spending of earned income by workers in visitor services industries the total economic contribution of SFO visitors to the Bay Area totaled roughly $182 billion in revenues yielding over 138000 jobs and nearly $68 billion in payroll (see Table 19) Suppliers of goods and services generated approximately $30 billion of revenues 15000 jobs and $12 billion of Labor income (indirect impacts) The re‐spending of earnings supported $46 billion of revenues nearly 27000 jobs and close to $17 billion of labor income (induced impacts)
2017 Economic Impact Study of San Francisco International Airport 32
Table 19 Summary of Direct Indirect and Induced Economic Impacts of the Contribution of Visitor Spending in the Bay Area
Economic Impact Business Revenues Payroll Jobs
I Direct Impact Visitor Spending Activity Direct Visitor Spending $10539626000 $3870828000 96121 II Indirect Impact Suppliers of Goods and Services Due to Visitor Spending Off‐Airport $3066523000 $1234317000 15268 III Induced Impact Re‐Spending of Worker Income Due to Visitor Spending Off‐Airport $4560386000 $1685335000 26893 Total Regional Impact in Bay Area $18166535000 $6790480000 138282
Notes Dollars rounded to thousands Columns may not add due to rounding
Sources SFO Traffic Statistics and national data sets from the Department of Transportation Visitor Survey US Department of Commerce data provided by IMPLAN IMPLAN multiplier package Calculations by EDR Group
2017 Economic Impact Study of San Francisco International Airport 33
This Page Left Blank Intentionally
2017 Economic Impact Study of San Francisco International Airport 34
CHAPTER 5 IMPACTS OF AIR RELIANT USERS
(FREIGHT SHIPPERS)
For this study ldquoreliant usersrdquo are defined as manufacturers and agricultural industries that ship products by air through SFO26
THE ROLE OF SFO IN AIR EXPORTS
SFO plays a critical role in Californiarsquos economy by enabling manufacturers and agricultural producers to transport commodities and finished goods to customers in both domestic and international markets This section on air reliant activities signifies the contribution of SFO to economic development in the Bay Area by enabling regional firms to sell products across the US and the world and thereby maximize shares of national and international trade Without the services offered at SFO (and if the similar scale of air services is not taken up by another regional airport) companies in the Bay Area that produce and ship products would find markets limited and market shares curtailed In turn economic activity in the Bay Area that is associated with production of goods shipped through SFO would be reduced
A review of the products shipped from the Bay Area through SFO provides an insight into the cross‐section of the economy that is reliant on‐air cargo services at SFO in particular Silicon Valley located in Santa Clara county and home to major technology companies and start‐ups This analysis is based on industry specific data from the Foreign Trade Division of the US Census Bureau and the Freight Analysis Framework of the US DOT (Federal Highway Administration) and economic output by industry from the US Bureau of Economic Analysis (collected by the Minnesota IMPLAN Group)27
INTERNATIONAL EXPORTS
SFO is a gateway for the Bay Area manufacturing and other industries to deliver their products to customers throughout world To assess the role that SFO plays in exports from the Bay Area the following methodology was applied According to data from the Foreign Trade Division (collected by WISERTrade) 25 of all California air exports that originated in California passed through SFO This percentage was applied to all industry sectors (three‐digit NAICS) to estimate the value and types of Californian exports going through SFO To isolate the Bay Area specific exports the ratio of Bay Area output to total California output was calculated using US Bureau of Economic Analysis (BEA) data and applied to California exports going through SFO28 The results represent estimates of international exports by industry that are produced by Bay Area businesses and exported for sale through SFO This methodology is further explained in Appendix I
Air‐freight shipped from SFO is overwhelmingly concentrated in technology goods produced in the Bay Area The leading export industry is Computer and Electronics manufacturing which accounts for nearly
26 This definition is based on past SFO Economic Impact Studies 27 At this writing the most recent year available for both Foreign Trade Division and US Bureau of Economic Analysis information
is 2016 28 Provided through the Minnesota IMPLAN Group
2017 Economic Impact Study of San Francisco International Airport 35
two‐thirds of the regionrsquos exports by value as indicated in Table 20 The next four ranked industries (chemicals machinery transportation equipment electrical equipment and appliances) account for an aggregate 26 of total Bay Area exports Altogether the top five industries account for 89 of the total value of goods that originates in the Bay Area and are shipped through SFO
Table 20 Top International Exported Industries
Industry Value (in $millions)
of Total
Computers and Electronics $5430 631 Chemicals $848 99 Machinery $742 86 Transportation Equipment $425 49 Electrical Equipment amp Appliances $232 27 All others $928 108 Total $8604 100
Sources US Census Bureau Foreign Trade Division collected by WISERTrade
DOMESTIC EXPORTS
The FHWA Freight Analysis Framework (FAF) was used to identify the domestic flows of Bay Area goods to US customers via SFO The FAF areas are represented by Combined Statistical Areas (CSAs) represent the FAF areasmdashthe San Francisco CSA includes 12 counties (the Bay Area plus San Benito Santa Cruz and San Joaquin counties) To scale the commodity flows to the nine‐county Bay Area a ratio was applied like the approach described above for international exports This ratio was calculated using the BEA industry output for the nine‐county region and was divided by the industry output for the 12‐county CSA
Even more concentrated than international exports domestic shipments are highly concentrated in computer and electronics and electrical equipment manufacturingmdashcombined these sectors account for 75 of the total Bay Area produced shipments through SFO The second largest amount of exports is in chemicals which represents 94 of all exports as indicated in Table 21 Together the top five industries represent 91 of the total value of Bay Area domestic exports through SFO
Table 21 Top Domestic Shipped Industries
Industry Value (in $millions)
of Total
Computers and Electronics $3419 423 Electrical Equipment amp Appliances $2642 327 Chemicals $761 94 Transportation Equipment $302 37 Machinery $191 24 All Others $766 95 Total $8081 100
Source Freight Analysis Framework US Department of Transportation
2017 Economic Impact Study of San Francisco International Airport 36
Combining both domestic and international products still highlights the integral part that computer and electronics and electrical equipment manufacturing (70) plays within the Bay Area compared to other manufacturing sectors (Figure 10) and the significance that SFO has in enabling these products to reach their customers
Figure 10 Percentage of the Bay Arearsquos Combined Domestic and International Exports Shipped via SFO
Sources US Census Bureau Foreign Trade Division collected by WISERTrade and Freight Analysis Framework US Department of Transportation
ECONOMIC CONTRIBUTION OF SFO TO THE BAY AREA
To gauge the level of impact EDR Group used US Bureau of Economic Analysis (BEA) data included in IMPLAN to 1) estimate the jobs and wages associated with the domestic and international exports through SFO and 2) determine the additional activity that percolates throughout the economy as air‐reliant businesses purchase additional goods and services from suppliers (Indirect) and employees spend their additional income (Induced) BEA data within IMPLAN is used because it contains information about the structural buyer‐supplier relationships within the economy as well as the industries where labor income is usually spent
Overall $167 billion in domestic and international exports shipped via SFO contribute to over 26000 jobs and over $40 billion in labor income within the Bay Area (Table 22) When including purchases of supplier goods and services (Indirect) and employee wage re‐spending (Induced) the total impact of air exports on the Bay Area economy accounts for over 84000 jobs and nearly $29 billion in business sales (output) Appendix I describes the methodology used to develop these calculations
2017 Economic Impact Study of San Francisco International Airport 37
Table 22 Economic Value of Domestic and International Exports Originating in the Bay Area via SFO
Impact Type Employment Labor Income Output Direct Effect 26078 $4023963000 $16721996000
Indirect Effect 20448 $2262032000 $6067692000
Induced Effect 37706 $2408696000 $6186854000
Total Effect 84232 $8694691000 $28976542000
Source US Department of Commerce data provided by IMPLAN Calculations by EDR Group
EFFECTS ON SUPPLIERS OF GOODS AND SERVICES
Figure 11 profiles the employment supported when Bay Area air‐reliant businesses purchase goods and services from other Bay Area businesses In total over 20000 jobs are dependent on Bay Area air‐reliant businesses that purchase goods and services to make final products that are shipped via SFO Most jobs are in the services sector which accounts for over 10000 of the indirect jobs
Figure 11 Employment Impacts on Suppliers of Goods and Services (Indirect)
Service
Trade
Manufacturing
Transp Inform amp Utilities
Government
Construction
Agriculture
Mining
Jobs
Source US Department of Commerce data provided by IMPLAN Calculations by EDR Group
At a finer level of BEA industry detail purchases made by Bay Area air‐reliant businesses are concentrated in wholesale trade administrative support professional scientific and technical services management of companies and computers and electronics As shown in Table 23 these five industries represent 60 of the total jobs supported by air reliant business purchases Nearly 40 of the job impacts are spread across other industries indicating that the dependence on Bay Area businesses that use SFO is widespread across most the local economy
0 2000 4000 6000 8000 10000 12000
2017 Economic Impact Study of San Francisco International Airport 38
Table 23 Impacts on Suppliers of Goods and Services (Indirect) by BEA Industry
Industry Category Jobs of Total
Wholesale trade 3709 18 Administrative Support 2881 14 Professional Scientific amp Technical Services 2588 13 Management of Companies 1810 9 Computer amp Electronics 1311 6 Government 743 4 Repair amp Maintenance 619 3 Food amp Beverage 616 3 Fabricated Metals 592 3 Construction 546 3 Rest of Others 5034 25 Total 20448 100
Source US Department of Commerce data provided by IMPLAN Calculations by EDR Group
The following sections did not include any updated information and therefore can be found in Chapter 5 Impacts of Air Reliant User (Freight Shipper) within the 2016 Economic Impact Study of San Francisco International Airport Overview of International Freight Activity SFO Connects the Bay Area to Domestic Markets Commodities Shipped from SFO to Domestic Markets County by County Commodity Movements
2017 Economic Impact Study of San Francisco International Airport 39
CHAPTER 6 TAX IMPACTS GENERATED BY ACTIVITIES AT SFO
The income and business sales produced by economic activities at SFO in turn generate federal state county and municipal tax revenues This chapter presents estimates of state and local tax impacts from airport activities as well as federal aviation taxes derived from aviation services29
STATE AND LOCAL TAX IMPACTS
The state and local tax revenues linked to operations at SFO totaled nearly $29 billion in 2016 including close to $16 billion from direct activities and almost $13 billion from purchases of supplier goods and services (Indirect) and re‐spending of worker income (Induced) Tax revenues are estimated using effective tax rates calculated by BEA and US Census data (as organized through IMPLAN) as well by considering California publications including the Governorrsquos Budget Summary ndash 2015‐16 Comprehensive Annual Financial Report of the State Controllerrsquos Office and the County of San Mateo Appendix II includes a breakout of tax revenues by county where applicable
Table 24 Estimated 2016 State and Local Tax Impacts (in $ millions)
Impact Category Direct Activities Indirect Induced
Activities Total Activities
On‐Airport $602 $336 $937
Construction $7 $16 $23
Visitor Spending $697 $345 $1041
Air‐Reliant Businesses $280 $592 $872
Total Taxes $1586 $1288 $2874
Sources Totals may not sum due to rounding Based on information from Regional Economic Accounts (REA) and National Income and Product Accounts (NIPA) from the Bureau of Economic Analysis (BEA) and Consumer Expenditure Survey (CES) and the Annual Survey of State and Local Government Finances (SLGF) from the US Census Bureau
FEDERAL AVIATION TAXES
Aviation operations at SFO generated more than $12 billion dollars in federal taxes including $419 million from taxes on international and domestic passengers and $791 million in US Customs revenue from customs duties on international air cargo shipments (Table 25) These tax revenues are remitted to the US Department of the Treasury and may not directly benefit the Bay Area or the State of California
29 Data developed in this chapter should be considered as order of magnitude estimates As in previous economic impact studies for SFO tax impacts are derived from per‐capita measures
2017 Economic Impact Study of San Francisco International Airport 40
Table 25 Estimated 2016 Federal Aviation Tax Revenues
Type of Tax ChargesFees Revenues in millions
of Total
Customs and Immigration $550 and $7 per passenger $32 3
International Arrival and Departure Tax $1800 per passenger $93 8
Domestic Passenger Taxes $410 per passenger amp 75 of airfare $237 20
Sept 11th security fee $560 per passenger $57 5
Sub‐Total Passenger Related Taxes $419 35
US Customs Revenue (International Cargo) Customs Revenues (US ITC) $791 65
Total $1211 100
Notes Includes US Government Segment tax Does not include Domestic Transportation tax (75 of airfare cost)
Sources Federal Aviation Administration wwwairlinesorg and wwwWiserTradecom
2017 Economic Impact Study of San Francisco International Airport 41
CHAPTER 7 DISTRIBUTION OF IMPACTS BY BAY AREA COUNTIES
This chapter presents the distribution of direct jobs and income as well as the distribution of tax benefits among Bay Area counties for on‐airport and visitor spending categories Local impacts are based on a sample of almost 24000 on‐airport employees by zip code compiled for the 2016 Study
ON‐AIRPORT EFFECT AMONG BAY AREA COUNTIES
Table 26 and Table 27 show estimates of jobs payroll (labor income) and business revenues (output) associated with each of the nine Bay Area counties that are generated by on‐airport economic activity In Table 26 direct and induced employment and wages are allocated to the counties based on the residence of employees of the Airport Commission staff its contract workers and tenants Due to the location of SFO all direct business revenues (direct output) are generated in San Mateo County (Table 29) Economic impacts (employment payroll and business revenues) associated with supplier purchases (indirect) were applied proportionally to each county based on relative employment levels compared to the Bay Area region
Table 26 Employment and Labor Income Impacts of On‐airport Tenants by County
County Impact Type
Employ ment
Labor Income County Impact Type
Employ ment
Labor Income
Alameda
Direct 5487 $339835000 San Mateo
Direct 12197 $755396000 Indirect 2836 $247852000 Indirect 1516 $132524000 Induced 2562 $190496000 Induced 5696 $423440000 Total 10885 $778183000 Total 19409 $1311360000
Contra Costa
Direct 2600 $161011000 Santa Clara
Direct 1307 $80940000 Indirect 1505 $131531000 Indirect 3750 $327807000 Induced 1214 $90255000 Induced 610 $45371000 Total 5319 $382797000 Total 5668 $454118000
Marin
Direct 221 $13692000
Solano
Direct 1125 $69671000 Indirect 551 $48121000 Indirect 527 $46064000 Induced 103 $7675000 Induced 525 $39054000 Total 875 $69488000 Total 2177 $154789000
Napa
Direct 125 $7741000
Sonoma
Direct 199 $12323000 Indirect 291 $25428000 Indirect 836 $73075000 Induced 58 $4339000 Induced 93 $6908000 Total 474 $37508000 Total 1128 $92306000
San Francisco
Direct 6618 $409849000 Outside Bay Area
Direct 10908 $675588000 Indirect 2518 $220117000 Indirect NA NA Induced 3090 $229743000 Induced 5094 $378704000 Total 12226 $859709000 Total 16002 $1054292000
Total
Direct 40787 $2526046000 Indirect 14330 $1252519000 Induced 19047 $1415985000 Total 74164 $5194550000
Notes Cells left blank because indirect impacts from the Bay Area are only allocated to each of the 9 counties Sources Airport Tenant Survey Data Provided by SFO and US Department of Commerce data provided by IMPLAN Calculations by EDR Group
2017 Economic Impact Study of San Francisco International Airport 42
Table 27 Business Revenues Impacts of On‐airport Tenants by Bay Area County
County Impact Type Business Revenues
County Impact Type Business Revenues
Alameda
Direct $0
San Mateo
Direct $8042484000 Indirect $583266000 Indirect $311867000 Induced $505583000 Induced $1123825000 Total $1088849000 Total $9478176000
Contra Costa
Direct $0
Santa Clara
Direct $0 Indirect $309528000 Indirect $771423000 Induced $239541000 Induced $120417000 Total $549069000 Total $891840000
Marin
Direct $0
Solano
Direct $0 Indirect $113241000 Indirect $108402000 Induced $20370000 Induced $103651000 Total $133611000 Total $212053000
Napa
Direct $0
Sonoma
Direct $0 Indirect $59839000 Indirect $171965000 Induced $11517000 Induced $18333000 Total $71356000 Total $190298000
San Francisco
Direct $0 Outside Bay Area in CA
Direct $0 Indirect $517998000 Indirect NA Induced $609744000 Induced $1005092000 Total $1127742000 Total $1005092000
Total
Direct $8042484000 Indirect $2947529000 Induced $3758073000 Total $14748086000
Notes Cells left blank because indirect impacts from the Bay Area are only allocated to each of the 9 counties Sources Airport Tenant Survey Data Provided by SFO and US Department of Commerce data provided by IMPLAN Calculations by EDR Group
2017 Economic Impact Study of San Francisco International Airport 43
VISITOR SPENDING The visitor spending survey conducted at SFO documented the destinations of visitors who arrive in California through SFO Table 28 indicates the economic impacts associated with visitor spending for each county
Table 28 Economic Impacts of Visitor Spending by Bay Area County
Bay Area County Impact Type Employment Labor Income Visitor Spending
Alameda
Direct 6812 $274314000 $746911000 Indirect 1082 $87472000 $217315000 Induced 1906 $119435000 $323181000 Total 9800 $481221000 $1287407000
Contra Costa
Direct 4737 $190766000 $519423000 Indirect 752 $60831000 $151127000 Induced 1325 $83058000 $224749000 Total 6815 $334655000 $895299000
Marin
Direct 2732 $110014000 $299551000 Indirect 434 $35081000 $87155000 Induced 764 $47900000 $129613000 Total 3930 $192995000 $516319000
Napa
Direct 3933 $158385000 $431255000 Indirect 625 $50505000 $125474000 Induced 1100 $68960000 $186600000 Total 5658 $277850000 $743329000
San Francisco
Direct 52000 $2094047000 $5701745000 Indirect 8260 $667743000 $1658933000 Induced 14549 $911735000 $2467086000 Total 74808 $3673525000 $9827764000
San Mateo
Direct 10475 $421828000 $1148568000 Indirect 1664 $134511000 $334178000 Induced 2931 $183661000 $496973000 Total 15069 $740000000 $1979719000
Santa Clara
Direct 10832 $436224000 $1187767000 Indirect 1721 $139102000 $345583000 Induced 3031 $189929000 $513934000 Total 15584 $765255000 $2047284000
Solano
Direct 667 $26864000 $73147000 Indirect 106 $8566000 $21282000 Induced 187 $11697000 $31650000 Total 960 $47127000 $126079000
Sonoma
Direct 3933 $158386000 $431259000 Indirect 625 $50506000 $125476000 Induced 1100 $68960000 $186601000 Total 5658 $277852000 $743336000
Total
Direct 96121 $3870828000 $10539626000 Indirect 15268 $1234317000 $3066523000 Induced 26893 $1685335000 $4560387000 Total 138282 $6790480000 $18166536000
Sources Airport Visitor Spending Survey Data Provided by SFO and US Department of Commerce data provided by IMPLAN Calculations by EDR Group
2017 Economic Impact Study of San Francisco International Airport 44
TAX IMPACTS BY BAY AREA COUNTY
Tax revenues including sales property (business and labor) corporate and income taxes are collected from on‐airport tenants and the workers that they employ directly at SFO Table 29 indicates the tax revenues generated from each impact type (direct IndirectInduced and Total) by county Direct tax revenues paid by individuals and households are apportioned according to place of residence of Airport Commission staff contact employees and tenants Direct taxes paid by businesses originate in San Mateo County due to the location of the Airport
Table 29 Tax Revenues by County for On‐airport Tenants
Bay Area Counties
Direct Indirect Induced
Total
Alameda $10303000 $53898000 $64201000
Contra Costa $4882000 $27089000 $31971000
Marin $415000 $6369000 $6784000
Napa $235000 $3405000 $3640000
San Francisco $12426000 $56329000 $68755000
San Mateo $548000000 $73751000 $621751000
Santa Clara $2454000 $42422000 $44876000
Solano $2112000 $10527000 $12639000
Sonoma $374000 $9009000 $9383000
Outside Bay Area $20483000 $52913000 $73396000
Total $601684000 $335712000 $937396000
Notes Direct tax revenues shown in San Mateo County include $33 million in Possessory Interest Tax revenues as estimated for the 2016 Study
Sources Governorrsquos Budget Summary State Controllerrsquos Office the County of San Mateo Bureau of Economic Analysisrsquo (BEA) National Income and Product Accounts (NIPA) the US Census Bureau (Consumer Expenditure Survey Annual Survey of State and Local Government Finances) US Department of Commerce data provided by IMPLAN Airport Tenant Survey and Information Provided by SFO Calculations by EDR Group
Tax revenues including sales property (business and residential) corporate and income taxes are also generated by visitors and businesses that provide goods and services to domestic and international visitors Table 30 below outlines the tax revenues provided by each county by business in the hotel restaurant transportation entertainment and retail industries (direct) the businesses that support these industries (indirect) and the tax revenue generated by employees spending their earned income (induced)
2017 Economic Impact Study of San Francisco International Airport 45
Table 30 Tax Revenues by County for Visitor Spending
Bay Area Counties Direct Indirect Induced
Total
Alameda $49365000 $24431000 $73796000
Contra Costa $34330000 $16990000 $51320000
Marin $19798000 $9798000 $29596000
Napa $28502000 $14106000 $42608000
San Francisco $376840000 $186502000 $563342000
San Mateo $75911000 $37569000 $113480000
Santa Clara $78502000 $38851000 $117353000
Solano $4834000 $2393000 $7227000
Sonoma $28503000 $14106000 $42609000
Total Taxes $696585000 $344746000 $1041331000
Sources Governorrsquos Budget Summary State Controllerrsquos Office Bureau of Economic Analysisrsquo (BEA) National Income and Product Accounts (NIPA) the US Census Bureau (Consumer Expenditure Survey Annual Survey of State and Local Government Finances) US Department of Commerce data provided by IMPLAN and SFO Airport Visitor Survey Calculations by EDR Group
2017 Economic Impact Study of San Francisco International Airport 46
This Page Left Blank Intentionally
2017 Economic Impact Study of San Francisco International Airport 47
APPENDIX I METHODOLOGY FOR THE ANALYSIS
OF OVERALL ECONOMIC IMPACTS
Airport jobs and commerce on the Airport premises create strong economic stimuli for the Bay Area This airport business activity itself generates an increased demand for other local goods and services Not only do the businesses based on the Airport pay local and state taxes but the off‐airport businesses that depend upon airport‐based activity pay taxes as well As shown in this study the direct business activity and subsequent multiplier effects have a strong overall impact on the economy
All economic impacts in this report are described using the measures of jobs payroll and business sales The study quantifies three distinct categories of economic benefits that result from SFO‐related activities direct indirect and induced effects as described below
Direct impacts stem from the activity that is directly related to the provision of aviation services visitor spending or the activity of aviation‐reliant businesses For example the direct impacts of on‐airport tenants include the number of persons they employ on the Airport the wages and benefits paid to those workers and their business sales Similarly the direct impacts of air visitors include the money they spend on services and supplies and the jobs and payroll supported by those expenditures Most of the direct impacts measured in this study occur on‐airport but some such as visitor spending and the benefits produced by aviation dependent businesses occur off‐airport
Indirect and induced impacts which are sometimes called ldquomultiplier impactsrdquo result from (1) a portion of business sales used for ldquobusiness‐to‐businessrdquo purchases of goods and services (indirect effects) and (2) the recirculation of worker incomes and business expenditures in the broader Bay Area economy (induced effects) For example an airport restaurant may buy supplies from a Bay Area produce vendor This purchase represents income (ie new business sales) to the produce supplier which uses a portion of that income to pay its workers and buy additional goods and services from other businesses in the region In addition airport workers spend their wages on other items such as housing retail purchases and services Those expenditures in turn support jobs in those industries whose workers then spend their salaries in the Bay Area These successive rounds of spending and job creation represent the indirect impacts (business‐to‐business) and induced impacts (spending of wages) This study specifically measured the indirect and induced impacts that occur in the county economies of the Bay Area The discussions of total impacts are based on the following analyses and are illustrated in Figure 12
2017 Economic Impact Study of San Francisco International Airport 48
Figure 12 Elements of Economic Impacts and Interrelationships
Source EDR Group
2017 Economic Impact Study of San Francisco International Airport 49
SUPPLIERS OF GOODS AND SERVICES (INDIRECT MULTIPLIER EFFECTS)
Orders from Businesses at the Airport
Activities occurring at the Airport generate additional orders for goods and services from suppliers including orders for
Printing and publishing for the Airport operator and the airlines
Banking insurance legal accounting and technical services for airport businesses
Off‐site bus and parking services for SFO employees
Food products for airport restaurants
Wholesale merchandise to be sold by airport stores
Furniture and equipment for offices hotels restaurants and stores located at the Airport
Orders from Off‐Airport Businesses Serving Air Travelers
Activities serving air travelers outside of the Airport also generate additional orders for goods and services from suppliers for
Fueling and maintenance services for use by off‐airport taxis rental cars tour buses and public transportation
Construction and support operations of convention and hospitality facilities for convention visitors
Food products for off‐airport restaurants
Wholesale merchandise to be sold by off‐airport stores
Furniture and equipment for off‐airport hotels restaurants and stores
RE‐SPENDING OF WORKER INCOME (INDUCED MULTIPLIER EFFECTS)
The workers at SFO at off‐airport businesses serving air visitors and at supplier businesses earn income and most of that income is re‐spent on consumer purchases which support additional jobs within the Bay Area Examples of these purchases include
Retail purchases of food clothing home furnishings cars electronic devices computers and other products
Purchases of services spanning haircuts cleaning car repair and insurance
2017 Economic Impact Study of San Francisco International Airport 50
CALCULATING THE DOMESTIC AND INTERNATIONAL VALUES FROM CARGO
ORIGINATING IN THE BAY AREA AND SHIPPED THROUGH SFO
The combined $17 billion of international and domestic exports through SFO provides a significant direct contribution to the Bay Area economy as well as additional activity through economic linkages To estimate the level of impact EDR Group layered three sets of data ndash the Foreign Trade Database (FTD) of the US Bureau of the Census (tabulated by WISERTrade) the multi‐modal Freight Analysis Framework (FAF) of the US Federal Highway Administration and US Bureau of Economic Analysis (BEA) data included in IMPLAN to
1) Estimate the jobs and wages associated with the domestic and international exports through SFO and
2) Determine the additional activity that percolates throughout the economy as air‐reliant businesses purchase additional goods and services from suppliers (Indirect) and employees spend their additional income (Induced)
FTD data aggregated by WISERTrade was the basis of estimating the weight and value of goods produced in the Bay Area and exported from SFO to international markets FTD provides total exports by commodity and state of origin and the total value of California exports shipped through SFO WISERTrade also provides total value and weight by commodity for all shipments from SFO but not at a commodity level by point of origin Using IMPLAN data the ratios of output by commodity were calculated for the nine‐county Bay Area compared to California totals This calculation estimated the ldquosharerdquo of California produced air exports with an approximate point of origin in the Bay Area The calculation was constrained by both the value and weight reported by WISERTrade of exports by commodity from SFO and the weight of international shipments from SFO taken from the flysfo website
FAF was the basis of estimating domestic cargo shipments FAF provides domestic air shipments of commodities that originate in the twelve county San Jose‐San Francisco‐Oakland CA Combined Statistical Area Using IMPLAN data output by commodity for the nine‐county Bay Area were compared to the twelve county CMSA to estimate the ldquosharerdquo of each commodity shipped from the CSA
BEA data within IMPLAN profiles the structural buyer‐supplier relationships within the economy as well as the industries where labor income is usually spent Figure 13 illustrates the methodology of calculating the domestic and international values from the Bay Area through SFO
2017 Economic Impact Study of San Francisco International Airport 51
Figure 13 Methodology to Estimate Air Dependent Contribution to Bay Area Economy
3 Freight shipments by value
2 Geography
1 Calculations
MAJOR SOURCES OF DATA USED IN THIS STUDY
The discussion of total impacts is based on the following analyses conducted specifically for this study
1 A survey of all airport tenants and the data provided by staff of the San Francisco Airport Commission These data provide profiles of on‐airport jobs by establishment type of business activity and place of residence by zip code for airport and tenant employees
2 Polaris Research conducted surveys of airport travelers were conducted by Polaris Research The survey profiled trip purposes international or domestic origins segmentation of visitors from local residents and connecting passengers and the amount of money in the Bay Area spent by visitors using the Airport
3 Air freight analyses are based on data from SFO WISERTrade using data from US Census Bureau Foreign Trade Division30 and the Freight Analysis Framework (FAF) to develop a detailed profile of air exports from SFO by commodity and origin of movement Detailed data from FAF are not available for the Bay Area alone (statewide for the Foreign Trade Division and a 12 county combined statistical area (CSA) for FAF) Therefore the detailed commodity flows found in the data sets are proportioned based on the output per industry (converted from commodities) of the Bay Area
30 The World Institute for Strategic Economic Research (WISERTrade) formed July 1 2004 to continue the international trade data work of its predecessor MISER was chosen by the US Census Bureau to be one of its first Business and Industry Data Centers with special focus on foreign trade statistics See wwwwisertradeorg
2017 Economic Impact Study of San Francisco International Airport 52
4 Econometric models for the nine‐county Bay Area are based on the IMPLAN Economic Model System IMPLAN is used to estimate wages and sales (or budget expenditures for public entities) for airport tenants where only employment totals were available Labor income and sales andor expenditures per worker are derived primarily from US Department of Commerce (BEA is a part of the Commerce Department) and Department of Labor data sets and are county‐specific IMPLAN is also used to derive multiplier effects including business orders to suppliers generated by on‐airport businesses off‐airport businesses serving airport visitors and airport‐reliant businesses and business sales generated by the spending of the additional workersrsquo income on consumer purchases
2017 Economic Impact Study of San Francisco International Airport 53
APPENDIX II SUMMARY OF IMPLAN SECTORING
To estimate the full range of direct effects and the indirect and induced (ldquomultiplierrdquo) economic effects this study utilized the IMPLAN model system of MIG Inc IMPLAN is now the most widely used input‐output economic modeling system in the US with a client list of 500 public and private agencies including several federal agencies and numerous state agencies It utilizes US Commerce Department (National Income and Product Accounts) data on inter‐industry technology relationships (also known as input‐output structural matrices) countywide employment and income data from the Bureau of Economic Analysis (BEA) and Bureau of Labor Statistics (BLS) and its own industry and county‐specific estimates of local purchasing rates (ldquoregional purchase coefficientsrdquo) It is enhanced over most other input‐output models in that it also includes coverage of public sector activity and consumer activity (reflected in its ldquosocial accounting matrixrdquo) The industry detail is at the level of 536 industries and is based on categories of the US Bureau of Economic Analysis (BEA) which correspond to two to five digit groups in the North American Industry Classification System (NAICS)
For this study the direct job payroll and business revenue effects for on‐airport and visitor spending were documented through surveys completed for this project and then assigned to specific sector groups based on EDR Grouprsquos experience in aviation SFOrsquos support of air reliant industries was documented through databases maintained by the US Census Bureau and the US Department of Transportation The IMPLAN model was then calibrated for the nine‐county Bay Area as well as for each county within the region and a model calibrated for a defined region outside the Bay Area to measure additional visitor spending The result was an estimate of the indirect and induced (and overall) job business revenue and income impacts for each segment of airport beneficiary The analysis of retail impacts was adjusted to account for retail markup margins and the concentration of sales in airports and in visitor industries Retail portions of multiplier effects also incorporate these margins
Regardless of whether economic impacts are measured in terms of jobs income or business sales these impacts can be classified into three categories
Direct economic effects are the changes occurring at the project site as a direct consequence of the public investment project or program This is represented as the net increase in business activity associated with business at the SFO initial visitor spending at off‐airport businesses in each countyrsquos hospitality sector and the sale revenues earned by shippers who route air cargo through SFO
Indirect economic effects are the broader effects on business activity for off‐site goods and services supplied to the directly affected businesses
Induced economic effects are further shifts in spending on food clothing shelter and other consumer goods and services because of the change in workers and payroll of directly and indirectly affected businesses
EDR Group assembled classifications of the 536 sectors in the IMPLAN modeling package to best mirror types of industries on SFO types of visitor spending and industries related to commodities exported from SFO The classification schemes used for this study for on‐airport and visitor spending impacts are shown in Table 31 and Table 32
2017 Economic Impact Study of San Francisco International Airport 54
Table 31 Industry Classification of On‐Airport Industries
Airport Tenants Classification IMPLAN Sectors Used Passenger Airlines Air Transportation Freight Airlines Couriers Air Transportation Couriers Fixed Based Operator (FBO) Support activities for transportation Local Government
State and Local Government State Government
Federal Government Immigration TSA FBI US Customs and Border Patrol (CBP) National Weather Service
Distribution TruckingWarehousing Wholesale Wholesale Trade business Security Security Aviation Firms
Construction
Highways and Streets Commercial Structures Non‐residential structures Maintenance and Repair
Retail
ElectronicsAppliance Stores Food and Beverage Health and Labor Care Clothing Stores Sporting Goods Stores Misc Retail
Food and Beverage (includes Catering Firms) Full‐service restaurants Limited‐service restaurants All other food and drinking places
Car Rental Car Rental Ground Transportation (incl taxis limos buses vans and transit)
Transit and ground passenger transp
Other Medical Clinic Vending Machines
Services
Educational institutions Electronic repair services Insurance Medical services Other Support Services Telecommunications Waste Management
Reliant Services
ArchitecturalEngineering Business support Computer systems design services Facilities support Financial Services Management scientific and Technical Parking and Misc
2017 Economic Impact Study of San Francisco International Airport 55
Table 32 Industry Classification of Visitor‐Serving Industries
Visitor Spending Classification
IMPLAN Sectors Used
ElectronicsAppliance Stores
Food and Beverage
Health and Labor
Retail Clothing Stores
Sporting Goods
General Merchandise
Misc Retail
Performing Arts
Spectator Sports
Artists writers and performers
Museums zoos and parks
Entertainment Amusement parks and arcades
Gambling industries
Fitness and recreational sports centers
Bowling centers
Other amusement recreation
Full‐service restaurants
Restaurant Limited‐service restaurants
All other food and drinking places
Hotels and motels Hotel
Other accommodations
Transit and ground passenger transportation
Scenic and sightseeing Transportation
Support activities
Gas stations
Sources US Department of Commerce data provided by IMPLAN Calculations by EDR Group
2017 Economic Impact Study of San Francisco International Airport 56
This Page Left Blank Intentionally
2017 Economic Impact Study of San Francisco International Airport 57
APPENDIX III SFO TENANT AND VISITOR SURVEYS
The following pages are the survey instruments used for SFO tenants and visiting passengers Note that the passenger survey was administered in multiple languages
2017 Economic Impact Study of San Francisco International Airport 58
2017 Economic Impact Study of San Francisco International Airport 59
2017 Economic Impact Study of San Francisco International Airport 60
2017 Economic Impact Study of San Francisco International Airport 61
2017 Economic Impact Study of San Francisco International Airport 62
2017 Economic Impact Study of San Francisco International Airport 63
2017 Economic Impact Study of San Francisco International Airport 64
2017 Economic Impact Study of San Francisco International Airport 65
2017 Economic Impact Study of San Francisco International Airport 66

This Page Left Blank Intentionally
TABLE OF CONTENTS Page
Executive Summary 1 Total Economic Contribution 1 Classification of Impacts 2 Approach 3
Introduction amp Overview 5Chapter 1Overview 6 Airside and Groundside Airport Jobs 9 Off‐Airport Jobs Serving Airport Travelers 9 Related Industries Jobs that Rely on Air Cargo 10
National Context 13Chapter 2Context The Vibrant Bay Area Economy 13 SFOrsquos Role in International Trade 15 Export Commodities 16 Import Commodities 17 Total Trade 20
Chapter 3 On‐Airport Impacts 23 Direct Employment 23 Business Sales and Payroll 24 Indirect and Induced Impacts 25 On‐airport Construction 27
Chapter 4 Visitor Spending 29 Visitor Spending 30 Jobs and Income Generated by Off‐Airport Visitor Spending 31 Indirect and Induced Impacts 32
Chapter 5 Impacts of Air Reliant Users (Freight Shippers) 35 The Role of SFO in Air Exports 35 International Exports 35 Domestic Exports 36 Economic Contribution of SFO to the Bay Area 37 Effects on Suppliers of Goods and Services 38
Chapter 6 Tax Impacts Generated by Activities at SFO 40 State and Local Tax Impacts 40 Federal Aviation Taxes 40
Chapter 7 Distribution of Impacts by Bay Area Counties 42 On‐Airport Effect among Bay Area Counties 42
Visitor Spending 44 Tax Impacts by Bay Area County 45
Appendix I Methodology for the Analysis of Overall Economic Impacts 48 Suppliers of Goods and Services (Indirect Multiplier Effects) 50 Re‐Spending of Worker Income (Induced Multiplier Effects) 50 Calculating the Domestic and International Values from Cargo Originating in the Bay Area and Shipped Through SFO 51 Major Sources of Data Used in this Study 52
Appendix II Summary of IMPLAN Sectoring 54
Appendix III SFO Tenant and Visitor Surveys 58
LIST OF TABLES Page
Table 1 Summary of Economic Impacts of SFO in the Bay Area 2
Table 2 Economic Contribution of SFO to the Bay Area 8
Table 3 Visitors to the San Francisco Region arriving through SFO (year ending June 2016) 10
Table 4 Airport Ranking for Top Three Exported Commodities by Percent of Total 11
Table 5 Air Value of US and Bay Area Export by Airport 2009‐2016 16
Table 6 Top Ten SFO Export Commodities by Air Value and Weight 2016 17
Table 7 Top Ten SFO Import Commodities by Air Value and Weight 2016 19
Table 8 Countries that Traded Commodities with Total Value More than $1 Billion in 2016 through SFO In Order of Value of Trade 21
Table 9 Direct Impacts of On‐Airport Tenants and Administrative Employees 24
25 Table 10 Direct Employment Labor Income and Business Revenues for Tenant and Administrative SFO
Table 11 Summary of Direct Indirect and Induced Economic Impacts of SFO in Bay Area 26
Table 12 Supplier of GoodsServices Industries (Indirect) 26
Table 13 Re‐Spending of Worker Income Industries (Induced) 27
Table 14 Sector Mapping 27
Table 15 Annual Average Impacts from SFO Construction on the Bay Area Economy 28
Table 16 Off‐Airport SFO Visitor Spending Inside and Outside of the Bay Area 30
Table 17 Breakdown of Total Visitor Spending Impacts 31
Table 18 Earnings and Sales per Worker 32
Table 19 Summary of Direct Indirect and Induced Economic Impacts of the Contribution of Visitor Spending in the Bay Area 33
Table 20 Top International Exported Industries 36
Table 21 Top Domestic Shipped Industries 36
Table 22 Economic Value of Domestic and International Exports Originating in the Bay Area via SFO38
Table 23 Impacts on Suppliers of Goods and Services (Indirect) by BEA Industry 39
Table 24 Estimated 2016 State and Local Tax Impacts (in $ millions) 40
Table 25 Estimated 2016 Federal Aviation Tax Revenues 41
Table 26 Employment and Labor Income Impacts of On‐airport Tenants by County 42
Table 27 Business Revenues Impacts of On‐airport Tenants by Bay Area County 43
Table 28 Economic Impacts of Visitor Spending by Bay Area County 44
Table 29 Tax Revenues by County for On‐airport Tenants 45
Table 30 Tax Revenues by County for Visitor Spending 46
Table 31 Industry Classification of On‐Airport Industries 55
Table 32 Industry Classification of Visitor‐Serving Industries 56
LIST OF FIGURES Page
Figure 1 International Exports Shipped from SFO and California by Industry Sector 11
Figure 2 Domestic Outbound Air Shipments from SFO
Figure 10 Percentage of the Bay Arearsquos Combined Domestic and International Exports Shipped via
12
Figure 3 Illustration of the Bay Area by County 14
Figure 4 Top Five Airports by Air Value of Exports to Asia 2009‐2016 20
Figure 5 Top Five Airports by Air Value per Ton of Exports to Asia 2009‐2016 20
Figure 6 Distribution of On‐Airport Tenants and Administrative Jobs 23
Figure 7 Percent of Relative Employment Labor Income and Revenues by Aggregated Sector on SFO24
Figure 8 Profile of Air Visitors Arriving via SFO by Place of Origin 29
Figure 9 Relative Spending of Visitors per Trip by Origin and Purpose 30
SFO 37
Figure 11 Employment Impacts on Suppliers of Goods and Services (Indirect) 38
Figure 12 Elements of Economic Impacts and Interrelationships 49
Figure 13 Methodology to Estimate Air Dependent Contribution to Bay Area Economy 52
EXECUTIVE SUMMARY
This study is an update to the 2016 Economic Impact Study of San Francisco International Airport (SFO or ldquothe Airportrdquo) and examines the Fiscal Year1 (FY) 20152016 impacts of the airport in the nine‐county Bay Area of Alameda Contra Costa Marin Napa San Mateo San Francisco Santa Clara Solano and Sonoma
SFO is the seventh leading passenger airport in the United States and the 16th largest air cargo airport2
In the FY 201516 nearly 440000 aircraft operations were conducted at the Airport serving over 514 million incoming and outgoing passengers and moving 383300 metric tons of cargo and 68200 metric tons of mail3
TOTAL ECONOMIC CONTRIBUTION
The total economic contribution of SFO to metropolitan San Francisco is the sum of the business activity directly associated with operation of SFO and the spending of its users as well as the additional business activity associated with orders to suppliers and re‐spending of worker income These various elements of economic impact are each defined and shown in Table 1
In 2016 SFO directly accounted for $84 billion in on‐airport business activity supporting nearly 43000 jobs at the Airport4 Off‐site business activities that depend directly on local air service for staff movements cargo deliveries or customer visits (visitor spending) together raise the direct airport economic contribution to the Bay Area to $357 billion in business sales with over 165000 jobs There are also spin‐off activities in the region (indirect and induced multiplier effects) associated with suppliers of goods and services to the directly affected businesses and the re‐spending of additional worker income on consumer goods and services Adding in these effects raises the total economic footprint of SFO in the Bay Area to over $625 billion in business sales including $209 billion in total payroll and over 300000 jobs in the region All dollar values are expressed in 2016 dollars
1 The Fiscal Year is defined as the period July 1st to June 30 of the following year 2 Based on data from Airports Council International (ACI) cited in the SFO Annual Report (2016) and the ACI 2015 North
American Airport Traffic Summary (Cargo) 3 Source wwwflysfocom 4 This total includes the Virgin America airline headquarters located in Burlingame CA and affiliated with SFO based on the
2015 survey
2017 Economic Impact Study of San Francisco International Airport 1
Table 1 Summary of Economic Impacts of SFO in the Bay Area
Impact Type
On‐airport
Employment
42828
Labor Income
$2670714000
Output
$8409265000
Visitor spending 96121 $3870828000 $10539626000
Aviation dependent exports 26078 $4023963000 $16721996000
Direct Total 165026 $10565505000 $35670887000
Suppliers of goods and services 50689 $4798113000 $12204072000
Re‐spending of income 84606 $5570121000 $14668593000
Total Impact 300322 $20933739000 $62543552000
Notes Includes impacts of temporary construction investment dollars rounded to the nearest thousand Columns may not add due to rounding
The economic activities generated by SFO also return significant tax revenues to the State of California the nine Bay Area counties and to the nation in terms of federal aviation taxes
The state and local tax revenues linked to operations at SFO totaled nearly $29 billion in FY 201516 including almost $16 billion from direct activities and close to $13 billion from purchases of supplier goods and services (tax impacts from indirect effects) and subsequent spending of worker income in the Bay Area (tax impacts from induced effects) Approximately $20 billion ($13 billion from direct activities) stem from on‐airport commerce and visitor spending while $872 million are attributable to air‐reliant shippers that use SFO for air freight ($280 million from direct economic activity)
In addition aviation operations at SFO generated $12 billion dollars in federal taxes including $419 million from taxes on international and domestic passengers and $791 million in US Customs revenue from international air freight shipments These tax revenues are remitted to the US Department of the Treasury and do not directly benefit the Bay Area or the State of California
CLASSIFICATION OF IMPACTS
The operation of SFO providing terminal and related services for air travelers and cargo movement is only a portion of the Airportrsquos contribution to the Bay Area economy Visitors from international and domestic locations use SFO to visit the Bay Area for leisure or business and their spending supports additional business activity within the region In addition companies in the region that produce manufactured and agricultural goods that are exported by air from SFO would be at a disadvantage without proximity to a major international airport Altogether these on‐ and off‐site business activities fall into five categories
Airport‐based economic activities (airport terminal‐related and tenants)
Off‐airport businesses serving airport travelers
Off‐airport businesses dependent on the Airport for cargo movement
Suppliers of goods and services to the Airport and air‐dependent business
Re‐spending of worker income (supported by airport‐based activities visitor spending air‐dependent businesses and suppliers of goods and services)
2017 Economic Impact Study of San Francisco International Airport 2
APPROACH
Findings in this study were developed by
1 Dividing airport employment into three categories 1) Updates from SFO for employment and labor income for airport employees and contractors 2) Updates from SFO for terminal concession revenues and these revenues were the basis for estimating direct employment and labor income for the concessions establishments and 3) data obtained from the 2015 tenant survey were used for the remaining on‐airport employment and labor income
2 Using the visitor intercept survey and methodology developed in 2015 with an updated number of enplanements
3 Adapting the Impact Analysis for Planning (IMPLAN) Modeling Package to the nine‐county Bay Area region IMPLAN was used to (a) develop a county‐specific economic profile of the Bay Area using data primarily from the US Department of Commerce (Bureau of Economic Analysis) and US Department of Labor to estimate jobs wages and labor income (direct effect) and (b) develop a model of the Bay Area to represent inter‐metropolitan flows of business sales This includes business orders to suppliers generated by on‐airport businesses off‐airport businesses serving airport visitors and airport‐reliant businesses (indirect effects) It also includes business sales generated by the spending of additional workersrsquo income on consumer purchases (induced effects) The 2015 IMPLAN package was substituted for the 2014 package used in the previous study
4 Utilizing data from SFO in conjunction with international data from the Foreign Trade Division of the US Census Bureau (packaged by WISERTrade) and domestic freight data from the Freight Analysis Framework (FAF) of the US Department of Transportation to develop an analysis of the role of air cargo shipments in the economies of the Bay Area
5 National and California state sources are used to identify aviation specific tax impacts and major state and local tax impacts State sources include the Governorrsquos Office the California State Controllerrsquos Office and the County of San Mateo Federal sources include the Federal Aviation Administration Bureau of Economic Analysis (BEA) and the US Census Bureau These sources are used independently and in conjunction with the IMPLAN tax module to estimate tax impacts generated by SFO aviation activity for federal revenues and state and local taxes by where the taxes are generated
2017 Economic Impact Study of San Francisco International Airport 3
This Page Left Blank Intentionally
2017 Economic Impact Study of San Francisco International Airport 4
CHAPTER 1 INTRODUCTION amp OVERVIEW
This 2017 Economic Impact Study Update Report (2017 Update) is a partial update of the 2016 Economic Impact Study of San Francisco International Airport (2016 Study) Although published in June 2017 data in this study was collected in 2016 As in the 2016 Study this update reflects the economic contribution of SFO in the nine Bay Area counties of Alameda Contra Costa Marin Napa San Mateo San Francisco Santa Clara Solano and Sonoma
Data updated to 2016 values include administrative employment information (jobs labor income and zip code of residence) contractors concession revenues enplanements and cargo shipments Data not updated and held constant with the 2016 Study are the portions of the previous study that were based on surveys including visitor spending per trip and tenant employment other than terminal concessions The latter primarily represents airlines and other airside components of SFO as well as federal employment on airport
Additionally the ldquoeconomic matrixrdquo behind the 2016 Study was updated The ldquoeconomic matrixrdquo reflects how industries buy and sell from each other and how households spend their income ndash these are the drivers of indirect and induced (or ldquomultiplierrdquo) impacts respectively The 2016 Study incorporated the IMPLAN LLC input‐output model from 2014 which was the most recent model year available when the study was underway (adjusted to reflect 2012 dollars) This update is based on the IMPLAN model of 2015 (adjusted to reflect 2016 dollars) A further adjustment was made in that induced effects (the impacts of spending of wages earned from direct and indirect activities) were adjusted to account for changes in the Bay Area from calendar 2015 through 2016 This ensures the update more accurately reflects the regional economy as it rebounds from the recent recession5
The new input‐output model reflects changes in how Bay Area industries rely on local suppliers for goods and services (which lead to indirect multiplier effects) and the extent of household spending remains in the Bay Area (which lead to induced multiplier effects) Several trends are particularly important as noted below
Less materials and supply purchases are now made locally Within optimized supply chains and globalization on the rise more material and supplier purchases are made outside regional boundaries These dollars that in previous years stimulated regional economic growth are now flowing outside the Bay Area economy
In the Computer and Other Electronics manufacturing industry 22 less purchases of materials and supplier were made within the Bay Area region
Productivity continues to rise for most industries (1‐7) with a large increase for aviation and airline services (10) Notable declines in productivity include Ground Transportation (‐22) likely driven by increased competition from Transportation Network Companies (TNC) and Freight Aviation (‐3) likely due to changes in supply chain or delivery models
On‐line and non‐store sales continue to expand with a 17 growth in business sales and 4 growth in employment since the last study
5 This update is based on the Quarterly Census of Employment and Wages (QCEW) published by the US Bureau of Labor Statistics for 2012‐2013 for the nine‐county region
2017 Economic Impact Study of San Francisco International Airport 5
SFO is a major economic engine for the Bay Area economy Despite drop‐offs in multiplier impacts total business revenues associated with the airport has increased from $617 billion to $625 billion Despite increased productivity per worker in the region for most industries employment has increased from 295000 to over 300000 However it must be emphasized that these findings represent a partial update of the 2016 Study and do not account for any changes in the levels of airside employment or in spending per visitor (although the numbers of visitors are adjusted)
An increase in on‐airport employment has been driven by both lower job‐to‐sales ratios and increased sales Since the last study sales to job ratios for retail sales declined from $129000 per job to $127000 per job and from $92000 per job to $73000 per job for Ground Transportation These declines resulted in a higher number of jobs for the same amount of revenues In addition there was a strong increase in revenues associated with Transportation Network Companies (TNC) since the last study which also contributed to higher job impacts (see Chapter 3 ldquoOn‐Airport Impactsrdquo)
Other notable differences compared to the 2016 Study include increases in on‐airport employment driven by lower sales to job ratios Since the last study sales to job ratios for retail sales dropped from $129000 per job to $127000 per job The business sales to job ratio for Ground Transportation declined precipitously from $92000 per job in the previous study to $73000 per job in this study This decline in productivity consequently results in a higher number of jobs further supported by the growth in business sales associated with Transportation Network Companies (TNC) (see Chapter 3 ldquoOn‐Airport Impactsrdquo)
OVERVIEW
This report provides study findings of the economic impacts of San Francisco International Airport (SFO) This chapter introduces the study provides an overview of the methodology used and summarizes the airportrsquos overall economic contribution to the nine‐county Bay Area
Chapter 2 reviews the economic context of SFO and the Bay Area Chapters 3 through 7 describe the findings of the economic impacts generated by SFO Chapter 3 reports in detail the impacts derived from airport‐based activities as well as the impacts of the airportrsquos construction Chapter 4 describes the impacts of Bay Area visitors who arrive through SFO and spend money in the region Chapter 5 reviews the economic contribution of shippers who transport their goods to international and domestic markets via SFO These shippers are air‐reliant meaning that their businesses rely on air‐freight Chapter 6 presents tax impacts of on‐airport activities and visitor spending including key federal aviation taxes and municipal county and state revenues Chapter 7 outlines the distribution of on‐airport and visitor spending impacts for each county in the Bay Area region
The operation of SFO providing terminal and related services for air travelers and cargo movement is only one part of the Airportrsquos total regional economic impact Airport‐dependent businesses and airline travelers visiting the area for business or leisure support additional business activity within the Bay Area Together these on‐ and off‐site business activities fall into five categories
Airport‐based economic activities (airport terminal‐related and tenants)
Off‐airport businesses serving airport travelers
Off‐airport businesses dependent on SFO for cargo movement
2017 Economic Impact Study of San Francisco International Airport 6
Suppliers of goods and services to SFO and air‐dependent business and to off‐airport businesses that serve visitors This activity is off‐airport in the Bay Area
Re‐spending of worker income (supported by airport‐based activities visitor spending air‐dependent businesses and suppliers of goods and services) Almost all re‐spending is off‐airport in the Bay Area
The total economic contribution of SFO is the sum of the business activity directly associated with operation of the Airport and the spending of its users as well as the additional business activity associated with orders to suppliers and re‐spending of worker income The sum of on‐airport activities at SFO visitor spending by air visitors to the Bay Area and regional exports supported by air cargo exceeds $356 billion in direct business sales which in turn support nearly 165000 direct jobs that generates a $105 billion payroll Table 2 summarizes the economic contribution of SFO to the Bay Area economy by impact category
2017 Economic Impact Study of San Francisco International Airport 7
Table 2 Economic Contribution of SFO to the Bay Area
Impacts Airport
Generated Visitor
Spending Air‐
Related Total Impact
Jobs Direct 42828 96121 26078 165026 Indirect 14974 15268 20448 50689 Induced 20008 26893 37706 84606 Total Jobs 77809 138282 84232 300322
Business Revenue ($ millions) Direct $8409 $10540 $16722 $35671 Indirect $3070 $3067 $6068 $12204 Induced $3921 $4560 $6187 $14669 Total Business Revenue $15400 $18167 $28977 $62544
Labor Income ($ millions) Direct $2671 $3871 $4024 $10566 Indirect $1302 $1234 $2262 $4798 Induced $1476 $1685 $2409 $5570 Total Labor Income $5449 $6790 $8695 $20934
Avg IncomeEmployee ($yr) Direct $62400 $40300 $154300 $64000 Indirect $86900 $80800 $110600 $94700 Induced $73800 $62700 $63900 $65800 Weighted Avg IncomeEmployee
$70000 $49100 $103200 $69700
Notes On‐airport impacts include on‐airport construction activities in 2016 Totals may not add due to rounding
Sources SFO Survey of SFO Tenants Survey of SFO Passengers US Department of Commerce data provided by MIG Inc (IMPLAN) and WISERTrade using data from the US Census Bureau Foreign Trade Division Calculations by EDR Group
In addition to direct impacts on the economy indirect multiplier effects are associated with suppliers of goods and services to directly affected businesses and induced multiplier impacts are generated by re‐spending of additional worker income on consumer goods and services Counting direct indirect and induced impacts SFOrsquos contribution to the Bay Area economy is over 300000 jobs and $625 billion in business revenues of which $209 billion is labor income (payroll) Appendix I summarizes the economic impact methodology
2017 Economic Impact Study of San Francisco International Airport 8
AIRSIDE AND GROUNDSIDE AIRPORT JOBS
Based on a 2015 airport‐wide survey and SFO data from FY 20152016 an estimated 42828 people work at SFO6 This total includes 14962 employees of passenger airlines that serve the Airport7 The breadth of jobs at SFO involves
Airlines both passenger and cargo activities
Air terminal operation including security building maintenance and facility management (construction also included)
Public agencies such as the FAA US Departments of Immigration and Naturalization Customs Agriculture Fish and Wildlife and Drug Enforcement Agency as well as Airport Administration (including police and fire departments)
Airline support services including catering in‐flight entertainment aircraft handling fueling and maintenance
Freight services including courier delivery customs broker and trucking
Concessions including restaurants retail stores and passenger services
Ground transportation services including rental car taxi and limousine service and bus companies
OFF‐AIRPORT JOBS SERVING AIRPORT TRAVELERS
For the fiscal year ending in June 30 2016 SFO served over 514 million passengers which included 256 million enplanements Enplanements include persons transferring from one flight to another en route to their final destinations residents of the Bay Area who are traveling and non‐residents returning home after visiting the San Francisco region
The visitor spending analysis in this report measures the extent that SFO facilitates money brought from outside the Bay Area and spent in the Bay Area to support jobs in the hospitality sectors of the regional economy Transferring passengers and local residents two classes of SFO passengers are excluded from this analysis While transferring passengers may make purchases at the Airport between flights this spending is accounted in the revenues of terminal tenants Thus including their purchases as ldquovisitor spendingrdquo would be a double count In addition off‐airport spending by residents traveling through SFO also does not count as a regional economic impact since residents spend most of their money in the Bay Area anyway Moreover as with transferring passengers money spent in the terminal is included in the analysis of on‐airport employment
Overall over 26 million international passengers 63 million non‐Californian and 12 million Southern California visitors came to the Bay Area via SFO (see Table 3) These visitors spent more than $105 billion in the bay area region on hotels food and beverage retail purchases entertainment and local travel (taxis car rental and public transportation)
6 Includes jobs associated with capital construction 7 Total on‐airport employment includes the Virgin America airline headquarters located in Burlingame CA affiliated with SFO
2017 Economic Impact Study of San Francisco International Airport 9
Table 3 Visitors to the San Francisco Region arriving through SFO (year ending June 2016)
Market Passengers
Domestic Origin and Destination at SFO 29504670 Enplaned Passenger at SFO 14752335 Percent of Enplaned Passengers who are Visitors 5135 Number of Visitors 7575496 Domestic Visitors by Origin Percent Originating in California 1633 Domestic Visitors Originating in California 1237222 Domestic Visitors Originating in Rest of US 6338274 International Visitors Arriving via US Flag Airlines Origin and Destination at SFO 2630232 Enplaned Passenger at SFO 1315116 Percent of Enplaned Passengers who are Visitors 4270 Number of Visitors 561598 International Visitors Arriving via Non‐US Flag Airlines Origin and Destination at SFO 6509654 Enplaned Passenger at SFO 3254827 Percent of Enplaned Passengers who are Visitors 6209 Number of Visitors 2020781 Total International Visitors (US Flag and Non‐US Flag) 2582379 Total Visitors 10157875
Note This table does not include travelers using SFO to connect from one flight to another
Sources SFO Traffic Statistics US DOT OampD Survey 2015 US DOT T‐100 Database IATA PaxIS Database US DOC International Air Travel Statistics 2015 US DOC National Travel and Tourism Office (NTTO)
RELATED INDUSTRIES JOBS THAT RELY ON AIR CARGO
In the calendar year 2016 commodities valued at roughly $268 billion were shipped to international and domestic destinations from SFO Of this total value about $168 billion originated in the Bay Area
Products originating in California and shipped internationally from SFO primary consist of technology goods Three commodity groups account for an estimated 83 of total value exported internationally which include electrical machinery industrial machinery (including computers) and optics and instruments with the remaining value spread cross aircraft manufacturing pharmaceutical products chemicals plastics and other commodities Figure 1 presents the value of California exports through SFO and all of California air exports This figure highlights that between 38 and 58 of Californiarsquos three leading exported commodities are shipped through SFO
2017 Economic Impact Study of San Francisco International Airport 10
Figure 1 International Exports Shipped from SFO and California by Industry Sector
Sources WISERTrade using data from the US Census Bureau Foreign Trade Division and the Freight Analysis Framework Calculations by EDR Group
Table 4 below presents how SFO ranks among the top five airports for these same three commodities groups previously mentioned SFO ranges between 8‐13 of national exports and ranks between second and sixth nationally for electric machinery industrial machinery (including computers) and opticalsurgical instrument exports
Table 4 Airport Ranking for Top Three Exported Commodities by Percent of Total
Electric Machinery Sound and TV Equip
Industrial Machinery (Incl Computers)
Optic Photo and Medic Surgical Instruments
Airport Total Airport Total Airport Total LAX 126 JFK 133 ORD 137 MSY 120 SFO 125 LAX 106 SFO 104 LAX 99 JFK 98 DFW 98 MIA 95 MSY 97 CLE 92 ORD 93 CLE 89 MIA 85 DFW 89 SFO 79 Total ($ millions) $89560 Total ($ millions) $65003 Total ($ millions) $59933
Source WISERTrade
In 2016 domestic outbound shipments from SFO totaled $83 billion and consisted primarily of electronics precision instruments pharmaceuticals motorized vehicles and machinery as shown in Figure 2
2017 Economic Impact Study of San Francisco International Airport 11
Figure 2 Domestic Outbound Air Shipments from SFO
Source FHWA Freight Analysis Framework (FAF)
2017 Economic Impact Study of San Francisco International Airport 12
CHAPTER 2 NATIONAL CONTEXT
The air transportation industry is a significant contributor to the US economy both in terms of output and employment In 2016 for instance the sector generated $1054 billion in gross domestic product (GDP) and was responsible for employing 437000 full‐time equivalent (FTE) workers in 20158 The role of air transportation extends well beyond industry operations alone however air travel indirectly stimulates both the global and national economy by facilitating trade and transporting passengers
San Francisco International Airport (SFO) is the largest airport in the Bay Area the seventh largest in the United States and the 21st largest in the world in terms of air‐passenger traffic9 When combined with Oakland International Airport and Mineta San Jose International Airport the three together constitute the sixth largest domestic passenger market in the US (as measured by enplanements)10 In FY 2016 SFO served 397 million total domestic passengers (enplaned and deplaned) capturing 65 of domestic Bay Area market share Meanwhile SFO had an international Bay Area market share of 93 with over 117 million international passengers served (enplaned and deplaned)11
This section outlines the role that SFO plays in facilitating domestic and international trade The role of SFO contributing to the regional economy as a domestic and international gateway for air cargo shipments from the Bay Area nine‐county region is presented in Chapter Six
CONTEXT THE VIBRANT BAY AREA ECONOMY
The 6900‐square mile nine‐county Bay Area (see Figure 3) is home to 77 million residents which accounts for 20 of Californiarsquos population12 The Bay Arearsquos population density of over 1100 people per square mile of land is more than four‐times the California average By itself the region would be the nationrsquos 13th most populous state falling between Washington at 73 million and Virginia at 84 million residents13 Moreover the per‐capita income of Bay Area residents is 42 above the California average and 58 above the national average14
8 US Department of Commerce Bureau of Economic Analysis Industry Economic Accounts Interactive Tables available at httpwwwbeagovindustryindexhtm as of May 2017 (National Data GDP amp Personal Income NIPA Table 65D FTE by Industry) GDP data is for 2016 while employment data is for 2015
9 2016 SFO Annual Report (2015 data) San Francisco CA San Francisco International Airport httpmediaflysfocoms3amazonawscommedia2016_Annual_Report_Finalpdf Airports Council International
10 Federal Aviation Administration Passenger Boarding (Enplanement) and All‐Cargo Data for US Airports 2015 11 2016 SFO Annual report SFOrsquos total Bay Area market share including both domestic and international passengers was 70
(or 514 million passengers) in FY2016 12 US Census 2016 13 Ibid 14 Based on data from the Bureau of Economic Analysis (BEA) in 2015
2017 Economic Impact Study of San Francisco International Airport 13
Figure 3 Illustration of the Bay Area by County
Source Data ndash RITA NTAD (National Transit Atlas Database) Graphic ndash EDR Group
Some of the largest and fastest growing companies in the country that make the region home fuel the economy of the Bay Area Twenty‐eight of the global Fortune 500 and 29 of the US Fortune 500 are headquartered locally Both of these groups represent more than $10 trillion in sales Since 2011 no Fortune 500 companies have relocated from the Bay Area and a new entrant data management and cloud services provider NetApp has joined the list Beyond just large companies the Bay Area is home to 25 of the Inc Fastest Growing 500 list collectively accounting for over $1 billion in sales The Bay Area is also home to three of the top ten global companies ranked by market capitalization including the two most valuable companies in the world Apple and Google If the Bay Area were a country it would be the 19th largest economy in the world with a gross regional product that falls between the gross domestic products of Turkey (18 among nations) and Switzerland (20)15
This generally high‐income level is supported by competitive economic strengths in the national and global economies The Bay Area is a national center for business innovation and technology while the city of San Francisco is one of the United Statesrsquo leading domestic and international tourist destinations Silicon Valley located in Santa Clara County is renowned as the countryrsquos technology (hardware and software) capital Other leading industries include financial activities pharmaceutical and medicine
15 Source Bay Area Council Economic Institute of the Bay Area Council Bay Area Fast Facts (wwwbayareaeconomyorg)
2017 Economic Impact Study of San Francisco International Airport 14
manufacturing professional scientific and technical services information services and higher education as well as hospitality related industries
These core strengths of the Bay Area economy have specialized air service needs that are served by San Francisco International Airport16 The high‐tech and pharmaceutical manufacturing knowledge based service sectors hospitality and agricultural industries rely on air services much more than other sectors for both passenger and cargo travel needs for the following reasons
Products produced tend to be high‐value delicate and time‐sensitive and need to be shipped by air Typically these are technology‐related products where value reflects high labor costs and precision manufacturing but may also be perishable agricultural products (including fish and meat)
Products that are heavy to ship but that carry a large return on transportation costs invested including just‐in‐time manufacturing and equipment needed to maintain high yielding production
Business and professional services depend on the sale of professional expertise which often requires travel to meet with clients and make presentations
Companies have statewide western national and even global business networks requiring frequent and often international travel between various offices
Airports serve resorts and tourist destinations
Producers of high‐tech products business services and computer‐oriented firms are among the industries that spend the most money on air services Most of these industries spend at least 40 more on air services than the average industry in the United States and a few spend 50 or more than the average of all industries in the United States17
SFOrsquoS ROLE IN INTERNATIONAL TRADE
Given its proximity to Asia markets SFO has historically played an important role in international trade Over the past decade the Airport experienced a trend in export activity like airports across the country (Table 5) From 2009 to 2016 the total air value of exports18 passing through SFO grew at an average annual rate of 35 from $21 billion to $268 billion The value of exports at all US airports (including SFO) rose from $3344 billion to $4370 billion or 39 annually during the same period
Despite being one of three commercial service airports within the region SFO now accounts for a majority of all export value that flies out of the Bay Area (Table 5) In 2016 Oakland International Airport exported $321 million worth of commodities with an annual average growth rate of 103 from 2009 to 2016 San Jose International Airport exported an air value of $390 million in 2014 and experienced an annual average growth rate of 56 from 2009 to 2014 The value of international air exports from San Jose International
16 The following is based on research conducted for Aviation Cooperative Research Program 03‐28 The Role of US Airports in the National Economy for the Transportation Research Board of the National Academies published as ACRP Report 132
17 Ibid 18 These are the value of the goods at the US port of export The value shall be the selling price (or the cost if the goods are
not sold) including inland or domestic freight insurance and other charges to the US seaport airport or land border port of export
2017 Economic Impact Study of San Francisco International Airport 15
rose from $106 billion in 2015 to $22 billion in 2016 an increase of 103 This rise in exports is driven primarily by aircraft and spacecraft exports which grew from $783 million in 2015 to $17 billion in 2016 However as of March 2017 only $85 million has been shipped indicating uncertainty whether additional exports will materialize throughout the year
Table 5 Air Value of US and Bay Area Export by Airport 2009‐2016
Airport 2009 2010 2011 2012 2013 2014 2015 2016
SFO $210 $274 $265 $261 $281 $274 $253 $268
SJC $03 $03 $03 $04 $05 $04 $11 $22 OAK $02 $02 $02 $02 $03 $04 $03 $03 Total from Bay Area International Airports
$215 $280 $270 $268 $289 $282 $266 $293
Source US Census Bureau Foreign Trade Division provided by WISERTrade
EXPORT COMMODITIES
While SFO serves as the gateway for a host of commodities the Airportrsquos top exports reflect the strengths of the Bay Area regional economy (Table 6) In 2016 electric machinery sound equipment and TV equipment exports alone were valued at $93 billion or over 35 of the total value exported through the Airport reflecting a resurgence in growth since the low value of $79 billion in exports in 2015 Other major commodities such as machinery and computers opticphotomedical instruments pharmaceutical aircraft manufacturing plastics and agriculture sector exports have been growing in both value and weight since 2009 By measure of air weight edible fruits and nuts topped the list of export commodities at SFO in 2016 at 28 thousand metric tons or 20 of the Airportrsquos total Industrial machinery (including computers) electric machinery and optic photo and medical instruments also constituted a significant share of the commodity weight exported on SFO flights in 2016 Since 2009 SFO has witnessed double‐digit growth in the export of meat exports by volume with an annual average increase of 204 over the past seven years
2017 Economic Impact Study of San Francisco International Airport 16
Table 6 Top Ten SFO Export Commodities by Air Value and Weight 2016
BY AIR VALUE
Rank Commodity Air Value (In $Ms)
Change (2009‐2016)
Annual Change (2009‐
2016) 1 Electronic Machinery SoundTV Equip $9326 6 09 2 Machinery and Computers $8096 57 67 3 OpticPhotoMedical Instruments $4741 26 34 4 Pharmaceutical Products $1480 81 89 5 Aircraft Spacecraft and Parts $530 10 14 6 Miscellaneous Chemical Products $467 ‐4 ‐05 7 Plastics $208 96 101 8 Edible Fruit and Nuts $174 55 65 9 Organic Chemicals $164 66 75 10 Tanning Dye Paint and Paint $132 21 28
All Others $1509 34 43
All Commodities $26828 28 36
BY AIR WEIGHT
Rank Commodity Air Weight (In 000s of Metric Tons)
Change (2009‐2016)
Annual Change
(2009‐2016) 1 Edible Fruit and Nuts 280 24 31 2 Machinery and Computers 271 17 23 3 Electric Machinery SoundTV Equip 184 7 10 4 OpticPhotoMedical Instruments 105 8 11 5 Vegetables Roots and Tubers 44 18 24 6 Articles of Iron or Steel 41 22 29 7 Plastics 40 5 06 8 Meat 36 267 204 9 Miscellaneous Chemical Products 33 ‐16 ‐25 10 Essential Oils Perfumes amp Cosmetics 25 ‐1 ‐02
All Others 1432 ‐1 ‐02 All Commodities 1433 1116 15
Source US Census Bureau Foreign Trade Division provided by WISERTrade
IMPORT COMMODITIES
SFO also serves as the entryway to the Bay Area for many commodity types (Table 7)19 Valued at $127 billion commodities in electric machinery soundTV equipment topped the Airportrsquos list of most valuable imports in 2016 These commodities when combined with those in the industrial machinery including computers optic photographic and medical instruments accounted for 79 of the Airportrsquos
19 US district and port data do not reflect state of origin or destination but indicate pass‐through location only There are no data available on state imports because it is impossible to tell the ultimate destination once goods enter the country
2017 Economic Impact Study of San Francisco International Airport 17
total import value in 2016 Pharmaceuticals chemical products pearlsstonesmetalscoins photo or cinema goods also constituted a significant portion of total import value at SFO last year while fish apparel plastics and vehicles comprised most of the Airportrsquos total import weight beyond typical electric‐related commodities
Pharmaceuticals experienced strong growth over the last seven years not only as an export commodity but also as an import to SFO (Table 7) Between 2009‐2016 the value of import commodities in this category grew by 620 or 326 annually up to $11 billion in 2016 All of the top commodity types by value increased over this period while apparel (not including knit) and vehicles declined in volume during the same period
2017 Economic Impact Study of San Francisco International Airport 18
Table 7 Top Ten SFO Import Commodities by Air Value and Weight 2016
BY AIR VALUE
Rank Commodity Air Value (In $Ms)
Change (2009‐2016)
Annual Change
(2009‐2016) 1 Electric Machinery SoundTV Equip $12703 51 61 2 Machinery and Computers $6990 19 26 3 OpticPhotoMedical Instruments $2269 55 65 4 Special Classification $1578 67 76 5 Pharmaceutical Products $1114 620 326 6 Miscellaneous Chemical Products $546 38 47 7 PearlsStonesMetalsCoins $213 21 27 8 Photo or Cinema Goods $198 61 70 9 Apparel (not including knit) $147 0 00 10 Vehicles (except rail or tramway) $144 88 94
All Others $1847 76 84 All Commodities $27749 48 57
BY AIR WEIGHT
Rank Commodity Air Weight (In 000s of Metric Tons)
Change (2009‐2016)
Annual Change
(2009‐2016) 1 Electric Machinery SoundTV Equip 385 34 43 2 Machinery and Computers 381 ‐10 ‐16 3 Fish Crustaceans and Aquatic 96 168 151 4 OpticPhotoMedical Instruments 84 11 15 5 Apparel (including knit) 56 27 34 6 Apparel (not including knit) 51 ‐4 ‐06 7 Plastics 45 64 74 8 Vehicles (except rail or tramway) 41 ‐2 ‐04 9 Special Classification 39 31 40 10 Furniture Bedding amp Lamps 37 395 257
All Others 432 79 87 All Commodities 1648 30 38
Source US Census Bureau Foreign Trade Division provided by WISERTrade Trade with Asia
SFO is a national gateway in terms of trade with Asia20 In 2016 the Airport was the third busiest in the nation in terms of trans‐pacific trade serving as the pass‐through port for $199 billion in total Asia export value which has grown from $154 billion in 2009 and peaked at $22 billion in 2013 (Figure 4) When measured by tonnage exported to Asia SFO ranked fourth among US airports each year since 2009 behind Chicago OrsquoHare International (ORD) Los Angeles International (LAX) and John F Kennedy International (JFK)
In 2016 Asia export value accounted for 74 of the Airportrsquos total export value This reliance on Asia exports has been consistent at SFO During the 2009‐2016 timeframe SFO and JFK alternated as the lead
20 Defined here as the Asia continent excluding the Middle East and Turkey
2017 Economic Impact Study of San Francisco International Airport 19
US airport in in terms of value per exported ton but in 2016 have both been surpassed by DFW as shown in Figure 5 Led by industrial machinery electrical machinery and optical instruments the value of exports to Asia through SFO averaged about $200000 per ton in 2016
Figure 4 Top Five Airports by Air Value of Exports to Asia 2009‐2016
Source US Census Bureau Foreign Trade Division provided by WISERTrade
Figure 5 Top Five Airports by Air Value per Ton of Exports to Asia 2009‐2016
Source US Census Bureau Foreign Trade Division provided by WISERTrade
TOTAL TRADE
In 2016 SFO facilitated nearly $546 billion of international trade (imports and exports) which required the transport of over 308000 metric tons of cargo The largest trading partners of US companies that
2017 Economic Impact Study of San Francisco International Airport 20
use SFO are in order of air value China Japan Malaysia Taiwan the Republic of Korea and Singapore Trade between the US and these six nations accounted for 70 of the value and 61 of tonnage of commodities moved through SFO As displayed in Table 8 the Airport enabled trade of a billion dollars or more with 12 different nations in 2016 and nine of them are in Asia Germany is the largest non‐Asia market connected through SFO
Table 8 Countries that Traded Commodities with Total Value More than $1 Billion in 2016 through SFO In Order of Value of Trade
Trading Partner Value of Trade 2016 (in $Mrsquos)
Percent of Total SFO Air Trade
Metric Tons 2016
Percent of Total
Tonnage China $11535 21 69938 23 Japan $6696 12 41294 13 Malaysia $6192 11 9601 3 Taiwan $5026 9 29460 10 Korea Republic Of $4913 9 23644 8 Singapore $4010 7 13958 5 Germany $2094 4 11614 4 Hong Kong $1628 3 9865 3 Thailand $1359 2 4773 2 Switzerland $1235 2 4691 2 Philippines $1118 2 2555 1 Ireland $1022 2 2627 1 Other (224 countries) $7749 14 84040 27 Total $54577 100 308060 100
Source US Census Bureau Foreign Trade Division provided by WISERTrade
2017 Economic Impact Study of San Francisco International Airport 21
This Page Left Blank Intentionally
2017 Economic Impact Study of San Francisco International Airport 22
CHAPTER 3 ON‐AIRPORT IMPACTS
DIRECT EMPLOYMENT
In 2016 nearly 41000 people were employed at SFO (excluding employment generated by temporary construction expenditures) according to data from the surveys of airport management and tenants In addition to 14900 employees of passenger airlines the Airport supports a wide variety of other aviation‐related jobs in transportation retail and government services These jobs involve
Freight services including dedicated cargo aviation courier delivery custom broker and trucking
Air terminal operations including security building maintenance and facility management
Airline support services including catering in‐flight entertainment aircraft handling fueling and maintenance
Concessionaire services including restaurants and retail stores
Ground transportation including rental car taxis and limousines
Figure 6 shows the distribution of jobs at SFO by major function Roughly 48 of airport jobs are directly aviation related which includes passenger and freight airlines and aviation support services (eg in‐flight catering firms and fixed‐base operators) The Airport Commission and contractors federal agencies such as the FAA and the TSA and other administrative functions account for 16 of on‐airport employment Terminal concessions account for 12 of employment while ground transportation also accounts for 18 of total full time and part time jobs
Figure 6 Distribution of On‐Airport Tenants and Administrative Jobs
Passenger Airlines 37
Admin Gov Security 16
Ground Transp 19
Terminal Concessions
12
Aviation Support 10
Rental car 5
Freight Transp 1
Sources Interviews of tenants and airport administration
2017 Economic Impact Study of San Francisco International Airport 23
BUSINESS SALES AND PAYROLL
In 2016 SFO business establishments generated $80 billion of business revenues (business sales and government budget expenditures) which included over $25 billion of payroll for nearly 40800 workers at the Airport (see Table 9)
Table 9 Direct Impacts of On‐Airport Tenants and Administrative Employees
Impact Type Employment Payroll Revenues
Direct Effect 40787 $2526045000 $8042483000
Note Data excludes on‐airport construction activities in 2016 Source Airport Tenant Survey and data from the US Department of Commerce aggregated through IMPLAN
Payroll was calculated from a hybrid of the survey responses and average revenues and wages per worker by economic sector in the Bay Area21 Findings from this analysis show that passenger airlines represent 37 of employment at SFO but also account for 45 of labor income earned by workers and 61 of revenues generated on the Airport Passenger Airlines was the only sector with a higher percentage of total labor income and productivity (revenues) than employment across all sectors as shown in Figure 7 Moreover the average payroll for on‐airport workers was $62000
Figure 7 Percent of Relative Employment Labor Income and Revenues by Aggregated Sector on SFO
70
0
10
20
30
40
50
60
Jobs Business Sales Labor Income
Passenger Admin Gov Ground Terminal Aviation Rental car Freight Other Airlines Security Transp Concessions Support Transp
Sources Interviews of tenants and airport administration US Department of Commerce data provided by IMPLAN Calculations by EDR Group
21 Survey respondents were asked for payroll When it was not provided the survey data were supplemented with US Department of Commerce data for appropriate industry sectors for each employer aggregated by the Minnesota IMPLAN Group (MIG Inc)
2017 Economic Impact Study of San Francisco International Airport 24
INDIRECT AND INDUCED IMPACTS
The direct economic activities at SFO lead to additional downstream impacts on suppliers as well as re‐spending of worker income To calculate the impacts of these effects indirect and induced multipliers were calculated for each of the categories listed in Table 10
Table 10 Direct Employment Labor Income and Business Revenues for Tenant and Administrative SFO
Classification of Activity by Sector Employment Payroll Revenues
Passenger Services amp Airport Administration
OtherNon‐Profit 93 $5449000 $12763000 StateLocal Government 93 $6998000 $15636000 Parking and Miscellaneous 232 $15853000 $30350000 Management MaintCleaning amp Facilities Services 339 $35846000 $79634000 Federal Government 1814 $223187000 $326720000 City of San Francisco Airport Commission 1998 $257567000 $300062000 Security Firms 2011 $101198000 $136874000 FBOs General Aviation and Aviation Services 4062 $180244000 $418961000 Airport Retail and Concessions 4904 $171696000 $626054000 Passenger Airlines 14962 $1148294000 $4896253000 Sub Total 30507 $2146332000 $6843307000
Freight Transportation Services Freight Airlines and Couriers 485 $31351000 $119587000
Passenger Ground Transportation Services LimosBusesVansTransit 2618 $85443000 $190926000 Taxi Cabs 2809 $91686000 $204877000 Transportation Network Companies (TNCs) 2131 $69544000 $155400000 Rental Car 2238 $101689000 $528386000 Sub Total 9375 $334665000 $1048981000
Total Airport‐Based 40787 $2526045000 $8042483000
Notes Data excludes on‐airport construction activities conducted in 2016 Dollars rounded to the nearest thousand Columns may not add due to rounding
Sources Interviews of tenants airport administration and US Department of Commerce data provided by IMPLAN Calculations by EDR Group
In 2016 the direct economic activities on‐airport generated an additional $67 billion in business revenues in the Bay Area (indirect and induced effects) supporting over 33000 additional jobs and $26 billion in labor income (payroll) The total economic contribution of on‐airport activity to the Bay Area is roughly $147 billion in revenues yielding nearly 74200 jobs and $52 billion in labor income for workers (see Table 11) Suppliers of goods and services generated approximately $29 billion in revenues over 14000 jobs and expended over $12 billion on payroll (indirect impacts) The re‐spending of labor income by workers on airport and supplier firms supported nearly 19000 additional Bay Area jobs with over $14 billion in payroll and $37 billion in new business sales
2017 Economic Impact Study of San Francisco International Airport 25
Table 11 Summary of Direct Indirect and Induced Economic Impacts of SFO in Bay Area
Economic Impacts Employment Payroll Revenues I Direct Impact Airport‐Driven Activity Airport‐Based 40787 $2526045000 $8042483000 II Indirect Impact Suppliers of Goods and Services Due to Airport and Related Activities 14330 $1252520000 $2947530000 III Induced Impact Re‐Spending of Worker Income Due to Airport and Related Activities 19047 $1415986000 $3758072000 Total Regional Impact 74164 $5194551000 $14748085000
Notes Dollars rounded to the nearest thousand Columns may not add due to rounding
Sources Interviews of tenants airport administration and US Department of Commerce data provided by IMPLAN Calculations by EDR Group
On‐airport businesses purchase supplies and services from the greater Bay Area economy which is highly concentrated in air‐reliant services22 transportation support other services and food and beverage industries which combined represent 71 of all supporting industries (Table 12) The wages spent by employees of on‐airport businesses for their daily living needs are primarily spent on service sectors food and beverages and retail which combine to be 74 of all purchases made within in the Bay Area economy as indicated in Table 13
Table 12 Supplier of GoodsServices Industries (Indirect)
Industry Employment of Total
Air‐reliant services 3042 21 Other Services 3017 21 Transportation Support 2951 21 Food amp Beverage 1128 8 Couriers 681 5 Wholesale Trade 602 4 State amp Local Government 499 3 Manufacturing 419 3 Construction 318 2 Banking amp Financial Services 269 2 All Others 1404 10 Total 14330 100
Sources US Department of Commerce data provided by IMPLAN Calculations by EDR Group
22 Air‐reliant services include architectural engineering business support computer systems design services facility support financial services management scientific technical services and consulting These sectors purchase large amounts of air transportation services Other Services include insurance rentalleasing building services landscaping waste management medical social and maintenance and repair A full listing is in Appendix I
2017 Economic Impact Study of San Francisco International Airport 26
Table 13 Re‐Spending of Worker Income Industries (Induced)
Industry Employment of Total
Services 6553 34 Food amp Beverage 2855 15 Reliant Services 2425 13 Retail 2277 12 Entertainment 734 4 Wholesale Trade 561 3 Banking amp Financial services 438 2 Manufacturing 292 2 State amp Local Government 253 1 All Others 2661 14 Total 19047 100
Sources US Department of Commerce data provided by IMPLAN Calculations by EDR Group
ON‐AIRPORT CONSTRUCTION
SFO provided a summary of all capital projects from FY 1314 to FY 1516 The summary of projects was provided in eight categories of expenditures including terminal airport support groundside environmental parking safety amp security airfield and utility improvements An analysis over multiple years is preferable to smooth‐out annual fluctuations that are typically seen in construction spending The objective of this approach is to estimate economic impacts of construction at SFO for a ldquotypical yearrdquo to mitigate the short‐term investment periods associated with single construction projects
Each type of expenditure is matched to the most appropriate industry sector in the IMPLAN modeling package as described in Table 14
Table 14 Sector Mapping
SFO Capital Construction Category IMPLAN Sector
Description
Terminal improvements Construction of nonresidential structures
Airport support improvements Facilities support services
Groundside improvements Maintenance and repair (roadway amp taxiway)
Environmental improvements
Maintenance amp Repair (nonresidential) Parking improvements
Safety amp security improvements
Airfield improvements
Utility improvements Water sewage and other systems
Source SFO and US Department of Commerce data provided by IMPLAN
2017 Economic Impact Study of San Francisco International Airport 27
After classifying each of the five expenditure categories into the corresponding IMPLAN sector these economic impacts of the capital investments were estimated for the nine Bay Area counties for an average year from FY 1314 ndash FY 1516 (Table 15)
Table 15 Annual Average Impacts from SFO Construction on the Bay Area Economy
Impact Type Employment Labor Income Expenditures Direct Effect 2041 $144669000 $366782000 Indirect Effect 644 $49244000 $122327000 Induced Effect 961 $60104000 $163281000 Total Effect 3645 $254017000 $652390000
Notes Dollars rounded to the nearest thousand Columns may not add due to rounding
Source Employment and Labor Income derived using IMPLAN
2017 Economic Impact Study of San Francisco International Airport 28
CHAPTER 4 VISITOR SPENDING
In the year ending June 2016 526 of domestic and international air travelers arriving at SFO were non‐residents visiting the region (representing 102 million of the 193 million origin and destination (OampD) enplanements at the Airport excluding connecting passengers) SFO traffic statistics and national data sets from the Department of Transportation show that that 26 of all visitors were international visitors 12 were Southern California residents served by four airports and 62 were visitors from other parts of the United States Surveys of air travelers indicate that 70 of visitors traveled for personal reasons to the Bay Area and 30 for business reasons The survey also shows that the trip purposes of domestic travelers are more likely to be business related than for international travelers (Figure 8)
Figure 8 Profile of Air Visitors Arriving via SFO by Place of Origin
Sources Visitor Survey Conducted by Polaris Inc SFO Traffic Statistics US DOT OampD Survey US DOT T‐100 Database IATA PaxIS Database US DOC National Travel and Tourism Office (NTTO) Calculations by EDR Group and ICF
2017 Economic Impact Study of San Francisco International Airport 29
VISITOR SPENDING
The survey of arriving visitors found that on average international visitors spend $1234 in the Bay Area and domestic US visitors spend $1024 per trip The breakdowns by trip origin and trip purpose (business or labor) are shown in Figure 9
Figure 9 Relative Spending of Visitors per Trip by Origin and Purpose
Sources Visitor Survey Conducted by Polaris Inc Calculations by EDR Group
Overall the off‐airport spending of the 102 million domestic and foreign visitors who arrived through SFO visitor amounted to nearly $111 billion of which approximately $105 billion was in the Bay Area and an additional $585 million was outside the Bay Area23 This encompasses spending on hotels food and beverage retail purchases entertainment and recreation and local travel (eg taxis car rental24 sight‐seeing trips and public transportation) The breakout of visitor spending by sector is shown in Table 16
Table 16 Off‐Airport SFO Visitor Spending Inside and Outside of the Bay Area
Sector Total within Bay Area Total Outside Bay Area Total
Accommodations $4515536000 $263822000 $4779358000 Food and Beverage $2407541000 $128195000 $2535735000 Retail $1769840000 $90393000 $1860234000 Entertainment $831216000 $44525000 $875740000 Car Rental $714078000 $50036000 $764114000 Ground Transportation $301415000 $7788000 $309203000 Total $10539626000 $584759000 $11124384000
Note Dollars are rounded to thousands
Sources SFO Traffic Statistics and national data sets from the Department of Transportation Visitor Survey Calculations by EDR Group
23 Visitor surveys conducted at SFO indicated if spending occurred within the Bay area or in surrounding counties 24 On‐airport car rentals are included in the On‐airport tenant estimates Car rentals off‐airport is included in the Visitor Spending
estimates
2017 Economic Impact Study of San Francisco International Airport 30
JOBS AND INCOME GENERATED BY OFF‐AIRPORT VISITOR SPENDING
The $111 billion spent in 2016 by visitors arriving through SFO supported over 138000 jobs within the Bay Area and an additional 8500 jobs supported by visitor spending outside the Bay Area in other counties in California
Table 17 Breakdown of Total Visitor Spending Impacts
Impact Type Employment Payroll Visitor Spending Total Visitor Spending Impacts in Bay Area Direct 96121 $3870828000 $10539626000 Indirect 15268 $1234317000 $3066523000 Induced 26893 $1685335000 $4560386000 Total 138282 $6790480000 $18166535000 Total Visitor Spending Impacts Outside of the Bay Area Direct 5731 $198297000 $584759000 Indirect 1185 $70593000 $205456000 Induced 1596 $79311000 $239010000 Total 8511 $348201000 $1029225000 Total Visitor Spending Impacts Due to SFO Direct 101852 $4069125000 $11124385000 Indirect 16452 $1304910000 $3271979000 Induced 28489 $1764646000 $4799396000 Total 146793 $7138681000 $19195760000
Notes Jobs include employees and proprietors Payroll includes wages profits and value of benefits
Sources Visitor Survey conducted by Polaris Inc SFO Traffic Statistics and national data sets from the Department of Transportation Calculations by EDR Group
The IMPLAN modeling package was tailored to the nine‐county Bay Area and the rest of California to calculate direct jobs and wages from visitor spending in the region and to capture spending in the remaining counties of California In the initial stage of the analysis spending profiles were developed as shown in Table 16 (lodging food and beverage entertainment retail and local ground transportation) were used in the initial stage of the analysis25 The first step was to apply business sales (the actual visitor spending) to worker ratios to estimate employment generated by visitor spending The second step involved applying payroll to worker ratios to these employment estimates to calculate the how much labor income is generated for each of the five categories of spending These ratios are summarized in Table 18 and the applied calculations are as follows
1 Step 1 Employment Generated by Visitor Spending = Visitor SpendingBusiness Sales per Worker (by sector)
2 Step 2 Labor Income Generated by Visitor Spending = Workers (calculated in Step 1 above) Labor Income per Worker (by sector)
25 IMPLAN packages data from federal agencies on a county basis including the US Department of Commerce and the US Department of Labor EDR Group developed the sectors that reflect visitor spending and aggregated the counties to build the Bay Area region and Outside‐Bay Area region
2017 Economic Impact Study of San Francisco International Airport 31
Table 18 Earnings and Sales per Worker
Sector Payroll per Worker
Sales per Worker
Ground Transportation $56195 $116579 Car Rental $45823 $233176 Accommodations $47874 $119611 Retail $41257 $83847 Entertainment $36507 $88861 Food amp Beverage $31016 $65252
Notes Payroll (labor income) includes wages and profits Retail Sales per worker are margined sales
Sources US Departments of Commerce of Labor data provided by IMPLAN Calculations by EDR Group
INDIRECT AND INDUCED IMPACTS
Activities serving air travelers or visitors outside of the Airport (see Table 16) also generate additional orders for goods and services from suppliers These include orders for
Fuel and maintenance services by off‐airport taxis rental cars tour buses and public transportation
Accounting fees paid by businesses in hospitality industries
Food products for off‐airport restaurants
Wholesale merchandise to be sold by off‐airport stores
Furniture and equipment for off‐airport hotels restaurants and stores
These orders in turn support additional employment and wages in the Bay Area Supplier orders support payroll to workers of these supplier businesses Workers then spent this income on consumer purchases such as
Retail purchases for consumer items such as food clothing home furnishings and cars
Purchases of health care and childcare services
Rent and mortgage payments and other housing costs
In 2016 the multiplier effects of spending by air visitors to the Bay Area generated an additional $76 billion in business revenues in the region supporting 42000 additional jobs and provided over $29 billion in total payroll expenditures
Including initial visitor spending indirect supplier purchases and spending of earned income by workers in visitor services industries the total economic contribution of SFO visitors to the Bay Area totaled roughly $182 billion in revenues yielding over 138000 jobs and nearly $68 billion in payroll (see Table 19) Suppliers of goods and services generated approximately $30 billion of revenues 15000 jobs and $12 billion of Labor income (indirect impacts) The re‐spending of earnings supported $46 billion of revenues nearly 27000 jobs and close to $17 billion of labor income (induced impacts)
2017 Economic Impact Study of San Francisco International Airport 32
Table 19 Summary of Direct Indirect and Induced Economic Impacts of the Contribution of Visitor Spending in the Bay Area
Economic Impact Business Revenues Payroll Jobs
I Direct Impact Visitor Spending Activity Direct Visitor Spending $10539626000 $3870828000 96121 II Indirect Impact Suppliers of Goods and Services Due to Visitor Spending Off‐Airport $3066523000 $1234317000 15268 III Induced Impact Re‐Spending of Worker Income Due to Visitor Spending Off‐Airport $4560386000 $1685335000 26893 Total Regional Impact in Bay Area $18166535000 $6790480000 138282
Notes Dollars rounded to thousands Columns may not add due to rounding
Sources SFO Traffic Statistics and national data sets from the Department of Transportation Visitor Survey US Department of Commerce data provided by IMPLAN IMPLAN multiplier package Calculations by EDR Group
2017 Economic Impact Study of San Francisco International Airport 33
This Page Left Blank Intentionally
2017 Economic Impact Study of San Francisco International Airport 34
CHAPTER 5 IMPACTS OF AIR RELIANT USERS
(FREIGHT SHIPPERS)
For this study ldquoreliant usersrdquo are defined as manufacturers and agricultural industries that ship products by air through SFO26
THE ROLE OF SFO IN AIR EXPORTS
SFO plays a critical role in Californiarsquos economy by enabling manufacturers and agricultural producers to transport commodities and finished goods to customers in both domestic and international markets This section on air reliant activities signifies the contribution of SFO to economic development in the Bay Area by enabling regional firms to sell products across the US and the world and thereby maximize shares of national and international trade Without the services offered at SFO (and if the similar scale of air services is not taken up by another regional airport) companies in the Bay Area that produce and ship products would find markets limited and market shares curtailed In turn economic activity in the Bay Area that is associated with production of goods shipped through SFO would be reduced
A review of the products shipped from the Bay Area through SFO provides an insight into the cross‐section of the economy that is reliant on‐air cargo services at SFO in particular Silicon Valley located in Santa Clara county and home to major technology companies and start‐ups This analysis is based on industry specific data from the Foreign Trade Division of the US Census Bureau and the Freight Analysis Framework of the US DOT (Federal Highway Administration) and economic output by industry from the US Bureau of Economic Analysis (collected by the Minnesota IMPLAN Group)27
INTERNATIONAL EXPORTS
SFO is a gateway for the Bay Area manufacturing and other industries to deliver their products to customers throughout world To assess the role that SFO plays in exports from the Bay Area the following methodology was applied According to data from the Foreign Trade Division (collected by WISERTrade) 25 of all California air exports that originated in California passed through SFO This percentage was applied to all industry sectors (three‐digit NAICS) to estimate the value and types of Californian exports going through SFO To isolate the Bay Area specific exports the ratio of Bay Area output to total California output was calculated using US Bureau of Economic Analysis (BEA) data and applied to California exports going through SFO28 The results represent estimates of international exports by industry that are produced by Bay Area businesses and exported for sale through SFO This methodology is further explained in Appendix I
Air‐freight shipped from SFO is overwhelmingly concentrated in technology goods produced in the Bay Area The leading export industry is Computer and Electronics manufacturing which accounts for nearly
26 This definition is based on past SFO Economic Impact Studies 27 At this writing the most recent year available for both Foreign Trade Division and US Bureau of Economic Analysis information
is 2016 28 Provided through the Minnesota IMPLAN Group
2017 Economic Impact Study of San Francisco International Airport 35
two‐thirds of the regionrsquos exports by value as indicated in Table 20 The next four ranked industries (chemicals machinery transportation equipment electrical equipment and appliances) account for an aggregate 26 of total Bay Area exports Altogether the top five industries account for 89 of the total value of goods that originates in the Bay Area and are shipped through SFO
Table 20 Top International Exported Industries
Industry Value (in $millions)
of Total
Computers and Electronics $5430 631 Chemicals $848 99 Machinery $742 86 Transportation Equipment $425 49 Electrical Equipment amp Appliances $232 27 All others $928 108 Total $8604 100
Sources US Census Bureau Foreign Trade Division collected by WISERTrade
DOMESTIC EXPORTS
The FHWA Freight Analysis Framework (FAF) was used to identify the domestic flows of Bay Area goods to US customers via SFO The FAF areas are represented by Combined Statistical Areas (CSAs) represent the FAF areasmdashthe San Francisco CSA includes 12 counties (the Bay Area plus San Benito Santa Cruz and San Joaquin counties) To scale the commodity flows to the nine‐county Bay Area a ratio was applied like the approach described above for international exports This ratio was calculated using the BEA industry output for the nine‐county region and was divided by the industry output for the 12‐county CSA
Even more concentrated than international exports domestic shipments are highly concentrated in computer and electronics and electrical equipment manufacturingmdashcombined these sectors account for 75 of the total Bay Area produced shipments through SFO The second largest amount of exports is in chemicals which represents 94 of all exports as indicated in Table 21 Together the top five industries represent 91 of the total value of Bay Area domestic exports through SFO
Table 21 Top Domestic Shipped Industries
Industry Value (in $millions)
of Total
Computers and Electronics $3419 423 Electrical Equipment amp Appliances $2642 327 Chemicals $761 94 Transportation Equipment $302 37 Machinery $191 24 All Others $766 95 Total $8081 100
Source Freight Analysis Framework US Department of Transportation
2017 Economic Impact Study of San Francisco International Airport 36
Combining both domestic and international products still highlights the integral part that computer and electronics and electrical equipment manufacturing (70) plays within the Bay Area compared to other manufacturing sectors (Figure 10) and the significance that SFO has in enabling these products to reach their customers
Figure 10 Percentage of the Bay Arearsquos Combined Domestic and International Exports Shipped via SFO
Sources US Census Bureau Foreign Trade Division collected by WISERTrade and Freight Analysis Framework US Department of Transportation
ECONOMIC CONTRIBUTION OF SFO TO THE BAY AREA
To gauge the level of impact EDR Group used US Bureau of Economic Analysis (BEA) data included in IMPLAN to 1) estimate the jobs and wages associated with the domestic and international exports through SFO and 2) determine the additional activity that percolates throughout the economy as air‐reliant businesses purchase additional goods and services from suppliers (Indirect) and employees spend their additional income (Induced) BEA data within IMPLAN is used because it contains information about the structural buyer‐supplier relationships within the economy as well as the industries where labor income is usually spent
Overall $167 billion in domestic and international exports shipped via SFO contribute to over 26000 jobs and over $40 billion in labor income within the Bay Area (Table 22) When including purchases of supplier goods and services (Indirect) and employee wage re‐spending (Induced) the total impact of air exports on the Bay Area economy accounts for over 84000 jobs and nearly $29 billion in business sales (output) Appendix I describes the methodology used to develop these calculations
2017 Economic Impact Study of San Francisco International Airport 37
Table 22 Economic Value of Domestic and International Exports Originating in the Bay Area via SFO
Impact Type Employment Labor Income Output Direct Effect 26078 $4023963000 $16721996000
Indirect Effect 20448 $2262032000 $6067692000
Induced Effect 37706 $2408696000 $6186854000
Total Effect 84232 $8694691000 $28976542000
Source US Department of Commerce data provided by IMPLAN Calculations by EDR Group
EFFECTS ON SUPPLIERS OF GOODS AND SERVICES
Figure 11 profiles the employment supported when Bay Area air‐reliant businesses purchase goods and services from other Bay Area businesses In total over 20000 jobs are dependent on Bay Area air‐reliant businesses that purchase goods and services to make final products that are shipped via SFO Most jobs are in the services sector which accounts for over 10000 of the indirect jobs
Figure 11 Employment Impacts on Suppliers of Goods and Services (Indirect)
Service
Trade
Manufacturing
Transp Inform amp Utilities
Government
Construction
Agriculture
Mining
Jobs
Source US Department of Commerce data provided by IMPLAN Calculations by EDR Group
At a finer level of BEA industry detail purchases made by Bay Area air‐reliant businesses are concentrated in wholesale trade administrative support professional scientific and technical services management of companies and computers and electronics As shown in Table 23 these five industries represent 60 of the total jobs supported by air reliant business purchases Nearly 40 of the job impacts are spread across other industries indicating that the dependence on Bay Area businesses that use SFO is widespread across most the local economy
0 2000 4000 6000 8000 10000 12000
2017 Economic Impact Study of San Francisco International Airport 38
Table 23 Impacts on Suppliers of Goods and Services (Indirect) by BEA Industry
Industry Category Jobs of Total
Wholesale trade 3709 18 Administrative Support 2881 14 Professional Scientific amp Technical Services 2588 13 Management of Companies 1810 9 Computer amp Electronics 1311 6 Government 743 4 Repair amp Maintenance 619 3 Food amp Beverage 616 3 Fabricated Metals 592 3 Construction 546 3 Rest of Others 5034 25 Total 20448 100
Source US Department of Commerce data provided by IMPLAN Calculations by EDR Group
The following sections did not include any updated information and therefore can be found in Chapter 5 Impacts of Air Reliant User (Freight Shipper) within the 2016 Economic Impact Study of San Francisco International Airport Overview of International Freight Activity SFO Connects the Bay Area to Domestic Markets Commodities Shipped from SFO to Domestic Markets County by County Commodity Movements
2017 Economic Impact Study of San Francisco International Airport 39
CHAPTER 6 TAX IMPACTS GENERATED BY ACTIVITIES AT SFO
The income and business sales produced by economic activities at SFO in turn generate federal state county and municipal tax revenues This chapter presents estimates of state and local tax impacts from airport activities as well as federal aviation taxes derived from aviation services29
STATE AND LOCAL TAX IMPACTS
The state and local tax revenues linked to operations at SFO totaled nearly $29 billion in 2016 including close to $16 billion from direct activities and almost $13 billion from purchases of supplier goods and services (Indirect) and re‐spending of worker income (Induced) Tax revenues are estimated using effective tax rates calculated by BEA and US Census data (as organized through IMPLAN) as well by considering California publications including the Governorrsquos Budget Summary ndash 2015‐16 Comprehensive Annual Financial Report of the State Controllerrsquos Office and the County of San Mateo Appendix II includes a breakout of tax revenues by county where applicable
Table 24 Estimated 2016 State and Local Tax Impacts (in $ millions)
Impact Category Direct Activities Indirect Induced
Activities Total Activities
On‐Airport $602 $336 $937
Construction $7 $16 $23
Visitor Spending $697 $345 $1041
Air‐Reliant Businesses $280 $592 $872
Total Taxes $1586 $1288 $2874
Sources Totals may not sum due to rounding Based on information from Regional Economic Accounts (REA) and National Income and Product Accounts (NIPA) from the Bureau of Economic Analysis (BEA) and Consumer Expenditure Survey (CES) and the Annual Survey of State and Local Government Finances (SLGF) from the US Census Bureau
FEDERAL AVIATION TAXES
Aviation operations at SFO generated more than $12 billion dollars in federal taxes including $419 million from taxes on international and domestic passengers and $791 million in US Customs revenue from customs duties on international air cargo shipments (Table 25) These tax revenues are remitted to the US Department of the Treasury and may not directly benefit the Bay Area or the State of California
29 Data developed in this chapter should be considered as order of magnitude estimates As in previous economic impact studies for SFO tax impacts are derived from per‐capita measures
2017 Economic Impact Study of San Francisco International Airport 40
Table 25 Estimated 2016 Federal Aviation Tax Revenues
Type of Tax ChargesFees Revenues in millions
of Total
Customs and Immigration $550 and $7 per passenger $32 3
International Arrival and Departure Tax $1800 per passenger $93 8
Domestic Passenger Taxes $410 per passenger amp 75 of airfare $237 20
Sept 11th security fee $560 per passenger $57 5
Sub‐Total Passenger Related Taxes $419 35
US Customs Revenue (International Cargo) Customs Revenues (US ITC) $791 65
Total $1211 100
Notes Includes US Government Segment tax Does not include Domestic Transportation tax (75 of airfare cost)
Sources Federal Aviation Administration wwwairlinesorg and wwwWiserTradecom
2017 Economic Impact Study of San Francisco International Airport 41
CHAPTER 7 DISTRIBUTION OF IMPACTS BY BAY AREA COUNTIES
This chapter presents the distribution of direct jobs and income as well as the distribution of tax benefits among Bay Area counties for on‐airport and visitor spending categories Local impacts are based on a sample of almost 24000 on‐airport employees by zip code compiled for the 2016 Study
ON‐AIRPORT EFFECT AMONG BAY AREA COUNTIES
Table 26 and Table 27 show estimates of jobs payroll (labor income) and business revenues (output) associated with each of the nine Bay Area counties that are generated by on‐airport economic activity In Table 26 direct and induced employment and wages are allocated to the counties based on the residence of employees of the Airport Commission staff its contract workers and tenants Due to the location of SFO all direct business revenues (direct output) are generated in San Mateo County (Table 29) Economic impacts (employment payroll and business revenues) associated with supplier purchases (indirect) were applied proportionally to each county based on relative employment levels compared to the Bay Area region
Table 26 Employment and Labor Income Impacts of On‐airport Tenants by County
County Impact Type
Employ ment
Labor Income County Impact Type
Employ ment
Labor Income
Alameda
Direct 5487 $339835000 San Mateo
Direct 12197 $755396000 Indirect 2836 $247852000 Indirect 1516 $132524000 Induced 2562 $190496000 Induced 5696 $423440000 Total 10885 $778183000 Total 19409 $1311360000
Contra Costa
Direct 2600 $161011000 Santa Clara
Direct 1307 $80940000 Indirect 1505 $131531000 Indirect 3750 $327807000 Induced 1214 $90255000 Induced 610 $45371000 Total 5319 $382797000 Total 5668 $454118000
Marin
Direct 221 $13692000
Solano
Direct 1125 $69671000 Indirect 551 $48121000 Indirect 527 $46064000 Induced 103 $7675000 Induced 525 $39054000 Total 875 $69488000 Total 2177 $154789000
Napa
Direct 125 $7741000
Sonoma
Direct 199 $12323000 Indirect 291 $25428000 Indirect 836 $73075000 Induced 58 $4339000 Induced 93 $6908000 Total 474 $37508000 Total 1128 $92306000
San Francisco
Direct 6618 $409849000 Outside Bay Area
Direct 10908 $675588000 Indirect 2518 $220117000 Indirect NA NA Induced 3090 $229743000 Induced 5094 $378704000 Total 12226 $859709000 Total 16002 $1054292000
Total
Direct 40787 $2526046000 Indirect 14330 $1252519000 Induced 19047 $1415985000 Total 74164 $5194550000
Notes Cells left blank because indirect impacts from the Bay Area are only allocated to each of the 9 counties Sources Airport Tenant Survey Data Provided by SFO and US Department of Commerce data provided by IMPLAN Calculations by EDR Group
2017 Economic Impact Study of San Francisco International Airport 42
Table 27 Business Revenues Impacts of On‐airport Tenants by Bay Area County
County Impact Type Business Revenues
County Impact Type Business Revenues
Alameda
Direct $0
San Mateo
Direct $8042484000 Indirect $583266000 Indirect $311867000 Induced $505583000 Induced $1123825000 Total $1088849000 Total $9478176000
Contra Costa
Direct $0
Santa Clara
Direct $0 Indirect $309528000 Indirect $771423000 Induced $239541000 Induced $120417000 Total $549069000 Total $891840000
Marin
Direct $0
Solano
Direct $0 Indirect $113241000 Indirect $108402000 Induced $20370000 Induced $103651000 Total $133611000 Total $212053000
Napa
Direct $0
Sonoma
Direct $0 Indirect $59839000 Indirect $171965000 Induced $11517000 Induced $18333000 Total $71356000 Total $190298000
San Francisco
Direct $0 Outside Bay Area in CA
Direct $0 Indirect $517998000 Indirect NA Induced $609744000 Induced $1005092000 Total $1127742000 Total $1005092000
Total
Direct $8042484000 Indirect $2947529000 Induced $3758073000 Total $14748086000
Notes Cells left blank because indirect impacts from the Bay Area are only allocated to each of the 9 counties Sources Airport Tenant Survey Data Provided by SFO and US Department of Commerce data provided by IMPLAN Calculations by EDR Group
2017 Economic Impact Study of San Francisco International Airport 43
VISITOR SPENDING The visitor spending survey conducted at SFO documented the destinations of visitors who arrive in California through SFO Table 28 indicates the economic impacts associated with visitor spending for each county
Table 28 Economic Impacts of Visitor Spending by Bay Area County
Bay Area County Impact Type Employment Labor Income Visitor Spending
Alameda
Direct 6812 $274314000 $746911000 Indirect 1082 $87472000 $217315000 Induced 1906 $119435000 $323181000 Total 9800 $481221000 $1287407000
Contra Costa
Direct 4737 $190766000 $519423000 Indirect 752 $60831000 $151127000 Induced 1325 $83058000 $224749000 Total 6815 $334655000 $895299000
Marin
Direct 2732 $110014000 $299551000 Indirect 434 $35081000 $87155000 Induced 764 $47900000 $129613000 Total 3930 $192995000 $516319000
Napa
Direct 3933 $158385000 $431255000 Indirect 625 $50505000 $125474000 Induced 1100 $68960000 $186600000 Total 5658 $277850000 $743329000
San Francisco
Direct 52000 $2094047000 $5701745000 Indirect 8260 $667743000 $1658933000 Induced 14549 $911735000 $2467086000 Total 74808 $3673525000 $9827764000
San Mateo
Direct 10475 $421828000 $1148568000 Indirect 1664 $134511000 $334178000 Induced 2931 $183661000 $496973000 Total 15069 $740000000 $1979719000
Santa Clara
Direct 10832 $436224000 $1187767000 Indirect 1721 $139102000 $345583000 Induced 3031 $189929000 $513934000 Total 15584 $765255000 $2047284000
Solano
Direct 667 $26864000 $73147000 Indirect 106 $8566000 $21282000 Induced 187 $11697000 $31650000 Total 960 $47127000 $126079000
Sonoma
Direct 3933 $158386000 $431259000 Indirect 625 $50506000 $125476000 Induced 1100 $68960000 $186601000 Total 5658 $277852000 $743336000
Total
Direct 96121 $3870828000 $10539626000 Indirect 15268 $1234317000 $3066523000 Induced 26893 $1685335000 $4560387000 Total 138282 $6790480000 $18166536000
Sources Airport Visitor Spending Survey Data Provided by SFO and US Department of Commerce data provided by IMPLAN Calculations by EDR Group
2017 Economic Impact Study of San Francisco International Airport 44
TAX IMPACTS BY BAY AREA COUNTY
Tax revenues including sales property (business and labor) corporate and income taxes are collected from on‐airport tenants and the workers that they employ directly at SFO Table 29 indicates the tax revenues generated from each impact type (direct IndirectInduced and Total) by county Direct tax revenues paid by individuals and households are apportioned according to place of residence of Airport Commission staff contact employees and tenants Direct taxes paid by businesses originate in San Mateo County due to the location of the Airport
Table 29 Tax Revenues by County for On‐airport Tenants
Bay Area Counties
Direct Indirect Induced
Total
Alameda $10303000 $53898000 $64201000
Contra Costa $4882000 $27089000 $31971000
Marin $415000 $6369000 $6784000
Napa $235000 $3405000 $3640000
San Francisco $12426000 $56329000 $68755000
San Mateo $548000000 $73751000 $621751000
Santa Clara $2454000 $42422000 $44876000
Solano $2112000 $10527000 $12639000
Sonoma $374000 $9009000 $9383000
Outside Bay Area $20483000 $52913000 $73396000
Total $601684000 $335712000 $937396000
Notes Direct tax revenues shown in San Mateo County include $33 million in Possessory Interest Tax revenues as estimated for the 2016 Study
Sources Governorrsquos Budget Summary State Controllerrsquos Office the County of San Mateo Bureau of Economic Analysisrsquo (BEA) National Income and Product Accounts (NIPA) the US Census Bureau (Consumer Expenditure Survey Annual Survey of State and Local Government Finances) US Department of Commerce data provided by IMPLAN Airport Tenant Survey and Information Provided by SFO Calculations by EDR Group
Tax revenues including sales property (business and residential) corporate and income taxes are also generated by visitors and businesses that provide goods and services to domestic and international visitors Table 30 below outlines the tax revenues provided by each county by business in the hotel restaurant transportation entertainment and retail industries (direct) the businesses that support these industries (indirect) and the tax revenue generated by employees spending their earned income (induced)
2017 Economic Impact Study of San Francisco International Airport 45
Table 30 Tax Revenues by County for Visitor Spending
Bay Area Counties Direct Indirect Induced
Total
Alameda $49365000 $24431000 $73796000
Contra Costa $34330000 $16990000 $51320000
Marin $19798000 $9798000 $29596000
Napa $28502000 $14106000 $42608000
San Francisco $376840000 $186502000 $563342000
San Mateo $75911000 $37569000 $113480000
Santa Clara $78502000 $38851000 $117353000
Solano $4834000 $2393000 $7227000
Sonoma $28503000 $14106000 $42609000
Total Taxes $696585000 $344746000 $1041331000
Sources Governorrsquos Budget Summary State Controllerrsquos Office Bureau of Economic Analysisrsquo (BEA) National Income and Product Accounts (NIPA) the US Census Bureau (Consumer Expenditure Survey Annual Survey of State and Local Government Finances) US Department of Commerce data provided by IMPLAN and SFO Airport Visitor Survey Calculations by EDR Group
2017 Economic Impact Study of San Francisco International Airport 46
This Page Left Blank Intentionally
2017 Economic Impact Study of San Francisco International Airport 47
APPENDIX I METHODOLOGY FOR THE ANALYSIS
OF OVERALL ECONOMIC IMPACTS
Airport jobs and commerce on the Airport premises create strong economic stimuli for the Bay Area This airport business activity itself generates an increased demand for other local goods and services Not only do the businesses based on the Airport pay local and state taxes but the off‐airport businesses that depend upon airport‐based activity pay taxes as well As shown in this study the direct business activity and subsequent multiplier effects have a strong overall impact on the economy
All economic impacts in this report are described using the measures of jobs payroll and business sales The study quantifies three distinct categories of economic benefits that result from SFO‐related activities direct indirect and induced effects as described below
Direct impacts stem from the activity that is directly related to the provision of aviation services visitor spending or the activity of aviation‐reliant businesses For example the direct impacts of on‐airport tenants include the number of persons they employ on the Airport the wages and benefits paid to those workers and their business sales Similarly the direct impacts of air visitors include the money they spend on services and supplies and the jobs and payroll supported by those expenditures Most of the direct impacts measured in this study occur on‐airport but some such as visitor spending and the benefits produced by aviation dependent businesses occur off‐airport
Indirect and induced impacts which are sometimes called ldquomultiplier impactsrdquo result from (1) a portion of business sales used for ldquobusiness‐to‐businessrdquo purchases of goods and services (indirect effects) and (2) the recirculation of worker incomes and business expenditures in the broader Bay Area economy (induced effects) For example an airport restaurant may buy supplies from a Bay Area produce vendor This purchase represents income (ie new business sales) to the produce supplier which uses a portion of that income to pay its workers and buy additional goods and services from other businesses in the region In addition airport workers spend their wages on other items such as housing retail purchases and services Those expenditures in turn support jobs in those industries whose workers then spend their salaries in the Bay Area These successive rounds of spending and job creation represent the indirect impacts (business‐to‐business) and induced impacts (spending of wages) This study specifically measured the indirect and induced impacts that occur in the county economies of the Bay Area The discussions of total impacts are based on the following analyses and are illustrated in Figure 12
2017 Economic Impact Study of San Francisco International Airport 48
Figure 12 Elements of Economic Impacts and Interrelationships
Source EDR Group
2017 Economic Impact Study of San Francisco International Airport 49
SUPPLIERS OF GOODS AND SERVICES (INDIRECT MULTIPLIER EFFECTS)
Orders from Businesses at the Airport
Activities occurring at the Airport generate additional orders for goods and services from suppliers including orders for
Printing and publishing for the Airport operator and the airlines
Banking insurance legal accounting and technical services for airport businesses
Off‐site bus and parking services for SFO employees
Food products for airport restaurants
Wholesale merchandise to be sold by airport stores
Furniture and equipment for offices hotels restaurants and stores located at the Airport
Orders from Off‐Airport Businesses Serving Air Travelers
Activities serving air travelers outside of the Airport also generate additional orders for goods and services from suppliers for
Fueling and maintenance services for use by off‐airport taxis rental cars tour buses and public transportation
Construction and support operations of convention and hospitality facilities for convention visitors
Food products for off‐airport restaurants
Wholesale merchandise to be sold by off‐airport stores
Furniture and equipment for off‐airport hotels restaurants and stores
RE‐SPENDING OF WORKER INCOME (INDUCED MULTIPLIER EFFECTS)
The workers at SFO at off‐airport businesses serving air visitors and at supplier businesses earn income and most of that income is re‐spent on consumer purchases which support additional jobs within the Bay Area Examples of these purchases include
Retail purchases of food clothing home furnishings cars electronic devices computers and other products
Purchases of services spanning haircuts cleaning car repair and insurance
2017 Economic Impact Study of San Francisco International Airport 50
CALCULATING THE DOMESTIC AND INTERNATIONAL VALUES FROM CARGO
ORIGINATING IN THE BAY AREA AND SHIPPED THROUGH SFO
The combined $17 billion of international and domestic exports through SFO provides a significant direct contribution to the Bay Area economy as well as additional activity through economic linkages To estimate the level of impact EDR Group layered three sets of data ndash the Foreign Trade Database (FTD) of the US Bureau of the Census (tabulated by WISERTrade) the multi‐modal Freight Analysis Framework (FAF) of the US Federal Highway Administration and US Bureau of Economic Analysis (BEA) data included in IMPLAN to
1) Estimate the jobs and wages associated with the domestic and international exports through SFO and
2) Determine the additional activity that percolates throughout the economy as air‐reliant businesses purchase additional goods and services from suppliers (Indirect) and employees spend their additional income (Induced)
FTD data aggregated by WISERTrade was the basis of estimating the weight and value of goods produced in the Bay Area and exported from SFO to international markets FTD provides total exports by commodity and state of origin and the total value of California exports shipped through SFO WISERTrade also provides total value and weight by commodity for all shipments from SFO but not at a commodity level by point of origin Using IMPLAN data the ratios of output by commodity were calculated for the nine‐county Bay Area compared to California totals This calculation estimated the ldquosharerdquo of California produced air exports with an approximate point of origin in the Bay Area The calculation was constrained by both the value and weight reported by WISERTrade of exports by commodity from SFO and the weight of international shipments from SFO taken from the flysfo website
FAF was the basis of estimating domestic cargo shipments FAF provides domestic air shipments of commodities that originate in the twelve county San Jose‐San Francisco‐Oakland CA Combined Statistical Area Using IMPLAN data output by commodity for the nine‐county Bay Area were compared to the twelve county CMSA to estimate the ldquosharerdquo of each commodity shipped from the CSA
BEA data within IMPLAN profiles the structural buyer‐supplier relationships within the economy as well as the industries where labor income is usually spent Figure 13 illustrates the methodology of calculating the domestic and international values from the Bay Area through SFO
2017 Economic Impact Study of San Francisco International Airport 51
Figure 13 Methodology to Estimate Air Dependent Contribution to Bay Area Economy
3 Freight shipments by value
2 Geography
1 Calculations
MAJOR SOURCES OF DATA USED IN THIS STUDY
The discussion of total impacts is based on the following analyses conducted specifically for this study
1 A survey of all airport tenants and the data provided by staff of the San Francisco Airport Commission These data provide profiles of on‐airport jobs by establishment type of business activity and place of residence by zip code for airport and tenant employees
2 Polaris Research conducted surveys of airport travelers were conducted by Polaris Research The survey profiled trip purposes international or domestic origins segmentation of visitors from local residents and connecting passengers and the amount of money in the Bay Area spent by visitors using the Airport
3 Air freight analyses are based on data from SFO WISERTrade using data from US Census Bureau Foreign Trade Division30 and the Freight Analysis Framework (FAF) to develop a detailed profile of air exports from SFO by commodity and origin of movement Detailed data from FAF are not available for the Bay Area alone (statewide for the Foreign Trade Division and a 12 county combined statistical area (CSA) for FAF) Therefore the detailed commodity flows found in the data sets are proportioned based on the output per industry (converted from commodities) of the Bay Area
30 The World Institute for Strategic Economic Research (WISERTrade) formed July 1 2004 to continue the international trade data work of its predecessor MISER was chosen by the US Census Bureau to be one of its first Business and Industry Data Centers with special focus on foreign trade statistics See wwwwisertradeorg
2017 Economic Impact Study of San Francisco International Airport 52
4 Econometric models for the nine‐county Bay Area are based on the IMPLAN Economic Model System IMPLAN is used to estimate wages and sales (or budget expenditures for public entities) for airport tenants where only employment totals were available Labor income and sales andor expenditures per worker are derived primarily from US Department of Commerce (BEA is a part of the Commerce Department) and Department of Labor data sets and are county‐specific IMPLAN is also used to derive multiplier effects including business orders to suppliers generated by on‐airport businesses off‐airport businesses serving airport visitors and airport‐reliant businesses and business sales generated by the spending of the additional workersrsquo income on consumer purchases
2017 Economic Impact Study of San Francisco International Airport 53
APPENDIX II SUMMARY OF IMPLAN SECTORING
To estimate the full range of direct effects and the indirect and induced (ldquomultiplierrdquo) economic effects this study utilized the IMPLAN model system of MIG Inc IMPLAN is now the most widely used input‐output economic modeling system in the US with a client list of 500 public and private agencies including several federal agencies and numerous state agencies It utilizes US Commerce Department (National Income and Product Accounts) data on inter‐industry technology relationships (also known as input‐output structural matrices) countywide employment and income data from the Bureau of Economic Analysis (BEA) and Bureau of Labor Statistics (BLS) and its own industry and county‐specific estimates of local purchasing rates (ldquoregional purchase coefficientsrdquo) It is enhanced over most other input‐output models in that it also includes coverage of public sector activity and consumer activity (reflected in its ldquosocial accounting matrixrdquo) The industry detail is at the level of 536 industries and is based on categories of the US Bureau of Economic Analysis (BEA) which correspond to two to five digit groups in the North American Industry Classification System (NAICS)
For this study the direct job payroll and business revenue effects for on‐airport and visitor spending were documented through surveys completed for this project and then assigned to specific sector groups based on EDR Grouprsquos experience in aviation SFOrsquos support of air reliant industries was documented through databases maintained by the US Census Bureau and the US Department of Transportation The IMPLAN model was then calibrated for the nine‐county Bay Area as well as for each county within the region and a model calibrated for a defined region outside the Bay Area to measure additional visitor spending The result was an estimate of the indirect and induced (and overall) job business revenue and income impacts for each segment of airport beneficiary The analysis of retail impacts was adjusted to account for retail markup margins and the concentration of sales in airports and in visitor industries Retail portions of multiplier effects also incorporate these margins
Regardless of whether economic impacts are measured in terms of jobs income or business sales these impacts can be classified into three categories
Direct economic effects are the changes occurring at the project site as a direct consequence of the public investment project or program This is represented as the net increase in business activity associated with business at the SFO initial visitor spending at off‐airport businesses in each countyrsquos hospitality sector and the sale revenues earned by shippers who route air cargo through SFO
Indirect economic effects are the broader effects on business activity for off‐site goods and services supplied to the directly affected businesses
Induced economic effects are further shifts in spending on food clothing shelter and other consumer goods and services because of the change in workers and payroll of directly and indirectly affected businesses
EDR Group assembled classifications of the 536 sectors in the IMPLAN modeling package to best mirror types of industries on SFO types of visitor spending and industries related to commodities exported from SFO The classification schemes used for this study for on‐airport and visitor spending impacts are shown in Table 31 and Table 32
2017 Economic Impact Study of San Francisco International Airport 54
Table 31 Industry Classification of On‐Airport Industries
Airport Tenants Classification IMPLAN Sectors Used Passenger Airlines Air Transportation Freight Airlines Couriers Air Transportation Couriers Fixed Based Operator (FBO) Support activities for transportation Local Government
State and Local Government State Government
Federal Government Immigration TSA FBI US Customs and Border Patrol (CBP) National Weather Service
Distribution TruckingWarehousing Wholesale Wholesale Trade business Security Security Aviation Firms
Construction
Highways and Streets Commercial Structures Non‐residential structures Maintenance and Repair
Retail
ElectronicsAppliance Stores Food and Beverage Health and Labor Care Clothing Stores Sporting Goods Stores Misc Retail
Food and Beverage (includes Catering Firms) Full‐service restaurants Limited‐service restaurants All other food and drinking places
Car Rental Car Rental Ground Transportation (incl taxis limos buses vans and transit)
Transit and ground passenger transp
Other Medical Clinic Vending Machines
Services
Educational institutions Electronic repair services Insurance Medical services Other Support Services Telecommunications Waste Management
Reliant Services
ArchitecturalEngineering Business support Computer systems design services Facilities support Financial Services Management scientific and Technical Parking and Misc
2017 Economic Impact Study of San Francisco International Airport 55
Table 32 Industry Classification of Visitor‐Serving Industries
Visitor Spending Classification
IMPLAN Sectors Used
ElectronicsAppliance Stores
Food and Beverage
Health and Labor
Retail Clothing Stores
Sporting Goods
General Merchandise
Misc Retail
Performing Arts
Spectator Sports
Artists writers and performers
Museums zoos and parks
Entertainment Amusement parks and arcades
Gambling industries
Fitness and recreational sports centers
Bowling centers
Other amusement recreation
Full‐service restaurants
Restaurant Limited‐service restaurants
All other food and drinking places
Hotels and motels Hotel
Other accommodations
Transit and ground passenger transportation
Scenic and sightseeing Transportation
Support activities
Gas stations
Sources US Department of Commerce data provided by IMPLAN Calculations by EDR Group
2017 Economic Impact Study of San Francisco International Airport 56
This Page Left Blank Intentionally
2017 Economic Impact Study of San Francisco International Airport 57
APPENDIX III SFO TENANT AND VISITOR SURVEYS
The following pages are the survey instruments used for SFO tenants and visiting passengers Note that the passenger survey was administered in multiple languages
2017 Economic Impact Study of San Francisco International Airport 58
2017 Economic Impact Study of San Francisco International Airport 59
2017 Economic Impact Study of San Francisco International Airport 60
2017 Economic Impact Study of San Francisco International Airport 61
2017 Economic Impact Study of San Francisco International Airport 62
2017 Economic Impact Study of San Francisco International Airport 63
2017 Economic Impact Study of San Francisco International Airport 64
2017 Economic Impact Study of San Francisco International Airport 65
2017 Economic Impact Study of San Francisco International Airport 66

This Page Left Blank Intentionally
2017 Economic Impact Study of San Francisco International Airport 4
CHAPTER 1 INTRODUCTION amp OVERVIEW
This 2017 Economic Impact Study Update Report (2017 Update) is a partial update of the 2016 Economic Impact Study of San Francisco International Airport (2016 Study) Although published in June 2017 data in this study was collected in 2016 As in the 2016 Study this update reflects the economic contribution of SFO in the nine Bay Area counties of Alameda Contra Costa Marin Napa San Mateo San Francisco Santa Clara Solano and Sonoma
Data updated to 2016 values include administrative employment information (jobs labor income and zip code of residence) contractors concession revenues enplanements and cargo shipments Data not updated and held constant with the 2016 Study are the portions of the previous study that were based on surveys including visitor spending per trip and tenant employment other than terminal concessions The latter primarily represents airlines and other airside components of SFO as well as federal employment on airport
Additionally the ldquoeconomic matrixrdquo behind the 2016 Study was updated The ldquoeconomic matrixrdquo reflects how industries buy and sell from each other and how households spend their income ndash these are the drivers of indirect and induced (or ldquomultiplierrdquo) impacts respectively The 2016 Study incorporated the IMPLAN LLC input‐output model from 2014 which was the most recent model year available when the study was underway (adjusted to reflect 2012 dollars) This update is based on the IMPLAN model of 2015 (adjusted to reflect 2016 dollars) A further adjustment was made in that induced effects (the impacts of spending of wages earned from direct and indirect activities) were adjusted to account for changes in the Bay Area from calendar 2015 through 2016 This ensures the update more accurately reflects the regional economy as it rebounds from the recent recession5
The new input‐output model reflects changes in how Bay Area industries rely on local suppliers for goods and services (which lead to indirect multiplier effects) and the extent of household spending remains in the Bay Area (which lead to induced multiplier effects) Several trends are particularly important as noted below
Less materials and supply purchases are now made locally Within optimized supply chains and globalization on the rise more material and supplier purchases are made outside regional boundaries These dollars that in previous years stimulated regional economic growth are now flowing outside the Bay Area economy
In the Computer and Other Electronics manufacturing industry 22 less purchases of materials and supplier were made within the Bay Area region
Productivity continues to rise for most industries (1‐7) with a large increase for aviation and airline services (10) Notable declines in productivity include Ground Transportation (‐22) likely driven by increased competition from Transportation Network Companies (TNC) and Freight Aviation (‐3) likely due to changes in supply chain or delivery models
On‐line and non‐store sales continue to expand with a 17 growth in business sales and 4 growth in employment since the last study
5 This update is based on the Quarterly Census of Employment and Wages (QCEW) published by the US Bureau of Labor Statistics for 2012‐2013 for the nine‐county region
2017 Economic Impact Study of San Francisco International Airport 5
SFO is a major economic engine for the Bay Area economy Despite drop‐offs in multiplier impacts total business revenues associated with the airport has increased from $617 billion to $625 billion Despite increased productivity per worker in the region for most industries employment has increased from 295000 to over 300000 However it must be emphasized that these findings represent a partial update of the 2016 Study and do not account for any changes in the levels of airside employment or in spending per visitor (although the numbers of visitors are adjusted)
An increase in on‐airport employment has been driven by both lower job‐to‐sales ratios and increased sales Since the last study sales to job ratios for retail sales declined from $129000 per job to $127000 per job and from $92000 per job to $73000 per job for Ground Transportation These declines resulted in a higher number of jobs for the same amount of revenues In addition there was a strong increase in revenues associated with Transportation Network Companies (TNC) since the last study which also contributed to higher job impacts (see Chapter 3 ldquoOn‐Airport Impactsrdquo)
Other notable differences compared to the 2016 Study include increases in on‐airport employment driven by lower sales to job ratios Since the last study sales to job ratios for retail sales dropped from $129000 per job to $127000 per job The business sales to job ratio for Ground Transportation declined precipitously from $92000 per job in the previous study to $73000 per job in this study This decline in productivity consequently results in a higher number of jobs further supported by the growth in business sales associated with Transportation Network Companies (TNC) (see Chapter 3 ldquoOn‐Airport Impactsrdquo)
OVERVIEW
This report provides study findings of the economic impacts of San Francisco International Airport (SFO) This chapter introduces the study provides an overview of the methodology used and summarizes the airportrsquos overall economic contribution to the nine‐county Bay Area
Chapter 2 reviews the economic context of SFO and the Bay Area Chapters 3 through 7 describe the findings of the economic impacts generated by SFO Chapter 3 reports in detail the impacts derived from airport‐based activities as well as the impacts of the airportrsquos construction Chapter 4 describes the impacts of Bay Area visitors who arrive through SFO and spend money in the region Chapter 5 reviews the economic contribution of shippers who transport their goods to international and domestic markets via SFO These shippers are air‐reliant meaning that their businesses rely on air‐freight Chapter 6 presents tax impacts of on‐airport activities and visitor spending including key federal aviation taxes and municipal county and state revenues Chapter 7 outlines the distribution of on‐airport and visitor spending impacts for each county in the Bay Area region
The operation of SFO providing terminal and related services for air travelers and cargo movement is only one part of the Airportrsquos total regional economic impact Airport‐dependent businesses and airline travelers visiting the area for business or leisure support additional business activity within the Bay Area Together these on‐ and off‐site business activities fall into five categories
Airport‐based economic activities (airport terminal‐related and tenants)
Off‐airport businesses serving airport travelers
Off‐airport businesses dependent on SFO for cargo movement
2017 Economic Impact Study of San Francisco International Airport 6
Suppliers of goods and services to SFO and air‐dependent business and to off‐airport businesses that serve visitors This activity is off‐airport in the Bay Area
Re‐spending of worker income (supported by airport‐based activities visitor spending air‐dependent businesses and suppliers of goods and services) Almost all re‐spending is off‐airport in the Bay Area
The total economic contribution of SFO is the sum of the business activity directly associated with operation of the Airport and the spending of its users as well as the additional business activity associated with orders to suppliers and re‐spending of worker income The sum of on‐airport activities at SFO visitor spending by air visitors to the Bay Area and regional exports supported by air cargo exceeds $356 billion in direct business sales which in turn support nearly 165000 direct jobs that generates a $105 billion payroll Table 2 summarizes the economic contribution of SFO to the Bay Area economy by impact category
2017 Economic Impact Study of San Francisco International Airport 7
Table 2 Economic Contribution of SFO to the Bay Area
Impacts Airport
Generated Visitor
Spending Air‐
Related Total Impact
Jobs Direct 42828 96121 26078 165026 Indirect 14974 15268 20448 50689 Induced 20008 26893 37706 84606 Total Jobs 77809 138282 84232 300322
Business Revenue ($ millions) Direct $8409 $10540 $16722 $35671 Indirect $3070 $3067 $6068 $12204 Induced $3921 $4560 $6187 $14669 Total Business Revenue $15400 $18167 $28977 $62544
Labor Income ($ millions) Direct $2671 $3871 $4024 $10566 Indirect $1302 $1234 $2262 $4798 Induced $1476 $1685 $2409 $5570 Total Labor Income $5449 $6790 $8695 $20934
Avg IncomeEmployee ($yr) Direct $62400 $40300 $154300 $64000 Indirect $86900 $80800 $110600 $94700 Induced $73800 $62700 $63900 $65800 Weighted Avg IncomeEmployee
$70000 $49100 $103200 $69700
Notes On‐airport impacts include on‐airport construction activities in 2016 Totals may not add due to rounding
Sources SFO Survey of SFO Tenants Survey of SFO Passengers US Department of Commerce data provided by MIG Inc (IMPLAN) and WISERTrade using data from the US Census Bureau Foreign Trade Division Calculations by EDR Group
In addition to direct impacts on the economy indirect multiplier effects are associated with suppliers of goods and services to directly affected businesses and induced multiplier impacts are generated by re‐spending of additional worker income on consumer goods and services Counting direct indirect and induced impacts SFOrsquos contribution to the Bay Area economy is over 300000 jobs and $625 billion in business revenues of which $209 billion is labor income (payroll) Appendix I summarizes the economic impact methodology
2017 Economic Impact Study of San Francisco International Airport 8
AIRSIDE AND GROUNDSIDE AIRPORT JOBS
Based on a 2015 airport‐wide survey and SFO data from FY 20152016 an estimated 42828 people work at SFO6 This total includes 14962 employees of passenger airlines that serve the Airport7 The breadth of jobs at SFO involves
Airlines both passenger and cargo activities
Air terminal operation including security building maintenance and facility management (construction also included)
Public agencies such as the FAA US Departments of Immigration and Naturalization Customs Agriculture Fish and Wildlife and Drug Enforcement Agency as well as Airport Administration (including police and fire departments)
Airline support services including catering in‐flight entertainment aircraft handling fueling and maintenance
Freight services including courier delivery customs broker and trucking
Concessions including restaurants retail stores and passenger services
Ground transportation services including rental car taxi and limousine service and bus companies
OFF‐AIRPORT JOBS SERVING AIRPORT TRAVELERS
For the fiscal year ending in June 30 2016 SFO served over 514 million passengers which included 256 million enplanements Enplanements include persons transferring from one flight to another en route to their final destinations residents of the Bay Area who are traveling and non‐residents returning home after visiting the San Francisco region
The visitor spending analysis in this report measures the extent that SFO facilitates money brought from outside the Bay Area and spent in the Bay Area to support jobs in the hospitality sectors of the regional economy Transferring passengers and local residents two classes of SFO passengers are excluded from this analysis While transferring passengers may make purchases at the Airport between flights this spending is accounted in the revenues of terminal tenants Thus including their purchases as ldquovisitor spendingrdquo would be a double count In addition off‐airport spending by residents traveling through SFO also does not count as a regional economic impact since residents spend most of their money in the Bay Area anyway Moreover as with transferring passengers money spent in the terminal is included in the analysis of on‐airport employment
Overall over 26 million international passengers 63 million non‐Californian and 12 million Southern California visitors came to the Bay Area via SFO (see Table 3) These visitors spent more than $105 billion in the bay area region on hotels food and beverage retail purchases entertainment and local travel (taxis car rental and public transportation)
6 Includes jobs associated with capital construction 7 Total on‐airport employment includes the Virgin America airline headquarters located in Burlingame CA affiliated with SFO
2017 Economic Impact Study of San Francisco International Airport 9
Table 3 Visitors to the San Francisco Region arriving through SFO (year ending June 2016)
Market Passengers
Domestic Origin and Destination at SFO 29504670 Enplaned Passenger at SFO 14752335 Percent of Enplaned Passengers who are Visitors 5135 Number of Visitors 7575496 Domestic Visitors by Origin Percent Originating in California 1633 Domestic Visitors Originating in California 1237222 Domestic Visitors Originating in Rest of US 6338274 International Visitors Arriving via US Flag Airlines Origin and Destination at SFO 2630232 Enplaned Passenger at SFO 1315116 Percent of Enplaned Passengers who are Visitors 4270 Number of Visitors 561598 International Visitors Arriving via Non‐US Flag Airlines Origin and Destination at SFO 6509654 Enplaned Passenger at SFO 3254827 Percent of Enplaned Passengers who are Visitors 6209 Number of Visitors 2020781 Total International Visitors (US Flag and Non‐US Flag) 2582379 Total Visitors 10157875
Note This table does not include travelers using SFO to connect from one flight to another
Sources SFO Traffic Statistics US DOT OampD Survey 2015 US DOT T‐100 Database IATA PaxIS Database US DOC International Air Travel Statistics 2015 US DOC National Travel and Tourism Office (NTTO)
RELATED INDUSTRIES JOBS THAT RELY ON AIR CARGO
In the calendar year 2016 commodities valued at roughly $268 billion were shipped to international and domestic destinations from SFO Of this total value about $168 billion originated in the Bay Area
Products originating in California and shipped internationally from SFO primary consist of technology goods Three commodity groups account for an estimated 83 of total value exported internationally which include electrical machinery industrial machinery (including computers) and optics and instruments with the remaining value spread cross aircraft manufacturing pharmaceutical products chemicals plastics and other commodities Figure 1 presents the value of California exports through SFO and all of California air exports This figure highlights that between 38 and 58 of Californiarsquos three leading exported commodities are shipped through SFO
2017 Economic Impact Study of San Francisco International Airport 10
Figure 1 International Exports Shipped from SFO and California by Industry Sector
Sources WISERTrade using data from the US Census Bureau Foreign Trade Division and the Freight Analysis Framework Calculations by EDR Group
Table 4 below presents how SFO ranks among the top five airports for these same three commodities groups previously mentioned SFO ranges between 8‐13 of national exports and ranks between second and sixth nationally for electric machinery industrial machinery (including computers) and opticalsurgical instrument exports
Table 4 Airport Ranking for Top Three Exported Commodities by Percent of Total
Electric Machinery Sound and TV Equip
Industrial Machinery (Incl Computers)
Optic Photo and Medic Surgical Instruments
Airport Total Airport Total Airport Total LAX 126 JFK 133 ORD 137 MSY 120 SFO 125 LAX 106 SFO 104 LAX 99 JFK 98 DFW 98 MIA 95 MSY 97 CLE 92 ORD 93 CLE 89 MIA 85 DFW 89 SFO 79 Total ($ millions) $89560 Total ($ millions) $65003 Total ($ millions) $59933
Source WISERTrade
In 2016 domestic outbound shipments from SFO totaled $83 billion and consisted primarily of electronics precision instruments pharmaceuticals motorized vehicles and machinery as shown in Figure 2
2017 Economic Impact Study of San Francisco International Airport 11
Figure 2 Domestic Outbound Air Shipments from SFO
Source FHWA Freight Analysis Framework (FAF)
2017 Economic Impact Study of San Francisco International Airport 12
CHAPTER 2 NATIONAL CONTEXT
The air transportation industry is a significant contributor to the US economy both in terms of output and employment In 2016 for instance the sector generated $1054 billion in gross domestic product (GDP) and was responsible for employing 437000 full‐time equivalent (FTE) workers in 20158 The role of air transportation extends well beyond industry operations alone however air travel indirectly stimulates both the global and national economy by facilitating trade and transporting passengers
San Francisco International Airport (SFO) is the largest airport in the Bay Area the seventh largest in the United States and the 21st largest in the world in terms of air‐passenger traffic9 When combined with Oakland International Airport and Mineta San Jose International Airport the three together constitute the sixth largest domestic passenger market in the US (as measured by enplanements)10 In FY 2016 SFO served 397 million total domestic passengers (enplaned and deplaned) capturing 65 of domestic Bay Area market share Meanwhile SFO had an international Bay Area market share of 93 with over 117 million international passengers served (enplaned and deplaned)11
This section outlines the role that SFO plays in facilitating domestic and international trade The role of SFO contributing to the regional economy as a domestic and international gateway for air cargo shipments from the Bay Area nine‐county region is presented in Chapter Six
CONTEXT THE VIBRANT BAY AREA ECONOMY
The 6900‐square mile nine‐county Bay Area (see Figure 3) is home to 77 million residents which accounts for 20 of Californiarsquos population12 The Bay Arearsquos population density of over 1100 people per square mile of land is more than four‐times the California average By itself the region would be the nationrsquos 13th most populous state falling between Washington at 73 million and Virginia at 84 million residents13 Moreover the per‐capita income of Bay Area residents is 42 above the California average and 58 above the national average14
8 US Department of Commerce Bureau of Economic Analysis Industry Economic Accounts Interactive Tables available at httpwwwbeagovindustryindexhtm as of May 2017 (National Data GDP amp Personal Income NIPA Table 65D FTE by Industry) GDP data is for 2016 while employment data is for 2015
9 2016 SFO Annual Report (2015 data) San Francisco CA San Francisco International Airport httpmediaflysfocoms3amazonawscommedia2016_Annual_Report_Finalpdf Airports Council International
10 Federal Aviation Administration Passenger Boarding (Enplanement) and All‐Cargo Data for US Airports 2015 11 2016 SFO Annual report SFOrsquos total Bay Area market share including both domestic and international passengers was 70
(or 514 million passengers) in FY2016 12 US Census 2016 13 Ibid 14 Based on data from the Bureau of Economic Analysis (BEA) in 2015
2017 Economic Impact Study of San Francisco International Airport 13
Figure 3 Illustration of the Bay Area by County
Source Data ndash RITA NTAD (National Transit Atlas Database) Graphic ndash EDR Group
Some of the largest and fastest growing companies in the country that make the region home fuel the economy of the Bay Area Twenty‐eight of the global Fortune 500 and 29 of the US Fortune 500 are headquartered locally Both of these groups represent more than $10 trillion in sales Since 2011 no Fortune 500 companies have relocated from the Bay Area and a new entrant data management and cloud services provider NetApp has joined the list Beyond just large companies the Bay Area is home to 25 of the Inc Fastest Growing 500 list collectively accounting for over $1 billion in sales The Bay Area is also home to three of the top ten global companies ranked by market capitalization including the two most valuable companies in the world Apple and Google If the Bay Area were a country it would be the 19th largest economy in the world with a gross regional product that falls between the gross domestic products of Turkey (18 among nations) and Switzerland (20)15
This generally high‐income level is supported by competitive economic strengths in the national and global economies The Bay Area is a national center for business innovation and technology while the city of San Francisco is one of the United Statesrsquo leading domestic and international tourist destinations Silicon Valley located in Santa Clara County is renowned as the countryrsquos technology (hardware and software) capital Other leading industries include financial activities pharmaceutical and medicine
15 Source Bay Area Council Economic Institute of the Bay Area Council Bay Area Fast Facts (wwwbayareaeconomyorg)
2017 Economic Impact Study of San Francisco International Airport 14
manufacturing professional scientific and technical services information services and higher education as well as hospitality related industries
These core strengths of the Bay Area economy have specialized air service needs that are served by San Francisco International Airport16 The high‐tech and pharmaceutical manufacturing knowledge based service sectors hospitality and agricultural industries rely on air services much more than other sectors for both passenger and cargo travel needs for the following reasons
Products produced tend to be high‐value delicate and time‐sensitive and need to be shipped by air Typically these are technology‐related products where value reflects high labor costs and precision manufacturing but may also be perishable agricultural products (including fish and meat)
Products that are heavy to ship but that carry a large return on transportation costs invested including just‐in‐time manufacturing and equipment needed to maintain high yielding production
Business and professional services depend on the sale of professional expertise which often requires travel to meet with clients and make presentations
Companies have statewide western national and even global business networks requiring frequent and often international travel between various offices
Airports serve resorts and tourist destinations
Producers of high‐tech products business services and computer‐oriented firms are among the industries that spend the most money on air services Most of these industries spend at least 40 more on air services than the average industry in the United States and a few spend 50 or more than the average of all industries in the United States17
SFOrsquoS ROLE IN INTERNATIONAL TRADE
Given its proximity to Asia markets SFO has historically played an important role in international trade Over the past decade the Airport experienced a trend in export activity like airports across the country (Table 5) From 2009 to 2016 the total air value of exports18 passing through SFO grew at an average annual rate of 35 from $21 billion to $268 billion The value of exports at all US airports (including SFO) rose from $3344 billion to $4370 billion or 39 annually during the same period
Despite being one of three commercial service airports within the region SFO now accounts for a majority of all export value that flies out of the Bay Area (Table 5) In 2016 Oakland International Airport exported $321 million worth of commodities with an annual average growth rate of 103 from 2009 to 2016 San Jose International Airport exported an air value of $390 million in 2014 and experienced an annual average growth rate of 56 from 2009 to 2014 The value of international air exports from San Jose International
16 The following is based on research conducted for Aviation Cooperative Research Program 03‐28 The Role of US Airports in the National Economy for the Transportation Research Board of the National Academies published as ACRP Report 132
17 Ibid 18 These are the value of the goods at the US port of export The value shall be the selling price (or the cost if the goods are
not sold) including inland or domestic freight insurance and other charges to the US seaport airport or land border port of export
2017 Economic Impact Study of San Francisco International Airport 15
rose from $106 billion in 2015 to $22 billion in 2016 an increase of 103 This rise in exports is driven primarily by aircraft and spacecraft exports which grew from $783 million in 2015 to $17 billion in 2016 However as of March 2017 only $85 million has been shipped indicating uncertainty whether additional exports will materialize throughout the year
Table 5 Air Value of US and Bay Area Export by Airport 2009‐2016
Airport 2009 2010 2011 2012 2013 2014 2015 2016
SFO $210 $274 $265 $261 $281 $274 $253 $268
SJC $03 $03 $03 $04 $05 $04 $11 $22 OAK $02 $02 $02 $02 $03 $04 $03 $03 Total from Bay Area International Airports
$215 $280 $270 $268 $289 $282 $266 $293
Source US Census Bureau Foreign Trade Division provided by WISERTrade
EXPORT COMMODITIES
While SFO serves as the gateway for a host of commodities the Airportrsquos top exports reflect the strengths of the Bay Area regional economy (Table 6) In 2016 electric machinery sound equipment and TV equipment exports alone were valued at $93 billion or over 35 of the total value exported through the Airport reflecting a resurgence in growth since the low value of $79 billion in exports in 2015 Other major commodities such as machinery and computers opticphotomedical instruments pharmaceutical aircraft manufacturing plastics and agriculture sector exports have been growing in both value and weight since 2009 By measure of air weight edible fruits and nuts topped the list of export commodities at SFO in 2016 at 28 thousand metric tons or 20 of the Airportrsquos total Industrial machinery (including computers) electric machinery and optic photo and medical instruments also constituted a significant share of the commodity weight exported on SFO flights in 2016 Since 2009 SFO has witnessed double‐digit growth in the export of meat exports by volume with an annual average increase of 204 over the past seven years
2017 Economic Impact Study of San Francisco International Airport 16
Table 6 Top Ten SFO Export Commodities by Air Value and Weight 2016
BY AIR VALUE
Rank Commodity Air Value (In $Ms)
Change (2009‐2016)
Annual Change (2009‐
2016) 1 Electronic Machinery SoundTV Equip $9326 6 09 2 Machinery and Computers $8096 57 67 3 OpticPhotoMedical Instruments $4741 26 34 4 Pharmaceutical Products $1480 81 89 5 Aircraft Spacecraft and Parts $530 10 14 6 Miscellaneous Chemical Products $467 ‐4 ‐05 7 Plastics $208 96 101 8 Edible Fruit and Nuts $174 55 65 9 Organic Chemicals $164 66 75 10 Tanning Dye Paint and Paint $132 21 28
All Others $1509 34 43
All Commodities $26828 28 36
BY AIR WEIGHT
Rank Commodity Air Weight (In 000s of Metric Tons)
Change (2009‐2016)
Annual Change
(2009‐2016) 1 Edible Fruit and Nuts 280 24 31 2 Machinery and Computers 271 17 23 3 Electric Machinery SoundTV Equip 184 7 10 4 OpticPhotoMedical Instruments 105 8 11 5 Vegetables Roots and Tubers 44 18 24 6 Articles of Iron or Steel 41 22 29 7 Plastics 40 5 06 8 Meat 36 267 204 9 Miscellaneous Chemical Products 33 ‐16 ‐25 10 Essential Oils Perfumes amp Cosmetics 25 ‐1 ‐02
All Others 1432 ‐1 ‐02 All Commodities 1433 1116 15
Source US Census Bureau Foreign Trade Division provided by WISERTrade
IMPORT COMMODITIES
SFO also serves as the entryway to the Bay Area for many commodity types (Table 7)19 Valued at $127 billion commodities in electric machinery soundTV equipment topped the Airportrsquos list of most valuable imports in 2016 These commodities when combined with those in the industrial machinery including computers optic photographic and medical instruments accounted for 79 of the Airportrsquos
19 US district and port data do not reflect state of origin or destination but indicate pass‐through location only There are no data available on state imports because it is impossible to tell the ultimate destination once goods enter the country
2017 Economic Impact Study of San Francisco International Airport 17
total import value in 2016 Pharmaceuticals chemical products pearlsstonesmetalscoins photo or cinema goods also constituted a significant portion of total import value at SFO last year while fish apparel plastics and vehicles comprised most of the Airportrsquos total import weight beyond typical electric‐related commodities
Pharmaceuticals experienced strong growth over the last seven years not only as an export commodity but also as an import to SFO (Table 7) Between 2009‐2016 the value of import commodities in this category grew by 620 or 326 annually up to $11 billion in 2016 All of the top commodity types by value increased over this period while apparel (not including knit) and vehicles declined in volume during the same period
2017 Economic Impact Study of San Francisco International Airport 18
Table 7 Top Ten SFO Import Commodities by Air Value and Weight 2016
BY AIR VALUE
Rank Commodity Air Value (In $Ms)
Change (2009‐2016)
Annual Change
(2009‐2016) 1 Electric Machinery SoundTV Equip $12703 51 61 2 Machinery and Computers $6990 19 26 3 OpticPhotoMedical Instruments $2269 55 65 4 Special Classification $1578 67 76 5 Pharmaceutical Products $1114 620 326 6 Miscellaneous Chemical Products $546 38 47 7 PearlsStonesMetalsCoins $213 21 27 8 Photo or Cinema Goods $198 61 70 9 Apparel (not including knit) $147 0 00 10 Vehicles (except rail or tramway) $144 88 94
All Others $1847 76 84 All Commodities $27749 48 57
BY AIR WEIGHT
Rank Commodity Air Weight (In 000s of Metric Tons)
Change (2009‐2016)
Annual Change
(2009‐2016) 1 Electric Machinery SoundTV Equip 385 34 43 2 Machinery and Computers 381 ‐10 ‐16 3 Fish Crustaceans and Aquatic 96 168 151 4 OpticPhotoMedical Instruments 84 11 15 5 Apparel (including knit) 56 27 34 6 Apparel (not including knit) 51 ‐4 ‐06 7 Plastics 45 64 74 8 Vehicles (except rail or tramway) 41 ‐2 ‐04 9 Special Classification 39 31 40 10 Furniture Bedding amp Lamps 37 395 257
All Others 432 79 87 All Commodities 1648 30 38
Source US Census Bureau Foreign Trade Division provided by WISERTrade Trade with Asia
SFO is a national gateway in terms of trade with Asia20 In 2016 the Airport was the third busiest in the nation in terms of trans‐pacific trade serving as the pass‐through port for $199 billion in total Asia export value which has grown from $154 billion in 2009 and peaked at $22 billion in 2013 (Figure 4) When measured by tonnage exported to Asia SFO ranked fourth among US airports each year since 2009 behind Chicago OrsquoHare International (ORD) Los Angeles International (LAX) and John F Kennedy International (JFK)
In 2016 Asia export value accounted for 74 of the Airportrsquos total export value This reliance on Asia exports has been consistent at SFO During the 2009‐2016 timeframe SFO and JFK alternated as the lead
20 Defined here as the Asia continent excluding the Middle East and Turkey
2017 Economic Impact Study of San Francisco International Airport 19
US airport in in terms of value per exported ton but in 2016 have both been surpassed by DFW as shown in Figure 5 Led by industrial machinery electrical machinery and optical instruments the value of exports to Asia through SFO averaged about $200000 per ton in 2016
Figure 4 Top Five Airports by Air Value of Exports to Asia 2009‐2016
Source US Census Bureau Foreign Trade Division provided by WISERTrade
Figure 5 Top Five Airports by Air Value per Ton of Exports to Asia 2009‐2016
Source US Census Bureau Foreign Trade Division provided by WISERTrade
TOTAL TRADE
In 2016 SFO facilitated nearly $546 billion of international trade (imports and exports) which required the transport of over 308000 metric tons of cargo The largest trading partners of US companies that
2017 Economic Impact Study of San Francisco International Airport 20
use SFO are in order of air value China Japan Malaysia Taiwan the Republic of Korea and Singapore Trade between the US and these six nations accounted for 70 of the value and 61 of tonnage of commodities moved through SFO As displayed in Table 8 the Airport enabled trade of a billion dollars or more with 12 different nations in 2016 and nine of them are in Asia Germany is the largest non‐Asia market connected through SFO
Table 8 Countries that Traded Commodities with Total Value More than $1 Billion in 2016 through SFO In Order of Value of Trade
Trading Partner Value of Trade 2016 (in $Mrsquos)
Percent of Total SFO Air Trade
Metric Tons 2016
Percent of Total
Tonnage China $11535 21 69938 23 Japan $6696 12 41294 13 Malaysia $6192 11 9601 3 Taiwan $5026 9 29460 10 Korea Republic Of $4913 9 23644 8 Singapore $4010 7 13958 5 Germany $2094 4 11614 4 Hong Kong $1628 3 9865 3 Thailand $1359 2 4773 2 Switzerland $1235 2 4691 2 Philippines $1118 2 2555 1 Ireland $1022 2 2627 1 Other (224 countries) $7749 14 84040 27 Total $54577 100 308060 100
Source US Census Bureau Foreign Trade Division provided by WISERTrade
2017 Economic Impact Study of San Francisco International Airport 21
This Page Left Blank Intentionally
2017 Economic Impact Study of San Francisco International Airport 22
CHAPTER 3 ON‐AIRPORT IMPACTS
DIRECT EMPLOYMENT
In 2016 nearly 41000 people were employed at SFO (excluding employment generated by temporary construction expenditures) according to data from the surveys of airport management and tenants In addition to 14900 employees of passenger airlines the Airport supports a wide variety of other aviation‐related jobs in transportation retail and government services These jobs involve
Freight services including dedicated cargo aviation courier delivery custom broker and trucking
Air terminal operations including security building maintenance and facility management
Airline support services including catering in‐flight entertainment aircraft handling fueling and maintenance
Concessionaire services including restaurants and retail stores
Ground transportation including rental car taxis and limousines
Figure 6 shows the distribution of jobs at SFO by major function Roughly 48 of airport jobs are directly aviation related which includes passenger and freight airlines and aviation support services (eg in‐flight catering firms and fixed‐base operators) The Airport Commission and contractors federal agencies such as the FAA and the TSA and other administrative functions account for 16 of on‐airport employment Terminal concessions account for 12 of employment while ground transportation also accounts for 18 of total full time and part time jobs
Figure 6 Distribution of On‐Airport Tenants and Administrative Jobs
Passenger Airlines 37
Admin Gov Security 16
Ground Transp 19
Terminal Concessions
12
Aviation Support 10
Rental car 5
Freight Transp 1
Sources Interviews of tenants and airport administration
2017 Economic Impact Study of San Francisco International Airport 23
BUSINESS SALES AND PAYROLL
In 2016 SFO business establishments generated $80 billion of business revenues (business sales and government budget expenditures) which included over $25 billion of payroll for nearly 40800 workers at the Airport (see Table 9)
Table 9 Direct Impacts of On‐Airport Tenants and Administrative Employees
Impact Type Employment Payroll Revenues
Direct Effect 40787 $2526045000 $8042483000
Note Data excludes on‐airport construction activities in 2016 Source Airport Tenant Survey and data from the US Department of Commerce aggregated through IMPLAN
Payroll was calculated from a hybrid of the survey responses and average revenues and wages per worker by economic sector in the Bay Area21 Findings from this analysis show that passenger airlines represent 37 of employment at SFO but also account for 45 of labor income earned by workers and 61 of revenues generated on the Airport Passenger Airlines was the only sector with a higher percentage of total labor income and productivity (revenues) than employment across all sectors as shown in Figure 7 Moreover the average payroll for on‐airport workers was $62000
Figure 7 Percent of Relative Employment Labor Income and Revenues by Aggregated Sector on SFO
70
0
10
20
30
40
50
60
Jobs Business Sales Labor Income
Passenger Admin Gov Ground Terminal Aviation Rental car Freight Other Airlines Security Transp Concessions Support Transp
Sources Interviews of tenants and airport administration US Department of Commerce data provided by IMPLAN Calculations by EDR Group
21 Survey respondents were asked for payroll When it was not provided the survey data were supplemented with US Department of Commerce data for appropriate industry sectors for each employer aggregated by the Minnesota IMPLAN Group (MIG Inc)
2017 Economic Impact Study of San Francisco International Airport 24
INDIRECT AND INDUCED IMPACTS
The direct economic activities at SFO lead to additional downstream impacts on suppliers as well as re‐spending of worker income To calculate the impacts of these effects indirect and induced multipliers were calculated for each of the categories listed in Table 10
Table 10 Direct Employment Labor Income and Business Revenues for Tenant and Administrative SFO
Classification of Activity by Sector Employment Payroll Revenues
Passenger Services amp Airport Administration
OtherNon‐Profit 93 $5449000 $12763000 StateLocal Government 93 $6998000 $15636000 Parking and Miscellaneous 232 $15853000 $30350000 Management MaintCleaning amp Facilities Services 339 $35846000 $79634000 Federal Government 1814 $223187000 $326720000 City of San Francisco Airport Commission 1998 $257567000 $300062000 Security Firms 2011 $101198000 $136874000 FBOs General Aviation and Aviation Services 4062 $180244000 $418961000 Airport Retail and Concessions 4904 $171696000 $626054000 Passenger Airlines 14962 $1148294000 $4896253000 Sub Total 30507 $2146332000 $6843307000
Freight Transportation Services Freight Airlines and Couriers 485 $31351000 $119587000
Passenger Ground Transportation Services LimosBusesVansTransit 2618 $85443000 $190926000 Taxi Cabs 2809 $91686000 $204877000 Transportation Network Companies (TNCs) 2131 $69544000 $155400000 Rental Car 2238 $101689000 $528386000 Sub Total 9375 $334665000 $1048981000
Total Airport‐Based 40787 $2526045000 $8042483000
Notes Data excludes on‐airport construction activities conducted in 2016 Dollars rounded to the nearest thousand Columns may not add due to rounding
Sources Interviews of tenants airport administration and US Department of Commerce data provided by IMPLAN Calculations by EDR Group
In 2016 the direct economic activities on‐airport generated an additional $67 billion in business revenues in the Bay Area (indirect and induced effects) supporting over 33000 additional jobs and $26 billion in labor income (payroll) The total economic contribution of on‐airport activity to the Bay Area is roughly $147 billion in revenues yielding nearly 74200 jobs and $52 billion in labor income for workers (see Table 11) Suppliers of goods and services generated approximately $29 billion in revenues over 14000 jobs and expended over $12 billion on payroll (indirect impacts) The re‐spending of labor income by workers on airport and supplier firms supported nearly 19000 additional Bay Area jobs with over $14 billion in payroll and $37 billion in new business sales
2017 Economic Impact Study of San Francisco International Airport 25
Table 11 Summary of Direct Indirect and Induced Economic Impacts of SFO in Bay Area
Economic Impacts Employment Payroll Revenues I Direct Impact Airport‐Driven Activity Airport‐Based 40787 $2526045000 $8042483000 II Indirect Impact Suppliers of Goods and Services Due to Airport and Related Activities 14330 $1252520000 $2947530000 III Induced Impact Re‐Spending of Worker Income Due to Airport and Related Activities 19047 $1415986000 $3758072000 Total Regional Impact 74164 $5194551000 $14748085000
Notes Dollars rounded to the nearest thousand Columns may not add due to rounding
Sources Interviews of tenants airport administration and US Department of Commerce data provided by IMPLAN Calculations by EDR Group
On‐airport businesses purchase supplies and services from the greater Bay Area economy which is highly concentrated in air‐reliant services22 transportation support other services and food and beverage industries which combined represent 71 of all supporting industries (Table 12) The wages spent by employees of on‐airport businesses for their daily living needs are primarily spent on service sectors food and beverages and retail which combine to be 74 of all purchases made within in the Bay Area economy as indicated in Table 13
Table 12 Supplier of GoodsServices Industries (Indirect)
Industry Employment of Total
Air‐reliant services 3042 21 Other Services 3017 21 Transportation Support 2951 21 Food amp Beverage 1128 8 Couriers 681 5 Wholesale Trade 602 4 State amp Local Government 499 3 Manufacturing 419 3 Construction 318 2 Banking amp Financial Services 269 2 All Others 1404 10 Total 14330 100
Sources US Department of Commerce data provided by IMPLAN Calculations by EDR Group
22 Air‐reliant services include architectural engineering business support computer systems design services facility support financial services management scientific technical services and consulting These sectors purchase large amounts of air transportation services Other Services include insurance rentalleasing building services landscaping waste management medical social and maintenance and repair A full listing is in Appendix I
2017 Economic Impact Study of San Francisco International Airport 26
Table 13 Re‐Spending of Worker Income Industries (Induced)
Industry Employment of Total
Services 6553 34 Food amp Beverage 2855 15 Reliant Services 2425 13 Retail 2277 12 Entertainment 734 4 Wholesale Trade 561 3 Banking amp Financial services 438 2 Manufacturing 292 2 State amp Local Government 253 1 All Others 2661 14 Total 19047 100
Sources US Department of Commerce data provided by IMPLAN Calculations by EDR Group
ON‐AIRPORT CONSTRUCTION
SFO provided a summary of all capital projects from FY 1314 to FY 1516 The summary of projects was provided in eight categories of expenditures including terminal airport support groundside environmental parking safety amp security airfield and utility improvements An analysis over multiple years is preferable to smooth‐out annual fluctuations that are typically seen in construction spending The objective of this approach is to estimate economic impacts of construction at SFO for a ldquotypical yearrdquo to mitigate the short‐term investment periods associated with single construction projects
Each type of expenditure is matched to the most appropriate industry sector in the IMPLAN modeling package as described in Table 14
Table 14 Sector Mapping
SFO Capital Construction Category IMPLAN Sector
Description
Terminal improvements Construction of nonresidential structures
Airport support improvements Facilities support services
Groundside improvements Maintenance and repair (roadway amp taxiway)
Environmental improvements
Maintenance amp Repair (nonresidential) Parking improvements
Safety amp security improvements
Airfield improvements
Utility improvements Water sewage and other systems
Source SFO and US Department of Commerce data provided by IMPLAN
2017 Economic Impact Study of San Francisco International Airport 27
After classifying each of the five expenditure categories into the corresponding IMPLAN sector these economic impacts of the capital investments were estimated for the nine Bay Area counties for an average year from FY 1314 ndash FY 1516 (Table 15)
Table 15 Annual Average Impacts from SFO Construction on the Bay Area Economy
Impact Type Employment Labor Income Expenditures Direct Effect 2041 $144669000 $366782000 Indirect Effect 644 $49244000 $122327000 Induced Effect 961 $60104000 $163281000 Total Effect 3645 $254017000 $652390000
Notes Dollars rounded to the nearest thousand Columns may not add due to rounding
Source Employment and Labor Income derived using IMPLAN
2017 Economic Impact Study of San Francisco International Airport 28
CHAPTER 4 VISITOR SPENDING
In the year ending June 2016 526 of domestic and international air travelers arriving at SFO were non‐residents visiting the region (representing 102 million of the 193 million origin and destination (OampD) enplanements at the Airport excluding connecting passengers) SFO traffic statistics and national data sets from the Department of Transportation show that that 26 of all visitors were international visitors 12 were Southern California residents served by four airports and 62 were visitors from other parts of the United States Surveys of air travelers indicate that 70 of visitors traveled for personal reasons to the Bay Area and 30 for business reasons The survey also shows that the trip purposes of domestic travelers are more likely to be business related than for international travelers (Figure 8)
Figure 8 Profile of Air Visitors Arriving via SFO by Place of Origin
Sources Visitor Survey Conducted by Polaris Inc SFO Traffic Statistics US DOT OampD Survey US DOT T‐100 Database IATA PaxIS Database US DOC National Travel and Tourism Office (NTTO) Calculations by EDR Group and ICF
2017 Economic Impact Study of San Francisco International Airport 29
VISITOR SPENDING
The survey of arriving visitors found that on average international visitors spend $1234 in the Bay Area and domestic US visitors spend $1024 per trip The breakdowns by trip origin and trip purpose (business or labor) are shown in Figure 9
Figure 9 Relative Spending of Visitors per Trip by Origin and Purpose
Sources Visitor Survey Conducted by Polaris Inc Calculations by EDR Group
Overall the off‐airport spending of the 102 million domestic and foreign visitors who arrived through SFO visitor amounted to nearly $111 billion of which approximately $105 billion was in the Bay Area and an additional $585 million was outside the Bay Area23 This encompasses spending on hotels food and beverage retail purchases entertainment and recreation and local travel (eg taxis car rental24 sight‐seeing trips and public transportation) The breakout of visitor spending by sector is shown in Table 16
Table 16 Off‐Airport SFO Visitor Spending Inside and Outside of the Bay Area
Sector Total within Bay Area Total Outside Bay Area Total
Accommodations $4515536000 $263822000 $4779358000 Food and Beverage $2407541000 $128195000 $2535735000 Retail $1769840000 $90393000 $1860234000 Entertainment $831216000 $44525000 $875740000 Car Rental $714078000 $50036000 $764114000 Ground Transportation $301415000 $7788000 $309203000 Total $10539626000 $584759000 $11124384000
Note Dollars are rounded to thousands
Sources SFO Traffic Statistics and national data sets from the Department of Transportation Visitor Survey Calculations by EDR Group
23 Visitor surveys conducted at SFO indicated if spending occurred within the Bay area or in surrounding counties 24 On‐airport car rentals are included in the On‐airport tenant estimates Car rentals off‐airport is included in the Visitor Spending
estimates
2017 Economic Impact Study of San Francisco International Airport 30
JOBS AND INCOME GENERATED BY OFF‐AIRPORT VISITOR SPENDING
The $111 billion spent in 2016 by visitors arriving through SFO supported over 138000 jobs within the Bay Area and an additional 8500 jobs supported by visitor spending outside the Bay Area in other counties in California
Table 17 Breakdown of Total Visitor Spending Impacts
Impact Type Employment Payroll Visitor Spending Total Visitor Spending Impacts in Bay Area Direct 96121 $3870828000 $10539626000 Indirect 15268 $1234317000 $3066523000 Induced 26893 $1685335000 $4560386000 Total 138282 $6790480000 $18166535000 Total Visitor Spending Impacts Outside of the Bay Area Direct 5731 $198297000 $584759000 Indirect 1185 $70593000 $205456000 Induced 1596 $79311000 $239010000 Total 8511 $348201000 $1029225000 Total Visitor Spending Impacts Due to SFO Direct 101852 $4069125000 $11124385000 Indirect 16452 $1304910000 $3271979000 Induced 28489 $1764646000 $4799396000 Total 146793 $7138681000 $19195760000
Notes Jobs include employees and proprietors Payroll includes wages profits and value of benefits
Sources Visitor Survey conducted by Polaris Inc SFO Traffic Statistics and national data sets from the Department of Transportation Calculations by EDR Group
The IMPLAN modeling package was tailored to the nine‐county Bay Area and the rest of California to calculate direct jobs and wages from visitor spending in the region and to capture spending in the remaining counties of California In the initial stage of the analysis spending profiles were developed as shown in Table 16 (lodging food and beverage entertainment retail and local ground transportation) were used in the initial stage of the analysis25 The first step was to apply business sales (the actual visitor spending) to worker ratios to estimate employment generated by visitor spending The second step involved applying payroll to worker ratios to these employment estimates to calculate the how much labor income is generated for each of the five categories of spending These ratios are summarized in Table 18 and the applied calculations are as follows
1 Step 1 Employment Generated by Visitor Spending = Visitor SpendingBusiness Sales per Worker (by sector)
2 Step 2 Labor Income Generated by Visitor Spending = Workers (calculated in Step 1 above) Labor Income per Worker (by sector)
25 IMPLAN packages data from federal agencies on a county basis including the US Department of Commerce and the US Department of Labor EDR Group developed the sectors that reflect visitor spending and aggregated the counties to build the Bay Area region and Outside‐Bay Area region
2017 Economic Impact Study of San Francisco International Airport 31
Table 18 Earnings and Sales per Worker
Sector Payroll per Worker
Sales per Worker
Ground Transportation $56195 $116579 Car Rental $45823 $233176 Accommodations $47874 $119611 Retail $41257 $83847 Entertainment $36507 $88861 Food amp Beverage $31016 $65252
Notes Payroll (labor income) includes wages and profits Retail Sales per worker are margined sales
Sources US Departments of Commerce of Labor data provided by IMPLAN Calculations by EDR Group
INDIRECT AND INDUCED IMPACTS
Activities serving air travelers or visitors outside of the Airport (see Table 16) also generate additional orders for goods and services from suppliers These include orders for
Fuel and maintenance services by off‐airport taxis rental cars tour buses and public transportation
Accounting fees paid by businesses in hospitality industries
Food products for off‐airport restaurants
Wholesale merchandise to be sold by off‐airport stores
Furniture and equipment for off‐airport hotels restaurants and stores
These orders in turn support additional employment and wages in the Bay Area Supplier orders support payroll to workers of these supplier businesses Workers then spent this income on consumer purchases such as
Retail purchases for consumer items such as food clothing home furnishings and cars
Purchases of health care and childcare services
Rent and mortgage payments and other housing costs
In 2016 the multiplier effects of spending by air visitors to the Bay Area generated an additional $76 billion in business revenues in the region supporting 42000 additional jobs and provided over $29 billion in total payroll expenditures
Including initial visitor spending indirect supplier purchases and spending of earned income by workers in visitor services industries the total economic contribution of SFO visitors to the Bay Area totaled roughly $182 billion in revenues yielding over 138000 jobs and nearly $68 billion in payroll (see Table 19) Suppliers of goods and services generated approximately $30 billion of revenues 15000 jobs and $12 billion of Labor income (indirect impacts) The re‐spending of earnings supported $46 billion of revenues nearly 27000 jobs and close to $17 billion of labor income (induced impacts)
2017 Economic Impact Study of San Francisco International Airport 32
Table 19 Summary of Direct Indirect and Induced Economic Impacts of the Contribution of Visitor Spending in the Bay Area
Economic Impact Business Revenues Payroll Jobs
I Direct Impact Visitor Spending Activity Direct Visitor Spending $10539626000 $3870828000 96121 II Indirect Impact Suppliers of Goods and Services Due to Visitor Spending Off‐Airport $3066523000 $1234317000 15268 III Induced Impact Re‐Spending of Worker Income Due to Visitor Spending Off‐Airport $4560386000 $1685335000 26893 Total Regional Impact in Bay Area $18166535000 $6790480000 138282
Notes Dollars rounded to thousands Columns may not add due to rounding
Sources SFO Traffic Statistics and national data sets from the Department of Transportation Visitor Survey US Department of Commerce data provided by IMPLAN IMPLAN multiplier package Calculations by EDR Group
2017 Economic Impact Study of San Francisco International Airport 33
This Page Left Blank Intentionally
2017 Economic Impact Study of San Francisco International Airport 34
CHAPTER 5 IMPACTS OF AIR RELIANT USERS
(FREIGHT SHIPPERS)
For this study ldquoreliant usersrdquo are defined as manufacturers and agricultural industries that ship products by air through SFO26
THE ROLE OF SFO IN AIR EXPORTS
SFO plays a critical role in Californiarsquos economy by enabling manufacturers and agricultural producers to transport commodities and finished goods to customers in both domestic and international markets This section on air reliant activities signifies the contribution of SFO to economic development in the Bay Area by enabling regional firms to sell products across the US and the world and thereby maximize shares of national and international trade Without the services offered at SFO (and if the similar scale of air services is not taken up by another regional airport) companies in the Bay Area that produce and ship products would find markets limited and market shares curtailed In turn economic activity in the Bay Area that is associated with production of goods shipped through SFO would be reduced
A review of the products shipped from the Bay Area through SFO provides an insight into the cross‐section of the economy that is reliant on‐air cargo services at SFO in particular Silicon Valley located in Santa Clara county and home to major technology companies and start‐ups This analysis is based on industry specific data from the Foreign Trade Division of the US Census Bureau and the Freight Analysis Framework of the US DOT (Federal Highway Administration) and economic output by industry from the US Bureau of Economic Analysis (collected by the Minnesota IMPLAN Group)27
INTERNATIONAL EXPORTS
SFO is a gateway for the Bay Area manufacturing and other industries to deliver their products to customers throughout world To assess the role that SFO plays in exports from the Bay Area the following methodology was applied According to data from the Foreign Trade Division (collected by WISERTrade) 25 of all California air exports that originated in California passed through SFO This percentage was applied to all industry sectors (three‐digit NAICS) to estimate the value and types of Californian exports going through SFO To isolate the Bay Area specific exports the ratio of Bay Area output to total California output was calculated using US Bureau of Economic Analysis (BEA) data and applied to California exports going through SFO28 The results represent estimates of international exports by industry that are produced by Bay Area businesses and exported for sale through SFO This methodology is further explained in Appendix I
Air‐freight shipped from SFO is overwhelmingly concentrated in technology goods produced in the Bay Area The leading export industry is Computer and Electronics manufacturing which accounts for nearly
26 This definition is based on past SFO Economic Impact Studies 27 At this writing the most recent year available for both Foreign Trade Division and US Bureau of Economic Analysis information
is 2016 28 Provided through the Minnesota IMPLAN Group
2017 Economic Impact Study of San Francisco International Airport 35
two‐thirds of the regionrsquos exports by value as indicated in Table 20 The next four ranked industries (chemicals machinery transportation equipment electrical equipment and appliances) account for an aggregate 26 of total Bay Area exports Altogether the top five industries account for 89 of the total value of goods that originates in the Bay Area and are shipped through SFO
Table 20 Top International Exported Industries
Industry Value (in $millions)
of Total
Computers and Electronics $5430 631 Chemicals $848 99 Machinery $742 86 Transportation Equipment $425 49 Electrical Equipment amp Appliances $232 27 All others $928 108 Total $8604 100
Sources US Census Bureau Foreign Trade Division collected by WISERTrade
DOMESTIC EXPORTS
The FHWA Freight Analysis Framework (FAF) was used to identify the domestic flows of Bay Area goods to US customers via SFO The FAF areas are represented by Combined Statistical Areas (CSAs) represent the FAF areasmdashthe San Francisco CSA includes 12 counties (the Bay Area plus San Benito Santa Cruz and San Joaquin counties) To scale the commodity flows to the nine‐county Bay Area a ratio was applied like the approach described above for international exports This ratio was calculated using the BEA industry output for the nine‐county region and was divided by the industry output for the 12‐county CSA
Even more concentrated than international exports domestic shipments are highly concentrated in computer and electronics and electrical equipment manufacturingmdashcombined these sectors account for 75 of the total Bay Area produced shipments through SFO The second largest amount of exports is in chemicals which represents 94 of all exports as indicated in Table 21 Together the top five industries represent 91 of the total value of Bay Area domestic exports through SFO
Table 21 Top Domestic Shipped Industries
Industry Value (in $millions)
of Total
Computers and Electronics $3419 423 Electrical Equipment amp Appliances $2642 327 Chemicals $761 94 Transportation Equipment $302 37 Machinery $191 24 All Others $766 95 Total $8081 100
Source Freight Analysis Framework US Department of Transportation
2017 Economic Impact Study of San Francisco International Airport 36
Combining both domestic and international products still highlights the integral part that computer and electronics and electrical equipment manufacturing (70) plays within the Bay Area compared to other manufacturing sectors (Figure 10) and the significance that SFO has in enabling these products to reach their customers
Figure 10 Percentage of the Bay Arearsquos Combined Domestic and International Exports Shipped via SFO
Sources US Census Bureau Foreign Trade Division collected by WISERTrade and Freight Analysis Framework US Department of Transportation
ECONOMIC CONTRIBUTION OF SFO TO THE BAY AREA
To gauge the level of impact EDR Group used US Bureau of Economic Analysis (BEA) data included in IMPLAN to 1) estimate the jobs and wages associated with the domestic and international exports through SFO and 2) determine the additional activity that percolates throughout the economy as air‐reliant businesses purchase additional goods and services from suppliers (Indirect) and employees spend their additional income (Induced) BEA data within IMPLAN is used because it contains information about the structural buyer‐supplier relationships within the economy as well as the industries where labor income is usually spent
Overall $167 billion in domestic and international exports shipped via SFO contribute to over 26000 jobs and over $40 billion in labor income within the Bay Area (Table 22) When including purchases of supplier goods and services (Indirect) and employee wage re‐spending (Induced) the total impact of air exports on the Bay Area economy accounts for over 84000 jobs and nearly $29 billion in business sales (output) Appendix I describes the methodology used to develop these calculations
2017 Economic Impact Study of San Francisco International Airport 37
Table 22 Economic Value of Domestic and International Exports Originating in the Bay Area via SFO
Impact Type Employment Labor Income Output Direct Effect 26078 $4023963000 $16721996000
Indirect Effect 20448 $2262032000 $6067692000
Induced Effect 37706 $2408696000 $6186854000
Total Effect 84232 $8694691000 $28976542000
Source US Department of Commerce data provided by IMPLAN Calculations by EDR Group
EFFECTS ON SUPPLIERS OF GOODS AND SERVICES
Figure 11 profiles the employment supported when Bay Area air‐reliant businesses purchase goods and services from other Bay Area businesses In total over 20000 jobs are dependent on Bay Area air‐reliant businesses that purchase goods and services to make final products that are shipped via SFO Most jobs are in the services sector which accounts for over 10000 of the indirect jobs
Figure 11 Employment Impacts on Suppliers of Goods and Services (Indirect)
Service
Trade
Manufacturing
Transp Inform amp Utilities
Government
Construction
Agriculture
Mining
Jobs
Source US Department of Commerce data provided by IMPLAN Calculations by EDR Group
At a finer level of BEA industry detail purchases made by Bay Area air‐reliant businesses are concentrated in wholesale trade administrative support professional scientific and technical services management of companies and computers and electronics As shown in Table 23 these five industries represent 60 of the total jobs supported by air reliant business purchases Nearly 40 of the job impacts are spread across other industries indicating that the dependence on Bay Area businesses that use SFO is widespread across most the local economy
0 2000 4000 6000 8000 10000 12000
2017 Economic Impact Study of San Francisco International Airport 38
Table 23 Impacts on Suppliers of Goods and Services (Indirect) by BEA Industry
Industry Category Jobs of Total
Wholesale trade 3709 18 Administrative Support 2881 14 Professional Scientific amp Technical Services 2588 13 Management of Companies 1810 9 Computer amp Electronics 1311 6 Government 743 4 Repair amp Maintenance 619 3 Food amp Beverage 616 3 Fabricated Metals 592 3 Construction 546 3 Rest of Others 5034 25 Total 20448 100
Source US Department of Commerce data provided by IMPLAN Calculations by EDR Group
The following sections did not include any updated information and therefore can be found in Chapter 5 Impacts of Air Reliant User (Freight Shipper) within the 2016 Economic Impact Study of San Francisco International Airport Overview of International Freight Activity SFO Connects the Bay Area to Domestic Markets Commodities Shipped from SFO to Domestic Markets County by County Commodity Movements
2017 Economic Impact Study of San Francisco International Airport 39
CHAPTER 6 TAX IMPACTS GENERATED BY ACTIVITIES AT SFO
The income and business sales produced by economic activities at SFO in turn generate federal state county and municipal tax revenues This chapter presents estimates of state and local tax impacts from airport activities as well as federal aviation taxes derived from aviation services29
STATE AND LOCAL TAX IMPACTS
The state and local tax revenues linked to operations at SFO totaled nearly $29 billion in 2016 including close to $16 billion from direct activities and almost $13 billion from purchases of supplier goods and services (Indirect) and re‐spending of worker income (Induced) Tax revenues are estimated using effective tax rates calculated by BEA and US Census data (as organized through IMPLAN) as well by considering California publications including the Governorrsquos Budget Summary ndash 2015‐16 Comprehensive Annual Financial Report of the State Controllerrsquos Office and the County of San Mateo Appendix II includes a breakout of tax revenues by county where applicable
Table 24 Estimated 2016 State and Local Tax Impacts (in $ millions)
Impact Category Direct Activities Indirect Induced
Activities Total Activities
On‐Airport $602 $336 $937
Construction $7 $16 $23
Visitor Spending $697 $345 $1041
Air‐Reliant Businesses $280 $592 $872
Total Taxes $1586 $1288 $2874
Sources Totals may not sum due to rounding Based on information from Regional Economic Accounts (REA) and National Income and Product Accounts (NIPA) from the Bureau of Economic Analysis (BEA) and Consumer Expenditure Survey (CES) and the Annual Survey of State and Local Government Finances (SLGF) from the US Census Bureau
FEDERAL AVIATION TAXES
Aviation operations at SFO generated more than $12 billion dollars in federal taxes including $419 million from taxes on international and domestic passengers and $791 million in US Customs revenue from customs duties on international air cargo shipments (Table 25) These tax revenues are remitted to the US Department of the Treasury and may not directly benefit the Bay Area or the State of California
29 Data developed in this chapter should be considered as order of magnitude estimates As in previous economic impact studies for SFO tax impacts are derived from per‐capita measures
2017 Economic Impact Study of San Francisco International Airport 40
Table 25 Estimated 2016 Federal Aviation Tax Revenues
Type of Tax ChargesFees Revenues in millions
of Total
Customs and Immigration $550 and $7 per passenger $32 3
International Arrival and Departure Tax $1800 per passenger $93 8
Domestic Passenger Taxes $410 per passenger amp 75 of airfare $237 20
Sept 11th security fee $560 per passenger $57 5
Sub‐Total Passenger Related Taxes $419 35
US Customs Revenue (International Cargo) Customs Revenues (US ITC) $791 65
Total $1211 100
Notes Includes US Government Segment tax Does not include Domestic Transportation tax (75 of airfare cost)
Sources Federal Aviation Administration wwwairlinesorg and wwwWiserTradecom
2017 Economic Impact Study of San Francisco International Airport 41
CHAPTER 7 DISTRIBUTION OF IMPACTS BY BAY AREA COUNTIES
This chapter presents the distribution of direct jobs and income as well as the distribution of tax benefits among Bay Area counties for on‐airport and visitor spending categories Local impacts are based on a sample of almost 24000 on‐airport employees by zip code compiled for the 2016 Study
ON‐AIRPORT EFFECT AMONG BAY AREA COUNTIES
Table 26 and Table 27 show estimates of jobs payroll (labor income) and business revenues (output) associated with each of the nine Bay Area counties that are generated by on‐airport economic activity In Table 26 direct and induced employment and wages are allocated to the counties based on the residence of employees of the Airport Commission staff its contract workers and tenants Due to the location of SFO all direct business revenues (direct output) are generated in San Mateo County (Table 29) Economic impacts (employment payroll and business revenues) associated with supplier purchases (indirect) were applied proportionally to each county based on relative employment levels compared to the Bay Area region
Table 26 Employment and Labor Income Impacts of On‐airport Tenants by County
County Impact Type
Employ ment
Labor Income County Impact Type
Employ ment
Labor Income
Alameda
Direct 5487 $339835000 San Mateo
Direct 12197 $755396000 Indirect 2836 $247852000 Indirect 1516 $132524000 Induced 2562 $190496000 Induced 5696 $423440000 Total 10885 $778183000 Total 19409 $1311360000
Contra Costa
Direct 2600 $161011000 Santa Clara
Direct 1307 $80940000 Indirect 1505 $131531000 Indirect 3750 $327807000 Induced 1214 $90255000 Induced 610 $45371000 Total 5319 $382797000 Total 5668 $454118000
Marin
Direct 221 $13692000
Solano
Direct 1125 $69671000 Indirect 551 $48121000 Indirect 527 $46064000 Induced 103 $7675000 Induced 525 $39054000 Total 875 $69488000 Total 2177 $154789000
Napa
Direct 125 $7741000
Sonoma
Direct 199 $12323000 Indirect 291 $25428000 Indirect 836 $73075000 Induced 58 $4339000 Induced 93 $6908000 Total 474 $37508000 Total 1128 $92306000
San Francisco
Direct 6618 $409849000 Outside Bay Area
Direct 10908 $675588000 Indirect 2518 $220117000 Indirect NA NA Induced 3090 $229743000 Induced 5094 $378704000 Total 12226 $859709000 Total 16002 $1054292000
Total
Direct 40787 $2526046000 Indirect 14330 $1252519000 Induced 19047 $1415985000 Total 74164 $5194550000
Notes Cells left blank because indirect impacts from the Bay Area are only allocated to each of the 9 counties Sources Airport Tenant Survey Data Provided by SFO and US Department of Commerce data provided by IMPLAN Calculations by EDR Group
2017 Economic Impact Study of San Francisco International Airport 42
Table 27 Business Revenues Impacts of On‐airport Tenants by Bay Area County
County Impact Type Business Revenues
County Impact Type Business Revenues
Alameda
Direct $0
San Mateo
Direct $8042484000 Indirect $583266000 Indirect $311867000 Induced $505583000 Induced $1123825000 Total $1088849000 Total $9478176000
Contra Costa
Direct $0
Santa Clara
Direct $0 Indirect $309528000 Indirect $771423000 Induced $239541000 Induced $120417000 Total $549069000 Total $891840000
Marin
Direct $0
Solano
Direct $0 Indirect $113241000 Indirect $108402000 Induced $20370000 Induced $103651000 Total $133611000 Total $212053000
Napa
Direct $0
Sonoma
Direct $0 Indirect $59839000 Indirect $171965000 Induced $11517000 Induced $18333000 Total $71356000 Total $190298000
San Francisco
Direct $0 Outside Bay Area in CA
Direct $0 Indirect $517998000 Indirect NA Induced $609744000 Induced $1005092000 Total $1127742000 Total $1005092000
Total
Direct $8042484000 Indirect $2947529000 Induced $3758073000 Total $14748086000
Notes Cells left blank because indirect impacts from the Bay Area are only allocated to each of the 9 counties Sources Airport Tenant Survey Data Provided by SFO and US Department of Commerce data provided by IMPLAN Calculations by EDR Group
2017 Economic Impact Study of San Francisco International Airport 43
VISITOR SPENDING The visitor spending survey conducted at SFO documented the destinations of visitors who arrive in California through SFO Table 28 indicates the economic impacts associated with visitor spending for each county
Table 28 Economic Impacts of Visitor Spending by Bay Area County
Bay Area County Impact Type Employment Labor Income Visitor Spending
Alameda
Direct 6812 $274314000 $746911000 Indirect 1082 $87472000 $217315000 Induced 1906 $119435000 $323181000 Total 9800 $481221000 $1287407000
Contra Costa
Direct 4737 $190766000 $519423000 Indirect 752 $60831000 $151127000 Induced 1325 $83058000 $224749000 Total 6815 $334655000 $895299000
Marin
Direct 2732 $110014000 $299551000 Indirect 434 $35081000 $87155000 Induced 764 $47900000 $129613000 Total 3930 $192995000 $516319000
Napa
Direct 3933 $158385000 $431255000 Indirect 625 $50505000 $125474000 Induced 1100 $68960000 $186600000 Total 5658 $277850000 $743329000
San Francisco
Direct 52000 $2094047000 $5701745000 Indirect 8260 $667743000 $1658933000 Induced 14549 $911735000 $2467086000 Total 74808 $3673525000 $9827764000
San Mateo
Direct 10475 $421828000 $1148568000 Indirect 1664 $134511000 $334178000 Induced 2931 $183661000 $496973000 Total 15069 $740000000 $1979719000
Santa Clara
Direct 10832 $436224000 $1187767000 Indirect 1721 $139102000 $345583000 Induced 3031 $189929000 $513934000 Total 15584 $765255000 $2047284000
Solano
Direct 667 $26864000 $73147000 Indirect 106 $8566000 $21282000 Induced 187 $11697000 $31650000 Total 960 $47127000 $126079000
Sonoma
Direct 3933 $158386000 $431259000 Indirect 625 $50506000 $125476000 Induced 1100 $68960000 $186601000 Total 5658 $277852000 $743336000
Total
Direct 96121 $3870828000 $10539626000 Indirect 15268 $1234317000 $3066523000 Induced 26893 $1685335000 $4560387000 Total 138282 $6790480000 $18166536000
Sources Airport Visitor Spending Survey Data Provided by SFO and US Department of Commerce data provided by IMPLAN Calculations by EDR Group
2017 Economic Impact Study of San Francisco International Airport 44
TAX IMPACTS BY BAY AREA COUNTY
Tax revenues including sales property (business and labor) corporate and income taxes are collected from on‐airport tenants and the workers that they employ directly at SFO Table 29 indicates the tax revenues generated from each impact type (direct IndirectInduced and Total) by county Direct tax revenues paid by individuals and households are apportioned according to place of residence of Airport Commission staff contact employees and tenants Direct taxes paid by businesses originate in San Mateo County due to the location of the Airport
Table 29 Tax Revenues by County for On‐airport Tenants
Bay Area Counties
Direct Indirect Induced
Total
Alameda $10303000 $53898000 $64201000
Contra Costa $4882000 $27089000 $31971000
Marin $415000 $6369000 $6784000
Napa $235000 $3405000 $3640000
San Francisco $12426000 $56329000 $68755000
San Mateo $548000000 $73751000 $621751000
Santa Clara $2454000 $42422000 $44876000
Solano $2112000 $10527000 $12639000
Sonoma $374000 $9009000 $9383000
Outside Bay Area $20483000 $52913000 $73396000
Total $601684000 $335712000 $937396000
Notes Direct tax revenues shown in San Mateo County include $33 million in Possessory Interest Tax revenues as estimated for the 2016 Study
Sources Governorrsquos Budget Summary State Controllerrsquos Office the County of San Mateo Bureau of Economic Analysisrsquo (BEA) National Income and Product Accounts (NIPA) the US Census Bureau (Consumer Expenditure Survey Annual Survey of State and Local Government Finances) US Department of Commerce data provided by IMPLAN Airport Tenant Survey and Information Provided by SFO Calculations by EDR Group
Tax revenues including sales property (business and residential) corporate and income taxes are also generated by visitors and businesses that provide goods and services to domestic and international visitors Table 30 below outlines the tax revenues provided by each county by business in the hotel restaurant transportation entertainment and retail industries (direct) the businesses that support these industries (indirect) and the tax revenue generated by employees spending their earned income (induced)
2017 Economic Impact Study of San Francisco International Airport 45
Table 30 Tax Revenues by County for Visitor Spending
Bay Area Counties Direct Indirect Induced
Total
Alameda $49365000 $24431000 $73796000
Contra Costa $34330000 $16990000 $51320000
Marin $19798000 $9798000 $29596000
Napa $28502000 $14106000 $42608000
San Francisco $376840000 $186502000 $563342000
San Mateo $75911000 $37569000 $113480000
Santa Clara $78502000 $38851000 $117353000
Solano $4834000 $2393000 $7227000
Sonoma $28503000 $14106000 $42609000
Total Taxes $696585000 $344746000 $1041331000
Sources Governorrsquos Budget Summary State Controllerrsquos Office Bureau of Economic Analysisrsquo (BEA) National Income and Product Accounts (NIPA) the US Census Bureau (Consumer Expenditure Survey Annual Survey of State and Local Government Finances) US Department of Commerce data provided by IMPLAN and SFO Airport Visitor Survey Calculations by EDR Group
2017 Economic Impact Study of San Francisco International Airport 46
This Page Left Blank Intentionally
2017 Economic Impact Study of San Francisco International Airport 47
APPENDIX I METHODOLOGY FOR THE ANALYSIS
OF OVERALL ECONOMIC IMPACTS
Airport jobs and commerce on the Airport premises create strong economic stimuli for the Bay Area This airport business activity itself generates an increased demand for other local goods and services Not only do the businesses based on the Airport pay local and state taxes but the off‐airport businesses that depend upon airport‐based activity pay taxes as well As shown in this study the direct business activity and subsequent multiplier effects have a strong overall impact on the economy
All economic impacts in this report are described using the measures of jobs payroll and business sales The study quantifies three distinct categories of economic benefits that result from SFO‐related activities direct indirect and induced effects as described below
Direct impacts stem from the activity that is directly related to the provision of aviation services visitor spending or the activity of aviation‐reliant businesses For example the direct impacts of on‐airport tenants include the number of persons they employ on the Airport the wages and benefits paid to those workers and their business sales Similarly the direct impacts of air visitors include the money they spend on services and supplies and the jobs and payroll supported by those expenditures Most of the direct impacts measured in this study occur on‐airport but some such as visitor spending and the benefits produced by aviation dependent businesses occur off‐airport
Indirect and induced impacts which are sometimes called ldquomultiplier impactsrdquo result from (1) a portion of business sales used for ldquobusiness‐to‐businessrdquo purchases of goods and services (indirect effects) and (2) the recirculation of worker incomes and business expenditures in the broader Bay Area economy (induced effects) For example an airport restaurant may buy supplies from a Bay Area produce vendor This purchase represents income (ie new business sales) to the produce supplier which uses a portion of that income to pay its workers and buy additional goods and services from other businesses in the region In addition airport workers spend their wages on other items such as housing retail purchases and services Those expenditures in turn support jobs in those industries whose workers then spend their salaries in the Bay Area These successive rounds of spending and job creation represent the indirect impacts (business‐to‐business) and induced impacts (spending of wages) This study specifically measured the indirect and induced impacts that occur in the county economies of the Bay Area The discussions of total impacts are based on the following analyses and are illustrated in Figure 12
2017 Economic Impact Study of San Francisco International Airport 48
Figure 12 Elements of Economic Impacts and Interrelationships
Source EDR Group
2017 Economic Impact Study of San Francisco International Airport 49
SUPPLIERS OF GOODS AND SERVICES (INDIRECT MULTIPLIER EFFECTS)
Orders from Businesses at the Airport
Activities occurring at the Airport generate additional orders for goods and services from suppliers including orders for
Printing and publishing for the Airport operator and the airlines
Banking insurance legal accounting and technical services for airport businesses
Off‐site bus and parking services for SFO employees
Food products for airport restaurants
Wholesale merchandise to be sold by airport stores
Furniture and equipment for offices hotels restaurants and stores located at the Airport
Orders from Off‐Airport Businesses Serving Air Travelers
Activities serving air travelers outside of the Airport also generate additional orders for goods and services from suppliers for
Fueling and maintenance services for use by off‐airport taxis rental cars tour buses and public transportation
Construction and support operations of convention and hospitality facilities for convention visitors
Food products for off‐airport restaurants
Wholesale merchandise to be sold by off‐airport stores
Furniture and equipment for off‐airport hotels restaurants and stores
RE‐SPENDING OF WORKER INCOME (INDUCED MULTIPLIER EFFECTS)
The workers at SFO at off‐airport businesses serving air visitors and at supplier businesses earn income and most of that income is re‐spent on consumer purchases which support additional jobs within the Bay Area Examples of these purchases include
Retail purchases of food clothing home furnishings cars electronic devices computers and other products
Purchases of services spanning haircuts cleaning car repair and insurance
2017 Economic Impact Study of San Francisco International Airport 50
CALCULATING THE DOMESTIC AND INTERNATIONAL VALUES FROM CARGO
ORIGINATING IN THE BAY AREA AND SHIPPED THROUGH SFO
The combined $17 billion of international and domestic exports through SFO provides a significant direct contribution to the Bay Area economy as well as additional activity through economic linkages To estimate the level of impact EDR Group layered three sets of data ndash the Foreign Trade Database (FTD) of the US Bureau of the Census (tabulated by WISERTrade) the multi‐modal Freight Analysis Framework (FAF) of the US Federal Highway Administration and US Bureau of Economic Analysis (BEA) data included in IMPLAN to
1) Estimate the jobs and wages associated with the domestic and international exports through SFO and
2) Determine the additional activity that percolates throughout the economy as air‐reliant businesses purchase additional goods and services from suppliers (Indirect) and employees spend their additional income (Induced)
FTD data aggregated by WISERTrade was the basis of estimating the weight and value of goods produced in the Bay Area and exported from SFO to international markets FTD provides total exports by commodity and state of origin and the total value of California exports shipped through SFO WISERTrade also provides total value and weight by commodity for all shipments from SFO but not at a commodity level by point of origin Using IMPLAN data the ratios of output by commodity were calculated for the nine‐county Bay Area compared to California totals This calculation estimated the ldquosharerdquo of California produced air exports with an approximate point of origin in the Bay Area The calculation was constrained by both the value and weight reported by WISERTrade of exports by commodity from SFO and the weight of international shipments from SFO taken from the flysfo website
FAF was the basis of estimating domestic cargo shipments FAF provides domestic air shipments of commodities that originate in the twelve county San Jose‐San Francisco‐Oakland CA Combined Statistical Area Using IMPLAN data output by commodity for the nine‐county Bay Area were compared to the twelve county CMSA to estimate the ldquosharerdquo of each commodity shipped from the CSA
BEA data within IMPLAN profiles the structural buyer‐supplier relationships within the economy as well as the industries where labor income is usually spent Figure 13 illustrates the methodology of calculating the domestic and international values from the Bay Area through SFO
2017 Economic Impact Study of San Francisco International Airport 51
Figure 13 Methodology to Estimate Air Dependent Contribution to Bay Area Economy
3 Freight shipments by value
2 Geography
1 Calculations
MAJOR SOURCES OF DATA USED IN THIS STUDY
The discussion of total impacts is based on the following analyses conducted specifically for this study
1 A survey of all airport tenants and the data provided by staff of the San Francisco Airport Commission These data provide profiles of on‐airport jobs by establishment type of business activity and place of residence by zip code for airport and tenant employees
2 Polaris Research conducted surveys of airport travelers were conducted by Polaris Research The survey profiled trip purposes international or domestic origins segmentation of visitors from local residents and connecting passengers and the amount of money in the Bay Area spent by visitors using the Airport
3 Air freight analyses are based on data from SFO WISERTrade using data from US Census Bureau Foreign Trade Division30 and the Freight Analysis Framework (FAF) to develop a detailed profile of air exports from SFO by commodity and origin of movement Detailed data from FAF are not available for the Bay Area alone (statewide for the Foreign Trade Division and a 12 county combined statistical area (CSA) for FAF) Therefore the detailed commodity flows found in the data sets are proportioned based on the output per industry (converted from commodities) of the Bay Area
30 The World Institute for Strategic Economic Research (WISERTrade) formed July 1 2004 to continue the international trade data work of its predecessor MISER was chosen by the US Census Bureau to be one of its first Business and Industry Data Centers with special focus on foreign trade statistics See wwwwisertradeorg
2017 Economic Impact Study of San Francisco International Airport 52
4 Econometric models for the nine‐county Bay Area are based on the IMPLAN Economic Model System IMPLAN is used to estimate wages and sales (or budget expenditures for public entities) for airport tenants where only employment totals were available Labor income and sales andor expenditures per worker are derived primarily from US Department of Commerce (BEA is a part of the Commerce Department) and Department of Labor data sets and are county‐specific IMPLAN is also used to derive multiplier effects including business orders to suppliers generated by on‐airport businesses off‐airport businesses serving airport visitors and airport‐reliant businesses and business sales generated by the spending of the additional workersrsquo income on consumer purchases
2017 Economic Impact Study of San Francisco International Airport 53
APPENDIX II SUMMARY OF IMPLAN SECTORING
To estimate the full range of direct effects and the indirect and induced (ldquomultiplierrdquo) economic effects this study utilized the IMPLAN model system of MIG Inc IMPLAN is now the most widely used input‐output economic modeling system in the US with a client list of 500 public and private agencies including several federal agencies and numerous state agencies It utilizes US Commerce Department (National Income and Product Accounts) data on inter‐industry technology relationships (also known as input‐output structural matrices) countywide employment and income data from the Bureau of Economic Analysis (BEA) and Bureau of Labor Statistics (BLS) and its own industry and county‐specific estimates of local purchasing rates (ldquoregional purchase coefficientsrdquo) It is enhanced over most other input‐output models in that it also includes coverage of public sector activity and consumer activity (reflected in its ldquosocial accounting matrixrdquo) The industry detail is at the level of 536 industries and is based on categories of the US Bureau of Economic Analysis (BEA) which correspond to two to five digit groups in the North American Industry Classification System (NAICS)
For this study the direct job payroll and business revenue effects for on‐airport and visitor spending were documented through surveys completed for this project and then assigned to specific sector groups based on EDR Grouprsquos experience in aviation SFOrsquos support of air reliant industries was documented through databases maintained by the US Census Bureau and the US Department of Transportation The IMPLAN model was then calibrated for the nine‐county Bay Area as well as for each county within the region and a model calibrated for a defined region outside the Bay Area to measure additional visitor spending The result was an estimate of the indirect and induced (and overall) job business revenue and income impacts for each segment of airport beneficiary The analysis of retail impacts was adjusted to account for retail markup margins and the concentration of sales in airports and in visitor industries Retail portions of multiplier effects also incorporate these margins
Regardless of whether economic impacts are measured in terms of jobs income or business sales these impacts can be classified into three categories
Direct economic effects are the changes occurring at the project site as a direct consequence of the public investment project or program This is represented as the net increase in business activity associated with business at the SFO initial visitor spending at off‐airport businesses in each countyrsquos hospitality sector and the sale revenues earned by shippers who route air cargo through SFO
Indirect economic effects are the broader effects on business activity for off‐site goods and services supplied to the directly affected businesses
Induced economic effects are further shifts in spending on food clothing shelter and other consumer goods and services because of the change in workers and payroll of directly and indirectly affected businesses
EDR Group assembled classifications of the 536 sectors in the IMPLAN modeling package to best mirror types of industries on SFO types of visitor spending and industries related to commodities exported from SFO The classification schemes used for this study for on‐airport and visitor spending impacts are shown in Table 31 and Table 32
2017 Economic Impact Study of San Francisco International Airport 54
Table 31 Industry Classification of On‐Airport Industries
Airport Tenants Classification IMPLAN Sectors Used Passenger Airlines Air Transportation Freight Airlines Couriers Air Transportation Couriers Fixed Based Operator (FBO) Support activities for transportation Local Government
State and Local Government State Government
Federal Government Immigration TSA FBI US Customs and Border Patrol (CBP) National Weather Service
Distribution TruckingWarehousing Wholesale Wholesale Trade business Security Security Aviation Firms
Construction
Highways and Streets Commercial Structures Non‐residential structures Maintenance and Repair
Retail
ElectronicsAppliance Stores Food and Beverage Health and Labor Care Clothing Stores Sporting Goods Stores Misc Retail
Food and Beverage (includes Catering Firms) Full‐service restaurants Limited‐service restaurants All other food and drinking places
Car Rental Car Rental Ground Transportation (incl taxis limos buses vans and transit)
Transit and ground passenger transp
Other Medical Clinic Vending Machines
Services
Educational institutions Electronic repair services Insurance Medical services Other Support Services Telecommunications Waste Management
Reliant Services
ArchitecturalEngineering Business support Computer systems design services Facilities support Financial Services Management scientific and Technical Parking and Misc
2017 Economic Impact Study of San Francisco International Airport 55
Table 32 Industry Classification of Visitor‐Serving Industries
Visitor Spending Classification
IMPLAN Sectors Used
ElectronicsAppliance Stores
Food and Beverage
Health and Labor
Retail Clothing Stores
Sporting Goods
General Merchandise
Misc Retail
Performing Arts
Spectator Sports
Artists writers and performers
Museums zoos and parks
Entertainment Amusement parks and arcades
Gambling industries
Fitness and recreational sports centers
Bowling centers
Other amusement recreation
Full‐service restaurants
Restaurant Limited‐service restaurants
All other food and drinking places
Hotels and motels Hotel
Other accommodations
Transit and ground passenger transportation
Scenic and sightseeing Transportation
Support activities
Gas stations
Sources US Department of Commerce data provided by IMPLAN Calculations by EDR Group
2017 Economic Impact Study of San Francisco International Airport 56
This Page Left Blank Intentionally
2017 Economic Impact Study of San Francisco International Airport 57
APPENDIX III SFO TENANT AND VISITOR SURVEYS
The following pages are the survey instruments used for SFO tenants and visiting passengers Note that the passenger survey was administered in multiple languages
2017 Economic Impact Study of San Francisco International Airport 58
2017 Economic Impact Study of San Francisco International Airport 59
2017 Economic Impact Study of San Francisco International Airport 60
2017 Economic Impact Study of San Francisco International Airport 61
2017 Economic Impact Study of San Francisco International Airport 62
2017 Economic Impact Study of San Francisco International Airport 63
2017 Economic Impact Study of San Francisco International Airport 64
2017 Economic Impact Study of San Francisco International Airport 65
2017 Economic Impact Study of San Francisco International Airport 66

This Page Left Blank Intentionally
2017 Economic Impact Study of San Francisco International Airport 22
CHAPTER 3 ON‐AIRPORT IMPACTS
DIRECT EMPLOYMENT
In 2016 nearly 41000 people were employed at SFO (excluding employment generated by temporary construction expenditures) according to data from the surveys of airport management and tenants In addition to 14900 employees of passenger airlines the Airport supports a wide variety of other aviation‐related jobs in transportation retail and government services These jobs involve
Freight services including dedicated cargo aviation courier delivery custom broker and trucking
Air terminal operations including security building maintenance and facility management
Airline support services including catering in‐flight entertainment aircraft handling fueling and maintenance
Concessionaire services including restaurants and retail stores
Ground transportation including rental car taxis and limousines
Figure 6 shows the distribution of jobs at SFO by major function Roughly 48 of airport jobs are directly aviation related which includes passenger and freight airlines and aviation support services (eg in‐flight catering firms and fixed‐base operators) The Airport Commission and contractors federal agencies such as the FAA and the TSA and other administrative functions account for 16 of on‐airport employment Terminal concessions account for 12 of employment while ground transportation also accounts for 18 of total full time and part time jobs
Figure 6 Distribution of On‐Airport Tenants and Administrative Jobs
Passenger Airlines 37
Admin Gov Security 16
Ground Transp 19
Terminal Concessions
12
Aviation Support 10
Rental car 5
Freight Transp 1
Sources Interviews of tenants and airport administration
2017 Economic Impact Study of San Francisco International Airport 23
BUSINESS SALES AND PAYROLL
In 2016 SFO business establishments generated $80 billion of business revenues (business sales and government budget expenditures) which included over $25 billion of payroll for nearly 40800 workers at the Airport (see Table 9)
Table 9 Direct Impacts of On‐Airport Tenants and Administrative Employees
Impact Type Employment Payroll Revenues
Direct Effect 40787 $2526045000 $8042483000
Note Data excludes on‐airport construction activities in 2016 Source Airport Tenant Survey and data from the US Department of Commerce aggregated through IMPLAN
Payroll was calculated from a hybrid of the survey responses and average revenues and wages per worker by economic sector in the Bay Area21 Findings from this analysis show that passenger airlines represent 37 of employment at SFO but also account for 45 of labor income earned by workers and 61 of revenues generated on the Airport Passenger Airlines was the only sector with a higher percentage of total labor income and productivity (revenues) than employment across all sectors as shown in Figure 7 Moreover the average payroll for on‐airport workers was $62000
Figure 7 Percent of Relative Employment Labor Income and Revenues by Aggregated Sector on SFO
70
0
10
20
30
40
50
60
Jobs Business Sales Labor Income
Passenger Admin Gov Ground Terminal Aviation Rental car Freight Other Airlines Security Transp Concessions Support Transp
Sources Interviews of tenants and airport administration US Department of Commerce data provided by IMPLAN Calculations by EDR Group
21 Survey respondents were asked for payroll When it was not provided the survey data were supplemented with US Department of Commerce data for appropriate industry sectors for each employer aggregated by the Minnesota IMPLAN Group (MIG Inc)
2017 Economic Impact Study of San Francisco International Airport 24
INDIRECT AND INDUCED IMPACTS
The direct economic activities at SFO lead to additional downstream impacts on suppliers as well as re‐spending of worker income To calculate the impacts of these effects indirect and induced multipliers were calculated for each of the categories listed in Table 10
Table 10 Direct Employment Labor Income and Business Revenues for Tenant and Administrative SFO
Classification of Activity by Sector Employment Payroll Revenues
Passenger Services amp Airport Administration
OtherNon‐Profit 93 $5449000 $12763000 StateLocal Government 93 $6998000 $15636000 Parking and Miscellaneous 232 $15853000 $30350000 Management MaintCleaning amp Facilities Services 339 $35846000 $79634000 Federal Government 1814 $223187000 $326720000 City of San Francisco Airport Commission 1998 $257567000 $300062000 Security Firms 2011 $101198000 $136874000 FBOs General Aviation and Aviation Services 4062 $180244000 $418961000 Airport Retail and Concessions 4904 $171696000 $626054000 Passenger Airlines 14962 $1148294000 $4896253000 Sub Total 30507 $2146332000 $6843307000
Freight Transportation Services Freight Airlines and Couriers 485 $31351000 $119587000
Passenger Ground Transportation Services LimosBusesVansTransit 2618 $85443000 $190926000 Taxi Cabs 2809 $91686000 $204877000 Transportation Network Companies (TNCs) 2131 $69544000 $155400000 Rental Car 2238 $101689000 $528386000 Sub Total 9375 $334665000 $1048981000
Total Airport‐Based 40787 $2526045000 $8042483000
Notes Data excludes on‐airport construction activities conducted in 2016 Dollars rounded to the nearest thousand Columns may not add due to rounding
Sources Interviews of tenants airport administration and US Department of Commerce data provided by IMPLAN Calculations by EDR Group
In 2016 the direct economic activities on‐airport generated an additional $67 billion in business revenues in the Bay Area (indirect and induced effects) supporting over 33000 additional jobs and $26 billion in labor income (payroll) The total economic contribution of on‐airport activity to the Bay Area is roughly $147 billion in revenues yielding nearly 74200 jobs and $52 billion in labor income for workers (see Table 11) Suppliers of goods and services generated approximately $29 billion in revenues over 14000 jobs and expended over $12 billion on payroll (indirect impacts) The re‐spending of labor income by workers on airport and supplier firms supported nearly 19000 additional Bay Area jobs with over $14 billion in payroll and $37 billion in new business sales
2017 Economic Impact Study of San Francisco International Airport 25
Table 11 Summary of Direct Indirect and Induced Economic Impacts of SFO in Bay Area
Economic Impacts Employment Payroll Revenues I Direct Impact Airport‐Driven Activity Airport‐Based 40787 $2526045000 $8042483000 II Indirect Impact Suppliers of Goods and Services Due to Airport and Related Activities 14330 $1252520000 $2947530000 III Induced Impact Re‐Spending of Worker Income Due to Airport and Related Activities 19047 $1415986000 $3758072000 Total Regional Impact 74164 $5194551000 $14748085000
Notes Dollars rounded to the nearest thousand Columns may not add due to rounding
Sources Interviews of tenants airport administration and US Department of Commerce data provided by IMPLAN Calculations by EDR Group
On‐airport businesses purchase supplies and services from the greater Bay Area economy which is highly concentrated in air‐reliant services22 transportation support other services and food and beverage industries which combined represent 71 of all supporting industries (Table 12) The wages spent by employees of on‐airport businesses for their daily living needs are primarily spent on service sectors food and beverages and retail which combine to be 74 of all purchases made within in the Bay Area economy as indicated in Table 13
Table 12 Supplier of GoodsServices Industries (Indirect)
Industry Employment of Total
Air‐reliant services 3042 21 Other Services 3017 21 Transportation Support 2951 21 Food amp Beverage 1128 8 Couriers 681 5 Wholesale Trade 602 4 State amp Local Government 499 3 Manufacturing 419 3 Construction 318 2 Banking amp Financial Services 269 2 All Others 1404 10 Total 14330 100
Sources US Department of Commerce data provided by IMPLAN Calculations by EDR Group
22 Air‐reliant services include architectural engineering business support computer systems design services facility support financial services management scientific technical services and consulting These sectors purchase large amounts of air transportation services Other Services include insurance rentalleasing building services landscaping waste management medical social and maintenance and repair A full listing is in Appendix I
2017 Economic Impact Study of San Francisco International Airport 26
Table 13 Re‐Spending of Worker Income Industries (Induced)
Industry Employment of Total
Services 6553 34 Food amp Beverage 2855 15 Reliant Services 2425 13 Retail 2277 12 Entertainment 734 4 Wholesale Trade 561 3 Banking amp Financial services 438 2 Manufacturing 292 2 State amp Local Government 253 1 All Others 2661 14 Total 19047 100
Sources US Department of Commerce data provided by IMPLAN Calculations by EDR Group
ON‐AIRPORT CONSTRUCTION
SFO provided a summary of all capital projects from FY 1314 to FY 1516 The summary of projects was provided in eight categories of expenditures including terminal airport support groundside environmental parking safety amp security airfield and utility improvements An analysis over multiple years is preferable to smooth‐out annual fluctuations that are typically seen in construction spending The objective of this approach is to estimate economic impacts of construction at SFO for a ldquotypical yearrdquo to mitigate the short‐term investment periods associated with single construction projects
Each type of expenditure is matched to the most appropriate industry sector in the IMPLAN modeling package as described in Table 14
Table 14 Sector Mapping
SFO Capital Construction Category IMPLAN Sector
Description
Terminal improvements Construction of nonresidential structures
Airport support improvements Facilities support services
Groundside improvements Maintenance and repair (roadway amp taxiway)
Environmental improvements
Maintenance amp Repair (nonresidential) Parking improvements
Safety amp security improvements
Airfield improvements
Utility improvements Water sewage and other systems
Source SFO and US Department of Commerce data provided by IMPLAN
2017 Economic Impact Study of San Francisco International Airport 27
After classifying each of the five expenditure categories into the corresponding IMPLAN sector these economic impacts of the capital investments were estimated for the nine Bay Area counties for an average year from FY 1314 ndash FY 1516 (Table 15)
Table 15 Annual Average Impacts from SFO Construction on the Bay Area Economy
Impact Type Employment Labor Income Expenditures Direct Effect 2041 $144669000 $366782000 Indirect Effect 644 $49244000 $122327000 Induced Effect 961 $60104000 $163281000 Total Effect 3645 $254017000 $652390000
Notes Dollars rounded to the nearest thousand Columns may not add due to rounding
Source Employment and Labor Income derived using IMPLAN
2017 Economic Impact Study of San Francisco International Airport 28
CHAPTER 4 VISITOR SPENDING
In the year ending June 2016 526 of domestic and international air travelers arriving at SFO were non‐residents visiting the region (representing 102 million of the 193 million origin and destination (OampD) enplanements at the Airport excluding connecting passengers) SFO traffic statistics and national data sets from the Department of Transportation show that that 26 of all visitors were international visitors 12 were Southern California residents served by four airports and 62 were visitors from other parts of the United States Surveys of air travelers indicate that 70 of visitors traveled for personal reasons to the Bay Area and 30 for business reasons The survey also shows that the trip purposes of domestic travelers are more likely to be business related than for international travelers (Figure 8)
Figure 8 Profile of Air Visitors Arriving via SFO by Place of Origin
Sources Visitor Survey Conducted by Polaris Inc SFO Traffic Statistics US DOT OampD Survey US DOT T‐100 Database IATA PaxIS Database US DOC National Travel and Tourism Office (NTTO) Calculations by EDR Group and ICF
2017 Economic Impact Study of San Francisco International Airport 29
VISITOR SPENDING
The survey of arriving visitors found that on average international visitors spend $1234 in the Bay Area and domestic US visitors spend $1024 per trip The breakdowns by trip origin and trip purpose (business or labor) are shown in Figure 9
Figure 9 Relative Spending of Visitors per Trip by Origin and Purpose
Sources Visitor Survey Conducted by Polaris Inc Calculations by EDR Group
Overall the off‐airport spending of the 102 million domestic and foreign visitors who arrived through SFO visitor amounted to nearly $111 billion of which approximately $105 billion was in the Bay Area and an additional $585 million was outside the Bay Area23 This encompasses spending on hotels food and beverage retail purchases entertainment and recreation and local travel (eg taxis car rental24 sight‐seeing trips and public transportation) The breakout of visitor spending by sector is shown in Table 16
Table 16 Off‐Airport SFO Visitor Spending Inside and Outside of the Bay Area
Sector Total within Bay Area Total Outside Bay Area Total
Accommodations $4515536000 $263822000 $4779358000 Food and Beverage $2407541000 $128195000 $2535735000 Retail $1769840000 $90393000 $1860234000 Entertainment $831216000 $44525000 $875740000 Car Rental $714078000 $50036000 $764114000 Ground Transportation $301415000 $7788000 $309203000 Total $10539626000 $584759000 $11124384000
Note Dollars are rounded to thousands
Sources SFO Traffic Statistics and national data sets from the Department of Transportation Visitor Survey Calculations by EDR Group
23 Visitor surveys conducted at SFO indicated if spending occurred within the Bay area or in surrounding counties 24 On‐airport car rentals are included in the On‐airport tenant estimates Car rentals off‐airport is included in the Visitor Spending
estimates
2017 Economic Impact Study of San Francisco International Airport 30
JOBS AND INCOME GENERATED BY OFF‐AIRPORT VISITOR SPENDING
The $111 billion spent in 2016 by visitors arriving through SFO supported over 138000 jobs within the Bay Area and an additional 8500 jobs supported by visitor spending outside the Bay Area in other counties in California
Table 17 Breakdown of Total Visitor Spending Impacts
Impact Type Employment Payroll Visitor Spending Total Visitor Spending Impacts in Bay Area Direct 96121 $3870828000 $10539626000 Indirect 15268 $1234317000 $3066523000 Induced 26893 $1685335000 $4560386000 Total 138282 $6790480000 $18166535000 Total Visitor Spending Impacts Outside of the Bay Area Direct 5731 $198297000 $584759000 Indirect 1185 $70593000 $205456000 Induced 1596 $79311000 $239010000 Total 8511 $348201000 $1029225000 Total Visitor Spending Impacts Due to SFO Direct 101852 $4069125000 $11124385000 Indirect 16452 $1304910000 $3271979000 Induced 28489 $1764646000 $4799396000 Total 146793 $7138681000 $19195760000
Notes Jobs include employees and proprietors Payroll includes wages profits and value of benefits
Sources Visitor Survey conducted by Polaris Inc SFO Traffic Statistics and national data sets from the Department of Transportation Calculations by EDR Group
The IMPLAN modeling package was tailored to the nine‐county Bay Area and the rest of California to calculate direct jobs and wages from visitor spending in the region and to capture spending in the remaining counties of California In the initial stage of the analysis spending profiles were developed as shown in Table 16 (lodging food and beverage entertainment retail and local ground transportation) were used in the initial stage of the analysis25 The first step was to apply business sales (the actual visitor spending) to worker ratios to estimate employment generated by visitor spending The second step involved applying payroll to worker ratios to these employment estimates to calculate the how much labor income is generated for each of the five categories of spending These ratios are summarized in Table 18 and the applied calculations are as follows
1 Step 1 Employment Generated by Visitor Spending = Visitor SpendingBusiness Sales per Worker (by sector)
2 Step 2 Labor Income Generated by Visitor Spending = Workers (calculated in Step 1 above) Labor Income per Worker (by sector)
25 IMPLAN packages data from federal agencies on a county basis including the US Department of Commerce and the US Department of Labor EDR Group developed the sectors that reflect visitor spending and aggregated the counties to build the Bay Area region and Outside‐Bay Area region
2017 Economic Impact Study of San Francisco International Airport 31
Table 18 Earnings and Sales per Worker
Sector Payroll per Worker
Sales per Worker
Ground Transportation $56195 $116579 Car Rental $45823 $233176 Accommodations $47874 $119611 Retail $41257 $83847 Entertainment $36507 $88861 Food amp Beverage $31016 $65252
Notes Payroll (labor income) includes wages and profits Retail Sales per worker are margined sales
Sources US Departments of Commerce of Labor data provided by IMPLAN Calculations by EDR Group
INDIRECT AND INDUCED IMPACTS
Activities serving air travelers or visitors outside of the Airport (see Table 16) also generate additional orders for goods and services from suppliers These include orders for
Fuel and maintenance services by off‐airport taxis rental cars tour buses and public transportation
Accounting fees paid by businesses in hospitality industries
Food products for off‐airport restaurants
Wholesale merchandise to be sold by off‐airport stores
Furniture and equipment for off‐airport hotels restaurants and stores
These orders in turn support additional employment and wages in the Bay Area Supplier orders support payroll to workers of these supplier businesses Workers then spent this income on consumer purchases such as
Retail purchases for consumer items such as food clothing home furnishings and cars
Purchases of health care and childcare services
Rent and mortgage payments and other housing costs
In 2016 the multiplier effects of spending by air visitors to the Bay Area generated an additional $76 billion in business revenues in the region supporting 42000 additional jobs and provided over $29 billion in total payroll expenditures
Including initial visitor spending indirect supplier purchases and spending of earned income by workers in visitor services industries the total economic contribution of SFO visitors to the Bay Area totaled roughly $182 billion in revenues yielding over 138000 jobs and nearly $68 billion in payroll (see Table 19) Suppliers of goods and services generated approximately $30 billion of revenues 15000 jobs and $12 billion of Labor income (indirect impacts) The re‐spending of earnings supported $46 billion of revenues nearly 27000 jobs and close to $17 billion of labor income (induced impacts)
2017 Economic Impact Study of San Francisco International Airport 32
Table 19 Summary of Direct Indirect and Induced Economic Impacts of the Contribution of Visitor Spending in the Bay Area
Economic Impact Business Revenues Payroll Jobs
I Direct Impact Visitor Spending Activity Direct Visitor Spending $10539626000 $3870828000 96121 II Indirect Impact Suppliers of Goods and Services Due to Visitor Spending Off‐Airport $3066523000 $1234317000 15268 III Induced Impact Re‐Spending of Worker Income Due to Visitor Spending Off‐Airport $4560386000 $1685335000 26893 Total Regional Impact in Bay Area $18166535000 $6790480000 138282
Notes Dollars rounded to thousands Columns may not add due to rounding
Sources SFO Traffic Statistics and national data sets from the Department of Transportation Visitor Survey US Department of Commerce data provided by IMPLAN IMPLAN multiplier package Calculations by EDR Group
2017 Economic Impact Study of San Francisco International Airport 33
This Page Left Blank Intentionally
2017 Economic Impact Study of San Francisco International Airport 34
CHAPTER 5 IMPACTS OF AIR RELIANT USERS
(FREIGHT SHIPPERS)
For this study ldquoreliant usersrdquo are defined as manufacturers and agricultural industries that ship products by air through SFO26
THE ROLE OF SFO IN AIR EXPORTS
SFO plays a critical role in Californiarsquos economy by enabling manufacturers and agricultural producers to transport commodities and finished goods to customers in both domestic and international markets This section on air reliant activities signifies the contribution of SFO to economic development in the Bay Area by enabling regional firms to sell products across the US and the world and thereby maximize shares of national and international trade Without the services offered at SFO (and if the similar scale of air services is not taken up by another regional airport) companies in the Bay Area that produce and ship products would find markets limited and market shares curtailed In turn economic activity in the Bay Area that is associated with production of goods shipped through SFO would be reduced
A review of the products shipped from the Bay Area through SFO provides an insight into the cross‐section of the economy that is reliant on‐air cargo services at SFO in particular Silicon Valley located in Santa Clara county and home to major technology companies and start‐ups This analysis is based on industry specific data from the Foreign Trade Division of the US Census Bureau and the Freight Analysis Framework of the US DOT (Federal Highway Administration) and economic output by industry from the US Bureau of Economic Analysis (collected by the Minnesota IMPLAN Group)27
INTERNATIONAL EXPORTS
SFO is a gateway for the Bay Area manufacturing and other industries to deliver their products to customers throughout world To assess the role that SFO plays in exports from the Bay Area the following methodology was applied According to data from the Foreign Trade Division (collected by WISERTrade) 25 of all California air exports that originated in California passed through SFO This percentage was applied to all industry sectors (three‐digit NAICS) to estimate the value and types of Californian exports going through SFO To isolate the Bay Area specific exports the ratio of Bay Area output to total California output was calculated using US Bureau of Economic Analysis (BEA) data and applied to California exports going through SFO28 The results represent estimates of international exports by industry that are produced by Bay Area businesses and exported for sale through SFO This methodology is further explained in Appendix I
Air‐freight shipped from SFO is overwhelmingly concentrated in technology goods produced in the Bay Area The leading export industry is Computer and Electronics manufacturing which accounts for nearly
26 This definition is based on past SFO Economic Impact Studies 27 At this writing the most recent year available for both Foreign Trade Division and US Bureau of Economic Analysis information
is 2016 28 Provided through the Minnesota IMPLAN Group
2017 Economic Impact Study of San Francisco International Airport 35
two‐thirds of the regionrsquos exports by value as indicated in Table 20 The next four ranked industries (chemicals machinery transportation equipment electrical equipment and appliances) account for an aggregate 26 of total Bay Area exports Altogether the top five industries account for 89 of the total value of goods that originates in the Bay Area and are shipped through SFO
Table 20 Top International Exported Industries
Industry Value (in $millions)
of Total
Computers and Electronics $5430 631 Chemicals $848 99 Machinery $742 86 Transportation Equipment $425 49 Electrical Equipment amp Appliances $232 27 All others $928 108 Total $8604 100
Sources US Census Bureau Foreign Trade Division collected by WISERTrade
DOMESTIC EXPORTS
The FHWA Freight Analysis Framework (FAF) was used to identify the domestic flows of Bay Area goods to US customers via SFO The FAF areas are represented by Combined Statistical Areas (CSAs) represent the FAF areasmdashthe San Francisco CSA includes 12 counties (the Bay Area plus San Benito Santa Cruz and San Joaquin counties) To scale the commodity flows to the nine‐county Bay Area a ratio was applied like the approach described above for international exports This ratio was calculated using the BEA industry output for the nine‐county region and was divided by the industry output for the 12‐county CSA
Even more concentrated than international exports domestic shipments are highly concentrated in computer and electronics and electrical equipment manufacturingmdashcombined these sectors account for 75 of the total Bay Area produced shipments through SFO The second largest amount of exports is in chemicals which represents 94 of all exports as indicated in Table 21 Together the top five industries represent 91 of the total value of Bay Area domestic exports through SFO
Table 21 Top Domestic Shipped Industries
Industry Value (in $millions)
of Total
Computers and Electronics $3419 423 Electrical Equipment amp Appliances $2642 327 Chemicals $761 94 Transportation Equipment $302 37 Machinery $191 24 All Others $766 95 Total $8081 100
Source Freight Analysis Framework US Department of Transportation
2017 Economic Impact Study of San Francisco International Airport 36
Combining both domestic and international products still highlights the integral part that computer and electronics and electrical equipment manufacturing (70) plays within the Bay Area compared to other manufacturing sectors (Figure 10) and the significance that SFO has in enabling these products to reach their customers
Figure 10 Percentage of the Bay Arearsquos Combined Domestic and International Exports Shipped via SFO
Sources US Census Bureau Foreign Trade Division collected by WISERTrade and Freight Analysis Framework US Department of Transportation
ECONOMIC CONTRIBUTION OF SFO TO THE BAY AREA
To gauge the level of impact EDR Group used US Bureau of Economic Analysis (BEA) data included in IMPLAN to 1) estimate the jobs and wages associated with the domestic and international exports through SFO and 2) determine the additional activity that percolates throughout the economy as air‐reliant businesses purchase additional goods and services from suppliers (Indirect) and employees spend their additional income (Induced) BEA data within IMPLAN is used because it contains information about the structural buyer‐supplier relationships within the economy as well as the industries where labor income is usually spent
Overall $167 billion in domestic and international exports shipped via SFO contribute to over 26000 jobs and over $40 billion in labor income within the Bay Area (Table 22) When including purchases of supplier goods and services (Indirect) and employee wage re‐spending (Induced) the total impact of air exports on the Bay Area economy accounts for over 84000 jobs and nearly $29 billion in business sales (output) Appendix I describes the methodology used to develop these calculations
2017 Economic Impact Study of San Francisco International Airport 37
Table 22 Economic Value of Domestic and International Exports Originating in the Bay Area via SFO
Impact Type Employment Labor Income Output Direct Effect 26078 $4023963000 $16721996000
Indirect Effect 20448 $2262032000 $6067692000
Induced Effect 37706 $2408696000 $6186854000
Total Effect 84232 $8694691000 $28976542000
Source US Department of Commerce data provided by IMPLAN Calculations by EDR Group
EFFECTS ON SUPPLIERS OF GOODS AND SERVICES
Figure 11 profiles the employment supported when Bay Area air‐reliant businesses purchase goods and services from other Bay Area businesses In total over 20000 jobs are dependent on Bay Area air‐reliant businesses that purchase goods and services to make final products that are shipped via SFO Most jobs are in the services sector which accounts for over 10000 of the indirect jobs
Figure 11 Employment Impacts on Suppliers of Goods and Services (Indirect)
Service
Trade
Manufacturing
Transp Inform amp Utilities
Government
Construction
Agriculture
Mining
Jobs
Source US Department of Commerce data provided by IMPLAN Calculations by EDR Group
At a finer level of BEA industry detail purchases made by Bay Area air‐reliant businesses are concentrated in wholesale trade administrative support professional scientific and technical services management of companies and computers and electronics As shown in Table 23 these five industries represent 60 of the total jobs supported by air reliant business purchases Nearly 40 of the job impacts are spread across other industries indicating that the dependence on Bay Area businesses that use SFO is widespread across most the local economy
0 2000 4000 6000 8000 10000 12000
2017 Economic Impact Study of San Francisco International Airport 38
Table 23 Impacts on Suppliers of Goods and Services (Indirect) by BEA Industry
Industry Category Jobs of Total
Wholesale trade 3709 18 Administrative Support 2881 14 Professional Scientific amp Technical Services 2588 13 Management of Companies 1810 9 Computer amp Electronics 1311 6 Government 743 4 Repair amp Maintenance 619 3 Food amp Beverage 616 3 Fabricated Metals 592 3 Construction 546 3 Rest of Others 5034 25 Total 20448 100
Source US Department of Commerce data provided by IMPLAN Calculations by EDR Group
The following sections did not include any updated information and therefore can be found in Chapter 5 Impacts of Air Reliant User (Freight Shipper) within the 2016 Economic Impact Study of San Francisco International Airport Overview of International Freight Activity SFO Connects the Bay Area to Domestic Markets Commodities Shipped from SFO to Domestic Markets County by County Commodity Movements
2017 Economic Impact Study of San Francisco International Airport 39
CHAPTER 6 TAX IMPACTS GENERATED BY ACTIVITIES AT SFO
The income and business sales produced by economic activities at SFO in turn generate federal state county and municipal tax revenues This chapter presents estimates of state and local tax impacts from airport activities as well as federal aviation taxes derived from aviation services29
STATE AND LOCAL TAX IMPACTS
The state and local tax revenues linked to operations at SFO totaled nearly $29 billion in 2016 including close to $16 billion from direct activities and almost $13 billion from purchases of supplier goods and services (Indirect) and re‐spending of worker income (Induced) Tax revenues are estimated using effective tax rates calculated by BEA and US Census data (as organized through IMPLAN) as well by considering California publications including the Governorrsquos Budget Summary ndash 2015‐16 Comprehensive Annual Financial Report of the State Controllerrsquos Office and the County of San Mateo Appendix II includes a breakout of tax revenues by county where applicable
Table 24 Estimated 2016 State and Local Tax Impacts (in $ millions)
Impact Category Direct Activities Indirect Induced
Activities Total Activities
On‐Airport $602 $336 $937
Construction $7 $16 $23
Visitor Spending $697 $345 $1041
Air‐Reliant Businesses $280 $592 $872
Total Taxes $1586 $1288 $2874
Sources Totals may not sum due to rounding Based on information from Regional Economic Accounts (REA) and National Income and Product Accounts (NIPA) from the Bureau of Economic Analysis (BEA) and Consumer Expenditure Survey (CES) and the Annual Survey of State and Local Government Finances (SLGF) from the US Census Bureau
FEDERAL AVIATION TAXES
Aviation operations at SFO generated more than $12 billion dollars in federal taxes including $419 million from taxes on international and domestic passengers and $791 million in US Customs revenue from customs duties on international air cargo shipments (Table 25) These tax revenues are remitted to the US Department of the Treasury and may not directly benefit the Bay Area or the State of California
29 Data developed in this chapter should be considered as order of magnitude estimates As in previous economic impact studies for SFO tax impacts are derived from per‐capita measures
2017 Economic Impact Study of San Francisco International Airport 40
Table 25 Estimated 2016 Federal Aviation Tax Revenues
Type of Tax ChargesFees Revenues in millions
of Total
Customs and Immigration $550 and $7 per passenger $32 3
International Arrival and Departure Tax $1800 per passenger $93 8
Domestic Passenger Taxes $410 per passenger amp 75 of airfare $237 20
Sept 11th security fee $560 per passenger $57 5
Sub‐Total Passenger Related Taxes $419 35
US Customs Revenue (International Cargo) Customs Revenues (US ITC) $791 65
Total $1211 100
Notes Includes US Government Segment tax Does not include Domestic Transportation tax (75 of airfare cost)
Sources Federal Aviation Administration wwwairlinesorg and wwwWiserTradecom
2017 Economic Impact Study of San Francisco International Airport 41
CHAPTER 7 DISTRIBUTION OF IMPACTS BY BAY AREA COUNTIES
This chapter presents the distribution of direct jobs and income as well as the distribution of tax benefits among Bay Area counties for on‐airport and visitor spending categories Local impacts are based on a sample of almost 24000 on‐airport employees by zip code compiled for the 2016 Study
ON‐AIRPORT EFFECT AMONG BAY AREA COUNTIES
Table 26 and Table 27 show estimates of jobs payroll (labor income) and business revenues (output) associated with each of the nine Bay Area counties that are generated by on‐airport economic activity In Table 26 direct and induced employment and wages are allocated to the counties based on the residence of employees of the Airport Commission staff its contract workers and tenants Due to the location of SFO all direct business revenues (direct output) are generated in San Mateo County (Table 29) Economic impacts (employment payroll and business revenues) associated with supplier purchases (indirect) were applied proportionally to each county based on relative employment levels compared to the Bay Area region
Table 26 Employment and Labor Income Impacts of On‐airport Tenants by County
County Impact Type
Employ ment
Labor Income County Impact Type
Employ ment
Labor Income
Alameda
Direct 5487 $339835000 San Mateo
Direct 12197 $755396000 Indirect 2836 $247852000 Indirect 1516 $132524000 Induced 2562 $190496000 Induced 5696 $423440000 Total 10885 $778183000 Total 19409 $1311360000
Contra Costa
Direct 2600 $161011000 Santa Clara
Direct 1307 $80940000 Indirect 1505 $131531000 Indirect 3750 $327807000 Induced 1214 $90255000 Induced 610 $45371000 Total 5319 $382797000 Total 5668 $454118000
Marin
Direct 221 $13692000
Solano
Direct 1125 $69671000 Indirect 551 $48121000 Indirect 527 $46064000 Induced 103 $7675000 Induced 525 $39054000 Total 875 $69488000 Total 2177 $154789000
Napa
Direct 125 $7741000
Sonoma
Direct 199 $12323000 Indirect 291 $25428000 Indirect 836 $73075000 Induced 58 $4339000 Induced 93 $6908000 Total 474 $37508000 Total 1128 $92306000
San Francisco
Direct 6618 $409849000 Outside Bay Area
Direct 10908 $675588000 Indirect 2518 $220117000 Indirect NA NA Induced 3090 $229743000 Induced 5094 $378704000 Total 12226 $859709000 Total 16002 $1054292000
Total
Direct 40787 $2526046000 Indirect 14330 $1252519000 Induced 19047 $1415985000 Total 74164 $5194550000
Notes Cells left blank because indirect impacts from the Bay Area are only allocated to each of the 9 counties Sources Airport Tenant Survey Data Provided by SFO and US Department of Commerce data provided by IMPLAN Calculations by EDR Group
2017 Economic Impact Study of San Francisco International Airport 42
Table 27 Business Revenues Impacts of On‐airport Tenants by Bay Area County
County Impact Type Business Revenues
County Impact Type Business Revenues
Alameda
Direct $0
San Mateo
Direct $8042484000 Indirect $583266000 Indirect $311867000 Induced $505583000 Induced $1123825000 Total $1088849000 Total $9478176000
Contra Costa
Direct $0
Santa Clara
Direct $0 Indirect $309528000 Indirect $771423000 Induced $239541000 Induced $120417000 Total $549069000 Total $891840000
Marin
Direct $0
Solano
Direct $0 Indirect $113241000 Indirect $108402000 Induced $20370000 Induced $103651000 Total $133611000 Total $212053000
Napa
Direct $0
Sonoma
Direct $0 Indirect $59839000 Indirect $171965000 Induced $11517000 Induced $18333000 Total $71356000 Total $190298000
San Francisco
Direct $0 Outside Bay Area in CA
Direct $0 Indirect $517998000 Indirect NA Induced $609744000 Induced $1005092000 Total $1127742000 Total $1005092000
Total
Direct $8042484000 Indirect $2947529000 Induced $3758073000 Total $14748086000
Notes Cells left blank because indirect impacts from the Bay Area are only allocated to each of the 9 counties Sources Airport Tenant Survey Data Provided by SFO and US Department of Commerce data provided by IMPLAN Calculations by EDR Group
2017 Economic Impact Study of San Francisco International Airport 43
VISITOR SPENDING The visitor spending survey conducted at SFO documented the destinations of visitors who arrive in California through SFO Table 28 indicates the economic impacts associated with visitor spending for each county
Table 28 Economic Impacts of Visitor Spending by Bay Area County
Bay Area County Impact Type Employment Labor Income Visitor Spending
Alameda
Direct 6812 $274314000 $746911000 Indirect 1082 $87472000 $217315000 Induced 1906 $119435000 $323181000 Total 9800 $481221000 $1287407000
Contra Costa
Direct 4737 $190766000 $519423000 Indirect 752 $60831000 $151127000 Induced 1325 $83058000 $224749000 Total 6815 $334655000 $895299000
Marin
Direct 2732 $110014000 $299551000 Indirect 434 $35081000 $87155000 Induced 764 $47900000 $129613000 Total 3930 $192995000 $516319000
Napa
Direct 3933 $158385000 $431255000 Indirect 625 $50505000 $125474000 Induced 1100 $68960000 $186600000 Total 5658 $277850000 $743329000
San Francisco
Direct 52000 $2094047000 $5701745000 Indirect 8260 $667743000 $1658933000 Induced 14549 $911735000 $2467086000 Total 74808 $3673525000 $9827764000
San Mateo
Direct 10475 $421828000 $1148568000 Indirect 1664 $134511000 $334178000 Induced 2931 $183661000 $496973000 Total 15069 $740000000 $1979719000
Santa Clara
Direct 10832 $436224000 $1187767000 Indirect 1721 $139102000 $345583000 Induced 3031 $189929000 $513934000 Total 15584 $765255000 $2047284000
Solano
Direct 667 $26864000 $73147000 Indirect 106 $8566000 $21282000 Induced 187 $11697000 $31650000 Total 960 $47127000 $126079000
Sonoma
Direct 3933 $158386000 $431259000 Indirect 625 $50506000 $125476000 Induced 1100 $68960000 $186601000 Total 5658 $277852000 $743336000
Total
Direct 96121 $3870828000 $10539626000 Indirect 15268 $1234317000 $3066523000 Induced 26893 $1685335000 $4560387000 Total 138282 $6790480000 $18166536000
Sources Airport Visitor Spending Survey Data Provided by SFO and US Department of Commerce data provided by IMPLAN Calculations by EDR Group
2017 Economic Impact Study of San Francisco International Airport 44
TAX IMPACTS BY BAY AREA COUNTY
Tax revenues including sales property (business and labor) corporate and income taxes are collected from on‐airport tenants and the workers that they employ directly at SFO Table 29 indicates the tax revenues generated from each impact type (direct IndirectInduced and Total) by county Direct tax revenues paid by individuals and households are apportioned according to place of residence of Airport Commission staff contact employees and tenants Direct taxes paid by businesses originate in San Mateo County due to the location of the Airport
Table 29 Tax Revenues by County for On‐airport Tenants
Bay Area Counties
Direct Indirect Induced
Total
Alameda $10303000 $53898000 $64201000
Contra Costa $4882000 $27089000 $31971000
Marin $415000 $6369000 $6784000
Napa $235000 $3405000 $3640000
San Francisco $12426000 $56329000 $68755000
San Mateo $548000000 $73751000 $621751000
Santa Clara $2454000 $42422000 $44876000
Solano $2112000 $10527000 $12639000
Sonoma $374000 $9009000 $9383000
Outside Bay Area $20483000 $52913000 $73396000
Total $601684000 $335712000 $937396000
Notes Direct tax revenues shown in San Mateo County include $33 million in Possessory Interest Tax revenues as estimated for the 2016 Study
Sources Governorrsquos Budget Summary State Controllerrsquos Office the County of San Mateo Bureau of Economic Analysisrsquo (BEA) National Income and Product Accounts (NIPA) the US Census Bureau (Consumer Expenditure Survey Annual Survey of State and Local Government Finances) US Department of Commerce data provided by IMPLAN Airport Tenant Survey and Information Provided by SFO Calculations by EDR Group
Tax revenues including sales property (business and residential) corporate and income taxes are also generated by visitors and businesses that provide goods and services to domestic and international visitors Table 30 below outlines the tax revenues provided by each county by business in the hotel restaurant transportation entertainment and retail industries (direct) the businesses that support these industries (indirect) and the tax revenue generated by employees spending their earned income (induced)
2017 Economic Impact Study of San Francisco International Airport 45
Table 30 Tax Revenues by County for Visitor Spending
Bay Area Counties Direct Indirect Induced
Total
Alameda $49365000 $24431000 $73796000
Contra Costa $34330000 $16990000 $51320000
Marin $19798000 $9798000 $29596000
Napa $28502000 $14106000 $42608000
San Francisco $376840000 $186502000 $563342000
San Mateo $75911000 $37569000 $113480000
Santa Clara $78502000 $38851000 $117353000
Solano $4834000 $2393000 $7227000
Sonoma $28503000 $14106000 $42609000
Total Taxes $696585000 $344746000 $1041331000
Sources Governorrsquos Budget Summary State Controllerrsquos Office Bureau of Economic Analysisrsquo (BEA) National Income and Product Accounts (NIPA) the US Census Bureau (Consumer Expenditure Survey Annual Survey of State and Local Government Finances) US Department of Commerce data provided by IMPLAN and SFO Airport Visitor Survey Calculations by EDR Group
2017 Economic Impact Study of San Francisco International Airport 46
This Page Left Blank Intentionally
2017 Economic Impact Study of San Francisco International Airport 47
APPENDIX I METHODOLOGY FOR THE ANALYSIS
OF OVERALL ECONOMIC IMPACTS
Airport jobs and commerce on the Airport premises create strong economic stimuli for the Bay Area This airport business activity itself generates an increased demand for other local goods and services Not only do the businesses based on the Airport pay local and state taxes but the off‐airport businesses that depend upon airport‐based activity pay taxes as well As shown in this study the direct business activity and subsequent multiplier effects have a strong overall impact on the economy
All economic impacts in this report are described using the measures of jobs payroll and business sales The study quantifies three distinct categories of economic benefits that result from SFO‐related activities direct indirect and induced effects as described below
Direct impacts stem from the activity that is directly related to the provision of aviation services visitor spending or the activity of aviation‐reliant businesses For example the direct impacts of on‐airport tenants include the number of persons they employ on the Airport the wages and benefits paid to those workers and their business sales Similarly the direct impacts of air visitors include the money they spend on services and supplies and the jobs and payroll supported by those expenditures Most of the direct impacts measured in this study occur on‐airport but some such as visitor spending and the benefits produced by aviation dependent businesses occur off‐airport
Indirect and induced impacts which are sometimes called ldquomultiplier impactsrdquo result from (1) a portion of business sales used for ldquobusiness‐to‐businessrdquo purchases of goods and services (indirect effects) and (2) the recirculation of worker incomes and business expenditures in the broader Bay Area economy (induced effects) For example an airport restaurant may buy supplies from a Bay Area produce vendor This purchase represents income (ie new business sales) to the produce supplier which uses a portion of that income to pay its workers and buy additional goods and services from other businesses in the region In addition airport workers spend their wages on other items such as housing retail purchases and services Those expenditures in turn support jobs in those industries whose workers then spend their salaries in the Bay Area These successive rounds of spending and job creation represent the indirect impacts (business‐to‐business) and induced impacts (spending of wages) This study specifically measured the indirect and induced impacts that occur in the county economies of the Bay Area The discussions of total impacts are based on the following analyses and are illustrated in Figure 12
2017 Economic Impact Study of San Francisco International Airport 48
Figure 12 Elements of Economic Impacts and Interrelationships
Source EDR Group
2017 Economic Impact Study of San Francisco International Airport 49
SUPPLIERS OF GOODS AND SERVICES (INDIRECT MULTIPLIER EFFECTS)
Orders from Businesses at the Airport
Activities occurring at the Airport generate additional orders for goods and services from suppliers including orders for
Printing and publishing for the Airport operator and the airlines
Banking insurance legal accounting and technical services for airport businesses
Off‐site bus and parking services for SFO employees
Food products for airport restaurants
Wholesale merchandise to be sold by airport stores
Furniture and equipment for offices hotels restaurants and stores located at the Airport
Orders from Off‐Airport Businesses Serving Air Travelers
Activities serving air travelers outside of the Airport also generate additional orders for goods and services from suppliers for
Fueling and maintenance services for use by off‐airport taxis rental cars tour buses and public transportation
Construction and support operations of convention and hospitality facilities for convention visitors
Food products for off‐airport restaurants
Wholesale merchandise to be sold by off‐airport stores
Furniture and equipment for off‐airport hotels restaurants and stores
RE‐SPENDING OF WORKER INCOME (INDUCED MULTIPLIER EFFECTS)
The workers at SFO at off‐airport businesses serving air visitors and at supplier businesses earn income and most of that income is re‐spent on consumer purchases which support additional jobs within the Bay Area Examples of these purchases include
Retail purchases of food clothing home furnishings cars electronic devices computers and other products
Purchases of services spanning haircuts cleaning car repair and insurance
2017 Economic Impact Study of San Francisco International Airport 50
CALCULATING THE DOMESTIC AND INTERNATIONAL VALUES FROM CARGO
ORIGINATING IN THE BAY AREA AND SHIPPED THROUGH SFO
The combined $17 billion of international and domestic exports through SFO provides a significant direct contribution to the Bay Area economy as well as additional activity through economic linkages To estimate the level of impact EDR Group layered three sets of data ndash the Foreign Trade Database (FTD) of the US Bureau of the Census (tabulated by WISERTrade) the multi‐modal Freight Analysis Framework (FAF) of the US Federal Highway Administration and US Bureau of Economic Analysis (BEA) data included in IMPLAN to
1) Estimate the jobs and wages associated with the domestic and international exports through SFO and
2) Determine the additional activity that percolates throughout the economy as air‐reliant businesses purchase additional goods and services from suppliers (Indirect) and employees spend their additional income (Induced)
FTD data aggregated by WISERTrade was the basis of estimating the weight and value of goods produced in the Bay Area and exported from SFO to international markets FTD provides total exports by commodity and state of origin and the total value of California exports shipped through SFO WISERTrade also provides total value and weight by commodity for all shipments from SFO but not at a commodity level by point of origin Using IMPLAN data the ratios of output by commodity were calculated for the nine‐county Bay Area compared to California totals This calculation estimated the ldquosharerdquo of California produced air exports with an approximate point of origin in the Bay Area The calculation was constrained by both the value and weight reported by WISERTrade of exports by commodity from SFO and the weight of international shipments from SFO taken from the flysfo website
FAF was the basis of estimating domestic cargo shipments FAF provides domestic air shipments of commodities that originate in the twelve county San Jose‐San Francisco‐Oakland CA Combined Statistical Area Using IMPLAN data output by commodity for the nine‐county Bay Area were compared to the twelve county CMSA to estimate the ldquosharerdquo of each commodity shipped from the CSA
BEA data within IMPLAN profiles the structural buyer‐supplier relationships within the economy as well as the industries where labor income is usually spent Figure 13 illustrates the methodology of calculating the domestic and international values from the Bay Area through SFO
2017 Economic Impact Study of San Francisco International Airport 51
Figure 13 Methodology to Estimate Air Dependent Contribution to Bay Area Economy
3 Freight shipments by value
2 Geography
1 Calculations
MAJOR SOURCES OF DATA USED IN THIS STUDY
The discussion of total impacts is based on the following analyses conducted specifically for this study
1 A survey of all airport tenants and the data provided by staff of the San Francisco Airport Commission These data provide profiles of on‐airport jobs by establishment type of business activity and place of residence by zip code for airport and tenant employees
2 Polaris Research conducted surveys of airport travelers were conducted by Polaris Research The survey profiled trip purposes international or domestic origins segmentation of visitors from local residents and connecting passengers and the amount of money in the Bay Area spent by visitors using the Airport
3 Air freight analyses are based on data from SFO WISERTrade using data from US Census Bureau Foreign Trade Division30 and the Freight Analysis Framework (FAF) to develop a detailed profile of air exports from SFO by commodity and origin of movement Detailed data from FAF are not available for the Bay Area alone (statewide for the Foreign Trade Division and a 12 county combined statistical area (CSA) for FAF) Therefore the detailed commodity flows found in the data sets are proportioned based on the output per industry (converted from commodities) of the Bay Area
30 The World Institute for Strategic Economic Research (WISERTrade) formed July 1 2004 to continue the international trade data work of its predecessor MISER was chosen by the US Census Bureau to be one of its first Business and Industry Data Centers with special focus on foreign trade statistics See wwwwisertradeorg
2017 Economic Impact Study of San Francisco International Airport 52
4 Econometric models for the nine‐county Bay Area are based on the IMPLAN Economic Model System IMPLAN is used to estimate wages and sales (or budget expenditures for public entities) for airport tenants where only employment totals were available Labor income and sales andor expenditures per worker are derived primarily from US Department of Commerce (BEA is a part of the Commerce Department) and Department of Labor data sets and are county‐specific IMPLAN is also used to derive multiplier effects including business orders to suppliers generated by on‐airport businesses off‐airport businesses serving airport visitors and airport‐reliant businesses and business sales generated by the spending of the additional workersrsquo income on consumer purchases
2017 Economic Impact Study of San Francisco International Airport 53
APPENDIX II SUMMARY OF IMPLAN SECTORING
To estimate the full range of direct effects and the indirect and induced (ldquomultiplierrdquo) economic effects this study utilized the IMPLAN model system of MIG Inc IMPLAN is now the most widely used input‐output economic modeling system in the US with a client list of 500 public and private agencies including several federal agencies and numerous state agencies It utilizes US Commerce Department (National Income and Product Accounts) data on inter‐industry technology relationships (also known as input‐output structural matrices) countywide employment and income data from the Bureau of Economic Analysis (BEA) and Bureau of Labor Statistics (BLS) and its own industry and county‐specific estimates of local purchasing rates (ldquoregional purchase coefficientsrdquo) It is enhanced over most other input‐output models in that it also includes coverage of public sector activity and consumer activity (reflected in its ldquosocial accounting matrixrdquo) The industry detail is at the level of 536 industries and is based on categories of the US Bureau of Economic Analysis (BEA) which correspond to two to five digit groups in the North American Industry Classification System (NAICS)
For this study the direct job payroll and business revenue effects for on‐airport and visitor spending were documented through surveys completed for this project and then assigned to specific sector groups based on EDR Grouprsquos experience in aviation SFOrsquos support of air reliant industries was documented through databases maintained by the US Census Bureau and the US Department of Transportation The IMPLAN model was then calibrated for the nine‐county Bay Area as well as for each county within the region and a model calibrated for a defined region outside the Bay Area to measure additional visitor spending The result was an estimate of the indirect and induced (and overall) job business revenue and income impacts for each segment of airport beneficiary The analysis of retail impacts was adjusted to account for retail markup margins and the concentration of sales in airports and in visitor industries Retail portions of multiplier effects also incorporate these margins
Regardless of whether economic impacts are measured in terms of jobs income or business sales these impacts can be classified into three categories
Direct economic effects are the changes occurring at the project site as a direct consequence of the public investment project or program This is represented as the net increase in business activity associated with business at the SFO initial visitor spending at off‐airport businesses in each countyrsquos hospitality sector and the sale revenues earned by shippers who route air cargo through SFO
Indirect economic effects are the broader effects on business activity for off‐site goods and services supplied to the directly affected businesses
Induced economic effects are further shifts in spending on food clothing shelter and other consumer goods and services because of the change in workers and payroll of directly and indirectly affected businesses
EDR Group assembled classifications of the 536 sectors in the IMPLAN modeling package to best mirror types of industries on SFO types of visitor spending and industries related to commodities exported from SFO The classification schemes used for this study for on‐airport and visitor spending impacts are shown in Table 31 and Table 32
2017 Economic Impact Study of San Francisco International Airport 54
Table 31 Industry Classification of On‐Airport Industries
Airport Tenants Classification IMPLAN Sectors Used Passenger Airlines Air Transportation Freight Airlines Couriers Air Transportation Couriers Fixed Based Operator (FBO) Support activities for transportation Local Government
State and Local Government State Government
Federal Government Immigration TSA FBI US Customs and Border Patrol (CBP) National Weather Service
Distribution TruckingWarehousing Wholesale Wholesale Trade business Security Security Aviation Firms
Construction
Highways and Streets Commercial Structures Non‐residential structures Maintenance and Repair
Retail
ElectronicsAppliance Stores Food and Beverage Health and Labor Care Clothing Stores Sporting Goods Stores Misc Retail
Food and Beverage (includes Catering Firms) Full‐service restaurants Limited‐service restaurants All other food and drinking places
Car Rental Car Rental Ground Transportation (incl taxis limos buses vans and transit)
Transit and ground passenger transp
Other Medical Clinic Vending Machines
Services
Educational institutions Electronic repair services Insurance Medical services Other Support Services Telecommunications Waste Management
Reliant Services
ArchitecturalEngineering Business support Computer systems design services Facilities support Financial Services Management scientific and Technical Parking and Misc
2017 Economic Impact Study of San Francisco International Airport 55
Table 32 Industry Classification of Visitor‐Serving Industries
Visitor Spending Classification
IMPLAN Sectors Used
ElectronicsAppliance Stores
Food and Beverage
Health and Labor
Retail Clothing Stores
Sporting Goods
General Merchandise
Misc Retail
Performing Arts
Spectator Sports
Artists writers and performers
Museums zoos and parks
Entertainment Amusement parks and arcades
Gambling industries
Fitness and recreational sports centers
Bowling centers
Other amusement recreation
Full‐service restaurants
Restaurant Limited‐service restaurants
All other food and drinking places
Hotels and motels Hotel
Other accommodations
Transit and ground passenger transportation
Scenic and sightseeing Transportation
Support activities
Gas stations
Sources US Department of Commerce data provided by IMPLAN Calculations by EDR Group
2017 Economic Impact Study of San Francisco International Airport 56
This Page Left Blank Intentionally
2017 Economic Impact Study of San Francisco International Airport 57
APPENDIX III SFO TENANT AND VISITOR SURVEYS
The following pages are the survey instruments used for SFO tenants and visiting passengers Note that the passenger survey was administered in multiple languages
2017 Economic Impact Study of San Francisco International Airport 58
2017 Economic Impact Study of San Francisco International Airport 59
2017 Economic Impact Study of San Francisco International Airport 60
2017 Economic Impact Study of San Francisco International Airport 61
2017 Economic Impact Study of San Francisco International Airport 62
2017 Economic Impact Study of San Francisco International Airport 63
2017 Economic Impact Study of San Francisco International Airport 64
2017 Economic Impact Study of San Francisco International Airport 65
2017 Economic Impact Study of San Francisco International Airport 66

INDIRECT AND INDUCED IMPACTS
The direct economic activities at SFO lead to additional downstream impacts on suppliers as well as re‐spending of worker income To calculate the impacts of these effects indirect and induced multipliers were calculated for each of the categories listed in Table 10
Table 10 Direct Employment Labor Income and Business Revenues for Tenant and Administrative SFO
Classification of Activity by Sector Employment Payroll Revenues
Passenger Services amp Airport Administration
OtherNon‐Profit 93 $5449000 $12763000 StateLocal Government 93 $6998000 $15636000 Parking and Miscellaneous 232 $15853000 $30350000 Management MaintCleaning amp Facilities Services 339 $35846000 $79634000 Federal Government 1814 $223187000 $326720000 City of San Francisco Airport Commission 1998 $257567000 $300062000 Security Firms 2011 $101198000 $136874000 FBOs General Aviation and Aviation Services 4062 $180244000 $418961000 Airport Retail and Concessions 4904 $171696000 $626054000 Passenger Airlines 14962 $1148294000 $4896253000 Sub Total 30507 $2146332000 $6843307000
Freight Transportation Services Freight Airlines and Couriers 485 $31351000 $119587000
Passenger Ground Transportation Services LimosBusesVansTransit 2618 $85443000 $190926000 Taxi Cabs 2809 $91686000 $204877000 Transportation Network Companies (TNCs) 2131 $69544000 $155400000 Rental Car 2238 $101689000 $528386000 Sub Total 9375 $334665000 $1048981000
Total Airport‐Based 40787 $2526045000 $8042483000
Notes Data excludes on‐airport construction activities conducted in 2016 Dollars rounded to the nearest thousand Columns may not add due to rounding
Sources Interviews of tenants airport administration and US Department of Commerce data provided by IMPLAN Calculations by EDR Group
In 2016 the direct economic activities on‐airport generated an additional $67 billion in business revenues in the Bay Area (indirect and induced effects) supporting over 33000 additional jobs and $26 billion in labor income (payroll) The total economic contribution of on‐airport activity to the Bay Area is roughly $147 billion in revenues yielding nearly 74200 jobs and $52 billion in labor income for workers (see Table 11) Suppliers of goods and services generated approximately $29 billion in revenues over 14000 jobs and expended over $12 billion on payroll (indirect impacts) The re‐spending of labor income by workers on airport and supplier firms supported nearly 19000 additional Bay Area jobs with over $14 billion in payroll and $37 billion in new business sales
2017 Economic Impact Study of San Francisco International Airport 25
Table 11 Summary of Direct Indirect and Induced Economic Impacts of SFO in Bay Area
Economic Impacts Employment Payroll Revenues I Direct Impact Airport‐Driven Activity Airport‐Based 40787 $2526045000 $8042483000 II Indirect Impact Suppliers of Goods and Services Due to Airport and Related Activities 14330 $1252520000 $2947530000 III Induced Impact Re‐Spending of Worker Income Due to Airport and Related Activities 19047 $1415986000 $3758072000 Total Regional Impact 74164 $5194551000 $14748085000
Notes Dollars rounded to the nearest thousand Columns may not add due to rounding
Sources Interviews of tenants airport administration and US Department of Commerce data provided by IMPLAN Calculations by EDR Group
On‐airport businesses purchase supplies and services from the greater Bay Area economy which is highly concentrated in air‐reliant services22 transportation support other services and food and beverage industries which combined represent 71 of all supporting industries (Table 12) The wages spent by employees of on‐airport businesses for their daily living needs are primarily spent on service sectors food and beverages and retail which combine to be 74 of all purchases made within in the Bay Area economy as indicated in Table 13
Table 12 Supplier of GoodsServices Industries (Indirect)
Industry Employment of Total
Air‐reliant services 3042 21 Other Services 3017 21 Transportation Support 2951 21 Food amp Beverage 1128 8 Couriers 681 5 Wholesale Trade 602 4 State amp Local Government 499 3 Manufacturing 419 3 Construction 318 2 Banking amp Financial Services 269 2 All Others 1404 10 Total 14330 100
Sources US Department of Commerce data provided by IMPLAN Calculations by EDR Group
22 Air‐reliant services include architectural engineering business support computer systems design services facility support financial services management scientific technical services and consulting These sectors purchase large amounts of air transportation services Other Services include insurance rentalleasing building services landscaping waste management medical social and maintenance and repair A full listing is in Appendix I
2017 Economic Impact Study of San Francisco International Airport 26
Table 13 Re‐Spending of Worker Income Industries (Induced)
Industry Employment of Total
Services 6553 34 Food amp Beverage 2855 15 Reliant Services 2425 13 Retail 2277 12 Entertainment 734 4 Wholesale Trade 561 3 Banking amp Financial services 438 2 Manufacturing 292 2 State amp Local Government 253 1 All Others 2661 14 Total 19047 100
Sources US Department of Commerce data provided by IMPLAN Calculations by EDR Group
ON‐AIRPORT CONSTRUCTION
SFO provided a summary of all capital projects from FY 1314 to FY 1516 The summary of projects was provided in eight categories of expenditures including terminal airport support groundside environmental parking safety amp security airfield and utility improvements An analysis over multiple years is preferable to smooth‐out annual fluctuations that are typically seen in construction spending The objective of this approach is to estimate economic impacts of construction at SFO for a ldquotypical yearrdquo to mitigate the short‐term investment periods associated with single construction projects
Each type of expenditure is matched to the most appropriate industry sector in the IMPLAN modeling package as described in Table 14
Table 14 Sector Mapping
SFO Capital Construction Category IMPLAN Sector
Description
Terminal improvements Construction of nonresidential structures
Airport support improvements Facilities support services
Groundside improvements Maintenance and repair (roadway amp taxiway)
Environmental improvements
Maintenance amp Repair (nonresidential) Parking improvements
Safety amp security improvements
Airfield improvements
Utility improvements Water sewage and other systems
Source SFO and US Department of Commerce data provided by IMPLAN
2017 Economic Impact Study of San Francisco International Airport 27
After classifying each of the five expenditure categories into the corresponding IMPLAN sector these economic impacts of the capital investments were estimated for the nine Bay Area counties for an average year from FY 1314 ndash FY 1516 (Table 15)
Table 15 Annual Average Impacts from SFO Construction on the Bay Area Economy
Impact Type Employment Labor Income Expenditures Direct Effect 2041 $144669000 $366782000 Indirect Effect 644 $49244000 $122327000 Induced Effect 961 $60104000 $163281000 Total Effect 3645 $254017000 $652390000
Notes Dollars rounded to the nearest thousand Columns may not add due to rounding
Source Employment and Labor Income derived using IMPLAN
2017 Economic Impact Study of San Francisco International Airport 28
CHAPTER 4 VISITOR SPENDING
In the year ending June 2016 526 of domestic and international air travelers arriving at SFO were non‐residents visiting the region (representing 102 million of the 193 million origin and destination (OampD) enplanements at the Airport excluding connecting passengers) SFO traffic statistics and national data sets from the Department of Transportation show that that 26 of all visitors were international visitors 12 were Southern California residents served by four airports and 62 were visitors from other parts of the United States Surveys of air travelers indicate that 70 of visitors traveled for personal reasons to the Bay Area and 30 for business reasons The survey also shows that the trip purposes of domestic travelers are more likely to be business related than for international travelers (Figure 8)
Figure 8 Profile of Air Visitors Arriving via SFO by Place of Origin
Sources Visitor Survey Conducted by Polaris Inc SFO Traffic Statistics US DOT OampD Survey US DOT T‐100 Database IATA PaxIS Database US DOC National Travel and Tourism Office (NTTO) Calculations by EDR Group and ICF
2017 Economic Impact Study of San Francisco International Airport 29
VISITOR SPENDING
The survey of arriving visitors found that on average international visitors spend $1234 in the Bay Area and domestic US visitors spend $1024 per trip The breakdowns by trip origin and trip purpose (business or labor) are shown in Figure 9
Figure 9 Relative Spending of Visitors per Trip by Origin and Purpose
Sources Visitor Survey Conducted by Polaris Inc Calculations by EDR Group
Overall the off‐airport spending of the 102 million domestic and foreign visitors who arrived through SFO visitor amounted to nearly $111 billion of which approximately $105 billion was in the Bay Area and an additional $585 million was outside the Bay Area23 This encompasses spending on hotels food and beverage retail purchases entertainment and recreation and local travel (eg taxis car rental24 sight‐seeing trips and public transportation) The breakout of visitor spending by sector is shown in Table 16
Table 16 Off‐Airport SFO Visitor Spending Inside and Outside of the Bay Area
Sector Total within Bay Area Total Outside Bay Area Total
Accommodations $4515536000 $263822000 $4779358000 Food and Beverage $2407541000 $128195000 $2535735000 Retail $1769840000 $90393000 $1860234000 Entertainment $831216000 $44525000 $875740000 Car Rental $714078000 $50036000 $764114000 Ground Transportation $301415000 $7788000 $309203000 Total $10539626000 $584759000 $11124384000
Note Dollars are rounded to thousands
Sources SFO Traffic Statistics and national data sets from the Department of Transportation Visitor Survey Calculations by EDR Group
23 Visitor surveys conducted at SFO indicated if spending occurred within the Bay area or in surrounding counties 24 On‐airport car rentals are included in the On‐airport tenant estimates Car rentals off‐airport is included in the Visitor Spending
estimates
2017 Economic Impact Study of San Francisco International Airport 30
JOBS AND INCOME GENERATED BY OFF‐AIRPORT VISITOR SPENDING
The $111 billion spent in 2016 by visitors arriving through SFO supported over 138000 jobs within the Bay Area and an additional 8500 jobs supported by visitor spending outside the Bay Area in other counties in California
Table 17 Breakdown of Total Visitor Spending Impacts
Impact Type Employment Payroll Visitor Spending Total Visitor Spending Impacts in Bay Area Direct 96121 $3870828000 $10539626000 Indirect 15268 $1234317000 $3066523000 Induced 26893 $1685335000 $4560386000 Total 138282 $6790480000 $18166535000 Total Visitor Spending Impacts Outside of the Bay Area Direct 5731 $198297000 $584759000 Indirect 1185 $70593000 $205456000 Induced 1596 $79311000 $239010000 Total 8511 $348201000 $1029225000 Total Visitor Spending Impacts Due to SFO Direct 101852 $4069125000 $11124385000 Indirect 16452 $1304910000 $3271979000 Induced 28489 $1764646000 $4799396000 Total 146793 $7138681000 $19195760000
Notes Jobs include employees and proprietors Payroll includes wages profits and value of benefits
Sources Visitor Survey conducted by Polaris Inc SFO Traffic Statistics and national data sets from the Department of Transportation Calculations by EDR Group
The IMPLAN modeling package was tailored to the nine‐county Bay Area and the rest of California to calculate direct jobs and wages from visitor spending in the region and to capture spending in the remaining counties of California In the initial stage of the analysis spending profiles were developed as shown in Table 16 (lodging food and beverage entertainment retail and local ground transportation) were used in the initial stage of the analysis25 The first step was to apply business sales (the actual visitor spending) to worker ratios to estimate employment generated by visitor spending The second step involved applying payroll to worker ratios to these employment estimates to calculate the how much labor income is generated for each of the five categories of spending These ratios are summarized in Table 18 and the applied calculations are as follows
1 Step 1 Employment Generated by Visitor Spending = Visitor SpendingBusiness Sales per Worker (by sector)
2 Step 2 Labor Income Generated by Visitor Spending = Workers (calculated in Step 1 above) Labor Income per Worker (by sector)
25 IMPLAN packages data from federal agencies on a county basis including the US Department of Commerce and the US Department of Labor EDR Group developed the sectors that reflect visitor spending and aggregated the counties to build the Bay Area region and Outside‐Bay Area region
2017 Economic Impact Study of San Francisco International Airport 31
Table 18 Earnings and Sales per Worker
Sector Payroll per Worker
Sales per Worker
Ground Transportation $56195 $116579 Car Rental $45823 $233176 Accommodations $47874 $119611 Retail $41257 $83847 Entertainment $36507 $88861 Food amp Beverage $31016 $65252
Notes Payroll (labor income) includes wages and profits Retail Sales per worker are margined sales
Sources US Departments of Commerce of Labor data provided by IMPLAN Calculations by EDR Group
INDIRECT AND INDUCED IMPACTS
Activities serving air travelers or visitors outside of the Airport (see Table 16) also generate additional orders for goods and services from suppliers These include orders for
Fuel and maintenance services by off‐airport taxis rental cars tour buses and public transportation
Accounting fees paid by businesses in hospitality industries
Food products for off‐airport restaurants
Wholesale merchandise to be sold by off‐airport stores
Furniture and equipment for off‐airport hotels restaurants and stores
These orders in turn support additional employment and wages in the Bay Area Supplier orders support payroll to workers of these supplier businesses Workers then spent this income on consumer purchases such as
Retail purchases for consumer items such as food clothing home furnishings and cars
Purchases of health care and childcare services
Rent and mortgage payments and other housing costs
In 2016 the multiplier effects of spending by air visitors to the Bay Area generated an additional $76 billion in business revenues in the region supporting 42000 additional jobs and provided over $29 billion in total payroll expenditures
Including initial visitor spending indirect supplier purchases and spending of earned income by workers in visitor services industries the total economic contribution of SFO visitors to the Bay Area totaled roughly $182 billion in revenues yielding over 138000 jobs and nearly $68 billion in payroll (see Table 19) Suppliers of goods and services generated approximately $30 billion of revenues 15000 jobs and $12 billion of Labor income (indirect impacts) The re‐spending of earnings supported $46 billion of revenues nearly 27000 jobs and close to $17 billion of labor income (induced impacts)
2017 Economic Impact Study of San Francisco International Airport 32
Table 19 Summary of Direct Indirect and Induced Economic Impacts of the Contribution of Visitor Spending in the Bay Area
Economic Impact Business Revenues Payroll Jobs
I Direct Impact Visitor Spending Activity Direct Visitor Spending $10539626000 $3870828000 96121 II Indirect Impact Suppliers of Goods and Services Due to Visitor Spending Off‐Airport $3066523000 $1234317000 15268 III Induced Impact Re‐Spending of Worker Income Due to Visitor Spending Off‐Airport $4560386000 $1685335000 26893 Total Regional Impact in Bay Area $18166535000 $6790480000 138282
Notes Dollars rounded to thousands Columns may not add due to rounding
Sources SFO Traffic Statistics and national data sets from the Department of Transportation Visitor Survey US Department of Commerce data provided by IMPLAN IMPLAN multiplier package Calculations by EDR Group
2017 Economic Impact Study of San Francisco International Airport 33
This Page Left Blank Intentionally
2017 Economic Impact Study of San Francisco International Airport 34
CHAPTER 5 IMPACTS OF AIR RELIANT USERS
(FREIGHT SHIPPERS)
For this study ldquoreliant usersrdquo are defined as manufacturers and agricultural industries that ship products by air through SFO26
THE ROLE OF SFO IN AIR EXPORTS
SFO plays a critical role in Californiarsquos economy by enabling manufacturers and agricultural producers to transport commodities and finished goods to customers in both domestic and international markets This section on air reliant activities signifies the contribution of SFO to economic development in the Bay Area by enabling regional firms to sell products across the US and the world and thereby maximize shares of national and international trade Without the services offered at SFO (and if the similar scale of air services is not taken up by another regional airport) companies in the Bay Area that produce and ship products would find markets limited and market shares curtailed In turn economic activity in the Bay Area that is associated with production of goods shipped through SFO would be reduced
A review of the products shipped from the Bay Area through SFO provides an insight into the cross‐section of the economy that is reliant on‐air cargo services at SFO in particular Silicon Valley located in Santa Clara county and home to major technology companies and start‐ups This analysis is based on industry specific data from the Foreign Trade Division of the US Census Bureau and the Freight Analysis Framework of the US DOT (Federal Highway Administration) and economic output by industry from the US Bureau of Economic Analysis (collected by the Minnesota IMPLAN Group)27
INTERNATIONAL EXPORTS
SFO is a gateway for the Bay Area manufacturing and other industries to deliver their products to customers throughout world To assess the role that SFO plays in exports from the Bay Area the following methodology was applied According to data from the Foreign Trade Division (collected by WISERTrade) 25 of all California air exports that originated in California passed through SFO This percentage was applied to all industry sectors (three‐digit NAICS) to estimate the value and types of Californian exports going through SFO To isolate the Bay Area specific exports the ratio of Bay Area output to total California output was calculated using US Bureau of Economic Analysis (BEA) data and applied to California exports going through SFO28 The results represent estimates of international exports by industry that are produced by Bay Area businesses and exported for sale through SFO This methodology is further explained in Appendix I
Air‐freight shipped from SFO is overwhelmingly concentrated in technology goods produced in the Bay Area The leading export industry is Computer and Electronics manufacturing which accounts for nearly
26 This definition is based on past SFO Economic Impact Studies 27 At this writing the most recent year available for both Foreign Trade Division and US Bureau of Economic Analysis information
is 2016 28 Provided through the Minnesota IMPLAN Group
2017 Economic Impact Study of San Francisco International Airport 35
two‐thirds of the regionrsquos exports by value as indicated in Table 20 The next four ranked industries (chemicals machinery transportation equipment electrical equipment and appliances) account for an aggregate 26 of total Bay Area exports Altogether the top five industries account for 89 of the total value of goods that originates in the Bay Area and are shipped through SFO
Table 20 Top International Exported Industries
Industry Value (in $millions)
of Total
Computers and Electronics $5430 631 Chemicals $848 99 Machinery $742 86 Transportation Equipment $425 49 Electrical Equipment amp Appliances $232 27 All others $928 108 Total $8604 100
Sources US Census Bureau Foreign Trade Division collected by WISERTrade
DOMESTIC EXPORTS
The FHWA Freight Analysis Framework (FAF) was used to identify the domestic flows of Bay Area goods to US customers via SFO The FAF areas are represented by Combined Statistical Areas (CSAs) represent the FAF areasmdashthe San Francisco CSA includes 12 counties (the Bay Area plus San Benito Santa Cruz and San Joaquin counties) To scale the commodity flows to the nine‐county Bay Area a ratio was applied like the approach described above for international exports This ratio was calculated using the BEA industry output for the nine‐county region and was divided by the industry output for the 12‐county CSA
Even more concentrated than international exports domestic shipments are highly concentrated in computer and electronics and electrical equipment manufacturingmdashcombined these sectors account for 75 of the total Bay Area produced shipments through SFO The second largest amount of exports is in chemicals which represents 94 of all exports as indicated in Table 21 Together the top five industries represent 91 of the total value of Bay Area domestic exports through SFO
Table 21 Top Domestic Shipped Industries
Industry Value (in $millions)
of Total
Computers and Electronics $3419 423 Electrical Equipment amp Appliances $2642 327 Chemicals $761 94 Transportation Equipment $302 37 Machinery $191 24 All Others $766 95 Total $8081 100
Source Freight Analysis Framework US Department of Transportation
2017 Economic Impact Study of San Francisco International Airport 36
Combining both domestic and international products still highlights the integral part that computer and electronics and electrical equipment manufacturing (70) plays within the Bay Area compared to other manufacturing sectors (Figure 10) and the significance that SFO has in enabling these products to reach their customers
Figure 10 Percentage of the Bay Arearsquos Combined Domestic and International Exports Shipped via SFO
Sources US Census Bureau Foreign Trade Division collected by WISERTrade and Freight Analysis Framework US Department of Transportation
ECONOMIC CONTRIBUTION OF SFO TO THE BAY AREA
To gauge the level of impact EDR Group used US Bureau of Economic Analysis (BEA) data included in IMPLAN to 1) estimate the jobs and wages associated with the domestic and international exports through SFO and 2) determine the additional activity that percolates throughout the economy as air‐reliant businesses purchase additional goods and services from suppliers (Indirect) and employees spend their additional income (Induced) BEA data within IMPLAN is used because it contains information about the structural buyer‐supplier relationships within the economy as well as the industries where labor income is usually spent
Overall $167 billion in domestic and international exports shipped via SFO contribute to over 26000 jobs and over $40 billion in labor income within the Bay Area (Table 22) When including purchases of supplier goods and services (Indirect) and employee wage re‐spending (Induced) the total impact of air exports on the Bay Area economy accounts for over 84000 jobs and nearly $29 billion in business sales (output) Appendix I describes the methodology used to develop these calculations
2017 Economic Impact Study of San Francisco International Airport 37
Table 22 Economic Value of Domestic and International Exports Originating in the Bay Area via SFO
Impact Type Employment Labor Income Output Direct Effect 26078 $4023963000 $16721996000
Indirect Effect 20448 $2262032000 $6067692000
Induced Effect 37706 $2408696000 $6186854000
Total Effect 84232 $8694691000 $28976542000
Source US Department of Commerce data provided by IMPLAN Calculations by EDR Group
EFFECTS ON SUPPLIERS OF GOODS AND SERVICES
Figure 11 profiles the employment supported when Bay Area air‐reliant businesses purchase goods and services from other Bay Area businesses In total over 20000 jobs are dependent on Bay Area air‐reliant businesses that purchase goods and services to make final products that are shipped via SFO Most jobs are in the services sector which accounts for over 10000 of the indirect jobs
Figure 11 Employment Impacts on Suppliers of Goods and Services (Indirect)
Service
Trade
Manufacturing
Transp Inform amp Utilities
Government
Construction
Agriculture
Mining
Jobs
Source US Department of Commerce data provided by IMPLAN Calculations by EDR Group
At a finer level of BEA industry detail purchases made by Bay Area air‐reliant businesses are concentrated in wholesale trade administrative support professional scientific and technical services management of companies and computers and electronics As shown in Table 23 these five industries represent 60 of the total jobs supported by air reliant business purchases Nearly 40 of the job impacts are spread across other industries indicating that the dependence on Bay Area businesses that use SFO is widespread across most the local economy
0 2000 4000 6000 8000 10000 12000
2017 Economic Impact Study of San Francisco International Airport 38
Table 23 Impacts on Suppliers of Goods and Services (Indirect) by BEA Industry
Industry Category Jobs of Total
Wholesale trade 3709 18 Administrative Support 2881 14 Professional Scientific amp Technical Services 2588 13 Management of Companies 1810 9 Computer amp Electronics 1311 6 Government 743 4 Repair amp Maintenance 619 3 Food amp Beverage 616 3 Fabricated Metals 592 3 Construction 546 3 Rest of Others 5034 25 Total 20448 100
Source US Department of Commerce data provided by IMPLAN Calculations by EDR Group
The following sections did not include any updated information and therefore can be found in Chapter 5 Impacts of Air Reliant User (Freight Shipper) within the 2016 Economic Impact Study of San Francisco International Airport Overview of International Freight Activity SFO Connects the Bay Area to Domestic Markets Commodities Shipped from SFO to Domestic Markets County by County Commodity Movements
2017 Economic Impact Study of San Francisco International Airport 39
CHAPTER 6 TAX IMPACTS GENERATED BY ACTIVITIES AT SFO
The income and business sales produced by economic activities at SFO in turn generate federal state county and municipal tax revenues This chapter presents estimates of state and local tax impacts from airport activities as well as federal aviation taxes derived from aviation services29
STATE AND LOCAL TAX IMPACTS
The state and local tax revenues linked to operations at SFO totaled nearly $29 billion in 2016 including close to $16 billion from direct activities and almost $13 billion from purchases of supplier goods and services (Indirect) and re‐spending of worker income (Induced) Tax revenues are estimated using effective tax rates calculated by BEA and US Census data (as organized through IMPLAN) as well by considering California publications including the Governorrsquos Budget Summary ndash 2015‐16 Comprehensive Annual Financial Report of the State Controllerrsquos Office and the County of San Mateo Appendix II includes a breakout of tax revenues by county where applicable
Table 24 Estimated 2016 State and Local Tax Impacts (in $ millions)
Impact Category Direct Activities Indirect Induced
Activities Total Activities
On‐Airport $602 $336 $937
Construction $7 $16 $23
Visitor Spending $697 $345 $1041
Air‐Reliant Businesses $280 $592 $872
Total Taxes $1586 $1288 $2874
Sources Totals may not sum due to rounding Based on information from Regional Economic Accounts (REA) and National Income and Product Accounts (NIPA) from the Bureau of Economic Analysis (BEA) and Consumer Expenditure Survey (CES) and the Annual Survey of State and Local Government Finances (SLGF) from the US Census Bureau
FEDERAL AVIATION TAXES
Aviation operations at SFO generated more than $12 billion dollars in federal taxes including $419 million from taxes on international and domestic passengers and $791 million in US Customs revenue from customs duties on international air cargo shipments (Table 25) These tax revenues are remitted to the US Department of the Treasury and may not directly benefit the Bay Area or the State of California
29 Data developed in this chapter should be considered as order of magnitude estimates As in previous economic impact studies for SFO tax impacts are derived from per‐capita measures
2017 Economic Impact Study of San Francisco International Airport 40
Table 25 Estimated 2016 Federal Aviation Tax Revenues
Type of Tax ChargesFees Revenues in millions
of Total
Customs and Immigration $550 and $7 per passenger $32 3
International Arrival and Departure Tax $1800 per passenger $93 8
Domestic Passenger Taxes $410 per passenger amp 75 of airfare $237 20
Sept 11th security fee $560 per passenger $57 5
Sub‐Total Passenger Related Taxes $419 35
US Customs Revenue (International Cargo) Customs Revenues (US ITC) $791 65
Total $1211 100
Notes Includes US Government Segment tax Does not include Domestic Transportation tax (75 of airfare cost)
Sources Federal Aviation Administration wwwairlinesorg and wwwWiserTradecom
2017 Economic Impact Study of San Francisco International Airport 41
CHAPTER 7 DISTRIBUTION OF IMPACTS BY BAY AREA COUNTIES
This chapter presents the distribution of direct jobs and income as well as the distribution of tax benefits among Bay Area counties for on‐airport and visitor spending categories Local impacts are based on a sample of almost 24000 on‐airport employees by zip code compiled for the 2016 Study
ON‐AIRPORT EFFECT AMONG BAY AREA COUNTIES
Table 26 and Table 27 show estimates of jobs payroll (labor income) and business revenues (output) associated with each of the nine Bay Area counties that are generated by on‐airport economic activity In Table 26 direct and induced employment and wages are allocated to the counties based on the residence of employees of the Airport Commission staff its contract workers and tenants Due to the location of SFO all direct business revenues (direct output) are generated in San Mateo County (Table 29) Economic impacts (employment payroll and business revenues) associated with supplier purchases (indirect) were applied proportionally to each county based on relative employment levels compared to the Bay Area region
Table 26 Employment and Labor Income Impacts of On‐airport Tenants by County
County Impact Type
Employ ment
Labor Income County Impact Type
Employ ment
Labor Income
Alameda
Direct 5487 $339835000 San Mateo
Direct 12197 $755396000 Indirect 2836 $247852000 Indirect 1516 $132524000 Induced 2562 $190496000 Induced 5696 $423440000 Total 10885 $778183000 Total 19409 $1311360000
Contra Costa
Direct 2600 $161011000 Santa Clara
Direct 1307 $80940000 Indirect 1505 $131531000 Indirect 3750 $327807000 Induced 1214 $90255000 Induced 610 $45371000 Total 5319 $382797000 Total 5668 $454118000
Marin
Direct 221 $13692000
Solano
Direct 1125 $69671000 Indirect 551 $48121000 Indirect 527 $46064000 Induced 103 $7675000 Induced 525 $39054000 Total 875 $69488000 Total 2177 $154789000
Napa
Direct 125 $7741000
Sonoma
Direct 199 $12323000 Indirect 291 $25428000 Indirect 836 $73075000 Induced 58 $4339000 Induced 93 $6908000 Total 474 $37508000 Total 1128 $92306000
San Francisco
Direct 6618 $409849000 Outside Bay Area
Direct 10908 $675588000 Indirect 2518 $220117000 Indirect NA NA Induced 3090 $229743000 Induced 5094 $378704000 Total 12226 $859709000 Total 16002 $1054292000
Total
Direct 40787 $2526046000 Indirect 14330 $1252519000 Induced 19047 $1415985000 Total 74164 $5194550000
Notes Cells left blank because indirect impacts from the Bay Area are only allocated to each of the 9 counties Sources Airport Tenant Survey Data Provided by SFO and US Department of Commerce data provided by IMPLAN Calculations by EDR Group
2017 Economic Impact Study of San Francisco International Airport 42
Table 27 Business Revenues Impacts of On‐airport Tenants by Bay Area County
County Impact Type Business Revenues
County Impact Type Business Revenues
Alameda
Direct $0
San Mateo
Direct $8042484000 Indirect $583266000 Indirect $311867000 Induced $505583000 Induced $1123825000 Total $1088849000 Total $9478176000
Contra Costa
Direct $0
Santa Clara
Direct $0 Indirect $309528000 Indirect $771423000 Induced $239541000 Induced $120417000 Total $549069000 Total $891840000
Marin
Direct $0
Solano
Direct $0 Indirect $113241000 Indirect $108402000 Induced $20370000 Induced $103651000 Total $133611000 Total $212053000
Napa
Direct $0
Sonoma
Direct $0 Indirect $59839000 Indirect $171965000 Induced $11517000 Induced $18333000 Total $71356000 Total $190298000
San Francisco
Direct $0 Outside Bay Area in CA
Direct $0 Indirect $517998000 Indirect NA Induced $609744000 Induced $1005092000 Total $1127742000 Total $1005092000
Total
Direct $8042484000 Indirect $2947529000 Induced $3758073000 Total $14748086000
Notes Cells left blank because indirect impacts from the Bay Area are only allocated to each of the 9 counties Sources Airport Tenant Survey Data Provided by SFO and US Department of Commerce data provided by IMPLAN Calculations by EDR Group
2017 Economic Impact Study of San Francisco International Airport 43
VISITOR SPENDING The visitor spending survey conducted at SFO documented the destinations of visitors who arrive in California through SFO Table 28 indicates the economic impacts associated with visitor spending for each county
Table 28 Economic Impacts of Visitor Spending by Bay Area County
Bay Area County Impact Type Employment Labor Income Visitor Spending
Alameda
Direct 6812 $274314000 $746911000 Indirect 1082 $87472000 $217315000 Induced 1906 $119435000 $323181000 Total 9800 $481221000 $1287407000
Contra Costa
Direct 4737 $190766000 $519423000 Indirect 752 $60831000 $151127000 Induced 1325 $83058000 $224749000 Total 6815 $334655000 $895299000
Marin
Direct 2732 $110014000 $299551000 Indirect 434 $35081000 $87155000 Induced 764 $47900000 $129613000 Total 3930 $192995000 $516319000
Napa
Direct 3933 $158385000 $431255000 Indirect 625 $50505000 $125474000 Induced 1100 $68960000 $186600000 Total 5658 $277850000 $743329000
San Francisco
Direct 52000 $2094047000 $5701745000 Indirect 8260 $667743000 $1658933000 Induced 14549 $911735000 $2467086000 Total 74808 $3673525000 $9827764000
San Mateo
Direct 10475 $421828000 $1148568000 Indirect 1664 $134511000 $334178000 Induced 2931 $183661000 $496973000 Total 15069 $740000000 $1979719000
Santa Clara
Direct 10832 $436224000 $1187767000 Indirect 1721 $139102000 $345583000 Induced 3031 $189929000 $513934000 Total 15584 $765255000 $2047284000
Solano
Direct 667 $26864000 $73147000 Indirect 106 $8566000 $21282000 Induced 187 $11697000 $31650000 Total 960 $47127000 $126079000
Sonoma
Direct 3933 $158386000 $431259000 Indirect 625 $50506000 $125476000 Induced 1100 $68960000 $186601000 Total 5658 $277852000 $743336000
Total
Direct 96121 $3870828000 $10539626000 Indirect 15268 $1234317000 $3066523000 Induced 26893 $1685335000 $4560387000 Total 138282 $6790480000 $18166536000
Sources Airport Visitor Spending Survey Data Provided by SFO and US Department of Commerce data provided by IMPLAN Calculations by EDR Group
2017 Economic Impact Study of San Francisco International Airport 44
TAX IMPACTS BY BAY AREA COUNTY
Tax revenues including sales property (business and labor) corporate and income taxes are collected from on‐airport tenants and the workers that they employ directly at SFO Table 29 indicates the tax revenues generated from each impact type (direct IndirectInduced and Total) by county Direct tax revenues paid by individuals and households are apportioned according to place of residence of Airport Commission staff contact employees and tenants Direct taxes paid by businesses originate in San Mateo County due to the location of the Airport
Table 29 Tax Revenues by County for On‐airport Tenants
Bay Area Counties
Direct Indirect Induced
Total
Alameda $10303000 $53898000 $64201000
Contra Costa $4882000 $27089000 $31971000
Marin $415000 $6369000 $6784000
Napa $235000 $3405000 $3640000
San Francisco $12426000 $56329000 $68755000
San Mateo $548000000 $73751000 $621751000
Santa Clara $2454000 $42422000 $44876000
Solano $2112000 $10527000 $12639000
Sonoma $374000 $9009000 $9383000
Outside Bay Area $20483000 $52913000 $73396000
Total $601684000 $335712000 $937396000
Notes Direct tax revenues shown in San Mateo County include $33 million in Possessory Interest Tax revenues as estimated for the 2016 Study
Sources Governorrsquos Budget Summary State Controllerrsquos Office the County of San Mateo Bureau of Economic Analysisrsquo (BEA) National Income and Product Accounts (NIPA) the US Census Bureau (Consumer Expenditure Survey Annual Survey of State and Local Government Finances) US Department of Commerce data provided by IMPLAN Airport Tenant Survey and Information Provided by SFO Calculations by EDR Group
Tax revenues including sales property (business and residential) corporate and income taxes are also generated by visitors and businesses that provide goods and services to domestic and international visitors Table 30 below outlines the tax revenues provided by each county by business in the hotel restaurant transportation entertainment and retail industries (direct) the businesses that support these industries (indirect) and the tax revenue generated by employees spending their earned income (induced)
2017 Economic Impact Study of San Francisco International Airport 45
Table 30 Tax Revenues by County for Visitor Spending
Bay Area Counties Direct Indirect Induced
Total
Alameda $49365000 $24431000 $73796000
Contra Costa $34330000 $16990000 $51320000
Marin $19798000 $9798000 $29596000
Napa $28502000 $14106000 $42608000
San Francisco $376840000 $186502000 $563342000
San Mateo $75911000 $37569000 $113480000
Santa Clara $78502000 $38851000 $117353000
Solano $4834000 $2393000 $7227000
Sonoma $28503000 $14106000 $42609000
Total Taxes $696585000 $344746000 $1041331000
Sources Governorrsquos Budget Summary State Controllerrsquos Office Bureau of Economic Analysisrsquo (BEA) National Income and Product Accounts (NIPA) the US Census Bureau (Consumer Expenditure Survey Annual Survey of State and Local Government Finances) US Department of Commerce data provided by IMPLAN and SFO Airport Visitor Survey Calculations by EDR Group
2017 Economic Impact Study of San Francisco International Airport 46
This Page Left Blank Intentionally
2017 Economic Impact Study of San Francisco International Airport 47
APPENDIX I METHODOLOGY FOR THE ANALYSIS
OF OVERALL ECONOMIC IMPACTS
Airport jobs and commerce on the Airport premises create strong economic stimuli for the Bay Area This airport business activity itself generates an increased demand for other local goods and services Not only do the businesses based on the Airport pay local and state taxes but the off‐airport businesses that depend upon airport‐based activity pay taxes as well As shown in this study the direct business activity and subsequent multiplier effects have a strong overall impact on the economy
All economic impacts in this report are described using the measures of jobs payroll and business sales The study quantifies three distinct categories of economic benefits that result from SFO‐related activities direct indirect and induced effects as described below
Direct impacts stem from the activity that is directly related to the provision of aviation services visitor spending or the activity of aviation‐reliant businesses For example the direct impacts of on‐airport tenants include the number of persons they employ on the Airport the wages and benefits paid to those workers and their business sales Similarly the direct impacts of air visitors include the money they spend on services and supplies and the jobs and payroll supported by those expenditures Most of the direct impacts measured in this study occur on‐airport but some such as visitor spending and the benefits produced by aviation dependent businesses occur off‐airport
Indirect and induced impacts which are sometimes called ldquomultiplier impactsrdquo result from (1) a portion of business sales used for ldquobusiness‐to‐businessrdquo purchases of goods and services (indirect effects) and (2) the recirculation of worker incomes and business expenditures in the broader Bay Area economy (induced effects) For example an airport restaurant may buy supplies from a Bay Area produce vendor This purchase represents income (ie new business sales) to the produce supplier which uses a portion of that income to pay its workers and buy additional goods and services from other businesses in the region In addition airport workers spend their wages on other items such as housing retail purchases and services Those expenditures in turn support jobs in those industries whose workers then spend their salaries in the Bay Area These successive rounds of spending and job creation represent the indirect impacts (business‐to‐business) and induced impacts (spending of wages) This study specifically measured the indirect and induced impacts that occur in the county economies of the Bay Area The discussions of total impacts are based on the following analyses and are illustrated in Figure 12
2017 Economic Impact Study of San Francisco International Airport 48
Figure 12 Elements of Economic Impacts and Interrelationships
Source EDR Group
2017 Economic Impact Study of San Francisco International Airport 49
SUPPLIERS OF GOODS AND SERVICES (INDIRECT MULTIPLIER EFFECTS)
Orders from Businesses at the Airport
Activities occurring at the Airport generate additional orders for goods and services from suppliers including orders for
Printing and publishing for the Airport operator and the airlines
Banking insurance legal accounting and technical services for airport businesses
Off‐site bus and parking services for SFO employees
Food products for airport restaurants
Wholesale merchandise to be sold by airport stores
Furniture and equipment for offices hotels restaurants and stores located at the Airport
Orders from Off‐Airport Businesses Serving Air Travelers
Activities serving air travelers outside of the Airport also generate additional orders for goods and services from suppliers for
Fueling and maintenance services for use by off‐airport taxis rental cars tour buses and public transportation
Construction and support operations of convention and hospitality facilities for convention visitors
Food products for off‐airport restaurants
Wholesale merchandise to be sold by off‐airport stores
Furniture and equipment for off‐airport hotels restaurants and stores
RE‐SPENDING OF WORKER INCOME (INDUCED MULTIPLIER EFFECTS)
The workers at SFO at off‐airport businesses serving air visitors and at supplier businesses earn income and most of that income is re‐spent on consumer purchases which support additional jobs within the Bay Area Examples of these purchases include
Retail purchases of food clothing home furnishings cars electronic devices computers and other products
Purchases of services spanning haircuts cleaning car repair and insurance
2017 Economic Impact Study of San Francisco International Airport 50
CALCULATING THE DOMESTIC AND INTERNATIONAL VALUES FROM CARGO
ORIGINATING IN THE BAY AREA AND SHIPPED THROUGH SFO
The combined $17 billion of international and domestic exports through SFO provides a significant direct contribution to the Bay Area economy as well as additional activity through economic linkages To estimate the level of impact EDR Group layered three sets of data ndash the Foreign Trade Database (FTD) of the US Bureau of the Census (tabulated by WISERTrade) the multi‐modal Freight Analysis Framework (FAF) of the US Federal Highway Administration and US Bureau of Economic Analysis (BEA) data included in IMPLAN to
1) Estimate the jobs and wages associated with the domestic and international exports through SFO and
2) Determine the additional activity that percolates throughout the economy as air‐reliant businesses purchase additional goods and services from suppliers (Indirect) and employees spend their additional income (Induced)
FTD data aggregated by WISERTrade was the basis of estimating the weight and value of goods produced in the Bay Area and exported from SFO to international markets FTD provides total exports by commodity and state of origin and the total value of California exports shipped through SFO WISERTrade also provides total value and weight by commodity for all shipments from SFO but not at a commodity level by point of origin Using IMPLAN data the ratios of output by commodity were calculated for the nine‐county Bay Area compared to California totals This calculation estimated the ldquosharerdquo of California produced air exports with an approximate point of origin in the Bay Area The calculation was constrained by both the value and weight reported by WISERTrade of exports by commodity from SFO and the weight of international shipments from SFO taken from the flysfo website
FAF was the basis of estimating domestic cargo shipments FAF provides domestic air shipments of commodities that originate in the twelve county San Jose‐San Francisco‐Oakland CA Combined Statistical Area Using IMPLAN data output by commodity for the nine‐county Bay Area were compared to the twelve county CMSA to estimate the ldquosharerdquo of each commodity shipped from the CSA
BEA data within IMPLAN profiles the structural buyer‐supplier relationships within the economy as well as the industries where labor income is usually spent Figure 13 illustrates the methodology of calculating the domestic and international values from the Bay Area through SFO
2017 Economic Impact Study of San Francisco International Airport 51
Figure 13 Methodology to Estimate Air Dependent Contribution to Bay Area Economy
3 Freight shipments by value
2 Geography
1 Calculations
MAJOR SOURCES OF DATA USED IN THIS STUDY
The discussion of total impacts is based on the following analyses conducted specifically for this study
1 A survey of all airport tenants and the data provided by staff of the San Francisco Airport Commission These data provide profiles of on‐airport jobs by establishment type of business activity and place of residence by zip code for airport and tenant employees
2 Polaris Research conducted surveys of airport travelers were conducted by Polaris Research The survey profiled trip purposes international or domestic origins segmentation of visitors from local residents and connecting passengers and the amount of money in the Bay Area spent by visitors using the Airport
3 Air freight analyses are based on data from SFO WISERTrade using data from US Census Bureau Foreign Trade Division30 and the Freight Analysis Framework (FAF) to develop a detailed profile of air exports from SFO by commodity and origin of movement Detailed data from FAF are not available for the Bay Area alone (statewide for the Foreign Trade Division and a 12 county combined statistical area (CSA) for FAF) Therefore the detailed commodity flows found in the data sets are proportioned based on the output per industry (converted from commodities) of the Bay Area
30 The World Institute for Strategic Economic Research (WISERTrade) formed July 1 2004 to continue the international trade data work of its predecessor MISER was chosen by the US Census Bureau to be one of its first Business and Industry Data Centers with special focus on foreign trade statistics See wwwwisertradeorg
2017 Economic Impact Study of San Francisco International Airport 52
4 Econometric models for the nine‐county Bay Area are based on the IMPLAN Economic Model System IMPLAN is used to estimate wages and sales (or budget expenditures for public entities) for airport tenants where only employment totals were available Labor income and sales andor expenditures per worker are derived primarily from US Department of Commerce (BEA is a part of the Commerce Department) and Department of Labor data sets and are county‐specific IMPLAN is also used to derive multiplier effects including business orders to suppliers generated by on‐airport businesses off‐airport businesses serving airport visitors and airport‐reliant businesses and business sales generated by the spending of the additional workersrsquo income on consumer purchases
2017 Economic Impact Study of San Francisco International Airport 53
APPENDIX II SUMMARY OF IMPLAN SECTORING
To estimate the full range of direct effects and the indirect and induced (ldquomultiplierrdquo) economic effects this study utilized the IMPLAN model system of MIG Inc IMPLAN is now the most widely used input‐output economic modeling system in the US with a client list of 500 public and private agencies including several federal agencies and numerous state agencies It utilizes US Commerce Department (National Income and Product Accounts) data on inter‐industry technology relationships (also known as input‐output structural matrices) countywide employment and income data from the Bureau of Economic Analysis (BEA) and Bureau of Labor Statistics (BLS) and its own industry and county‐specific estimates of local purchasing rates (ldquoregional purchase coefficientsrdquo) It is enhanced over most other input‐output models in that it also includes coverage of public sector activity and consumer activity (reflected in its ldquosocial accounting matrixrdquo) The industry detail is at the level of 536 industries and is based on categories of the US Bureau of Economic Analysis (BEA) which correspond to two to five digit groups in the North American Industry Classification System (NAICS)
For this study the direct job payroll and business revenue effects for on‐airport and visitor spending were documented through surveys completed for this project and then assigned to specific sector groups based on EDR Grouprsquos experience in aviation SFOrsquos support of air reliant industries was documented through databases maintained by the US Census Bureau and the US Department of Transportation The IMPLAN model was then calibrated for the nine‐county Bay Area as well as for each county within the region and a model calibrated for a defined region outside the Bay Area to measure additional visitor spending The result was an estimate of the indirect and induced (and overall) job business revenue and income impacts for each segment of airport beneficiary The analysis of retail impacts was adjusted to account for retail markup margins and the concentration of sales in airports and in visitor industries Retail portions of multiplier effects also incorporate these margins
Regardless of whether economic impacts are measured in terms of jobs income or business sales these impacts can be classified into three categories
Direct economic effects are the changes occurring at the project site as a direct consequence of the public investment project or program This is represented as the net increase in business activity associated with business at the SFO initial visitor spending at off‐airport businesses in each countyrsquos hospitality sector and the sale revenues earned by shippers who route air cargo through SFO
Indirect economic effects are the broader effects on business activity for off‐site goods and services supplied to the directly affected businesses
Induced economic effects are further shifts in spending on food clothing shelter and other consumer goods and services because of the change in workers and payroll of directly and indirectly affected businesses
EDR Group assembled classifications of the 536 sectors in the IMPLAN modeling package to best mirror types of industries on SFO types of visitor spending and industries related to commodities exported from SFO The classification schemes used for this study for on‐airport and visitor spending impacts are shown in Table 31 and Table 32
2017 Economic Impact Study of San Francisco International Airport 54
Table 31 Industry Classification of On‐Airport Industries
Airport Tenants Classification IMPLAN Sectors Used Passenger Airlines Air Transportation Freight Airlines Couriers Air Transportation Couriers Fixed Based Operator (FBO) Support activities for transportation Local Government
State and Local Government State Government
Federal Government Immigration TSA FBI US Customs and Border Patrol (CBP) National Weather Service
Distribution TruckingWarehousing Wholesale Wholesale Trade business Security Security Aviation Firms
Construction
Highways and Streets Commercial Structures Non‐residential structures Maintenance and Repair
Retail
ElectronicsAppliance Stores Food and Beverage Health and Labor Care Clothing Stores Sporting Goods Stores Misc Retail
Food and Beverage (includes Catering Firms) Full‐service restaurants Limited‐service restaurants All other food and drinking places
Car Rental Car Rental Ground Transportation (incl taxis limos buses vans and transit)
Transit and ground passenger transp
Other Medical Clinic Vending Machines
Services
Educational institutions Electronic repair services Insurance Medical services Other Support Services Telecommunications Waste Management
Reliant Services
ArchitecturalEngineering Business support Computer systems design services Facilities support Financial Services Management scientific and Technical Parking and Misc
2017 Economic Impact Study of San Francisco International Airport 55
Table 32 Industry Classification of Visitor‐Serving Industries
Visitor Spending Classification
IMPLAN Sectors Used
ElectronicsAppliance Stores
Food and Beverage
Health and Labor
Retail Clothing Stores
Sporting Goods
General Merchandise
Misc Retail
Performing Arts
Spectator Sports
Artists writers and performers
Museums zoos and parks
Entertainment Amusement parks and arcades
Gambling industries
Fitness and recreational sports centers
Bowling centers
Other amusement recreation
Full‐service restaurants
Restaurant Limited‐service restaurants
All other food and drinking places
Hotels and motels Hotel
Other accommodations
Transit and ground passenger transportation
Scenic and sightseeing Transportation
Support activities
Gas stations
Sources US Department of Commerce data provided by IMPLAN Calculations by EDR Group
2017 Economic Impact Study of San Francisco International Airport 56
This Page Left Blank Intentionally
2017 Economic Impact Study of San Francisco International Airport 57
APPENDIX III SFO TENANT AND VISITOR SURVEYS
The following pages are the survey instruments used for SFO tenants and visiting passengers Note that the passenger survey was administered in multiple languages
2017 Economic Impact Study of San Francisco International Airport 58
2017 Economic Impact Study of San Francisco International Airport 59
2017 Economic Impact Study of San Francisco International Airport 60
2017 Economic Impact Study of San Francisco International Airport 61
2017 Economic Impact Study of San Francisco International Airport 62
2017 Economic Impact Study of San Francisco International Airport 63
2017 Economic Impact Study of San Francisco International Airport 64
2017 Economic Impact Study of San Francisco International Airport 65
2017 Economic Impact Study of San Francisco International Airport 66

This Page Left Blank Intentionally
2017 Economic Impact Study of San Francisco International Airport 34
CHAPTER 5 IMPACTS OF AIR RELIANT USERS
(FREIGHT SHIPPERS)
For this study ldquoreliant usersrdquo are defined as manufacturers and agricultural industries that ship products by air through SFO26
THE ROLE OF SFO IN AIR EXPORTS
SFO plays a critical role in Californiarsquos economy by enabling manufacturers and agricultural producers to transport commodities and finished goods to customers in both domestic and international markets This section on air reliant activities signifies the contribution of SFO to economic development in the Bay Area by enabling regional firms to sell products across the US and the world and thereby maximize shares of national and international trade Without the services offered at SFO (and if the similar scale of air services is not taken up by another regional airport) companies in the Bay Area that produce and ship products would find markets limited and market shares curtailed In turn economic activity in the Bay Area that is associated with production of goods shipped through SFO would be reduced
A review of the products shipped from the Bay Area through SFO provides an insight into the cross‐section of the economy that is reliant on‐air cargo services at SFO in particular Silicon Valley located in Santa Clara county and home to major technology companies and start‐ups This analysis is based on industry specific data from the Foreign Trade Division of the US Census Bureau and the Freight Analysis Framework of the US DOT (Federal Highway Administration) and economic output by industry from the US Bureau of Economic Analysis (collected by the Minnesota IMPLAN Group)27
INTERNATIONAL EXPORTS
SFO is a gateway for the Bay Area manufacturing and other industries to deliver their products to customers throughout world To assess the role that SFO plays in exports from the Bay Area the following methodology was applied According to data from the Foreign Trade Division (collected by WISERTrade) 25 of all California air exports that originated in California passed through SFO This percentage was applied to all industry sectors (three‐digit NAICS) to estimate the value and types of Californian exports going through SFO To isolate the Bay Area specific exports the ratio of Bay Area output to total California output was calculated using US Bureau of Economic Analysis (BEA) data and applied to California exports going through SFO28 The results represent estimates of international exports by industry that are produced by Bay Area businesses and exported for sale through SFO This methodology is further explained in Appendix I
Air‐freight shipped from SFO is overwhelmingly concentrated in technology goods produced in the Bay Area The leading export industry is Computer and Electronics manufacturing which accounts for nearly
26 This definition is based on past SFO Economic Impact Studies 27 At this writing the most recent year available for both Foreign Trade Division and US Bureau of Economic Analysis information
is 2016 28 Provided through the Minnesota IMPLAN Group
2017 Economic Impact Study of San Francisco International Airport 35
two‐thirds of the regionrsquos exports by value as indicated in Table 20 The next four ranked industries (chemicals machinery transportation equipment electrical equipment and appliances) account for an aggregate 26 of total Bay Area exports Altogether the top five industries account for 89 of the total value of goods that originates in the Bay Area and are shipped through SFO
Table 20 Top International Exported Industries
Industry Value (in $millions)
of Total
Computers and Electronics $5430 631 Chemicals $848 99 Machinery $742 86 Transportation Equipment $425 49 Electrical Equipment amp Appliances $232 27 All others $928 108 Total $8604 100
Sources US Census Bureau Foreign Trade Division collected by WISERTrade
DOMESTIC EXPORTS
The FHWA Freight Analysis Framework (FAF) was used to identify the domestic flows of Bay Area goods to US customers via SFO The FAF areas are represented by Combined Statistical Areas (CSAs) represent the FAF areasmdashthe San Francisco CSA includes 12 counties (the Bay Area plus San Benito Santa Cruz and San Joaquin counties) To scale the commodity flows to the nine‐county Bay Area a ratio was applied like the approach described above for international exports This ratio was calculated using the BEA industry output for the nine‐county region and was divided by the industry output for the 12‐county CSA
Even more concentrated than international exports domestic shipments are highly concentrated in computer and electronics and electrical equipment manufacturingmdashcombined these sectors account for 75 of the total Bay Area produced shipments through SFO The second largest amount of exports is in chemicals which represents 94 of all exports as indicated in Table 21 Together the top five industries represent 91 of the total value of Bay Area domestic exports through SFO
Table 21 Top Domestic Shipped Industries
Industry Value (in $millions)
of Total
Computers and Electronics $3419 423 Electrical Equipment amp Appliances $2642 327 Chemicals $761 94 Transportation Equipment $302 37 Machinery $191 24 All Others $766 95 Total $8081 100
Source Freight Analysis Framework US Department of Transportation
2017 Economic Impact Study of San Francisco International Airport 36
Combining both domestic and international products still highlights the integral part that computer and electronics and electrical equipment manufacturing (70) plays within the Bay Area compared to other manufacturing sectors (Figure 10) and the significance that SFO has in enabling these products to reach their customers
Figure 10 Percentage of the Bay Arearsquos Combined Domestic and International Exports Shipped via SFO
Sources US Census Bureau Foreign Trade Division collected by WISERTrade and Freight Analysis Framework US Department of Transportation
ECONOMIC CONTRIBUTION OF SFO TO THE BAY AREA
To gauge the level of impact EDR Group used US Bureau of Economic Analysis (BEA) data included in IMPLAN to 1) estimate the jobs and wages associated with the domestic and international exports through SFO and 2) determine the additional activity that percolates throughout the economy as air‐reliant businesses purchase additional goods and services from suppliers (Indirect) and employees spend their additional income (Induced) BEA data within IMPLAN is used because it contains information about the structural buyer‐supplier relationships within the economy as well as the industries where labor income is usually spent
Overall $167 billion in domestic and international exports shipped via SFO contribute to over 26000 jobs and over $40 billion in labor income within the Bay Area (Table 22) When including purchases of supplier goods and services (Indirect) and employee wage re‐spending (Induced) the total impact of air exports on the Bay Area economy accounts for over 84000 jobs and nearly $29 billion in business sales (output) Appendix I describes the methodology used to develop these calculations
2017 Economic Impact Study of San Francisco International Airport 37
Table 22 Economic Value of Domestic and International Exports Originating in the Bay Area via SFO
Impact Type Employment Labor Income Output Direct Effect 26078 $4023963000 $16721996000
Indirect Effect 20448 $2262032000 $6067692000
Induced Effect 37706 $2408696000 $6186854000
Total Effect 84232 $8694691000 $28976542000
Source US Department of Commerce data provided by IMPLAN Calculations by EDR Group
EFFECTS ON SUPPLIERS OF GOODS AND SERVICES
Figure 11 profiles the employment supported when Bay Area air‐reliant businesses purchase goods and services from other Bay Area businesses In total over 20000 jobs are dependent on Bay Area air‐reliant businesses that purchase goods and services to make final products that are shipped via SFO Most jobs are in the services sector which accounts for over 10000 of the indirect jobs
Figure 11 Employment Impacts on Suppliers of Goods and Services (Indirect)
Service
Trade
Manufacturing
Transp Inform amp Utilities
Government
Construction
Agriculture
Mining
Jobs
Source US Department of Commerce data provided by IMPLAN Calculations by EDR Group
At a finer level of BEA industry detail purchases made by Bay Area air‐reliant businesses are concentrated in wholesale trade administrative support professional scientific and technical services management of companies and computers and electronics As shown in Table 23 these five industries represent 60 of the total jobs supported by air reliant business purchases Nearly 40 of the job impacts are spread across other industries indicating that the dependence on Bay Area businesses that use SFO is widespread across most the local economy
0 2000 4000 6000 8000 10000 12000
2017 Economic Impact Study of San Francisco International Airport 38
Table 23 Impacts on Suppliers of Goods and Services (Indirect) by BEA Industry
Industry Category Jobs of Total
Wholesale trade 3709 18 Administrative Support 2881 14 Professional Scientific amp Technical Services 2588 13 Management of Companies 1810 9 Computer amp Electronics 1311 6 Government 743 4 Repair amp Maintenance 619 3 Food amp Beverage 616 3 Fabricated Metals 592 3 Construction 546 3 Rest of Others 5034 25 Total 20448 100
Source US Department of Commerce data provided by IMPLAN Calculations by EDR Group
The following sections did not include any updated information and therefore can be found in Chapter 5 Impacts of Air Reliant User (Freight Shipper) within the 2016 Economic Impact Study of San Francisco International Airport Overview of International Freight Activity SFO Connects the Bay Area to Domestic Markets Commodities Shipped from SFO to Domestic Markets County by County Commodity Movements
2017 Economic Impact Study of San Francisco International Airport 39
CHAPTER 6 TAX IMPACTS GENERATED BY ACTIVITIES AT SFO
The income and business sales produced by economic activities at SFO in turn generate federal state county and municipal tax revenues This chapter presents estimates of state and local tax impacts from airport activities as well as federal aviation taxes derived from aviation services29
STATE AND LOCAL TAX IMPACTS
The state and local tax revenues linked to operations at SFO totaled nearly $29 billion in 2016 including close to $16 billion from direct activities and almost $13 billion from purchases of supplier goods and services (Indirect) and re‐spending of worker income (Induced) Tax revenues are estimated using effective tax rates calculated by BEA and US Census data (as organized through IMPLAN) as well by considering California publications including the Governorrsquos Budget Summary ndash 2015‐16 Comprehensive Annual Financial Report of the State Controllerrsquos Office and the County of San Mateo Appendix II includes a breakout of tax revenues by county where applicable
Table 24 Estimated 2016 State and Local Tax Impacts (in $ millions)
Impact Category Direct Activities Indirect Induced
Activities Total Activities
On‐Airport $602 $336 $937
Construction $7 $16 $23
Visitor Spending $697 $345 $1041
Air‐Reliant Businesses $280 $592 $872
Total Taxes $1586 $1288 $2874
Sources Totals may not sum due to rounding Based on information from Regional Economic Accounts (REA) and National Income and Product Accounts (NIPA) from the Bureau of Economic Analysis (BEA) and Consumer Expenditure Survey (CES) and the Annual Survey of State and Local Government Finances (SLGF) from the US Census Bureau
FEDERAL AVIATION TAXES
Aviation operations at SFO generated more than $12 billion dollars in federal taxes including $419 million from taxes on international and domestic passengers and $791 million in US Customs revenue from customs duties on international air cargo shipments (Table 25) These tax revenues are remitted to the US Department of the Treasury and may not directly benefit the Bay Area or the State of California
29 Data developed in this chapter should be considered as order of magnitude estimates As in previous economic impact studies for SFO tax impacts are derived from per‐capita measures
2017 Economic Impact Study of San Francisco International Airport 40
Table 25 Estimated 2016 Federal Aviation Tax Revenues
Type of Tax ChargesFees Revenues in millions
of Total
Customs and Immigration $550 and $7 per passenger $32 3
International Arrival and Departure Tax $1800 per passenger $93 8
Domestic Passenger Taxes $410 per passenger amp 75 of airfare $237 20
Sept 11th security fee $560 per passenger $57 5
Sub‐Total Passenger Related Taxes $419 35
US Customs Revenue (International Cargo) Customs Revenues (US ITC) $791 65
Total $1211 100
Notes Includes US Government Segment tax Does not include Domestic Transportation tax (75 of airfare cost)
Sources Federal Aviation Administration wwwairlinesorg and wwwWiserTradecom
2017 Economic Impact Study of San Francisco International Airport 41
CHAPTER 7 DISTRIBUTION OF IMPACTS BY BAY AREA COUNTIES
This chapter presents the distribution of direct jobs and income as well as the distribution of tax benefits among Bay Area counties for on‐airport and visitor spending categories Local impacts are based on a sample of almost 24000 on‐airport employees by zip code compiled for the 2016 Study
ON‐AIRPORT EFFECT AMONG BAY AREA COUNTIES
Table 26 and Table 27 show estimates of jobs payroll (labor income) and business revenues (output) associated with each of the nine Bay Area counties that are generated by on‐airport economic activity In Table 26 direct and induced employment and wages are allocated to the counties based on the residence of employees of the Airport Commission staff its contract workers and tenants Due to the location of SFO all direct business revenues (direct output) are generated in San Mateo County (Table 29) Economic impacts (employment payroll and business revenues) associated with supplier purchases (indirect) were applied proportionally to each county based on relative employment levels compared to the Bay Area region
Table 26 Employment and Labor Income Impacts of On‐airport Tenants by County
County Impact Type
Employ ment
Labor Income County Impact Type
Employ ment
Labor Income
Alameda
Direct 5487 $339835000 San Mateo
Direct 12197 $755396000 Indirect 2836 $247852000 Indirect 1516 $132524000 Induced 2562 $190496000 Induced 5696 $423440000 Total 10885 $778183000 Total 19409 $1311360000
Contra Costa
Direct 2600 $161011000 Santa Clara
Direct 1307 $80940000 Indirect 1505 $131531000 Indirect 3750 $327807000 Induced 1214 $90255000 Induced 610 $45371000 Total 5319 $382797000 Total 5668 $454118000
Marin
Direct 221 $13692000
Solano
Direct 1125 $69671000 Indirect 551 $48121000 Indirect 527 $46064000 Induced 103 $7675000 Induced 525 $39054000 Total 875 $69488000 Total 2177 $154789000
Napa
Direct 125 $7741000
Sonoma
Direct 199 $12323000 Indirect 291 $25428000 Indirect 836 $73075000 Induced 58 $4339000 Induced 93 $6908000 Total 474 $37508000 Total 1128 $92306000
San Francisco
Direct 6618 $409849000 Outside Bay Area
Direct 10908 $675588000 Indirect 2518 $220117000 Indirect NA NA Induced 3090 $229743000 Induced 5094 $378704000 Total 12226 $859709000 Total 16002 $1054292000
Total
Direct 40787 $2526046000 Indirect 14330 $1252519000 Induced 19047 $1415985000 Total 74164 $5194550000
Notes Cells left blank because indirect impacts from the Bay Area are only allocated to each of the 9 counties Sources Airport Tenant Survey Data Provided by SFO and US Department of Commerce data provided by IMPLAN Calculations by EDR Group
2017 Economic Impact Study of San Francisco International Airport 42
Table 27 Business Revenues Impacts of On‐airport Tenants by Bay Area County
County Impact Type Business Revenues
County Impact Type Business Revenues
Alameda
Direct $0
San Mateo
Direct $8042484000 Indirect $583266000 Indirect $311867000 Induced $505583000 Induced $1123825000 Total $1088849000 Total $9478176000
Contra Costa
Direct $0
Santa Clara
Direct $0 Indirect $309528000 Indirect $771423000 Induced $239541000 Induced $120417000 Total $549069000 Total $891840000
Marin
Direct $0
Solano
Direct $0 Indirect $113241000 Indirect $108402000 Induced $20370000 Induced $103651000 Total $133611000 Total $212053000
Napa
Direct $0
Sonoma
Direct $0 Indirect $59839000 Indirect $171965000 Induced $11517000 Induced $18333000 Total $71356000 Total $190298000
San Francisco
Direct $0 Outside Bay Area in CA
Direct $0 Indirect $517998000 Indirect NA Induced $609744000 Induced $1005092000 Total $1127742000 Total $1005092000
Total
Direct $8042484000 Indirect $2947529000 Induced $3758073000 Total $14748086000
Notes Cells left blank because indirect impacts from the Bay Area are only allocated to each of the 9 counties Sources Airport Tenant Survey Data Provided by SFO and US Department of Commerce data provided by IMPLAN Calculations by EDR Group
2017 Economic Impact Study of San Francisco International Airport 43
VISITOR SPENDING The visitor spending survey conducted at SFO documented the destinations of visitors who arrive in California through SFO Table 28 indicates the economic impacts associated with visitor spending for each county
Table 28 Economic Impacts of Visitor Spending by Bay Area County
Bay Area County Impact Type Employment Labor Income Visitor Spending
Alameda
Direct 6812 $274314000 $746911000 Indirect 1082 $87472000 $217315000 Induced 1906 $119435000 $323181000 Total 9800 $481221000 $1287407000
Contra Costa
Direct 4737 $190766000 $519423000 Indirect 752 $60831000 $151127000 Induced 1325 $83058000 $224749000 Total 6815 $334655000 $895299000
Marin
Direct 2732 $110014000 $299551000 Indirect 434 $35081000 $87155000 Induced 764 $47900000 $129613000 Total 3930 $192995000 $516319000
Napa
Direct 3933 $158385000 $431255000 Indirect 625 $50505000 $125474000 Induced 1100 $68960000 $186600000 Total 5658 $277850000 $743329000
San Francisco
Direct 52000 $2094047000 $5701745000 Indirect 8260 $667743000 $1658933000 Induced 14549 $911735000 $2467086000 Total 74808 $3673525000 $9827764000
San Mateo
Direct 10475 $421828000 $1148568000 Indirect 1664 $134511000 $334178000 Induced 2931 $183661000 $496973000 Total 15069 $740000000 $1979719000
Santa Clara
Direct 10832 $436224000 $1187767000 Indirect 1721 $139102000 $345583000 Induced 3031 $189929000 $513934000 Total 15584 $765255000 $2047284000
Solano
Direct 667 $26864000 $73147000 Indirect 106 $8566000 $21282000 Induced 187 $11697000 $31650000 Total 960 $47127000 $126079000
Sonoma
Direct 3933 $158386000 $431259000 Indirect 625 $50506000 $125476000 Induced 1100 $68960000 $186601000 Total 5658 $277852000 $743336000
Total
Direct 96121 $3870828000 $10539626000 Indirect 15268 $1234317000 $3066523000 Induced 26893 $1685335000 $4560387000 Total 138282 $6790480000 $18166536000
Sources Airport Visitor Spending Survey Data Provided by SFO and US Department of Commerce data provided by IMPLAN Calculations by EDR Group
2017 Economic Impact Study of San Francisco International Airport 44
TAX IMPACTS BY BAY AREA COUNTY
Tax revenues including sales property (business and labor) corporate and income taxes are collected from on‐airport tenants and the workers that they employ directly at SFO Table 29 indicates the tax revenues generated from each impact type (direct IndirectInduced and Total) by county Direct tax revenues paid by individuals and households are apportioned according to place of residence of Airport Commission staff contact employees and tenants Direct taxes paid by businesses originate in San Mateo County due to the location of the Airport
Table 29 Tax Revenues by County for On‐airport Tenants
Bay Area Counties
Direct Indirect Induced
Total
Alameda $10303000 $53898000 $64201000
Contra Costa $4882000 $27089000 $31971000
Marin $415000 $6369000 $6784000
Napa $235000 $3405000 $3640000
San Francisco $12426000 $56329000 $68755000
San Mateo $548000000 $73751000 $621751000
Santa Clara $2454000 $42422000 $44876000
Solano $2112000 $10527000 $12639000
Sonoma $374000 $9009000 $9383000
Outside Bay Area $20483000 $52913000 $73396000
Total $601684000 $335712000 $937396000
Notes Direct tax revenues shown in San Mateo County include $33 million in Possessory Interest Tax revenues as estimated for the 2016 Study
Sources Governorrsquos Budget Summary State Controllerrsquos Office the County of San Mateo Bureau of Economic Analysisrsquo (BEA) National Income and Product Accounts (NIPA) the US Census Bureau (Consumer Expenditure Survey Annual Survey of State and Local Government Finances) US Department of Commerce data provided by IMPLAN Airport Tenant Survey and Information Provided by SFO Calculations by EDR Group
Tax revenues including sales property (business and residential) corporate and income taxes are also generated by visitors and businesses that provide goods and services to domestic and international visitors Table 30 below outlines the tax revenues provided by each county by business in the hotel restaurant transportation entertainment and retail industries (direct) the businesses that support these industries (indirect) and the tax revenue generated by employees spending their earned income (induced)
2017 Economic Impact Study of San Francisco International Airport 45
Table 30 Tax Revenues by County for Visitor Spending
Bay Area Counties Direct Indirect Induced
Total
Alameda $49365000 $24431000 $73796000
Contra Costa $34330000 $16990000 $51320000
Marin $19798000 $9798000 $29596000
Napa $28502000 $14106000 $42608000
San Francisco $376840000 $186502000 $563342000
San Mateo $75911000 $37569000 $113480000
Santa Clara $78502000 $38851000 $117353000
Solano $4834000 $2393000 $7227000
Sonoma $28503000 $14106000 $42609000
Total Taxes $696585000 $344746000 $1041331000
Sources Governorrsquos Budget Summary State Controllerrsquos Office Bureau of Economic Analysisrsquo (BEA) National Income and Product Accounts (NIPA) the US Census Bureau (Consumer Expenditure Survey Annual Survey of State and Local Government Finances) US Department of Commerce data provided by IMPLAN and SFO Airport Visitor Survey Calculations by EDR Group
2017 Economic Impact Study of San Francisco International Airport 46
This Page Left Blank Intentionally
2017 Economic Impact Study of San Francisco International Airport 47
APPENDIX I METHODOLOGY FOR THE ANALYSIS
OF OVERALL ECONOMIC IMPACTS
Airport jobs and commerce on the Airport premises create strong economic stimuli for the Bay Area This airport business activity itself generates an increased demand for other local goods and services Not only do the businesses based on the Airport pay local and state taxes but the off‐airport businesses that depend upon airport‐based activity pay taxes as well As shown in this study the direct business activity and subsequent multiplier effects have a strong overall impact on the economy
All economic impacts in this report are described using the measures of jobs payroll and business sales The study quantifies three distinct categories of economic benefits that result from SFO‐related activities direct indirect and induced effects as described below
Direct impacts stem from the activity that is directly related to the provision of aviation services visitor spending or the activity of aviation‐reliant businesses For example the direct impacts of on‐airport tenants include the number of persons they employ on the Airport the wages and benefits paid to those workers and their business sales Similarly the direct impacts of air visitors include the money they spend on services and supplies and the jobs and payroll supported by those expenditures Most of the direct impacts measured in this study occur on‐airport but some such as visitor spending and the benefits produced by aviation dependent businesses occur off‐airport
Indirect and induced impacts which are sometimes called ldquomultiplier impactsrdquo result from (1) a portion of business sales used for ldquobusiness‐to‐businessrdquo purchases of goods and services (indirect effects) and (2) the recirculation of worker incomes and business expenditures in the broader Bay Area economy (induced effects) For example an airport restaurant may buy supplies from a Bay Area produce vendor This purchase represents income (ie new business sales) to the produce supplier which uses a portion of that income to pay its workers and buy additional goods and services from other businesses in the region In addition airport workers spend their wages on other items such as housing retail purchases and services Those expenditures in turn support jobs in those industries whose workers then spend their salaries in the Bay Area These successive rounds of spending and job creation represent the indirect impacts (business‐to‐business) and induced impacts (spending of wages) This study specifically measured the indirect and induced impacts that occur in the county economies of the Bay Area The discussions of total impacts are based on the following analyses and are illustrated in Figure 12
2017 Economic Impact Study of San Francisco International Airport 48
Figure 12 Elements of Economic Impacts and Interrelationships
Source EDR Group
2017 Economic Impact Study of San Francisco International Airport 49
SUPPLIERS OF GOODS AND SERVICES (INDIRECT MULTIPLIER EFFECTS)
Orders from Businesses at the Airport
Activities occurring at the Airport generate additional orders for goods and services from suppliers including orders for
Printing and publishing for the Airport operator and the airlines
Banking insurance legal accounting and technical services for airport businesses
Off‐site bus and parking services for SFO employees
Food products for airport restaurants
Wholesale merchandise to be sold by airport stores
Furniture and equipment for offices hotels restaurants and stores located at the Airport
Orders from Off‐Airport Businesses Serving Air Travelers
Activities serving air travelers outside of the Airport also generate additional orders for goods and services from suppliers for
Fueling and maintenance services for use by off‐airport taxis rental cars tour buses and public transportation
Construction and support operations of convention and hospitality facilities for convention visitors
Food products for off‐airport restaurants
Wholesale merchandise to be sold by off‐airport stores
Furniture and equipment for off‐airport hotels restaurants and stores
RE‐SPENDING OF WORKER INCOME (INDUCED MULTIPLIER EFFECTS)
The workers at SFO at off‐airport businesses serving air visitors and at supplier businesses earn income and most of that income is re‐spent on consumer purchases which support additional jobs within the Bay Area Examples of these purchases include
Retail purchases of food clothing home furnishings cars electronic devices computers and other products
Purchases of services spanning haircuts cleaning car repair and insurance
2017 Economic Impact Study of San Francisco International Airport 50
CALCULATING THE DOMESTIC AND INTERNATIONAL VALUES FROM CARGO
ORIGINATING IN THE BAY AREA AND SHIPPED THROUGH SFO
The combined $17 billion of international and domestic exports through SFO provides a significant direct contribution to the Bay Area economy as well as additional activity through economic linkages To estimate the level of impact EDR Group layered three sets of data ndash the Foreign Trade Database (FTD) of the US Bureau of the Census (tabulated by WISERTrade) the multi‐modal Freight Analysis Framework (FAF) of the US Federal Highway Administration and US Bureau of Economic Analysis (BEA) data included in IMPLAN to
1) Estimate the jobs and wages associated with the domestic and international exports through SFO and
2) Determine the additional activity that percolates throughout the economy as air‐reliant businesses purchase additional goods and services from suppliers (Indirect) and employees spend their additional income (Induced)
FTD data aggregated by WISERTrade was the basis of estimating the weight and value of goods produced in the Bay Area and exported from SFO to international markets FTD provides total exports by commodity and state of origin and the total value of California exports shipped through SFO WISERTrade also provides total value and weight by commodity for all shipments from SFO but not at a commodity level by point of origin Using IMPLAN data the ratios of output by commodity were calculated for the nine‐county Bay Area compared to California totals This calculation estimated the ldquosharerdquo of California produced air exports with an approximate point of origin in the Bay Area The calculation was constrained by both the value and weight reported by WISERTrade of exports by commodity from SFO and the weight of international shipments from SFO taken from the flysfo website
FAF was the basis of estimating domestic cargo shipments FAF provides domestic air shipments of commodities that originate in the twelve county San Jose‐San Francisco‐Oakland CA Combined Statistical Area Using IMPLAN data output by commodity for the nine‐county Bay Area were compared to the twelve county CMSA to estimate the ldquosharerdquo of each commodity shipped from the CSA
BEA data within IMPLAN profiles the structural buyer‐supplier relationships within the economy as well as the industries where labor income is usually spent Figure 13 illustrates the methodology of calculating the domestic and international values from the Bay Area through SFO
2017 Economic Impact Study of San Francisco International Airport 51
Figure 13 Methodology to Estimate Air Dependent Contribution to Bay Area Economy
3 Freight shipments by value
2 Geography
1 Calculations
MAJOR SOURCES OF DATA USED IN THIS STUDY
The discussion of total impacts is based on the following analyses conducted specifically for this study
1 A survey of all airport tenants and the data provided by staff of the San Francisco Airport Commission These data provide profiles of on‐airport jobs by establishment type of business activity and place of residence by zip code for airport and tenant employees
2 Polaris Research conducted surveys of airport travelers were conducted by Polaris Research The survey profiled trip purposes international or domestic origins segmentation of visitors from local residents and connecting passengers and the amount of money in the Bay Area spent by visitors using the Airport
3 Air freight analyses are based on data from SFO WISERTrade using data from US Census Bureau Foreign Trade Division30 and the Freight Analysis Framework (FAF) to develop a detailed profile of air exports from SFO by commodity and origin of movement Detailed data from FAF are not available for the Bay Area alone (statewide for the Foreign Trade Division and a 12 county combined statistical area (CSA) for FAF) Therefore the detailed commodity flows found in the data sets are proportioned based on the output per industry (converted from commodities) of the Bay Area
30 The World Institute for Strategic Economic Research (WISERTrade) formed July 1 2004 to continue the international trade data work of its predecessor MISER was chosen by the US Census Bureau to be one of its first Business and Industry Data Centers with special focus on foreign trade statistics See wwwwisertradeorg
2017 Economic Impact Study of San Francisco International Airport 52
4 Econometric models for the nine‐county Bay Area are based on the IMPLAN Economic Model System IMPLAN is used to estimate wages and sales (or budget expenditures for public entities) for airport tenants where only employment totals were available Labor income and sales andor expenditures per worker are derived primarily from US Department of Commerce (BEA is a part of the Commerce Department) and Department of Labor data sets and are county‐specific IMPLAN is also used to derive multiplier effects including business orders to suppliers generated by on‐airport businesses off‐airport businesses serving airport visitors and airport‐reliant businesses and business sales generated by the spending of the additional workersrsquo income on consumer purchases
2017 Economic Impact Study of San Francisco International Airport 53
APPENDIX II SUMMARY OF IMPLAN SECTORING
To estimate the full range of direct effects and the indirect and induced (ldquomultiplierrdquo) economic effects this study utilized the IMPLAN model system of MIG Inc IMPLAN is now the most widely used input‐output economic modeling system in the US with a client list of 500 public and private agencies including several federal agencies and numerous state agencies It utilizes US Commerce Department (National Income and Product Accounts) data on inter‐industry technology relationships (also known as input‐output structural matrices) countywide employment and income data from the Bureau of Economic Analysis (BEA) and Bureau of Labor Statistics (BLS) and its own industry and county‐specific estimates of local purchasing rates (ldquoregional purchase coefficientsrdquo) It is enhanced over most other input‐output models in that it also includes coverage of public sector activity and consumer activity (reflected in its ldquosocial accounting matrixrdquo) The industry detail is at the level of 536 industries and is based on categories of the US Bureau of Economic Analysis (BEA) which correspond to two to five digit groups in the North American Industry Classification System (NAICS)
For this study the direct job payroll and business revenue effects for on‐airport and visitor spending were documented through surveys completed for this project and then assigned to specific sector groups based on EDR Grouprsquos experience in aviation SFOrsquos support of air reliant industries was documented through databases maintained by the US Census Bureau and the US Department of Transportation The IMPLAN model was then calibrated for the nine‐county Bay Area as well as for each county within the region and a model calibrated for a defined region outside the Bay Area to measure additional visitor spending The result was an estimate of the indirect and induced (and overall) job business revenue and income impacts for each segment of airport beneficiary The analysis of retail impacts was adjusted to account for retail markup margins and the concentration of sales in airports and in visitor industries Retail portions of multiplier effects also incorporate these margins
Regardless of whether economic impacts are measured in terms of jobs income or business sales these impacts can be classified into three categories
Direct economic effects are the changes occurring at the project site as a direct consequence of the public investment project or program This is represented as the net increase in business activity associated with business at the SFO initial visitor spending at off‐airport businesses in each countyrsquos hospitality sector and the sale revenues earned by shippers who route air cargo through SFO
Indirect economic effects are the broader effects on business activity for off‐site goods and services supplied to the directly affected businesses
Induced economic effects are further shifts in spending on food clothing shelter and other consumer goods and services because of the change in workers and payroll of directly and indirectly affected businesses
EDR Group assembled classifications of the 536 sectors in the IMPLAN modeling package to best mirror types of industries on SFO types of visitor spending and industries related to commodities exported from SFO The classification schemes used for this study for on‐airport and visitor spending impacts are shown in Table 31 and Table 32
2017 Economic Impact Study of San Francisco International Airport 54
Table 31 Industry Classification of On‐Airport Industries
Airport Tenants Classification IMPLAN Sectors Used Passenger Airlines Air Transportation Freight Airlines Couriers Air Transportation Couriers Fixed Based Operator (FBO) Support activities for transportation Local Government
State and Local Government State Government
Federal Government Immigration TSA FBI US Customs and Border Patrol (CBP) National Weather Service
Distribution TruckingWarehousing Wholesale Wholesale Trade business Security Security Aviation Firms
Construction
Highways and Streets Commercial Structures Non‐residential structures Maintenance and Repair
Retail
ElectronicsAppliance Stores Food and Beverage Health and Labor Care Clothing Stores Sporting Goods Stores Misc Retail
Food and Beverage (includes Catering Firms) Full‐service restaurants Limited‐service restaurants All other food and drinking places
Car Rental Car Rental Ground Transportation (incl taxis limos buses vans and transit)
Transit and ground passenger transp
Other Medical Clinic Vending Machines
Services
Educational institutions Electronic repair services Insurance Medical services Other Support Services Telecommunications Waste Management
Reliant Services
ArchitecturalEngineering Business support Computer systems design services Facilities support Financial Services Management scientific and Technical Parking and Misc
2017 Economic Impact Study of San Francisco International Airport 55
Table 32 Industry Classification of Visitor‐Serving Industries
Visitor Spending Classification
IMPLAN Sectors Used
ElectronicsAppliance Stores
Food and Beverage
Health and Labor
Retail Clothing Stores
Sporting Goods
General Merchandise
Misc Retail
Performing Arts
Spectator Sports
Artists writers and performers
Museums zoos and parks
Entertainment Amusement parks and arcades
Gambling industries
Fitness and recreational sports centers
Bowling centers
Other amusement recreation
Full‐service restaurants
Restaurant Limited‐service restaurants
All other food and drinking places
Hotels and motels Hotel
Other accommodations
Transit and ground passenger transportation
Scenic and sightseeing Transportation
Support activities
Gas stations
Sources US Department of Commerce data provided by IMPLAN Calculations by EDR Group
2017 Economic Impact Study of San Francisco International Airport 56
This Page Left Blank Intentionally
2017 Economic Impact Study of San Francisco International Airport 57
APPENDIX III SFO TENANT AND VISITOR SURVEYS
The following pages are the survey instruments used for SFO tenants and visiting passengers Note that the passenger survey was administered in multiple languages
2017 Economic Impact Study of San Francisco International Airport 58
2017 Economic Impact Study of San Francisco International Airport 59
2017 Economic Impact Study of San Francisco International Airport 60
2017 Economic Impact Study of San Francisco International Airport 61
2017 Economic Impact Study of San Francisco International Airport 62
2017 Economic Impact Study of San Francisco International Airport 63
2017 Economic Impact Study of San Francisco International Airport 64
2017 Economic Impact Study of San Francisco International Airport 65
2017 Economic Impact Study of San Francisco International Airport 66
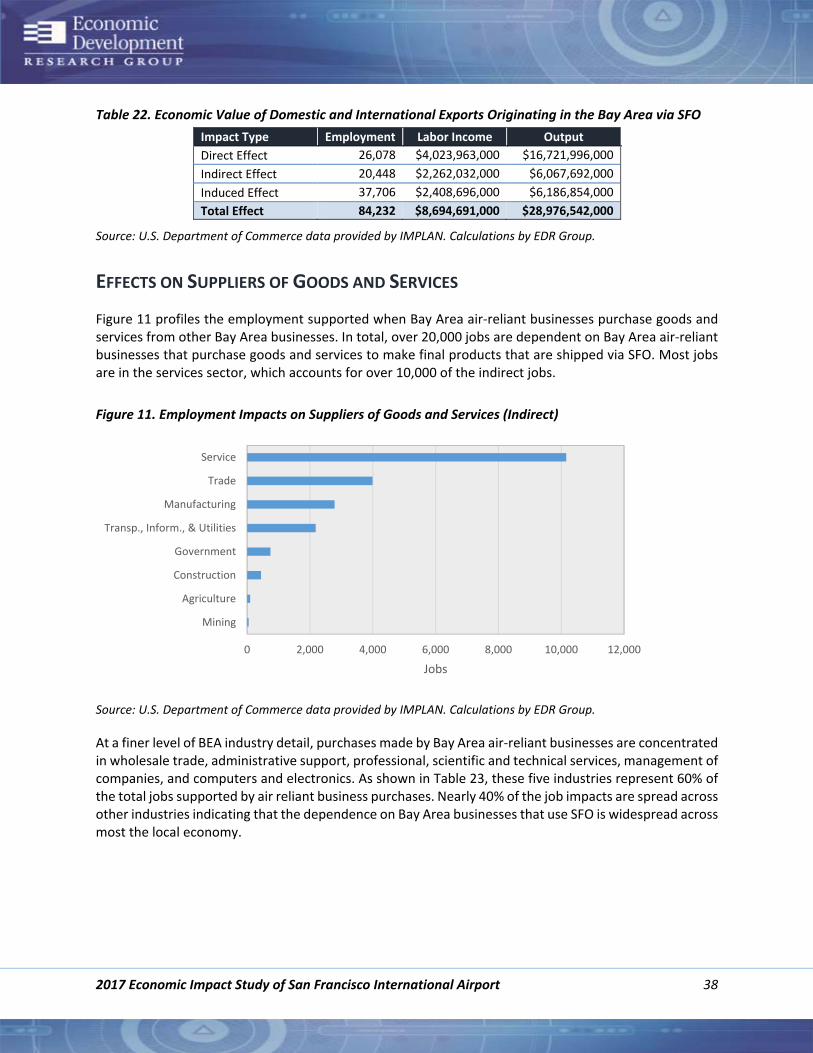

This Page Left Blank Intentionally
2017 Economic Impact Study of San Francisco International Airport 47
APPENDIX I METHODOLOGY FOR THE ANALYSIS
OF OVERALL ECONOMIC IMPACTS
Airport jobs and commerce on the Airport premises create strong economic stimuli for the Bay Area This airport business activity itself generates an increased demand for other local goods and services Not only do the businesses based on the Airport pay local and state taxes but the off‐airport businesses that depend upon airport‐based activity pay taxes as well As shown in this study the direct business activity and subsequent multiplier effects have a strong overall impact on the economy
All economic impacts in this report are described using the measures of jobs payroll and business sales The study quantifies three distinct categories of economic benefits that result from SFO‐related activities direct indirect and induced effects as described below
Direct impacts stem from the activity that is directly related to the provision of aviation services visitor spending or the activity of aviation‐reliant businesses For example the direct impacts of on‐airport tenants include the number of persons they employ on the Airport the wages and benefits paid to those workers and their business sales Similarly the direct impacts of air visitors include the money they spend on services and supplies and the jobs and payroll supported by those expenditures Most of the direct impacts measured in this study occur on‐airport but some such as visitor spending and the benefits produced by aviation dependent businesses occur off‐airport
Indirect and induced impacts which are sometimes called ldquomultiplier impactsrdquo result from (1) a portion of business sales used for ldquobusiness‐to‐businessrdquo purchases of goods and services (indirect effects) and (2) the recirculation of worker incomes and business expenditures in the broader Bay Area economy (induced effects) For example an airport restaurant may buy supplies from a Bay Area produce vendor This purchase represents income (ie new business sales) to the produce supplier which uses a portion of that income to pay its workers and buy additional goods and services from other businesses in the region In addition airport workers spend their wages on other items such as housing retail purchases and services Those expenditures in turn support jobs in those industries whose workers then spend their salaries in the Bay Area These successive rounds of spending and job creation represent the indirect impacts (business‐to‐business) and induced impacts (spending of wages) This study specifically measured the indirect and induced impacts that occur in the county economies of the Bay Area The discussions of total impacts are based on the following analyses and are illustrated in Figure 12
2017 Economic Impact Study of San Francisco International Airport 48
Figure 12 Elements of Economic Impacts and Interrelationships
Source EDR Group
2017 Economic Impact Study of San Francisco International Airport 49
SUPPLIERS OF GOODS AND SERVICES (INDIRECT MULTIPLIER EFFECTS)
Orders from Businesses at the Airport
Activities occurring at the Airport generate additional orders for goods and services from suppliers including orders for
Printing and publishing for the Airport operator and the airlines
Banking insurance legal accounting and technical services for airport businesses
Off‐site bus and parking services for SFO employees
Food products for airport restaurants
Wholesale merchandise to be sold by airport stores
Furniture and equipment for offices hotels restaurants and stores located at the Airport
Orders from Off‐Airport Businesses Serving Air Travelers
Activities serving air travelers outside of the Airport also generate additional orders for goods and services from suppliers for
Fueling and maintenance services for use by off‐airport taxis rental cars tour buses and public transportation
Construction and support operations of convention and hospitality facilities for convention visitors
Food products for off‐airport restaurants
Wholesale merchandise to be sold by off‐airport stores
Furniture and equipment for off‐airport hotels restaurants and stores
RE‐SPENDING OF WORKER INCOME (INDUCED MULTIPLIER EFFECTS)
The workers at SFO at off‐airport businesses serving air visitors and at supplier businesses earn income and most of that income is re‐spent on consumer purchases which support additional jobs within the Bay Area Examples of these purchases include
Retail purchases of food clothing home furnishings cars electronic devices computers and other products
Purchases of services spanning haircuts cleaning car repair and insurance
2017 Economic Impact Study of San Francisco International Airport 50
CALCULATING THE DOMESTIC AND INTERNATIONAL VALUES FROM CARGO
ORIGINATING IN THE BAY AREA AND SHIPPED THROUGH SFO
The combined $17 billion of international and domestic exports through SFO provides a significant direct contribution to the Bay Area economy as well as additional activity through economic linkages To estimate the level of impact EDR Group layered three sets of data ndash the Foreign Trade Database (FTD) of the US Bureau of the Census (tabulated by WISERTrade) the multi‐modal Freight Analysis Framework (FAF) of the US Federal Highway Administration and US Bureau of Economic Analysis (BEA) data included in IMPLAN to
1) Estimate the jobs and wages associated with the domestic and international exports through SFO and
2) Determine the additional activity that percolates throughout the economy as air‐reliant businesses purchase additional goods and services from suppliers (Indirect) and employees spend their additional income (Induced)
FTD data aggregated by WISERTrade was the basis of estimating the weight and value of goods produced in the Bay Area and exported from SFO to international markets FTD provides total exports by commodity and state of origin and the total value of California exports shipped through SFO WISERTrade also provides total value and weight by commodity for all shipments from SFO but not at a commodity level by point of origin Using IMPLAN data the ratios of output by commodity were calculated for the nine‐county Bay Area compared to California totals This calculation estimated the ldquosharerdquo of California produced air exports with an approximate point of origin in the Bay Area The calculation was constrained by both the value and weight reported by WISERTrade of exports by commodity from SFO and the weight of international shipments from SFO taken from the flysfo website
FAF was the basis of estimating domestic cargo shipments FAF provides domestic air shipments of commodities that originate in the twelve county San Jose‐San Francisco‐Oakland CA Combined Statistical Area Using IMPLAN data output by commodity for the nine‐county Bay Area were compared to the twelve county CMSA to estimate the ldquosharerdquo of each commodity shipped from the CSA
BEA data within IMPLAN profiles the structural buyer‐supplier relationships within the economy as well as the industries where labor income is usually spent Figure 13 illustrates the methodology of calculating the domestic and international values from the Bay Area through SFO
2017 Economic Impact Study of San Francisco International Airport 51
Figure 13 Methodology to Estimate Air Dependent Contribution to Bay Area Economy
3 Freight shipments by value
2 Geography
1 Calculations
MAJOR SOURCES OF DATA USED IN THIS STUDY
The discussion of total impacts is based on the following analyses conducted specifically for this study
1 A survey of all airport tenants and the data provided by staff of the San Francisco Airport Commission These data provide profiles of on‐airport jobs by establishment type of business activity and place of residence by zip code for airport and tenant employees
2 Polaris Research conducted surveys of airport travelers were conducted by Polaris Research The survey profiled trip purposes international or domestic origins segmentation of visitors from local residents and connecting passengers and the amount of money in the Bay Area spent by visitors using the Airport
3 Air freight analyses are based on data from SFO WISERTrade using data from US Census Bureau Foreign Trade Division30 and the Freight Analysis Framework (FAF) to develop a detailed profile of air exports from SFO by commodity and origin of movement Detailed data from FAF are not available for the Bay Area alone (statewide for the Foreign Trade Division and a 12 county combined statistical area (CSA) for FAF) Therefore the detailed commodity flows found in the data sets are proportioned based on the output per industry (converted from commodities) of the Bay Area
30 The World Institute for Strategic Economic Research (WISERTrade) formed July 1 2004 to continue the international trade data work of its predecessor MISER was chosen by the US Census Bureau to be one of its first Business and Industry Data Centers with special focus on foreign trade statistics See wwwwisertradeorg
2017 Economic Impact Study of San Francisco International Airport 52
4 Econometric models for the nine‐county Bay Area are based on the IMPLAN Economic Model System IMPLAN is used to estimate wages and sales (or budget expenditures for public entities) for airport tenants where only employment totals were available Labor income and sales andor expenditures per worker are derived primarily from US Department of Commerce (BEA is a part of the Commerce Department) and Department of Labor data sets and are county‐specific IMPLAN is also used to derive multiplier effects including business orders to suppliers generated by on‐airport businesses off‐airport businesses serving airport visitors and airport‐reliant businesses and business sales generated by the spending of the additional workersrsquo income on consumer purchases
2017 Economic Impact Study of San Francisco International Airport 53
APPENDIX II SUMMARY OF IMPLAN SECTORING
To estimate the full range of direct effects and the indirect and induced (ldquomultiplierrdquo) economic effects this study utilized the IMPLAN model system of MIG Inc IMPLAN is now the most widely used input‐output economic modeling system in the US with a client list of 500 public and private agencies including several federal agencies and numerous state agencies It utilizes US Commerce Department (National Income and Product Accounts) data on inter‐industry technology relationships (also known as input‐output structural matrices) countywide employment and income data from the Bureau of Economic Analysis (BEA) and Bureau of Labor Statistics (BLS) and its own industry and county‐specific estimates of local purchasing rates (ldquoregional purchase coefficientsrdquo) It is enhanced over most other input‐output models in that it also includes coverage of public sector activity and consumer activity (reflected in its ldquosocial accounting matrixrdquo) The industry detail is at the level of 536 industries and is based on categories of the US Bureau of Economic Analysis (BEA) which correspond to two to five digit groups in the North American Industry Classification System (NAICS)
For this study the direct job payroll and business revenue effects for on‐airport and visitor spending were documented through surveys completed for this project and then assigned to specific sector groups based on EDR Grouprsquos experience in aviation SFOrsquos support of air reliant industries was documented through databases maintained by the US Census Bureau and the US Department of Transportation The IMPLAN model was then calibrated for the nine‐county Bay Area as well as for each county within the region and a model calibrated for a defined region outside the Bay Area to measure additional visitor spending The result was an estimate of the indirect and induced (and overall) job business revenue and income impacts for each segment of airport beneficiary The analysis of retail impacts was adjusted to account for retail markup margins and the concentration of sales in airports and in visitor industries Retail portions of multiplier effects also incorporate these margins
Regardless of whether economic impacts are measured in terms of jobs income or business sales these impacts can be classified into three categories
Direct economic effects are the changes occurring at the project site as a direct consequence of the public investment project or program This is represented as the net increase in business activity associated with business at the SFO initial visitor spending at off‐airport businesses in each countyrsquos hospitality sector and the sale revenues earned by shippers who route air cargo through SFO
Indirect economic effects are the broader effects on business activity for off‐site goods and services supplied to the directly affected businesses
Induced economic effects are further shifts in spending on food clothing shelter and other consumer goods and services because of the change in workers and payroll of directly and indirectly affected businesses
EDR Group assembled classifications of the 536 sectors in the IMPLAN modeling package to best mirror types of industries on SFO types of visitor spending and industries related to commodities exported from SFO The classification schemes used for this study for on‐airport and visitor spending impacts are shown in Table 31 and Table 32
2017 Economic Impact Study of San Francisco International Airport 54
Table 31 Industry Classification of On‐Airport Industries
Airport Tenants Classification IMPLAN Sectors Used Passenger Airlines Air Transportation Freight Airlines Couriers Air Transportation Couriers Fixed Based Operator (FBO) Support activities for transportation Local Government
State and Local Government State Government
Federal Government Immigration TSA FBI US Customs and Border Patrol (CBP) National Weather Service
Distribution TruckingWarehousing Wholesale Wholesale Trade business Security Security Aviation Firms
Construction
Highways and Streets Commercial Structures Non‐residential structures Maintenance and Repair
Retail
ElectronicsAppliance Stores Food and Beverage Health and Labor Care Clothing Stores Sporting Goods Stores Misc Retail
Food and Beverage (includes Catering Firms) Full‐service restaurants Limited‐service restaurants All other food and drinking places
Car Rental Car Rental Ground Transportation (incl taxis limos buses vans and transit)
Transit and ground passenger transp
Other Medical Clinic Vending Machines
Services
Educational institutions Electronic repair services Insurance Medical services Other Support Services Telecommunications Waste Management
Reliant Services
ArchitecturalEngineering Business support Computer systems design services Facilities support Financial Services Management scientific and Technical Parking and Misc
2017 Economic Impact Study of San Francisco International Airport 55
Table 32 Industry Classification of Visitor‐Serving Industries
Visitor Spending Classification
IMPLAN Sectors Used
ElectronicsAppliance Stores
Food and Beverage
Health and Labor
Retail Clothing Stores
Sporting Goods
General Merchandise
Misc Retail
Performing Arts
Spectator Sports
Artists writers and performers
Museums zoos and parks
Entertainment Amusement parks and arcades
Gambling industries
Fitness and recreational sports centers
Bowling centers
Other amusement recreation
Full‐service restaurants
Restaurant Limited‐service restaurants
All other food and drinking places
Hotels and motels Hotel
Other accommodations
Transit and ground passenger transportation
Scenic and sightseeing Transportation
Support activities
Gas stations
Sources US Department of Commerce data provided by IMPLAN Calculations by EDR Group
2017 Economic Impact Study of San Francisco International Airport 56
This Page Left Blank Intentionally
2017 Economic Impact Study of San Francisco International Airport 57
APPENDIX III SFO TENANT AND VISITOR SURVEYS
The following pages are the survey instruments used for SFO tenants and visiting passengers Note that the passenger survey was administered in multiple languages
2017 Economic Impact Study of San Francisco International Airport 58
2017 Economic Impact Study of San Francisco International Airport 59
2017 Economic Impact Study of San Francisco International Airport 60
2017 Economic Impact Study of San Francisco International Airport 61
2017 Economic Impact Study of San Francisco International Airport 62
2017 Economic Impact Study of San Francisco International Airport 63
2017 Economic Impact Study of San Francisco International Airport 64
2017 Economic Impact Study of San Francisco International Airport 65
2017 Economic Impact Study of San Francisco International Airport 66
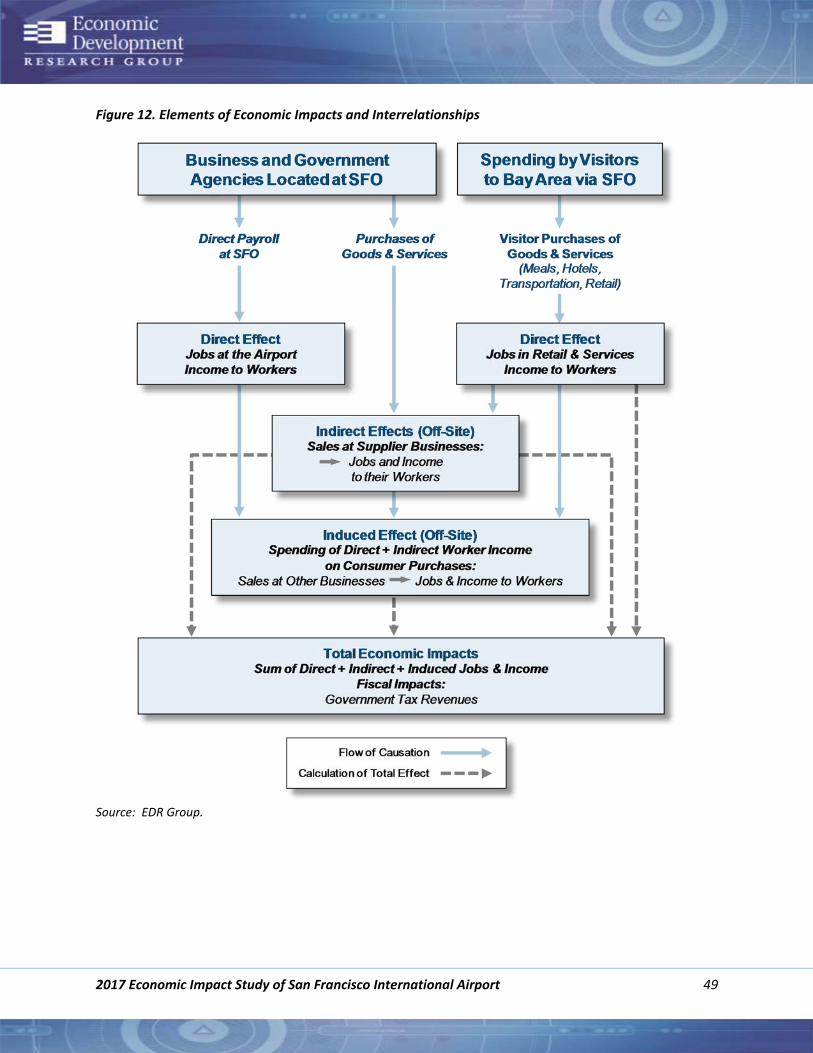

2017 Economic Impact Study of San Francisco International Airport 63
2017 Economic Impact Study of San Francisco International Airport 64
2017 Economic Impact Study of San Francisco International Airport 65
2017 Economic Impact Study of San Francisco International Airport 66

2017 Economic Impact Study of San Francisco International Airport 64
2017 Economic Impact Study of San Francisco International Airport 65
2017 Economic Impact Study of San Francisco International Airport 66

2017 Economic Impact Study of San Francisco International Airport 65
2017 Economic Impact Study of San Francisco International Airport 66

2017 Economic Impact Study of San Francisco International Airport 66