Embed Size (px)
Citation preview

2017 DELIVERABILITY
REPORTAnalysis of Worldwide Inbox Placement Rates

22017 Deliverability Benchmark Report returnpath.com
Reaching the inbox has always been a challenge. Mailbox providers seek to protect their mailbox users and provide the best possible inbox experience, so they have strong restrictions in place on both what is accepted and whether it is placed in the inbox or in the spam folder.
Due to these restrictions, globally, one in five messages does not reach the inbox. Not only do they not reach the inbox, 70 percent of those messages are not delivered to the inbox or spam folder—rather they are blocked at the gateway. With 20 percent of email not reaching the inbox, marketers are missing out on not only potential revenue, but also the opportunity to build strong relationships with subscribers.
In this year’s annual benchmark report, we take a look at how email gets delivered and the best way to measure inbox placement. We also explore the 12 month global and regional inbox placement results, as well as industry breakouts of inbox placement.
INTRODUCTION
22017 Deliverability Benchmark Report returnpath.com

32017 Deliverability Benchmark Report returnpath.com
THE PATH TO THE INBOXGetting to the inbox entails more than hitting the send button. Below is a representation of the filters each message encounters on its journey.
Email that is deemed malicious or untrustworthy is often blocked at the gateway, never reaching either the inbox or the spam folder. For messages that make it past the gateway, spam filters look at the reputation of the sender, subscriber engagement, and content to decide if they should be placed in the inbox or the spam folder for each subscriber. Emails that make it past both gateway and spam filters are the only ones that reach the inbox.
GATEWAY SPAM FILTER INBOX
BLOCK? NO SPAM? NO
YES YES
SPAM FOLDERSTOP
32017 Deliverability Benchmark Report returnpath.com

42017 Deliverability Benchmark Report returnpath.com
MEASURING INBOX PLACEMENT
Both of these sources of data have their strengths and weaknesses, and each provides slightly different deliverability numbers as a result of their different inputs. Using both together provides a more complete, holistic view of your deliverability.
The global and country specific inbox placement rates on the pages that follow are calculated using seed data. We use seed data for these calculations because it provides excellent coverage with global and regional mailboxes, and allows us to capture information about missing/blocked email. Then we will take a look at the inbox placement rates broken out by industry using Consumer Network data. This allows us to see how subscriber engagement with the different industries impacts inbox placement.
Seed addresses is the most common method for measuring inbox placement rates. Have you ever tested an email campaign’s deliverability rate by sending it to your personal email address? That’s similar to how seed addresses work. But at Return Path, we have created seed addresses at hundreds of mailbox providers and filters around the world, and we provide multiple addresses per mailbox provider. When marketers send email to the seed addresses we own and manage, our software checks to see if it was delivered, and if so, reports whether the message went to the inbox or the spam folder.
Consumer Network data data shows placement results generated from email accounts that are actively owned and managed by real subscribers. This data is collected from users of Return Path powered email applications in which users explicitly grant permission for Return Path to view and report on their mailbox behavioral data in aggregate. Through our Consumer Network, we are able to gather real world data and analyze world email behaviors. For example, if an email lands in the inbox or spam folder, we can see whether or not the subscriber reads the email, reports it as spam, and many other hidden user behaviors.
42017 Deliverability Benchmark Report returnpath.com
Seeds:+ 140+ global and regional mailbox providers+ Measure missing/blocked emails- No engagement data- Smaller sample
Consumer Network:+ 2 million active users + Engagement data- Only covers Microsoft, Gmail, Yahoo, and AOL

52017 Deliverability Benchmark Report returnpath.com
GLOBAL INBOX PLACEMENTThe overall global inbox placement rate of 80 percent represents a one percent increase over the previous period.
52017 Deliverability Benchmark Report returnpath.com
Inbox placement rate Spam rate Missing rate
Q3 16 Q4 16 Q1 17 Q2 17 TOTAL
78% 6% 15% 82% 6% 12% 80% 6% 14%81% 6% 13% 79% 6% 16%
YoY inbox placementchange
YoY spam placementchange
YoYmissingchange
1% 1% -2%

62017 Deliverability Benchmark Report returnpath.com
UNITED STATESSenders in the US saw an average inbox placement rate of 77 percent for the period analyzed compared to 73 percent a year ago. This represents an increase of four percentage points compared to the previous period.
62017 Deliverability Benchmark Report returnpath.com
Inbox placement rate Spam rate Missing rate
Q3 16 Q4 16 Q1 17 Q2 17 TOTAL
73% 8% 19% 79% 8% 13% 77% 8% 16%79% 8% 14% 77% 7% 17%
YoY inbox placementchange
YoY spam placementchange
YoYmissingchange
4% 2% -6%

72017 Deliverability Benchmark Report returnpath.com
03
CANADACanadian marketers achieved one of the highest inbox placement rates with a 12 month average of 90 percent—significantly above the global average.
72017 Deliverability Benchmark Report returnpath.com
Inbox placement rate Spam rate Missing rate
Q3 16 Q4 16 Q1 17 Q2 17 TOTAL
92% 2% 6% 93% 2% 6% 90% 2% 7%90% 3% 7% 87% 3% 10%
1% -1%-2%YoY inbox placementchange
YoY spam placementchange
YoYmissingchange

82017 Deliverability Benchmark Report returnpath.com
BRAZILIn Brazil, marketers maintained the same overall inbox placement from the previous period, with a 79 percent average inbox placement rate. This figure is just slightly below the global average of 80 percent.
82017 Deliverability Benchmark Report returnpath.com
Inbox placement rate Spam rate Missing rate
Q3 16 Q4 16 Q1 17 Q2 17 TOTAL
78% 8% 14% 78% 13% 9% 79% 10% 11%80% 10% 10% 81% 8% 12%
1% -1%0%YoY inbox placementchange
YoY spam placementchange
YoYmissingchange
92017 Deliverability Benchmark Report returnpath.com
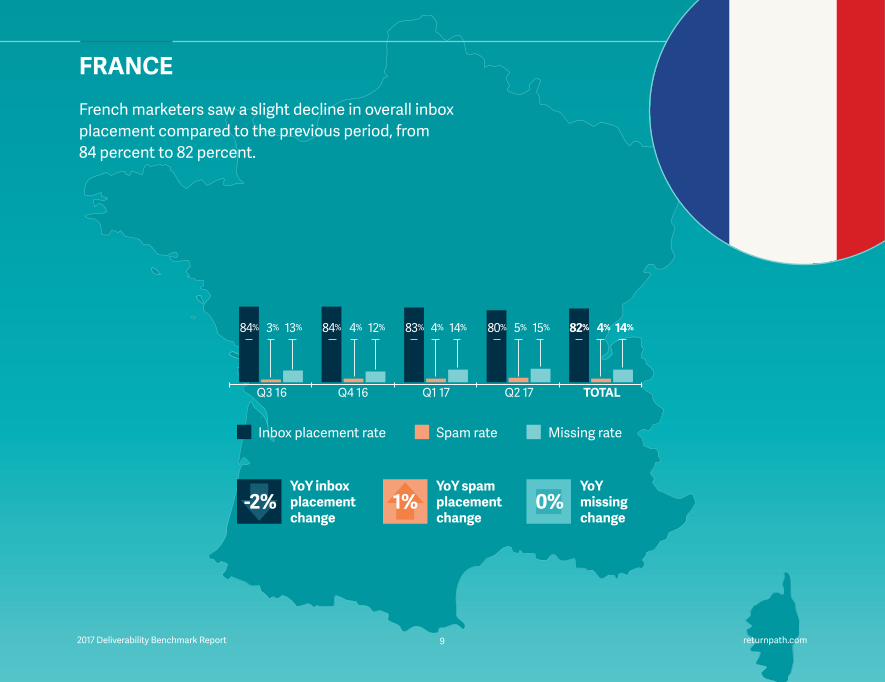
FRANCEFrench marketers saw a slight decline in overall inbox placement compared to the previous period, from 84 percent to 82 percent.
92017 Deliverability Benchmark Report returnpath.com
Inbox placement rate Spam rate Missing rate
Q3 16 Q4 16 Q1 17 Q2 17 TOTAL
84% 3% 13% 84% 4% 12% 82% 4% 14%83% 4% 14% 80% 5% 15%
1%-2% 0%YoY inbox placementchange
YoY spam placementchange
YoYmissingchange

102017 Deliverability Benchmark Report returnpath.com
GERMANYInbox placement in Germany dropped slightly from the previous period, with a 79 percent average.
102017 Deliverability Benchmark Report returnpath.com
Inbox placement rate Spam rate Missing rate
Q3 16 Q4 16 Q1 17 Q2 17 TOTAL
84% 5% 11% 83% 6% 11% 79% 8% 13%77% 9% 14% 74% 11% 15%
-1% 0% 1%YoY inbox placementchange
YoY spam placementchange
YoYmissingchange

112017 Deliverability Benchmark Report returnpath.com
SPAINSpain maintained an average inbox placement rate of 82 percent during the 12 months analyzed .
112017 Deliverability Benchmark Report returnpath.com
Inbox placement rate Spam rate Missing rate
Q3 16 Q4 16 Q1 17 Q2 17 TOTAL
80% 8% 12% 81% 8% 11% 82% 6% 12%83% 5% 12% 83% 4% 13%
4% -5%0%YoY inbox placementchange
YoY spam placementchange
YoYmissingchange

122017 Deliverability Benchmark Report returnpath.com
UNITED KINGDOMEmail marketers in the United Kingdom had an average inbox placement rate of 84 percent during the period analyzed. This rate remained relatively steady throughout the entire 12 months.
Inbox placement rate Spam rate Missing rate
Q3 16 Q4 16 Q1 17 Q2 17 TOTAL
85% 7% 8% 83% 8% 8% 84% 7% 9%85% 7% 8% 84% 5% 11%
122017 Deliverability Benchmark Report returnpath.com
2%-4% 2%YoY inbox placementchange
YoY spam placementchange
YoYmissingchange

132017 Deliverability Benchmark Report returnpath.com
-1%
AUSTRALIAInbox placement rates for Australian email marketers remained unchanged from the previous period at 90 percent—tying with Canada for the highest inbox placement during the period studied.
132017 Deliverability Benchmark Report returnpath.com
Q3 16 Q4 16 Q1 17 Q2 17 TOTAL
89% 2% 9% 90% 1% 9% 90% 1% 9%92% 2% 7% 90% 1% 9%
Inbox placement rate Spam rate Missing rate
0%YoY inbox placementchange
YoY spam placementchange
YoYmissingchange
2%

142017 Deliverability Benchmark Report returnpath.com
As more mailbox providers begin to factor subscriber engagement into their email placement decisions, access to live subscriber data becomes extremely important. By tracking how subscribers interact with email and how deliverability changes as a result, marketers can uncover the cause of engagement-based deliverability issues.
Because Return Path Consumer Network data is drawn from real subscribers’ inbox behaviors, it helps email marketers gain visibility into deliverability issues caused by subscriber engagement. The graphic below shows inbox placement rates by industry, gathered from over 2 million inboxes included in our Consumer Network.
While reviewing these benchmarks, remember:
1. This data only represents emails accepted at the gateway. Messages that are blocked or blacklisted aren’t included. In other words, email that is sent but not “delivered”—either to the inbox or spam folder— does not factor into these calculations. Because of this, these numbers will be higher than those calculated with seed data. 2. Consumer Network data represents only the top four webmail domain providers: Microsoft, Gmail, Yahoo, and AOL.
CAPTURING SUBSCRIBER LEVEL DELIVERABILITY

152017 Deliverability Benchmark Report returnpath.com
The 12 month inbox placement average for all industries was 85 percent, when calculated using our Consumer Network data. This represents a slight decline from the previous period.
Banking & finance, distribution & manufacturing, and travel marketers had the highest inbox placement rates of all industries, each achieving average inbox placement rates of 90 percent or more.
Automotive, education/nonprofit/government, and social & dating industries struggled to reach their subscribers, each with inbox placement rates below 78 percent.
INBOX PLACEMENT RATE BY INDUSTRY
Banking & Finance 94% 94% 93% 94% 94% 92% 2%
Household & Home Improvement 89% 88% 88% 87% 88% 95% -7%
Deals & Rewards 89% 87% 85% 83% 86% 88% -2%
Insurance 86% 90% 90% 90% 89% 76% 13%
Distribution & Manufacturing 85% 93% 95% 96% 92% 85% 7%
Computers & Electronics 88% 87% 84% 87% 86% 92% -6%
Food & Drug 88% 86% 84% 82% 85% 89% -4%
Automotive 64% 82% 78% 84% 77% 66% 11%
Social & Dating 75% 78% 78% 78% 77% 78% -1%
Technology/So�ware/Internet 85% 87% 86% 84% 85% 75% 10%
Business & Marketing 80% 81% 83% 83% 82% 78% 4%
Education/Nonprofit/Government 77% 78% 74% 74% 76% 82% -6%
Health & Beauty 87% 85% 81% 82% 83% 89% -6%
Apparel 87% 86% 84% 84% 85% 93% -8%
Media & Entertainment 83% 83% 82% 80% 82% 86% -4%
Travel 92% 91% 89% 88% 90% 94% -4%
All Industries 84% 86% 85% 85% 85% 87% -2%
INDUSTRY Q3 2016 Q4 2016 Q1 2017 Q2 2017 12 Mo. AVG Prev Period YoY CHANGE
162017 Deliverability Benchmark Report returnpath.com
METHODOLOGYReturn Path conducted this study using a representative sample of more than 2 billion promotional email messages sent to consumers around the world between July 2016 and June 2017. Global and regional statistics are based on performance across more than 140 mailbox providers in North America, South America, Europe, and Asia-Pacific regions. Country and industry statistics are based on a subset of senders whose locations and industry classifications are identifiable.
Return Path Consumer Network data is captured from monitored email accounts controlled by real subscribers to sample user-initiated engagement based filtering decisions by mailbox providers. Consumer Network data can uncover behavior based factors and thresholds that influence inbox placement at large mailbox providers and can’t be identified by non-interactive seeds.
The industry results are based on global consumer data consisting of over 17,000 commercial senders, 2 million consumer panelists, and over 2 billion commercial email messages sent to Microsoft, Gmail, Yahoo, and AOL users in the same time period.
Defining seed data:Information captured from high volumes of monitored email accounts (seeds) controlled by senders to sample mailbox providers’ placement decisions irrespective of user-initiated or engagement-based filtering. For new programs with little or no history of subscriber interaction, seeds can provide an accurate assessment of inbox placement. Defining Consumer Network data:Information captured from monitored email accounts controlled by real subscribers to sample user-initiated and engagement based filtering decisions by mailbox providers. Consumer Network data can uncover behavior-based factors and thresholds that influence inbox placement at large mailbox providers and can’t be identified by non-interactive seeds.