Embed Size (px)
Citation preview
Draft Report …helping organizations make better decisions since 1982
Submitted to the City of Elgin, Illinois by: ETC Institute 725 W. Frontier Lane, Olathe, Kansas 66061
August 2017
‘17 2017 City of Elgin Community Survey

Contents
Executive Summary .............................................................................................. i
Section 1: Charts and Graphs .............................................................................. 1
Section 2: Benchmarking Analysis ..................................................................... 24
Section 3: Importance-Satisfaction Analysis ..................................................... 31
Section 4: Tabular Data ..................................................................................... 51
Section 5: Survey Instrument ............................................................................ 96
2017 City of Elgin Community Survey
ETC Institute (2017) i
Executive Su
mm
ary Rep
ort
2017 City of Elgin Community Survey
Executive Summary Report
Overview and Methodology
Overview. During June and July 2017, ETC Institute administered a citizen survey for the City of Elgin, Illinois. The purpose of the survey was to gather input from residents as part of the City’s ongoing effort to improve City services.
Methodology. A seven-page survey was mailed to a random sample of households throughout the City of Elgin. The mailed survey included a postage-paid return envelope and a cover letter. The cover letter explained the purpose of the survey, encouraged residents to return their surveys in the mail, and provided a link to an online survey for those who preferred to fill out the survey online (www.cityofelginsurvey.org). Approximately 14 days after the surveys were mailed, residents who received the survey were contacted by phone. Those who indicated that they had not returned the survey by mail or completed it online were given the option of completing it by phone.
The goal was to receive at least 500 completed surveys. This goal was exceeded, with a total of 577 households completing a survey. The results for the random sample of 577 households have a 95% level of confidence with a precision of at least +/- 4.1%. There were no statistically significant differences in the results of the survey based on the method of administration (mail, phone, online). To ensure that households throughout the City were well represented, ETC Institute geocoded the home address of respondents to the survey. The map below shows the physical distribution of survey respondents based on the locations of their homes (to be added). Interpretation of “Don’t Know” Responses. The percentage of “don’t know” responses has been excluded from many of the graphs in this report to assess satisfaction with residents who had used City services and to facilitate valid comparisons with other communities in the benchmarking analysis. Since the number of “don’t know” responses often reflects the utilization and awareness of City services, the percentage of “don’t know” responses has been included in the tabular data in Section 4 of this report. When the “don’t know” responses have been excluded, the text of this report will indicate that the responses have been excluded with the phrase “who had an opinion.”

2017 City of Elgin Community Survey
ETC Institute (2017) ii
Executive Su
mm
ary Rep
ort
This report contains the following:
a summary of the methodology for administering the survey and major findings
charts showing the overall results for the survey (Section 1)
benchmarking data that shows how the results for the City of Kewanee compare to other U.S. communities (Section 2)
Importance-Satisfaction analysis that identifies priorities for investment (Section 3)
tabular data showing the overall results for all questions on the survey (Section 4)
a copy of the cover letter and survey instrument (Section 5)
GIS maps that show the results of many survey questions on maps of the City (Appendix A – TO BE ADDED)
Major Findings
Perceptions of the City of Elgin
Seventy-six percent (76%) of the residents surveyed, who had an opinion, gave a rating of “excellent” or “good” (rating of 4 or 5 on a 5-point scale) with the City of Elgin as a place to live; 15% rated the City as “neutral” and 9% felt the City was “below average” or “poor” as a place to live.
Satisfaction With Major City Services
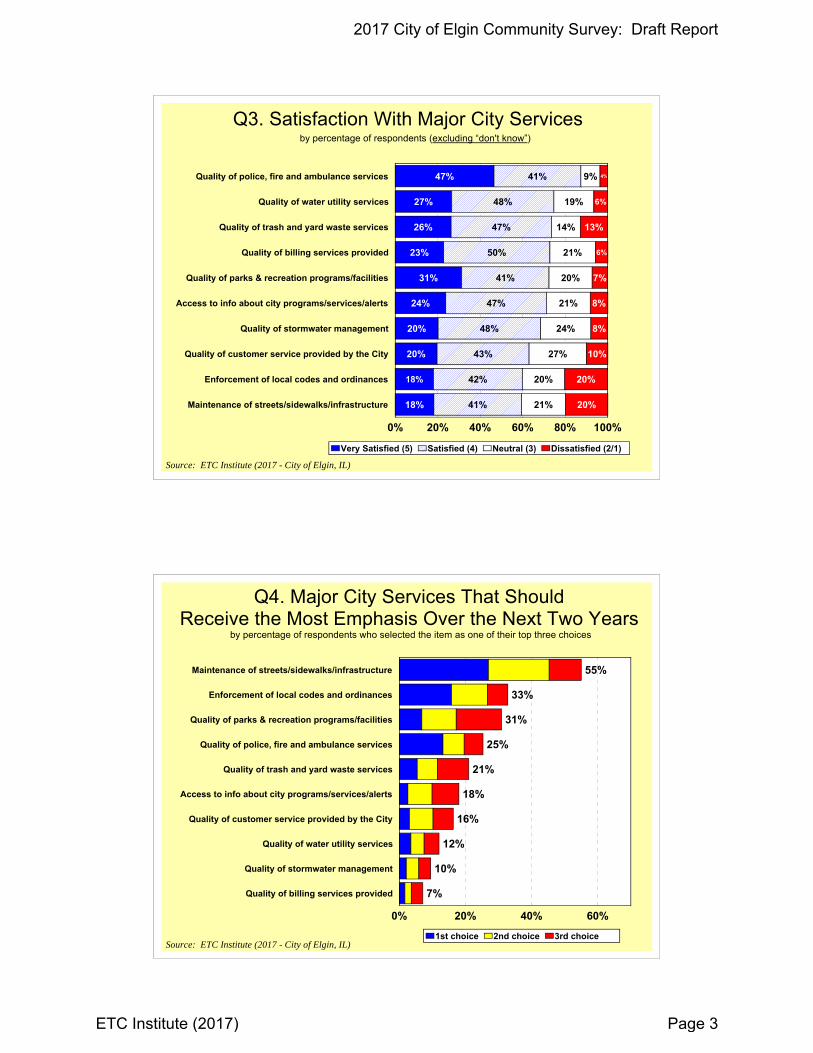
Eighty-eight percent (88%) of residents surveyed, who had an opinion, gave a rating of “very satisfied” or “satisfied” (rating of 4 or 5 on a 5-point scale) with the quality of police, fire and ambulance services. Other areas that received ratings of “very satisfied” or “satisfied” include: quality of water utility services (75%), quality of trash and yard waste services (73%), quality of billing services provided (73%), and quality of parks and recreation programs and facilities (72%). Residents were least satisfied with the maintenance of streets, sidewalks, and infrastructure (59%).
Based on the sum of their top three choices, the major City services that residents felt should receive the most emphasis from City leaders over the next two years were: (1) maintenance of streets, sidewalks, and infrastructure, (2) enforcement of local codes and ordinances, and (3) quality of parks and recreation programs and facilities.
Public Safety Services
The public safety services that residents, who had an opinion, were most satisfied with (rating of 4 or 5 on a 5-point scale) were: overall effectiveness of police protection (82%), overall professionalism of the police department (78%), and 911 call handling (77%). Residents were least satisfied with parking enforcement services (51%).
2017 City of Elgin Community Survey
ETC Institute (2017) iii
Executive Su
mm
ary Rep
ort
Based on the sum of their top three choices, the public safety services that residents felt should receive the most emphasis from City leaders over the next two years were: (1) visibility of police in neighborhoods, (2) police efforts to prevent crime, and (3) overall effectiveness of police protection.
Fire and Emergency Medical Services
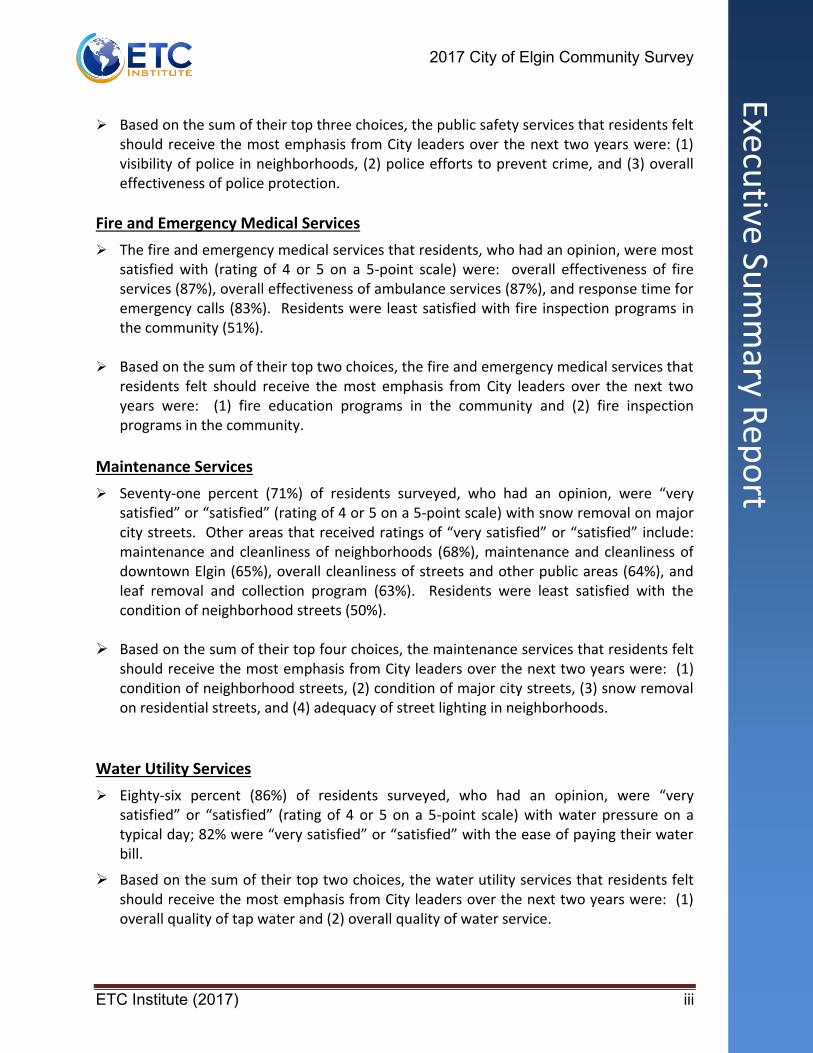
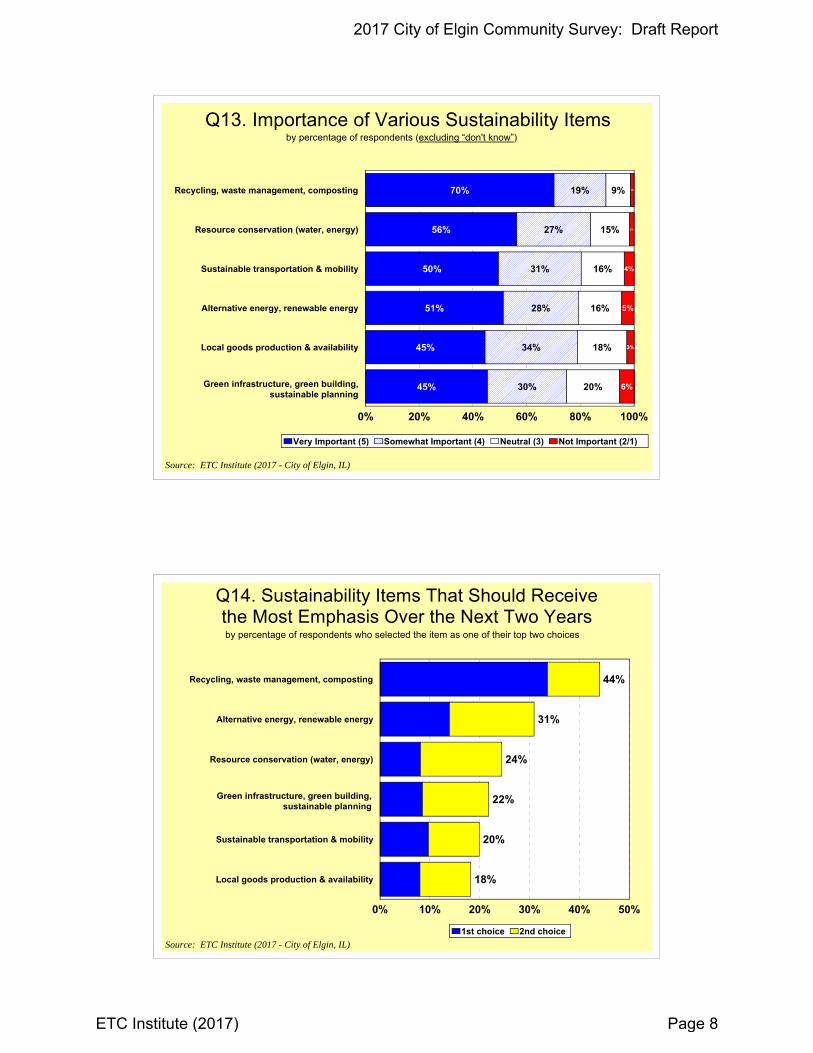
The fire and emergency medical services that residents, who had an opinion, were most satisfied with (rating of 4 or 5 on a 5-point scale) were: overall effectiveness of fire services (87%), overall effectiveness of ambulance services (87%), and response time for emergency calls (83%). Residents were least satisfied with fire inspection programs in the community (51%).
Based on the sum of their top two choices, the fire and emergency medical services that residents felt should receive the most emphasis from City leaders over the next two years were: (1) fire education programs in the community and (2) fire inspection programs in the community.
Maintenance Services
Seventy-one percent (71%) of residents surveyed, who had an opinion, were “very satisfied” or “satisfied” (rating of 4 or 5 on a 5-point scale) with snow removal on major city streets. Other areas that received ratings of “very satisfied” or “satisfied” include: maintenance and cleanliness of neighborhoods (68%), maintenance and cleanliness of downtown Elgin (65%), overall cleanliness of streets and other public areas (64%), and leaf removal and collection program (63%). Residents were least satisfied with the condition of neighborhood streets (50%).
Based on the sum of their top four choices, the maintenance services that residents felt should receive the most emphasis from City leaders over the next two years were: (1) condition of neighborhood streets, (2) condition of major city streets, (3) snow removal on residential streets, and (4) adequacy of street lighting in neighborhoods.
Water Utility Services
Eighty-six percent (86%) of residents surveyed, who had an opinion, were “very satisfied” or “satisfied” (rating of 4 or 5 on a 5-point scale) with water pressure on a typical day; 82% were “very satisfied” or “satisfied” with the ease of paying their water bill.
Based on the sum of their top two choices, the water utility services that residents felt should receive the most emphasis from City leaders over the next two years were: (1) overall quality of tap water and (2) overall quality of water service.

2017 City of Elgin Community Survey
ETC Institute (2017) iv
Executive Su
mm
ary Rep
ort
Parks and Recreation Services
Residents were asked to rate their satisfaction with three different aspects of parks and recreation services: parks, recreation, and communication. With regard to parks, 74% of residents surveyed, who had an opinion, were “very satisfied” or “satisfied” (rating of 4 or 5 on a 5-point scale) with the maintenance of parks. In the recreation category, 79% were “very satisfied” or “satisfied” with the maintenance and appearance of The Centre, and in the communication category, 62% were “very satisfied” or “satisfied” with the quality of customer service from Parks and Recreation employees.
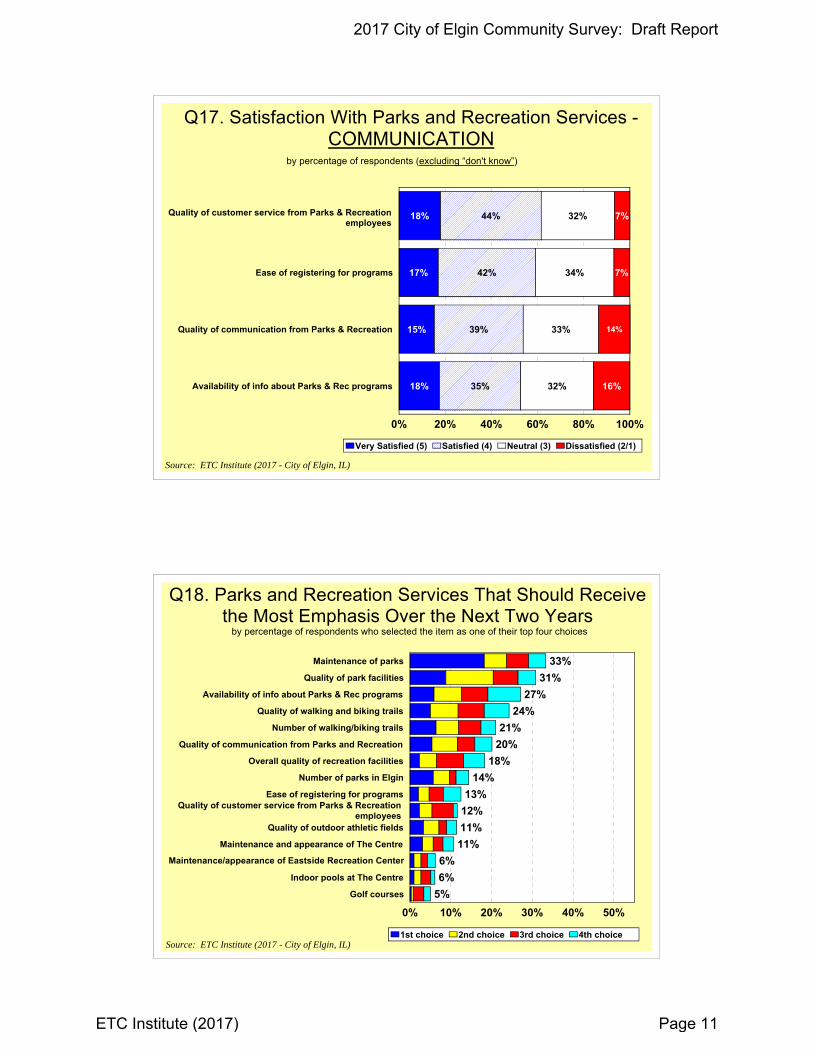
Based on the sum of their top four choices, the parks and recreation services that residents felt should receive the most emphasis from City leaders over the next two years were: (1) maintenance of parks, (2) quality of parks facilities, (3) availability of information about Parks and Recreation programs, and (4) quality of walking and biking trails.
Code Enforcement Services
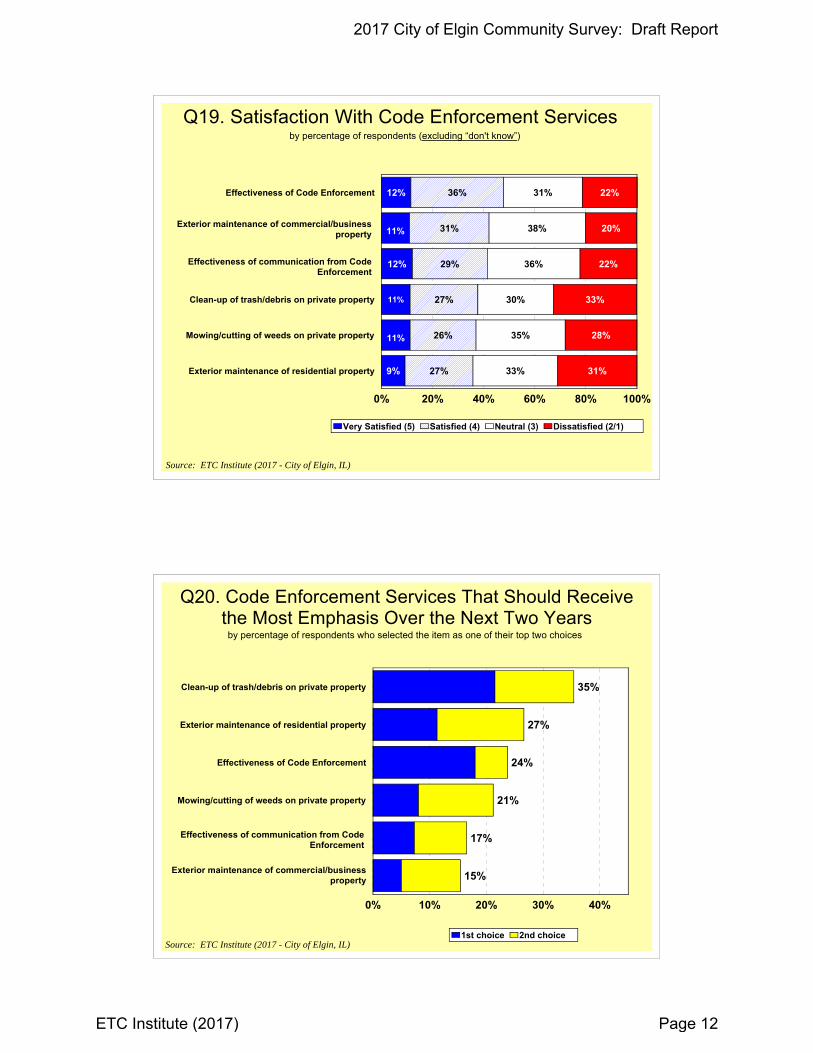
Forty-eight percent (48%) of residents surveyed, who had an opinion, were “very satisfied” or “satisfied” (rating of 4 or 5 on a 5-point scale) with the effectiveness of Code Enforcement; 42% were “very satisfied” or “satisfied” with the exterior maintenance of commercial/business property.
Based on the sum of their top two choices, the code enforcement services that residents felt should receive the most emphasis from City leaders over the next two years were: (1) clean-up of trash and debris on private property and (2) exterior maintenance of residential property.
Community Development Services
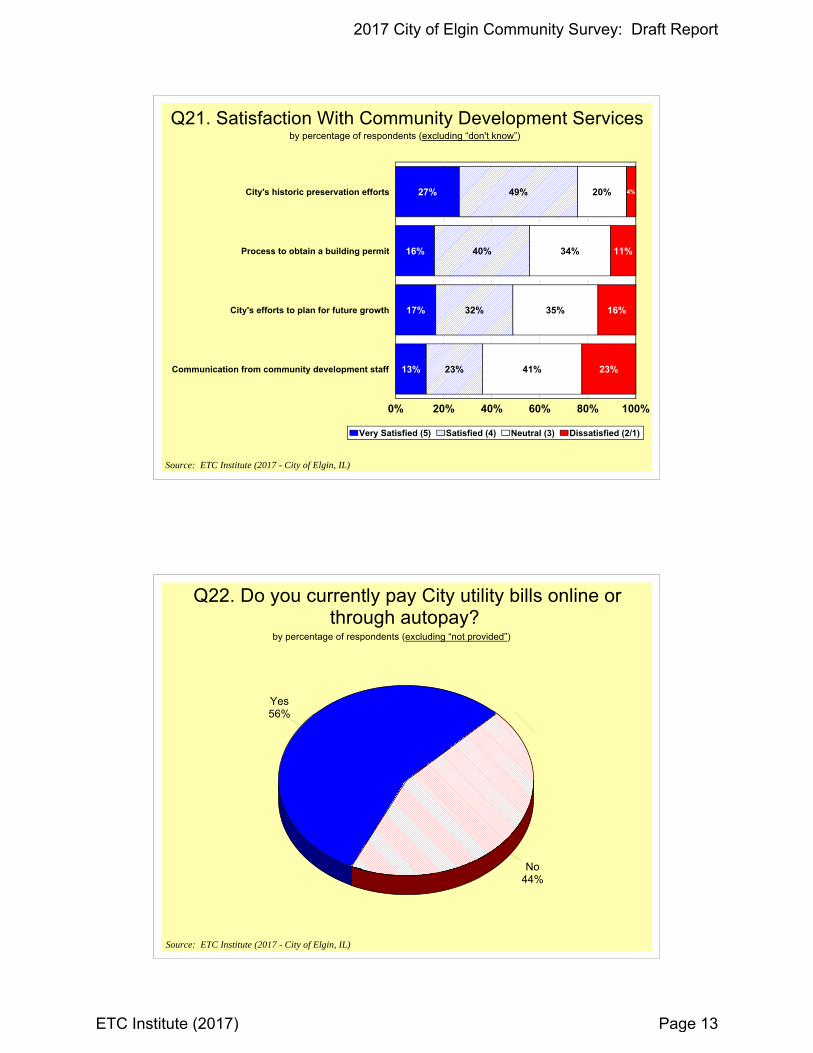
Seventy-six percent (76%) of residents surveyed, who had an opinion, were “very satisfied” or “satisfied” (rating of 4 or 5 on a 5-point scale) with the City’s historic preservation efforts; 20% were “neutral” and 4% were “dissatisfied.” Residents were least satisfied with communication from community development staff (36%).
Public Information and Engagement
Fifty-four percent (54%) of residents surveyed, who had an opinion, were “very satisfied” or “satisfied” (rating of 4 or 5 on a 5-point scale) with the availability of public information from the City; 31% were “neutral” and 15 were “dissatisfied.”
Two-thirds (66%) of residents indicated they used the City of Elgin website to gather information about the City; 55% used word of mouth, and 45% used local newspapers.
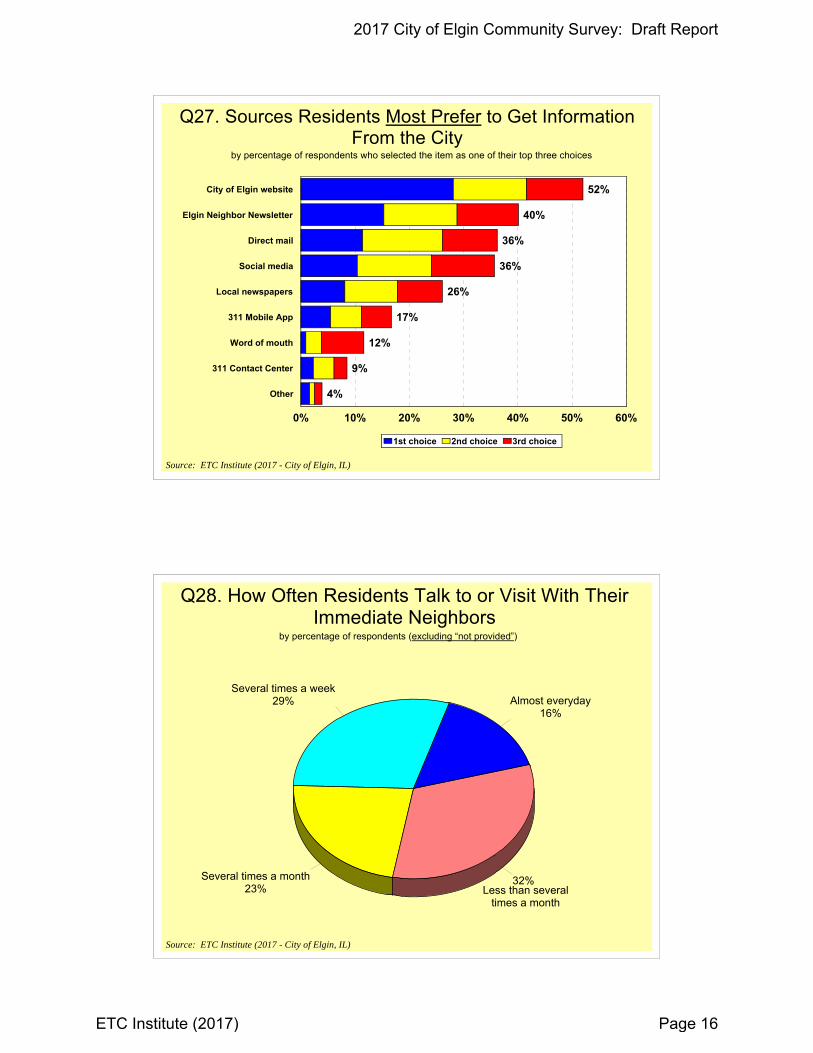
Based on the sum of their top three choices, the sources residents most prefer to get information from the city are: (1) City of Elgin website, (2) Elgin Neighbor Newsletter, and (3) direct mail.

2017 City of Elgin Community Survey
ETC Institute (2017) v
Executive Su
mm
ary Rep
ort
Other Findings Nearly three-fourths (71%) of residents who had an opinion indicated they would be
“very likely” or “likely” to remain in Elgin for the next five years; 61% would be “very likely” or “likely” to recommend living in Elgin.
Most residents (88%) who had an opinion felt “very safe” or “safe” in their neighborhood during the day; 74% felt “very safe” or “safe” in Downtown Elgin during the day, and 73% felt “very safe” or “safe” in their neighborhood at night.
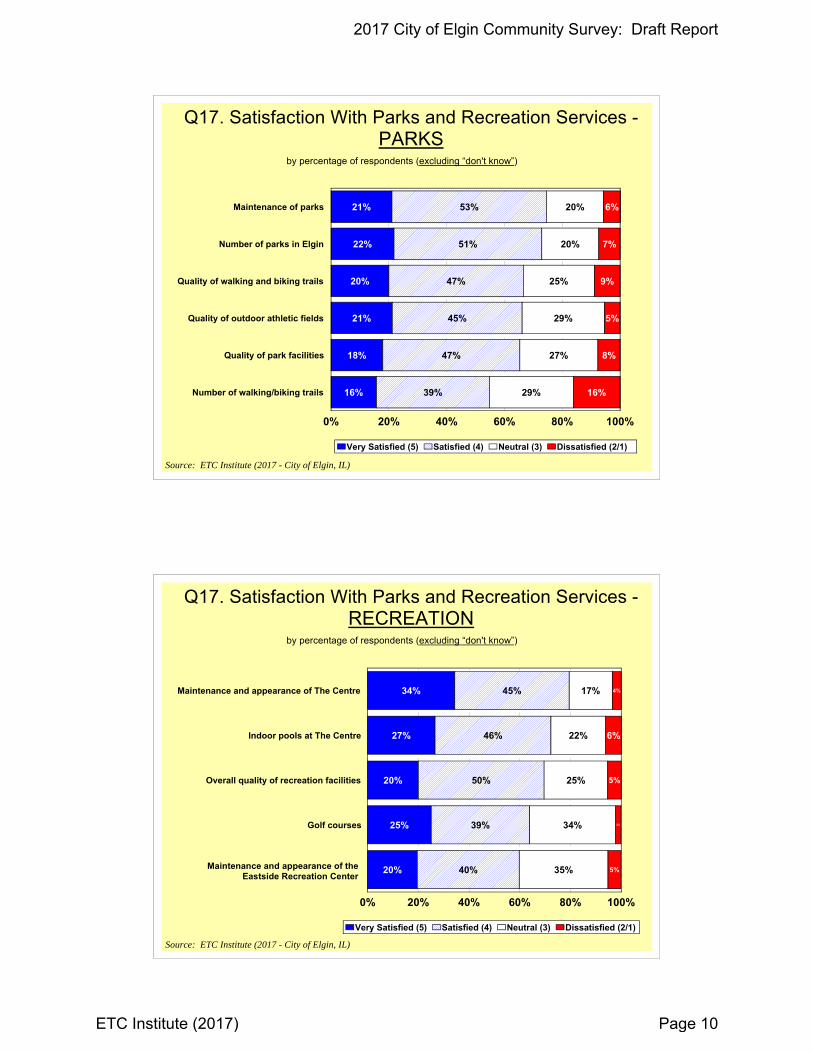
Eighty-nine percent (89%) of residents who had an opinion indicated that recycling, waste management, and composting were “very important” or “somewhat important” sustainability items; 83% thought resource conservation (water, energy) were “very important” or “somewhat important,” and 81% felt that sustainable transportation and mobility were “very important” or “somewhat important.” Based on the sum of their top two choices, the sustainability items residents thought should receive the most emphasis over the next two years were: (1) recycling, waste management, and composting and (2) alternative and renewable energy.
More than half (56%) of residents who had an opinion indicated they currently pay City
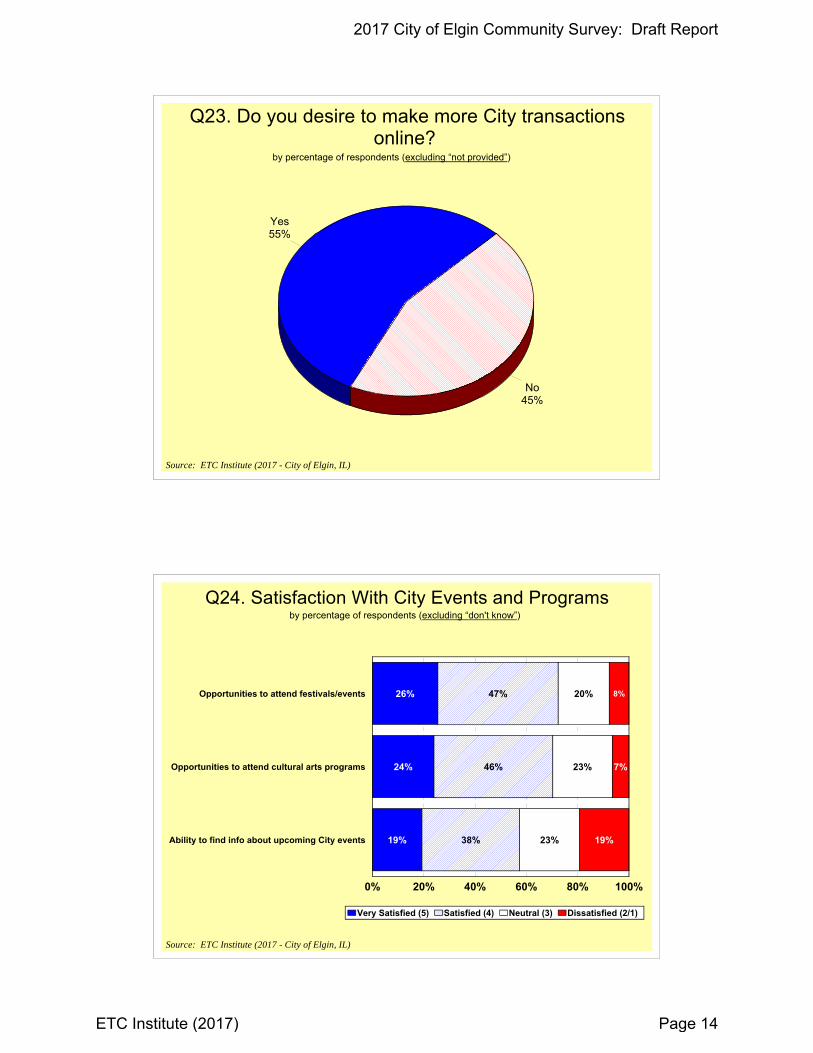
utility bills online or through autopay. Fifty-five percent (55%) who had an opinion indicated a desire to make more City transactions online.
Sixteen percent (16%) of residents who had an opinion indicated they talk to or visit with their immediate neighbors almost everyday; 29% visit with their neighbors several times a week, 23% do so several times a month, and 32% visit with their neighbors less than several times a month.
More than three-fourths (76%) of residents who had an opinion indicated they are satisfied with the process to report non-emergency problems, such as potholes, to the City. When asked what their preferred method is for reporting problems to the City, more than half (51%) who had an opinion indicated they prefer a phone call; 15% prefer using a mobile application, 14% prefer the City website, 12% email, 6% prefer to report problems in-person to a City staff member, and 2% through social media.
Fifty-five percent (55%) of residents would most likely use the City of Elgin website to find employment opportunities in the Elgin area; 53% would use online employment search engines (e.g. Indeed, CareerBuilder, etc.), and 39% would use referrals from friends or family.

2017 City of Elgin Community Survey
ETC Institute (2017) vi
Executive Su
mm
ary Rep
ort
Sixty-nine percent (69%) of residents who had an opinion indicated they had visited Downtown Elgin to eat at a restaurant in the last 12 months; 60% had visited Downtown to attend a special event, 45% had visited to do business or had an appointment, 39% had visited to attend a cultural/visual/performing arts program, and 50% of residents had visited Downtown Elgin to recreate along the Fox River or Walton Island in the last 12 months.

2017 City of Elgin Community Survey
ETC Institute (2017) vii
Executive Su
mm
ary Rep
ort
How the City of Elgin Compares to Other Communities Nationally
Satisfaction ratings for the City of Elgin rated above the U.S. average in 45 of the 57 areas that were assessed. The City of Elgin rated significantly higher than the U.S. average (difference of 5% or more) in 33 of these areas. Listed below are the services in which the City of Elgin rated above U.S. average:

2017 City of Elgin Community Survey
ETC Institute (2017) viii
Executive Su
mm
ary Rep
ort
How the City of Elgin Compares to Other Communities Regionally
Satisfaction ratings for the City of Elgin rated above the Great Lakes regional average in 39 of the 57 areas that were assessed. The City of Elgin rated significantly higher than the Great Lakes regional average (difference of 5% or more) in 30 of these areas. Listed below are the services in which the City of Elgin rated above the Great Lakes regional average:

2017 City of Elgin Community Survey
ETC Institute (2017) ix
Executive Su
mm
ary Rep
ort
Investment Priorities
In order to help the City identify opportunities for improvement, ETC Institute conducted an Importance-Satisfaction (I-S) Priorities Analysis. This analysis examined the importance that residents placed on each City service and the level of satisfaction with each service. By identifying services of high importance and low satisfaction, the analysis identified which services will have the most impact on overall satisfaction with City services over the next two years. If the City wants to improve its overall satisfaction rating, the City should prioritize improvements in services with the highest Importance Satisfaction (I-S) ratings. Details regarding the methodology for the analysis are provided in Section 3 of this report.
Based on the results of the Importance-Satisfaction (I-S) Priorities Analysis, ETC Institute recommends the following:
Overall Priorities for the City by Major Service Category. The first level of analysis reviewed the importance of and satisfaction with major categories of City services. This analysis was conducted to help set the overall priorities for the City. Based on the results of this analysis, the major services that are recommended as the top two opportunities for improvement over the next two years in order to raise the City’s overall satisfaction rating are listed below in descending order of the Importance-Satisfaction rating:
Maintenance of streets/sidewalks/infrastructure Enforcement of local codes and ordinances
Priorities within Departments/Specific Areas. The second level of analysis reviewed the importance of and satisfaction of services within departments and specific service areas. This analysis was conducted to help departmental managers set priorities for their department. Based on the results of this analysis, the services that are recommended as the top priorities within each department over the next two years are listed below:
Police and Public Safety: visibility of police in neighborhoods and police
efforts to prevent crime.
Fire and Emergency Medical Services: fire education programs in your community and fire inspection programs in your community.
Maintenance Services: condition of neighborhood streets, condition of major
city streets, and removal of snow on residential streets.
Sustainability: no high priorities identified.
Water Utility Services: overall quality of your tap water.
2017 City of Elgin Community Survey
ETC Institute (2017) x
Executive Su
mm
ary Rep
ort
Parks and Recreation: availability of information about parks and recreation programs and quality of park facilities.
Code Enforcement: clean-up of trash/debris on private property and exterior maintenance of residential property.

Section 1:
Charts and Graphs
2017 City of Elgin Community Survey: Draft Report
ETC Institute (2017) Page 1

17%
23%
18%
13%
16%
13%
13%
11%
12%
59%
41%
40%
44%
39%
36%
35%
30%
25%
15%
21%
27%
24%
30%
31%
31%
35%
26%
9%
15%
15%
20%
15%
19%
22%
24%
37%
As a place to live
As a place you are proud to call home
As a City moving in the right direction
As a place to raise children
As a place to work
As a place for recreation
As a place to visit
As a place for single adults (age 18-35)
As a place to retire
0% 20% 40% 60% 80% 100%
Excellent (5) Good (4) Neutral (3) Below Average/Poor (2/1)
Q1. Perceptions of the City of Elginby percentage of respondents (excluding “don't know”)
Source: ETC Institute (2017 - City of Elgin, IL)
Q2. Likelihood of Doing the Following:
39%
19%
18%
19%
32%
42%
36%
34%
11%
21%
27%
30%
17%
19%
19%
17%
Remain in Elgin for the next five years
Recommend living in Elgin to someone who asks
Recommend visiting Elgin
Recommend doing business in Elgin
0% 20% 40% 60% 80% 100%
Very Likely (5) Likely (4) Neutral (3) Unlikely (2/1)
by percentage of respondents (excluding “don't know”)
Source: ETC Institute (2017 - City of Elgin, IL)
2017 City of Elgin Community Survey: Draft Report
ETC Institute (2017) Page 2
47%
27%
26%
23%
31%
24%
20%
20%
18%
18%
41%
48%
47%
50%
41%
47%
48%
43%
42%
41%
9%
19%
14%
21%
20%
21%
24%
27%
20%
21%
4%
6%
13%
6%
7%
8%
8%
10%
20%
20%
Quality of police, fire and ambulance services
Quality of water utility services
Quality of trash and yard waste services
Quality of billing services provided
Quality of parks & recreation programs/facilities
Access to info about city programs/services/alerts
Quality of stormwater management
Quality of customer service provided by the City
Enforcement of local codes and ordinances
Maintenance of streets/sidewalks/infrastructure
0% 20% 40% 60% 80% 100%
Very Satisfied (5) Satisfied (4) Neutral (3) Dissatisfied (2/1)
Q3. Satisfaction With Major City Services
Source: ETC Institute (2017 - City of Elgin, IL)
by percentage of respondents (excluding “don't know”)
55%
33%
31%
25%
21%
18%
16%
12%
10%
7%
Maintenance of streets/sidewalks/infrastructure
Enforcement of local codes and ordinances
Quality of parks & recreation programs/facilities
Quality of police, fire and ambulance services
Quality of trash and yard waste services
Access to info about city programs/services/alerts
Quality of customer service provided by the City
Quality of water utility services
Quality of stormwater management
Quality of billing services provided
0% 20% 40% 60%
1st choice 2nd choice 3rd choice
Q4. Major City Services That Should Receive the Most Emphasis Over the Next Two Years
by percentage of respondents who selected the item as one of their top three choices
Source: ETC Institute (2017 - City of Elgin, IL)
2017 City of Elgin Community Survey: Draft Report
ETC Institute (2017) Page 3

49%
32%
27%
15%
12%
9%
39%
42%
46%
39%
28%
28%
9%
20%
17%
34%
38%
34%
3%
6%
10%
12%
22%
29%
In your neighborhood during the day
In Downtown Elgin during the day
In your neighborhood at night
In public parks
In City parking garages
In Downtown Elgin at night
0% 20% 40% 60% 80% 100%
Very Safe (5) Safe (4) Neutral (3) Unsafe (2/1)
Q5. Feeling of Safety in Various Situations
Source: ETC Institute (2017 - City of Elgin, IL)
by percentage of respondents (excluding “don't know”)
33%
35%
36%
34%
25%
25%
22%
18%
16%
49%
43%
41%
42%
46%
42%
40%
38%
35%
15%
16%
20%
19%
23%
25%
24%
34%
34%
4%
6%
3%
5%
6%
9%
14%
10%
16%
Overall effectiveness of police protection
Overall professionalism of the police department
911 call handling
Response time for emergency calls
Visibility of police in the city
Police efforts to prevent crime
Visibility of police in neighborhoods
Parking enforcement services
0% 20% 40% 60% 80% 100%
Very Satisfied (5) Satisfied (4) Neutral (3) Dissatisfied (2/1)
Q6. Satisfaction With Public Safety Servicesby percentage of respondents (excluding “don't know”)
Source: ETC Institute (2017 - City of Elgin, IL)
Availability of info about police programs/activities
2017 City of Elgin Community Survey: Draft Report
ETC Institute (2017) Page 4
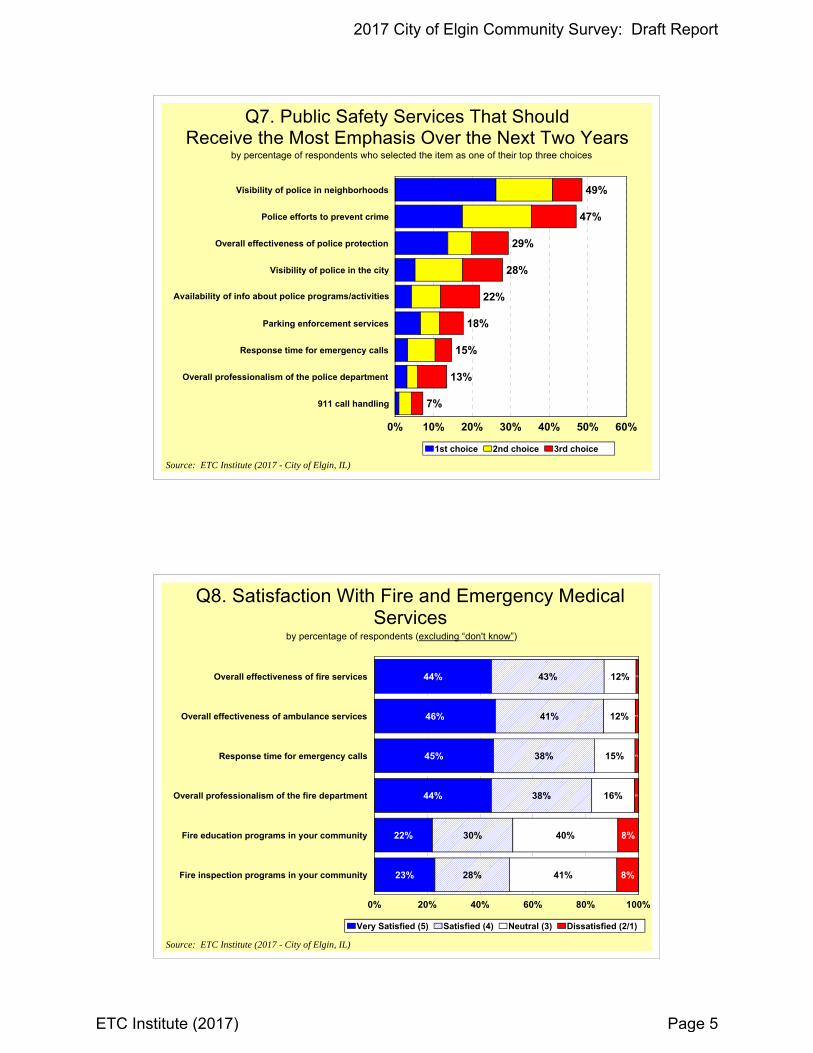
49%
47%
29%
28%
22%
18%
15%
13%
7%
Visibility of police in neighborhoods
Police efforts to prevent crime
Overall effectiveness of police protection
Visibility of police in the city
Parking enforcement services
Response time for emergency calls
Overall professionalism of the police department
911 call handling
0% 10% 20% 30% 40% 50% 60%
1st choice 2nd choice 3rd choice
Q7. Public Safety Services That Should Receive the Most Emphasis Over the Next Two Years
by percentage of respondents who selected the item as one of their top three choices
Source: ETC Institute (2017 - City of Elgin, IL)
Availability of info about police programs/activities
44%
46%
45%
44%
22%
23%
43%
41%
38%
38%
30%
28%
12%
12%
15%
16%
40%
41%
1%
1%
1%
2%
8%
8%
Overall effectiveness of fire services
Overall effectiveness of ambulance services
Response time for emergency calls
Overall professionalism of the fire department
Fire education programs in your community
Fire inspection programs in your community
0% 20% 40% 60% 80% 100%
Very Satisfied (5) Satisfied (4) Neutral (3) Dissatisfied (2/1)
Q8. Satisfaction With Fire and Emergency Medical Services
by percentage of respondents (excluding “don't know”)
Source: ETC Institute (2017 - City of Elgin, IL)
2017 City of Elgin Community Survey: Draft Report
ETC Institute (2017) Page 5

36%
34%
21%
19%
19%
5%
Fire education programs in your community
Fire inspection programs in your community
Overall effectiveness of fire services
Overall effectiveness of ambulance services
Response time for emergency calls
Overall professionalism of the fire department
0% 10% 20% 30% 40%
1st choice 2nd choice
Q9. Fire and Emergency Medical Services That Should Receive the Most Emphasis Over the Next Two Years
by percentage of respondents who selected the item as one of their top two choices
Source: ETC Institute (2017 - City of Elgin, IL)
22%
20%
19%
15%
22%
13%
11%
19%
15%
11%
17%
11%
14%
9%
49%
48%
46%
49%
41%
49%
49%
40%
44%
47%
41%
46%
38%
41%
18%
20%
28%
25%
21%
24%
24%
21%
26%
24%
21%
28%
33%
24%
11%
12%
8%
10%
16%
14%
16%
20%
15%
18%
21%
15%
14%
27%
Snow removal on major city streets
Maintenance and cleanliness of your neighborhood
Maintenance and cleanliness of downtown Elgin
Overall cleanliness of streets/other public areas
Leaf removal or collection program
Maintenance of street signs, pavements & markings
Condition of city sidewalks and bikeways
Adequacy of street lighting in your neighborhood
Mowing/tree trimming along streets/public areas
Condition of major city streets
Snow removal on residential streets
Condition of street drainage/water drainage
On-street bicycle infrastructure
Condition of neighborhood streets
0% 20% 40% 60% 80% 100%
Very Satisfied (5) Satisfied (4) Neutral (3) Dissatisfied (2/1)
Q10. Satisfaction With Maintenance Services
Source: ETC Institute (2017 - City of Elgin, IL)
by percentage of respondents (excluding “don't know”)
2017 City of Elgin Community Survey: Draft Report
ETC Institute (2017) Page 6

45%
34%
31%
25%
25%
21%
20%
18%
18%
16%
16%
14%
13%
12%
Condition of neighborhood streets
Condition of major city streets
Snow removal on residential streets
Adequacy of street lighting in your neighborhood
Condition of street drainage/water drainage
Condition of city sidewalks and bikeways
Overall cleanliness of streets/other public areas
Maintenance and cleanliness of your neighborhood
Maintenance and cleanliness of downtown Elgin
Snow removal on major city streets
Leaf removal or collection program
Mowing/tree trimming along streets/public areas
Maintenance of street signs, pavements & markings
On-street bicycle infrastructure
0% 10% 20% 30% 40% 50%
1st choice 2nd choice 3rd choice 4th choice
Q11. Maintenance Services That Should Receive the Most Emphasis Over the Next Two Years
by percentage of respondents who selected the item as one of their top four choices
Source: ETC Institute (2017 - City of Elgin, IL)
Q12. Is parking an issue in your neighborhood?
Yes30%
No70%
by percentage of respondents (excluding “not provided”)
Source: ETC Institute (2017 - City of Elgin, IL)
2017 City of Elgin Community Survey: Draft Report
ETC Institute (2017) Page 7
70%
56%
50%
51%
45%
45%
19%
27%
31%
28%
34%
30%
9%
15%
16%
16%
18%
20%
1%
2%
4%
5%
3%
6%
Recycling, waste management, composting
Resource conservation (water, energy)
Sustainable transportation & mobility
Alternative energy, renewable energy
Local goods production & availability
0% 20% 40% 60% 80% 100%
Very Important (5) Somewhat Important (4) Neutral (3) Not Important (2/1)
Q13. Importance of Various Sustainability Items
Source: ETC Institute (2017 - City of Elgin, IL)
by percentage of respondents (excluding “don't know”)
Green infrastructure, green building, sustainable planning
44%
31%
24%
22%
20%
18%
Recycling, waste management, composting
Alternative energy, renewable energy
Resource conservation (water, energy)
Sustainable transportation & mobility
Local goods production & availability
0% 10% 20% 30% 40% 50%
1st choice 2nd choice
Q14. Sustainability Items That Should Receive the Most Emphasis Over the Next Two Yearsby percentage of respondents who selected the item as one of their top two choices
Source: ETC Institute (2017 - City of Elgin, IL)
Green infrastructure, green building, sustainable planning
2017 City of Elgin Community Survey: Draft Report
ETC Institute (2017) Page 8

45%
42%
36%
31%
41%
40%
43%
37%
7%
12%
15%
19%
7%
6%
6%
13%
Water pressure on a typical day
Ease of paying water bill
Overall quality of water service
Overall quality of your tap water
0% 20% 40% 60% 80% 100%
Very Satisfied (5) Satisfied (4) Neutral (3) Dissatisfied (1/2)
Q15. Satisfaction With Water Utility Servicesby percentage of respondents (excluding “don't know”)
Source: ETC Institute (2017 - City of Elgin, IL)
64%
39%
21%
14%
Overall quality of your tap water
Overall quality of water service
Water pressure on a typical day
Ease of paying water bill
0% 20% 40% 60%
1st choice 2nd choice
Q16. Water Utility Services That Should Receive the Most Emphasis Over the Next Two Years
by percentage of respondents who selected the item as one of their top two choices
Source: ETC Institute (2017 - City of Elgin, IL)
2017 City of Elgin Community Survey: Draft Report
ETC Institute (2017) Page 9
21%
22%
20%
21%
18%
16%
53%
51%
47%
45%
47%
39%
20%
20%
25%
29%
27%
29%
6%
7%
9%
5%
8%
16%
Maintenance of parks
Number of parks in Elgin
Quality of walking and biking trails
Quality of outdoor athletic fields
Quality of park facilities
Number of walking/biking trails
0% 20% 40% 60% 80% 100%
Very Satisfied (5) Satisfied (4) Neutral (3) Dissatisfied (2/1)
Q17. Satisfaction With Parks and Recreation Services - PARKS
by percentage of respondents (excluding “don't know”)
Source: ETC Institute (2017 - City of Elgin, IL)
34%
27%
20%
25%
20%
45%
46%
50%
39%
40%
17%
22%
25%
34%
35%
4%
6%
5%
2%
5%
Maintenance and appearance of The Centre
Indoor pools at The Centre
Overall quality of recreation facilities
Golf courses
0% 20% 40% 60% 80% 100%
Very Satisfied (5) Satisfied (4) Neutral (3) Dissatisfied (2/1)
Q17. Satisfaction With Parks and Recreation Services - RECREATION
by percentage of respondents (excluding “don't know”)
Source: ETC Institute (2017 - City of Elgin, IL)
Maintenance and appearance of the Eastside Recreation Center
2017 City of Elgin Community Survey: Draft Report
ETC Institute (2017) Page 10
18%
17%
15%
18%
44%
42%
39%
35%
32%
34%
33%
32%
7%
7%
14%
16%
Ease of registering for programs
Quality of communication from Parks & Recreation
Availability of info about Parks & Rec programs
0% 20% 40% 60% 80% 100%
Very Satisfied (5) Satisfied (4) Neutral (3) Dissatisfied (2/1)
Q17. Satisfaction With Parks and Recreation Services - COMMUNICATION
by percentage of respondents (excluding “don't know”)
Source: ETC Institute (2017 - City of Elgin, IL)
Quality of customer service from Parks & Recreationemployees
33%
31%
27%
24%
21%
20%
18%
14%
13%
12%
11%
11%
6%
6%
5%
Maintenance of parks
Quality of park facilities
Availability of info about Parks & Rec programs
Quality of walking and biking trails
Number of walking/biking trails
Quality of communication from Parks and Recreation
Overall quality of recreation facilities
Number of parks in Elgin
Ease of registering for programs
Quality of outdoor athletic fields
Maintenance and appearance of The Centre
Indoor pools at The Centre
Golf courses
0% 10% 20% 30% 40% 50%
1st choice 2nd choice 3rd choice 4th choice
Q18. Parks and Recreation Services That Should Receive the Most Emphasis Over the Next Two Years
by percentage of respondents who selected the item as one of their top four choices
Source: ETC Institute (2017 - City of Elgin, IL)
Quality of customer service from Parks & Recreationemployees
Maintenance/appearance of Eastside Recreation Center
2017 City of Elgin Community Survey: Draft Report
ETC Institute (2017) Page 11
12%
11%
12%
11%
11%
9%
36%
31%
29%
27%
26%
27%
31%
38%
36%
30%
35%
33%
22%
20%
22%
33%
28%
31%
Effectiveness of Code Enforcement
Clean-up of trash/debris on private property
Mowing/cutting of weeds on private property
Exterior maintenance of residential property
0% 20% 40% 60% 80% 100%
Very Satisfied (5) Satisfied (4) Neutral (3) Dissatisfied (2/1)
Q19. Satisfaction With Code Enforcement Servicesby percentage of respondents (excluding “don't know”)
Source: ETC Institute (2017 - City of Elgin, IL)
Effectiveness of communication from Code Enforcement
Exterior maintenance of commercial/business property
35%
27%
24%
21%
17%
15%
Clean-up of trash/debris on private property
Exterior maintenance of residential property
Effectiveness of Code Enforcement
Mowing/cutting of weeds on private property
0% 10% 20% 30% 40%
1st choice 2nd choice
Q20. Code Enforcement Services That Should Receive the Most Emphasis Over the Next Two Years
by percentage of respondents who selected the item as one of their top two choices
Source: ETC Institute (2017 - City of Elgin, IL)
Effectiveness of communication from Code Enforcement
Exterior maintenance of commercial/business property
2017 City of Elgin Community Survey: Draft Report
ETC Institute (2017) Page 12
27%
16%
17%
13%
49%
40%
32%
23%
20%
34%
35%
41%
4%
11%
16%
23%
City's historic preservation efforts
Process to obtain a building permit
City's efforts to plan for future growth
Communication from community development staff
0% 20% 40% 60% 80% 100%
Very Satisfied (5) Satisfied (4) Neutral (3) Dissatisfied (2/1)
Q21. Satisfaction With Community Development Servicesby percentage of respondents (excluding “don't know”)
Source: ETC Institute (2017 - City of Elgin, IL)
Q22. Do you currently pay City utility bills online or through autopay?
Yes56%
No44%
by percentage of respondents (excluding “not provided”)
Source: ETC Institute (2017 - City of Elgin, IL)
2017 City of Elgin Community Survey: Draft Report
ETC Institute (2017) Page 13
Q23. Do you desire to make more City transactions online?
Yes55%
No45%
by percentage of respondents (excluding “not provided”)
Source: ETC Institute (2017 - City of Elgin, IL)
26%
24%
19%
47%
46%
38%
20%
23%
23%
8%
7%
19%
Opportunities to attend festivals/events
Opportunities to attend cultural arts programs
Ability to find info about upcoming City events
0% 20% 40% 60% 80% 100%
Very Satisfied (5) Satisfied (4) Neutral (3) Dissatisfied (2/1)
Q24. Satisfaction With City Events and Programsby percentage of respondents (excluding “don't know”)
Source: ETC Institute (2017 - City of Elgin, IL)
2017 City of Elgin Community Survey: Draft Report
ETC Institute (2017) Page 14

15%
16%
13%
15%
39%
37%
30%
28%
31%
33%
43%
36%
15%
14%
13%
21%
Availability of public information
Accessibility of public information
Your ability to volunteer/serve
Your ability to provide feedback to City
0% 20% 40% 60% 80% 100%
Very Satisfied (5) Satisfied (4) Neutral (3) Dissatisfied (2/1)
Q25. Satisfaction With Public Information and Engagementby percentage of respondents (excluding “don't know”)
Source: ETC Institute (2017 - City of Elgin, IL)
66%
55%
45%
43%
42%
37%
15%
14%
5%
City of Elgin website
Word of mouth
Local newspapers
Social media
Elgin Neighbor Newsletter
Direct mail
311 Mobile App
311 Contact Center
Other
0% 20% 40% 60%
Q26. Sources Used to Gather Information About the City of Elgin
by percentage of respondents (multiple selections could be made)
Source: ETC Institute (2017 - City of Elgin, IL)
2017 City of Elgin Community Survey: Draft Report
ETC Institute (2017) Page 15
52%
40%
36%
36%
26%
17%
12%
9%
4%
City of Elgin website
Elgin Neighbor Newsletter
Direct mail
Social media
Local newspapers
311 Mobile App
Word of mouth
311 Contact Center
Other
0% 10% 20% 30% 40% 50% 60%
1st choice 2nd choice 3rd choice
Q27. Sources Residents Most Prefer to Get Information From the City
by percentage of respondents who selected the item as one of their top three choices
Source: ETC Institute (2017 - City of Elgin, IL)
Almost everyday16%
Several times a week29%
Several times a month23%
32%
Q28. How Often Residents Talk to or Visit With Their Immediate Neighbors
by percentage of respondents (excluding “not provided”)
Source: ETC Institute (2017 - City of Elgin, IL)
Less than several times a month
2017 City of Elgin Community Survey: Draft Report
ETC Institute (2017) Page 16

Q29. Are you satisfied with the process to report non-emergency problems (e.g. potholes) to the City?
Yes76%
No24%
by percentage of respondents (excluding “don’t know”)
Source: ETC Institute (2017 - City of Elgin, IL)
Q30. Most Preferred Method for Reporting Problems to the City
Source: ETC Institute (2017 - City of Elgin, IL)
Mobile application15%
Website14%Email
12%
Social media2%
Phone call51%
6%
In person to City staff member
by percentage of respondents (excluding “not provided”)
2017 City of Elgin Community Survey: Draft Report
ETC Institute (2017) Page 17
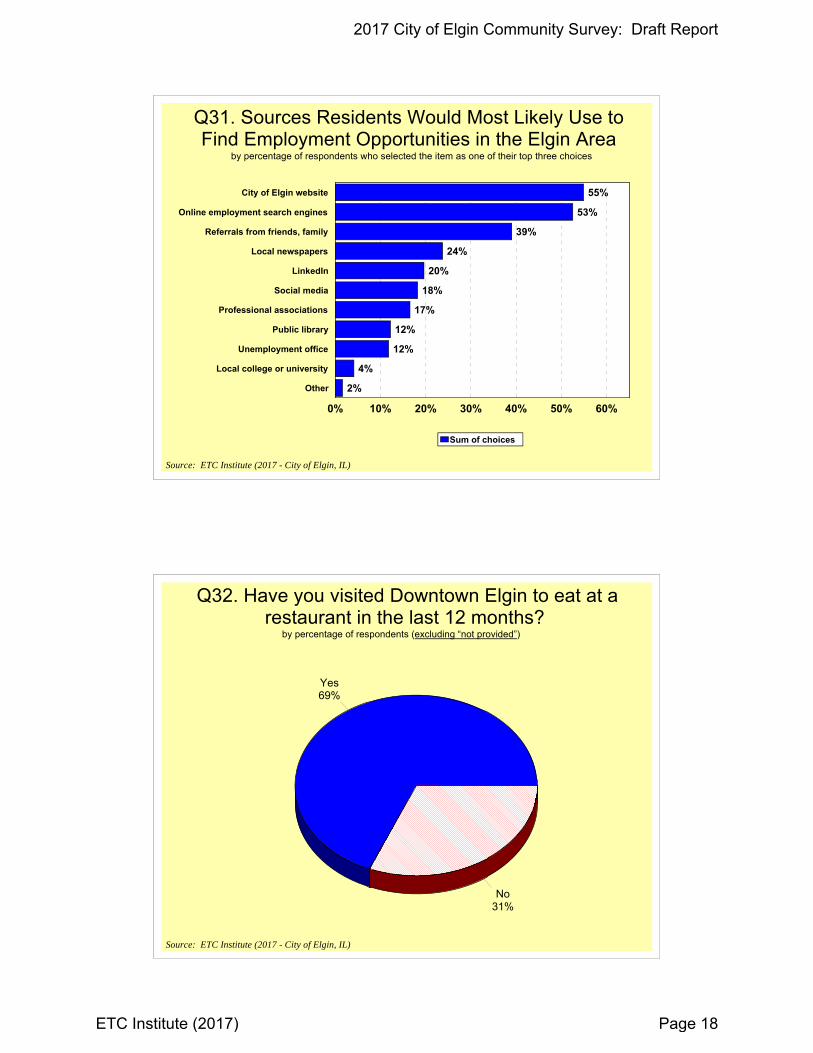
55%
53%
39%
24%
20%
18%
17%
12%
12%
4%
2%
City of Elgin website
Online employment search engines
Referrals from friends, family
Local newspapers
Social media
Professional associations
Public library
Unemployment office
Local college or university
Other
0% 10% 20% 30% 40% 50% 60%
Sum of choices
Q31. Sources Residents Would Most Likely Use to Find Employment Opportunities in the Elgin Area
Source: ETC Institute (2017 - City of Elgin, IL)
by percentage of respondents who selected the item as one of their top three choices
Q32. Have you visited Downtown Elgin to eat at a restaurant in the last 12 months?
Yes69%
No31%
by percentage of respondents (excluding “not provided”)
Source: ETC Institute (2017 - City of Elgin, IL)
2017 City of Elgin Community Survey: Draft Report
ETC Institute (2017) Page 18

Q33. Have you visited Downtown Elgin to attend a special event in the last 12 months?
Yes60%
No40%
by percentage of respondents (excluding “not provided”)
Source: ETC Institute (2017 - City of Elgin, IL)
Q34. Have you visited Downtown Elgin to do business or had an appointment in the last 12 months?
Yes45%
No55%
by percentage of respondents (excluding “not provided”)
Source: ETC Institute (2017 - City of Elgin, IL)
2017 City of Elgin Community Survey: Draft Report
ETC Institute (2017) Page 19
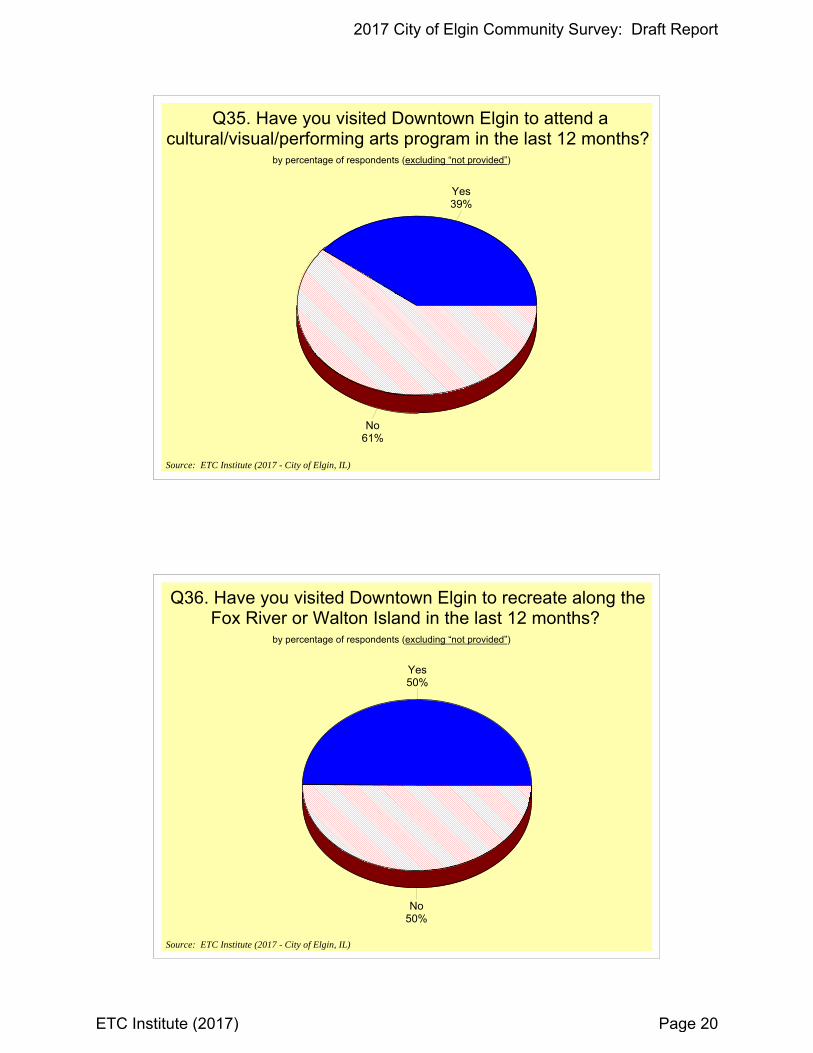
Q35. Have you visited Downtown Elgin to attend a cultural/visual/performing arts program in the last 12 months?
Yes39%
No61%
by percentage of respondents (excluding “not provided”)
Source: ETC Institute (2017 - City of Elgin, IL)
Q36. Have you visited Downtown Elgin to recreate along the Fox River or Walton Island in the last 12 months?
Yes50%
No50%
by percentage of respondents (excluding “not provided”)
Source: ETC Institute (2017 - City of Elgin, IL)
2017 City of Elgin Community Survey: Draft Report
ETC Institute (2017) Page 20
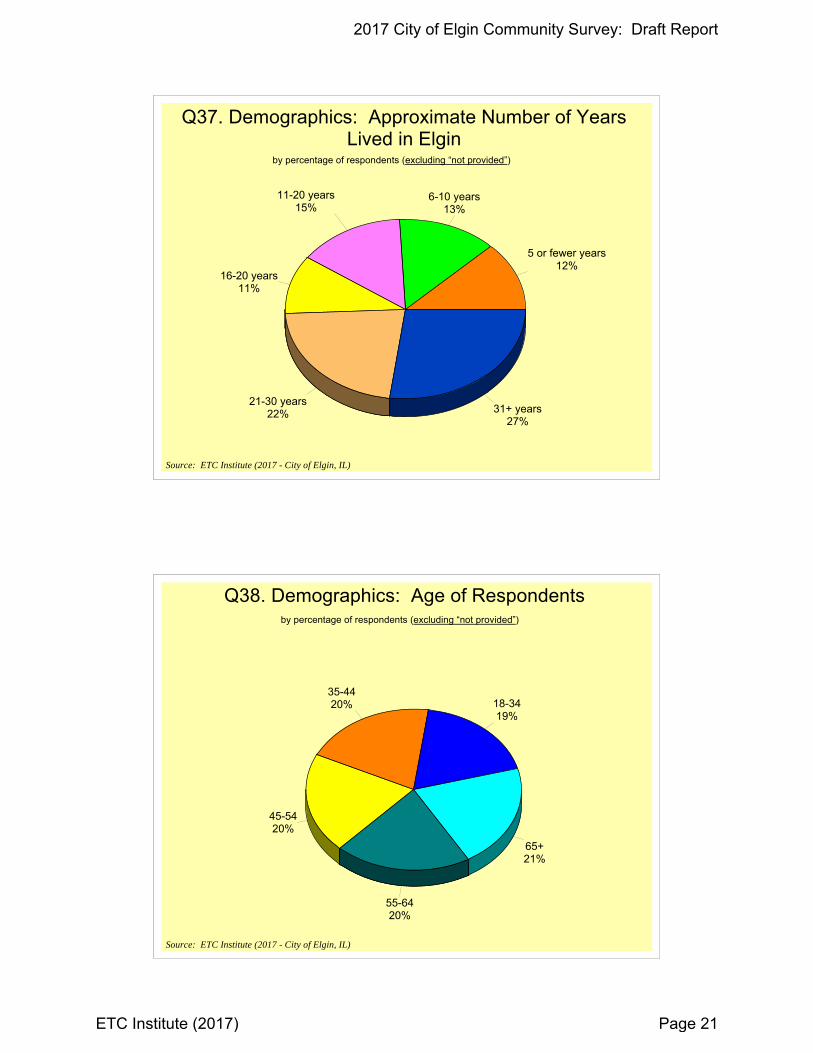
5 or fewer years12%
6-10 years13%
11-20 years15%
16-20 years11%
21-30 years22% 31+ years
27%
Q37. Demographics: Approximate Number of Years Lived in Elgin
Source: ETC Institute (2017 - City of Elgin, IL)
by percentage of respondents (excluding “not provided”)
18-3419%
35-4420%
45-5420%
55-6420%
65+21%
Q38. Demographics: Age of Respondentsby percentage of respondents (excluding “not provided”)
Source: ETC Institute (2017 - City of Elgin, IL)
2017 City of Elgin Community Survey: Draft Report
ETC Institute (2017) Page 21
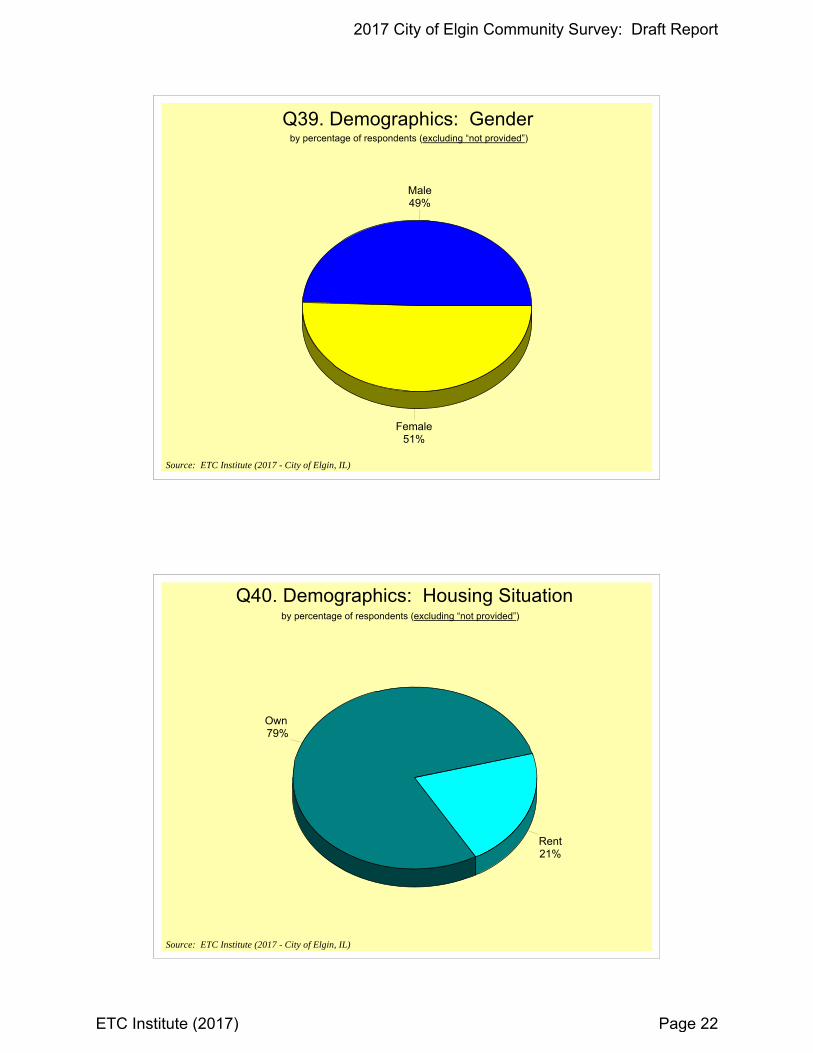
Q39. Demographics: Gender
Male49%
Female51%
by percentage of respondents (excluding “not provided”)
Source: ETC Institute (2017 - City of Elgin, IL)
Own 79%
Rent21%
Q40. Demographics: Housing Situationby percentage of respondents (excluding “not provided”)
Source: ETC Institute (2017 - City of Elgin, IL)
2017 City of Elgin Community Survey: Draft Report
ETC Institute (2017) Page 22

Q41. Demographics: Race/Ethnicity
63%
43%
7%
5%
2%
1%
Caucasian/White
Hispanic/Latino
African American/Black
Asian/Pacific Islander
Native American
Other
0% 20% 40% 60%
by percentage of respondents (multiple selections could be made)
Source: ETC Institute (2017 - City of Elgin, IL)
6%
22%
41%
Student2%
Retired24%
6%
Q42. Demographics: Employment Status
Source: ETC Institute (2017 - City of Elgin, IL)
by percentage of respondents (excluding “not provided”)
Employed in home/have home-based business
Employed outside home, in Elgin
Employed outside home, outside of Elgin
Not currently employed
2017 City of Elgin Community Survey: Draft Report
ETC Institute (2017) Page 23
Section 2:
Benchmarking Analysis
2017 City of Elgin Community Survey: Draft Report
ETC Institute (2017) Page 24
Ben
chm
arking A
nalysis
Benchmarking Summary Report City of Elgin, Illinois
Overview
ETC Institute's DirectionFinder program was originally developed in 1999 to help community
leaders across the United States use statistically valid community survey data as a tool for
making better decisions. Since November of 1999, the survey has been administered in more
than 230 cities in 43 states. Many participating cities conduct the survey on an annual or
biennial basis.
This report contains benchmarking data from two sources: (1) a national survey that was
administered by ETC Institute during the summer of 2016 to a random sample of over 4,000
residents across the United States and (2) a regional survey administered by ETC Institute during
the summer of 2016 to 360 residents living in communities in the Great Lakes Region of the
United States. The Great Lakes Region includes the following states: Illinois, Ohio, Michigan,
Indiana, and Pennsylvania.
Interpreting the Charts
The charts on the following pages show how the overall results for Elgin compare to the U.S.
national and regional averages based on the results of the 2016 survey that was administered
by ETC Institute. The City of Elgin’s results are shown in blue, the Great Lakes Region averages
are shown in red, and the National averages are shown in yellow in the charts on the following
pages.
2017 City of Elgin Community Survey: Draft Report
ETC Institute (2017) Page 25

76%
58%
57%
55%
48%
37%
79%
56%
75%
59%
62%
63%
70%
53%
68%
54%
60%
58%
As a place to live
As a City moving in the right direction
As a place to raise children
As a place to work
As a place to visit
As a place to retire
0% 20% 40% 60% 80% 100%
Elgin Great Lakes Region U.S.
by percentage of respondents who rated the item 4 or 5 on a 5-point scalewhere 5 was "very satisfied" and 1 was "very dissatisfied" (excluding don't knows)
Source: 2017 ETC Institute
Overall Perceptions of the CommunityElgin vs. Great Lakes Region vs. the U.S.
2017 City of Elgin Community Survey: Draft Report
ETC Institute (2017) Page 26
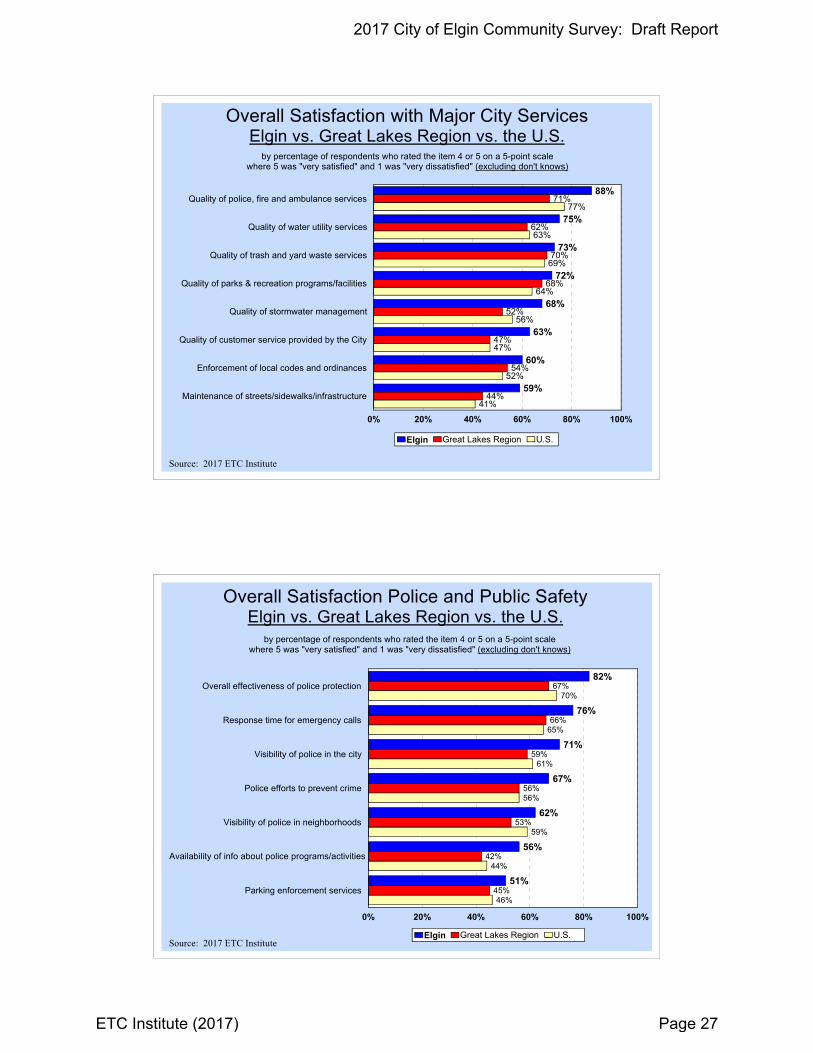
88%
75%
73%
72%
68%
63%
60%
59%
71%
62%
70%
68%
52%
47%
54%
44%
77%
63%
69%
64%
56%
47%
52%
41%
Quality of police, fire and ambulance services
Quality of water utility services
Quality of trash and yard waste services
Quality of parks & recreation programs/facilities
Quality of stormwater management
Quality of customer service provided by the City
Enforcement of local codes and ordinances
Maintenance of streets/sidewalks/infrastructure
0% 20% 40% 60% 80% 100%
Elgin Great Lakes Region U.S.
Overall Satisfaction with Major City ServicesElgin vs. Great Lakes Region vs. the U.S.
by percentage of respondents who rated the item 4 or 5 on a 5-point scalewhere 5 was "very satisfied" and 1 was "very dissatisfied" (excluding don't knows)
Source: 2017 ETC Institute
82%
76%
71%
67%
62%
56%
51%
67%
66%
59%
56%
53%
42%
45%
70%
65%
61%
56%
59%
44%
46%
Overall effectiveness of police protection
Response time for emergency calls
Visibility of police in the city
Police efforts to prevent crime
Visibility of police in neighborhoods
Parking enforcement services
0% 20% 40% 60% 80% 100%
Elgin Great Lakes Region U.S.
Overall Satisfaction Police and Public SafetyElgin vs. Great Lakes Region vs. the U.S.
by percentage of respondents who rated the item 4 or 5 on a 5-point scalewhere 5 was "very satisfied" and 1 was "very dissatisfied" (excluding don't knows)
Source: 2017 ETC Institute
Availability of info about police programs/activities
2017 City of Elgin Community Survey: Draft Report
ETC Institute (2017) Page 27
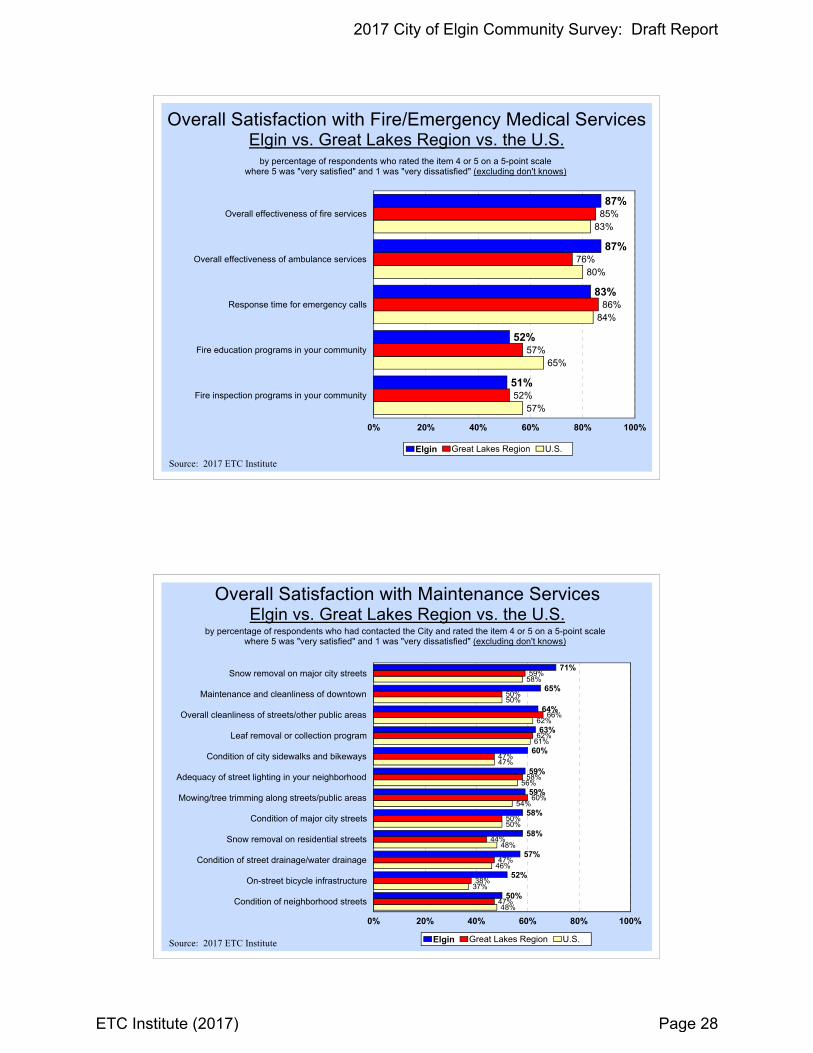
87%
87%
83%
52%
51%
85%
76%
86%
57%
52%
83%
80%
84%
65%
57%
Overall effectiveness of fire services
Overall effectiveness of ambulance services
Response time for emergency calls
Fire education programs in your community
Fire inspection programs in your community
0% 20% 40% 60% 80% 100%
Elgin Great Lakes Region U.S.
Overall Satisfaction with Fire/Emergency Medical ServicesElgin vs. Great Lakes Region vs. the U.S.
by percentage of respondents who rated the item 4 or 5 on a 5-point scalewhere 5 was "very satisfied" and 1 was "very dissatisfied" (excluding don't knows)
Source: 2017 ETC Institute
71%
65%
64%
63%
60%
59%
59%
58%
58%
57%
52%
50%
59%
50%
66%
62%
47%
58%
60%
50%
44%
47%
38%
47%
58%
50%
62%
61%
47%
56%
54%
50%
48%
46%
37%
48%
Snow removal on major city streets
Maintenance and cleanliness of downtown
Overall cleanliness of streets/other public areas
Leaf removal or collection program
Condition of city sidewalks and bikeways
Adequacy of street lighting in your neighborhood
Mowing/tree trimming along streets/public areas
Condition of major city streets
Snow removal on residential streets
Condition of street drainage/water drainage
On-street bicycle infrastructure
Condition of neighborhood streets
0% 20% 40% 60% 80% 100%
Elgin Great Lakes Region U.S.
Overall Satisfaction with Maintenance ServicesElgin vs. Great Lakes Region vs. the U.S.
by percentage of respondents who had contacted the City and rated the item 4 or 5 on a 5-point scalewhere 5 was "very satisfied" and 1 was "very dissatisfied" (excluding don't knows)
Source: 2017 ETC Institute
2017 City of Elgin Community Survey: Draft Report
ETC Institute (2017) Page 28

86%
79%
68%
67%
45%
62%
71%
48%
67%
Water pressure on a typical day
Overall quality of water service
Overall quality of your tap water
0% 20% 40% 60% 80% 100%
Elgin Great Lakes Region U.S.
by percentage of respondents who rated the item 4 or 5 on a 5-point scalewhere 5 was "very satisfied" and 1 was "very dissatisfied" (excluding don't knows)
Source: 2017 ETC Institute
Overall Satisfaction With Water Utility ServicesElgin vs. Great Lakes Region vs. the U.S.
74%
73%
70%
67%
67%
65%
64%
59%
55%
66%
66%
61%
59%
69%
69%
50%
72%
61%
70%
68%
60%
59%
65%
64%
45%
62%
63%
Maintenance of parks
Number of parks
Overall quality of recreation facilities
Quality of walking and biking trails
Quality of outdoor athletic fields
Quality of park facilities
Golf courses
Ease of registering for programs
Number of walking/biking trails
0% 20% 40% 60% 80% 100%
Elgin Great Lakes Region U.S.
by percentage of respondents who rated the item 4 or 5 on a 5-point scalewhere 5 was "very satisfied" and 1 was "very dissatisfied" (excluding don't knows)
Source: 2017 ETC Institute
Overall Satisfaction With Parks and RecreationElgin vs. Great Lakes Region vs. the U.S.
2017 City of Elgin Community Survey: Draft Report
ETC Institute (2017) Page 29

42%
38%
37%
36%
57%
45%
41%
43%
52%
41%
41%
43%
Exterior maint. of commercial/business property
Clean-up of trash/debris on private property
Mowing/cutting of weeds on private property
Exterior maintenance of residential property
0% 10% 20% 30% 40% 50% 60% 70%
Elgin Great Lakes Region U.S.
by percentage of respondents who rated the item 4 or 5 on a 5-point scalewhere 5 was "very satisfied" and 1 was "very dissatisfied" (excluding don't knows)
Source: 2017 ETC Institute
Overall Satisfaction With Code EnforcementElgin vs. Great Lakes Region vs. the U.S.
54%
43%
43%
50%
33%
39%
46%
33%
34%
Availability of public information
Ability to volunteer/serve
Ability to provide feedback to the City
0% 10% 20% 30% 40% 50% 60% 70%
Elgin Great Lakes Region U.S.
by percentage of respondents who rated the item 4 or 5 on a 5-point scalewhere 5 was "very satisfied" and 1 was "very dissatisfied" (excluding don't knows)
Source: 2017 ETC Institute
Overall Satisfaction With Public Information & EngagementElgin vs. Great Lakes Region vs. the U.S.
2017 City of Elgin Community Survey: Draft Report
ETC Institute (2017) Page 30

Section 3:
Importance-Satisfaction Analysis
2017 City of Elgin Community Survey: Draft Report
ETC Institute (2017) Page 31
IMPORTA
NCE‐SA
TISFACTIO
N ANALYSIS
Importance-Satisfaction Analysis City of Elgin, Illinois
Overview Today, City officials have limited resources which need to be targeted to activities that are of the most benefit to their citizens. Two of the most important criteria for decision making are (1) to target resources toward services of the highest importance to citizens; and (2) to target resources toward those services where citizens are the least satisfied. The Importance-Satisfaction (IS) rating is a unique tool that allows public officials to better understand both of these highly important decision making criteria for each of the services they are providing. The Importance-Satisfaction rating is based on the concept that cities will maximize overall citizen satisfaction by emphasizing improvements in those service categories where the level of satisfaction is relatively low and the perceived importance of the service is relatively high.
Methodology The rating is calculated by summing the percentage of responses for items selected as the first and second most important services for the City to provide. This sum is then multiplied by 1 minus the percentage of respondents that indicated they were positively satisfied with the City's performance in the related area (the sum of the ratings of 4 and 5 on a 5-point scale excluding “don't knows”). “Don't know” responses are excluded from the calculation to ensure that the satisfaction ratings among service categories are comparable. [IS=Importance x (1-Satisfaction)]. Example of the Calculation. Respondents were asked to identify the major City services they thought should receive the most emphasis over the next two years. Fifty-five percent (55%) selected maintenance of streets, sidewalks and infrastructure as one of the most important services for the City to emphasize over the next two years. With regard to satisfaction, 59% of the residents surveyed rated the City’s overall performance with maintenance of streets, sidewalks and infrastructure as a “4” or a “5” on a 5-point scale (where “5” means “very satisfied), excluding “don't know” responses. The I-S rating for maintenance of streets, sidewalks and infrastructure was calculated by multiplying the sum of the most important percentages by 1 minus the sum of the satisfaction percentages. In this example, 55% was multiplied by 41% (1-0.59). This calculation yielded an I-S rating of 0.2255, which was ranked first out of ten major City service categories.
2017 City of Elgin Community Survey: Draft Report
ETC Institute (2017) Page 32

IMPORTA
NCE‐SA
TISFACTIO
N ANALYSIS
The maximum rating is 1.00 and would be achieved when 100% of the respondents select an item as one of their top three choices to emphasize over the next two years and 0% indicate that they are positively satisfied with the delivery of the service. The lowest rating is 0.00 and could be achieved under either one of the following two situations:
if 100% of the respondents were positively satisfied with the delivery of the service
if none (0%) of the respondents selected the service as one of the three most important areas for the City to emphasize over the next two years.
Interpreting the Ratings Ratings that are greater than or equal to 0.20 identify areas that should receive significantly more emphasis over the next two years. Ratings from .10 to .20 identify service areas that should receive increased emphasis. Ratings less than .10 should continue to receive the current level of emphasis.
Definitely Increase Emphasis (IS>=0.20)
Increase Current Emphasis (0.10<=IS<0.20)
Maintain Current Emphasis (IS<0.10) The results for Elgin are provided on the following pages.
2017 City of Elgin Community Survey: Draft Report
ETC Institute (2017) Page 33

Importance-Satisfaction RatingCity of Elgin, IL
Major City Services
Category of ServiceMost
Important %
Most Important
Rank Satisfaction %Satisfaction
Rank
Importance-Satisfaction
RatingI-S Rating
Rank
Very High Priority (IS >.20)Maintenance of streets/sidewalks/infrastructure 55% 1 59% 10 0.2255 1
High Priority (IS .10-.20)Enforcement of local codes and ordinances 33% 2 60% 9 0.1312 2
Medium Priority (IS <.10)Quality of parks & recreation programs/facilities 31% 3 72% 5 0.0865 3Quality of customer service provided by the City 16% 7 63% 8 0.0603 4Quality of trash and yard waste services 21% 5 73% 3 0.0567 5Access to info about city programs/services/alerts 18% 6 71% 6 0.0522 6Quality of stormwater management 10% 9 68% 7 0.0304 7Quality of police, fire and ambulance services 25% 4 88% 1 0.0304 8Quality of water utility services 12% 8 75% 2 0.0300 9Quality of billing services provided 7% 10 73% 4 0.0192 10
Note: The I-S Rating is calculated by multiplying the "Most Important" % by (1-'Satisfaction' %)
Most Important %: The "Most Important" percentage represents the sum of the first, second, and third
most important responses for each item. Respondents were asked to identify
the items they thought should receive the most emphasis over the next two years.
Satisfaction %: The "Satisfaction" percentage represents the sum of the ratings "4" and "5" excluding 'don't knows.'Respondents ranked their level of satisfaction with the each of the items on a scaleof 1 to 5 with "5" being very satisfied and "1" being very dissatisfied.
© 2017 DirectionFinder by ETC Institute
2017 City of Elgin Community Survey: Draft Report
ETC Institute (2017) Page 34
Importance-Satisfaction RatingCity of Elgin, IL
Police and Public Safety
Category of ServiceMost
Important %
Most Important
Rank Satisfaction %Satisfaction
Rank
Importance-Satisfaction
RatingI-S Rating
Rank
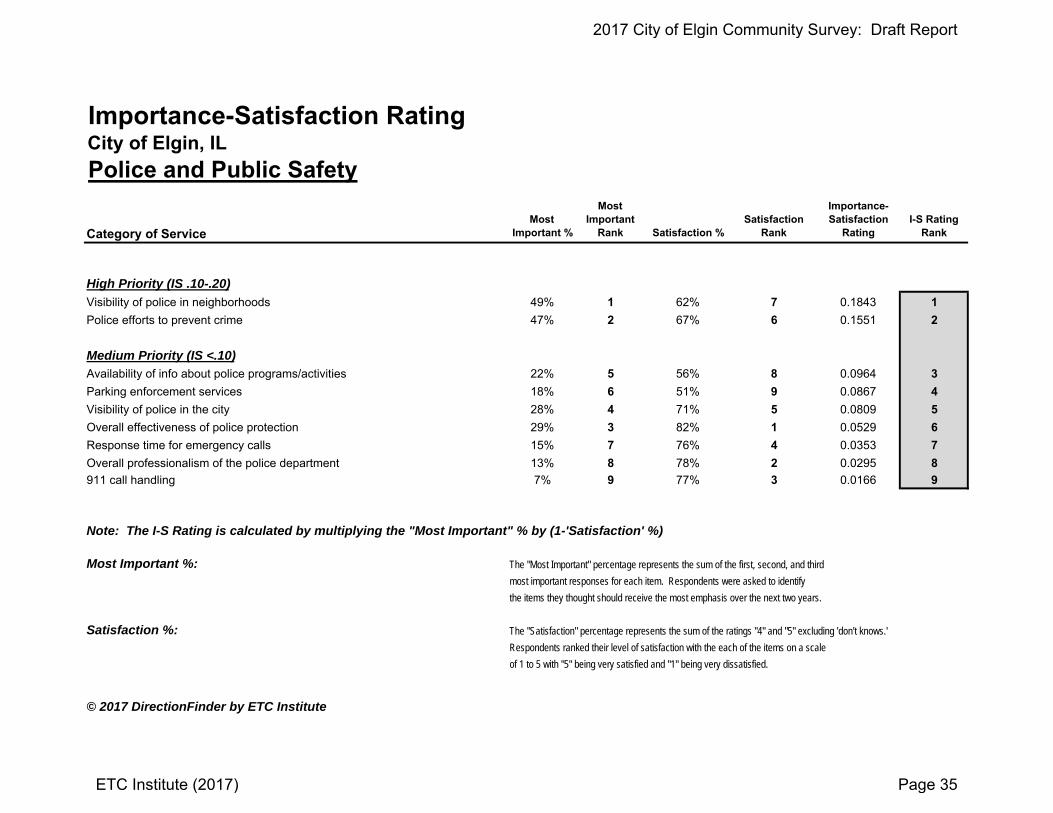
High Priority (IS .10-.20)Visibility of police in neighborhoods 49% 1 62% 7 0.1843 1
Police efforts to prevent crime 47% 2 67% 6 0.1551 2
Medium Priority (IS <.10)Availability of info about police programs/activities 22% 5 56% 8 0.0964 3
Parking enforcement services 18% 6 51% 9 0.0867 4
Visibility of police in the city 28% 4 71% 5 0.0809 5
Overall effectiveness of police protection 29% 3 82% 1 0.0529 6
Response time for emergency calls 15% 7 76% 4 0.0353 7
Overall professionalism of the police department 13% 8 78% 2 0.0295 8
911 call handling 7% 9 77% 3 0.0166 9
Note: The I-S Rating is calculated by multiplying the "Most Important" % by (1-'Satisfaction' %)
Most Important %: The "Most Important" percentage represents the sum of the first, second, and thirdmost important responses for each item. Respondents were asked to identifythe items they thought should receive the most emphasis over the next two years.
Satisfaction %: The "Satisfaction" percentage represents the sum of the ratings "4" and "5" excluding 'don't knows.'Respondents ranked their level of satisfaction with the each of the items on a scaleof 1 to 5 with "5" being very satisfied and "1" being very dissatisfied.
© 2017 DirectionFinder by ETC Institute
2017 City of Elgin Community Survey: Draft Report
ETC Institute (2017) Page 35
Importance-Satisfaction RatingCity of Elgin, IL
Fire and Emergency Medical Services
Category of ServiceMost
Important %
Most Important
Rank Satisfaction %Satisfaction
Rank
Importance-Satisfaction
RatingI-S Rating
Rank
High Priority (IS .10-.20)
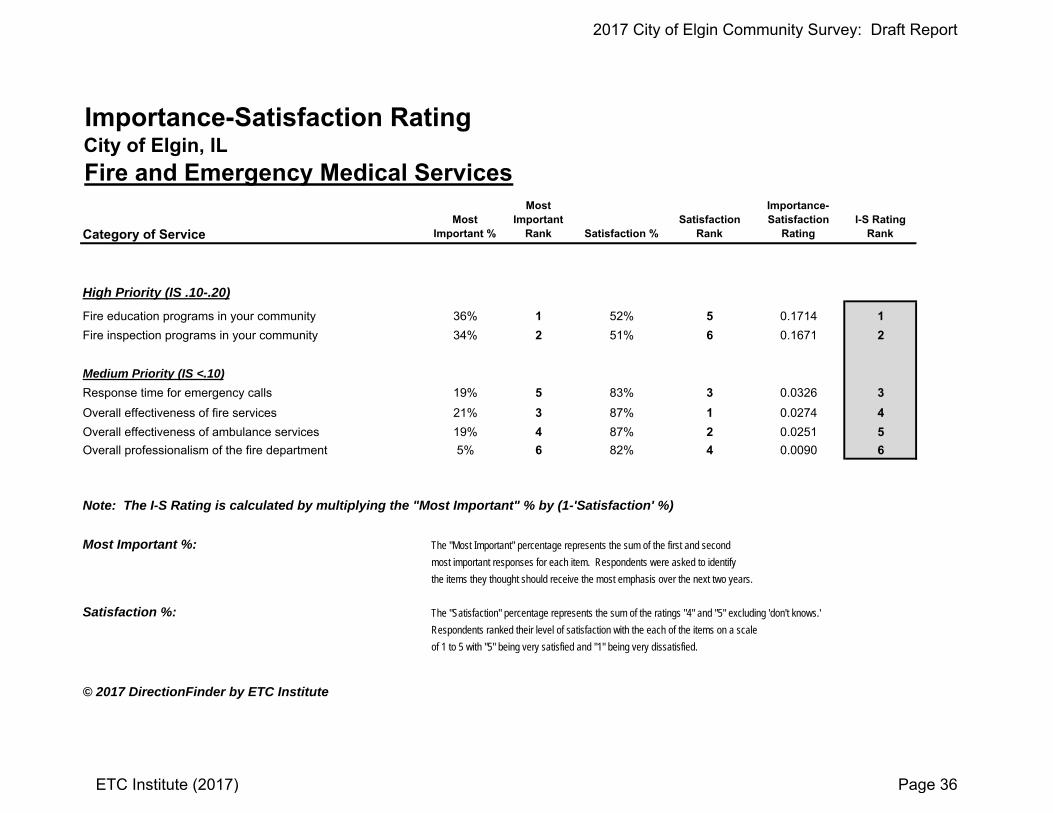
Fire education programs in your community 36% 1 52% 5 0.1714 1
Fire inspection programs in your community 34% 2 51% 6 0.1671 2
Medium Priority (IS <.10)Response time for emergency calls 19% 5 83% 3 0.0326 3
Overall effectiveness of fire services 21% 3 87% 1 0.0274 4
Overall effectiveness of ambulance services 19% 4 87% 2 0.0251 5
Overall professionalism of the fire department 5% 6 82% 4 0.0090 6
Note: The I-S Rating is calculated by multiplying the "Most Important" % by (1-'Satisfaction' %)
Most Important %: The "Most Important" percentage represents the sum of the first and secondmost important responses for each item. Respondents were asked to identifythe items they thought should receive the most emphasis over the next two years.
Satisfaction %: The "Satisfaction" percentage represents the sum of the ratings "4" and "5" excluding 'don't knows.'Respondents ranked their level of satisfaction with the each of the items on a scaleof 1 to 5 with "5" being very satisfied and "1" being very dissatisfied.
© 2017 DirectionFinder by ETC Institute
2017 City of Elgin Community Survey: Draft Report
ETC Institute (2017) Page 36
Importance-Satisfaction RatingCity of Elgin, IL
Maintenance Services
Category of ServiceMost
Important %
Most Important
Rank Satisfaction %Satisfaction
Rank
Importance-Satisfaction
RatingI-S Rating
Rank
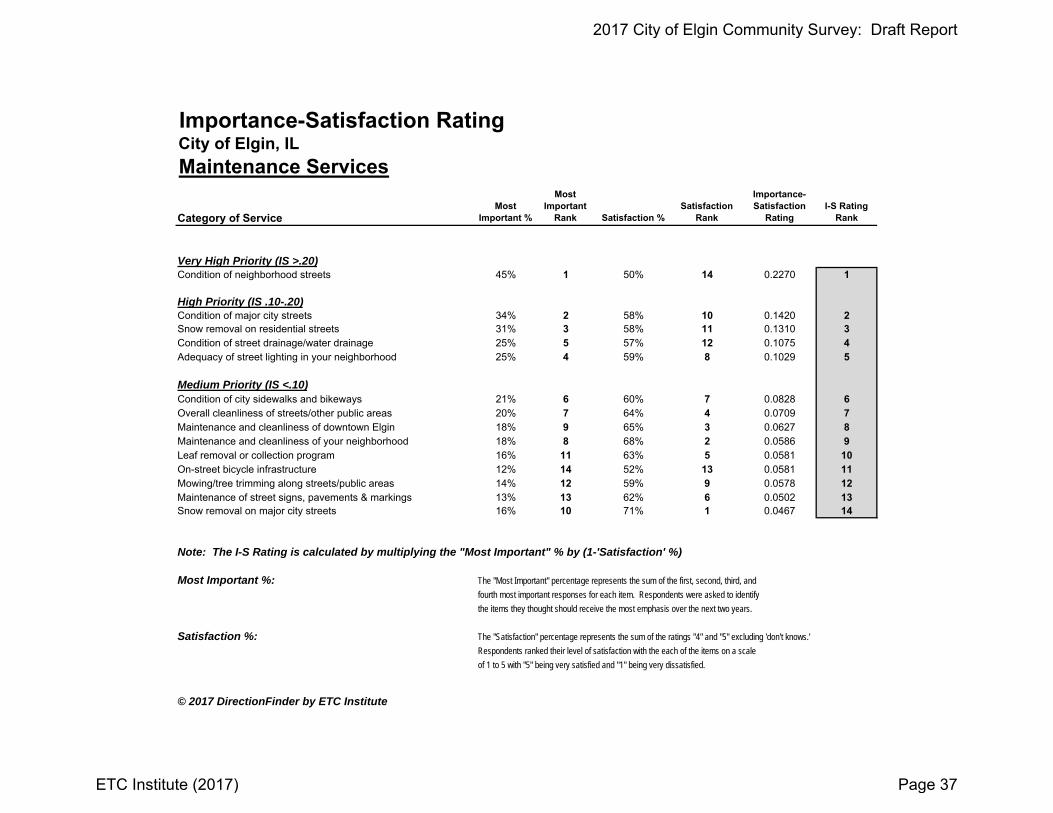
Very High Priority (IS >.20)Condition of neighborhood streets 45% 1 50% 14 0.2270 1
High Priority (IS .10-.20)Condition of major city streets 34% 2 58% 10 0.1420 2Snow removal on residential streets 31% 3 58% 11 0.1310 3Condition of street drainage/water drainage 25% 5 57% 12 0.1075 4Adequacy of street lighting in your neighborhood 25% 4 59% 8 0.1029 5
Medium Priority (IS <.10)Condition of city sidewalks and bikeways 21% 6 60% 7 0.0828 6Overall cleanliness of streets/other public areas 20% 7 64% 4 0.0709 7Maintenance and cleanliness of downtown Elgin 18% 9 65% 3 0.0627 8Maintenance and cleanliness of your neighborhood 18% 8 68% 2 0.0586 9Leaf removal or collection program 16% 11 63% 5 0.0581 10On-street bicycle infrastructure 12% 14 52% 13 0.0581 11Mowing/tree trimming along streets/public areas 14% 12 59% 9 0.0578 12Maintenance of street signs, pavements & markings 13% 13 62% 6 0.0502 13Snow removal on major city streets 16% 10 71% 1 0.0467 14
Note: The I-S Rating is calculated by multiplying the "Most Important" % by (1-'Satisfaction' %)
Most Important %: The "Most Important" percentage represents the sum of the first, second, third, andfourth most important responses for each item. Respondents were asked to identifythe items they thought should receive the most emphasis over the next two years.
Satisfaction %: The "Satisfaction" percentage represents the sum of the ratings "4" and "5" excluding 'don't knows.'Respondents ranked their level of satisfaction with the each of the items on a scaleof 1 to 5 with "5" being very satisfied and "1" being very dissatisfied.
© 2017 DirectionFinder by ETC Institute
2017 City of Elgin Community Survey: Draft Report
ETC Institute (2017) Page 37

Importance-Satisfaction RatingCity of Elgin, IL
Sustainability
Category of Service
Most Important
%
Most Important
Rank Satisfaction %Satisfaction
Rank
Importance-Satisfaction
RatingI-S Rating
Rank
Medium Priority (IS <.10)Alternative energy, renewable energy 31% 2 79% 4 0.0649 1
Green infrastructure, green building, sustainable planning 22% 4 75% 6 0.0545 2
Recycling, waste management, composting 44% 1 89% 1 0.0481 3
Resource conservation (water, energy) 24% 3 83% 2 0.0415 4
Local goods production & availability 18% 6 79% 5 0.0382 5
Sustainable transportation & mobility 20% 5 81% 3 0.0378 6
Note: The I-S Rating is calculated by multiplying the "Most Important" % by (1-'Satisfaction' %)
Most Important %: The "Most Important" percentage represents the sum of the first and secondmost important responses for each item. Respondents were asked to identifythe items they thought should receive the most emphasis over the next two years.
Satisfaction %: The "Satisfaction" percentage represents the sum of the ratings "4" and "5" excluding 'don't knows.'Respondents ranked their level of satisfaction with the each of the items on a scaleof 1 to 5 with "5" being very satisfied and "1" being very dissatisfied.
© 2017 DirectionFinder by ETC Institute
2017 City of Elgin Community Survey: Draft Report
ETC Institute (2017) Page 38

Importance-Satisfaction RatingCity of Elgin, IL
Water Utility Services
Category of ServiceMost
Important %
Most Important
Rank Satisfaction %Satisfaction
Rank
Importance-Satisfaction
RatingI-S Rating
Rank
Very High Priority (IS >.20)Overall quality of your tap water 64% 1 68% 4 0.2045 1
Medium Priority (IS <.10)Overall quality of water service 39% 2 79% 3 0.0825 2
Water pressure on a typical day 21% 3 86% 1 0.0291 3
Ease of paying water bill 14% 4 82% 2 0.0252 4
Note: The I-S Rating is calculated by multiplying the "Most Important" % by (1-'Satisfaction' %)
Most Important %: The "Most Important" percentage represents the sum of the first and secondmost important responses for each item. Respondents were asked to identifythe items they thought should receive the most emphasis over the next two years.
Satisfaction %: The "Satisfaction" percentage represents the sum of the ratings "4" and "5" excluding 'don't knows.'Respondents ranked their level of satisfaction with the each of the items on a scaleof 1 to 5 with "5" being very satisfied and "1" being very dissatisfied.
© 2017 DirectionFinder by ETC Institute
2017 City of Elgin Community Survey: Draft Report
ETC Institute (2017) Page 39
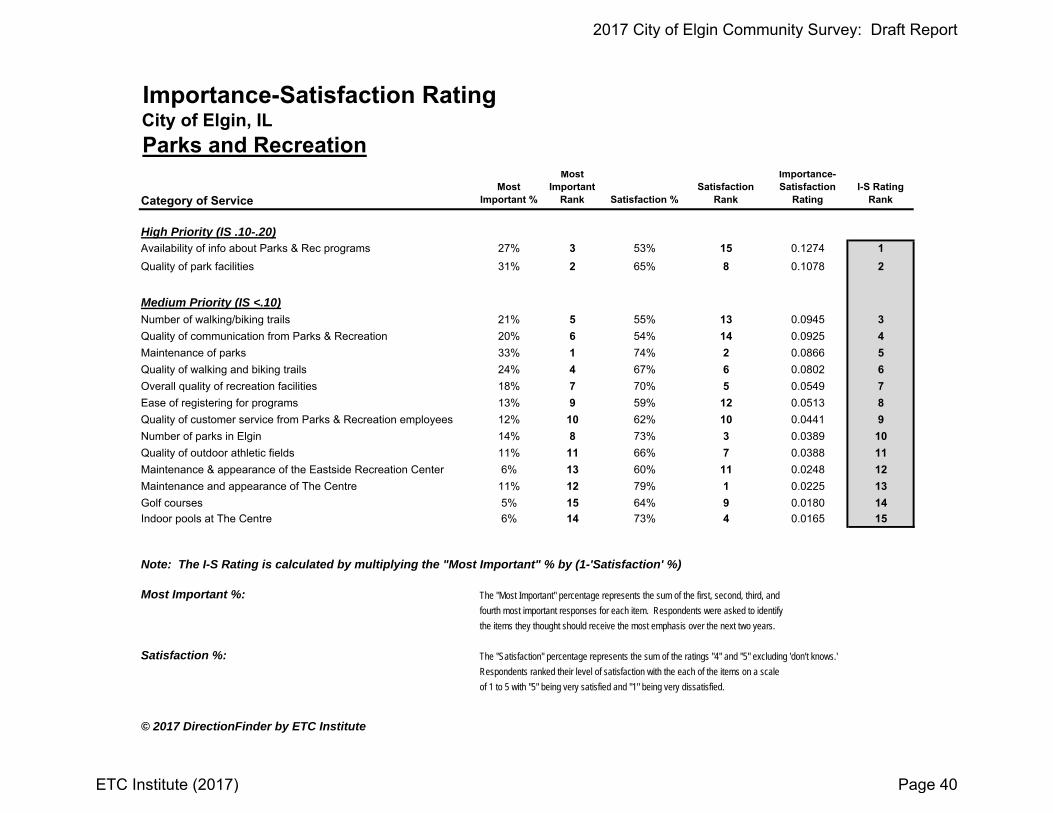
Importance-Satisfaction RatingCity of Elgin, IL
Parks and Recreation
Category of ServiceMost
Important %
Most Important
Rank Satisfaction %Satisfaction
Rank
Importance-Satisfaction
RatingI-S Rating
Rank
High Priority (IS .10-.20)Availability of info about Parks & Rec programs 27% 3 53% 15 0.1274 1
Quality of park facilities 31% 2 65% 8 0.1078 2
Medium Priority (IS <.10)Number of walking/biking trails 21% 5 55% 13 0.0945 3
Quality of communication from Parks & Recreation 20% 6 54% 14 0.0925 4
Maintenance of parks 33% 1 74% 2 0.0866 5
Quality of walking and biking trails 24% 4 67% 6 0.0802 6
Overall quality of recreation facilities 18% 7 70% 5 0.0549 7
Ease of registering for programs 13% 9 59% 12 0.0513 8
Quality of customer service from Parks & Recreation employees 12% 10 62% 10 0.0441 9
Number of parks in Elgin 14% 8 73% 3 0.0389 10
Quality of outdoor athletic fields 11% 11 66% 7 0.0388 11
Maintenance & appearance of the Eastside Recreation Center 6% 13 60% 11 0.0248 12
Maintenance and appearance of The Centre 11% 12 79% 1 0.0225 13
Golf courses 5% 15 64% 9 0.0180 14
Indoor pools at The Centre 6% 14 73% 4 0.0165 15
Note: The I-S Rating is calculated by multiplying the "Most Important" % by (1-'Satisfaction' %)
Most Important %: The "Most Important" percentage represents the sum of the first, second, third, andfourth most important responses for each item. Respondents were asked to identifythe items they thought should receive the most emphasis over the next two years.
Satisfaction %: The "Satisfaction" percentage represents the sum of the ratings "4" and "5" excluding 'don't knows.'Respondents ranked their level of satisfaction with the each of the items on a scaleof 1 to 5 with "5" being very satisfied and "1" being very dissatisfied.
© 2017 DirectionFinder by ETC Institute
2017 City of Elgin Community Survey: Draft Report
ETC Institute (2017) Page 40

Importance-Satisfaction RatingCity of Elgin, IL
Code Enforcement
Category of ServiceMost
Important %
Most Important
Rank Satisfaction %Satisfaction
Rank
Importance-Satisfaction
RatingI-S Rating
Rank
Very High Priority (IS >.20)Clean-up of trash/debris on private property 35% 1 38% 4 0.2195 1
High Priority (IS .10-.20)Exterior maintenance of residential property 27% 2 36% 6 0.1702 2
Mowing/cutting of weeds on private property 21% 4 37% 5 0.1336 3
Effectiveness of Code Enforcement 24% 3 48% 1 0.1232 4
Medium Priority (IS <.10)Effectiveness of communication from Code Enforcement 17% 5 41% 3 0.0974 5
Exterior maintenance of commercial/business property 15% 6 42% 2 0.0893 6
Note: The I-S Rating is calculated by multiplying the "Most Important" % by (1-'Satisfaction' %)
Most Important %: The "Most Important" percentage represents the sum of the first and secondmost important responses for each item. Respondents were asked to identifythe items they thought should receive the most emphasis over the next two years.
Satisfaction %: The "Satisfaction" percentage represents the sum of the ratings "4" and "5" excluding 'don't knows.'Respondents ranked their level of satisfaction with the each of the items on a scaleof 1 to 5 with "5" being very satisfied and "1" being very dissatisfied.
© 2017 DirectionFinder by ETC Institute
2017 City of Elgin Community Survey: Draft Report
ETC Institute (2017) Page 41

IMPORTA
NCE‐SA
TISFACTIO
N ANALYSIS
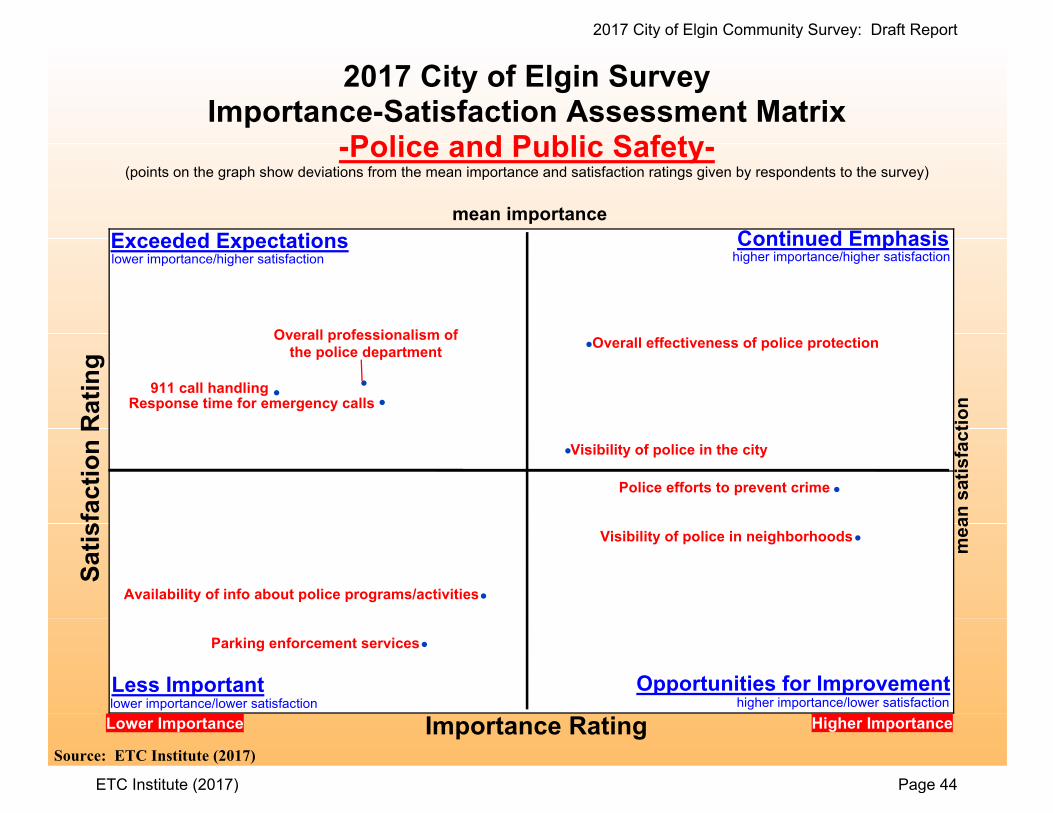
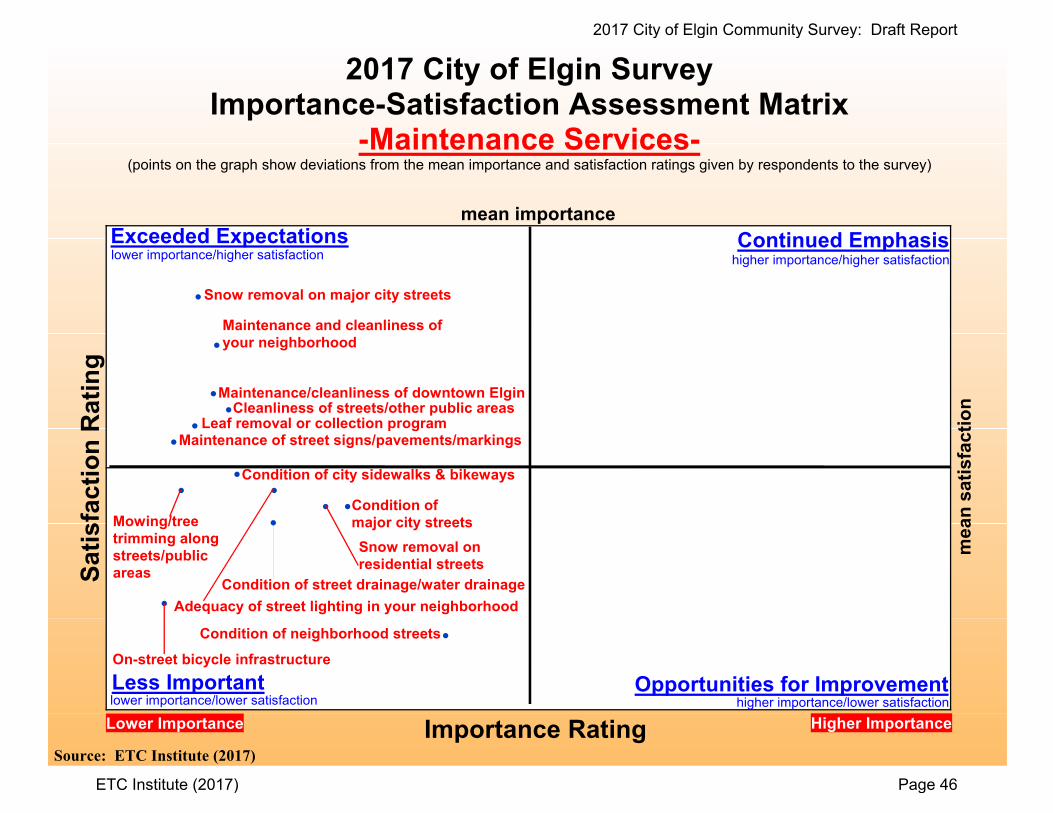
Importance-Satisfaction Matrix Analysis The Importance-Satisfaction rating is based on the concept that public agencies will maximize overall customer satisfaction by emphasizing improvements in those areas where the level of satisfaction is relatively low and the perceived importance of the service is relatively high. ETC Institute developed an Importance-Satisfaction Matrix to display the perceived importance of major services that were assessed on the survey against the perceived quality of service delivery. The two axes on the matrix represent Satisfaction (vertical) and relative Importance (horizontal). The I-S (Importance-Satisfaction) matrix should be interpreted as follows.
Continued Emphasis (above average importance and above average satisfaction). This area shows where the City is meeting customer expectations. Items in this area have a significant impact on the customer’s overall level of satisfaction. The City should maintain (or slightly increase) emphasis on items in this area.
Exceeding Expectations (below average importance and above average
satisfaction). This area shows where the City is performing significantly better than customers expect the City to perform. Items in this area do not significantly affect the overall level of satisfaction that residents have with City services. The City should maintain (or slightly decrease) emphasis on items in this area.
Opportunities for Improvement (above average importance and below average
satisfaction). This area shows where the City is not performing as well as residents expect the City to perform. This area has a significant impact on customer satisfaction, and the City should DEFINITELY increase emphasis on items in this area.
Less Important (below average importance and below average satisfaction).
This area shows where the City is not performing well relative to the City’s performance in other areas; however, this area is generally considered to be less important to residents. This area does not significantly affect overall satisfaction with City services because the items are less important to residents. The agency should maintain current levels of emphasis on items in this area.
Matrices showing the results for Elgin are provided on the following pages.
2017 City of Elgin Community Survey: Draft Report
ETC Institute (2017) Page 42

Sa t
isf a
ctio
n R
atin
g
!
!
!!! !
!
!
!
!
me a
n s
a tis
fac t
ion
Opportunities for Improvement
2017 City of Elgin SurveyImportance-Satisfaction Assessment Matrix
-Major City Services-(points on the graph show deviations from the mean importance and satisfaction ratings given by respondents to the survey)
mean importance
Importance RatingLower Importance Higher Importance
lower importance/higher satisfaction higher importance/higher satisfaction
lower importance/lower satisfaction higher importance/lower satisfaction
Exceeded Expectations
Less Important
Continued Emphasis
Source: ETC Institute (2017)
Quality of police, fire and ambulance services
Quality of water utility servicesQuality of trash and yard waste services
Quality of billing services provided Quality of parks & rec programs/facilitiesAccess to info about city programs/services/alerts
Quality of stormwater management
Quality of customer service provided by the City Enforcement of local codes and ordinances
Maintenance of streets/sidewalks/infrastructure
2017 City of Elgin Community Survey: Draft Report
ETC Institute (2017) Page 43
!
!
!!
!
!
!
!
!
Sa t
isf a
ctio
n R
atin
g
me a
n s
a tis
fac t
ion
Opportunities for Improvement
mean importance
Importance RatingLower Importance Higher Importance
lower importance/higher satisfaction higher importance/higher satisfaction
lower importance/lower satisfaction higher importance/lower satisfaction
Exceeded Expectations
Less Important
Continued Emphasis
2017 City of Elgin SurveyImportance-Satisfaction Assessment Matrix
-Police and Public Safety-(points on the graph show deviations from the mean importance and satisfaction ratings given by respondents to the survey)
Source: ETC Institute (2017)
Overall effectiveness of police protectionOverall professionalism ofthe police department
911 call handlingResponse time for emergency calls
Visibility of police in the city
Police efforts to prevent crime
Visibility of police in neighborhoods
Availability of info about police programs/activities
Parking enforcement services
2017 City of Elgin Community Survey: Draft Report
ETC Institute (2017) Page 44

!
!
!
!!
!
Sa t
isf a
ctio
n R
atin
g
me a
n s
a tis
fac t
ion
Opportunities for Improvement
mean importance
Importance RatingLower Importance Higher Importance
lower importance/higher satisfaction higher importance/higher satisfaction
lower importance/lower satisfaction higher importance/lower satisfaction
Exceeded Expectations
Less Important
Continued Emphasis
2017 City of Elgin SurveyImportance-Satisfaction Assessment Matrix
-Fire and Emergency Medical Services-(points on the graph show deviations from the mean importance and satisfaction ratings given by respondents to the survey)
Source: ETC Institute (2017)
Overall effectiveness of fire services
Overall effectiveness of ambulance services
Response time for emergency calls
Overall professionalism of the fire department
Fire education programsin your community
Fire inspection programs in your community
2017 City of Elgin Community Survey: Draft Report
ETC Institute (2017) Page 45
Sa t
isf a
ctio
n R
atin
g
!
!
!
!!
!!
!!!
!!!
!
me a
n s
a tis
fac t
ion
Opportunities for Improvement
mean importance
Importance RatingLower Importance Higher Importance
lower importance/higher satisfaction higher importance/higher satisfaction
lower importance/lower satisfaction higher importance/lower satisfaction
Exceeded Expectations
Less Important
Continued Emphasis
2017 City of Elgin SurveyImportance-Satisfaction Assessment Matrix
-Maintenance Services-(points on the graph show deviations from the mean importance and satisfaction ratings given by respondents to the survey)
Source: ETC Institute (2017)
Snow removal on major city streets
Maintenance and cleanliness of your neighborhood
Maintenance/cleanliness of downtown ElginCleanliness of streets/other public areas
Leaf removal or collection programMaintenance of street signs/pavements/markings
Condition of city sidewalks & bikeways
Adequacy of street lighting in your neighborhood
Mowing/tree trimming along streets/publicareas
Condition of major city streets
Snow removal on residential streets
Condition of street drainage/water drainage
On-street bicycle infrastructure
Condition of neighborhood streets
2017 City of Elgin Community Survey: Draft Report
ETC Institute (2017) Page 46

Sa t
isf a
ctio
n R
atin
g
!
!
!
!
!!
me a
n s
a tis
fac t
ion
Opportunities for Improvement
mean importance
Importance RatingLower Importance Higher Importance
lower importance/higher satisfaction higher importance/higher satisfaction
lower importance/lower satisfaction higher importance/lower satisfaction
Exceeded Expectations
Less Important
Continued Emphasis
2017 City of Elgin SurveyImportance-Satisfaction Assessment Matrix
-Sustainability-(points on the graph show deviations from the mean importance and satisfaction ratings given by respondents to the survey)
Source: ETC Institute (2017)
Recycling/waste management/composting
Resource conservation (water, energy)
Sustainable transportation & mobility
Alternative energy, renewable energyLocal goods production & availability
Green infrastructure, greenbuilding, sustainable planning
2017 City of Elgin Community Survey: Draft Report
ETC Institute (2017) Page 47

!
!
!
!
Sa t
isf a
ctio
n R
atin
g
me a
n s
a tis
fac t
ion
Opportunities for Improvement
mean importance
Importance RatingLower Importance Higher Importance
lower importance/higher satisfaction higher importance/higher satisfaction
lower importance/lower satisfaction higher importance/lower satisfaction
Exceeded Expectations
Less Important
Continued Emphasis
2017 City of Elgin SurveyImportance-Satisfaction Assessment Matrix
-Water Utility Services-(points on the graph show deviations from the mean importance and satisfaction ratings given by respondents to the survey)
Source: ETC Institute (2017)
Water pressure on a typical day
Ease of paying water bill
Overall quality of water service
Overall quality of your tap water
2017 City of Elgin Community Survey: Draft Report
ETC Institute (2017) Page 48
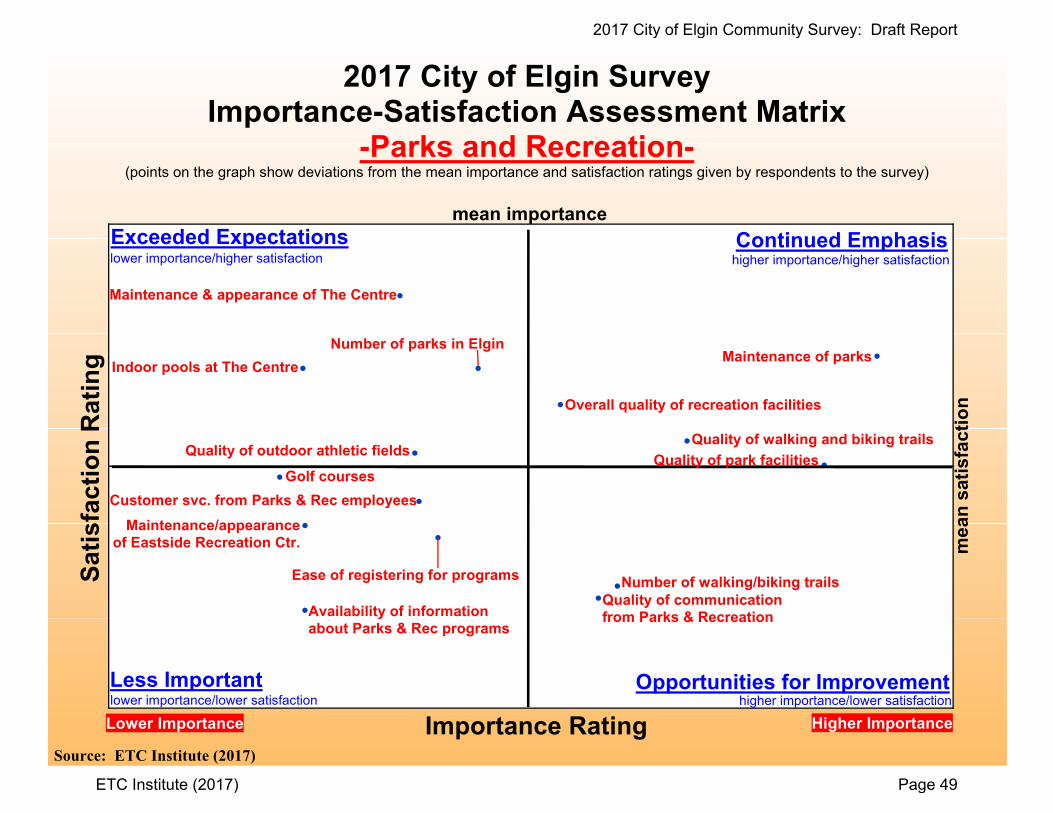
!
!
!!!
!
!!
!!
!
!!
!!
Sa t
isf a
ctio
n R
atin
g
me a
n s
a tis
fac t
ion
Opportunities for Improvement
mean importance
Importance RatingLower Importance Higher Importance
lower importance/higher satisfaction higher importance/higher satisfaction
lower importance/lower satisfaction higher importance/lower satisfaction
Exceeded Expectations
Less Important
Continued Emphasis
2017 City of Elgin SurveyImportance-Satisfaction Assessment Matrix
-Parks and Recreation-(points on the graph show deviations from the mean importance and satisfaction ratings given by respondents to the survey)
Source: ETC Institute (2017)
Maintenance & appearance of The Centre
Maintenance of parksNumber of parks in Elgin
Indoor pools at The Centre
Overall quality of recreation facilities
Quality of walking and biking trailsQuality of outdoor athletic fields
Quality of park facilitiesGolf courses
Customer svc. from Parks & Rec employees
Availability of informationabout Parks & Rec programs
Ease of registering for programs Number of walking/biking trailsQuality of communication from Parks & Recreation
Maintenance/appearance of Eastside Recreation Ctr.
2017 City of Elgin Community Survey: Draft Report
ETC Institute (2017) Page 49
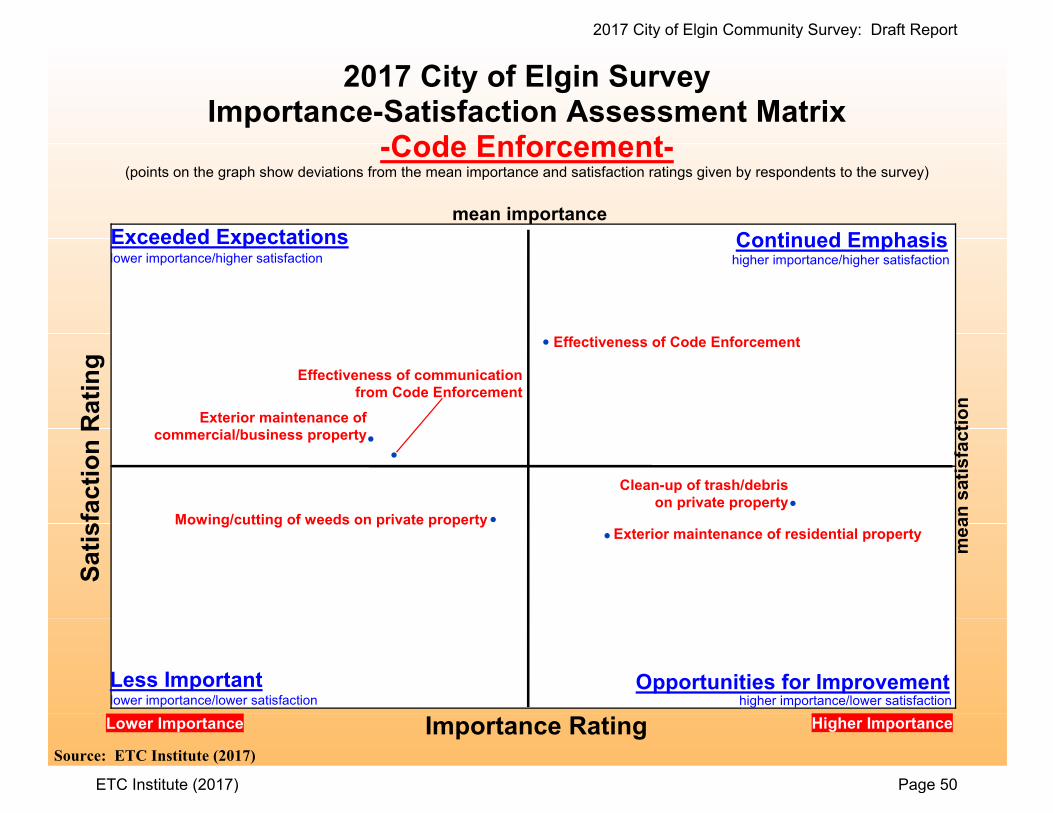
!
!
!!
!!
Sa t
isf a
ctio
n R
atin
g
me a
n s
a tis
fac t
ion
Opportunities for Improvement
mean importance
Importance RatingLower Importance Higher Importance
lower importance/higher satisfaction higher importance/higher satisfaction
lower importance/lower satisfaction higher importance/lower satisfaction
Exceeded Expectations
Less Important
Continued Emphasis
2017 City of Elgin SurveyImportance-Satisfaction Assessment Matrix
-Code Enforcement-(points on the graph show deviations from the mean importance and satisfaction ratings given by respondents to the survey)
Source: ETC Institute (2017)
Effectiveness of Code Enforcement
Exterior maintenance of commercial/business property
Effectiveness of communication from Code Enforcement
Clean-up of trash/debrison private property
Mowing/cutting of weeds on private propertyExterior maintenance of residential property
2017 City of Elgin Community Survey: Draft Report
ETC Institute (2017) Page 50

Section 4:
Tabular Data
2017 City of Elgin Community Survey: Draft Report
ETC Institute (2017) Page 51

Q1. Please rate the City of Elgin using a scale of 1 to 5, where 5 means "Excellent" and 1 means "Poor,"
with regard to each of the following items.
(N=577)
Below
Excellent Good Neutral Average Poor Don't Know
Q1a. As a place to live 17.2% 57.9% 15.3% 6.1% 2.4% 1.2%
Q1b. As a place to raise children 11.8% 41.1% 21.8% 13.7% 4.7% 6.9%
Q1c. As a place to work 13.3% 32.9% 25.5% 7.5% 4.9% 15.9%
Q1d. As a place to retire 10.7% 21.5% 22.7% 16.5% 15.6% 13.0%
Q1e. As a place to visit 12.1% 33.4% 29.5% 13.9% 7.1% 4.0%
Q1f. As a place for single adults (age 18-35) 8.7% 22.5% 26.9% 12.3% 5.5% 24.1%
Q1g. As a City moving in right direction 17.5% 38.3% 25.5% 9.5% 5.0% 4.2%
Q1h. As a place you are proud to call home 23.2% 40.7% 20.8% 8.8% 5.5% 0.9%
Q1i. As a place for recreation 12.8% 34.7% 29.8% 13.9% 4.7% 4.2%
WITHOUT “DON’T KNOW”
Q1. Please rate the City of Elgin using a scale of 1 to 5, where 5 means "Excellent" and 1 means "Poor,"
with regard to each of the following items. (without "don't know")
(N=577)
Excellent Good Neutral Below Average Poor
Q1a. As a place to live 17.4% 58.6% 15.4% 6.1% 2.5%
Q1b. As a place to raise children 12.7% 44.1% 23.5% 14.7% 5.0%
Q1c. As a place to work 15.9% 39.2% 30.3% 8.9% 5.8%
Q1d. As a place to retire 12.4% 24.7% 26.1% 18.9% 17.9%
Q1e. As a place to visit 12.6% 34.8% 30.7% 14.4% 7.4%
Q1f. As a place for single adults (age 18-35) 11.4% 29.7% 35.4% 16.2% 7.3%
Q1g. As a City moving in right direction 18.3% 40.0% 26.6% 9.9% 5.2%
Q1h. As a place you are proud to call home 23.4% 41.1% 21.0% 8.9% 5.6%
Q1i. As a place for recreation 13.4% 36.2% 31.1% 14.5% 4.9%
2017 City of Elgin Community Survey: Draft Report
ETC Institute (2017) Page 52

Q2. Using a scale of 1 to 5, where 5 means "Very Likely" and 1 means "Very Unlikely," please indicate
how likely you are to do each of the following.
(N=577)
Very
Very Likely Likely Neutral Unlikely Unlikely Don't Know
Q2a. Recommend living in Elgin to someone
who asks 18.4% 41.4% 20.5% 11.3% 7.6% 0.9%
Q2b. Remain in Elgin for next five years 38.0% 31.2% 11.1% 8.8% 7.8% 3.1%
Q2c. Recommend visiting Elgin 17.5% 35.7% 26.7% 13.5% 5.2% 1.4%
Q2d. Recommend doing business in Elgin 17.7% 31.2% 27.7% 9.9% 5.7% 7.8%
WITHOUT “DON’T KNOW”
Q2. Using a scale of 1 to 5, where 5 means "Very Likely" and 1 means "Very Unlikely," please indicate
how likely you are to do each of the following. (without "don't know")
(N=577)
Very Likely Likely Neutral Unlikely Very Unlikely
Q2a. Recommend living in Elgin to someone
who asks 18.5% 41.8% 20.6% 11.4% 7.7%
Q2b. Remain in Elgin for next five years 39.2% 32.2% 11.4% 9.1% 8.1%
Q2c. Recommend visiting Elgin 17.8% 36.2% 27.1% 13.7% 5.3%
Q2d. Recommend doing business in Elgin 19.2% 33.8% 30.1% 10.7% 6.2%
2017 City of Elgin Community Survey: Draft Report
ETC Institute (2017) Page 53
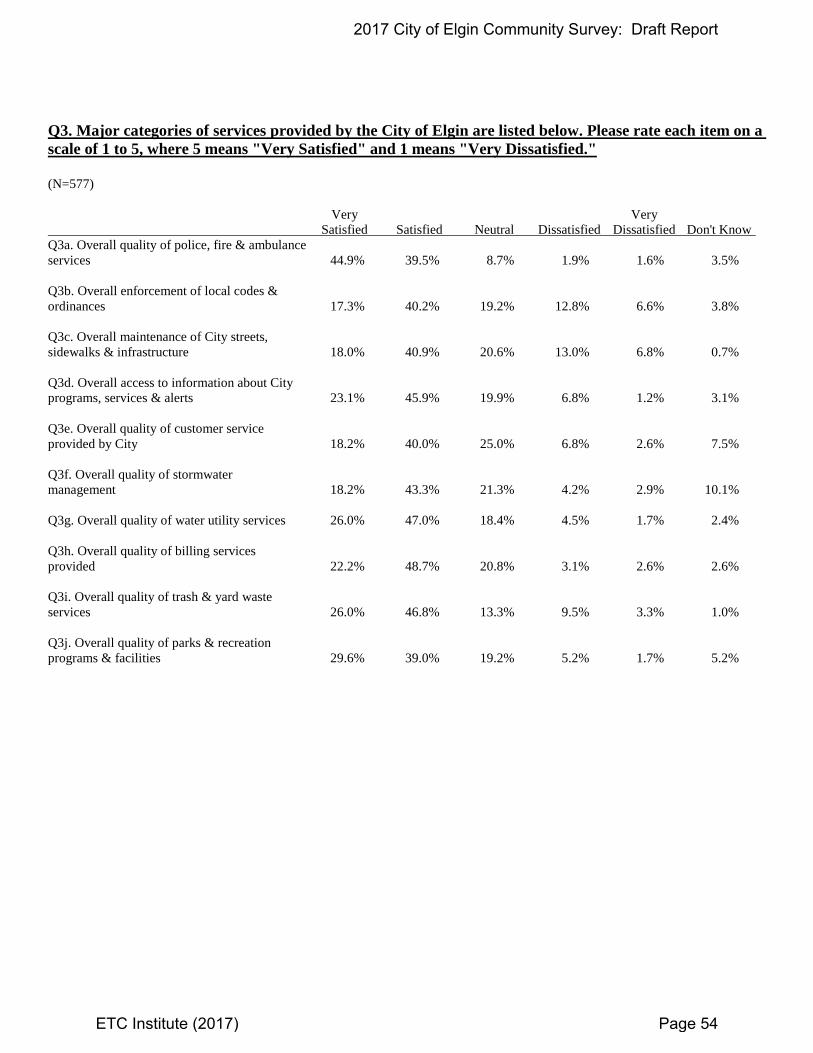
Q3. Major categories of services provided by the City of Elgin are listed below. Please rate each item on a
scale of 1 to 5, where 5 means "Very Satisfied" and 1 means "Very Dissatisfied."
(N=577)
Very Very
Satisfied Satisfied Neutral Dissatisfied Dissatisfied Don't Know
Q3a. Overall quality of police, fire & ambulance
services 44.9% 39.5% 8.7% 1.9% 1.6% 3.5%
Q3b. Overall enforcement of local codes &
ordinances 17.3% 40.2% 19.2% 12.8% 6.6% 3.8%
Q3c. Overall maintenance of City streets,
sidewalks & infrastructure 18.0% 40.9% 20.6% 13.0% 6.8% 0.7%
Q3d. Overall access to information about City
programs, services & alerts 23.1% 45.9% 19.9% 6.8% 1.2% 3.1%
Q3e. Overall quality of customer service
provided by City 18.2% 40.0% 25.0% 6.8% 2.6% 7.5%
Q3f. Overall quality of stormwater
management 18.2% 43.3% 21.3% 4.2% 2.9% 10.1%
Q3g. Overall quality of water utility services 26.0% 47.0% 18.4% 4.5% 1.7% 2.4%
Q3h. Overall quality of billing services
provided 22.2% 48.7% 20.8% 3.1% 2.6% 2.6%
Q3i. Overall quality of trash & yard waste
services 26.0% 46.8% 13.3% 9.5% 3.3% 1.0%
Q3j. Overall quality of parks & recreation
programs & facilities 29.6% 39.0% 19.2% 5.2% 1.7% 5.2%
2017 City of Elgin Community Survey: Draft Report
ETC Institute (2017) Page 54
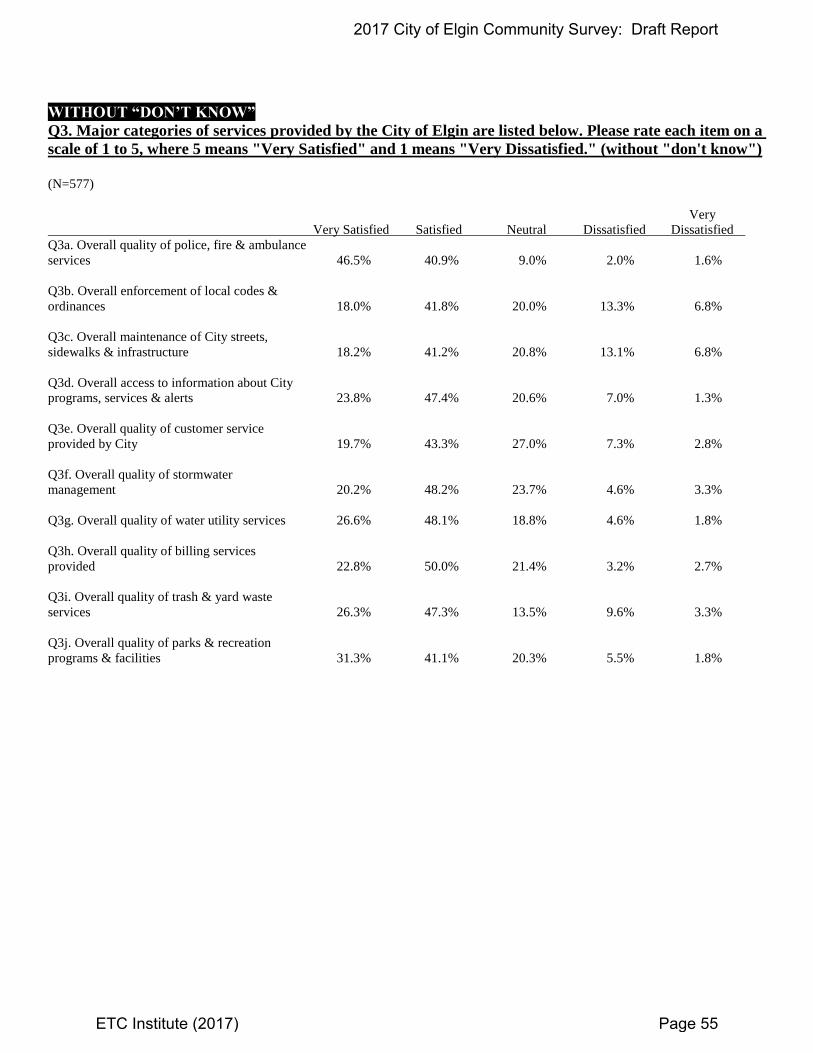
WITHOUT “DON’T KNOW”
Q3. Major categories of services provided by the City of Elgin are listed below. Please rate each item on a
scale of 1 to 5, where 5 means "Very Satisfied" and 1 means "Very Dissatisfied." (without "don't know")
(N=577)
Very
Very Satisfied Satisfied Neutral Dissatisfied Dissatisfied
Q3a. Overall quality of police, fire & ambulance
services 46.5% 40.9% 9.0% 2.0% 1.6%
Q3b. Overall enforcement of local codes &
ordinances 18.0% 41.8% 20.0% 13.3% 6.8%
Q3c. Overall maintenance of City streets,
sidewalks & infrastructure 18.2% 41.2% 20.8% 13.1% 6.8%
Q3d. Overall access to information about City
programs, services & alerts 23.8% 47.4% 20.6% 7.0% 1.3%
Q3e. Overall quality of customer service
provided by City 19.7% 43.3% 27.0% 7.3% 2.8%
Q3f. Overall quality of stormwater
management 20.2% 48.2% 23.7% 4.6% 3.3%
Q3g. Overall quality of water utility services 26.6% 48.1% 18.8% 4.6% 1.8%
Q3h. Overall quality of billing services
provided 22.8% 50.0% 21.4% 3.2% 2.7%
Q3i. Overall quality of trash & yard waste
services 26.3% 47.3% 13.5% 9.6% 3.3%
Q3j. Overall quality of parks & recreation
programs & facilities 31.3% 41.1% 20.3% 5.5% 1.8%
2017 City of Elgin Community Survey: Draft Report
ETC Institute (2017) Page 55
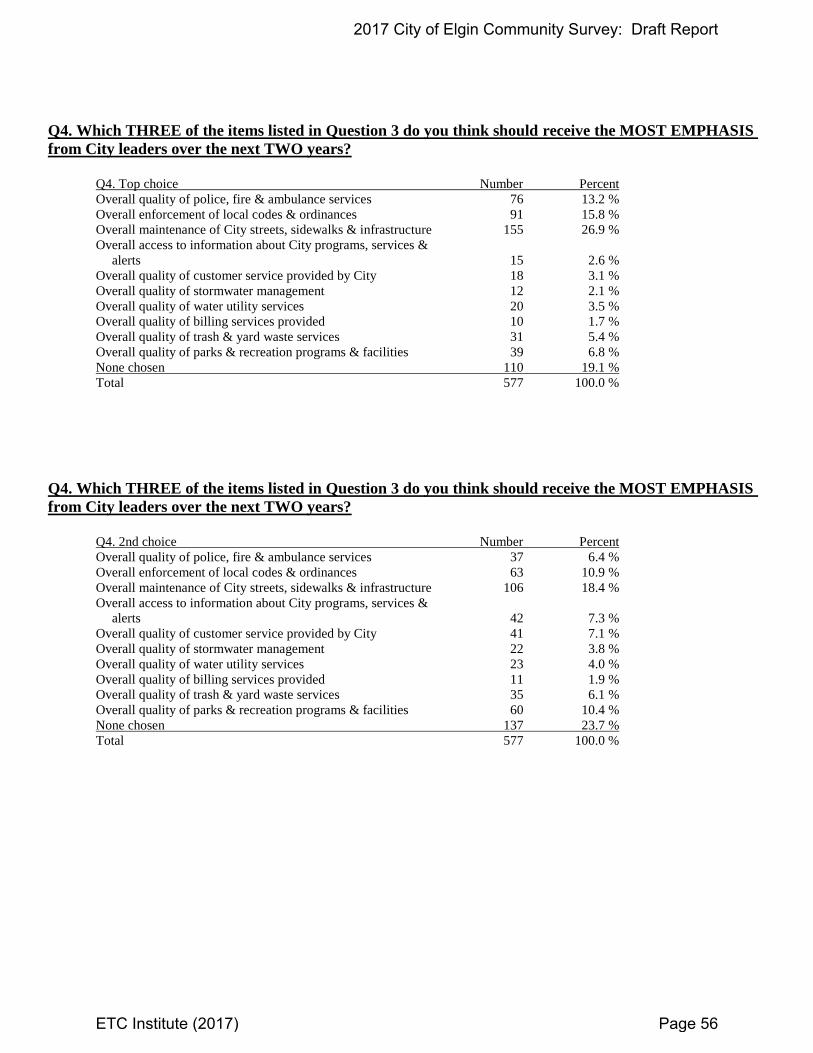
Q4. Which THREE of the items listed in Question 3 do you think should receive the MOST EMPHASIS
from City leaders over the next TWO years?
Q4. Top choice Number Percent
Overall quality of police, fire & ambulance services 76 13.2 %
Overall enforcement of local codes & ordinances 91 15.8 %
Overall maintenance of City streets, sidewalks & infrastructure 155 26.9 %
Overall access to information about City programs, services &
alerts 15 2.6 %
Overall quality of customer service provided by City 18 3.1 %
Overall quality of stormwater management 12 2.1 %
Overall quality of water utility services 20 3.5 %
Overall quality of billing services provided 10 1.7 %
Overall quality of trash & yard waste services 31 5.4 %
Overall quality of parks & recreation programs & facilities 39 6.8 %
None chosen 110 19.1 %
Total 577 100.0 %
Q4. Which THREE of the items listed in Question 3 do you think should receive the MOST EMPHASIS
from City leaders over the next TWO years?
Q4. 2nd choice Number Percent
Overall quality of police, fire & ambulance services 37 6.4 %
Overall enforcement of local codes & ordinances 63 10.9 %
Overall maintenance of City streets, sidewalks & infrastructure 106 18.4 %
Overall access to information about City programs, services &
alerts 42 7.3 %
Overall quality of customer service provided by City 41 7.1 %
Overall quality of stormwater management 22 3.8 %
Overall quality of water utility services 23 4.0 %
Overall quality of billing services provided 11 1.9 %
Overall quality of trash & yard waste services 35 6.1 %
Overall quality of parks & recreation programs & facilities 60 10.4 %
None chosen 137 23.7 %
Total 577 100.0 %
2017 City of Elgin Community Survey: Draft Report
ETC Institute (2017) Page 56

Q4. Which THREE of the items listed in Question 3 do you think should receive the MOST EMPHASIS
from City leaders over the next TWO years?
Q4. 3rd choice Number Percent
Overall quality of police, fire & ambulance services 33 5.7 %
Overall enforcement of local codes & ordinances 35 6.1 %
Overall maintenance of City streets, sidewalks & infrastructure 56 9.7 %
Overall access to information about City programs, services &
alerts 47 8.1 %
Overall quality of customer service provided by City 35 6.1 %
Overall quality of stormwater management 21 3.6 %
Overall quality of water utility services 26 4.5 %
Overall quality of billing services provided 20 3.5 %
Overall quality of trash & yard waste services 55 9.5 %
Overall quality of parks & recreation programs & facilities 79 13.7 %
None chosen 170 29.5 %
Total 577 100.0 %
Q4. Which THREE of the items listed in Question 3 do you think should receive the MOST EMPHASIS
from City leaders over the next TWO years? (top 3)
Q4. Sum of top 3 choices Number Percent
Overall quality of police, fire & ambulance services 146 25.3 %
Overall enforcement of local codes & ordinances 189 32.8 %
Overall maintenance of City streets, sidewalks & infrastructure 317 54.9 %
Overall access to information about City programs, services &
alerts 104 18.0 %
Overall quality of customer service provided by City 94 16.3 %
Overall quality of stormwater management 55 9.5 %
Overall quality of water utility services 69 12.0 %
Overall quality of billing services provided 41 7.1 %
Overall quality of trash & yard waste services 121 21.0 %
Overall quality of parks & recreation programs & facilities 178 30.8 %
None chosen 110 19.1 %
Total 1424
2017 City of Elgin Community Survey: Draft Report
ETC Institute (2017) Page 57
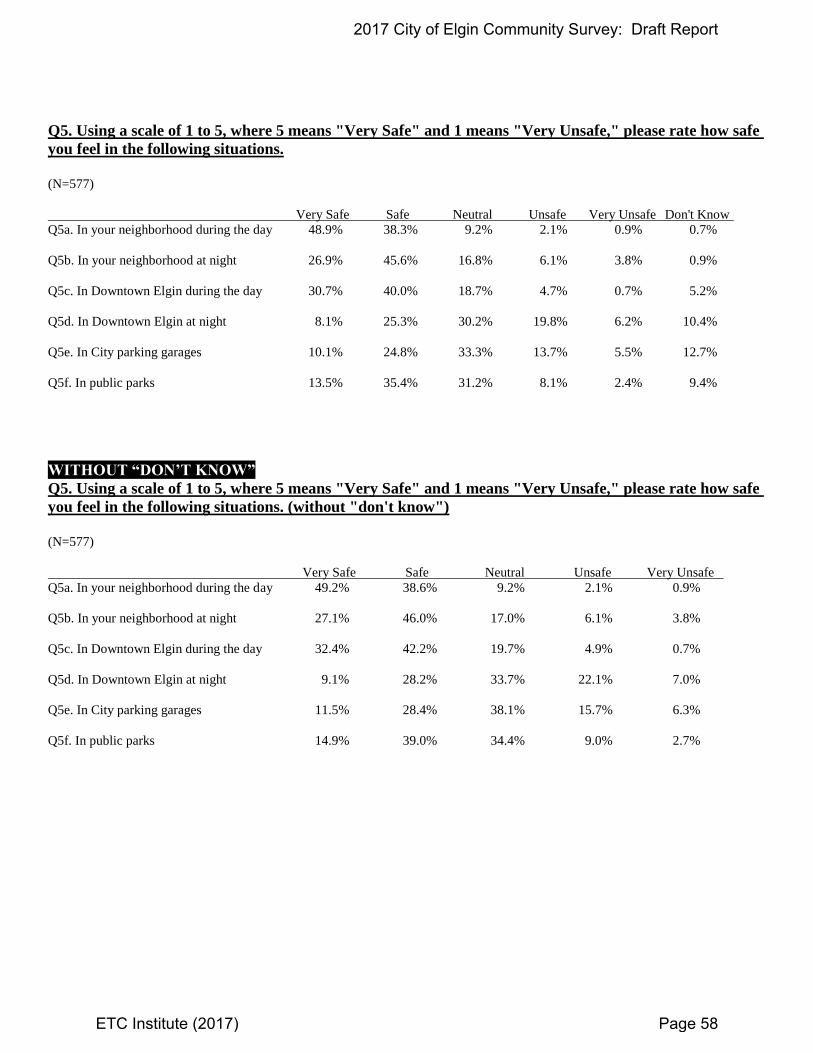
Q5. Using a scale of 1 to 5, where 5 means "Very Safe" and 1 means "Very Unsafe," please rate how safe
you feel in the following situations.
(N=577)
Very Safe Safe Neutral Unsafe Very Unsafe Don't Know
Q5a. In your neighborhood during the day 48.9% 38.3% 9.2% 2.1% 0.9% 0.7%
Q5b. In your neighborhood at night 26.9% 45.6% 16.8% 6.1% 3.8% 0.9%
Q5c. In Downtown Elgin during the day 30.7% 40.0% 18.7% 4.7% 0.7% 5.2%
Q5d. In Downtown Elgin at night 8.1% 25.3% 30.2% 19.8% 6.2% 10.4%
Q5e. In City parking garages 10.1% 24.8% 33.3% 13.7% 5.5% 12.7%
Q5f. In public parks 13.5% 35.4% 31.2% 8.1% 2.4% 9.4%
WITHOUT “DON’T KNOW”
Q5. Using a scale of 1 to 5, where 5 means "Very Safe" and 1 means "Very Unsafe," please rate how safe
you feel in the following situations. (without "don't know")
(N=577)
Very Safe Safe Neutral Unsafe Very Unsafe
Q5a. In your neighborhood during the day 49.2% 38.6% 9.2% 2.1% 0.9%
Q5b. In your neighborhood at night 27.1% 46.0% 17.0% 6.1% 3.8%
Q5c. In Downtown Elgin during the day 32.4% 42.2% 19.7% 4.9% 0.7%
Q5d. In Downtown Elgin at night 9.1% 28.2% 33.7% 22.1% 7.0%
Q5e. In City parking garages 11.5% 28.4% 38.1% 15.7% 6.3%
Q5f. In public parks 14.9% 39.0% 34.4% 9.0% 2.7%
2017 City of Elgin Community Survey: Draft Report
ETC Institute (2017) Page 58
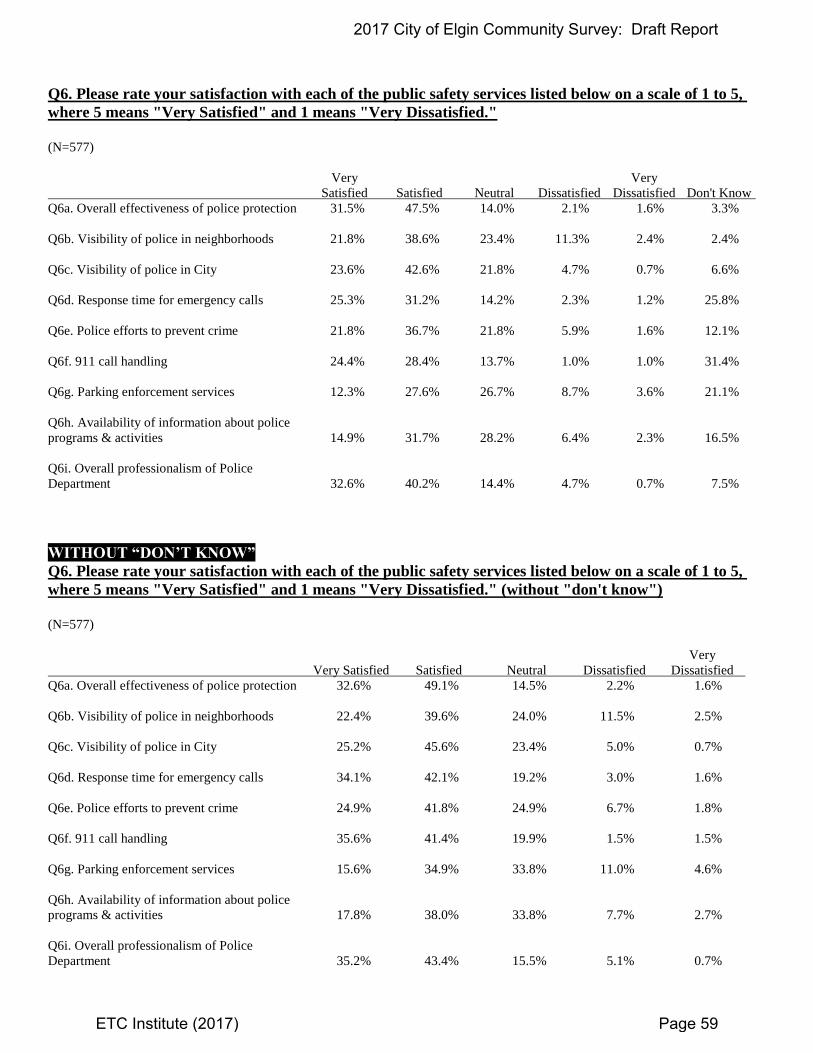
Q6. Please rate your satisfaction with each of the public safety services listed below on a scale of 1 to 5,
where 5 means "Very Satisfied" and 1 means "Very Dissatisfied."
(N=577)
Very Very
Satisfied Satisfied Neutral Dissatisfied Dissatisfied Don't Know
Q6a. Overall effectiveness of police protection 31.5% 47.5% 14.0% 2.1% 1.6% 3.3%
Q6b. Visibility of police in neighborhoods 21.8% 38.6% 23.4% 11.3% 2.4% 2.4%
Q6c. Visibility of police in City 23.6% 42.6% 21.8% 4.7% 0.7% 6.6%
Q6d. Response time for emergency calls 25.3% 31.2% 14.2% 2.3% 1.2% 25.8%
Q6e. Police efforts to prevent crime 21.8% 36.7% 21.8% 5.9% 1.6% 12.1%
Q6f. 911 call handling 24.4% 28.4% 13.7% 1.0% 1.0% 31.4%
Q6g. Parking enforcement services 12.3% 27.6% 26.7% 8.7% 3.6% 21.1%
Q6h. Availability of information about police
programs & activities 14.9% 31.7% 28.2% 6.4% 2.3% 16.5%
Q6i. Overall professionalism of Police
Department 32.6% 40.2% 14.4% 4.7% 0.7% 7.5%
WITHOUT “DON’T KNOW”
Q6. Please rate your satisfaction with each of the public safety services listed below on a scale of 1 to 5,
where 5 means "Very Satisfied" and 1 means "Very Dissatisfied." (without "don't know")
(N=577)
Very
Very Satisfied Satisfied Neutral Dissatisfied Dissatisfied
Q6a. Overall effectiveness of police protection 32.6% 49.1% 14.5% 2.2% 1.6%
Q6b. Visibility of police in neighborhoods 22.4% 39.6% 24.0% 11.5% 2.5%
Q6c. Visibility of police in City 25.2% 45.6% 23.4% 5.0% 0.7%
Q6d. Response time for emergency calls 34.1% 42.1% 19.2% 3.0% 1.6%
Q6e. Police efforts to prevent crime 24.9% 41.8% 24.9% 6.7% 1.8%
Q6f. 911 call handling 35.6% 41.4% 19.9% 1.5% 1.5%
Q6g. Parking enforcement services 15.6% 34.9% 33.8% 11.0% 4.6%
Q6h. Availability of information about police
programs & activities 17.8% 38.0% 33.8% 7.7% 2.7%
Q6i. Overall professionalism of Police
Department 35.2% 43.4% 15.5% 5.1% 0.7%
2017 City of Elgin Community Survey: Draft Report
ETC Institute (2017) Page 59

Q7. Which THREE of the public safety items listed in Question 6 do you think should receive the MOST
EMPHASIS from City leaders over the next TWO years?
Q7. Top choice Number Percent
Overall effectiveness of police protection 79 13.7 %
Visibility of police in neighborhoods 151 26.2 %
Visibility of police in City 30 5.2 %
Response time for emergency calls 19 3.3 %
Police efforts to prevent crime 101 17.5 %
911 call handling 6 1.0 %
Parking enforcement services 38 6.6 %
Availability of information about police programs & activities 25 4.3 %
Overall professionalism of Police Department 18 3.1 %
None chosen 110 19.1 %
Total 577 100.0 %
Q7. Which THREE of the public safety items listed in Question 6 do you think should receive the MOST
EMPHASIS from City leaders over the next TWO years?
Q7. 2nd choice Number Percent
Overall effectiveness of police protection 36 6.2 %
Visibility of police in neighborhoods 85 14.7 %
Visibility of police in City 71 12.3 %
Response time for emergency calls 41 7.1 %
Police efforts to prevent crime 103 17.9 %
911 call handling 19 3.3 %
Parking enforcement services 29 5.0 %
Availability of information about police programs & activities 43 7.5 %
Overall professionalism of Police Department 16 2.8 %
None chosen 134 23.2 %
Total 577 100.0 %
2017 City of Elgin Community Survey: Draft Report
ETC Institute (2017) Page 60
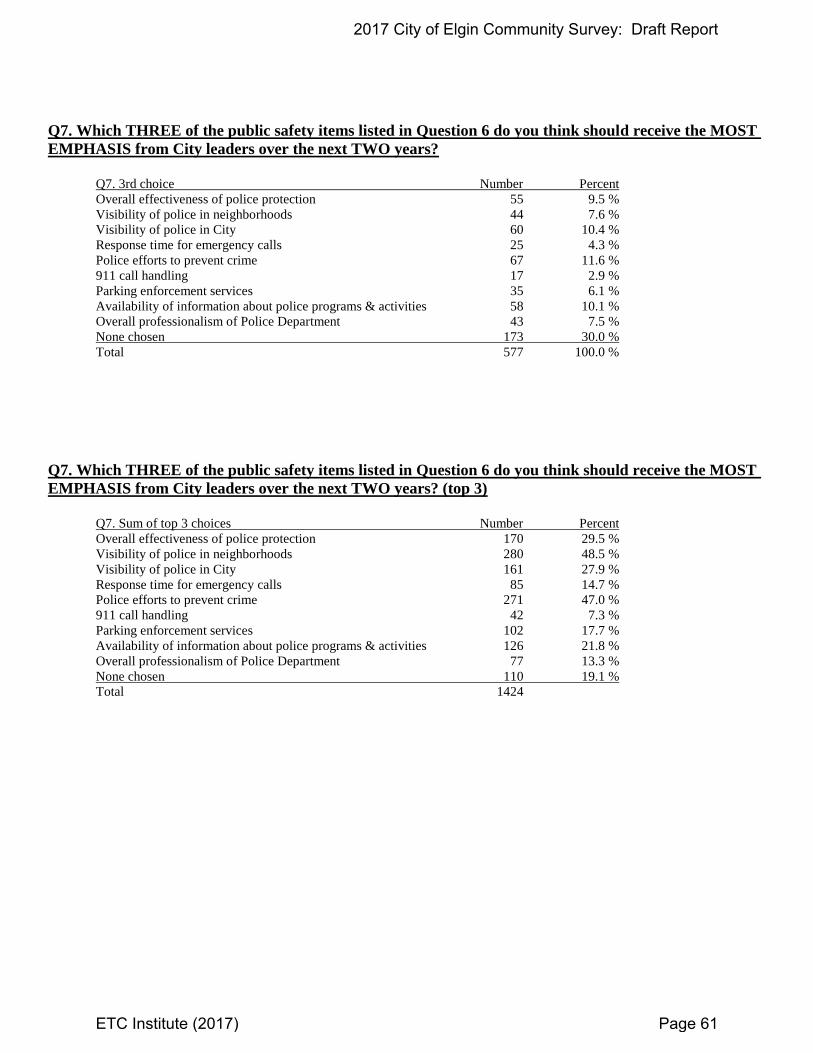
Q7. Which THREE of the public safety items listed in Question 6 do you think should receive the MOST
EMPHASIS from City leaders over the next TWO years?
Q7. 3rd choice Number Percent
Overall effectiveness of police protection 55 9.5 %
Visibility of police in neighborhoods 44 7.6 %
Visibility of police in City 60 10.4 %
Response time for emergency calls 25 4.3 %
Police efforts to prevent crime 67 11.6 %
911 call handling 17 2.9 %
Parking enforcement services 35 6.1 %
Availability of information about police programs & activities 58 10.1 %
Overall professionalism of Police Department 43 7.5 %
None chosen 173 30.0 %
Total 577 100.0 %
Q7. Which THREE of the public safety items listed in Question 6 do you think should receive the MOST
EMPHASIS from City leaders over the next TWO years? (top 3)
Q7. Sum of top 3 choices Number Percent
Overall effectiveness of police protection 170 29.5 %
Visibility of police in neighborhoods 280 48.5 %
Visibility of police in City 161 27.9 %
Response time for emergency calls 85 14.7 %
Police efforts to prevent crime 271 47.0 %
911 call handling 42 7.3 %
Parking enforcement services 102 17.7 %
Availability of information about police programs & activities 126 21.8 %
Overall professionalism of Police Department 77 13.3 %
None chosen 110 19.1 %
Total 1424
2017 City of Elgin Community Survey: Draft Report
ETC Institute (2017) Page 61
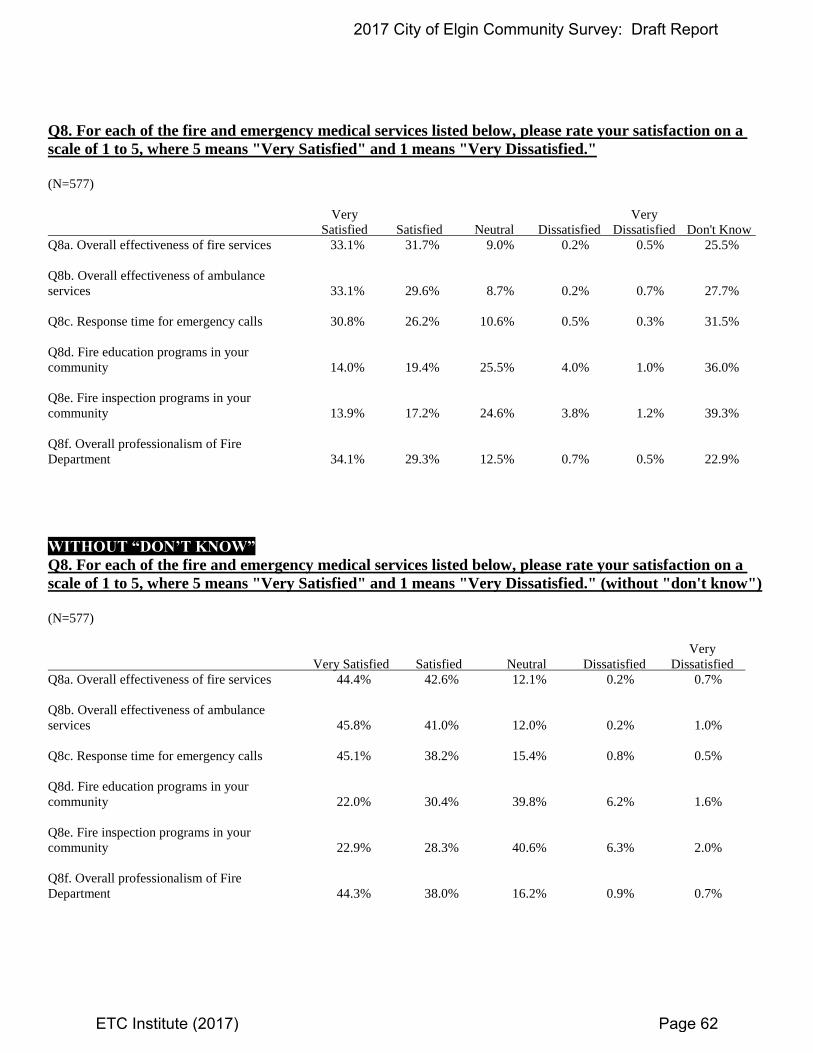
Q8. For each of the fire and emergency medical services listed below, please rate your satisfaction on a
scale of 1 to 5, where 5 means "Very Satisfied" and 1 means "Very Dissatisfied."
(N=577)
Very Very
Satisfied Satisfied Neutral Dissatisfied Dissatisfied Don't Know
Q8a. Overall effectiveness of fire services 33.1% 31.7% 9.0% 0.2% 0.5% 25.5%
Q8b. Overall effectiveness of ambulance
services 33.1% 29.6% 8.7% 0.2% 0.7% 27.7%
Q8c. Response time for emergency calls 30.8% 26.2% 10.6% 0.5% 0.3% 31.5%
Q8d. Fire education programs in your
community 14.0% 19.4% 25.5% 4.0% 1.0% 36.0%
Q8e. Fire inspection programs in your
community 13.9% 17.2% 24.6% 3.8% 1.2% 39.3%
Q8f. Overall professionalism of Fire
Department 34.1% 29.3% 12.5% 0.7% 0.5% 22.9%
WITHOUT “DON’T KNOW”
Q8. For each of the fire and emergency medical services listed below, please rate your satisfaction on a
scale of 1 to 5, where 5 means "Very Satisfied" and 1 means "Very Dissatisfied." (without "don't know")
(N=577)
Very
Very Satisfied Satisfied Neutral Dissatisfied Dissatisfied
Q8a. Overall effectiveness of fire services 44.4% 42.6% 12.1% 0.2% 0.7%
Q8b. Overall effectiveness of ambulance
services 45.8% 41.0% 12.0% 0.2% 1.0%
Q8c. Response time for emergency calls 45.1% 38.2% 15.4% 0.8% 0.5%
Q8d. Fire education programs in your
community 22.0% 30.4% 39.8% 6.2% 1.6%
Q8e. Fire inspection programs in your
community 22.9% 28.3% 40.6% 6.3% 2.0%
Q8f. Overall professionalism of Fire
Department 44.3% 38.0% 16.2% 0.9% 0.7%
2017 City of Elgin Community Survey: Draft Report
ETC Institute (2017) Page 62
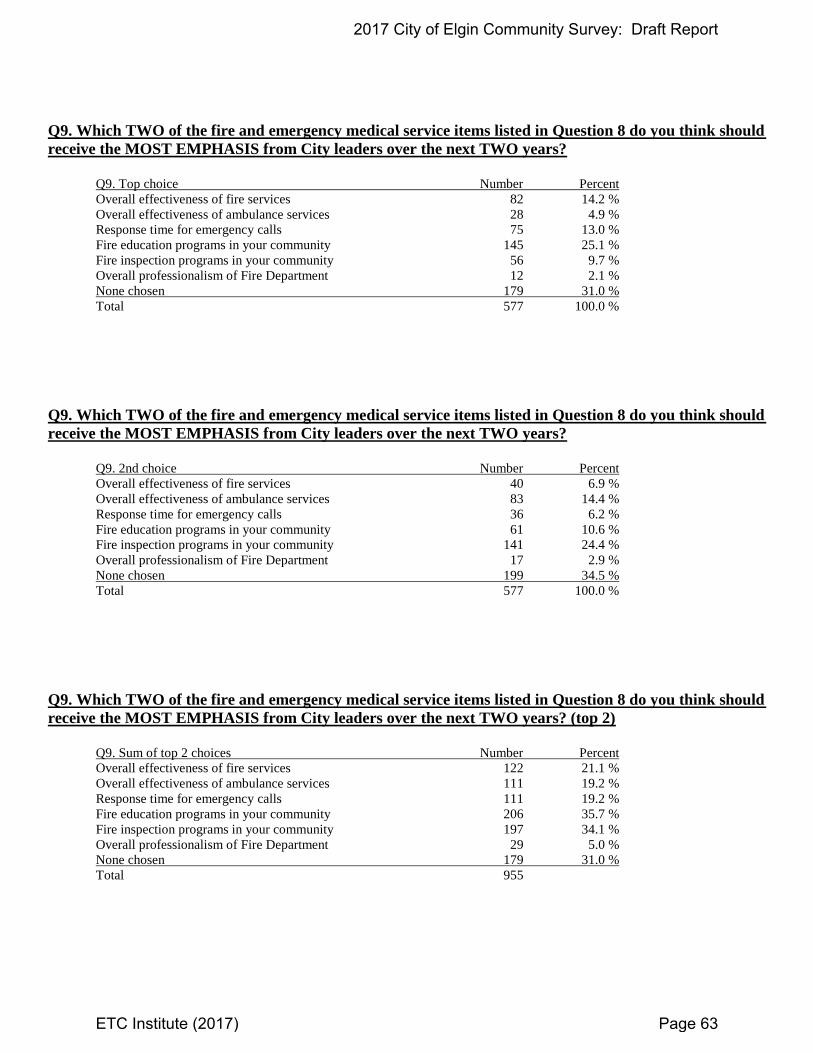
Q9. Which TWO of the fire and emergency medical service items listed in Question 8 do you think should
receive the MOST EMPHASIS from City leaders over the next TWO years?
Q9. Top choice Number Percent
Overall effectiveness of fire services 82 14.2 %
Overall effectiveness of ambulance services 28 4.9 %
Response time for emergency calls 75 13.0 %
Fire education programs in your community 145 25.1 %
Fire inspection programs in your community 56 9.7 %
Overall professionalism of Fire Department 12 2.1 %
None chosen 179 31.0 %
Total 577 100.0 %
Q9. Which TWO of the fire and emergency medical service items listed in Question 8 do you think should
receive the MOST EMPHASIS from City leaders over the next TWO years?
Q9. 2nd choice Number Percent
Overall effectiveness of fire services 40 6.9 %
Overall effectiveness of ambulance services 83 14.4 %
Response time for emergency calls 36 6.2 %
Fire education programs in your community 61 10.6 %
Fire inspection programs in your community 141 24.4 %
Overall professionalism of Fire Department 17 2.9 %
None chosen 199 34.5 %
Total 577 100.0 %
Q9. Which TWO of the fire and emergency medical service items listed in Question 8 do you think should
receive the MOST EMPHASIS from City leaders over the next TWO years? (top 2)
Q9. Sum of top 2 choices Number Percent
Overall effectiveness of fire services 122 21.1 %
Overall effectiveness of ambulance services 111 19.2 %
Response time for emergency calls 111 19.2 %
Fire education programs in your community 206 35.7 %
Fire inspection programs in your community 197 34.1 %
Overall professionalism of Fire Department 29 5.0 %
None chosen 179 31.0 %
Total 955
2017 City of Elgin Community Survey: Draft Report
ETC Institute (2017) Page 63

Q10. For each of the maintenance services listed below, please rate your satisfaction on a scale of 1 to 5,
where 5 means "Very Satisfied" and 1 means "Very Dissatisfied."
(N=577)
Very Very
Satisfied Satisfied Neutral Dissatisfied Dissatisfied Don't Know
Q10a. Condition of major City streets 10.7% 46.4% 23.4% 13.5% 4.3% 1.6%
Q10b. Condition of neighborhood streets 8.5% 40.6% 23.7% 19.8% 6.4% 1.0%
Q10c. Condition of City sidewalks & bikeways 10.7% 46.1% 22.5% 10.4% 4.2% 6.1%
Q10d. Maintenance of street signs,
pavements & markings 13.0% 47.8% 23.6% 11.1% 2.1% 2.4%
Q10e. Maintenance & cleanliness of
Downtown Elgin 17.7% 42.8% 26.2% 6.1% 1.2% 6.1%
Q10f. Maintenance & cleanliness of your
neighborhood 20.1% 47.1% 19.2% 8.8% 3.5% 1.2%
Q10g. Adequacy of street lighting in your
neighborhood 18.5% 39.9% 20.8% 14.7% 4.9% 1.2%
Q10h. Snow removal on major City streets
(not including Randall Road, Route 20, Route
25, Route 31) 21.1% 48.0% 17.7% 8.0% 2.8% 2.4%
Q10i. Snow removal on residential streets 16.6% 39.7% 20.6% 13.5% 7.3% 2.3%
Q10j. Leaf removal or collection program 20.6% 38.5% 19.1% 10.7% 4.2% 6.9%
Q10k. Mowing & tree trimming along streets &
other public areas 14.2% 41.2% 24.6% 10.9% 3.3% 5.7%
Q10l. Overall cleanliness of streets & other
public areas 15.1% 48.4% 24.8% 7.1% 2.6% 2.1%
Q10m. On-street bicycle infrastructure (bike
lanes/signs) 12.0% 32.2% 27.7% 8.7% 3.5% 15.9%
Q10n. Condition of street drainage/water
drainage 10.4% 43.8% 26.9% 9.9% 4.5% 4.5%
2017 City of Elgin Community Survey: Draft Report
ETC Institute (2017) Page 64
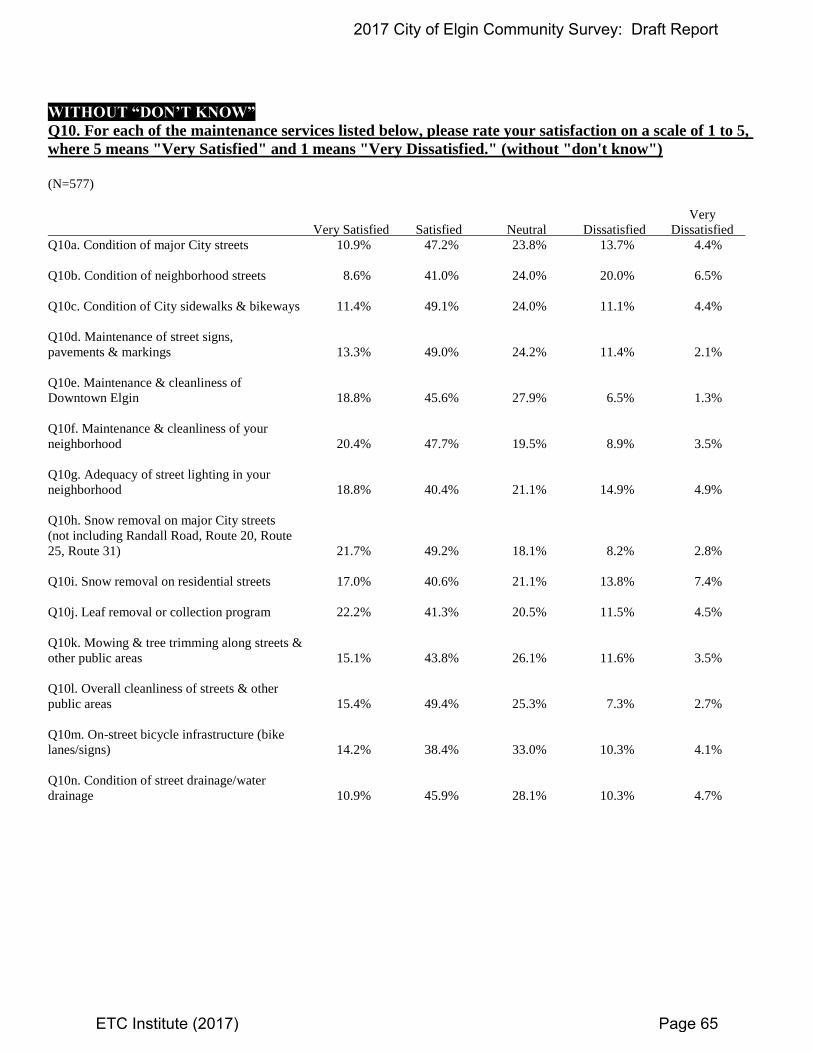
WITHOUT “DON’T KNOW”
Q10. For each of the maintenance services listed below, please rate your satisfaction on a scale of 1 to 5,
where 5 means "Very Satisfied" and 1 means "Very Dissatisfied." (without "don't know")
(N=577)
Very
Very Satisfied Satisfied Neutral Dissatisfied Dissatisfied
Q10a. Condition of major City streets 10.9% 47.2% 23.8% 13.7% 4.4%
Q10b. Condition of neighborhood streets 8.6% 41.0% 24.0% 20.0% 6.5%
Q10c. Condition of City sidewalks & bikeways 11.4% 49.1% 24.0% 11.1% 4.4%
Q10d. Maintenance of street signs,
pavements & markings 13.3% 49.0% 24.2% 11.4% 2.1%
Q10e. Maintenance & cleanliness of
Downtown Elgin 18.8% 45.6% 27.9% 6.5% 1.3%
Q10f. Maintenance & cleanliness of your
neighborhood 20.4% 47.7% 19.5% 8.9% 3.5%
Q10g. Adequacy of street lighting in your
neighborhood 18.8% 40.4% 21.1% 14.9% 4.9%
Q10h. Snow removal on major City streets
(not including Randall Road, Route 20, Route
25, Route 31) 21.7% 49.2% 18.1% 8.2% 2.8%
Q10i. Snow removal on residential streets 17.0% 40.6% 21.1% 13.8% 7.4%
Q10j. Leaf removal or collection program 22.2% 41.3% 20.5% 11.5% 4.5%
Q10k. Mowing & tree trimming along streets &
other public areas 15.1% 43.8% 26.1% 11.6% 3.5%
Q10l. Overall cleanliness of streets & other
public areas 15.4% 49.4% 25.3% 7.3% 2.7%
Q10m. On-street bicycle infrastructure (bike
lanes/signs) 14.2% 38.4% 33.0% 10.3% 4.1%
Q10n. Condition of street drainage/water
drainage 10.9% 45.9% 28.1% 10.3% 4.7%
2017 City of Elgin Community Survey: Draft Report
ETC Institute (2017) Page 65

Q11. Which FOUR of the maintenance items listed in Question 10 do you think should receive the MOST
EMPHASIS from City leaders over the next TWO years?
Q11. Top choice Number Percent
Condition of major City streets 106 18.4 %
Condition of neighborhood streets 114 19.8 %
Condition of City sidewalks & bikeways 22 3.8 %
Maintenance of street signs, pavements & markings 14 2.4 %
Maintenance & cleanliness of Downtown Elgin 22 3.8 %
Maintenance & cleanliness of your neighborhood 24 4.2 %
Adequacy of street lighting in your neighborhood 41 7.1 %
Snow removal on major City streets (not including Randall
Road, Route 20, Route 25, Route 31) 14 2.4 %
Snow removal on residential streets 39 6.8 %
Leaf removal or collection program 17 2.9 %
Mowing & tree trimming along streets & other public areas 9 1.6 %
Overall cleanliness of streets & other public areas 8 1.4 %
On-street bicycle infrastructure (bike lanes/signs) 19 3.3 %
Condition of street drainage/water drainage 39 6.8 %
None chosen 89 15.4 %
Total 577 100.0 %
Q11. Which FOUR of the maintenance items listed in Question 10 do you think should receive the MOST
EMPHASIS from City leaders over the next TWO years?
Q11. 2nd choice Number Percent
Condition of major City streets 36 6.2 %
Condition of neighborhood streets 93 16.1 %
Condition of City sidewalks & bikeways 37 6.4 %
Maintenance of street signs, pavements & markings 19 3.3 %
Maintenance & cleanliness of Downtown Elgin 31 5.4 %
Maintenance & cleanliness of your neighborhood 35 6.1 %
Adequacy of street lighting in your neighborhood 34 5.9 %
Snow removal on major City streets (not including Randall
Road, Route 20, Route 25, Route 31) 36 6.2 %
Snow removal on residential streets 44 7.6 %
Leaf removal or collection program 23 4.0 %
Mowing & tree trimming along streets & other public areas 23 4.0 %
Overall cleanliness of streets & other public areas 29 5.0 %
On-street bicycle infrastructure (bike lanes/signs) 12 2.1 %
Condition of street drainage/water drainage 14 2.4 %
None chosen 111 19.2 %
Total 577 100.0 %
2017 City of Elgin Community Survey: Draft Report
ETC Institute (2017) Page 66
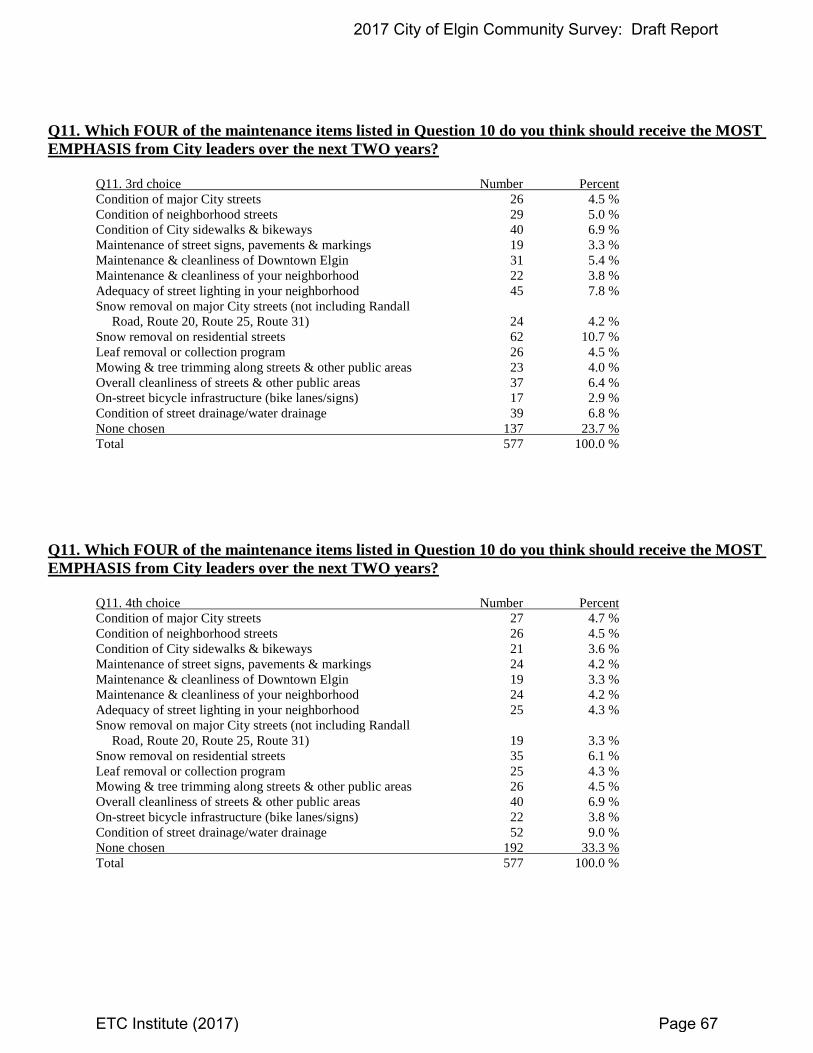
Q11. Which FOUR of the maintenance items listed in Question 10 do you think should receive the MOST
EMPHASIS from City leaders over the next TWO years?
Q11. 3rd choice Number Percent
Condition of major City streets 26 4.5 %
Condition of neighborhood streets 29 5.0 %
Condition of City sidewalks & bikeways 40 6.9 %
Maintenance of street signs, pavements & markings 19 3.3 %
Maintenance & cleanliness of Downtown Elgin 31 5.4 %
Maintenance & cleanliness of your neighborhood 22 3.8 %
Adequacy of street lighting in your neighborhood 45 7.8 %
Snow removal on major City streets (not including Randall
Road, Route 20, Route 25, Route 31) 24 4.2 %
Snow removal on residential streets 62 10.7 %
Leaf removal or collection program 26 4.5 %
Mowing & tree trimming along streets & other public areas 23 4.0 %
Overall cleanliness of streets & other public areas 37 6.4 %
On-street bicycle infrastructure (bike lanes/signs) 17 2.9 %
Condition of street drainage/water drainage 39 6.8 %
None chosen 137 23.7 %
Total 577 100.0 %
Q11. Which FOUR of the maintenance items listed in Question 10 do you think should receive the MOST
EMPHASIS from City leaders over the next TWO years?
Q11. 4th choice Number Percent
Condition of major City streets 27 4.7 %
Condition of neighborhood streets 26 4.5 %
Condition of City sidewalks & bikeways 21 3.6 %
Maintenance of street signs, pavements & markings 24 4.2 %
Maintenance & cleanliness of Downtown Elgin 19 3.3 %
Maintenance & cleanliness of your neighborhood 24 4.2 %
Adequacy of street lighting in your neighborhood 25 4.3 %
Snow removal on major City streets (not including Randall
Road, Route 20, Route 25, Route 31) 19 3.3 %
Snow removal on residential streets 35 6.1 %
Leaf removal or collection program 25 4.3 %
Mowing & tree trimming along streets & other public areas 26 4.5 %
Overall cleanliness of streets & other public areas 40 6.9 %
On-street bicycle infrastructure (bike lanes/signs) 22 3.8 %
Condition of street drainage/water drainage 52 9.0 %
None chosen 192 33.3 %
Total 577 100.0 %
2017 City of Elgin Community Survey: Draft Report
ETC Institute (2017) Page 67
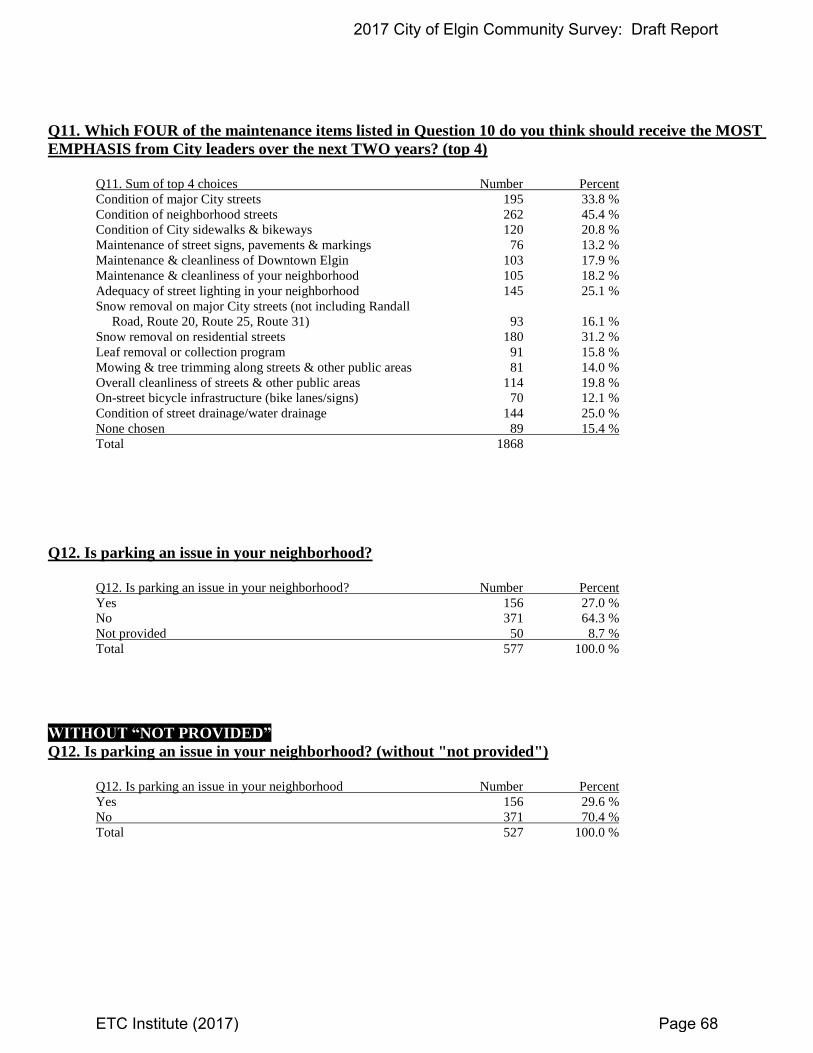
Q11. Which FOUR of the maintenance items listed in Question 10 do you think should receive the MOST
EMPHASIS from City leaders over the next TWO years? (top 4)
Q11. Sum of top 4 choices Number Percent
Condition of major City streets 195 33.8 %
Condition of neighborhood streets 262 45.4 %
Condition of City sidewalks & bikeways 120 20.8 %
Maintenance of street signs, pavements & markings 76 13.2 %
Maintenance & cleanliness of Downtown Elgin 103 17.9 %
Maintenance & cleanliness of your neighborhood 105 18.2 %
Adequacy of street lighting in your neighborhood 145 25.1 %
Snow removal on major City streets (not including Randall
Road, Route 20, Route 25, Route 31) 93 16.1 %
Snow removal on residential streets 180 31.2 %
Leaf removal or collection program 91 15.8 %
Mowing & tree trimming along streets & other public areas 81 14.0 %
Overall cleanliness of streets & other public areas 114 19.8 %
On-street bicycle infrastructure (bike lanes/signs) 70 12.1 %
Condition of street drainage/water drainage 144 25.0 %
None chosen 89 15.4 %
Total 1868
Q12. Is parking an issue in your neighborhood?
Q12. Is parking an issue in your neighborhood? Number Percent
Yes 156 27.0 %
No 371 64.3 %
Not provided 50 8.7 %
Total 577 100.0 %
WITHOUT “NOT PROVIDED”
Q12. Is parking an issue in your neighborhood? (without "not provided")
Q12. Is parking an issue in your neighborhood Number Percent
Yes 156 29.6 %
No 371 70.4 %
Total 527 100.0 %
2017 City of Elgin Community Survey: Draft Report
ETC Institute (2017) Page 68
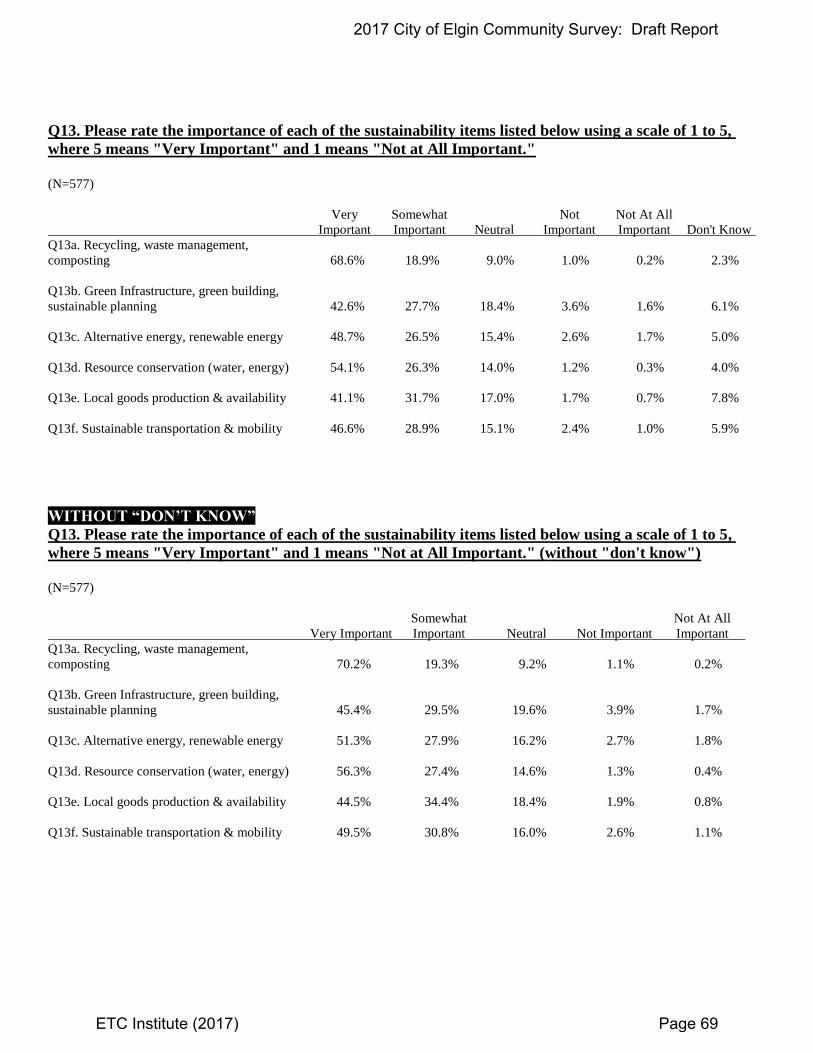
Q13. Please rate the importance of each of the sustainability items listed below using a scale of 1 to 5,
where 5 means "Very Important" and 1 means "Not at All Important."
(N=577)
Very Somewhat Not Not At All
Important Important Neutral Important Important Don't Know
Q13a. Recycling, waste management,
composting 68.6% 18.9% 9.0% 1.0% 0.2% 2.3%
Q13b. Green Infrastructure, green building,
sustainable planning 42.6% 27.7% 18.4% 3.6% 1.6% 6.1%
Q13c. Alternative energy, renewable energy 48.7% 26.5% 15.4% 2.6% 1.7% 5.0%
Q13d. Resource conservation (water, energy) 54.1% 26.3% 14.0% 1.2% 0.3% 4.0%
Q13e. Local goods production & availability 41.1% 31.7% 17.0% 1.7% 0.7% 7.8%
Q13f. Sustainable transportation & mobility 46.6% 28.9% 15.1% 2.4% 1.0% 5.9%
WITHOUT “DON’T KNOW”
Q13. Please rate the importance of each of the sustainability items listed below using a scale of 1 to 5,
where 5 means "Very Important" and 1 means "Not at All Important." (without "don't know")
(N=577)
Somewhat Not At All
Very Important Important Neutral Not Important Important
Q13a. Recycling, waste management,
composting 70.2% 19.3% 9.2% 1.1% 0.2%
Q13b. Green Infrastructure, green building,
sustainable planning 45.4% 29.5% 19.6% 3.9% 1.7%
Q13c. Alternative energy, renewable energy 51.3% 27.9% 16.2% 2.7% 1.8%
Q13d. Resource conservation (water, energy) 56.3% 27.4% 14.6% 1.3% 0.4%
Q13e. Local goods production & availability 44.5% 34.4% 18.4% 1.9% 0.8%
Q13f. Sustainable transportation & mobility 49.5% 30.8% 16.0% 2.6% 1.1%
2017 City of Elgin Community Survey: Draft Report
ETC Institute (2017) Page 69

Q14. Which TWO of the sustainability items listed in Question 13 do you think should receive the MOST
EMPHASIS from City leaders over the next TWO years?
Q14. Top choice Number Percent
Recycling, waste management, composting 194 33.6 %
Green Infrastructure, green building, sustainable planning 49 8.5 %
Alternative energy, renewable energy 80 13.9 %
Resource conservation (water, energy) 47 8.1 %
Local goods production & availability 46 8.0 %
Sustainable transportation & mobility 56 9.7 %
None chosen 105 18.2 %
Total 577 100.0 %
Q14. Which TWO of the sustainability items listed in Question 13 do you think should receive the MOST
EMPHASIS from City leaders over the next TWO years?
Q14. 2nd choice Number Percent
Recycling, waste management, composting 60 10.4 %
Green Infrastructure, green building, sustainable planning 77 13.3 %
Alternative energy, renewable energy 98 17.0 %
Resource conservation (water, energy) 94 16.3 %
Local goods production & availability 59 10.2 %
Sustainable transportation & mobility 59 10.2 %
None chosen 130 22.5 %
Total 577 100.0 %
Q14. Which TWO of the sustainability items listed in Question 13 do you think should receive the MOST
EMPHASIS from City leaders over the next TWO years? (top 2)
Q14. Sum of top 2 choices Number Percent
Recycling, waste management, composting 254 44.0 %
Green Infrastructure, green building, sustainable planning 126 21.8 %
Alternative energy, renewable energy 178 30.8 %
Resource conservation (water, energy) 141 24.4 %
Local goods production & availability 105 18.2 %
Sustainable transportation & mobility 115 19.9 %
None chosen 105 18.2 %
Total 1024
2017 City of Elgin Community Survey: Draft Report
ETC Institute (2017) Page 70

Q15. For each of the water utility services listed below, please rate your satisfaction on a scale of 1 to 5,
where 5 means "Very Satisfied" and 1 means "Very Dissatisfied."
(N=577)
Very
Very Satisfied Satisfied Neutral Dissatisfied Dissatisfied Don't Know
Q15a. Water pressure on a
typical day 44.5% 40.7% 6.8% 5.4% 1.4% 1.2%
Q15b. Overall quality of your tap
water 30.0% 35.9% 18.5% 9.2% 3.6% 2.8%
Q15c. Ease of paying water bill 40.6% 38.1% 11.6% 3.8% 1.7% 4.2%
Q15d. Overall quality of water
service 35.0% 42.5% 15.1% 3.6% 1.7% 2.1%
WITHOUT “DON’T KNOW”
Q15. For each of the water utility services listed below, please rate your satisfaction on a scale of 1 to 5,
where 5 means "Very Satisfied" and 1 means "Very Dissatisfied." (without "don't know")
(N=577)
Very
Very Satisfied Satisfied Neutral Dissatisfied Dissatisfied
Q15a. Water pressure on a typical day 45.1% 41.2% 6.8% 5.4% 1.4%
Q15b. Overall quality of your tap water 30.8% 36.9% 19.1% 9.4% 3.7%
Q15c. Ease of paying water bill 42.3% 39.8% 12.1% 4.0% 1.8%
Q15d. Overall quality of water service 35.8% 43.4% 15.4% 3.7% 1.8%
2017 City of Elgin Community Survey: Draft Report
ETC Institute (2017) Page 71
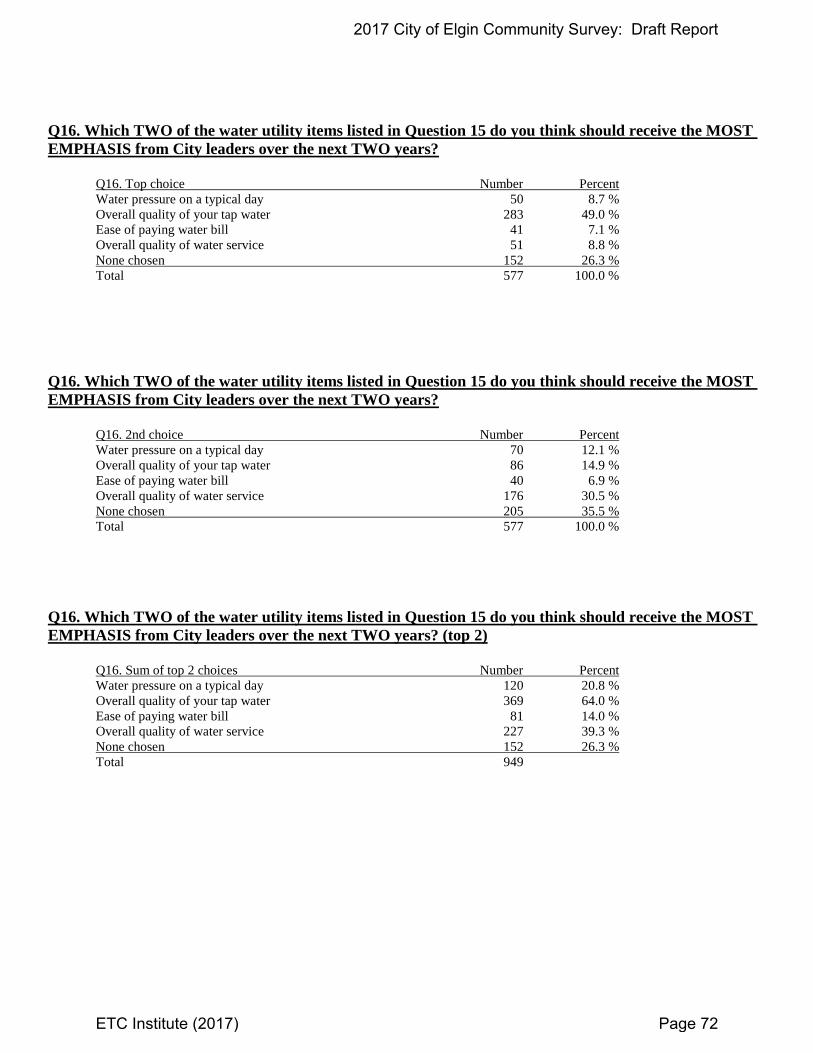
Q16. Which TWO of the water utility items listed in Question 15 do you think should receive the MOST
EMPHASIS from City leaders over the next TWO years?
Q16. Top choice Number Percent
Water pressure on a typical day 50 8.7 %
Overall quality of your tap water 283 49.0 %
Ease of paying water bill 41 7.1 %
Overall quality of water service 51 8.8 %
None chosen 152 26.3 %
Total 577 100.0 %
Q16. Which TWO of the water utility items listed in Question 15 do you think should receive the MOST
EMPHASIS from City leaders over the next TWO years?
Q16. 2nd choice Number Percent
Water pressure on a typical day 70 12.1 %
Overall quality of your tap water 86 14.9 %
Ease of paying water bill 40 6.9 %
Overall quality of water service 176 30.5 %
None chosen 205 35.5 %
Total 577 100.0 %
Q16. Which TWO of the water utility items listed in Question 15 do you think should receive the MOST
EMPHASIS from City leaders over the next TWO years? (top 2)
Q16. Sum of top 2 choices Number Percent
Water pressure on a typical day 120 20.8 %
Overall quality of your tap water 369 64.0 %
Ease of paying water bill 81 14.0 %
Overall quality of water service 227 39.3 %
None chosen 152 26.3 %
Total 949
2017 City of Elgin Community Survey: Draft Report
ETC Institute (2017) Page 72

Q17a-f. For each of the parks and recreation services listed below, please rate your satisfaction on a scale
of 1 to 5, where 5 means "Very Satisfied" and 1 means "Very Dissatisfied." (Parks)
(N=577)
Very Very
Satisfied Satisfied Neutral Dissatisfied Dissatisfied Don't Know
Q17a. Maintenance of parks 19.1% 48.2% 17.9% 4.5% 0.7% 9.7%
Q17b. Number of parks in Elgin 19.8% 46.4% 17.9% 5.2% 1.6% 9.2%
Q17c. Quality of park facilities, such as picnic
shelters, playgrounds, & tennis courts 15.8% 41.8% 23.7% 5.9% 0.9% 12.0%
Q17d. Quality of outdoor athletic fields (i.e.
baseball, soccer, football) 17.0% 36.0% 22.9% 3.3% 1.0% 19.8%
Q17e. Quality of walking & biking trails 17.2% 39.9% 21.1% 5.9% 1.7% 14.2%
Q17f. Number of walking/biking trails 13.3% 33.1% 24.6% 11.3% 2.4% 15.3%
WITHOUT “DON’T KNOW”
Q17a-f. For each of the parks and recreation services listed below, please rate your satisfaction on a scale
of 1 to 5, where 5 means "Very Satisfied" and 1 means "Very Dissatisfied." (Parks) (without "don't
know")
(N=577)
Very
Very Satisfied Satisfied Neutral Dissatisfied Dissatisfied
Q17a. Maintenance of parks 21.1% 53.4% 19.8% 5.0% 0.8%
Q17b. Number of parks in Elgin 21.8% 51.1% 19.7% 5.7% 1.7%
Q17c. Quality of park facilities, such as picnic
shelters, playgrounds, & tennis courts 17.9% 47.4% 27.0% 6.7% 1.0%
Q17d. Quality of outdoor athletic fields (i.e.
baseball, soccer, football) 21.2% 44.9% 28.5% 4.1% 1.3%
Q17e. Quality of walking & biking trails 20.0% 46.5% 24.6% 6.9% 2.0%
Q17f. Number of walking/biking trails 15.7% 39.1% 29.0% 13.3% 2.9%
2017 City of Elgin Community Survey: Draft Report
ETC Institute (2017) Page 73

Q17g-k. For each of the parks and recreation services listed below, please rate your satisfaction on a scale
of 1 to 5, where 5 means "Very Satisfied" and 1 means "Very Dissatisfied." (Recreation)
(N=577)
Very Very
Satisfied Satisfied Neutral Dissatisfied Dissatisfied Don't Know
Q17g. Overall quality of recreation facilities 17.0% 42.1% 21.3% 3.6% 0.9% 15.1%
Q17h. Maintenance & appearance of The
Centre 29.1% 38.1% 14.4% 2.4% 0.5% 15.4%
Q17i. Maintenance & appearance of the
Eastside Recreation Center 11.3% 23.1% 20.1% 1.9% 1.0% 42.6%
Q17j. Indoor pools at The Centre 18.5% 31.9% 15.1% 3.3% 1.0% 30.2%
Q17k. Golf courses 14.2% 22.0% 19.2% 0.5% 0.7% 43.3%
WITHOUT “DON’T KNOW”
Q17g-k. For each of the parks and recreation services listed below, please rate your satisfaction on a scale
of 1 to 5, where 5 means "Very Satisfied" and 1 means "Very Dissatisfied." (Recreation) (without "don't
know")
(N=577)
Very
Very Satisfied Satisfied Neutral Dissatisfied Dissatisfied
Q17g. Overall quality of recreation facilities 20.0% 49.6% 25.1% 4.3% 1.0%
Q17h. Maintenance & appearance of The
Centre 34.4% 45.1% 17.0% 2.9% 0.6%
Q17i. Maintenance & appearance of the
Eastside Recreation Center 19.6% 40.2% 35.0% 3.3% 1.8%
Q17j. Indoor pools at The Centre 26.6% 45.7% 21.6% 4.7% 1.5%
Q17k. Golf courses 25.1% 38.8% 33.9% 0.9% 1.2%
2017 City of Elgin Community Survey: Draft Report
ETC Institute (2017) Page 74
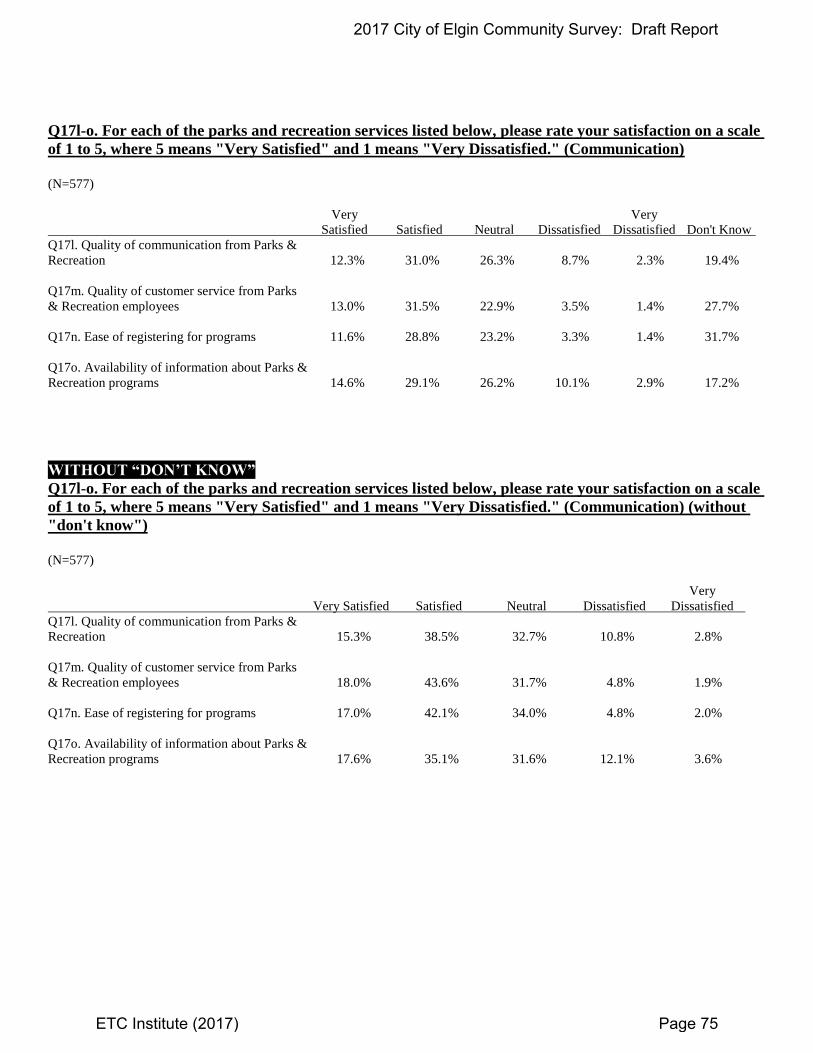
Q17l-o. For each of the parks and recreation services listed below, please rate your satisfaction on a scale
of 1 to 5, where 5 means "Very Satisfied" and 1 means "Very Dissatisfied." (Communication)
(N=577)
Very Very
Satisfied Satisfied Neutral Dissatisfied Dissatisfied Don't Know
Q17l. Quality of communication from Parks &
Recreation 12.3% 31.0% 26.3% 8.7% 2.3% 19.4%
Q17m. Quality of customer service from Parks
& Recreation employees 13.0% 31.5% 22.9% 3.5% 1.4% 27.7%
Q17n. Ease of registering for programs 11.6% 28.8% 23.2% 3.3% 1.4% 31.7%
Q17o. Availability of information about Parks &
Recreation programs 14.6% 29.1% 26.2% 10.1% 2.9% 17.2%
WITHOUT “DON’T KNOW”
Q17l-o. For each of the parks and recreation services listed below, please rate your satisfaction on a scale
of 1 to 5, where 5 means "Very Satisfied" and 1 means "Very Dissatisfied." (Communication) (without
"don't know")
(N=577)
Very
Very Satisfied Satisfied Neutral Dissatisfied Dissatisfied
Q17l. Quality of communication from Parks &
Recreation 15.3% 38.5% 32.7% 10.8% 2.8%
Q17m. Quality of customer service from Parks
& Recreation employees 18.0% 43.6% 31.7% 4.8% 1.9%
Q17n. Ease of registering for programs 17.0% 42.1% 34.0% 4.8% 2.0%
Q17o. Availability of information about Parks &
Recreation programs 17.6% 35.1% 31.6% 12.1% 3.6%
2017 City of Elgin Community Survey: Draft Report
ETC Institute (2017) Page 75

Q18. Which FOUR of the parks and recreation items listed in Question 17 do you think should receive
the MOST EMPHASIS from City leaders over the next TWO years?
Q18. Top choice Number Percent
Maintenance of parks 105 18.2 %
Number of parks in Elgin 33 5.7 %
Quality of park facilities, such as picnic shelters, playgrounds, &
tennis courts 51 8.8 %
Quality of outdoor athletic fields (i.e. baseball, soccer, football) 19 3.3 %
Quality of walking & biking trails 29 5.0 %
Number of walking/biking trails 37 6.4 %
Overall quality of recreation facilities 13 2.3 %
Maintenance & appearance of The Centre 18 3.1 %
Maintenance & appearance of the Eastside Recreation Center 6 1.0 %
Indoor pools at The Centre 6 1.0 %
Golf courses 2 0.3 %
Quality of communication from Parks & Recreation 31 5.4 %
Quality of customer service from Parks & Recreation employees 13 2.3 %
Ease of registering for programs 12 2.1 %
Availability of information about Parks & Recreation programs 34 5.9 %
None chosen 168 29.1 %
Total 577 100.0 %
Q18. Which FOUR of the parks and recreation items listed in Question 17 do you think should receive
the MOST EMPHASIS from City leaders over the next TWO years?
Q18. 2nd choice Number Percent
Maintenance of parks 32 5.5 %
Number of parks in Elgin 23 4.0 %
Quality of park facilities, such as picnic shelters, playgrounds, &
tennis courts 67 11.6 %
Quality of outdoor athletic fields (i.e. baseball, soccer, football) 22 3.8 %
Quality of walking & biking trails 39 6.8 %
Number of walking/biking trails 32 5.5 %
Overall quality of recreation facilities 24 4.2 %
Maintenance & appearance of The Centre 15 2.6 %
Maintenance & appearance of the Eastside Recreation Center 10 1.7 %
Indoor pools at The Centre 10 1.7 %
Golf courses 3 0.5 %
Quality of communication from Parks & Recreation 36 6.2 %
Quality of customer service from Parks & Recreation employees 18 3.1 %
Ease of registering for programs 15 2.6 %
Availability of information about Parks & Recreation programs 39 6.8 %
None chosen 192 33.3 %
Total 577 100.0 %
2017 City of Elgin Community Survey: Draft Report
ETC Institute (2017) Page 76
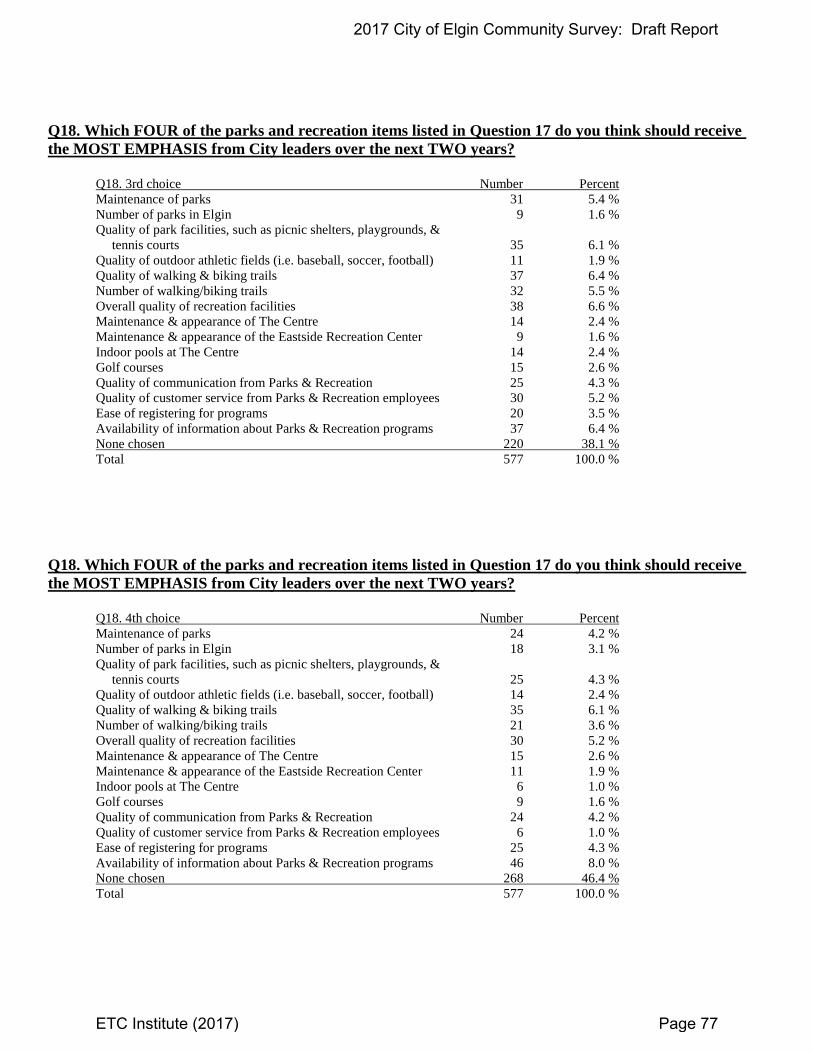
Q18. Which FOUR of the parks and recreation items listed in Question 17 do you think should receive
the MOST EMPHASIS from City leaders over the next TWO years?
Q18. 3rd choice Number Percent
Maintenance of parks 31 5.4 %
Number of parks in Elgin 9 1.6 %
Quality of park facilities, such as picnic shelters, playgrounds, &
tennis courts 35 6.1 %
Quality of outdoor athletic fields (i.e. baseball, soccer, football) 11 1.9 %
Quality of walking & biking trails 37 6.4 %
Number of walking/biking trails 32 5.5 %
Overall quality of recreation facilities 38 6.6 %
Maintenance & appearance of The Centre 14 2.4 %
Maintenance & appearance of the Eastside Recreation Center 9 1.6 %
Indoor pools at The Centre 14 2.4 %
Golf courses 15 2.6 %
Quality of communication from Parks & Recreation 25 4.3 %
Quality of customer service from Parks & Recreation employees 30 5.2 %
Ease of registering for programs 20 3.5 %
Availability of information about Parks & Recreation programs 37 6.4 %
None chosen 220 38.1 %
Total 577 100.0 %
Q18. Which FOUR of the parks and recreation items listed in Question 17 do you think should receive
the MOST EMPHASIS from City leaders over the next TWO years?
Q18. 4th choice Number Percent
Maintenance of parks 24 4.2 %
Number of parks in Elgin 18 3.1 %
Quality of park facilities, such as picnic shelters, playgrounds, &
tennis courts 25 4.3 %
Quality of outdoor athletic fields (i.e. baseball, soccer, football) 14 2.4 %
Quality of walking & biking trails 35 6.1 %
Number of walking/biking trails 21 3.6 %
Overall quality of recreation facilities 30 5.2 %
Maintenance & appearance of The Centre 15 2.6 %
Maintenance & appearance of the Eastside Recreation Center 11 1.9 %
Indoor pools at The Centre 6 1.0 %
Golf courses 9 1.6 %
Quality of communication from Parks & Recreation 24 4.2 %
Quality of customer service from Parks & Recreation employees 6 1.0 %
Ease of registering for programs 25 4.3 %
Availability of information about Parks & Recreation programs 46 8.0 %
None chosen 268 46.4 %
Total 577 100.0 %
2017 City of Elgin Community Survey: Draft Report
ETC Institute (2017) Page 77

Q18. Which FOUR of the parks and recreation items listed in Question 17 do you think should receive
the MOST EMPHASIS from City leaders over the next TWO years? (top 4)
Q18. Sum of top 4 choices Number Percent
Maintenance of parks 192 33.3 %
Number of parks in Elgin 83 14.4 %
Quality of park facilities, such as picnic shelters, playgrounds, &
tennis courts 178 30.8 %
Quality of outdoor athletic fields (i.e. baseball, soccer, football) 66 11.4 %
Quality of walking & biking trails 140 24.3 %
Number of walking/biking trails 122 21.1 %
Overall quality of recreation facilities 105 18.2 %
Maintenance & appearance of The Centre 62 10.7 %
Maintenance & appearance of the Eastside Recreation Center 36 6.2 %
Indoor pools at The Centre 36 6.2 %
Golf courses 29 5.0 %
Quality of communication from Parks & Recreation 116 20.1 %
Quality of customer service from Parks & Recreation employees 67 11.6 %
Ease of registering for programs 72 12.5 %
Availability of information about Parks & Recreation programs 156 27.0 %
None chosen 168 29.1 %
Total 1628
2017 City of Elgin Community Survey: Draft Report
ETC Institute (2017) Page 78

Q19. For each of the code enforcement services listed below, please rate your satisfaction on a scale of 1
to 5, where 5 means "Very Satisfied" and 1 means "Very Dissatisfied."
(N=577)
Very Very
Satisfied Satisfied Neutral Dissatisfied Dissatisfied Don't Know
Q19a. Overall effectiveness of Code
Enforcement 9.5% 30.2% 25.6% 12.0% 5.9% 16.8%
Q19b. Overall effectiveness of
communication from Code Enforcement 9.5% 23.1% 28.6% 11.6% 5.9% 21.3%
Q19c. Enforcing clean-up of trash & debris on
private property 9.5% 22.5% 25.1% 18.4% 9.4% 15.1%
Q19d. Enforcing mowing & cutting of weeds on
private property 9.4% 21.7% 29.3% 16.8% 6.8% 16.1%
Q19e. Enforcing exterior maintenance of
residential property (e.g. condition of
buildings) 7.8% 22.5% 28.1% 17.2% 9.0% 15.4%
Q19f. Enforcing exterior maintenance of
commercial/business property 8.7% 24.4% 29.6% 10.9% 4.9% 21.5%
WITHOUT “DON’T KNOW”
Q19. For each of the code enforcement services listed below, please rate your satisfaction on a scale of 1
to 5, where 5 means "Very Satisfied" and 1 means "Very Dissatisfied." (without "don't know")
(N=577)
Very
Very Satisfied Satisfied Neutral Dissatisfied Dissatisfied
Q19a. Overall effectiveness of Code
Enforcement 11.5% 36.3% 30.8% 14.4% 7.1%
Q19b. Overall effectiveness of
communication from Code Enforcement 12.1% 29.3% 36.3% 14.8% 7.5%
Q19c. Enforcing clean-up of trash & debris on
private property 11.2% 26.5% 29.6% 21.6% 11.0%
Q19d. Enforcing mowing & cutting of weeds on
private property 11.2% 25.8% 34.9% 20.0% 8.1%
Q19e. Enforcing exterior maintenance of
residential property (e.g. condition of
buildings) 9.2% 26.6% 33.2% 20.3% 10.7%
Q19f. Enforcing exterior maintenance of
commercial/business property 11.0% 31.1% 37.7% 13.9% 6.2%
2017 City of Elgin Community Survey: Draft Report
ETC Institute (2017) Page 79

Q20. Which TWO of the code enforcement items listed in Question 19 do you think should receive the
MOST EMPHASIS from City leaders over the next TWO years?
Q20. Top choice Number Percent
Overall effectiveness of Code Enforcement 104 18.0 %
Overall effectiveness of communication from Code Enforcement 42 7.3 %
Enforcing clean-up of trash & debris on private property 124 21.5 %
Enforcing mowing & cutting of weeds on private property 46 8.0 %
Enforcing exterior maintenance of residential property (e.g.
condition of buildings) 65 11.3 %
Enforcing exterior maintenance of commercial/business
property 29 5.0 %
None chosen 167 28.9 %
Total 577 100.0 %
Q20. Which TWO of the code enforcement items listed in Question 19 do you think should receive the
MOST EMPHASIS from City leaders over the next TWO years?
Q20. 2nd choice Number Percent
Overall effectiveness of Code Enforcement 33 5.7 %
Overall effectiveness of communication from Code Enforcement 53 9.2 %
Enforcing clean-up of trash & debris on private property 80 13.9 %
Enforcing mowing & cutting of weeds on private property 76 13.2 %
Enforcing exterior maintenance of residential property (e.g.
condition of buildings) 88 15.3 %
Enforcing exterior maintenance of commercial/business
property 60 10.4 %
None chosen 187 32.4 %
Total 577 100.0 %
Q20. Which TWO of the code enforcement items listed in Question 19 do you think should receive the
MOST EMPHASIS from City leaders over the next TWO years? (top 2)
Q20. Sum of top 2 choices Number Percent
Overall effectiveness of Code Enforcement 137 23.7 %
Overall effectiveness of communication from Code Enforcement 95 16.5 %
Enforcing clean-up of trash & debris on private property 204 35.4 %
Enforcing mowing & cutting of weeds on private property 122 21.1 %
Enforcing exterior maintenance of residential property (e.g.
condition of buildings) 153 26.5 %
Enforcing exterior maintenance of commercial/business
property 89 15.4 %
None chosen 167 28.9 %
Total 967
2017 City of Elgin Community Survey: Draft Report
ETC Institute (2017) Page 80
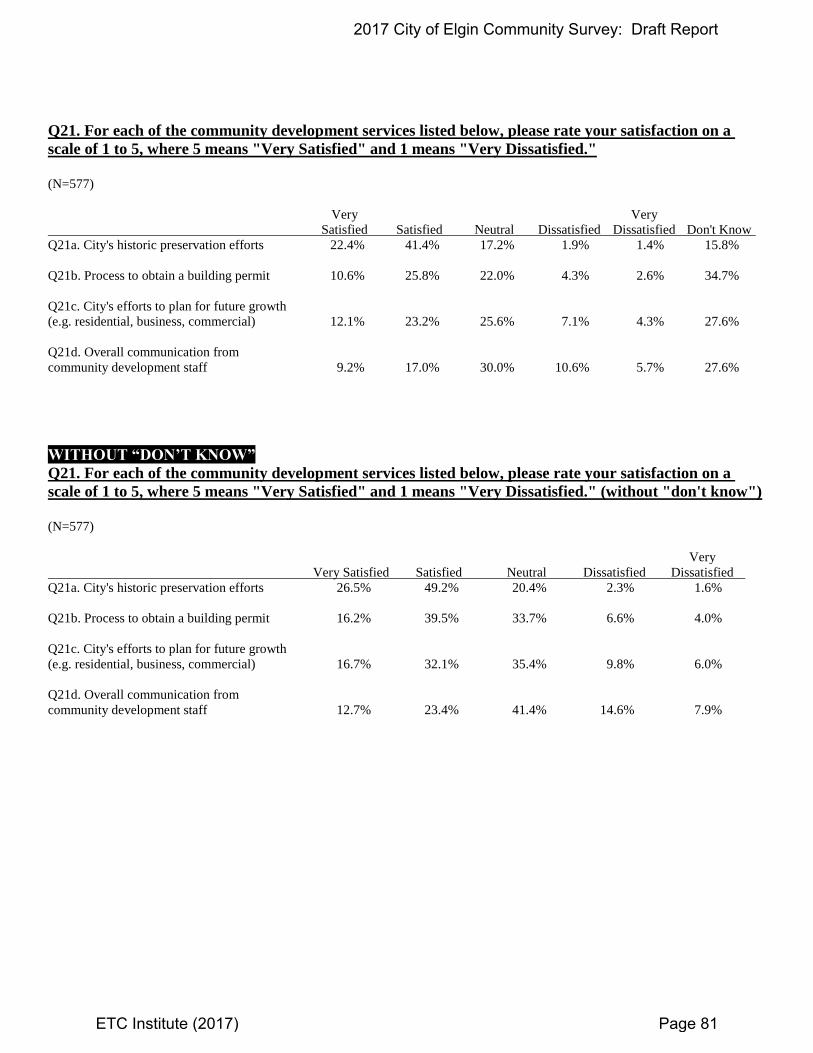
Q21. For each of the community development services listed below, please rate your satisfaction on a
scale of 1 to 5, where 5 means "Very Satisfied" and 1 means "Very Dissatisfied."
(N=577)
Very Very
Satisfied Satisfied Neutral Dissatisfied Dissatisfied Don't Know
Q21a. City's historic preservation efforts 22.4% 41.4% 17.2% 1.9% 1.4% 15.8%
Q21b. Process to obtain a building permit 10.6% 25.8% 22.0% 4.3% 2.6% 34.7%
Q21c. City's efforts to plan for future growth
(e.g. residential, business, commercial) 12.1% 23.2% 25.6% 7.1% 4.3% 27.6%
Q21d. Overall communication from
community development staff 9.2% 17.0% 30.0% 10.6% 5.7% 27.6%
WITHOUT “DON’T KNOW”
Q21. For each of the community development services listed below, please rate your satisfaction on a
scale of 1 to 5, where 5 means "Very Satisfied" and 1 means "Very Dissatisfied." (without "don't know")
(N=577)
Very
Very Satisfied Satisfied Neutral Dissatisfied Dissatisfied
Q21a. City's historic preservation efforts 26.5% 49.2% 20.4% 2.3% 1.6%
Q21b. Process to obtain a building permit 16.2% 39.5% 33.7% 6.6% 4.0%
Q21c. City's efforts to plan for future growth
(e.g. residential, business, commercial) 16.7% 32.1% 35.4% 9.8% 6.0%
Q21d. Overall communication from
community development staff 12.7% 23.4% 41.4% 14.6% 7.9%
2017 City of Elgin Community Survey: Draft Report
ETC Institute (2017) Page 81
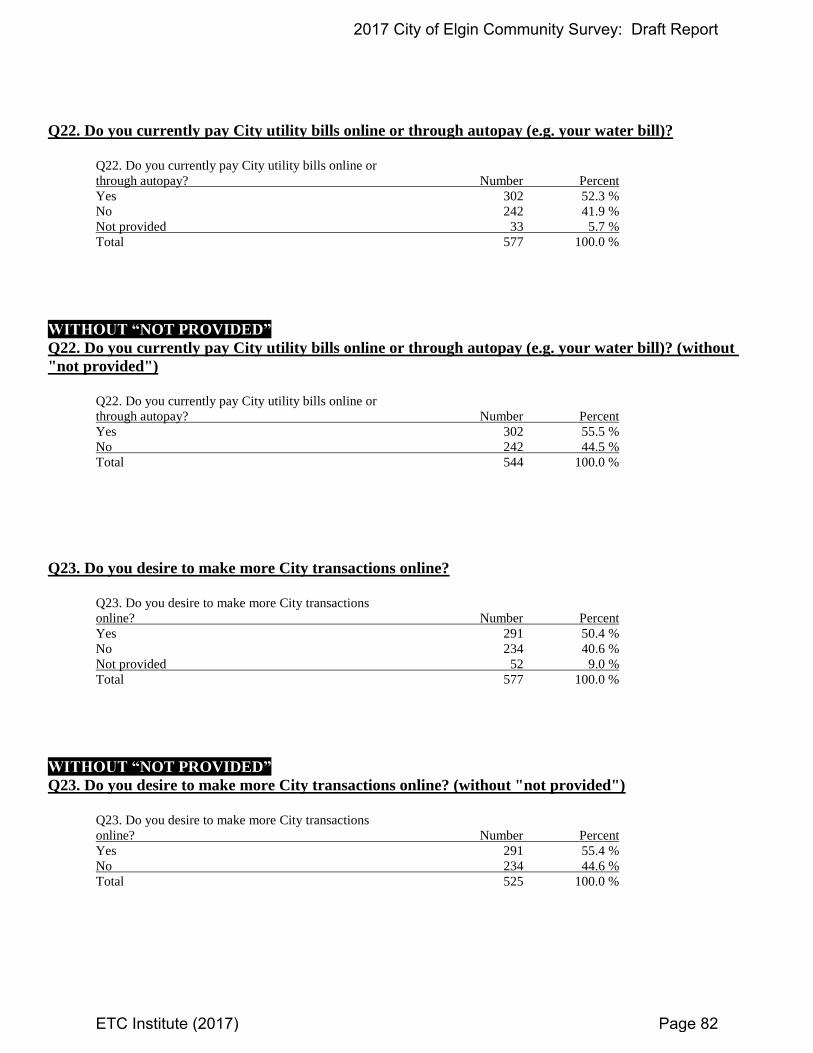
Q22. Do you currently pay City utility bills online or through autopay (e.g. your water bill)?
Q22. Do you currently pay City utility bills online or
through autopay? Number Percent
Yes 302 52.3 %
No 242 41.9 %
Not provided 33 5.7 %
Total 577 100.0 %
WITHOUT “NOT PROVIDED”
Q22. Do you currently pay City utility bills online or through autopay (e.g. your water bill)? (without
"not provided")
Q22. Do you currently pay City utility bills online or
through autopay? Number Percent
Yes 302 55.5 %
No 242 44.5 %
Total 544 100.0 %
Q23. Do you desire to make more City transactions online?
Q23. Do you desire to make more City transactions
online? Number Percent
Yes 291 50.4 %
No 234 40.6 %
Not provided 52 9.0 %
Total 577 100.0 %
WITHOUT “NOT PROVIDED”
Q23. Do you desire to make more City transactions online? (without "not provided")
Q23. Do you desire to make more City transactions
online? Number Percent
Yes 291 55.4 %
No 234 44.6 %
Total 525 100.0 %
2017 City of Elgin Community Survey: Draft Report
ETC Institute (2017) Page 82

Q24. For each of the City events and programs listed below, please rate your satisfaction on a scale of 1 to
5, where 5 means "Very Satisfied" and 1 means "Very Dissatisfied."
(N=577)
Very Very
Satisfied Satisfied Neutral Dissatisfied Dissatisfied Don't Know
Q24a. Opportunities to attend festivals/events 23.6% 43.3% 18.4% 5.4% 1.7% 7.6%
Q24b. Opportunities to attend cultural arts
programs 21.0% 40.6% 20.3% 4.5% 1.2% 12.5%
Q24c. Ability to find information about
upcoming City events 17.9% 35.2% 21.5% 13.3% 4.5% 7.6%
WITHOUT “DON’T KNOW”
Q24. For each of the City events and programs listed below, please rate your satisfaction on a scale of 1 to
5, where 5 means "Very Satisfied" and 1 means "Very Dissatisfied." (without "don't know")
(N=577)
Very
Very Satisfied Satisfied Neutral Dissatisfied Dissatisfied
Q24a. Opportunities to attend festivals/events 25.5% 46.9% 19.9% 5.8% 1.9%
Q24b. Opportunities to attend cultural arts
programs 24.0% 46.3% 23.2% 5.1% 1.4%
Q24c. Ability to find information about
upcoming City events 19.3% 38.1% 23.3% 14.4% 4.9%
2017 City of Elgin Community Survey: Draft Report
ETC Institute (2017) Page 83

Q25. For each of the public information and engagement items listed below, please rate your satisfaction
on a scale of 1 to 5, where 5 means "Very Satisfied" and 1 means "Very Dissatisfied."
(N=577)
Very Very
Satisfied Satisfied Neutral Dissatisfied Dissatisfied Don't Know
Q25a. Availability of public information 14.2% 35.7% 28.1% 11.1% 2.9% 8.0%
Q25b. Accessibility of public information 14.4% 33.6% 30.2% 10.1% 2.4% 9.4%
Q25c. Your ability to provide feedback to City 12.7% 22.7% 29.6% 12.3% 5.0% 17.7%
Q25d. Your ability to volunteer/serve (City
commissions, task forces, committees, etc.) 9.4% 21.7% 30.8% 7.3% 2.1% 28.8%
WITHOUT “DON’T KNOW”
Q25. For each of the public information and engagement items listed below, please rate your satisfaction
on a scale of 1 to 5, where 5 means "Very Satisfied" and 1 means "Very Dissatisfied." (without "don't
know")
(N=577)
Very
Very Satisfied Satisfied Neutral Dissatisfied Dissatisfied
Q25a. Availability of public information 15.4% 38.8% 30.5% 12.1% 3.2%
Q25b. Accessibility of public information 15.9% 37.1% 33.3% 11.1% 2.7%
Q25c. Your ability to provide feedback to City 15.4% 27.6% 36.0% 14.9% 6.1%
Q25d. Your ability to volunteer/serve (City
commissions, task forces, committees, etc.) 13.1% 30.4% 43.3% 10.2% 2.9%
2017 City of Elgin Community Survey: Draft Report
ETC Institute (2017) Page 84

Q26. Which of the following sources do you use to gather information about the City of Elgin?
Q26. What sources do you use to gather information
about City of Elgin? Number Percent
City of Elgin website (www.cityofelgin.org) 371 66.0 %
311 Contact Center 78 13.9 %
311 Mobile App 86 15.3 %
Social media (Facebook, Twitter, Instagram) 242 43.1 %
Local newspapers 251 44.7 %
Elgin Neighbor Newsletter 237 42.2 %
Direct mail (e.g. postcards or newsletter) 207 36.8 %
Word of mouth (friends, family, co-workers, etc.) 310 55.2 %
Other 28 5.0 %
Total 1810
Q26. Other
Q26. Other Number Percent
Library 5 18.5 %
TV 3 11.1 %
Email 3 11.1 %
cable television, public library 1 3.7 %
Elgin chamber 1 3.7 %
What's happening Elgin Facebook page 1 3.7 %
Whole city is a trash heap 1 3.7 %
city employed 1 3.7 %
Gifford Park Association 1 3.7 %
BRAVO MAGAZINE 1 3.7 %
NEIGHBORS 1 3.7 %
Posters 1 3.7 %
Del Webb Edgewater subdivision communication 1 3.7 %
Newspaper website 1 3.7 %
The mayor's sister 1 3.7 %
Elgin Roadblocks Facebook page 1 3.7 %
Library and Centre signs 1 3.7 %
At venues or online 1 3.7 %
ONLINE NEWSLETTER 1 3.7 %
Total 27 100.0 %
2017 City of Elgin Community Survey: Draft Report
ETC Institute (2017) Page 85
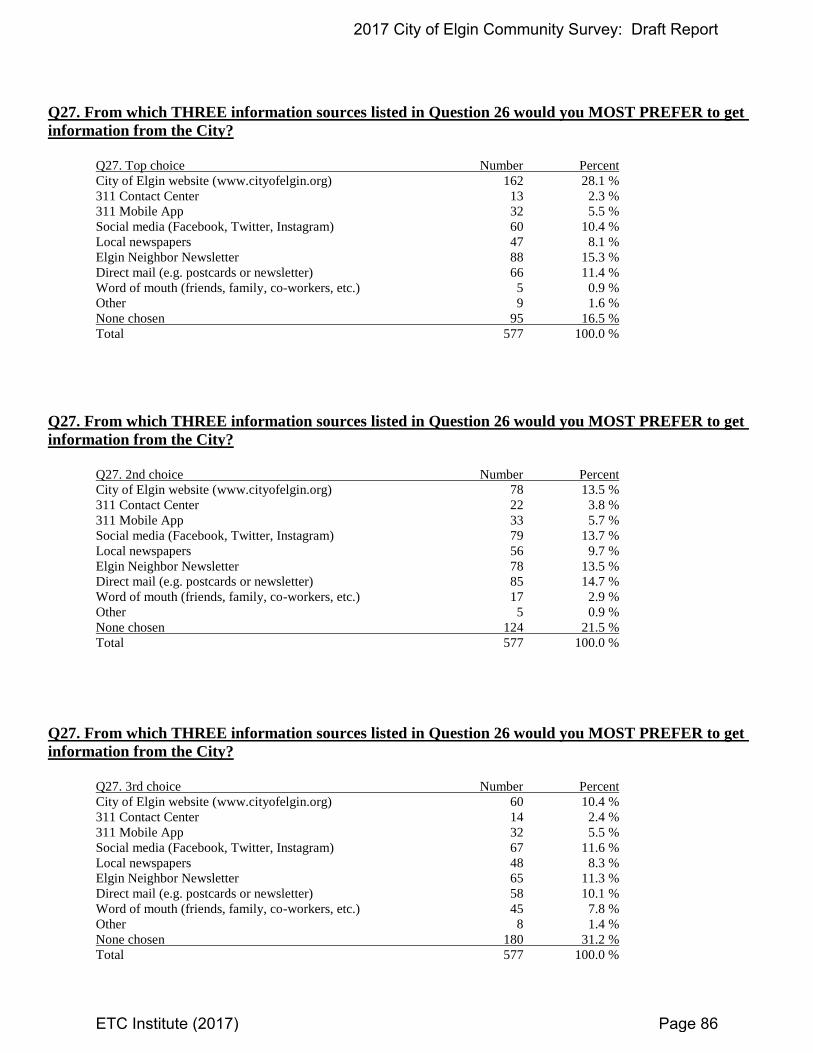
Q27. From which THREE information sources listed in Question 26 would you MOST PREFER to get
information from the City?
Q27. Top choice Number Percent
City of Elgin website (www.cityofelgin.org) 162 28.1 %
311 Contact Center 13 2.3 %
311 Mobile App 32 5.5 %
Social media (Facebook, Twitter, Instagram) 60 10.4 %
Local newspapers 47 8.1 %
Elgin Neighbor Newsletter 88 15.3 %
Direct mail (e.g. postcards or newsletter) 66 11.4 %
Word of mouth (friends, family, co-workers, etc.) 5 0.9 %
Other 9 1.6 %
None chosen 95 16.5 %
Total 577 100.0 %
Q27. From which THREE information sources listed in Question 26 would you MOST PREFER to get
information from the City?
Q27. 2nd choice Number Percent
City of Elgin website (www.cityofelgin.org) 78 13.5 %
311 Contact Center 22 3.8 %
311 Mobile App 33 5.7 %
Social media (Facebook, Twitter, Instagram) 79 13.7 %
Local newspapers 56 9.7 %
Elgin Neighbor Newsletter 78 13.5 %
Direct mail (e.g. postcards or newsletter) 85 14.7 %
Word of mouth (friends, family, co-workers, etc.) 17 2.9 %
Other 5 0.9 %
None chosen 124 21.5 %
Total 577 100.0 %
Q27. From which THREE information sources listed in Question 26 would you MOST PREFER to get
information from the City?
Q27. 3rd choice Number Percent
City of Elgin website (www.cityofelgin.org) 60 10.4 %
311 Contact Center 14 2.4 %
311 Mobile App 32 5.5 %
Social media (Facebook, Twitter, Instagram) 67 11.6 %
Local newspapers 48 8.3 %
Elgin Neighbor Newsletter 65 11.3 %
Direct mail (e.g. postcards or newsletter) 58 10.1 %
Word of mouth (friends, family, co-workers, etc.) 45 7.8 %
Other 8 1.4 %
None chosen 180 31.2 %
Total 577 100.0 %
2017 City of Elgin Community Survey: Draft Report
ETC Institute (2017) Page 86

Q27. From which THREE information sources listed in Question 26 would you MOST PREFER to get
information from the City? (top 3)
Q27. Sum of top 3 choices Number Percent
City of Elgin website (www.cityofelgin.org) 300 52.0 %
311 Contact Center 49 8.5 %
311 Mobile App 97 16.8 %
Social media (Facebook, Twitter, Instagram) 206 35.7 %
Local newspapers 151 26.2 %
Elgin Neighbor Newsletter 231 40.0 %
Direct mail (e.g. postcards or newsletter) 209 36.2 %
Word of mouth (friends, family, co-workers, etc.) 67 11.6 %
Other 22 3.8 %
None chosen 95 16.5 %
Total 1427
Q28. About how often, if at all, do you talk to or visit with your immediate neighbors (people who live in
the 10 - 20 households that are closest to you)?
Q28. How often do you talk to or visit with your
immediate neighbors? Number Percent
Almost everyday 89 15.4 %
Several times a week 162 28.1 %
Several times a month 126 21.8 %
Less than several times a month 177 30.7 %
Not provided 23 4.0 %
Total 577 100.0 %
WITHOUT “NOT PROVIDED”
Q28. About how often, if at all, do you talk to or visit with your immediate neighbors (people who live in
the 10 - 20 households that are closest to you)? (without "not provided")
Q28. How often do you talk to or visit with your
immediate neighbors? Number Percent
Almost everyday 89 16.1 %
Several times a week 162 29.2 %
Several times a month 126 22.7 %
Less than several times a month 177 31.9 %
Total 554 100.0 %
2017 City of Elgin Community Survey: Draft Report
ETC Institute (2017) Page 87

Q29. Are you satisfied with the process to report non-emergency problems (e.g. potholes) to the City?
Q29. Are you satisfied with process to report non-
emergency problems to City? Number Percent
Yes 253 43.8 %
No 78 13.5 %
Don't know 246 42.6 %
Total 577 100.0 %
WITHOUT “DON’T KNOW”
Q29. Are you satisfied with the process to report non-emergency problems (e.g. potholes) to the City?
(without "don't know")
Q29. Are you satisfied with process to report non-
emergency problems to City? Number Percent
Yes 253 76.4 %
No 78 23.6 %
Total 331 100.0 %
Q30. What would be your MOST PREFERRED method for reporting problems to the City?
Q30. Your most preferred method for reporting problems
to City? Number Percent
Mobile application 85 14.7 %
Website 81 14.0 %
Email 68 11.8 %
Social media 13 2.3 %
Phone call 286 49.6 %
In person to City staff member 31 5.4 %
Not provided 13 2.3 %
Total 577 100.0 %
WITHOUT “NOT PROVIDED”
Q30. What would be your MOST PREFERRED method for reporting problems to the City? (without
"not provided")
Q30. Your most preferred method for reporting problems
to City? Number Percent
Mobile application 85 15.1 %
Website 81 14.4 %
Email 68 12.1 %
Social media 13 2.3 %
Phone call 286 50.7 %
In person to City staff member 31 5.5 %
Total 564 100.0 %
2017 City of Elgin Community Survey: Draft Report
ETC Institute (2017) Page 88

Q31. Which THREE of the following sources would you MOST LIKELY use to find employment
opportunities in the Elgin area?
Q31. What sources would you most likely use to find
employment opportunities in Elgin area? Number Percent
City of Elgin website (www.cityofelgin.org) 280 54.9 %
LinkedIn 100 19.6 %
Local newspapers 121 23.7 %
Social media (Facebook, Twitter, Instagram) 93 18.2 %
Referrals from friends, family 199 39.0 %
Professional associations 84 16.5 %
Online employment search engines (Indeed, Career Builder,
Monster) 268 52.5 %
Unemployment office 60 11.8 %
Local college or university 21 4.1 %
Public library 62 12.2 %
Other 8 1.6 %
Total 1296
Q31. Other
Q31. Other Number Percent
AUTOMATED PHONE CALL 1 12.5 %
Hospital websites 1 12.5 %
Walk-In 1 12.5 %
see advertisement for self 1 12.5 %
professional employment agency 1 12.5 %
stores 1 12.5 %
Chamber of Commerce 1 12.5 %
GO TO THE BUSINESS IN PERSON 1 12.5 %
Total 8 100.0 %
2017 City of Elgin Community Survey: Draft Report
ETC Institute (2017) Page 89

Q32. Have you visited Downtown Elgin to eat at a restaurant in the last 12 months?
Q32. Have you visited Downtown Elgin to eat at a
restaurant in last 12 months? Number Percent
Yes 393 68.1 %
No 177 30.7 %
Not provided 7 1.2 %
Total 577 100.0 %
WITHOUT “NOT PROVIDED”
Q32. Have you visited Downtown Elgin to eat at a restaurant in the last 12 months? (without "not
provided")
Q32. Have you visited Downtown Elgin to eat at a
restaurant in last 12 months? Number Percent
Yes 393 68.9 %
No 177 31.1 %
Total 570 100.0 %
Q33. Have you visited Downtown Elgin to attend a special event in the last 12 months?
Q33. Have you visited Downtown Elgin to attend a
special event in last 12 months? Number Percent
Yes 341 59.1 %
No 229 39.7 %
Don't know 7 1.2 %
Total 577 100.0 %
WITHOUT “NOT PROVIDED”
Q33. Have you visited Downtown Elgin to attend a special event in the last 12 months? (without "not
provided”)
Q33. Have you visited Downtown Elgin to attend a
special event in last 12 months? Number Percent
Yes 341 59.8 %
No 229 40.2 %
Total 570 100.0 %
2017 City of Elgin Community Survey: Draft Report
ETC Institute (2017) Page 90

Q34. Have you visited Downtown Elgin to do business or had an appointment in the last 12 months?
Q34. Have you visited Downtown Elgin to do business
or had an appointment in last 12 months? Number Percent
Yes 257 44.5 %
No 314 54.4 %
Don't know 6 1.0 %
Total 577 100.0 %
WITHOUT “NOT PROVIDED”
Q34. Have you visited Downtown Elgin to do business or had an appointment in the last 12 months?
(without "not provided")
Q34. Have you visited Downtown Elgin to do business
or had an appointment in last 12 months? Number Percent
Yes 257 45.0 %
No 314 55.0 %
Total 571 100.0 %
Q35. Have you visited Downtown Elgin to attend a cultural/visual/performing arts program in the last 12
months?
Q35. Have you visited Downtown Elgin to attend a
cultural/visual/performing arts program in last 12 months? Number Percent
Yes 225 39.0 %
No 346 60.0 %
Don't know 6 1.0 %
Total 577 100.0 %
WITHOUT “NOT PROVIDED”
Q35. Have you visited Downtown Elgin to attend a cultural/visual/performing arts program in the last 12
months? (without "not provided")
Q35. Have you visited Downtown Elgin to attend a
cultural/visual/performing arts program in last 12 months? Number Percent
Yes 225 39.4 %
No 346 60.6 %
Total 571 100.0 %
2017 City of Elgin Community Survey: Draft Report
ETC Institute (2017) Page 91

Q36. Have you visited Downtown Elgin to recreate along the Fox River or Walton Island (e.g. fishing,
biking, walking, running) in the last 12 months?
Q36. Have you visited Downtown Elgin to recreate
along Fox River or Walton Island (e.g. fishing, biking,
walking, running) in last 12 months? Number Percent
Yes 284 49.2 %
No 285 49.4 %
Don't know 8 1.4 %
Total 577 100.0 %
WITHOUT “NOT PROVIDED”
Q36. Have you visited Downtown Elgin to recreate along the Fox River or Walton Island (e.g. fishing,
biking, walking, running) in the last 12 months? (without "not provided")
Q36. Have you visited Downtown Elgin to recreate
along Fox River or Walton Island (e.g. fishing, biking,
walking, running) in last 12 months? Number Percent
Yes 284 49.9 %
No 285 50.1 %
Total 569 100.0 %
WITHOUT “NOT PROVIDED”
Q37. Approximately how many years have you lived in Elgin?
Q37. How many years have you lived in Elgin? Number Percent
5 or less 71 12.4 %
6 to 10 76 13.3 %
11 to 15 83 14.5 %
16 to 20 60 10.5 %
21 to 30 127 22.2 %
31+ 154 27.0 %
Total 571 100.0 %
2017 City of Elgin Community Survey: Draft Report
ETC Institute (2017) Page 92
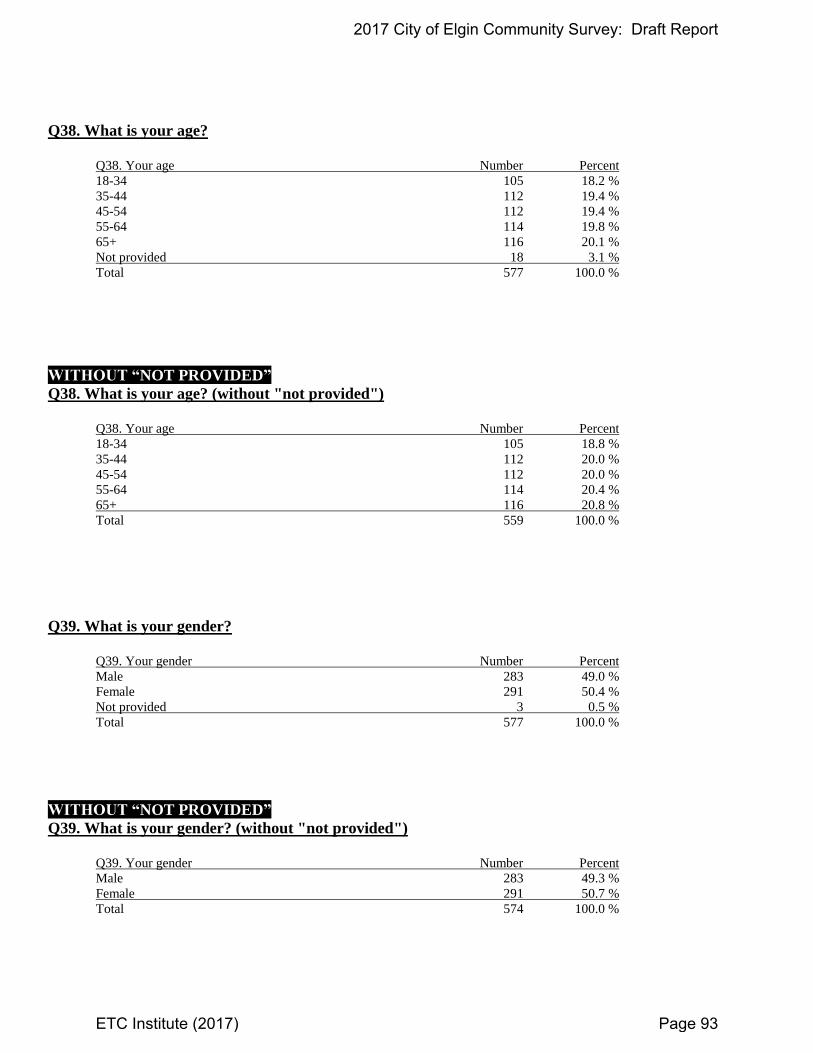
Q38. What is your age?
Q38. Your age Number Percent
18-34 105 18.2 %
35-44 112 19.4 %
45-54 112 19.4 %
55-64 114 19.8 %
65+ 116 20.1 %
Not provided 18 3.1 %
Total 577 100.0 %
WITHOUT “NOT PROVIDED”
Q38. What is your age? (without "not provided")
Q38. Your age Number Percent
18-34 105 18.8 %
35-44 112 20.0 %
45-54 112 20.0 %
55-64 114 20.4 %
65+ 116 20.8 %
Total 559 100.0 %
Q39. What is your gender?
Q39. Your gender Number Percent
Male 283 49.0 %
Female 291 50.4 %
Not provided 3 0.5 %
Total 577 100.0 %
WITHOUT “NOT PROVIDED”
Q39. What is your gender? (without "not provided")
Q39. Your gender Number Percent
Male 283 49.3 %
Female 291 50.7 %
Total 574 100.0 %
2017 City of Elgin Community Survey: Draft Report
ETC Institute (2017) Page 93

Q40. Which of the following best describes your housing situation?
Q40. What is your housing situation? Number Percent
Own 454 78.7 %
Rent 120 20.8 %
Not provided 3 0.5 %
Total 577 100.0 %
WITHOUT “NOT PROVIDED”
Q40. Which of the following best describes your housing situation? (without "not provided")
Q40. What is your housing situation? Number Percent
Own 454 79.1 %
Rent 120 20.9 %
Total 574 100.0 %
Q41. Which of the following best describes your race/ethnicity?
Q41. Your race/ethnicity Number Percent
African American/Black 40 7.0 %
Native American 11 1.9 %
Caucasian/White 364 63.4 %
Asian/Pacific Islander 28 4.9 %
Hispanic/Latino 248 43.2 %
Other 8 1.4 %
Total 699
Q41. Other
Q41. Other Number Percent
Mixed 4 50.0 %
Mexican American 2 25.0 %
Native American/Caucasian 1 12.5 %
ETHNIC AMERICAN 1 12.5 %
Total 8 100.0 %
2017 City of Elgin Community Survey: Draft Report
ETC Institute (2017) Page 94

Q42. Which of the following best describes your current employment status?
Q42. What is your current employment status? Number Percent
Employed in home/have home-based business 35 6.1 %
Employed outside home, in Elgin 124 21.5 %
Employed outside home, outside of Elgin 235 40.7 %
Student 9 1.6 %
Retired 136 23.6 %
Not currently employed 33 5.7 %
Not provided 5 0.9 %
Total 577 100.0 %
WITHOUT “NOT PROVIDED”
Q42. Which of the following best describes your current employment status? (without "not provided")
Q42. What is your current employment status? Number Percent
Employed in home/have home-based business 35 6.1 %
Employed outside home, in Elgin 124 21.7 %
Employed outside home, outside of Elgin 235 41.1 %
Student 9 1.6 %
Retired 136 23.8 %
Not currently employed 33 5.8 %
Total 572 100.0 %
2017 City of Elgin Community Survey: Draft Report
ETC Institute (2017) Page 95

Section 5:
Survey Instrument
2017 City of Elgin Community Survey: Draft Report
ETC Institute (2017) Page 96

June 2017
Dear Neighbor:
Mayor David J. Kaptain
City Council Corey D. Dixon Richard Dunne Terry Gavin Rosamaria Martinez Tish S. Powell Carol Rauschenberger Toby Shaw F. John Steffen
City Manager Richard G. Kozal
You have been randomly selected to participate in a survey to improve City programs, services and communication efforts. Your participation and feedback is valuable, as it will help inform city officials on the community’s top priorities.
For this project, the City is partnering with ETC Institute, one of the nation’s leading local government research firms. ETC has experience conducting statistically valid surveys in communities across the nation. The enclosed survey includes a postage-paid envelope to ETC Institute. However, if you prefer to complete it online, please visit www.cityofelginsurvey.org. Your survey responses will remain confidential.
The City greatly appreciates you taking time out of your schedule to reply. It takes 10-15 minutes to complete the survey, but every question is important. We ask that you complete the survey within the next two weeks. The time you invest will help us better understand and more effectively respond to the needs of our community.
The survey results will be presented to the Elgin City Council after they have been compiled and analyzed. A comprehensive report will be available on the City’s website.
If you have any questions regarding the survey, please feel free to contact Laura Valdez-Wilson, Senior Management Analyst, at 847-931-6749 or [email protected].
Thank you again for providing input that will help us make Elgin even better.
Sincerely,
Richard G. Kozal City Manager
Si tiene preguntas acerca de la encuesta y no habla Inglés, por favor llame al 1-844-811-0411. Gracias.
150 Dexter Court, Elgin, IL 60120 847-931-6001 www.cityofelgin.org
©2017 ETC Institute for the City of Elgin Page 1
2017 City of Elgin Community Survey Please take a few minutes to complete this survey. Your input is an important part of the City's on-going effort to identify and respond to citizen concerns. If you have questions, please call Laura Valdez-Wilson at 847-931-6749.
OVERALL PERCEPTIONS
1. Please rate the City of Elgin using a scale of 1 to 5, where 5 means "Excellent" and 1 means "Poor," with regard to each of the following items.
How would you rate Elgin... Excellent Good Neutral Below Average Poor Don't Know
1. As a place to live 5 4 3 2 1 9
2. As a place to raise children 5 4 3 2 1 9
3. As a place to work 5 4 3 2 1 9
4. As a place to retire 5 4 3 2 1 9
5. As a place to visit 5 4 3 2 1 9
6. As a place for single adults (age 18-35) 5 4 3 2 1 9
7. As a City moving in the right direction 5 4 3 2 1 9
8. As a place you are proud to call home 5 4 3 2 1 9
9. As a place for recreation 5 4 3 2 1 9
2. Using a scale of 1 to 5, where 5 means "Very Likely" and 1 means "Very Unlikely," please indicate how likely you are to do each of the following.
How likely are you to... Very Likely Likely Neutral Unlikely Very Unlikely Don't Know
1. Recommend living in Elgin to someone who asks 5 4 3 2 1 9
2. Remain in Elgin for the next five years 5 4 3 2 1 9
3. Recommend visiting Elgin 5 4 3 2 1 9
4. Recommend doing business in Elgin 5 4 3 2 1 9
GENERAL SERVICES
3. Major categories of services provided by the City of Elgin are listed below. Please rate each item on a scale of 1 to 5, where 5 means "Very Satisfied" and 1 means "Very Dissatisfied."
How satisfied are you with... Very
Satisfied Satisfied Neutral Dissatisfied
Very Dissatisfied
Don't Know
01. Overall quality of police, fire and ambulance services 5 4 3 2 1 9
02. Overall enforcement of local codes and ordinances 5 4 3 2 1 9
03. Overall maintenance of city streets, sidewalks and infrastructure
5 4 3 2 1 9
04. Overall access to information about city programs, services and alerts
5 4 3 2 1 9
05. Overall quality of customer service provided by the City 5 4 3 2 1 9
06. Overall quality of stormwater management 5 4 3 2 1 9
07. Overall quality of water utility services 5 4 3 2 1 9
08. Overall quality of billing services provided 5 4 3 2 1 9
09. Overall quality of trash and yard waste services 5 4 3 2 1 9
10. Overall quality of parks and recreation programs and facilities
5 4 3 2 1 9
4. Which THREE of the items listed in Question 3 do you think should receive the MOST EMPHASIS from city leaders over the next TWO years? [Write-in your answers below using the numbers from the list in Question 3.]
1st: ____ 2nd: ____ 3rd: ____
©2017 ETC Institute for the City of Elgin Page 2
PERCEPTIONS OF SAFETY
5. Using a scale of 1 to 5, where 5 means “Very Safe” and 1 means “Very Unsafe,” please rate how safe you feel in the following situations.
How safe do you feel... Very Safe Safe Neutral Unsafe Very Unsafe Don't Know
1. In your neighborhood during the day 5 4 3 2 1 9
2. In your neighborhood at night 5 4 3 2 1 9
3. In downtown Elgin during the day 5 4 3 2 1 9
4. In downtown Elgin at night 5 4 3 2 1 9
5. In City parking garages 5 4 3 2 1 9
6. In public parks 5 4 3 2 1 9
POLICE AND PUBLIC SAFETY
6. Please rate your satisfaction with each of the public safety services listed below on a scale of 1 to 5, where 5 means "Very Satisfied" and 1 means "Very Dissatisfied."
How satisfied are you with... Very
Satisfied Satisfied Neutral Dissatisfied
Very Dissatisfied
Don't Know
1. Overall effectiveness of police protection 5 4 3 2 1 9
2. Visibility of police in neighborhoods 5 4 3 2 1 9
3. Visibility of police in the city 5 4 3 2 1 9
4. Response time for emergency calls 5 4 3 2 1 9
5. Police efforts to prevent crime 5 4 3 2 1 9
6. 911 call handling 5 4 3 2 1 9
7. Parking enforcement services 5 4 3 2 1 9
8. Availability of information about police programs and activities
5 4 3 2 1 9
9. Overall professionalism of the police department 5 4 3 2 1 9
7. Which THREE of the public safety items listed in Question 6 do you think should receive the MOST EMPHASIS from city leaders over the next TWO years? [Write-in your answers below using the numbers from the list in Question 6.]
1st: ____ 2nd: ____ 3rd: ____
FIRE AND EMERGENCY MEDICAL SERVICES
8. For each of the fire and emergency medical services listed below, please rate your satisfaction on a scale of 1 to 5, where 5 means "Very Satisfied" and 1 means "Very Dissatisfied."
How satisfied are you with... Very
Satisfied Satisfied Neutral Dissatisfied
Very Dissatisfied
Don't Know
1. Overall effectiveness of fire services 5 4 3 2 1 9
2. Overall effectiveness of ambulance services 5 4 3 2 1 9
3. Response time for emergency calls 5 4 3 2 1 9
4. Fire education programs in your community 5 4 3 2 1 9
5. Fire inspection programs in your community 5 4 3 2 1 9
6. Overall professionalism of the fire department 5 4 3 2 1 9
9. Which TWO of the fire and emergency medical service items listed in Question 8 do you think should receive the MOST EMPHASIS from city leaders over the next TWO years? [Write-in your answers below using the numbers from the list in Question 8.]
1st: ____ 2nd: ____

©2017 ETC Institute for the City of Elgin Page 3
STREETS, SIDEWALKS, INFRASTRUCTURE
10. For each of the maintenance services listed below, please rate your satisfaction on a scale of 1 to 5, where 5 means "Very Satisfied" and 1 means "Very Dissatisfied."
How satisfied are you with... Very
Satisfied Satisfied Neutral Dissatisfied
Very Dissatisfied
Don't Know
01. Condition of major city streets 5 4 3 2 1 9
02. Condition of neighborhood streets 5 4 3 2 1 9
03. Condition of city sidewalks and bikeways 5 4 3 2 1 9
04. Maintenance of street signs, pavements and markings 5 4 3 2 1 9
05. Maintenance and cleanliness of downtown Elgin 5 4 3 2 1 9
06. Maintenance and cleanliness of your neighborhood 5 4 3 2 1 9
07. Adequacy of street lighting in your neighborhood 5 4 3 2 1 9
08. Snow removal on major city streets (not including Randall Road, Route 20, Route 25, Route 31)
5 4 3 2 1 9
09. Snow removal on residential streets 5 4 3 2 1 9
10. Leaf removal or collection program 5 4 3 2 1 9
11. Mowing and tree trimming along streets and other public areas
5 4 3 2 1 9
12. Overall cleanliness of streets and other public areas 5 4 3 2 1 9
13. On-street bicycle infrastructure (bike lanes/signs) 5 4 3 2 1 9
14. Condition of street drainage/water drainage 5 4 3 2 1 9
11. Which FOUR of the maintenance items listed in Question 10 do you think should receive the MOST EMPHASIS from city leaders over the next TWO years? [Write-in your answers below using the numbers from the list in Question 10.]
1st: ____ 2nd: ____ 3rd: ____ 4th: ____
12. Is parking an issue in your neighborhood? ____(1) Yes ____(2) No
SUSTAINABILITY
13. Please rate the importance of each of the sustainability items listed below using a scale of 1 to 5, where 5 means "Very Important" and 1 means "Not at All Important."
How important is... Very
Important Somewhat Important
Neutral Not
Important Not at All Important
Don't Know
1. Recycling, waste management, composting 5 4 3 2 1 9
2. Green Infrastructure, green building, sustainable planning 5 4 3 2 1 9
3. Alternative energy, renewable energy 5 4 3 2 1 9
4. Resource conservation (water, energy) 5 4 3 2 1 9
5. Local good production and availability 5 4 3 2 1 9
6. Sustainable transportation and mobility 5 4 3 2 1 9
14. Which TWO of the sustainability items listed in Question 13 do you think should receive the MOST EMPHASIS from city leaders over the next TWO years? [Write-in your answers below using the numbers from the list in Question 13.]
1st: ____ 2nd: ____

©2017 ETC Institute for the City of Elgin Page 4
WATER UTILITY
15. For each of the water utility services listed below, please rate your satisfaction on a scale of 1 to 5, where 5 means "Very Satisfied" and 1 means "Very Dissatisfied."
How satisfied are you with... Very
Satisfied Satisfied Neutral Dissatisfied
Very Dissatisfied
Don't Know
1. Water pressure on a typical day 5 4 3 2 1 9
2. Overall quality of your tap water 5 4 3 2 1 9
3. Ease of paying water bill 5 4 3 2 1 9
4. Overall quality of water service 5 4 3 2 1 9
16. Which TWO of the water utility items listed in Question 15 do you think should receive the MOST EMPHASIS from city leaders over the next TWO years? [Write-in your answers below using the numbers from the list in Question 15.]
1st: ____ 2nd: ____
PARKS AND RECREATION
17. For each of the parks and recreation services listed below, please rate your satisfaction on a scale of 1 to 5, where 5 means "Very Satisfied" and 1 means "Very Dissatisfied."
How satisfied are you with... Very
Satisfied Satisfied Neutral Dissatisfied
Very Dissatisfied
Don't Know
PARKS
01. Maintenance of parks 5 4 3 2 1 9
02. Number of parks in Elgin 5 4 3 2 1 9
03. Quality of park facilities, such as picnic shelters, playgrounds, and tennis courts
5 4 3 2 1 9
04. Quality of outdoor athletic fields (i.e. baseball, soccer, football)
5 4 3 2 1 9
05. Quality of walking and biking trails 5 4 3 2 1 9
06. Number of walking/biking trails 5 4 3 2 1 9
RECREATION
07. Overall quality of recreation facilities 5 4 3 2 1 9
08. Maintenance and appearance of The Centre 5 4 3 2 1 9
09. Maintenance and appearance of the Eastside Recreation Center
5 4 3 2 1 9
10. Indoor pools at The Centre 5 4 3 2 1 9
11. Golf courses 5 4 3 2 1 9
COMMUNICATION
12. Quality of communication from Parks and Recreation 5 4 3 2 1 9
13. Quality of customer service from Parks and Recreation employees
5 4 3 2 1 9
14. Ease of registering for programs 5 4 3 2 1 9
15. Availability of information about parks and recreation programs
5 4 3 2 1 9
18. Which FOUR of the parks and recreation items listed in Question 17 do you think should receive the MOST EMPHASIS from city leaders over the next TWO years? [Write-in your answers below using the numbers from the list in Question 17.]
1st: ____ 2nd: ____ 3rd: ____ 4th: ____
©2017 ETC Institute for the City of Elgin Page 5
CODE ENFORCEMENT
19. For each of the code enforcement services listed below, please rate your satisfaction on a scale of 1 to 5, where 5 means "Very Satisfied" and 1 means "Very Dissatisfied."
How satisfied are you with the... Very
Satisfied Satisfied Neutral Dissatisfied
Very Dissatisfied
Don't Know
1. Overall effectiveness of code enforcement 5 4 3 2 1 9
2. Overall effectiveness of communication from code enforcement
5 4 3 2 1 9
3. Enforcing the clean-up of trash and debris on private property
5 4 3 2 1 9
4. Enforcing the mowing and cutting of weeds on private property
5 4 3 2 1 9
5. Enforcing the exterior maintenance of residential property (e.g. condition of buildings)
5 4 3 2 1 9
6. Enforcing the exterior maintenance of commercial/business property
5 4 3 2 1 9
20. Which TWO of the code enforcement items listed in Question 19 do you think should receive the MOST EMPHASIS from city leaders over the next TWO years? [Write-in your answers below using the numbers from the list in Question 19.]
1st: ____ 2nd: ____
COMMUNITY DEVELOPMENT AND PLANNING
21. For each of the community development services listed below, please rate your satisfaction on a scale of 1 to 5, where 5 means "Very Satisfied" and 1 means "Very Dissatisfied."
How satisfied are you with... Very
Satisfied Satisfied Neutral Dissatisfied
Very Dissatisfied
Don't Know
1. City’s historic preservation efforts 5 4 3 2 1 9
2. Process to obtain a building permit 5 4 3 2 1 9
3. City’s efforts to plan for future growth (e.g. residential, business, commercial)
5 4 3 2 1 9
4. Overall communication from community development staff 5 4 3 2 1 9
BILLING
22. Do you currently pay city utility bills online or through autopay (e.g. your water bill)?
____(1) Yes ____(2) No
23. Do you desire to make more city transactions online? ____(1) Yes ____(2) No
CITY EVENTS AND PROGRAMS
24. For each of the city events and programs listed below, please rate your satisfaction on a scale of 1 to 5, where 5 means "Very Satisfied" and 1 means "Very Dissatisfied."
How satisfied are you with... Very
Satisfied Satisfied Neutral Dissatisfied
Very Dissatisfied
Don't Know
1. Opportunities to attend festivals/events 5 4 3 2 1 9
2. Opportunities to attend cultural arts programs 5 4 3 2 1 9
3. Ability to find information about upcoming city events 5 4 3 2 1 9
©2017 ETC Institute for the City of Elgin Page 6
PUBLIC INFORMATION AND ENGAGEMENT
25. For each of the public information and engagement items listed below, please rate your satisfaction on a scale of 1 to 5, where 5 means "Very Satisfied" and 1 means "Very Dissatisfied."
How satisfied are you with... Very
Satisfied Satisfied Neutral Dissatisfied
Very Dissatisfied
Don't Know
1. The availability of public information 5 4 3 2 1 9
2. The accessibility of public information 5 4 3 2 1 9
3. Your ability to provide feedback to the City 5 4 3 2 1 9
4. Your ability to volunteer/serve (city commissions, task forces, committees, etc.)
5 4 3 2 1 9
26. Which of the following sources do you use to gather information about the City of Elgin? [Check all that apply.]
____(1) City of Elgin website (www.cityofelgin.org) ____(2) 311 Contact Center ____(3) 311 Mobile App ____(4) Social Media (Facebook, Twitter, Instagram) ____(5) Local newspapers
____(6) Elgin Neighbor Newsletter ____(7) Direct mail (e.g. postcards or newsletter) ____(8) Word of mouth (friends, family, co-workers, etc.) ____(9) Other: ____________________________________
27. From which THREE information sources listed in Question 26 would you MOST PREFER to get information from the City? [Write-in your answers below using the numbers from the list in Question 26.]
1st: ____ 2nd: ____ 3rd: ____
28. About how often, if at all, do you talk to or visit with your immediate neighbors (people who live in the 10 - 20 households that are closest to you)?
____(1) Almost everyday ____(2) Several times a week
____(3) Several times a month ____(4) Less than several times a month
29. Are you satisfied with the process to report non-emergency problems (e.g. potholes) to the City?
____(1) Yes ____(2) No ____(9) Don’t Know
30. What would be your MOST PREFERRED method for reporting problems to the City? [Check only one.]
____(1) Mobile application ____(2) Website
____(3) Email ____(4) Social media
____(5) Phone call ____(6) In person to city staff member
31. Which THREE of the following sources would you MOST LIKELY use to find employment opportunities in the Elgin area? [Check up to three.]
____(01) City of Elgin website (www.cityofelgin.org) ____(02) LinkedIn ____(03) Local newspapers ____(04) Social Media (Facebook, Twitter, Instagram) ____(05) Referrals from friends, family ____(06) Professional associations
____(07) Online employment search engines (Indeed, Career Builder, Monster)
____(08) Unemployment office ____(09) Local college or university ____(10) Public library ____(11) Other: __________________________________

©2017 ETC Institute for the City of Elgin Page 7
DOWNTOWN
32. Have you visited downtown Elgin to eat at a restaurant in the last 12 months?
____(1) Yes ____(2) No
33. Have you visited downtown Elgin to attend a special event in the last 12 months?
____(1) Yes ____(2) No
34. Have you visited downtown Elgin to do business or had an appointment in the last 12 months?
____(1) Yes ____(2) No
35. Have you visited downtown Elgin to attend a cultural/visual/performing arts program in the last 12 months?
____(1) Yes ____(2) No
36. Have you visited downtown Elgin to recreate along the Fox River or Walton Island (e.g. fishing, biking, walking, running) in the last 12 months?
____(1) Yes ____(2) No
DEMOGRAPHICS
37. Approximately how many years have you lived in Elgin? ________ years
38. What is your age? ________ years old
39. What is your gender? ____(1) Male ____(2) Female
40. Which of the following best describes your housing situation? ____(1) Own ____(2) Rent
41. Which of the following best describes your race/ethnicity? [Check all that apply.]
____(1) African American/Black ____(2) Native American
____(3) Caucasian/White ____(4) Asian/Pacific Islander
____(5) Hispanic/Latino ____(6) Other: ______________________
42. Which of the following best describes your current employment status? [Check only one.]
____(1) Employed in the home/have home-based business ____(2) Employed outside the home, in Elgin ____(3) Employed outside the home, outside of Elgin
____(4) Student ____(5) Retired ____(6) Not currently employed
This concludes the survey – Thank you for your time! Please return your completed survey in the enclosed postage-paid envelope addressed to:
ETC Institute, 725 W. Frontier Circle, Olathe, KS 66061
Your responses will remain completely confidential. The Information printed to the right will ONLY be used to help identify which areas of the City are having problems. If your address is not correct, please provide the correct information. Thank you.