Embed Size (px)
Citation preview

2017 Annual Report
Stock Code:2845www.feib.com.twmops.twse.com.tw

Company SpokespersonName: Jiann-Jong LinChief Executive Vice PresidentTelephone Number: (02)2378-6868E-mail: [email protected]
Company Deputy SpokespersonName: Shinhwa ChouSenior Deputy Executive Vice PresidentTelephone Number: (02)2378-6868E-mail: [email protected]
Headquarter Address and Telephone NumberHeadquarter Address: 26F & 27F, No.207, Sec. 2, Dunhua S. Rd., Taipei City, Taiwan (R.O.C.)Telephone Number: (02)2378-6868
Stock Transfer and Registrar AgencyOffice Name: Oriental Securities CorporationAddress: 3F., No.86, Sec. 1, Chongqing S. Rd., Taipei City, Taiwan (R.O.C.)Telephone Number: (02)2361-8608Website: http://www.osc.com.tw/
Rating AgencyOffice Name: Fitch Australia Pty Ltd, Taiwan BranchAddress: Rm. 1306, 13F, No.205, Dunhua N. Rd., Taipei City, Taiwan (R.O.C.)Telephone Number: (02)8175-7600
Certified Official AccountantsOffice Name: Deloitee & ToucheAccountant Names: Jimmy Wu & Charles YangAddress: 12F, No.156, Sec. 3, Min Sheng E. Road., Taipei City, Taiwan (R.O.C.)Telephone Number: (02)2545-9988Website: https://www.deloitte.com.tw/
Overseas Securities Information● Luxembourg Stock Exchange Website: http://www.bourse.lu/ GDS CUSIP No: 30733T107 / 30733T206
Far Eastern International Bank Websitehttps://www.feib.com.tw/

營運績效Financial Highlights
壹、營運績效 Financial Highlights
貳、董事長嘉言 Chairperson's Message
參、本行簡介 Corporate Pro le一、基本資料 General Corporate Information二、銀行簡介 Introduction三、本行沿革 Milestones四、本行組織系統簡圖 FEIB Organization Chart
肆、公司治理 Corporate Governance一、公司治理守則 Corporate Governance Principles二、董事成員 Board of Directors 三、經營團隊 Management Team四、政策委員會 Policy Committees
伍、經營概況 Business Overview一、核心事業 Core Businesses二、本年度經營計畫 Business Plans三、長、短期業務發展計畫 Short and Long-term Development Plans
陸、財務狀況 Financial Information一、合併簡明資產負債表 Consolidated Simpli ed Balance Sheet二、合併簡明損益表 Consolidated Simpli ed Income Statement三、合併資本適足性 Consolidated Capital Adequacy四、轉投資公司概況及未來計畫 Reinvestment Policies and Plans
2017年英文年報目錄2017 Annual Report Contents
3
4
1818182430
3232343942
44444654
5858606162
1

柒、風險管理 Risk Management一、風險管理組織架構及政策 Risk Management Structure and Policy二、各項風險管理策略 Risk Management Strategy
捌、股東資訊 Shareholder Information一、股份及股東 Shares and Shareholders二、信用評等 Ratings
玖、企業社會責任 Corporate Social Responsibility
壹拾、集團綜效 Group Synergy
壹拾壹、其他資訊 Other Information
壹拾貳、合併財務報表 Consolidated Financial Report
666668
707071
72
76
80
86
2

營運績效Financial Highlights
3
壹、營運績效 Financial Highlights一、重要財務指標 (新台幣 /NT$)
Key Financial Index
二、市佔率第一之利基業務 (至 2017年底 ) Top 1 Market Share Businesses (As of 2017)
Taiwan Depositary Receipts Depositary Business Foreign Exchange Margin Trading
Installment
28% 64%
34%
20162017
$561,415MM
$575,424MM
Total Assets
2.5
20162017
$40,951
$42,787
Net Worth ( )
4.5
20162017
$452,720 MM
$472,392 MM
Total Deposits ( )
4.3
20162017
Total Loans ( )
-1.4$360,995 MM
$355,941 MM

4
OurVision
Position as a right-sized and specialized financial company in greater China market
董事長 侯金英Chairperson Ms. Ching-Ing Hou
Chairperson’s Message

董事長嘉言Chairperson’s Message
5
各位女士、先生:
回顧 2017年,全球經濟景氣復甦,帶動實體經濟動能及整體金融市場發展熱絡。而我國受惠
外需增溫,出口溫和成長,加以股市成交量放大,指數上達萬點,有效刺激民間消費,使 GDP成長
率達 2.86%,為近 5年來高點。展望 2018年,全球經濟可望持續成長,有助維繫我國出口動能,
加上政府推動前瞻基礎建設,GDP可望成長 2.42%。隨著金融科技快速發展,主管機關推動業務創
新及強化監理政策,銀行業將加速推動轉型,開啟新獲利動能。
綜觀 2017年度本行整體經營表現維持穩健,惟受制於匯率波動等不可控制及一次性損失,
2017年度稅後淨利達 28.54億元,每股盈餘 (EPS)維持 0.90元,總資產報酬率 (ROA)為 0.50%,
股東權益報酬率 (ROE)為 6.82%。逾期放款比率維持 0.29%,放款覆蓋率提升至 1.37%,資產品
質水準維持優於同業。
Dear Sir/Madam:
Re ecting on 2017, the world economy has recovered, driving real economic momentum and
nancial market developments. In Taiwan, thanks to the rising external demand and moderate
growth in exports, the transaction of stock market has been high and reached 10,000 market
index, all contributed to stimulate domestic consumption effectively, registering GDP growth at
2.86%, the highest within the last 5 years. Looking into 2018, the world economy is expected
to grow continuously, maintaining Taiwan’s export momentum, coupled with the government’s
promoting”Forward-Looking Infrastructure Development Program”, GDP growth is expected to
reach 2.42%. Along with the rapid developments of Fintech, the governmental institutions shall
encourage business innovation and strengthen supervision, thus the banking industry will expedite
transformation and initiate new pro t engine.
In 2017, Far Eastern International Bank (FEIB) maintained steady performance; however,
under the impact of foreign exchange loss, the fiscal year net profit was NT$2.854 billion.
Earnings per share (EPS) was NT$0.90. The total return on assets (ROA) was 0.50%, and the
return on equity (ROE) was 6.82%. Meanwhile, the bad debt ratio remained at 0.29%, and loan
loss coverage ratio rose to 1.37%, surpassing industry standards in terms of asset quality.
6
副董事長 徐旭東Vice Chairman Mr. Douglas Tong Hsu
OurMission Statement◆ Provide nancial solutions to both individual
and institutional customers in Asia market◆ Create maximum value for customers,
shareholders and employees

董事長嘉言Chairperson’s Message
7
分行系統升級,深化數位交易運用,促動客戶交易離櫃率達 86%。在信用卡方面,以遠東快樂信用卡為旗艦卡,累積發行 41萬張新卡,於集團零售通路簽帳成長 15%。在消費金融方面,消費性貸款餘額成長 6%,維持策盟車貸市佔第一。在財富管理方面,開設新一代高端智能分行,蟬聯三年卓越雜誌「最佳財富管理獎」獎項。在法人金融方面,完成首件東協市場主辦聯貸案,累積 5年主辦國際聯貸案共 19件,金額突破 700億元。在金融市場方面,成功轉型外匯保證金行動及網路交易型態,鞏固市場領先地位。
本行落實企業社會責任,投入各項公益活動,履獲獎項肯定。具體作為包括支持伊甸基金會之
捐款貢獻累計超過8千萬元,僱用成年喜憨兒並採購 3000盒喜憨兒月餅,長期關懷弱勢族群。發行企業社會責任報告書,獲 BSI企業永續傑出獎、臺灣企業永續獎銅獎肯定。發行 2018年月曆「知識之森,學問之海」,介紹當代圖書館,並贈書 31所高中高職,推動閱讀風氣。舉辦常玉展及奧塞展遠銀日,贊助太陽馬戲團,響應國際級藝文來臺展演。落實人才培育,榮獲勞動部連續 15年訓練補助肯定,並三度獲頒 TTQS人才發展品質管理系統認證,為本行永續人力資源發展,奠定良好根基。
FEIB has maintained its long-term steady operational strategies and demonstrated high-quality growth momentum in its core businesses. In the category of digital banking, the Bank launched “FE Mobile Payment Integrated Service” to incorporate Alipay and FriDay wallet in order to create integrated mPOS (Mobile Point of Sales). Together with online banking and branch network upgrade, we are expanding the application of digital transactions and enabling customer off-counter rate to reach 86%. As to the credit card business, with the flagship “Far Eastern Happy Credit Card,” the accumulated issuance of 410,000 new cards, and revolving balance via the Group’s channels grew 15%. In consumer banking business, consumption loans grew 6%, and market share of automobile loans continued its leading position. In wealth management, we established the latest high-end smart branch, and won for three consecutive years in the “Best Wealth Management Award” by the Excellence Magazine. In corporate banking business, FEIB completed Taiwan’s rst ASEAN market syndicated loan, and accomplished 19 international syndicated loans which surpassed NT$70 billion within 5 years as the lead bank. In financial market, the Bank successfully transformed the mobile and online FX guarantee trading, and strengthened its market lead position.
To fulfill corporate social responsibilities (CSR), FEIB has been committed to promoting various philanthropic activities, and frequently received award recognitions. Additionally, “Cash back program” was partnered with Eden Social Welfare Foundation, the donations amounted to more than NT$80 million. The Bank also helped the challenged adults by employing them as well as purchased 3,000 boxes of moon cakes made by them to care for the under-privileged. The Bank published the 2018 calendar with the theme of “Forest of Knowledge, Ocean of Learning” to introduce Taiwan’s contemporary libraries, and contributed books to 31 senior high schools and vocational schools to promote the habit of reading. In the cultural aspect, we sponsored FEIB Day of Parisian Nostalgia: the National Museum of History’s Sanyu Collection and Musée d’Orsay: The Aesthetic Worlds of the 19th Century, as well as the world-class artistic performance of Cirque du Soleil in Taiwan. In the human resource development, the Bank has received subsidies for 15 consecutive years from the Workforce Development Agency, the Ministry of Labor for its continued efforts in talent development. FEIB also received certification three times from TTQS (Talent Quality-Management System) to recognize its dedication in sustainable talent development.

8
OurCompetitive Strengths• Streamlined corporate structure with dedicated BUs• Steady growth of assets, leading market share in strategic fi nancial products
• Highly independent and well-developed risk management • Bi-cultural professional management team • Leverage “Virtual” FHC platform for group synergy
總經理 周添財President Mr.Thomas Chou

董事長嘉言Chairperson’s Message
9
展望 2018年,本行將延續優質成長動能,推動創新升級、轉型再造,強固核心競爭力。主要
的行動方針包括結合社群金融打造數位銀行新品牌,推出信用卡行動支付,加速數位佈局。增資租
賃子公司,新設新加坡及越南辦事處,持續開拓海外市場商機。信用卡有效卡突破百萬卡,提升品
牌知名度。串連財富管理及中小企業投融資業務,推動分行營運模式轉型。強化法遵、風控及內控
管理機制,配合法規監理環境,減少經營風險。面對數位世代及同業轉型日益增加的挑戰及機會,
全體同仁在追求獲利穩健成長的同時,亦將展現機敏創新能力,啟動新獲利動能,為股東、客戶、
員工及社會營造多贏的價值。
Looking into 2018, FEIB will continue to maintain its high-quality growth momentum, reiterate innovation, transformation, and restructure to strengthen core competence. Major action plans include combining social media banking, launch credit card mobile payment, and expedite the deployment of digitization. Increase investment in the af liated leasing company and open new of ces in Singapore and Vietnam to expand and explore overseas business opportunities. The number of credit cards in force exceeds one million to elevate further brand recognition. Connect wealth management and small & medium-sized financial businesses to transform the branch business model. Strengthen legal compliance, risk management, and internal control, in accordance with regulated supervisory environment to lower business risk. Embrace the challenges and opportunities in the face of digital era and the competitions from peer’s rapid transformation. While seeking steady profit growth, the Bank’s staffs also demonstrate agility and innovative capability to initiate new pro t engine, and create win-win for its shareholders, customers, employees and the society.

10
謹將本行 2017年度營運結果及 2018年度營業計劃概要報告如下:
2017 年度營運結果 ( 財務數字依個體財報 )
一、營業計畫及經營策略實施成果
營運概況 比較表單位 :新台幣百萬元
年度項目
2017年 2016年 變動率
存款及匯款 472,621 452,905 4.35%
法金放款 146,282 160,985 -9.13%
消金放款 209,659 200,011 4.82%
總放款 355,941 360,995 -1.40%
信用卡循環信用餘額 10,575 10,246 3.21%
買入有價證券 148,652 124,226 19.66%
權益法股權投資業務 2,759 2,568 7.42%
信託資產總額 59,980 58,174 3.10%
二、營業損益概況
(一 )預算執行情形
本行 2017年總資產 5,748億元,預算達成率 97%,存款餘額 4,726億元,預算達成率99%,放款餘額 3,559億元,預算達成率 95%。
(二 )財務收支及獲利能力分析
2017年度營業淨收益 102億元,較 2016年度減少 3%。淨利息收入 53.83億元,較2016年度減少 7%,利息以外淨收益 48.18億元,較 2016度增加 2%。
2017年度稅後淨利 28.54億元,較 2016年度減少 12%,每股盈餘 0.90元,較 2016年度減少 12%。
三、信用評等結果
惠譽國際信評公司 (Fitch Ratings)於 2017年 10月 31日公布本行國內評等分別為長期評等A(twn)、短期評等 F1(twn),國際外幣評等分別為長期評等 BBB-、短期評等 F3,評等展望維持穩定,屬投資等級穩健之金融機構。

董事長嘉言Chairperson’s Message
11
Operating Results for 2017 and Business Outlook for 2018 are summarized as follows:
Operating Results for 2017
1.Business Plan and Operating Results
Changes in Operations Overview(NT$MM)
Year Item 2017 2016 Change Rate
Deposit (Including due to other banks, excluding remittance) 472,621 452,905 4.35%
Corporate Loan 146,282 160,985 -9.13%
Consumer Loan 209,659 200,011 4.82%
Total Loan 355,941 360,995 -1.40%
Revolving Credit Cards Balance 10,575 10,246 3.21%
Securities Purchased 148,652 124,226 19.66%
Stock Investment in Equity 2,759 2,568 7.42%
Total Trust Assets 59,980 58,174 3.10%
2.Business Overview
(1) Target Achievement
In 2017, FEIB’s total assets stood at NT$574.8 billion, achieved 97% of target; total deposits and loans amounted to NT$472.6 billion and NT$355.9 billion, which achieved 99% and 95% of target, respectively.
(2) Analysis of Pro tability
FEIB’s net operating income in 2017 was down 3% (YoY) to NT$10.2 billion, net interests were NT$5.383 billion, dropped 7% (YoY), and total net revenues other than interest were NT$4.818 billion, grew 2% (YoY).
Income after tax was NT$2.854 billion, down 12% (YoY), and net earnings per share were NT$0.90, down 12% (YoY).
3.Ratings
The Bank’s investment grade ratings were assessed by Fitch Ratings Limited as follows:
National Rating Long-term A(twn), National Rating Short-term F1(twn), Foreign Currency Rating Long-term BBB-, and Foreign Currency Rating Short-term F3, FEIB is considered a stable nancial institution of investment grade.

12
四、研究發展狀況
為加速推動數位轉型策略,本行攜手遠東集團啟動「FE跨界行動應用平台」,開發整合型行動收單平台,掌握行動支付商機。同時運用金融創新科技,改版行動銀行 APP、推出全新官網,開辦手機線上申請信用卡、跨行無卡提款、企業 e客服遠端輔助系統等創新服務。此外,領先同業取得線上辦卡「雙軌」身分驗證及「隱碼符記加密服務」之資安專利,積極掌握數位客群
開發商機。
五、組織變化情形
(一)為整合資源運用、統一業務管理,子公司遠銀人身保代及遠銀財產保代於 2017年 2月併入本行,成立保險代理事業群。
(二)因應金管會頒訂之「銀行業防制洗錢及打擊資恐注意事項」,法令遵循處於 2017年 4月 1日增設洗錢防制組,俾積極落實防制洗錢及打擊資恐作業之執行。
六、受到外部競爭環境、法規環境及總體經營環境之影響
隨著全球數位科技快速發展,及金管會持續加強金融監理,銀行業面臨轉型之挑戰與機會。本
行透過全面推動數位轉型策略,啟動流程再造,提升營運效率,創造新業務模式。面對國內利
差持續縮減,擴大國際放款佔比,增長高利差個人房信貸規模。配合電子支付市場蓬勃發展,
開發行動支付服務,提升金融交易量市佔率。配合政府推動綠色金融行動方案,本行加強綠色
金融授信業務,2017年授信餘額達新台幣 174億元。為因應國際間對防制洗錢,打擊資恐的重視,本行已設置獨立之防制洗錢及打擊資恐專責單位,落實防制洗錢及打擊資恐作業之執行。

董事長嘉言Chairperson’s Message
13
4.Research and Development
To expedite the promotion of digital transformation, FEIB has been working with the Far Eastern Group to start up “FE Mobile Payment Integrated Service”, develop integrated mPOS, and thus seize mobile payment business opportunities. Also adopt innovative FinTech, revise mobile banking APP, launch brand new website, offer innovative services such as mobile online application of credit cards, cross-bank cardless cash withdrawal, and enterprise e-customer service remote support system. In addition, the Bank leads in acquiring information security patent of online application “Dual Track” identity check and “Hidden Code Token Encryption Service” to pursue the business development of digital customer group.
5.Structural Changes
(1) To integrate resources and streamline business management, Far Eastern Life Insurance Agency Co., Ltd. and Far Eastern Property Insurance Agency Co., Ltd. were merged into FEIB in February 2017 to establish the Insurance Agency Business Group.
(2) To comply with the “Guidelines Governing Anti-Money Laundering and Countering Terrorism Financing” by the Financial Supervisory Commission (“FSC”), the Bank’s Legal Compliance Department established on April 1, 2017 the Anti-Money Laundering Unit to implement the execution of anti-money laundering and countering terrorism nancing.
6.Impact of External Competitions, Legal and Overall Operating Environment
In line with the rapid development of global FinTech and increasingly stringent financial supervision by FSC, the banking industry is facing challenges and opportunities to call for transformation. FEIB, through promoting overall digital transformation, has initiated process reengineering to elevate operating efficiency and create new business model. To cope with continuous diminishing domestic interest margin, the Bank has enlarged the ratio of international loans, and increased the scale of high interest spread personal mortgage. Taking advantage of the booming electronic payment market, FEIB aims to develop mobile payment serviced and elevate the market share of nancial transactions. To cope with the Government’s promotion of Green Finance Initiative, the Bank strengthened green banking loan business, and total loans amounted to NT$17.4 billion in 2017. To echo with the international focus on anti-money laundering and anti-financing terrorism, FEIB established “Money Laundering Control Task Force” as the independent and responsible unit to implement the execution of money laundering control and combat against nancing terrorism.

14
2018 年度營業計劃概要本行 2018年度重要營業目標如下:
一、預期營業目標
本行 2017年度重要營業目標如下:
(一)總資產:6,191億元。
(二)存款總額:5,081億元。
(三)放款總額:3,781億元。
二、經營方針與重要經營政策
(一)個人金融業務:
塑造樂活財富管理品牌形象,建構新一代財富管理服務,打造獲利新動能。運用 Fintech升級財富管理系統,發展深度 KYC尊榮專案搶攻高端客戶。導入 AI智能理財提升多元資產配置效率,結合集團優惠提供專屬禮遇,成為個人、家庭會員及中小企業主投資理
財的最佳夥伴。持續深耕分行通路,調整分行佈點、結合分行店周資源,打造特色化分
行,擴大分行資產規模,穩固經營基礎。
(二)消金及信用卡業務:
1.消費金融方面
運用金融科技,持續優化 E&M功能,整合虛實通路,擴大通路規模,提升數位通路佔比,降低成本,提高營運效能。持續應用 Data mining,創造客戶需求,提供多元及客製化服務。恪守法令遵循,強化風險管理,優化資產及鞏固利基產品,維持市場
領先地位。
2.信用卡方面
整合集團零售通路資源,擴大遠東快樂信用卡優惠,提升發卡及簽帳金額,維持集團
優勢簽帳地位。因應行動支付市場趨勢,串聯 friDay錢包及台灣 pay,掌握行動支付商機。運用 Big Data,深化經營目標客戶,擴大簽帳經營規模。促動新舊客戶刷卡,有效提升活卡率,降低營運成本。
(三)法人金融業務:
積極佈局海外市場,新設新加坡及越南辦事處,爭取在地及東南亞市場聯貸案。增資上
海遠榮租賃,深耕大陸市場經營,以擴大海外資產規模及獲利佔比。發展交易金融業務,
拓展存款客源,優化存款結構,維護穩健放款利差。落實主動式風險管理,嚴控資產品

董事長嘉言Chairperson’s Message
15
Operating GoalsMajor Operating Goals for 2018 are summarized as follows:
1. Operating Target:(1)Total asset: NT$619.1 billion
(2)Total deposit: NT$508.1 billion
(3)Total loan: NT$378.1 billion
2. Operating Highlights:
(1) Individual Banking Business:
Cultivate LOHAS wealth management brand image, build up new generation wealth management services, and create new profit engine. Adopt upgrade Fintech wealth management system and pursue in depth KYC (Know Your Customer) A+ VIP project to aim at high-end customers. Introduce AI smart banking to elevate the ef ciency of diversi ed portfolio, combine Group’s special premiums to offer exclusive bene ts, and thus become the best wealth management partner for individual, family members, and small & medium-sized enterprises. Continue to explore branch channels, adjust branch locations, and combine neighboring resources, build specially featured branch, expand asset under management, and consolidate business base.
(2) Consumer Banking and Credit Cards Business:
A. Consumer Banking Business
Adopt Fintech, continue to optimize E&M function, integrate physical and virtual channels, expand channel scale, elevate ratio of digital channels, lower cost, and improve operating efficiency. Continue to apply Data mining, create customer needs, and provide diversi ed plus customized services. Comply with laws and regulations, strengthen risk management, optimize asset quality and consolidate niche products, and maintain market leadership.
B. Credit Cards
Integrate the Group’s retail channels, expand benefits offered by Far Eastern Happy Credit Card, and promote small-amount payment via Happycash card to focus on convenience for the cardholders. Join forces with large mobile payment and third-party payment operators to seize the emerging payment opportunities. Launch the rst interactive mobile e-billing to improve digitized service. Apply Big Data, deepen the cultivation of target customer, and explore new pro t engine.
(3) Corporate Banking Business
Proactively deploy the overseas market and establish Singapore and Vietnam Of ces to acquire local
syndicated loan businesses in the ASEAN market. Increase investment in FEIB Financial Leasing
Co., Ltd. in Shanghai to explore mainland China market, and expand overseas asset scale and pro t
ratio. Develop trading nancial business, explore deposit customer base, optimize deposit structure,

16
質。推廣二代企網銀平台及 B2B2C業務,複製企業理財業務經驗,主辦國內外聯貸,提供結構型融資及客製化金融商品,創造更多高附加價值的收益。
(四)金融市場業務:
鞏固外匯保證金交易市場領導地位,深耕既有客戶關係,運用社群媒體、網路等多重通
路持續開發新客源。擴大投資及交易部位,提升金融商品自主設計能力,開創新獲利來
源。多樣化金融商品銷售,提供多元資產配置,靈活交易策略,以提升客戶滲透率。重
新定位 TMU目標客層,延伸大型法金客戶及個金理財客群,拓展新客源。改善銀行存款結構,提高個人及中小企業戶存款,兼顧資產負債管理之流動性與獲利性。
(五 ) 數位金融業務:
發展務實金融科技,秉持可行的商轉技術、具體的應用場景、解決客戶痛點 /斷點等三大原則,推動各項數位金融服務。擴大運用「FE跨界行動應用平台」,持續佈建行動支付基礎建設,完善行動應用生活圈。整合 O2O線上 /線下通路,打造全通路 (Omni Channel)智能服務。重組銀行產品功能及連結社群金融,打造數位銀行新品牌。持續研發金融科技專利,營造優質的智慧金融體驗。
(六)保險代理業務:
與個人金融及法人金融事業群合作,慎選優質合作保險公司夥伴,代理引進符合內外部
客戶需求的保險理財商品,提供完整的風險管理、資產配置、財富傳承的服務。在集團
綜效方面,提供集團關企、客戶及同仁,最適化的人身壽險及財產保險商品,推展遠傳
電信行動裝置保險及亞東證券保險業務。運用數位金融科技發展,開發線上投保商機。
董事長
謹啟

董事長嘉言Chairperson’s Message
17
and maintain steady interest rate spread. Implement proactive risk management and strictly control
asset quality. Promote 2G internet platform and B2B2C business, duplicate enterprise financial
experience, lead in domestic and international syndicated loans, provide structured nancing and
customized nancial products, and create more high value-added pro ts.
(4) Financial Markets Business:
Consolidate the leading position in the foreign exchange margin trading market, cultivate existing
customer relations, and apply multiple channels including social media and internet to continue to
develop new customers. Expand investment and trading position, elevate self design capability
of nancial products, and create new source of pro t. Sell a variety of nancial products, provide
diversified asset allocation, flexible trading strategy, so as to improve customer penetration rate.
Reposition TMU target customers, extend large corporate account and individual wealth management
customers, and develop new customer source. Improve the Bank’s deposit structure, increase
individual and small & medium-sized enterprises deposits, to improve the liquidity and pro tability of
asset and liability management.
(5) Digital Banking Business:
Develop solid Fintech, aim at grasping feasible operation technology, concrete application scene, and
solution of customer’s pain point/breakpoint to promote various digital banking services. Expand to
apply “FE Mobile Payment Integrated Service”, continue to establish mobile payment infrastructure,
and complete mobile application lifestyle. Integrate O2O online/of ine channels, and create Omni
Channel smart services. Restructure bank product function and combine social nance to create new
brand of digital bank. Continue to research and develop Fintech patents, and build quality smart
banking experience.
(6) Insurance Agency Business:
Cooperate with consumer and corporate banking groups, carefully select insurance companies as
partners, introduce bank insurance products meeting the needs of internal and external customers,
and provide comprehensive risk management, asset allocation, and wealth inheritance services. In
terms of Group synergy, provide the most optimal life and property insurance products to Group
af liates, customers and staffs, promote Far EasTone Telecom mobile device insurance, and Oriental
Securities insurance business. Adopt the development of digital Fintech, and develop online
insurance listing business opportunities.
Chairperson

18
Corporate Pro le一、基本資料
2017年 12月 31日
1992 01 11
1998 11 27
( )( 10 )
31,829
2,473
57
BBB-A (twn)
二、銀行簡介
本行由實業家徐有庠先生創辦,徐有庠先生一生創立諸多事業,包括遠東新世紀、遠東百
貨、亞洲水泥等知名企業,對國家經濟發展貢獻斐然。
1989年,政府修正銀行法,開放民間設立銀行。徐有庠先生響應政府金融事業現代化、自
由化、國際化之政策,於同年 1月 19日成立本行籌備小組,秉持「誠、勤、樸、慎」的實業
精神與服務理念,積極運籌規劃。5月 14日發起人會議召開,議定資本額為新臺幣 100億元,
並於 10月向財政部提出申請。

本行簡介Corporate Pro le
19
1. General Corporate DataDecember 31, 2017
General Corporate Data
Date of Establishment January 11, 1992
Date of Listing on Taiwan Stock Exchange November 27, 1998
Paid-in Capital (NT$MM)(Par Value NT$10) 31,829
Number of Employees 2,473
Operating Units 57
Auditor Deloitte & Touche
FitchRatingsLong-term Foreign Currency IDRNational Long-term RatingOutlook
BBB-A (twn)Stable
2.Introduction
The Far Eastern International Bank (FEIB) was established by entrepreneur Mr. Y. Z. Hsu, founder of
various renowned enterprises including Far Eastern New Century Corporation, Far Eastern Department
Stores, Asia Cement Corporation, etc. with signi cant contributions to Taiwan’s economic developments.
In 1989, Far Eastern Group founder Y. Z. Hsu established a bank organizing committee with a view
to establish a private bank in responding to the government’s amendment of the Bank Law and policy to
liberalize private banks, which aimed to modernize and globalize Taiwan’s nancial sector. With founding
mottos and service guidelines of “Sincerity, Diligence, Thrift and Prudence”, the Convokers’ Meeting
was held on May 14, 1990 and then application was submitted to the Ministry of Finance in October for
approval to establish a new bank with capital of NT$10 billion.

20
1991年 8月 1日,本行獲准設立。於募足公開股款後,12月 9日召開創立會,會中通過
公司章程,並選出 9位董事及 3位監察人。次年元月 11日,經濟部通過本行之設立登記,並
發予公司執照;4月 9日再獲財政部發給營業執照。隨即於 4月 11日,總行營業部、儲蓄部
及台北逸仙分行正式對外營業。開業之初,本行取得一般銀行及儲蓄銀行業務等開辦許可;之
後陸續獲准開設信託部與國外部,辦理信託、投資、資產管理、理財諮詢與國外匯兌等業務。
經營項目不斷擴充,得以為客戶提供嶄新且多元化的金融服務。同期間並擇選北中南具發展潛
力地區,設立分行,建置全台服務通路網。
1995年 11月本行股票於櫃檯買賣中心掛牌,1998年 11月正式掛牌上市,並接受國際知
名信評公司評等,歷年所獲評等等級皆符合主管機關投資等級之評等規定。此外,為支應持續
擴大的外幣資產,亦考量資金募集多元化與國際化之必要,本行於 2003年 7月獲財政部核准
發行海外無擔保轉換金融債券,隨即發行零利率之海外無擔保轉換金融債券 1億 1仟萬美元。
本行面對業務成長與快速變化的市場環境,組織歷經多次變革。1999年本行率先本國同
業,確立事業群分立的組織,由行政管理群、企業金融群及消費金融群等三部分立開始,至
2006年整合為法人金融、金融市場、個人金融、消金及信用卡等四大事業群,並加入行政支援
群、風險管理處、資訊管理處等三大總行管理單位。接著又於法人金融與個人金融事業群設立
電子金融專責部門,提供交易無遠弗屆且資訊即時、密集的網路銀行服務,逐步建立專業分工
的金融服務團隊。事業群在各自運作之下,商品與服務得以持續創新,專業水平得以精實發展,
業務動能亦不斷提升,多項業務名列國內領導品牌之一。
於追求業務成長與專業服務的同時,為兼顧作業的嚴謹與效率,本行於 2008年成立作業
及資訊服務中心,為前台金融服務提供高效率的作業支援體系,不僅成本因作業集中化而降低,
更設立各項產能與效益指標,持續精進相關流程。
近年來本行接軌多項國際級金融集團業務,於 2008年完成與德意志銀行結盟成立德銀遠
東證券投資信託(股)公司;2009年受讓友邦國際(AIG)信用卡(股)公司之信用卡業務及
應收帳款資產;2011年投資購買 ING集團在台成立之安智證券(股)公司,同年完成交割後
更名為遠智證券。

本行簡介Corporate Pro le
21
On August 1, 1991, the Ministry of Finance approved the establishment of FEIB. After conducting public offer shares, the Establishment Meeting was held on December 9, which passé the article of incorporation and elected nine Directors and three Supervisors for the Board. On January 11, 1992, the Ministry of Economic Affairs approved FEIB’s registration and issued a company license; thereafter on April 9 the Ministry of Finance issued an operating license. Soon on April 11, 1992, the Business Department, Saving Department and Taipei Yisen Branch of FEIB began operations. In the early start, FEIB was authorized to operate general banking and saving businesses, then the trust and international banking departments were inaugurated to offer trust, investment, asset management, finance consulting and foreign exchange services. With continuous expansions of operations, the Bank is able to provide clients with new and diversi ed nancial services. At the same time, new branches from north to south of Taiwan were set up at the selected areas with growth potential to build up an island-wide network of service channels.
In November 1995, FEIB went public by listed on the Over the Counter (OTC) market of the Republic of China. In November 1998, the Bank was listed on the Taiwan Stock Exchange. FEIB’s investment grade ratings were assessed by world renowned ratings companies and the Bank has been considered a stable nancial institution of investment grade. To cope with its enlarging foreign exchange asset and the need for diversi ed and international portfolio, FEIB was approved by the Ministry of Finance to issue in July 2003 US$110 million worth of Unsecured Convertible Bonds overseas.
Responding to the growing businesses and dynamic market, FEIB underwent several restructurings. In 1999, it was the rst bank in Taiwan to set up three major independent Business Groups – Administration, Consumer Banking, and Corporate Banking. Till 2006, FEIB integrated its business units into four Banking Groups – Corporate Banking, Financial Markets, Individual Banking, and Consumer Banking & Credit Cards, and added three management units – Administration & Support Group, Risk Management and IT Management. Then E-banking Business Units were formed under Corporate Banking and Individual Banking Groups speci cally responsible for offering borderless, real-time, and 24/7 online banking services. Operating separately and independently, the Bank’s respective business groups continue to bring forth innovative products and services, enhance their expertise, and elevate their efficiency, enabling many businesses to rank rst in their respective categories.
While seeking business growth and offering professional services, in order to enhance operating ef ciency FEIB established in 2008 “Operations & Technology (O&T) Service Center” as the high-ef ciency support to the Bank’s front desk nancial services, which not only saved costs with centralized operations, but also streamlined processing by setting up various ef ciency indicators.
Recently, FEIB has engaged in various financial services cooperating with world-class financial institutions. In 2008 FEIB formed alliance with Deutsche Bank AG to establish Deutsche Far Eastern Asset Management Company Limited, in 2009 acquired AIG’s credit cards and accounts receivable business, and in 2011 acquired 100% in ING Securities Company Limited from ING Insurance International B.V. which was renamed in the same year as Far Eastern International Securities Company Ltd. after completion of the transaction.

22
通路擴張由實體分行與數位通路雙向並進,2010年初推出 FE Direct網銀帳戶,同年 4月
正式承受慶豐銀行 19家國內營業據點;同年 5月個人金融事業群成立「中小企業服務部」,
落實大分行計畫,以深耕中小企業客群之財富管理與融資業務。2011年推出行動銀行 iPhone
版與 Android版,逐步架構 e化與 M化的服務平台,並達兼顧通路效益與精緻服務品質的最適
規模。2013年領先同業推出「FETP外匯保證金網際網路交易平台」,滿足客戶多元化需求;
於 101大樓新設立台北 101分行,並結合子公司遠智證券的全球投資專業,提供富裕客層私人
銀行級的高端理財服務。2014年獲准開辦跨境第三方支付,領先同業推出外匯保證金及可轉
債選擇權網路下單交易平台,外匯保證金交易新增交易貨幣類別擴大業務規模;獲准投資遠鑫
電子票證股份有限公司,掌握電子支付及行動支付發展契機;新設立新竹巨城分行及板橋中本
分行,成為與百貨購物中心融合的複合式精品分行,落實理財與生活融合的概念,提供客戶全
方位商品與貼心服務。
2015年因應行動通訊、社群媒體、大數據、雲端科技等資通訊技術之發展趨勢,開發多
項數位金流服務平台,領先同業首創 iCloud雲端信用卡、推出信用卡及信貸線上申請平台。為
掌握金融數位化的潮流,2016年積極整合數位科技 &金融服務,推出多項數位金融服務,如
O2O雲端理財服務、ATM跨行存款及無卡提款、外匯保證金交易行動下單平台、並獲准辦理境
內與跨境第三方支付業務等,增進產品多元與便利性;同時建置 E3CM系統,運用評分卡模型、
商業智慧 (BI)、Test & Learn機制,以數據化管理授信風險;另為因應國際對防制洗錢與打擊
資助恐怖主義的議題日漸重視,導入防制洗錢及打擊資助恐怖主義管理系統,以系統化管理防
制洗錢及打擊資恐作業。
2017年為整合資源運用、統一業務管理及提升營運綜效,子公司遠銀人身保代及遠銀財產
保代併入本行,成立保險代理事業群。為加速推動數位轉型策略,攜手遠東集團啟動「FE跨界
行動應用平台」,開發整合型行動收單平台,掌握行動支付商機,同時運用金融創新科技,改
版行動銀行 APP、推出全新官網,開辦手機線上申請信用卡、跨行無卡提款、企業 e客服遠端
輔助系統等創新服務;領先同業取得線上辦卡「雙軌」身分驗證及「隱碼符記加密服務」之資
安專利;於遠企大樓 13樓設立新一代高端智能敦南分行,強調以無現金數位金融服務與智能
科技輔助理財,滿足高資產客戶的理財服務需求。
本行與時俱進發展至今,共設有 56處國內分行(含營業部)及香港分行,踏實發揮社會
資本供需的金融功能,讓資本更有效率流通、交易,為經濟與市場注入活力。

本行簡介Corporate Pro le
23
To expand both physical and virtual branches, FEIB launched FE Direct internet-banking service in early 2010, completed the acquisition of Chin-Fon Bank with 19 domestic operating units in April, established in May 2010 the “Small and Medium-sized Enterprise Banking Unit” under Individual Banking Group to implement Big Branch Plan as well as cultivate wealth management and small & medium-sized enterprise nancing business in this segment. The Bank launched fully integrated mobile apps in both Android and IOS versions in 2011 to establish digital and mobile banking platform so as to optimize channel ef ciency and offer dedicated services. In 2013, the Bank led in launching “FETP FX Margin Trading Online Platform” to satisfy the diversified demands of its customers, opened Taipei 101 Branch, the affiliated Far Eastern International Securities Company offers global investments and private banking services to high net-worth customers. In addition, FEIB was granted approval to operate cross-border third-party payment in 2014, led in launching FX margin trading and convertible bond option online trading platforms, the varieties of currencies for FX Margin Trading were also increased to enlarge business scale. Yuan Hsin Digital Payment Co., Ltd. was established to seize the booming digital payment and mobile-payment businesses. The newly opened Hsinchu Big City Branch and Banqiao Chungben Branch are boutique branches within shopping malls that offer wealth management services to customers as well as shopping lifestyle destination.
In 2015, in response to the recent trend of mobile communication, social media, Big Data, and cloud computing, FEIB strived to develop various digital nancial platforms, and led in issuing the rst iCloud credit card in the market, launched online application platform for credit cards and personal loans. To seize the trend of FinTech banking, in 2016 the Bank integrated its digitalized technology and launched varieties of digital financial services including O2O cloud financing, Inter-bank ATM deposit and cash withdraw without ATM cards, and mobile shopping platform of foreign exchange margin trading. The Bank was granted to operate domestic and cross-border third-party payments to enhance product diversity and convenience, it also built up the Enterprise Content Management (E3CM) system, apply Score Cards, Business Intelligence (BI), and Test & Learn solutions to manage loan risk via data analytic tools. Furthermore, to comply with the world’s ever increasing attention on anti-money laundering and combating terrorism financing, FEIB introduced the anti-money laundering and countering terrorism nancing guidelines to systematically prevent them.
In 2017, to integrate resources, streamline business management and elevate operation synergy, Far Eastern Life Insurance Agency Co., Ltd. and Far Eastern Property Insurance Agency Co., Ltd. were merged into FEIB to establish the Insurance Agency Group. To expedite the promotion of digital transformation, FEIB joined forces with the Far Eastern Group to launch “FE Mobile Payment Integrated Service,” develop integrated mPOS, seize mobile payment business opportunities, also adopt innovative FinTech, revise mobile banking APP, launch brand new website, offer innovative services such as mobile online application of credit cards, cross-bank cardless cash withdrawal, and enterprise e-customer service remote support system. In addition, the Bank leads in acquiring information security patent of online application “Dual Track” identity check and “Hidden Code Token Encryption Service” ; established the new generation high-end smart Dun-nan Branch focusing on cashless digital banking services and wealth management with smart technology to satisfy the wealth management needs of high net worth customers.
After continuous growth and developments, operating with 56 domestic branches (Business Department included) and the Hong Kong Branch, FEIB is committed to enhance the efficiency of its capital ow and nancial transactions and thus contributing to the nation’s economy and nancial market.

24
三、本行沿革
1990 ◆ 召開發起人會議,議定資本額為新台幣 100億元,並向財政部提出設立許可申請。
1991 ◆ 財政部核准本行設立。
1992 ◆ 總行營業部、儲蓄部及台北逸仙分行正式對外營業。
1995 ◆ 本行股票於櫃檯買賣中心正式掛牌。
1996 ◆ 總經理張學林榮退,由洪信德先生接任。
1997 ◆ 開啟與伊甸基金會的長期夥伴關係。
1998 ◆ 11月 27日本行股票正式掛牌上市。
◆ 國內第一家協助企業發行台灣存託憑證的保管銀行。
1999 ◆ 率先新銀行開辦海外存託憑證保管銀行業務。
◆ 獲財政部許可設立香港代表人辦事處。
◆ 轉投資設立遠銀人身保險代理人股份有限公司及遠銀租賃股份有限公司。
2000 ◆ 創辦人徐有庠先生辭世,由徐旭東先生繼任董事長。
◆ 遠銀 New Century信用卡上市,整合運用集團資源與優惠。
◆ 獲全國商業總會評鑑為「2000年企業職業訓練績優單位」。
2001 ◆ 國內非金控商業銀行中,第一家獲財政部核准發行金融債券。
◆ 與 1999年全美排名第一之上市資產管理公司美國大聯合作,成立子公司遠東大聯資產管
理公司。
2002 ◆ 信用卡發卡量破百萬張,循環餘額破百億元。
2003 ◆ 發行美金 1億元之海外無擔保轉換金融債券 (ECB) ,為國內非金控之商業銀行中第 1家。
2004 ◆ 開辦 FX Margin Trading業務,配合匯率市場開放 24小時交易。
◆ 消金貸款餘額突破 1,000億元規模。
◆ 轉投資之遠銀資產管理公司成立。
2005 ◆ 發行 ETC (高速公路電子收費 ) 聯名卡。
2006 ◆ 推出遠銀 HGI信用卡 (HAPPY GO INSIDE) 與遠東台塑聯名卡。
◆ 資訊處與信用卡部通過 ISO27001安控認證,為全國第一家獲此項認證的銀行。
2007 ◆ 香港分行正式開業,並取得香港金融局核發的「全功能業務」分行執照。
◆ 獲行政院勞委會職訓局評等為「金級」企業單位。
2008 ◆ 徐旭東先生請辭董事長並任副董事長,董事長由侯金英女士接任。
◆ 與德意志銀行集團結盟,成立德銀遠東證券投資信託股份有限公司。
2009 ◆ 購買友邦國際 (AIG)信用卡 (股 )公司之信用卡業務及應收帳款資產。
◆ 經由公開標售程序,取得慶豐銀行 19家國內營業據點。
◆ 與南山人壽合作推出「遠東商銀南山認同卡」。

本行簡介Corporate Pro le
25
3.Milestones
1990 ◆ Held Convokers’ Meeting, formally setting up a bank organizing committee, and applied to the Ministry of Finance for approval to establish bank with capital of NT$10 billion.
1991 ◆ The Ministry of Finance approved the establishment of FEIB.1992 ◆ Business Department, Savings Department and Taipei Yisen Branch of FEIB began operations.1995 ◆ Stock listed on the Over The Counter (OTC) trading of securities in Taiwan.1996 ◆ President Howard L. Chang retired. Mr. Eli Hong assumed presidency.1997 ◆ Started long-term partnership with Eden Welfare Foundation.1998 ◆ Listed on the Taiwan Stock Exchange on November 27. ◆ Became the rst bank in Taiwan to assist corporations to issue Global Depositary Receipts (GDRs) and
serve as a trust bank.1999 ◆ Became Taiwan’s rst private bank to launch GDR trust banking business. ◆ Set up representative of ce in Hong Kong. ◆ Established Far Eastern Life Insurance Agency Co., Ltd. and Far Eastern International Leasing Corp.2000 ◆ Founder and Former Chairman Y. Z. Hsu passed away on December 23, succeeded by Mr. Douglas Tong
Hsu. ◆ Launched FEIB New Century Credit Card to integrate the Group resources. ◆ Awarded the title of “Outstanding Vocational Training Enterprise” by The General Chamber of Commerce
of the Republic of China in 2000.”2001 ◆ Taiwan’s rst non-holding commercial bank to issue debentures. ◆ Opened Far Eastern Alliance Asset Management Co., Ltd. with Alliance Capital Management, ranked in
1999 the largest listed asset management company in the U.S.2002 ◆ Credit cards issuance exceeded 1 million cards; total credit cards revolving balance surpassed NT$10
billion.2003 ◆ Taiwan’s rst non-holding commercial bank to issue US$100 million worth of Euro Convertible Bonds
(ECBs).2004 ◆ Began Foreign Exchange (FX) Margin Trading business with 24-hour transactions. ◆ Consumer banking loans exceeded NT$100 billion at year end. ◆ Set up Far Eastern Asset Management Co., Ltd.2005 ◆ Launched ETC (Electronic Toll Collection) Card.2006 ◆ Launched HAPPY GO INSIDE (HGI) credit card and the Far Eastern & Formosa co-branded credit card. ◆ Taiwan’s rst bank to receive ISO 27001 certi cation.2007 ◆ Of cially inaugurated Hong Kong Branch. ◆ Rated as a “Golden Grade” enterprise by the Bureau of Employment and Vocational Training.2008 ◆ Mr. Douglas Tong Hsu resigned from Chairmanship, succeeded by Ms. Ching-Ing Hou. ◆ Partnership with Deutsche Bank AG to establish Deutsche Far Eastern Asset Management Company
Limited in Taiwan which focused on retail and institutional asset management.2009 ◆ Acquired AIG’s credit cards and accounts receivable businesses. ◆ Acquired Chin-Fon Commercial Bank’s 19 domestic operating units. ◆ Launched “Far Eastern Nan Shan Co-branded card” with Nan Shan Life Insurance Company, Ltd.

26
2010 ◆ 推出「FE Direct」純網銀帳戶服務。
◆ 正式概括承受慶豐銀行 19家國內營業據點。
◆ 個人金融事業群成立「中小企業服務部」,深耕中小企業客群之財富管理與融資業務。
◆ 獲經濟部與行政院勞工委員會頒發「創造就業貢獻獎」。
2011 ◆ 開辦人民幣業務。
◆ 榮獲今週刊第 5屆財管銀行評鑑「卓越成長獎」。
◆ 投資購買 ING集團旗下在台所成立的安智證券股份有限公司 100%股權。
◆ 贊助美國 MBL球員於台灣進行明星賽。
◆ 行動銀行上線 (Android+iPhone)。
2012 ◆ 提升全行客服中心系統。
◆ 信用卡帳單新增 QR Code功能,方便客戶使用智慧型手機繳款。
◆ 推出 eTag存款帳戶及信用卡自動儲值服務。
◆ 宣佈將與萬事達卡國際組織於台灣首推「inControl」創新支付,提供更便利及安全的信用
卡支付服務。
2013 ◆ 發行 1.5億美元海外可轉債金融債券 (ECB)。
◆ 結合遠傳電信共推「遠東 HAPPY GO NFC手機信用卡」試辦服務。
◆ 榮獲今週刊第七屆財富管理銀行評鑑「最佳潛力獎」。
2014 ◆ 首次以新股參與海外存託憑證 (GDR)發行。
◆ 獲金融管理監督委員會核准開辦「電子化通路 /OTP非約定轉帳服務」。
◆ 獲中央銀行核准辦理與銀聯線上 (China Pay)合作開辦「跨境第三方支付服務」。
2015 ◆ 於大陸上海市新設「遠榮國際融資租賃有限公司」。
◆ 首創「APP設定.網路購物」專用「遠東雲端 iCloud信用卡」上市。推出「遠銀 i申請」
線上辦卡平台。
◆ 獲經濟部頒發中小企業信保基金「送保融資成長獎」。
◆ 發行 C'est Moi旅遊悠遊卡,首張結合 HAPPY GO集點、eTag自動儲值及悠遊卡功能信用
卡。
◆ 獲今周刊第九屆財富管理銀行評鑑為「最佳安心銀行」,並獲「最佳公益獎」及「最佳安
心獎」兩項獎座。
◆ 獲財金資訊公司頒發「全國繳費稅業務交易量第四名」及「最佳業務發展獎」兩項大獎。
◆ 首創可轉債選擇權 iOS行動下單 app上線。

本行簡介Corporate Pro le
27
2010 ◆ Launched “FE Direct” internet banking account. ◆ Completed the conversion of 19 domestic operating units from Chin-Fon Bank. ◆ Established “Small and Medium-sized Enterprise Banking Unit” to cultivate this target market segment. ◆ Received “Employment Contribution Award” from the Council of Labor Affairs.2011 ◆ Initiated RMB business. ◆ Received “Outstanding Growth Award” of the 5th Wealth Management Bank Review by Business Today
Magazine. ◆ Acquired 100% stake in ING Securities Company Limited from ING Insurance International B.V. ◆ Sponsored U. S. MBL to play the all-star game in Taiwan. ◆ Launched fully integrated Android mobile banking App (Android+iPhone).2012 ◆ Established the Bank’s Customer Satisfaction Representative system. ◆ Implemented the QR Code billing application for cardholders’ payment via smart phones. ◆ Launched eTag deposit accounts and auto payment by credit cards. ◆ Announced Taiwan’s innovative “inControl” service, a secured payment solution, partnered with
MasterCard.2013 ◆ Issued US$150 million of euro-convertible bonds (ECB). ◆ Worked with Far EasTone Telecommunications to launch “FE HAPPY GO NFC Mobile Credit Card” trial
services. ◆ Received “Best Potential Award” of the 7th Wealth Management Bank Review by Business Today
magazine.2014 ◆ First-time new shares issuing of GDR. ◆ Authorized by the Financial Supervisory Commission to operate “e-channel/OTP non-contractual transfer
service”. ◆ Authorized by the Central Bank to operate jointly with China Play “Cross-border Third Party Payment
Service”.2015 ◆ Established in Shanghai FEIB Financial Leasing Company. ◆ Launched Taiwan’s rst “APP set up, online shopping” exclusive “Far Eastern iCloud Credit Card”, and
introduced “FEIB i-Application” online card application platform. ◆ Received SME Credit Guarantee Fund “Financial Factory Growth Award” by the Ministry of Economic
Affairs. ◆ Issued C’est Moi Travel Easy Card, the first multi-purpose credit card integrating HAPPY GO bonus
collection, eTag automatic stored value, and easy card. ◆ Received" Best Confidence Bank' of the 9th Wealth Management Bank Review by Business Today
Magazine and granted “Best CSR Award” and “Best Confidence Award”. ◆ Received “The 4th Highest National Tax Payment Business Volume” and “Best Business Development
Award” by Financial Information Service Co., Ltd. ◆ Launched Taiwan's rst convertible option iOS mobile platform for app online order.

28
2016 ◆ 組織新設「數位金融事業群」。
◆ 推出「遠銀 HAPPY+」臉書粉絲團。
◆ 周添財執行副總經理擔任總經理。
◆ 組織新設「財務策略中心」。
◆ 獲卓越雜誌 2016年度卓越銀行評比「最佳品牌形象獎」與「最佳財富管理獎」兩項大獎。
◆ 主辦華融國際金融控股一年期港幣 30億元聯合授信案。
◆ 主辦 United Envirotech (Hong Kong) Company Limited三年期美金 1.5億元聯合授信案。
◆ 取得英國標準協會頒發 ISO 50001能源管理系統認證。
2017 ◆ 併入遠銀人身保險代理人、遠銀財產保險代理人等股份有限公司,成立保險代理事業群。
◆ 獲財訊雜誌 2017財富管理大獎「最佳理專團隊獎」。
◆ 推出「FE跨界行動應用平台」,整合支付寶、friDay錢包於愛買量販上線。
◆ 與遠東集團關係企業共同贊助太陽馬戲團 TORUK來臺演出。
◆ 主辦 Huy Vietnam Group Limited聯合授信案,為本行首件東協市場企業之國際聯貸案。
◆ 獲 2017 BSI國際標準管理年會「企業社會責任報告書永續傑出獎」。
◆ 獲 2017 TCSA台灣企業永續獎「台灣企業永續報告獎銅獎」。
遠銀培育人才不餘遺力,榮獲勞動部 TTQS人才發展品質管理獎、Toastmasters精選傑出分會獎、保發中心卓越人才培訓專案獎,以及保險龍鳳獎調查,是財金保險學子最嚮往的金融業
FEIB Wealth Management Team has often been recognized by reputable business magazines. It is the recipient of “Best Wealth Management Team Award” by Wealth Magazine in 2017, also received “Best Wealth Management Award” and “Best Innovation Award” by Excellence Magazine that highlight our brand image.

本行簡介Corporate Pro le
29
2016 ◆ Established the new "Digital Banking Group". ◆ Launched “FEIB HAPPY+” fans club on Facebook. ◆ Mr. Thomas Chou assumed the position of the President. ◆ Established the new “Financial Strategy Center”. ◆ Received “Best Brand Image Award” and “Best Wealth Management Award” by Excellence Magazine. ◆ As the mandated lead arranger and book runner of the one-year syndicated loan of HK$3 billion with
Huarong International Financial Holdings Limited. ◆ As the lead bank of the three-year syndicated loan amounted to US$150 million with United Envirotech
(Hong Kong) Company Limited. ◆ Granted the “ISO 50001 Energy Management System” certi cation by the British Standards Institutions.2017 ◆ Merged Far Eastern Life Insurance Agency Co., Ltd. and Far Eastern Property Insurance Agency Co., Ltd.
to establish the Insurance Agency Group. ◆ Received “Best Wealth Management Team Award” by Wealth Magazine in 2017. ◆ Launched “FE Mobile Payment Integrated Service”, incorporating Alipay and FriDay wallet to be put
online at A-mart Hypermarket. ◆ Co-sponsored with the Far Eastern Group “TORUK” performance of Cirque du Soleil in Taiwan. ◆ Leading bank for syndicated loan with Huy Vietnam Group Limited, FEIB’s rst international syndicated
loan in the ASEAN market. ◆ Awarded “Outstanding CSR Sustainability Report” by 2017 BSI Standards annual conference. ◆ Received “Taiwan Corporate Sustainability Award Bronze Medal” by 2017 TCSA.

30
四、本行組織系統簡圖
董事長
董事會
常務董事會
股東大會
總稽核 總經理
審計委員會
投資審議委員會
人事評議委員會
授信審議委員會
資產負債管理委員會
信託財產評審委員會
資訊業務指導委員會
風險管理委員會
群業事卡用信及金消
薪資報酬委員會
心中務服訊資及業作
執行副總經理

本行簡介Corporate Pro le
31
Chairperson
Board of Directors
Board of Managing Directors
Shareholders’ Meeting
Chief Auditor
Audit Committee
Remuneration Committee
Investment Committee
Personnel Committee
Credit Committee
Assets and Liabilities Management Committee
Trust Assets Committee
IT Steering Committee
Risk Management Committee
Auditing Dept.
Individual Banking Group
Consumer Banking &
Credit Cards G
roup
Legal Compliance D
ept.
Risk Managem
ent Dept.
Hum
an Resources Dept.
Operations &
Technology G
roup
Financial Mm
arkets Group
Corporate Banking Group
Financial Strategy Center
Digital Banking G
roup
Insurance Agency Group
President
Chief Executive Vice President
4.FEIB Organization Chart
32
Corporate Governance
一、公司治理守則
本行依銀行業公司治理實務守則,落實公司治理制度,透過健全的管理制度與監控機制,達成
營運目標,進而提升競爭力,確保股東、員工及其他利益相關者的權益,為其創造最大價值並善盡
社會責任。茲將本行遵循的公司治理原則條述如下:
1.建置有效的公司治理架構
2.遵循法令並健全內部管理
3.保障股東權益
4.強化董事會職能
5.發揮審計委員會功能
6.尊重利益相關者權益
7.提升資訊透明度
本行遵循遵守法令主管制度,建立完備的內部控制制度,並按部就班執行;董事會下設稽核處,
以獨立超然的精神執行內部稽核任務,定期向董事、審計委員會報告;本行依法召開股東會,透過
公開資訊觀測站公告重要訊息,與利害關係人及關係企業的業務往來均依規定辦理,以確保股東權
益。
董事會成員均具備執行職務能力且符合法定資格條件,定期召開董事會,負責銀行經營策略與
重大決策,監督管理階層以對股東負責,此外設置各類功能性政策委員會,協助推行各項重大政策,
並選定專業獨立的勤業眾信會計師事務所,定期查核財務狀況及內部控制實施。此外,設置審計委
員會,獨立行使審查權,有效監督業務執行,降低經營風險;同時具備完善妥適的處理機制與溝通
管道,尊重與維護員工、消費者及其它利益相關者的合法權益;設有發言人與代理發言人、建置專
屬網站、揭露法人說明會及公司治理相關資訊,以提高對外資訊的透明度。

公司治理Corporate Governance
33
1.Corporate Governance Principles
To pursue corporate governance excellence, FEIB is dedicated to achieving its operating goals through a sound management system and an effective auditing mechanism to strengthen the Bank’s competitive advantage in the market and ensure all the bene ts available to shareholders, employees and other related parties. Our goal is to create maximum shareholder value and be a good corporate citizen. The Bank’s corporate governance principles are:
1. Establish an effective corporate governance structure
2. Comply with relevant laws and regulations and enhance internal management
3. Protect shareholders’ rights and interests
4. Strengthen the power of the Board of Directors
5. Ensure the viability of Audit Committee function
6. Respect the rights of related parties
7. Enhance information transparency
Far Eastern International Bank, strictly abided by supervising laws, has established and effectively implemented a thorough internal control system, and set up an Audit Department under the Board of Directors to execute independently the internal auditing mission and report regularly to the Bank’s Board Members and Audit Committee. Furthermore, FEIB holds regular shareholders’ meetings, publicly posts important bank messages on Taiwan’s public information watch station, and handles businesses among interested parties and group af liated companies totally conforming to regulations to ensure shareholders’ equity.
FEIB board members are all equipped with professional knowhow and conform to legal quali cations. They convoke regular board meetings to decide on the operating strategies and important policies, supervise the Bank’s management and protect shareholders’ interests. Also various functional committees are set up to assist in the promotion of each major policy. The Bank has selected Deloitte & Touche to conduct regular independent audits and check and report on the Bank’s nancial situation and internal controls. Audit Committee is also organized in accordance with rules and regulations to effectively and independently audit the execution of bank operations and to lower its risk. FEIB respects and safeguards the legal rights of employees, consumers, and other interested parties. The Bank has appointed a spokesperson and acting spokesperson, set up an exclusive website, organized investors’ forums and disclosed corporate governance related information to enhance the transparency of bank information.

34
April 22, 2017
職 稱Title
姓 名Name
主要經(學)歷Major Educational (Professional) Background
目前兼任本行及其他公司之職務Other Current Positions
董事長
Chairperson
侯金英
Ms. Ching-Ing Hou
美國范德堡大學經濟學碩士 台灣大學經濟系及研究所畢業 政治大學銀行學系主任及教授、財稅系教授 台灣金融研訓院董事長 遠東新世紀 (股 )公司監察人
Master’s degree in Economics, Vanderbilt Uni-versity, U.S.A.
BA & Master’s degree in Economics, National Taiwan University
Former Professor, Dept. of Money and Banking, National Chengchi University
Former Chairperson, Taiwan Academy of Bank-ing and Finance
Supervisor, Far Eastern New Century Corpora-tion
南台科技大學董事
Director, Southern Taiwan University of Science and Technology
副董事長
Vice Chair-man
徐旭東
Mr. Douglas Tong Hsu
交通大學管理學榮譽博士 美國聖母大學企管碩士 美國哥倫比亞大學經濟碩士 遠東新世紀 (股 )公司董事長
Honorary Doctorate of Management from Na-tional Chiao Tung University in Taiwan
MA & BA, University of Notre Dame, U. S. A. Post-graduate studies in Economics at Columbia University, U. S. A.
Chairman, Far Eastern New Century Corporation
遠東新世紀 (股 )公司董事長 亞洲水泥 (股 )公司董事長 裕民航運 (股 )公司董事長 遠東百貨 (股 )公司董事長 東聯化學 (股 )公司董事長 遠傳電信 (股 )公司董事長 宏遠興業 (股 )公司董事
Chairman, Far Eastern New Century Cor-poration
Chairman, Asia Cement Corp. Chairman, U-Ming Marine Transport Corp. Chairman, Far Eastern Department Stores Ltd.
Chairman, Orient Union Chemical Corp. Chairman, Far EasTone Telecommunica-tions Co., Ltd.
Director, Everest Textile Ltd.執行董事
Executive Director
王孝一
Mr. Shaw Y. Wang
中興大學工商管理系畢業 台灣大學管理研究學分班 遠東新世紀 (股 )公司董事、首席資深副總經理
BA, Dept. of Business Administration, National Chung Hsing University
EMBA Courses, National Taiwan University Director & First Senior Executive Vice President, Far Eastern New Century Corporation
遠東新世紀 (股 )公司公益事業執行長 遠東新世紀 (股 )公司董事 遠銀資產管理 (股 )公司董事 元智大學董事
Foundation Executive Director of Far East-ern Group
Director, Far Eastern New Century Corpo-ration
Director, Far Eastern Asset Management Corp.
Director, Yuan Ze University
二、董事成員 Board of Directors
公司治理Corporate Governance
35
職 稱Title
姓 名Name
主要經(學)歷Major Educational (Professional) Background
目前兼任本行及其他公司之職務Other Current Positions
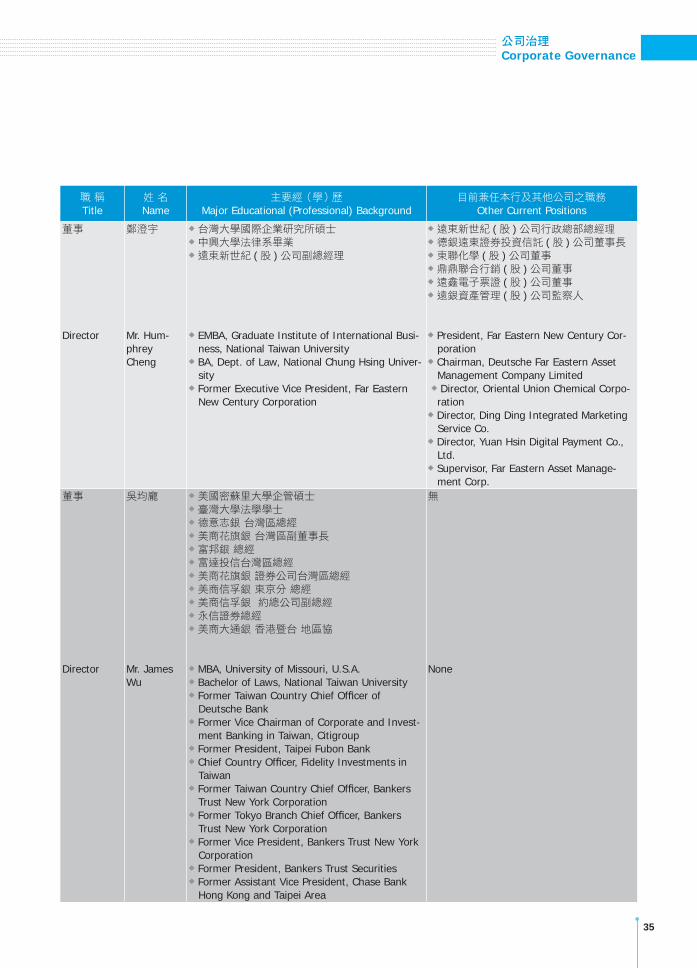
董事
Director
鄭澄宇
Mr. Hum-phrey Cheng
台灣大學國際企業研究所碩士 中興大學法律系畢業 遠東新世紀 (股 )公司副總經理
EMBA, Graduate Institute of International Busi-ness, National Taiwan University
BA, Dept. of Law, National Chung Hsing Univer-sity
Former Executive Vice President, Far Eastern New Century Corporation
遠東新世紀 (股 )公司行政總部總經理 德銀遠東證券投資信託 (股 )公司董事長 東聯化學 (股 )公司董事 鼎鼎聯合行銷 (股 )公司董事 遠鑫電子票證 (股 )公司董事 遠銀資產管理 (股 )公司監察人
President, Far Eastern New Century Cor-poration
Chairman, Deutsche Far Eastern Asset Management Company Limited Director, Oriental Union Chemical Corpo-
ration Director, Ding Ding Integrated Marketing Service Co.
Director, Yuan Hsin Digital Payment Co., Ltd.
Supervisor, Far Eastern Asset Manage-ment Corp.
董事
Director
吳均龐
Mr. James Wu
美國密蘇里大學企管碩士 臺灣大學法學學士 德意志銀 台灣區總經 美商花旗銀 台灣區副董事長 富邦銀 總經 富達投信台灣區總經 美商花旗銀 證券公司台灣區總經 美商信孚銀 東京分 總經 美商信孚銀 約總公司副總經 永信證券總經 美商大通銀 香港暨台 地區協
MBA, University of Missouri, U.S.A. Bachelor of Laws, National Taiwan University Former Taiwan Country Chief Of cer of Deutsche Bank
Former Vice Chairman of Corporate and Invest-ment Banking in Taiwan, Citigroup
Former President, Taipei Fubon Bank Chief Country Of cer, Fidelity Investments in Taiwan
Former Taiwan Country Chief Of cer, Bankers Trust New York Corporation
Former Tokyo Branch Chief Of cer, Bankers Trust New York Corporation
Former Vice President, Bankers Trust New York Corporation
Former President, Bankers Trust Securities Former Assistant Vice President, Chase Bank Hong Kong and Taipei Area
無
None

36
職 稱Title
姓 名Name
主要經(學)歷Major Educational (Professional) Background
目前兼任本行及其他公司之職務Other Current Positions
執行董事
Executive Director
鍾聰明
Mr. Tsung-Ming Chung
政治大學企業管理碩士 勤業會計師事務所會計師
MBA, National Chengchi University CPA, Deloitte & Touche
順達科技 (股 )公司董事長 致茂電子 (股 )公司獨立董事 東貝光電科技 (股 )公司董事
Chairman, DynaPack Corp. Independent Director, Chroma Ate Inc. Director, Unity Opto Technology Co., Ltd.
董事
Director
許士軍
Dr. Shi-Chun Hsu
美國密西根大學企業管理博士 台灣大學首任管理學院院長 高雄銀行董事長 元智大學教授
Ph.D., University of Michigan, U.S.A. Founding Dean, College of Management, Na-tional Taiwan University
Former Chairman, Bank of Kaohsiung Former Chair Professor of Management, Yuan Ze University
智原科技 (股 )公司董事 遠通電收 (股 )公司董事 雅茗天地 (股 )公司獨立董事 誠品生活 (股 )公司獨立董事 逢甲大學高人言先生講座教授
Director, Faraday Technology Corp.. Director, Far Eastern Toll Collection Co., Ltd.
Independent Director, Yummy Town (Cay-man) Holdings Corporation
Independent Director, Eslite Corporation Mr. Kao Jen-Yen Chair Professor, Feng Chia University
董事
Director
俞明德
Dr. Min-Teh Yu
美國俄亥俄州立大學經濟博士 中央大學財務金融學系主任 交通大學管理學院院長 靜宜大學校長 台灣大學財務金融學系教授 行政院金融重建基金管理委員會委員 行政院國家發展基金管理委員會委員 亞洲開發銀行顧問
Ph.D., Ohio State University, U.S.A. Former Dept. Chairman of Financial Manage-ment, National Central University
Former Dean, National Chiao Tung University College of Management
Former President, Providence University Former Professor, Dept. of Finance, National Taiwan University
Former Commissioner, Resolution Trust Corpora-tion (RTC), Executive Yuan
Former Commissioner, National Development Fund, Executive Yuan
Former Advisor, Asian Development Bank
智微科技 (股 )公司獨立董事 美食達人獨立董事 中國科技大學校長
Independent Director, JMicron Technology Corporation
Independent Director, Gourmet Master Co., Ltd.
President, China University of Technology

公司治理Corporate Governance
37
職 稱Title
姓 名Name
主要經(學)歷Major Educational (Professional) Background
目前兼任本行及其他公司之職務Other Current Positions
獨立董事兼常務董事
Independent Director, Managing Director
張忠本
Mr. Ben C. B. Chang
政治大學統計研究所畢業 政治大學兼任講師 輔仁大學兼任講師 和通投資控股有限公司執行董事 和通國際 (股 )公司總經理 中華開發工業銀行副總經理
Master’s degree in Statistics, National Chengchi University
Former Lecturer, National Chengchi University Former Lecturer, Fu Jen Catholic University Former Executive Director, Hotung Investment Holdings Limited
Former General Manager, Hotung International Co., Ltd.
Former Executive Vice President, China Devel-opment Industrial Bank
和碩聯合科技 (股 )公司獨立董事 瑞鼎科技 (股 )公司獨立董事 佳格食品 (股 )公司獨立董事 聚鼎科技 (股 )公司董事
Independent Director, Pegatron Corp. Independent Director, Kinsus Interconnect Technology Corp.
Independent Director, Standard Foods Corp.
Director, Polytronics Technology Corp.
獨立董事
Independent Director
沈平
Mr. Bing Shen
美國哈佛大學商學院企管碩士 美商摩根士丹利公司副總經理 摩根士丹利公司執行董事 中華開發工業銀行副總經理 開發國際投資 (股 )公司總經理
MBA, Harvard Business School, U.S.A. Former Vice President, Morgan Stanley Former Executive Director, Morgan Stanley Former Executive Vice President, China Devel-opment Industrial Bank
Former President of CDIB & Partners Invest-ment Holding
遠東新世紀 (股 )公司獨立董事 台光電子材料 (股 )公司獨立董事 中鼎工程 (股 )公司董事兼董事會公司治理委員會召集人
Independent Director of Far Eastern New Century Corporation
Independent Director of Elite Material Co., Ltd.
Director and Convener of Corporate Gov-ernance, CTCI Corporation

38
職 稱Title
姓 名Name
主要經(學)歷Major Educational (Professional) Background
目前兼任本行及其他公司之職務Other Current Positions
獨立董事
Independent Director
張秀蓮
Ms. Susan S. Chang
台灣大學國際經濟研究所碩士 台灣大學經濟系畢業 台灣銀行董事長 台灣金融控股公司董事長 金融監督管理委員會常務副主任委員 中華民國財政部常務次長 財政部國庫署署長 金融局副局長 金融司副司長 行政院經濟建設委員會經濟研究處副處長
MA, Dept. of Economics, National Taiwan Uni-versity
BA, Dept. of Economics, National Taiwan Uni-versity
Former Chairperson, Bank of Taiwan Former Chairperson, Taiwan Financial Holdings Former Vice Chairperson, Financial Supervisory Commission
Former Administrative Deputy Minister, Ministry of Finance
Former Director-General, National Treasury Administration, Ministry of Finance
Former Vice Commissioner, Bureau of Monetary Affairs
Former Deputy Chief, Dept. of Monetary Affairs Former Deputy Director, Economic Research Dept., Council for Economic Planning And De-velopment, Executive Yuan
金牛津事業 (股 )公司董事長 聯亞藥業 (股 )公司獨立董事 龍巖 (股 )公司獨立董事 生物鎵科技 (股 )公司董事 恩典科研 (股 )公司董事 安泰科技工程 (股 )公司監察人
Chairperson, Jinniujin Business Co., Ltd. Independent Director, UBI Pharma Co., Ltd.
Independent Director, Lungyeng Co., Ltd. Director, BioWare Technology Co., Ltd. Director, Grace Technology Co., Ltd. Supervisor, Entie Tech-engineering Co., Ltd.
公司治理Corporate Governance
39
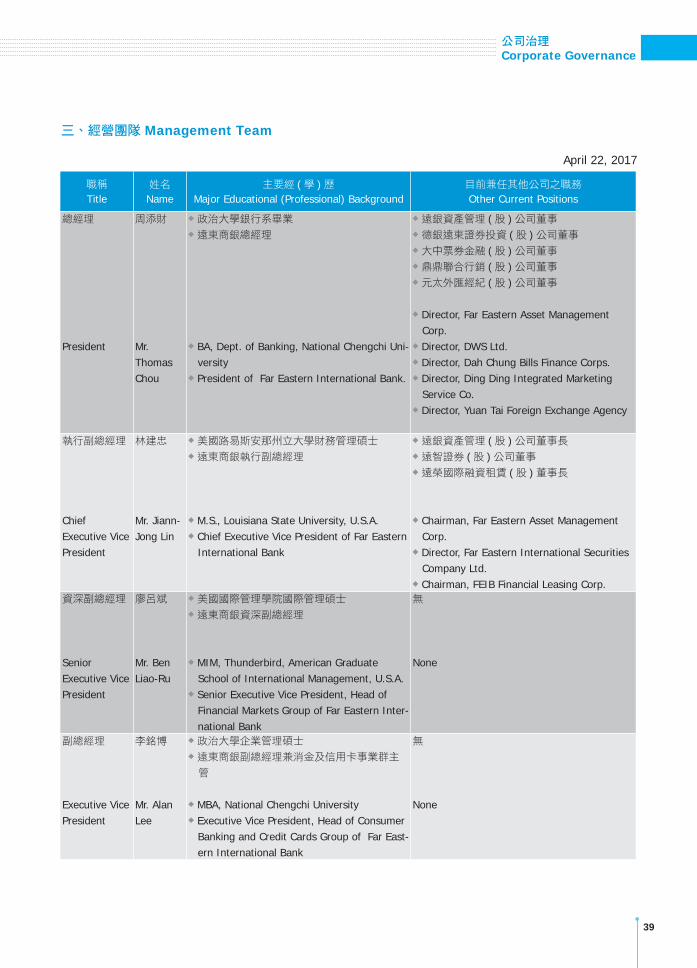
三、經營團隊 Management Team
April 22, 2017
職稱
Title姓名
Name主要經 (學 )歷
Major Educational (Professional) Background目前兼任其他公司之職務
Other Current Positions
總經理
President
周添財
Mr. Thomas Chou
政治大學銀行系畢業 遠東商銀總經理
BA, Dept. of Banking, National Chengchi Uni-versity
President of Far Eastern International Bank.
遠銀資產管理 (股 )公司董事 德銀遠東證券投資 (股 )公司董事 大中票券金融 (股 )公司董事 鼎鼎聯合行銷 (股 )公司董事 元太外匯經紀 (股 )公司董事
Director, Far Eastern Asset Management Corp.
Director, DWS Ltd. Director, Dah Chung Bills Finance Corps. Director, Ding Ding Integrated Marketing Service Co.
Director, Yuan Tai Foreign Exchange Agency
執行副總經理
Chief Executive Vice President
林建忠
Mr. Jiann-Jong Lin
美國路易斯安那州立大學財務管理碩士 遠東商銀執行副總經理
M.S., Louisiana State University, U.S.A. Chief Executive Vice President of Far Eastern International Bank
遠銀資產管理 (股 )公司董事長 遠智證券 (股 )公司董事 遠榮國際融資租賃 (股 )董事長
Chairman, Far Eastern Asset Management Corp.
Director, Far Eastern International Securities Company Ltd.
Chairman, FEIB Financial Leasing Corp.資深副總經理
Senior Executive Vice President
廖呂斌
Mr. Ben Liao-Ru
美國國際管理學院國際管理碩士 遠東商銀資深副總經理
MIM, Thunderbird, American Graduate School of International Management, U.S.A.
Senior Executive Vice President, Head of Financial Markets Group of Far Eastern Inter-national Bank
無
None
副總經理
Executive Vice President
李銘博
Mr. Alan Lee
政治大學企業管理碩士 遠東商銀副總經理兼消金及信用卡事業群主管
MBA, National Chengchi University Executive Vice President, Head of Consumer Banking and Credit Cards Group of Far East-ern International Bank
無
None
4040
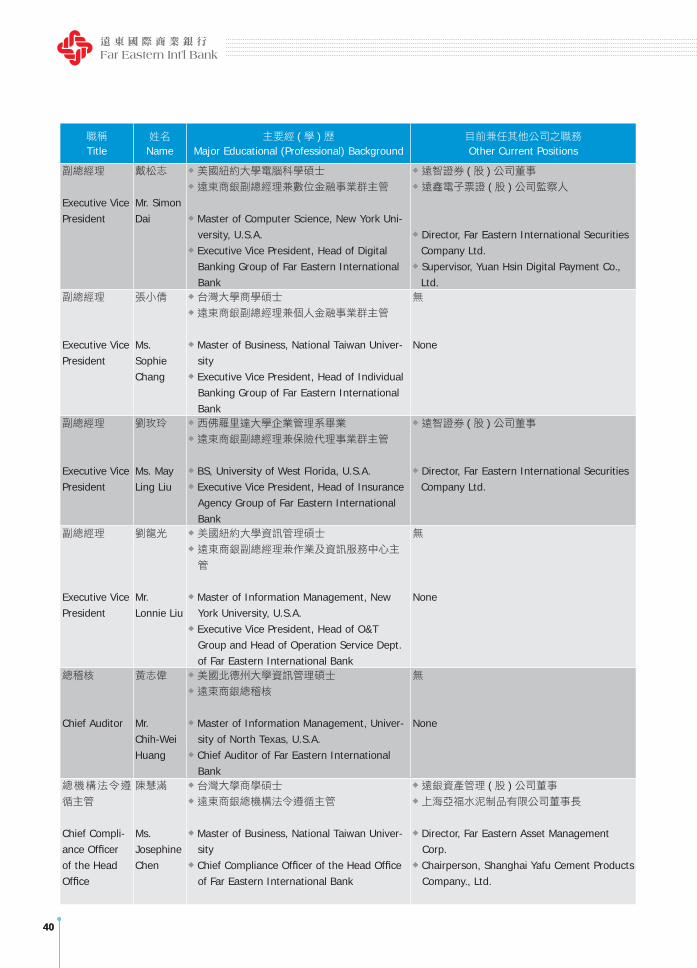
職稱
Title姓名
Name主要經 (學 )歷
Major Educational (Professional) Background目前兼任其他公司之職務
Other Current Positions
副總經理
Executive Vice President
戴松志
Mr. Simon Dai
美國紐約大學電腦科學碩士 遠東商銀副總經理兼數位金融事業群主管
Master of Computer Science, New York Uni-versity, U.S.A.
Executive Vice President, Head of Digital Banking Group of Far Eastern International Bank
遠智證券 (股 )公司董事 遠鑫電子票證 (股 )公司監察人
Director, Far Eastern International Securities Company Ltd. Supervisor, Yuan Hsin Digital Payment Co., Ltd.
副總經理
Executive Vice President
張小倩
Ms. Sophie Chang
台灣大學商學碩士 遠東商銀副總經理兼個人金融事業群主管
Master of Business, National Taiwan Univer-sity
Executive Vice President, Head of Individual Banking Group of Far Eastern International Bank
無
None
副總經理
Executive Vice President
劉玫玲
Ms. May Ling Liu
西佛羅里達大學企業管理系畢業 遠東商銀副總經理兼保險代理事業群主管
BS, University of West Florida, U.S.A. Executive Vice President, Head of Insurance Agency Group of Far Eastern International Bank
遠智證券 (股 )公司董事
Director, Far Eastern International Securities Company Ltd.
副總經理
Executive Vice President
劉龍光
Mr. Lonnie Liu
美國紐約大學資訊管理碩士
遠東商銀副總經理兼作業及資訊服務中心主
管
Master of Information Management, New York University, U.S.A.
Executive Vice President, Head of O&T Group and Head of Operation Service Dept. of Far Eastern International Bank
無
None
總稽核
Chief Auditor
黃志偉
Mr. Chih-Wei Huang
美國北德州大學資訊管理碩士 遠東商銀總稽核
Master of Information Management, Univer-sity of North Texas, U.S.A.
Chief Auditor of Far Eastern International Bank
無
None
總機構法令遵
循主管
Chief Compli-ance Of cer of the Head Of ce
陳慧滿
Ms. Josephine Chen
台灣大學商學碩士 遠東商銀總機構法令遵循主管
Master of Business, National Taiwan Univer-sity
Chief Compliance Of cer of the Head Of ce of Far Eastern International Bank
遠銀資產管理 (股 )公司董事 上海亞福水泥制品有限公司董事長
Director, Far Eastern Asset Management Corp.
Chairperson, Shanghai Yafu Cement Products Company., Ltd.

公司治理Corporate Governance
4141
法金利星行聯貸
Lei Shing Hong Syndication Loan
利星行為一總部設於香港之跨國優質企業集團,其聯貸案向為眾多同業所積極爭取主辦,競爭激烈,最終遠東商銀以最適架構勝出,共吸引 14家銀行參與,獲 1.5倍超額認購,以3年期、美金 4億元結案,寫下遠東商銀之香港企業聯貸案籌組規模新紀錄。
Lei Shing Hong Credit Limited is an outstanding multi-national corporation based in Hong Kong, many prominent banks would strive to become the leading bank of its syndication loan. After keen competition, FEIB won with the most optimal structure and attracted 14 participating banks, was over-subscribed by 1.5 times, and closed the deal with 3-year syndicated loan amounting to US$400 million, marking a new record scale for FEIB’s syndicated loan in Hong Kong.

42
四、政策委員會
(一 )資產負債管理委員會
本行為強化資產負債管理,健全資產負債結構,特設置資產負債管理委員會,負責擬定
本行資產負債政策及流動性風險管理方針,並研討利率政策,作成結論呈董事會核定後
辦理。
(二 )授信審議委員會
本行為拓展業務,提升授信品質及增進工作效能,特設置授信審議委員會,負責審議全
行超過授權經理核定範圍之授信案件,作成結論呈總經理、常務董事會或董事會核定後
辦理。
(三 )人事評議委員會
本行為建立職員管理之升遷獎懲制度,拔擢優秀人才,增進工作效率,特設置人事評議
委員會,負責審議全行人力資源規劃、人事規章、升遷、獎懲情事,作成結論呈總經理、
常務董事會或董事會核定後辦理。
(四 )投資審議委員會
本行為訂定投資決策,掌握投資效益,特設置投資審議委員會,定期開會,審議短期有
價證券投資策略交由金融市場部執行;並負責審理各項中長期專案投資計劃,作成結論
提董事會核定後辦理。
(五 )信託財產評審委員會
本行為拓展信託業務,特設置信託財產評審委員會,於每季營業終了後一個月內召開會
議,審查每一信託戶之信託財產並作成記錄,由全體出席委員簽署並送總經理及董事長
核可後呈報董事會核備。
(六 )資訊業務指導委員會
本行為建構全方位金融服務需求,特設置資訊業務指導委員會,負責研判資訊系統發展
趨勢,審議全行資訊系統架構建置,並配合業務發展,提議、監督資訊業務系統開發,
作成結論呈董事會核定後辦理。
(七 )風險管理委員會
本行為建立獨立有效之風險管理機制,提升風險管理品質,特設置風險管理委員會,負
責風險管理政策之擬定,風險管理執行成效、曝險狀況、風險決策之審議與監督,做成
結論呈報董事會核備。
(八 )薪資報酬委員會
本行為強化公司治理與健全公司董事、監察人及經理人薪資報酬制度,特依「股票上市
或於證券商營業處所買賣公司薪資報酬委員會設置及行使權辦法」設立薪資報酬委員會,
協助訂定並定期檢討董事監察人及經理人有關薪資報酬之政策、制度、標準與結構,並
向董事會提出建議。
(九 )審計委員會
審計委員會監督公司業務之執行及董事與經理人之盡職情形,並關注公司內控制度執行
情形,俾降低公司財務危機與經營風險。
公司治理Corporate Governance
43
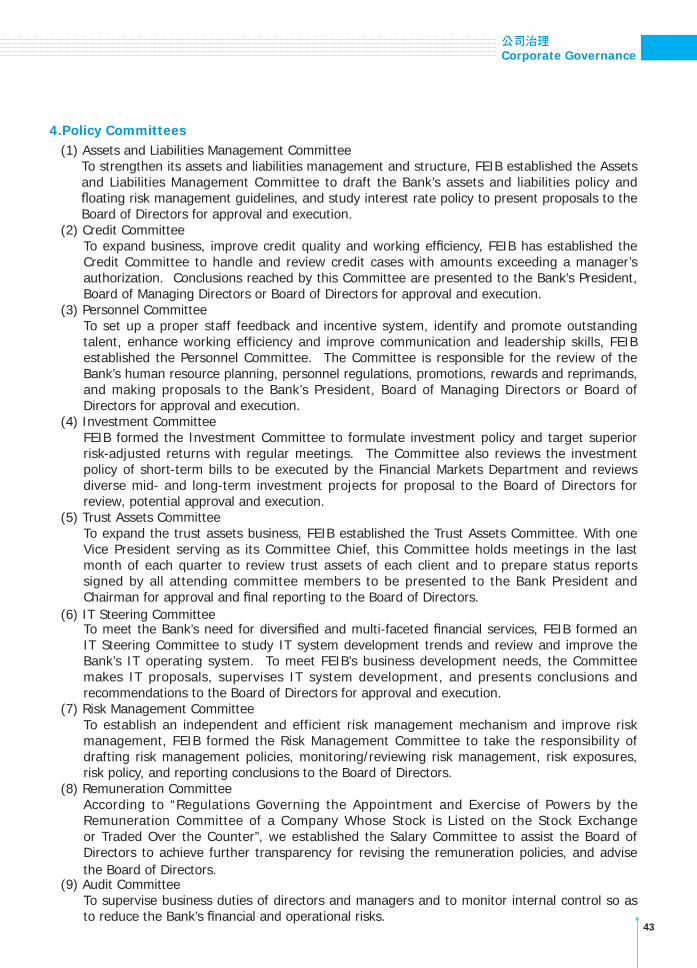
4.Policy Committees(1) Assets and Liabilities Management Committee
To strengthen its assets and liabilities management and structure, FEIB established the Assets and Liabilities Management Committee to draft the Bank’s assets and liabilities policy and oating risk management guidelines, and study interest rate policy to present proposals to the Board of Directors for approval and execution.
(2) Credit CommitteeTo expand business, improve credit quality and working ef ciency, FEIB has established the Credit Committee to handle and review credit cases with amounts exceeding a manager’s authorization. Conclusions reached by this Committee are presented to the Bank’s President, Board of Managing Directors or Board of Directors for approval and execution.
(3) Personnel CommitteeTo set up a proper staff feedback and incentive system, identify and promote outstanding talent, enhance working efficiency and improve communication and leadership skills, FEIB established the Personnel Committee. The Committee is responsible for the review of the Bank’s human resource planning, personnel regulations, promotions, rewards and reprimands, and making proposals to the Bank’s President, Board of Managing Directors or Board of Directors for approval and execution.
(4) Investment CommitteeFEIB formed the Investment Committee to formulate investment policy and target superior risk-adjusted returns with regular meetings. The Committee also reviews the investment policy of short-term bills to be executed by the Financial Markets Department and reviews diverse mid- and long-term investment projects for proposal to the Board of Directors for review, potential approval and execution.
(5) Trust Assets CommitteeTo expand the trust assets business, FEIB established the Trust Assets Committee. With one Vice President serving as its Committee Chief, this Committee holds meetings in the last month of each quarter to review trust assets of each client and to prepare status reports signed by all attending committee members to be presented to the Bank President and Chairman for approval and nal reporting to the Board of Directors.
(6) IT Steering CommitteeTo meet the Bank’s need for diversi ed and multi-faceted nancial services, FEIB formed an IT Steering Committee to study IT system development trends and review and improve the Bank’s IT operating system. To meet FEIB’s business development needs, the Committee makes IT proposals, supervises IT system development, and presents conclusions and recommendations to the Board of Directors for approval and execution.
(7) Risk Management CommitteeTo establish an independent and efficient risk management mechanism and improve risk management, FEIB formed the Risk Management Committee to take the responsibility of drafting risk management policies, monitoring/reviewing risk management, risk exposures, risk policy, and reporting conclusions to the Board of Directors.
(8) Remuneration CommitteeAccording to “Regulations Governing the Appointment and Exercise of Powers by the Remuneration Committee of a Company Whose Stock is Listed on the Stock Exchange or Traded Over the Counter”, we established the Salary Committee to assist the Board of Directors to achieve further transparency for revising the remuneration policies, and advise the Board of Directors.
(9) Audit CommitteeTo supervise business duties of directors and managers and to monitor internal control so as to reduce the Bank’s nancial and operational risks.
44
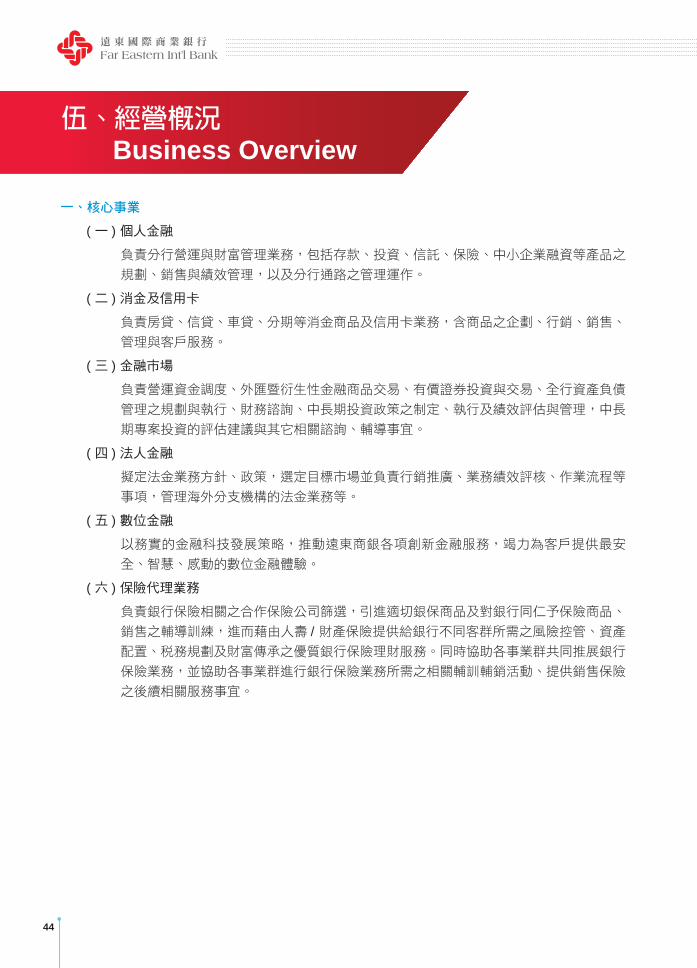
一、核心事業
(一 )個人金融
負責分行營運與財富管理業務,包括存款、投資、信託、保險、中小企業融資等產品之
規劃、銷售與績效管理,以及分行通路之管理運作。
(二 )消金及信用卡
負責房貸、信貸、車貸、分期等消金商品及信用卡業務,含商品之企劃、行銷、銷售、
管理與客戶服務。
(三 )金融市場
負責營運資金調度、外匯暨衍生性金融商品交易、有價證券投資與交易、全行資產負債
管理之規劃與執行、財務諮詢、中長期投資政策之制定、執行及績效評估與管理,中長
期專案投資的評估建議與其它相關諮詢、輔導事宜。
(四 )法人金融
擬定法金業務方針、政策,選定目標市場並負責行銷推廣、業務績效評核、作業流程等
事項,管理海外分支機構的法金業務等。
(五 )數位金融
以務實的金融科技發展策略,推動遠東商銀各項創新金融服務,竭力為客戶提供最安
全、智慧、感動的數位金融體驗。
(六 )保險代理業務
負責銀行保險相關之合作保險公司篩選,引進適切銀保商品及對銀行同仁予保險商品、
銷售之輔導訓練,進而藉由人壽 /財產保險提供給銀行不同客群所需之風險控管、資產配置、稅務規劃及財富傳承之優質銀行保險理財服務。同時協助各事業群共同推展銀行
保險業務,並協助各事業群進行銀行保險業務所需之相關輔訓輔銷活動、提供銷售保險
之後續相關服務事宜。
Business Overview

經營概況Business Overview
45
1.Core Businesses
(1) Individual BankingHandle branch operations and wealth management business, including the planning, sales and performance management of deposit, investment, trust, insurance, small and medium enterprise nancing products; as well as the management and operation of branch channels and e-channel (Internet-banking, ATM).
(2) Consumer Banking and Credit CardsHandle consumer banking products such as mortgage, credit loan, car loan, installment and credit cards business, including their planning, marketing, sales, management and customer service.
(3) Financial MarketsHandle working capital movement, FX and derivative transaction, bond investment and transaction, planning and execution of the whole Bank’s asset and liability management, nancial advisory service, the making, execution and performance review and management of mid and long-term investment strategy, review of mid and long-term project investment as well as other relevant advisory and consultation.
(4) Corporate BankingDraw corporate banking operation guideline, strategy, select target market and handle the marketing, promotion, and performance review of corporate banking products, optimize operating process, upgrade and establish relevant systems to satisfy corporate banking accounts’ nancial needs, and also in charge of overseas branch’s businesses.
(5) Digital BankingEngage in practical Fintech development strategy, promote FEIB’s various innovative banking services, and strive to provide to customers the most safe, smart, and warm digital banking experience.
(6)Insurance Agency BusinessSelect bank insurance related insurance companies to join forces with FEIB, introduce adequate bank insurance products, and offer staff training courses on insurance products and sales, thus provide quality bank insurance wealth management services to cope with the needed risk control, asset allocation, tax planning, and wealth inheritance of different customer groups through life/property insurances. Also assist each banking group to jointly promote bank insurance business, and help each business group to proceed with the required training courses, and sales activities, and provide follow-up related services after insurance sales.

46
二、本年度經營計劃
(一 ) 個人金融業務
A.財富管理:提升KYC、理財諮詢與多元資產配置能力,擴大客戶往來深度及商品滲透率。
B.客群經營:推出 e化行銷溝通模式、Big Data精準分析客戶需求、整合分行週圍店家與集團資源提供客戶專屬優惠,並結合關係企業服務,打造 VIP與家庭會員獨享尊榮禮遇,並積極搶攻高端核心客群。
C.智能理財:致力於創新科技應用,以 Fintech技術升級 CRM系統、導入 AI智能理財服務,強化資產配置效率,建置行動理專服務,主動出擊。
E.信託業務:因應數位化興起,積極開發電子票證預收業務;以退休規劃結合安養信託,量身訂做信託契約,滿足客戶退休安養需求;推廣關企員工福儲及持股信託業務,藉
以拓展財富管理業務,以期成為信託市場領先品牌。
F.中小企業放款:整合分行財富管理資源,深耕中小企業主及分行週圍店家客戶,擴大中小企業潛在客群;加強授信案件品質及貸後管理,追求獲利且兼顧風險控管。
G.分行營運:擴大分行資產規模,提升獲利動能;靈活調整分行佈點,並結合分行週圍店家與關企資源,建置特色化分行;因應數位趨勢,全面建置分行數位服務專區,打
造數位智能品牌識別。
財富管理團隊年年獲得專業財經媒體的評鑑肯定,於 2017年再度拿下財訊雜誌財富管理大調查「最佳理專團隊獎」、卓越雜誌卓越銀行評比「最佳財富管理獎」、「最佳創新獎」,為品牌加分。
FEIB Wealth Management Team has often been recognized by reputable business magazines. It is the recipient of “Best Wealth Management Team Award” by Wealth Magazine in 2017, also received “Best Wealth Management Award” and “Best Innovation Award” by Excellence Magazine that highlight our brand image.

經營概況Business Overview
47
2.Business Plans
(1) Individual Banking Business
A.Wealth Management: Elevate KYC, wealth management advisory, and diversi ed asset allocation capabilities, expand the depth of customer relations and rate of product penetration.
B.Management of Customer Segmentation: Launch e-marketing communication model, through Big Data analytics to capture customer needs fully, integrate surrounding shops and Group resources to offer exclusive bene ts to customers, incorporate Group af liates’ services, create VIP and family member exclusive premium bene ts, and proactively seek high net worth core business group.
C.Smart Wealth Management: Focus on innovative Fintech application, adopt Fintech to upgrade CRM system, introduce AI smart wealth management services, strengthen asset allocation ef ciency, set up mobile wealth manager services, and take proactive actions.
D.Trust Business: Cope with the rising digitization trend, develop prepayment of electronic bills business; combine retirement planning with elderly care trust, customize trust contracts, satisfy customers’ retirement and elderly care needs; promote Group employee welfare, deposit, and withholding trust business to expand wealth management business, and become leading brand of the trust market.
E.Small and Medium-sized Enterprise Deposit: Integrate branch wealth management resources, cultivate customers from small and medium-sized enterprise and branch surrounding store owners, expand potential customer groups in small and medium-sized enterprises; strengthen quality and after-loan management of new loan cases, and seek growth in both risk control and pro t earning.
F.Management of Customer Segmentation: Branch Management: Enlarge branch asset scale, elevate pro t momentum; seek urban
area with growth potential, flexibly adjust branch locations, incorporate surrounding stores and Group af liates resources, and set up specially featured branch; comply with digitization trend, establish the whole Bank’s branch digital service area, and build up smart digital brand recognition.
48
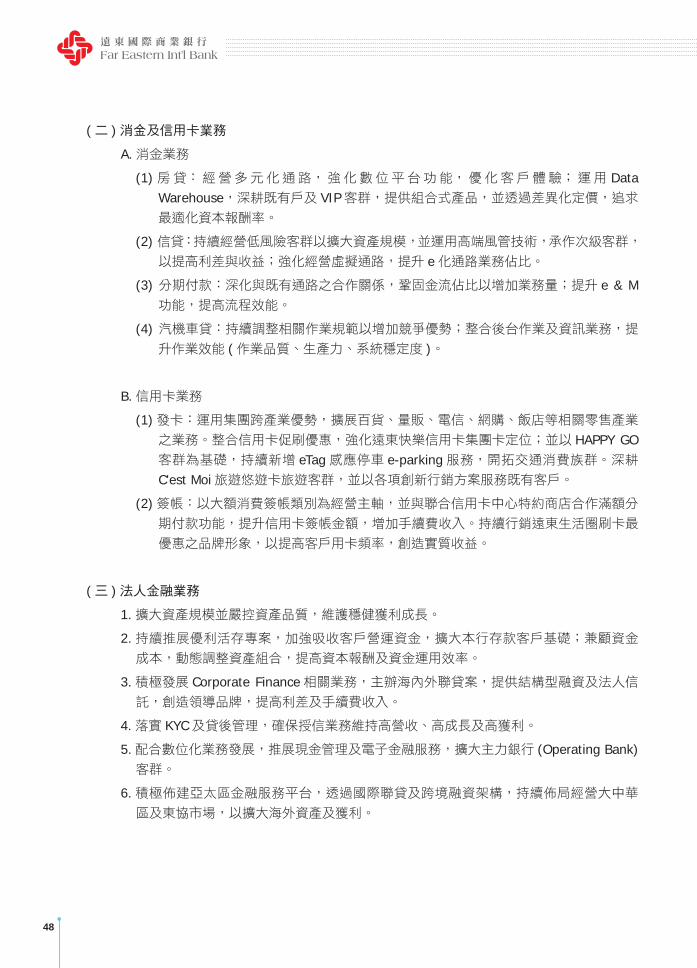
(二 )消金及信用卡業務
A.消金業務
(1)房貸:經營多元化通路,強化數位平台功能,優化客戶體驗;運用 Data Warehouse,深耕既有戶及 VIP客群,提供組合式產品,並透過差異化定價,追求最適化資本報酬率。
(2) 信貸:持續經營低風險客群以擴大資產規模,並運用高端風管技術,承作次級客群,以提高利差與收益;強化經營虛擬通路,提升 e化通路業務佔比。
(3) 分期付款:深化與既有通路之合作關係,鞏固金流佔比以增加業務量;提升 e & M功能,提高流程效能。
(4) 汽機車貸:持續調整相關作業規範以增加競爭優勢;整合後台作業及資訊業務,提升作業效能 (作業品質、生產力、系統穩定度 )。
B.信用卡業務
(1)發卡:運用集團跨產業優勢,擴展百貨、量販、電信、網購、飯店等相關零售產業之業務。整合信用卡促刷優惠,強化遠東快樂信用卡集團卡定位;並以 HAPPY GO客群為基礎,持續新增 eTag感應停車 e-parking服務,開拓交通消費族群。深耕C'est Moi旅遊悠遊卡旅遊客群,並以各項創新行銷方案服務既有客戶。
(2)簽帳:以大額消費簽帳類別為經營主軸,並與聯合信用卡中心特約商店合作滿額分期付款功能,提升信用卡簽帳金額,增加手續費收入。持續行銷遠東生活圈刷卡最
優惠之品牌形象,以提高客戶用卡頻率,創造實質收益。
(三 )法人金融業務
1.擴大資產規模並嚴控資產品質,維護穩健獲利成長。
2.持續推展優利活存專案,加強吸收客戶營運資金,擴大本行存款客戶基礎;兼顧資金成本,動態調整資產組合,提高資本報酬及資金運用效率。
3.積極發展 Corporate Finance相關業務,主辦海內外聯貸案,提供結構型融資及法人信託,創造領導品牌,提高利差及手續費收入。
4.落實 KYC及貸後管理,確保授信業務維持高營收、高成長及高獲利。
5.配合數位化業務發展,推展現金管理及電子金融服務,擴大主力銀行 (Operating Bank)客群。
6.積極佈建亞太區金融服務平台,透過國際聯貸及跨境融資架構,持續佈局經營大中華區及東協市場,以擴大海外資產及獲利。

經營概況Business Overview
49
(2) Consumer Banking and Credit Cards Business
A.Consumer Banking(1)Mortgage Loan: Operate with diversified channels, strengthen digital platform,
and optimize customer experience; adopt Data Warehouse, cultivate existing and VIP customers, offer integrated products, and seek most optimal capital return via differentiated pricing.
(2)Personal Loan: Continue to run low-risk customers to expand asset scale, and undergo re ned risk management, undertake subprime customers, to increase interest rate spread and pro t; strengthen virtual channels, and elevate business ratio of e-channels.
(3)Installments: Deepen cooperation with existing channels, consolidate ratio of money ow to increase business volume; enhance e&M, and expedite process pro ciency.
(4)Auto and Motorcycle Loan: Continue to adjust relevant operating guidelines to improve competitive strength; integrate back station process and data business to improve operating pro ciency. (operating quality, productivity, and system stability)
B.Credit Cards(1)Card Issuance: Leverage the Group’s cross-industry edge and diversi ed services, expand
into retail, telecom, online shopping, and hotel sectors, integrate credit cards incentive programs, and strengthen the Group card position of FE Happy Credit Card. Based on the customer base of HAPPY GO, and continue to add the new censor e-parking service of eTag to expand into commuter group. Continue to issue C’est Moi Travel Easy Card to explore the overseas traveling customers, and implement various creative marketing programs to better serve the existing customers.
(2)Spending Volume: Focus on large spending categories and cooperate with franchised stores of National Credit Card Center to increase commission income. Continue to promote the image of offering most comprehensive discounts by Far Eastern Group credit card to boost frequent spendings and create substantial pro ts.
(3)Corporate Banking Business
1.Expand asset scale, enforce strict control of asset quality, and maintain steady pro t growth.2.Continue to promote high interest demand deposits, focus on absorbing operating capital
from customers, and enlarge the Bank’s deposit account base; take into account capital cost, engage in dynamic adjustment of portfolio, increase capital return and capital utilization efficiency; periodically monitor liquidity ratio of LCR and NSFR, and strengthen the risk management of liquidity.
3.Proactively develop Corporate Finance businesses, lead in international syndicated loans, provide structured nancing and corporate banking trust, create leading brand, and increase interest rate spread and commission income.
4.Focus on KYC and after loan management to ensure that the loan businesses maintain to register high revenues, high growth, and high pro ts.
5.Cope with digital business development model, promote cash management and e-banking, and expand Operating Bank customers.
6.Proactive deployment of Asia Pacific financial service platform, through international syndicated loans and cross-border nancing structure, continue to operate Greater China and ASEAN markets, thus enlarge overseas assets and pro ts.

50
(四 ) 金融市場業務
A.金融交易業務:
衡量各項產品之風險與報酬,適度承擔風險及良好之股債資產配置作為銀行獲利基礎,
輔以擴展新種業務與交易對手以分散風險,積極參與金融市場交易,擴展交易服務平
台商品。
B.金融行銷:
持續提供客戶外匯相關之傳統及衍生性新金融商品相關服務,並積極研發、推廣利率
及商品等標的相關之金融商品及結構型商品。外匯保證金交易本年度將以加強 FETP網際網路交易及行動下單平台功能為主,維持市場領導地位。
C.金融同業存款授信業務:
授信方面:針對金控轉投資大陸租賃公司提供授信暨相關金融服務;爭取高利差、信
評佳之金融機構國際聯貸案及次級市場轉讓授信案;檢視授信動用情形,
適度調整閒置額度,增加可運用資金利用效能。
存款:分散客戶群及存款天期,加強吸收長期而穩定之資金,提升全行流動性覆蓋比
率 (LCR)及淨穩定資金比率 (NSFR)。
(五 )數位金融業務
A.數位轉型:
(1)積極推動金融服務數位化,升級數位金融服務流程,使本行「離櫃率」快速攀升。客戶交易包括存款、提款、轉帳、投資、換匯等五大類,離櫃率從 2016年平均 84.3% 快速攀升至 2017年平均 86.2%。
(2)漸進式的規劃人工智慧服務,2017年遠銀已推出遠東商銀新官網與行動網銀APP,提供客戶友善的使用介面,將持續研究數位場景應用,規劃智慧助理,適時提供客戶需要的金融資訊;並積極發展數位平台,最終目標將人工智慧 (AI)應用在本行數位服務中。
B.研發創新:
(1)著重 Fintech領域之創新,於各項數位專案發展過程中,不斷研發獨創技術,並積極申請專利,爭取業界前導地位。
(2)發展行動應用生態圈,以 FE跨界行動應用平台 (FE Mobile Payment Integration Service)為核心,結合大型零售通路快速導入 QR code支付,同時為各企業提供帳務整合服務,使遠銀成為各企業的金流服務平台。
(3)提升企業客戶服務品質,遠東商銀二代企網銀上線,同時遠東商銀首創「企業 e客服」,透過遠端輔助系統同步連線企業客戶電腦螢幕畫面,直接指導客戶進行線上
設定或排除問題,便利、安全及快速的解決客戶疑問。

經營概況Business Overview
51
(4)Financial Market Business
A.Financial Transactions:Evaluate risk and reward of each product, moderately endure risk tolerance, and gain pro t for the Bank with proper portfolio allocation, aided with expansion of new business products and trading partners to disperse risk, proactively engage in financial market transactions, and expand products on the service platform.
B.Treasury Marketing: Continue to offer customers related traditional and new derivative products, engage in R&D, promote nancial and structured products focusing on interest rate and commodity. This year the Bank aims to enhance FETP network & mobile transaction platform and maintain market lead position.
C.Financial Institute Deposits and Loans:Loans: Provide lending and other relevant financial services to the leasing companies
in China. Seek for international syndicated loans with high interest spread and reputable financial institutions as well as secondary market transfer business. Review credit withdrawal, properly adjust idle credit line, and enhance ef ciency of capital usage.
Deposits: Disperse customer groups and period of deposits, strive to absorb long-term and steady capital to elevate the Banks’ LCR and NSFR.
(5) Digital Banking Business
A.Digital Transformation(1)Proactively promote digitalized banking services and upgrade digital banking service
process. FEIB off-counter rate quickly rises~off-counter rate of the five major categories of customer transactions including deposit, withdrawal, transfer, investment, and foreign exchange grew from 84.3% in 2016 to 86.2% in 2017.
(2) Progressive planning of AI services, FEIB launches new website and mobile banking APP, offers customers with affable interface, will continue to study digital scenario application, designs intelligent assistant, timely provides the needed financial information; and continues to develop digital platform, with the ultimate goal to apply AI on the Bank’s digital services.
B. Research and Development(1)Focus on innovation in Fintech, unceasingly seek for unique technology and measures
when developing various digital projects, and proactively apply for patents, and gain leading position in the banking business.
(2)Develop mobile application ecosystem, with the core “FE Mobile Payment Integrated Service”, combine large retail channels to quickly introduce QR code payment, also to offer integrated payment service for each enterprise, enabling FEIB to become each enterprise’s money ow service platform.
(3)Elevate corporate banking service quality, launch the second generation FEIB online banking, also initiate FEIB’s first “enterprise e-customer service,” aided by remote support system to simultaneously link with enterprise customer’s computer screen, directly instruct customers to proceed with online setting or problem elimination, and provide convenient, safe, and quick solutions for customers’ doubts.

52
(4)整合虛實通路,打造全通路 (Omni Channel)智能服務,配合行動銀行 App改版上線,提供客戶 O2O雲端櫃台服務,客戶透過手機即可進行線上預約分行櫃台服務(Online to Of ine),大幅提升服務效率。
C.數位行銷:
(1)以靈活策略經營自媒體 (Own media),持續擴大臉書粉絲團及VIP Line@會員人數,以場景應用經營數位平台,並培養數位客群,以利新產品上線之導客效應。
(2)持續舉辦遠銀日、享樂系列活動,針對 VIP會員進行邀約與回饋,有效提升客戶對遠銀認同感;並大力推廣 VIP 家庭會員專案,增加會員忠誠度。
(3)運用 Big Data技術分析資料,預測客戶需求,提供客戶適切的金融服務。
(六 ) 保險代理業務
A.結合關企資源,提供遠傳電信行動裝置保險代理服務;與亞東證券跨售保險合作,積極拓展保險關企通路與商機。
B.運用保險科技 (InsurTech)推進 e化作業,並引進數位管理工具,加強業務品質及售後服務管理。
C.落實 One Bank理念,協助推廣本行其他業務,如:活存 /定存 /TMU/ACH等業務,提高全行收益。
D.隨時關注保險市場動向,持續與保險公司合作推出高競爭力之商品,提升銀行保險服務之競爭力。

經營概況Business Overview
53
(4)Integrate virtual and physical channels, create Omni Channel smart services, cope with revised mobile banking APP online, provide customers with O2O cloud counter service, allowing customers to reserve online to of ine service on their cell phones, and therefore greatly enhance convenience.
C.Digital Marketing(1)Operate own media with flexible strategy, continue to expand fans page and
membership on Facebook and VIP Line@; use case scenario to build up and operate digital platform, and cultivate digital clientele to facilitate lead customer effect when the Bank launches new product online.
(2)Continue to sponsor FEIB Day, VIP for Fun series event, invite VIP members to participate and gain feedback, effectively elevate customer’s recognition of FEIB; strive to promote VIP family member programs, and increase loyalty.
(3)Apply big data analytics to predict customer needs, and provide customers with optimal nancial services.
(6) Insurance Agency Business
A.Incorporate Group resources, provide insurance agency services to mobile devices of Far EasTone Telecom, cooperate with Oriental Securities for insurance cross sales, and proactively expand insurance channels and business opportunities.
B.Apply InsurTech to promote e-operations and introduce digital management tools to strengthen business quality and after-sales policy service management.
C.Focus on One Bank concept, assist promotion of the Bank’s other businesses, such as current deposits/time deposits/TMU/ACH and etc. to improve the whole Bank’s revenues.
D.Always attentive to insurance market movement, continue to cooperate with insurance companies to launch highly competitive insurance products, and elevate competitive strength of our bank insurance services.

54
三、長、短期業務發展計畫
A.短期業務發展計畫
1.鎖定優質客戶、擴大資產規模,落實動態式風險管理,嚴控資產品質。
2.為滿足客戶投資組合及風險管理需求,將持續投資 CRM系統建置及大數據預測模型之建置與改善,並導入 AI智能理財,以提升客戶投資組合管理的深度與廣度。
3.加強中小企業客群經營,結合分行資源,提升服務品質與效率,並積極推動政策支持之信保與產業專案,持續擴展業務量。
4.強化金融市場業務,以更快捷與方便的交易方式提供服務,以滿足客戶交易、投資與避險的需求。
5.積極推廣 TMU、ACH等利基型業務,強化交叉銷售團隊合作,增加多元收益。
6.持續調整策盟車貸業務之合作流程,強化作業效能,鞏固分期既有策盟業務量,另導入AR業務擴大市佔規模。
7.持續推動 e & M化流程服務,並進一步進行 O2O線上 /線下整合,打造全通路 (Omni Channel)智能服務,提供消費者最佳的使用者體驗。
8.加強經營以遠東快樂信用卡為主之大額消費產業如百貨、旅遊、3C、量販等,並加強海外地區與虛擬通路消費活動,擴大發卡與簽帳規模。
9.充分運用企業電子金流平台,提供大中華區帳戶整合、境內及跨境轉帳 /匯款之全方位現金管理服務,使本行成為客戶之主力資金往來銀行。
10.擴大海外投資及增設業務據點,籌備胡志明市及新加坡辦事處,增資遠榮租賃擴大營業規模。
11.持續累積 Fintech研發實力,於數位專案發展過程中找尋創新機會並申請金融科技專利。
12.深化高資產客戶經營,結合集團資源,提供專屬尊榮禮遇方案,如專屬講座、健檢專案、百貨購物優惠等。
13.以數位廣告為主,平面媒體議題操作為輔,做為遠東商銀自媒體經營佈局重點,持續營造首創、專利等數位專家形象,並且推出數位廣告結合影音素材,強勢吸睛。
經營概況Business Overview
55
3. Short and Long-term Development Plans:
A. Short-term Development Plans
1. Target quality customers, expand asset scale, implement dynamic risk management, and strictly control asset quality.
2. To satisfy customer needs for portfolio and risk management, will continue to invest in establishing CRM system and establishment/improvement of Big Data Prediction Mode, and introduce AI smart banking to elevate the depth and scope of customer portfolio management.
3. Strengthen the operation of small and medium-sized enterprise customers, elevate service quality and efficiency, and proactively promote Government sponsored credit insurance and industrial projects, and continue to expand business volume.
4. Fortify financial market businesses and serve customers with more speedy and more convenient trading methods to satisfy the trading, investment, and hedging needs of customers.
5. Proactively promote niche businesses such as TMU and ACH, strengthen cross sale teamwork, and increase diversi ed earnings.
6. Continue to adjust cooperation process of auto loans with strategic partners, strengthen operating ef ciency, consolidate existing business volume of installments with strategic partners, and introduce AR business to expand market share.
7. Continue to promote e&M process service, further proceed with O2O online/offline integration, create Omni Channel smart services, and provide consumers with best user experience.
8. Fortify the operation of large volume spending categories of FE Happy Credit Cards in department stores, travels, 3C, hypermarket, and etc., strengthen spending activities via overseas areas and virtual channels, and expand card issuance and spending scale.
9. Fully adopt enterprise e-banking money flow platform, provide account integration in Greater China and omni cash management services in domestic and cross-border transfers/remittances, making FEIB customers’ major fund transfer bank.
10.Expand overseas investment and increasing operation locations, prepare the establishment of Ho Chi Minh and Singapore Offices, and capital increase in FEIB Financial Leasing Company to enlarge operation scale.
11. Continue to accumulate Fintech R&D capabilities, seek innovation opportunities in the process of developing digital projects, and apply for Fintech patents.
12. Deepen the management of high net worth customers, incorporate Group resources, provide exclusive premium treatment projects such as exclusive seminars, physical checkups, department stores shopping discounts, and etc.
13. Rely mainly on digital advertisement, supplemented by media operation as focus of deployment of FEIB’s own media operation, continue to create original and patent digital expert image, and launch digital advertisement combining audio and video materials, to successfully attract eyeballs.

56
14.運用「FE跨界行動應用平台」,協助商家佈建行動支付基礎建設,支援多錢包服務,建構行動應用生活圈。
15.持續深耕銀行保險業務,與保險公司合作引進最適切的保險商品,提供客戶所需之人壽及財產保險服務,並提供企業風管與損害保障方案;同時發揮集團綜效,提供跨集團事業體
之保險服務。
B.長期業務發展計畫
1.以樂活態度落實遠銀財富管理品牌精神,實踐理財與生活 Happy+,以期滿足客戶不同人
生階段的財富管理需求,替客戶實現財富保值與資產增值。
2.持續精進財富管理諮詢及規劃能力,並加強稅務規劃、退休規劃等業務範疇,以滿足客戶個人、家庭理財、跨世代資產傳承的需求。
3.優化中小企業服務模式,建立客群分層經營,並針對中小企業客戶設計產業專案或產品,提高服務效率並滿足客戶需求。
4.整合集團數位錢包,深化集團零售通路合作策略,締造雙贏營運績效。
5. 以產業脈動設定目標客群,積極佈局海外市場,擴大海外資產規模及獲利佔比。
6.發展交易金融業務,拓展存款客源,優化存款結構,穩固放款利差。
7.持續優化數位化通路,提供客戶更快速及更便利金融服務;持續運用大數據分析,發展銷售契機。
8.掌握核心技術,加強創新金融科技應用,研究數位商業模式,進而開發出新數位金融商品,增加創新業務營收。
9.持續強化社群媒體經營的能力,推出適合的數位金融商品;發展遠銀數位品牌,並持續運用自媒體操作,建立本行數位專家形象。

經營概況Business Overview
57
14. Adopt “FE Mobile Payment Integrated Service”, assist shops to set up mobile payment infrastructure, support multi-wallet service, and constitute mobile application life region.
15. Continue to cultivate bank insurance businesses, cooperate with insurance companies to introduce the most optimal insurance products, offer customers the needed life and property insurance services, and provide enterprise risk control and damage protection projects; also enhance Group synergy to provide cross-af liates insurance services.
B. Long-term Development Plans
1. With LOHAS attitude to ful l FEIB wealth management brand spirit, implement wealth and life Happy+, satisfy customers’ wealth management needs in different life stages, and realize for customers wealth preservation and asset appreciation.
2. Continue to improve wealth management advisory and planning capability, strengthen tax planning, retire programs businesses to satisfy customers’ personal, family wealth management, cross-generation asset inheritance needs.
3. Optimize small and medium-sized enterprise service model, establish customer segmentation operation, and design industrial projects or products aiming at small and medium-sized enterprise, elevate service ef ciency, and satisfy customers’ needs.
4. Integrate Group digital wallets, deepen Retail Group channel cooperation, and deliver win-win operating performance.
5 Search target customers along with industry trend, proactively deploy overseas market, and expand overseas asset scale and pro t ratio.
6 Develop trading financial business, explore deposit customer base, optimize deposit structure, and maintain steady interest rate spread.
7 Continue to optimize digitized channels, provide customers with more speedy and more convenient financial services; continue to adopt Big Data analytics, and develop marketing opportunities.
8 Seize core technology, strengthen application of innovative Fintech, study digital business model, thus develop new digital financial products, and increase innovative business earnings.
9 Continue to strengthen capability for social media operations, launch adequate digital nancial products; develop the Bank’s digital brand, continue to implement own media operation, and establish FEIB digital brand image.

58
Financial Information一、合併簡明資產負債表 Consolidated Simpli ed Balance Sheet
新台幣千元 (NT$ ,000)
年 度 Year項 目 Item 2015 2016 2017
現金及約當現金、存放央行及拆借銀行同業Cash, Cash Equivalents, Due from Central Bank and Due from Banks 85,132,512 40,106,638 31,044,704
透過損益按公允價值衡量之金融資產Financial Assets at Fair Value Through Pro t or Loss 39,672,053 33,830,105 30,208,333
備供出售金融資產Available-for-Sale Financial Assets 27,478,135 79,594,706 109,631,578
避險之衍生金融資產Derivative Financial Assets for Hedging - - -
附賣回票券及債券投資Securities Purchased under Resale Agreements 15,344,855 6,396,656 11,071,393
應收款項 -淨額Net Receivables 20,853,418 22,847,242 22,750,869
當期所得稅資產Current Tax Assets 3,085 4,117 7,372
貼現及放款 -淨額Net Loans and Discounts 334,063,822 355,963,672 351,056,762
持有至到期日金融資產Hold-to-Maturity Financial Assets 3,125,209 2,630,635 2,135,246
採用權益法之投資 -淨額Net Investments in Equity 1,658,037 1,702,220 1,774,066
其他金融資產 -淨額Net Other Financial Assets 13,739,260 12,841,547 10,344,836
不動產及設備 -淨額Net Properties and Equipment 2,840,692 2,889,674 2,889,392
無形資產 -淨額Net Intangible Assets 1,776,051 1,750,568 1,725,085
遞延所得稅資產 -淨額Net Deferred Tax Assets 631,541 635,104 584,502
其他資產Other Assets 236,211 222,399 200,142
資產總額Total Assets 546,554,881 561,415,283 575,424,280
央行及銀行同業存款Due to Central Bank and Other Banks 13,194,889 7,432,194 6,960,774
透過損益按公允價值衡量之金融負債Financial Liabilities at Fair Value Through Pro t or Loss 9,588,248 7,954,542 4,319,121
避險之衍生金融負債Derivative Financial Liabilities for Hedging - - -
附買回票券及債券負債Bonds Sold under Repurchase Agreements 3,743,155 13,711,223 12,921,364
應付款項Payables 3,964,144 5,799,874 6,488,285
當期所得稅負債Current Tax Liabilities 422,618 405,097 254,446
存款及匯款Deposits Accepted and Remittances Payable 451,294,909 452,720,460 472,392,183

財務狀況Financial Information
59
新台幣千元 (NT$ ,000)
年 度 Year項 目 Item 2015 2016 2017
應付債券Bank Debentures 20,312,370 24,309,357 20,216,664
其他金融負債Other Financial Liabilities 3,030,963 6,385,369 7,416,775
負債準備Provisions 1,127,306 1,240,278 1,127,116
其他負債Other Liabilities 898,631 506,012 540,880
負債總額Total Liabilities
分配前Before Distribution 507,577,233 520,464,406 532,637,608
分配後 (註 )After Distribution 508,790,530 521,771,180 -
歸屬於母公司業主之權益Equity Attributable to Owners of The Bank 38,977,648 40,950,877 42,786,672
股 本Capital
分配前Before Distribution 30,332,430 31,113,672 31,829,286
分配後 (註 )After Distribution 30,939,079 31,829,286 -
資本公積Capital Surplus 459,918 456,426 456,426
保留盈餘R e t a i n e d Earnings
分配前Before Distribution 8,300,405 9,609,340 10,486,758
分配後 (註 )After Distribution 6,480,459 7,586,952 -
其他權益Other Equity (115,105) (228,561) 14,202
權益總額Total Equity
分配前Before Distribution 38,977,648 40,950,877 42,786,672
分配後 (註 )After Distribution 37,764,351 39,644,103 -
會計師查核意見Independent Auditors’ Report
無保留意見Unquali ed
Opinion
無保留意見Unquali ed
Opinion
無保留意見Unquali ed
Opinion
會計師姓名Names of Auditors
吳世宗、楊承修Wu Shih-tsungYang Cheng-xiu
吳世宗、楊承修Wu Shih-tsungYang Cheng-xiu
吳世宗、楊承修Wu Shih-tsungYang Cheng-xiu
註 : 分配後數字,依據次年股東會決議之情形填列。Note: Total liabilities, retained earnings & total Equity after distribution will be con rmed at general shareholders’ meeting.

60
二、合併簡明損益表 Consolidated Simpli ed Statements of Income
單位:新台幣千元 (NT$ ,000)
年 度 Year 項 目 Item 2015 2016 2017
利息收入Interest Income 11,989,434 9,629,219 10,057,931
利息費用Interest Cost 6,185,693 3,844,797 4,653,057
利息淨收益Net Interest Income 5,803,741 5,784,422 5,404,874
利息以外淨收益Noninterest Income and Gains, Net 5,423,986 4,963,033 5,015,382
淨收益Net Pro t 11,227,727 10,747,455 10,420,256
呆帳費用及保證責任準備提存 (迴轉利益 )Provision (Reversal of Provision) for Possible Losses and Guarantee Obligations Reserve
32,816 452,001 731,847
營業費用Operating Expense 6,575,291 6,479,552 6,420,765
繼續營業單位稅前淨利Pre-Tax Income from Continued Operations 4,619,620 3,815,902 3,267,644
所得稅 (費用 )利益Income Tax (Expense) Bene t (705,488) (572,016) (413,761)
繼續營業單位本期淨利After-Tax Income from Continued Operations 3,914,132 3,243,886 2,853,883
停業單位損益After-Tax Income from Discontinued Operations
本期淨利Net Income 3,914,132 3,243,886 2,853,883
本期其他綜合損益 (稅後淨額 )Other Comprehensive Income (Loss) for The Year, Net of Tax (44,146) (228,461) 288,686
本期綜合損益總額Total Comprehensive Income 3,869,986 3,015,425 3,142,569
淨利歸屬於母公司業主Net Income Attributable to Owners of The Bank 3,914,132 3,243,886 2,853,883
淨利歸屬於非控制權益Net Income Attributable to Non-Controlling Interests - - -
綜合損益總額淨利歸屬於母公司業主Total Comprehensive Income Attributable to Owners of The Bank
3,869,986 3,015,425 3,142,569
綜合損益總額歸屬於非控制權益Total Comprehensive Income Attributable to Non-controlling Interests
- - -
每股盈餘EPS (NT$) 1.24 1.02 0.90

財務狀況Financial Information
61
三、合併資本適足性 Consolidated Capital Adequacy
單位:新台幣千元 (NT$ ,000)
年度 Year分析項目 Analysis Items 2016 2017
自有資本Net Capital
普通股權益Common Equity Tier I 38,122,066 39,698,325
非普通股權益之其他第一類資本Additional Tier I Capital - -
第二類資本Tier II Capital 14,947,886 12,185,406
自有資本Net Capital 53,069,952 51,883,731
加權風險性資產額Total Risk-Weighted Assets
信用風險Credit Risk
標準法Standardized Approach 358,837,133 322,187,276
內部評等法Internal Rating Based Approach - -
資產證券化Asset Securitization - -
作業風險Operating Risk
基本指標法Basic Indicator Approach 19,910,475 19,646,350
標準法 /選擇性標準法Standardized Approach/Alternative Standardized Approach
- -
進階衡量法Advanced Measurement Approach - -
市場風險Market Risk
標準法Standardized Approach 16,796,650 14,948,088
內部模型法Internal Models Approach - -
加權風險性資產總額 Total Risk-Weighted Assets 395,544,258 356,781,714
資本適足率Capital Adequacy Ratio 13.42% 14.54%
第一類資本佔風險性資產之比率Ratio of Tier I Capital to Risk Assets 9.64% 11.13%
普通股權益占風險性資產之比率Ratio of Common Equity to Risk Assets 9.64% 11.13%
槓桿比率Leverage Ratio 5.97% 6.12%

62
四、轉投資公司概況及未來計畫
(一)遠智證券 :
1.獲利原因 :
本公司 2017年獲利 42,666仟元,再創歷史新高。收益面因財富管理部優質業務同仁的加入及結構型商品銷售大幅成長的動能下,致 2017年度之營業收益達 276,704仟元,與 2016年度營業收益 253,219仟元相較成長 23,485仟元;營運成本面則因商品成本控制得宜,致經紀經手費支出佔總收益之比重以維持 2016年度之 9%,而其他營業支出及費用則在本公司持續有效之撙節及控管下,整體支出及費用得以控制於預算
內。
2.未來一年經營策略
2018年將強化公司風險管控,持續投入作業流程改善及系統應用面等提升,整合公司業務資源並積極發展通路布局,追求公司穩健成長邁進,其經營重點如以下幾點 :
(1)落實公司內稽內控制度及法令遵循,持續加強防制洗錢與打擊資恐審查機制。強化資訊安全,提升公司整體風險控管能力。
(2)財富管理業務面,擴大招募財富管理顧問並提升整體業務人員生產力,做到高資產客戶差異化服務。
(3)證券經紀業務面,加速推廣股票交易電子化系統,規劃債券電子化交易平台,積極開發國外上手券商,提升銀行通路的業務發展。
(4)落實人員招募選才、訓練及留才措施。
(5)持續撙節支出及費用控管,追求最大收益目標。
(二 )遠銀資產
1.獲利原因:
主要為購買不良債權及合作開發案之投資報酬。
2.未來計劃:
1.陸續購入新的 NPL以獲取服務費收益;
2.藉由各項管道於市場上購入新的法拍不動產,並加以處分,以增加收益。

財務狀況Financial Information
63
4.Reinvestment Performance and Plans
(1)Far Eastern International Securities Company Ltd.
A.Pro t Analysis:In 2017, the Company again registered a record high pro t at NT$42.666 million. Thanks to efforts made by quality staffs of the new Weal Management Group and growth momentum of structured product sales, 2017 revenues grew YoY from NT$253.219 million to NT$276.704 million; with adequate control of the product cost, the ratio of brokerage fee maintained at 9%, same as that of 2016, and due to continuous stringency in operating expenses, the overall expenses were under budget.
B.Investment Plan for the Following Year:Further strengthen risk management in 2018, continue to improve operating process and system upgrade, integrate company resources and proactively develop channel deployment, and pursue steady growth, major focus as follows:(1) Fortify internal audit and legal compliance of the company, continue to strengthen
anti-money laundering and counter terrorism nancing review mechanism. Fortify information security, and elevate the company’s overall risk management capability.
(2) With regard to wealth management, expand the recruit of wealth management advisor, and elevate productivity of sales representatives, and offer differentiated services to high net worth customers.
(3) In terms of stock brokerage, expedite to promote digital stock trading system, plan for digital platform of bonds transaction, proactively develop foreign brokers, and improve business in bank channels.
(4) Ful ll talent recruiting, training and retaining.(5) Continuously save cost and control expense, and seek for maximum pro ts.
(2)Far Eastern Asset Management Corp.
A.Pro t Analysis:Mainly due to purchase of non-performing loans and return on investment from joint development projects
B.Investment Plan for the Following Year:(1) Continue to purchase new NPL to generate service fee income.(2) Purchase via various channels new court auction real estates from the open market,
and dispose of these assets to increase revenues.

64
(三)關係企業相關資料
遠東國際商業銀行
遠銀資產管理股份有限公司
遠榮國際融資租賃有限公司
遠智證券股份有限公司
註:本行各關係企業間並未相互持股
100%
100% 100%

財務狀況Financial Information
65
Note: There is no cross share-holding among FEIB affi liated companies.
Far Eastern Asset Management Corp.
FEIB Financial Leasing Co.
Far Eastern International Securities
(3)Affi liated Companies
100%
100%
100%
FEIB
66
Risk Management
一、風險管理組織架構及政策
(一 )政策
1.塑造本行注重風險管理之專業組織文化,並運用內外部風險管理規範之質化 (如各項作業辦法等 )、量化指標 (如資產品質比率等 ),作為本行營運策略參考。
2.設置獨立之風險控管專責單位,有效監控及落實風險管理制度。
3.有效辨識、衡量、監督與控制各項既有及潛在風險於本行可承受範圍內,並兼顧風險與合理利潤,達到盈餘目標。
(二 )組織架構
1.董事會:
本行風險管理之最高決策單位,負責核定全行風險管理政策,建立全行風險管理文化,
對整體風險管理負最終責任。
2.資產負債管理委員會及風險管理委員會:
由總經理為召集人,指定相關主管為委員,定期開會,負責掌理及審議全行風險管理
執行狀況與風險承擔情形。
3.風險管理處:
下設法金組、消金組,分別對法人金融、金融市場、個金 (中小企業 )、消金及信用卡等事業群之風險管理採直接管理。各事業群有關授信準則、程序、辦法、新產品開發、
人員授權等,均先經由風險管理處審查,再行呈核,使本銀行風險管理具集中控制效
果。
(A)風險管理處法金組分為審查組、應收帳款徵審組、金融市場中台組、授管組、覆審追蹤組等五個單位,分別負責授信案件事前審核、貸放後管理、交易部位之每日市
價評估與限額控管、授信規範之擬訂與控管及督導法金授信覆審追蹤作業。
(B)風險管理處消金組分為授信管理、消金授信審核、信用卡授信審核、債權管理、資訊 /服務、客訴 /自行查核等六個單位,分別負責制定消金與信用卡產品授信政策與資產品質管理、案件徵審與中途授信管理、逾期放款及協議案件之催理、資料倉
儲運用與風險分析、自行查核與客訴案件處理。
4.稽核處:
定期查核全行風險管理有關業務,包括風險管理架構、風險管理運作程序等相關作業
之實際執行狀況,並適時提供改進建議。

風險管理Risk Management
67
1. Risk Management Structure and Policy
(1) Policy
1.To foster a risk management-oriented culture, the Bank has employed a qualitative index of internal and external risk management regulations (such as diverse operating procedures) and quantitative index (such as ratios of asset quality) as a reference for operating strategy.
2.FEIB has set up an independent risk control unit to effectively supervise and implement the Bank's risk management system.
3.To effectively recognize, evaluate, monitor and control all existing and potential risks within acceptable limits to achieve target revenues.
(2) Organization Structure
1. Board of Directors:The Board of Directors steers FEIB’s risk management, and is responsible for reviewing the whole Bank’s risk management policies, reinforcing a risk management culture and taking ultimate responsibility for overall risk management.
2. Assets and Liabilities Management Committee & Risk Management Committee:The Bank President presides over the Risk Management Committee, appoints relevant bank heads as Committee Members and calls regular meetings to execute and review the Bank’s capital adequacy, risk bearing capacity and entire risk management system.
3. Risk Management Department:Under the Management Risk Department, the Corporate Banking, Consumer Banking and Small- and Medium-sized Enterprise Teams directly manage risk with regard to Corporate Banking, Financial Markets, Consumer Banking, Credit Cards as well as Individual Banking (SME Unit) Groups. The Risk Management Department reviews and gives quantitative and qualitative feedback on each business group’s lending guidelines, processes, product development, and authorization criteria, etc. before consideration for approval in an effort to centralize control and improve quality.(A) The Corporate Banking Team under Risk Management Department is further divided
into 5 Sections including: Risk Review, AR Factoring, Financial Market Middle Of ce, Credit Control, and Second Review & Trace which handle respectively the pre-evaluation of lending cases, after loan management, daily assessment of each position’s market value and limit control, the drawing of lending guidelines and risk control, and monitor Corporate Banking’s second review and trace operations.
(B) The Consumer Banking Team under Risk Management Department is further divided into 4 Sections including: Consumer Banking Credit Control, Credit Card Control, Debt Management, and Information/Service which handle respectively drawing of the lending policies of consumer banking and credit card products, management of asset quality, evaluation and after-loan management, transaction management, mid-way lending management, overdue loan recovery, debt write-off, data storage & processing, and risk analysis.
4. Auditing Department:Regularly check the Bank’s risk management related businesses including the execution of risk management structure and risk management operating processes, and then provide constructive suggestions for improvement.

68
二、各項風險管理策略
(一 )信用風險
1.法人金融業務
訂定穩健及明確之法人金融徵授信及貸後管理程序,掌控資產品質。控管授信行業別
之適當比重、集團企業授信風險之集中管理,並定期或視必要性依據經濟走勢、產業
趨勢及本行經營政策調整上述行業或集團比重。
2.消金及信用卡業務
訂定明確之授信規範及貸放程序,確保授信資產品質穩定及穩健獲利之營運目標。管
理資產結構確保各資產組合適當配置,追蹤放款品質,因應經濟景氣、經營環境變化,
動態調整授信政策。
3.中小企業金融業務
訂定明確中小企業徵授信規範、作業程序及貸後管理機制,達成授信資產品質優化及
規模成長目標。規範授信產品類別、進行資產結構管理,確保債權擔保性及資產組合
適當性。定期檢視經濟景氣變化,動態調整授信政策及策略目標。
(二 )作業風險
以有效且具獨立運作之內部稽核,檢視作業風險管理狀況,除就應改善事項設立追蹤機
制外,並適時呈報查核結果予董事會。為加強內部控制藉以防止弊端之發生,建立各單
位「自行查核」制度,並由稽核處定期至各單位辦理「一般查核」與「專案查核」;同
時本行設有「遵守法令主管」制度,督導全行確實遵循法令。依日常營業活動及管理流
程可能發生之各項風險,綜合評估其發生頻率及影響嚴重性,採取將部份或全部之作業
風險利用保險、委外等措施,移轉或沖抵事件發生之損失與衝擊。落實 KYC(認識客戶,Know Your Customer)及防制洗錢、內部控制制度、法規遵循、員工道德規範與教育訓練等措施,以降低風險發生之機率。本行建置符合國際標準規範 (ISO27001)的資訊安全控管規範,包含制定本行資訊安全政策、相關資訊安全之實施程序、監督風險與資訊安全
稽核能力、宣導資安教育訓練。
(三 )市場風險
依本行「金融市場自營交易業務授權準則」針對不同業務設有交易員、交易室部位限額
及停損限額,每日由專人於日中及日終進行檢視,損失達限額即應調整部位,避免市場
風險。新產品及業務推展前,適當評估市場風險並考量其暴險額對本行之影響。依金融
產品訂定交易室部位總額及個別交易員部位限額以控制市場風險於合理範圍。交易性部
位採即時或依每日市價評估為原則,並應每日評估一次,若為銀行本身業務需要辦理之
避險交易,至少每月評估二次,且由風險管理處獨立評估,執行部位控管及停損限制。

風險管理Risk Management
69
2. Risk Management Strategy
(1) Credit Risk1. Corporate Banking
To engage in stipulating stable and precise corporate banking lending and after-loan management processes, control asset quality; maintain an adequate ratio of lending industries, centralize management of corporate lending risk, and regularly adjust when necessary the above-said industry or corporate ratios in accordance with economic performance, industry trend, and the Bank’s operating policy to diversify and reduce risk.
2. Consumer Banking and Credit Cards BusinessTo de ne precise lending guidelines and processes so as to achieve the steady and organic growth target; manage asset structure to ensure the proper allocation of portfolios, trace lending quality, review economic recovery, monitor changes of operating environment, and proactively adjust lending policies.
3. Small and Medium-sized Enterprise Banking BusinessTo stipulate clearly the lending guidelines, operation process and after-loan management mechanism to small- and medium-sized enterprise clients to improve lending asset quality and achieve growth in scale; regulate lending product categories, implement asset structure management, ensure debt guarantee and proper portfolios; regularly monitor the changes in economic scenario, and proactively adjust lending policies and strategic objectives.
(2) Operating RiskWith effective and independent internal auditing, the Bank examines execution of its operational risk management. Aside from setting up follow-up mechanism for areas that require improvement, it also presents verification checking results in a timely manner to the Board of Directors. To strengthen the Bank’s internal controls and prevent defaults, each bank business unit has established its own “self-auditing” system and the Auditing Dept. shall implement “general auditing” and “special auditing.” The Bank also employs a “Compliance Of cer” system to ensure that the Bank strictly abides by all regulations. FEIB evaluates the frequency and seriousness of operational risks with regard to its daily operations and management process, and strives to transfer or write-off the loss and impact by way of insurance, outsourcing, and etc. With measures such as the implement of KYC (Know Your Customer), anti-laundry, internal control system, regulations, employee morale buildup and educational trainings, the Bank aims to lower the possibility of risk occurrence. The Bank has also set up information safety control guidelines conforming to the requirements of “ISO27001 Information Security Management System” including IT safety policies, process, supervision, audit and educational training to mitigate information risk.
(3)Market RiskThe Bank controls trading risk held by every trading unit around various nancial instruments and even whole trading room risk by setting up certain positions from speci c clerk, stop-loss limits for all positions to different nancial instruments and products to control market risk within a reasonable range. Special staff and teams check twice daily at noontime and end of day to review results, immediately squaring positions when reaching limits, and evaluating each day’s gains or losses of un-squared positions. Before launching, promoting or operating new product, business or system, adequate evaluation of market risk should be performed to check its impact on the Bank. In accordance with trading positions volumes of nancial products and individual clerk’s trading limit to control market risk within reasonable range. Trading positions will go through real time evaluations with reference to their daily market values, and should be evaluated once daily. As to hedge businesses deemed necessary by the Bank itself, should be evaluated at least twice per month and monitored independently by the Risk Management Department to execute position control and stop-loss limit.
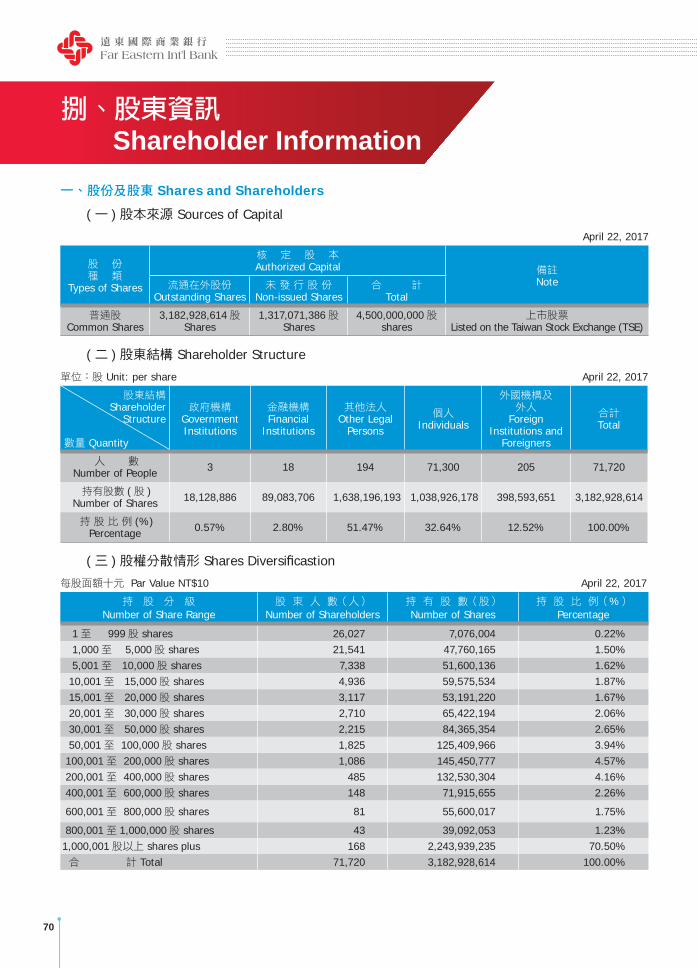
70
一、股份及股東 Shares and Shareholders
(一 )股本來源 Sources of Capital
April 22, 2017
股 份種 類
Types of Shares
核 定 股 本Authorized Capital 備註
Note流通在外股份Outstanding Shares
未 發 行 股 份Non-issued Shares
合 計Total
普通股Common Shares
3,182,928,614股Shares
1,317,071,386股Shares
4,500,000,000股shares
上市股票Listed on the Taiwan Stock Exchange (TSE)
(二 )股東結構 Shareholder Structure
單位:股 Unit: per share April 22, 2017
股東結構Shareholder
Structure
數量 Quantity
政府機構GovernmentInstitutions
金融機構Financial
Institutions
其他法人Other Legal
Persons
個人Individuals
外國機構及外人
Foreign Institutions and
Foreigners
合計Total
人 數 Number of People 3 18 194 71,300 205 71,720
持有股數 (股 )Number of Shares 18,128,886 89,083,706 1,638,196,193 1,038,926,178 398,593,651 3,182,928,614
持 股 比 例 (%)Percentage 0.57% 2.80% 51.47% 32.64% 12.52% 100.00%
(三 )股權分散情形 Shares Diversi castion
每股面額十元 Par Value NT$10 April 22, 2017
持 股 分 級Number of Share Range
股 東 人 數(人)Number of Shareholders
持 有 股 數(股)Number of Shares
持 股 比 例(%)Percentage
1至 999股 shares 26,027 7,076,004 0.22% 1,000至 5,000股 shares 21,541 47,760,165 1.50% 5,001至 10,000股 shares 7,338 51,600,136 1.62% 10,001至 15,000股 shares 4,936 59,575,534 1.87% 15,001至 20,000股 shares 3,117 53,191,220 1.67% 20,001至 30,000股 shares 2,710 65,422,194 2.06% 30,001至 50,000股 shares 2,215 84,365,354 2.65% 50,001至 100,000股 shares 1,825 125,409,966 3.94% 100,001至 200,000股 shares 1,086 145,450,777 4.57% 200,001至 400,000股 shares 485 132,530,304 4.16% 400,001至 600,000股 shares 148 71,915,655 2.26%
600,001至 800,000股 shares 81 55,600,017 1.75%
800,001至 1,000,000股 shares 43 39,092,053 1.23%1,000,001股以上 shares plus 168 2,243,939,235 70.50% 合 計 Total 71,720 3,182,928,614 100.00%
Shareholder Information

股東資訊Shareholder Information
71
二、信用評等 Ratings
在信用評等方面,經惠譽國際信評公司 (Fitch Ratings)評等,本行評等為國內評等分別為長期評等 A(twn)、短期評等 F1(twn),國際外幣評等之長期評等 BBB-、短期評等 F3,屬投資等級穩健之金融機構。
The Bank’s investment grade ratings were assessed by Fitch Ratings as follows: National Long-term Rating A (twn); National Short-term Rating F1 (twn); Long-term Foreign Currency Rating BBB-; and Short-term Foreign Currency Rating F3. FEIB is considered an investment grade institution of “stable” outlook.
評等項目 (Ratings) 2013/10/11 2014/9/30 2015/9/25 2016/10/24 2017/10/31
國際評等Foreign Currency Rating
短期 Short-term F3 F3 F3 F3 F3
長期 Long-term BBB- BBB- BBB- BBB- BBB-
展望 Outlook Negative Negative Stable Stable Stable
國內評等National Rating
短期 Short-term F1(twn) F1(twn) F1(twn) F1(twn) F1(twn)
長期 Long-term A(twn) A (twn) A (twn) A(twn) A(twn)
支援評等 Support Rating 4 4 4 4 4
(四 )主要股東名單 Major Shareholders
單位:股 Unit: shares April 22, 2017 股 份
Shares主要股東名稱Major Shareholders
持 有 股 數(股)Number of Shares
持 股 比 例(%)Percentage
裕元投資股份有限公司Yu Yuan Investment Co., Ltd. 157,631,416 4.95%
裕利投資股份有限公司Yue-Li Investment Company 139,605,333 4.39%
亞洲投資股份有限公司Asia Investment Corp. 128,186,282 4.03%
德勤投資股份有限公司Der Ching Investment Corp. 128,170,861 4.03%
裕通投資股份有限公司Yue-Tung Investment Corp. 123,847,500 3.89%
遠鼎投資股份有限公司Yuan Ding Investment Corp. 113,251,395 3.56%
開元國際投資股份有限公司Kai Yuan International Investment Corp. 102,167,141 3.21%
遠通投資股份有限公司Yuan Tung Investment Corp. 101,962,643 3.20%
鼎元國際投資股份有限公司Ding Yuan International Investment Corp. 84,154,519 2.64%
遠東商銀受託信託財產專戶-遠銀受託遠東商銀員工持股信託財產專戶Far Eastern Int’ l Bank Trust Account (Employees’ Share-Holding A/C)
83,365,477 2.62%
註:係列明股權比例佔前十名之股東。Note: Listed above are the Bank’s top ten major shareholders.

72
本行自成立以來,除致力於提供客戶完善的金融相關服務,更不忘實踐企業公民之社會責任,
長年投身各項公益活動,近幾年更大力推廣人文美學,期盼台灣社會不僅享有財富的豐饒,亦能領
會藝術所帶來的心靈之美。以下為 2017年本行主辦或參與的公益與人文美學活動。
一、關懷社會公益
1. 對伊甸的贊助始於民國1997年,以「伊甸愛心卡」為核心平台,發展多元、便利的捐款機制,
以本行的回饋捐款加上匯聚自大眾的涓滴愛心,至 2017年底挹注伊甸的捐款突破 8千萬元。
2. 2016年企業社會責任報告書取得 BSI認證,並獲臺灣永續發展基金會頒發金融保險組銅獎
及「2017 BSI國際標準管理年會」企業社會責任報告書-永續傑出獎。
3. 2017年中秋節,訂購三千盒喜憨兒中秋月餅致客戶,以具體的行動鼓勵喜憨兒追求自立,
也為社會散播更多的愛與祝福。
二、倡導樂活美學
1. 與遠東集團關係企業共同贊助太陽劇團《TORUK阿凡達前傳》來臺演出。
2. 舉辦「常玉展 遠銀日」及「奧塞展 遠銀日」,邀請客戶一起探訪藝術大師的美麗境界。
3. 2018年月曆《知識之森,學問之海》遴選臺灣從北到南 12家圖書館,邀請人們一探當代圖
書館的新風貌,重溫閱讀的樂趣。
4. 推廣閱讀風氣並響應天下文化「開放台灣」公益行動,採購臺灣公益平臺嚴長壽董事長為年
輕世代所創作的《在世界地圖上找到自己》贈閱全臺 31所高中職學校之畢業班學生。
5. 與遠東集團關係企業共同贊助 2017年新北市政府耶誕歡樂城活動,於新北市府廣場舉辦耶
誕點燈、音樂會與園遊會等,將溫馨、感恩的喜樂散播給社會。
6. 協辦遠企大樓耶誕點燈及音樂會活動「Love & Peace」,邀請社區民眾共度佳節。
7. 捐款贊助全國運動會在宜蘭舉行,為提升國內優秀運動員的能見度、推動運動風氣而共襄盛
舉。
Corporate Social Responsibility
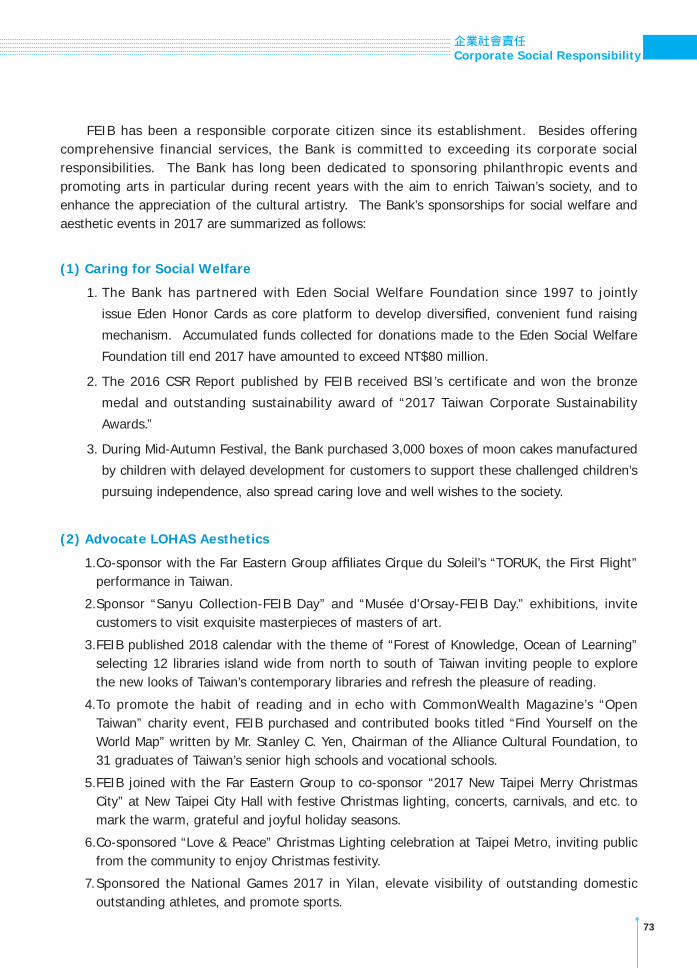
企業社會責任Corporate Social Responsibility
73
FEIB has been a responsible corporate citizen since its establishment. Besides offering comprehensive financial services, the Bank is committed to exceeding its corporate social responsibilities. The Bank has long been dedicated to sponsoring philanthropic events and promoting arts in particular during recent years with the aim to enrich Taiwan’s society, and to enhance the appreciation of the cultural artistry. The Bank’s sponsorships for social welfare and aesthetic events in 2017 are summarized as follows:
(1) Caring for Social Welfare
1. The Bank has partnered with Eden Social Welfare Foundation since 1997 to jointly
issue Eden Honor Cards as core platform to develop diversi ed, convenient fund raising
mechanism. Accumulated funds collected for donations made to the Eden Social Welfare
Foundation till end 2017 have amounted to exceed NT$80 million.
2. The 2016 CSR Report published by FEIB received BSI’s certificate and won the bronze
medal and outstanding sustainability award of “2017 Taiwan Corporate Sustainability
Awards.”
3. During Mid-Autumn Festival, the Bank purchased 3,000 boxes of moon cakes manufactured
by children with delayed development for customers to support these challenged children’s
pursuing independence, also spread caring love and well wishes to the society.
(2) Advocate LOHAS Aesthetics
1. Co-sponsor with the Far Eastern Group af liates Cirque du Soleil’s “TORUK, the First Flight” performance in Taiwan.
2. Sponsor “Sanyu Collection-FEIB Day” and “Musée d'Orsay-FEIB Day.” exhibitions, invite customers to visit exquisite masterpieces of masters of art.
3. FEIB published 2018 calendar with the theme of “Forest of Knowledge, Ocean of Learning” selecting 12 libraries island wide from north to south of Taiwan inviting people to explore the new looks of Taiwan’s contemporary libraries and refresh the pleasure of reading.
4. To promote the habit of reading and in echo with CommonWealth Magazine’s “Open Taiwan” charity event, FEIB purchased and contributed books titled “Find Yourself on the World Map” written by Mr. Stanley C. Yen, Chairman of the Alliance Cultural Foundation, to 31 graduates of Taiwan’s senior high schools and vocational schools.
5. FEIB joined with the Far Eastern Group to co-sponsor “2017 New Taipei Merry Christmas City” at New Taipei City Hall with festive Christmas lighting, concerts, carnivals, and etc. to mark the warm, grateful and joyful holiday seasons.
6. Co-sponsored “Love & Peace” Christmas Lighting celebration at Taipei Metro, inviting public from the community to enjoy Christmas festivity.
7. Sponsored the National Games 2017 in Yilan, elevate visibility of outstanding domestic outstanding athletes, and promote sports.

74
三、致力環境保護
為使節能減碳行動與國際接軌,本行於 2016年建置 ISO 50001系統,取得國際認證;並訂定
能源政策,成立能源管理團隊,由總經理領軍,規劃、整合全行內部能源管理業務,每年定期
召開會議討論能源管理策略、檢核能度節能行動方案成效,追求有效改善並提升能源使用效率,
降低經營成本同時致力對環境保護的承諾。
四、繼續經營與創造股東價值
本行長期致力於提升公司治理不遺餘力,並以全員行銷展現行動力,追求更優質之經營績效,
持續提升資產品質與競爭力,以強化經營體質,為全體股東創造最大價值。
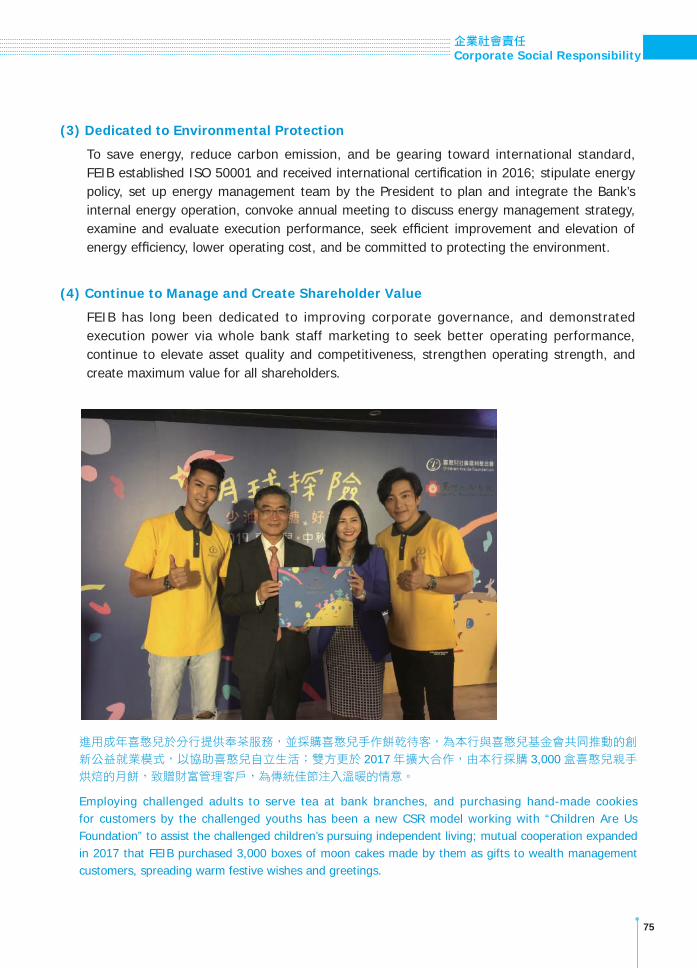
企業社會責任Corporate Social Responsibility
75
(3) Dedicated to Environmental Protection
To save energy, reduce carbon emission, and be gearing toward international standard, FEIB established ISO 50001 and received international certi cation in 2016; stipulate energy policy, set up energy management team by the President to plan and integrate the Bank’s internal energy operation, convoke annual meeting to discuss energy management strategy, examine and evaluate execution performance, seek ef cient improvement and elevation of energy ef ciency, lower operating cost, and be committed to protecting the environment.
(4) Continue to Manage and Create Shareholder Value
FEIB has long been dedicated to improving corporate governance, and demonstrated execution power via whole bank staff marketing to seek better operating performance, continue to elevate asset quality and competitiveness, strengthen operating strength, and create maximum value for all shareholders.
進用成年喜憨兒於分行提供奉茶服務,並採購喜憨兒手作餅乾待客,為本行與喜憨兒基金會共同推動的創
新公益就業模式,以協助喜憨兒自立生活;雙方更於 2017年擴大合作,由本行採購 3,000盒喜憨兒親手烘焙的月餅,致贈財富管理客戶,為傳統佳節注入溫暖的情意。
Employing challenged adults to serve tea at bank branches, and purchasing hand-made cookies for customers by the challenged youths has been a new CSR model working with “Children Are Us Foundation” to assist the challenged children’s pursuing independent living; mutual cooperation expanded in 2017 that FEIB purchased 3,000 boxes of moon cakes made by them as gifts to wealth management customers, spreading warm festive wishes and greetings.

76
遠東銀行由實業家徐有庠先生創辦,為遠東集團金融服務事業版圖之知名企業,遠東企業集團
由紡織業崛起,經歷 60餘年持續投資拓展,遂行產業垂直與水平整合,目前集團經營領域涵蓋石
化能源、聚酯化纖、水泥建材、百貨零售、海陸運輸、金融服務、通訊網路、營造建築、觀光旅館、
社會公益等 10大領域,事業體系橫跨製造業、服務業與高科技產業,2017年資產總額超過 824億
美元,並與全球知名廠商策略聯盟,營運觸角遍及全世界,近年來持續深耕台灣,佈局大陸,營業
額突破 213億美元,目前共有 9家上市企業,為台灣國際化及創新企業的標竿。
不斷為顧客、為股東創造新的價值,是遠東集團始終堅持的目標,致力經營旗下每一個事業體,
都成為該產業第一流的公司,秉持一貫的經營宗旨,遠東集團分佈在台灣、大陸、香港、新加坡、
馬來西亞、泰國、越南、日本等十餘個國家及地區,為數6萬餘名訓練嚴謹、熱忱敬業的高素質員工,
結合先進的科技知識、技術、設備與管理,產銷高品質的能源、化纖原料、紡織衣飾、水泥建材等
商品,並提供百貨零售、金融、運輸、通訊、醫療、教育等全方位、多元化的服務。
在追求卓越的同時,遠東集團致力於提升員工福利與環境保護,以促進人與環境的和諧與平衡。
遠東集團所有經營活動皆以保護環境品質及有效運用地球資源為中心,不但提供員工完整的訓練,
良好的工作環境,並鼓勵終身學習以吸收新知,提升技能;配合研發創新,以不傷害環境的生產模
式,製造最佳的產品,提供貼心的服務。
從企業經營的角度來看,外部環境的變化我們或許無法改變,但我們可以調整自己,對環境作
出「應變」。回顧 60餘年前,遠東集團橫跨海峽來到台灣建立事業,爾後數十年的發展,歷經二
次石油危機、亞洲金融風暴、網路泡沫、911恐怖攻擊、SARS危機及金融海嘯,遠東關係企業無
不回歸基本面,秉持「誠勤樸慎」及「創新」的立業精神,結合員工、顧客及供應商突破難關,轉
「危」為「機」。擁有豐富的集團關係企業資源,一直是本行在激烈競爭的金融環境中較同業享有
之優勢,本行除持續朝關係企業資源整合的既定目標努力,亦積極開發其他新種產品,如推出遠東
快樂信用卡、Happy Go Inside信用卡,整合集團的服務和資源,滿足顧客最大的需求,為國內集
團資源整合的績優典範。
遠東集團結合食、衣、住、行、育、樂等生活所需,是國內唯一橫跨各項消費領域的企業集團,
其中金融服務事業包含遠東商銀、亞東證券、遠銀租賃、亞東投顧、德銀遠東投信、遠銀資產管理、
遠銀保代、遠智證券等公司。本行擁有如此多元及豐富的集團資源,未來更將發揮遠東集團橫跨兩
岸之廣大客戶基礎優勢,掌握趨勢、創造契機,開拓兩岸三地金融業務契機,成為大中華區首屈一
指的專業銀行。
Group Synergy

集團綜效Group Synergy
77
Established by the Group Founder Mr. Y. Z. Hsu, Far Eastern International Bank (FEIB) is the agship company of Far Eastern Group’s nancial services. Starting from textiles and after more than 60 years of vertical and horizontal integration and expansion, FEG has developed into a leading diversi ed business conglomerate. With total assets exceeding US$82.4 billion in 2017, the Group’s global operations cover ten major industries including polyester fibers, petrochemicals, cement and construction, retail, transportation, nancial services, telecommunications & internet, hotel and philanthropies. FEG has also formed strategic alliances and joint ventures with many world-renowned corporations and organizations. Based in Taiwan and extending well into mainland China, the Group with 9 listed TWSE companies has generated revenues surpassing US$21.3 billion in 2017 and served as top performer in terms of globalization and innovation.
Far Eastern Group has always been committed to creating new value for its customers and shareholders. The Group’s af liated companies are in lead of their respective elds. With the majority of operations located in Taiwan, China, Hong Kong, Singapore, Malaysia, Thailand, Vietnam, Japan the Group’s 60,000 plus well-trained and dedicated staffs, coupled with advanced technology, state-of-the-art facilities and management, manufacture and sell high-quality products ranging from power, chemical fibers, textiles/apparel, cement and construction, and offer comprehensive, diversified services in the elds of retail, nance, transportation, telecom, medical care, and higher education, etc.
While seeking excellence, FEG also focuses on improving employee benefits and environmental protection to draw the balance between people and the planet earth. All the Group’s operations aim to make effective use of global resources. Staffs bene t from extensive training programs and enjoy a good working environment. Additionally, lifelong learning is encouraged for them to absorb new knowledge and enhance skills. With continuous R&D and innovation, the Group manufactures excellent products and delivers value-added services in an environment-friendly way.
From operation perspective, FEIB may not be able to change external environment but the Bank can certainly respond and adapt to changes. More than 60 years ago, FEG moved from mainland China to Taiwan and established its businesses. During the following decades of economic developments, the Group had encountered two oil crises, the Asian financial crisis, Internet bubble, September 11th terrorist attacks, the outbreak of SARS, and nancial tsunami. The Group has always been committed to its founding motto of “Sincerity, Diligence, Thrift, Prudence and Innovation” to join forces with its staff, customers and suppliers to overcome adversity and transform challenges into opportunities. FEIB’s competitive edge has long been its abundant resources under the Group as compared to other nancial institutions facing intense competition. The Bank has been actively developing services and products such as Far Eastern Happy Card and Happy Go Inside Card to fully integrate the Group’s services and resources to satisfy our clients’ comprehensive needs that exemplify as a role model of a conglomerate in Taiwan.
FEG is Taiwan’s only conglomerate that spans all walks in life, such as food, apparel, housing, transportation, education and recreation. The Group’s financial business comprises Far Eastern International Bank, Oriental Securities, Far Eastern International Leasing, Oriental Securities Investment Advisory, Deutsche Far Eastern Asset Management, Far Eastern Insurance Agency and Far Eastern International Securities, etc. Taking advantage of the Group’s diverse and abundant resources and ample cross-strait customer base, FEIB aims to seize business opportunities and explore nancial businesses in Taiwan, Hong Kong and China to become an outstanding bank in the Greater China region.

78
石化能源事業Petrochem. Bus.
東聯化學 (OUCC)亞東石化 (OPTC)亞東石化上海 (OPSC)亞東工業氣體 (ALFE)嘉惠電力 (CPC)
亞東石化揚州 (OPYC)遠東聯石化揚州 (FEPY)
水泥建材事業Cement & Bldg. Materials
亞洲水泥 (ACC)亞洲中國 ACC (China)亞泥新加坡 (ACC(S))九龍英泥 (KCC)遠龍不銹鋼 (YLSS)亞東預拌 (YRC)
江西亞東水泥 (JYDC)四川亞東 (SYDC)湖北亞東 (HYDC)揚州亞東 (YYDC)黃岡亞東 (HGYDC)
海陸運輸事業S/L Transportation Bus.
裕民航運 (U-Ming)富民運輸 (FMTC)富達運輸 (FDTC)
裕民新加坡 U-Ming (Singapore)裕民香港 U-Ming (Hong Kong)廈門裕民船舶 U-Ming (Xiamen)
聚酯化纖事業Polyester & Synth.
Fiber Bus.
遠東新世紀 (FENC)宏遠興業 (EVT)
遠紡工業 (上海 )(FEIS)遠東先進纖維 (FEFC)遠東服裝 (蘇州 )(FEAS)遠紡工業 (無錫 )(FEIW)遠東服裝 (越南 )(FEAV)遠紡織染 (蘇州 )(FEDZ)遠紡工業 (蘇州 )(FEIZ)亞東工業 (蘇州 )(OTIZ)遠東石塚 PET(FEIG)
百貨零售事業Retail and
Department Store Bus.
遠東百貨 (FEDS)亞東百貨 (YTDSL)
太平洋崇光百貨 (PSDSC)遠百企業 (A Mart)
太平洋中國控股 (BVI)(PCH(BVI))遠東都會 (FECS)
鼎鼎聯合行銷 (DDIM)遠東巨城購物中心 (FEBC)
遠東集團事業關聯圖 Business Structure of Far Eastern Group
註:遠東集團目前轄下經營領域涵蓋十大產業。
Note: The Far Eastern Group now operates in 10 different industry sectors

集團綜效Group Synergy
79
營造建築事業Construction Bus.
遠揚建設 (FECC)遠揚營造 (FEGCI)遠鼎公司 (YDC)
遠東資源開發 (FERD)遠東建經 (FETC)
社會公益事業Philanthropic Organizations
徐元智先生紀念基金會 (FEMF)徐元智先生醫藥基金會 (FEMDF)徐有庠先生紀念基金會 (YZHMF)
亞東紀念醫院 (FEMH)遠東聯合診所 (FEUCC)元智大學 (YZU)亞東技術學院 (OIT)豫章工商 (YCVS)
觀光旅館事業Hotel Bus.
香格里拉遠東國際大飯店 (台北 )(Shangri-La’s FEPH, Taipei)
香格里拉遠東國際大飯店 (台南 ) (Shangri-La’s FEPH, Tainan)
通訊網路事業Communication &
Internet Bus.
遠傳電信 (Far EasTone)和宇寬頻網路 (KGEX)全虹企業 (ARCOA)遠通電收 (FETC)安源通訊 (Qware)
金融服務事業Financial Services Bus.
遠東國際商業銀行 (FEIB)遠智證券 (FEIS)亞東證券 (OSC)
亞東證券投顧 (OSIA)德銀遠東投信 (DWS)遠銀租賃 (FEIL)
遠銀資產管理 (FEIB AMC)遠榮租賃 (FEFL)

80
壹拾壹、其他資訊
2017年度大事紀要
★主辦 Huy Vietnam Group Limited聯合授信案,為本行首件東協市場企業之國際聯貸案。
★併入遠銀人身保險代理人、遠銀財產保險代理人等股份有限公司,成立保險代理事業群。
★獲財訊雜誌 2017財富管理大獎「最佳理專團隊獎」。
★成立法令遵循處「洗錢防制組」。
★推出「FE跨界行動應用平台」,整合支付寶、friDay錢包於愛買量販上線。
★獲 2017保險龍鳳獎之財金保險畢業生最嚮往的金融業。
★舉辦「享樂系列‧遠銀日 -常玉展」。
★假臺北市國軍英雄館召開 2017年股東常會,補選董事吳均龐。
★發行 2016年企業社會責任報告書。
★「企業 e客服」遠端輔助系統上線。
★與遠東集團關係企業共同贊助太陽馬戲團 TORUK來臺演出。
★獲卓越雜誌 2017卓越銀行評比「最佳財富管理獎」及「最佳創新獎」。
★舉辦「享樂系列‧遠銀日 -奧塞展」。
★推出財富管理【圓夢計畫 HAPPY+】。
★認購 3,000盒喜憨兒中秋月餅致贈客戶。
★敦南智能理財分行開幕營運。
★獲臺灣保險卓越獎「人才培訓專案企劃卓越獎銀獎」。
★發生駭客入侵偽冒 SWIFT電文事件,追回 99.99%之遭盜駭款項。
★獲臺灣客服中心發展協會卓越客服大獎「最佳客戶服務企業獎」及「最佳客服中心獎」,同仁另獲「最佳服務之星獎」、「最佳訓練之星獎」及「最佳客服主管獎」等個人獎。
★獲 2017 BSI國際標準管理年會「企業社會責任報告書永續傑出獎」。
★與遠見天下文化基金會合辦公益贈書並邀請公益平臺基金會董事長嚴長壽演講。
★新版行動銀行 APP 上線。
★獲 2017 TCSA台灣企業永續獎「台灣企業永續報告獎銅獎」。
★與遠東集團關係企業共同贊助新北市歡樂耶誕城活動。
★發行 2018年月曆《知識之森,學問之海》。
★獲勞動部勞動力發展署 TTQS人才發展品質管理評核企業機構版之銀牌獎。
★獲衛生福利部國民健康署健康職場「健康啟動標章認證」。
★與遠東集團關係企業共同舉辦「Love & Peace」耶誕點燈活動。
3月
2月
1月
4月
6月
5月
7月
8月
11月
10月
12月

其他資訊Other Information
81
Other Information
Signi cant FEIB Events in 2017
★ As the lead bank of Huy Vietnam Group Limited syndicated loans, FEIB’s rst international syndicated loan in ASEAN market.
★Merged Far Eastern Life Insurance Agency Co., Ltd. and Far Eastern Property Insurance Agency Co., Ltd. to establish the Insurance Agency Group.
★ Received “Best Wealth Management Team Award” by Wealth Magazine in 2017.
★ Established “Anti-Money Laundering Unit” under Legal Compliance Department. ★ Launched “FE Mobile Payment Syndicated Service” to incorporate Alipay and FriDay wallet to be put online at A-mart
Hypermarket. ★Won the 2017 iDay Award as the most favored nancial institution for nancial insurance graduates.
★ Sponsored LOHAS Events “FEIB Day-Sanyu Collection.”
★ The Bank’s 2017 Shareholders’ Meeting was held in Taipei, James Wu was elected as Director.★ Published 2016 FEIB CSR Report.
★ “Enterprise e-customer Service” aided by remote support system was online.★ Co-sponsored with the Far Eastern Group “TORUK” performance of Cirque du Soleil in Taiwan.★ Received 2017 “Best Wealth Management Award” and “Best Innovation Award” by Excellence Magazine.★ Sponsored LOHAS Events “FEIB Day-Musée d'Orsay”.
★ Launched wealth management "Dream Come True HAPPY+".★ Purchased 3,000 boxes made by challenged children for customers.★Opened Dun Nan Smart Bank Branch.★ Received Taiwan Insurance Excellence Award “Outstanding Talent Training Program Silver Medal.”
★ FEIB SWIFT system was hacked, recovered 99.99% of the money stolen.★ Received Center Customer Service Excellence Award by Taiwan Contact Center Development in the categories of “Best
Customer Service Enterprise” and “Best Customer Service Center,” colleagues won individual awards including “Star of Best Service,” “Star of Best Training” and “Best Customer Service Executive.”
★ Awarded “Outstanding CSR Sustainability Report” by 2017 BSI Standards annual conference.★Co-sponsored with CommonWealth Magazine’s contributing books charity event, and invited Mr. Stanley C. Yen, Chairman
of the Alliance Cultural Foundation, as a speaker.★New version of Mobile Banking APP was online.★ Received “Taiwan Corporate Sustainability Award Bronze Medal” by 2017 TCSA.★ Co-sponsored with the Far Eastern Group the 2017 “New Taipei Merry Christmas City” festive event.
★ Published 2018 FEIB Calendar "Forest of Knowledge, Ocean of Learning".★ Workforce Development Agency, the Ministry of Labor awarded Silver Medal by TTQS (Talent Quality-Management
System) to recognize the Bank’s efforts in sustainable talent development.★ Received “Badge of Healthy Workplace” by Health Promotion Administration, Ministry of Health and Welfare.★ Co-sponsored “Love & Peace” Christmas Lighting Ceremony with FEG af liates.
Jan
Feb
Mar
June
May
Apr
July
Aug
Oct
Nov
★
★
★
Dec

82
本行各營業單位地址及電話表
單位名稱 地 址 電 話
總行 106台北市大安區敦化南路二段 207號 27樓 (886-2) 2378-6868
營業部 106台北市大安區敦化南路二段 207號 1樓 (886-2) 2378-6868
國外部 103台北市大同區重慶北路一段 30號 2樓 (886-2) 2550-8811
信託部 106台北市大安區敦化南路二段 207號 20樓 (886-2) 2312-3636
信用卡部 220新北市板橋區文化路二段 182巷 3弄 33號 (886-2) 8073-1166
台北襄陽分行 100台北市中正區襄陽路 1號 (886-2) 2381-4567
台北南門分行 100台北市中正區羅斯福路一段 40號 (886-2) 2392-6955
台北忠孝分行 100台北市中正區忠孝東路一段 112號 (886-2) 2327-8898
台北東門分行 100台北市中正區信義路二段 135號 (886-2) 2356-7711
台北重慶分行 103台北市大同區重慶北路一段 30號 (886-2) 2550-6600
台北松江分行 104台北市中山區松江路 59號 (886-2) 2505-5533
台北松山分行 105台北市松山區南京東路五段 171號 (886-2) 8787-6668
台北逸仙分行 110台北市信義區基隆路一段 200之 3號 (886-2) 2722-9558
台北石牌分行 112台北市北投區石牌路二段 112號 (886-2) 2826-5688
台北永吉分行 110台北市信義區中坡北路 7號 (886-2) 8785-5788
台北中山分行 104台北市中山區民生東路一段 70號 (886-2) 2523-8899
台北古亭分行 100台北市中正區羅斯福路三段 50號 (886-2) 2369-5600
台北信義分行 110台北市信義區光復南路 505號 (886-2) 2720-7755
台北南京東路分行 104台北市中山區南京東路三段 101號 (886-2) 7702-9766
台北大稻埕分行 103台北市大同區延平北路二段 86號 (886-2) 2558-6186
台北 101分行 110台北市信義區信義路五段 7號台北 101大樓 51-1 (886-2) 8101-0168
板橋南雅分行 220新北市板橋區南雅南路二段 172號 (886-2) 8966-3339
板橋文化分行 220新北市板橋區文化路二段 1號 (886-2) 2255-6499
板橋中正分行 220新北市板橋區中正路 226、228號 (886-2) 2272-6088
板橋大遠百分行 220新北市板橋區新站路 18號 (886-2) 7729-0616
蘆洲分行 247新北市蘆洲區三民路 38號 1樓 (886-2) 7730-6978
新店分行 231新北市新店區北新路三段 98號 (886-2) 2910-6060
永和分行 234新北市永和區福和路 222號 (886-2) 2232-6500
中和分行 235新北市中和區和平街 1之 2號、3號及 3之 1號 (886-2) 2945-1800
雙和分行 234新北市永和區中和路 535號 1、2樓 (886-2) 7717-6668
三重分行 241新北市三重區福德北路 46號 (886-2) 8973-1133
台北新莊分行 242新北市新莊區復興路一段 209號 (886-2) 8991-3366

其他資訊Other Information
83
Operation LocationsOpera ng Unit Address Telephone Number
Head O ce 27F, No. 207, Dunhua S. Rd., Sec. 2, Da-an Dist., Taipei City 106,Taiwan (886-2) 2378-6868
Business Department 1F, No. 207, Dunhua S. Rd., Sec. 2, Da-an Dist., Taipei City 106, Taiwan (886-2) 2378-6868Interna onal Banking De-partment 2F, No. 30, Chongqing N. Rd., Sec. 1, Datong Dist., Taipei City 103, Taiwan (886-2) 2550-8811
Trust Department 5F, No. 1, Shiangyang Rd., Zhongjheng Dist., Taipei City 100, Taiwan (886-2) 2312-3636
Credit Cards Department No. 33, Ally. 3, Lane 182, Wenhua Rd., Sec. 2, Banqiao City, New Taipei City 220, Taiwan (886-2) 8073-1166
Taipei Shiangyang Branch No. 1, Shiangyang Rd., Zhongjheng Dist., Taipei City 100, Taiwan (886-2) 2381-4567
Taipei Nanmen Branch No. 40, Roosevelt Rd., Sec. 1, Zhongjheng Dist., Taipei City 100, Taiwan (886-2) 2392-6955
Taipei Junghsiau Branch No. 112, Junghsiau E. Rd., Sec. 1, Zhongjheng Dist., Taipei City 100, Taiwan (886-2) 2327-8898
Taipei Tungmen Branch No. 135, Sinyi Rd., Sec. 2, Zhongjheng Dist., Taipei City 100, Taiwan (886-2) 2356-7711
Taipei Chungching Branch No. 30, Chungching N. Rd., Sec. 1, Datong Dist., Taipei City 103, Taiwan (886-2) 2550-6600
Taipei Sungjiang Branch No. 59, Songjiang Rd., Zhongshan Dist., Taipei City 104, Taiwan (886-2) 2505-5533
Taipei Sungshan Branch No. 171, Nanjing E. Rd., Sec. 5, Sungshan Dist., Taipei City 105, Taiwan (886-2) 8787-6668
Taipei Yisen Branch No. 200-3, Keelung Rd., Sec. 1, Sinyi Dist., Taipei City 110, Taiwan (886-2) 2722-9558
Taipei Shipai Branch No.112, Sec. 2, Shipai Rd., Beitou Dist., Taipei City 112, Taiwan (R.O.C.) (886-2) 2826-5688
Taipei Yungi Branch No. 7, Jhongpo N. Rd., Sinyi Dist., Taipei City 110, Taiwan (886-2) 8785-5788
Taipei Zhongshan Branch No. 70, Minsheng E. Rd., Sec. 1, Zhongshan Dist., Taipei City 104, Taiwan (886-2) 2523-8899
Taipei Gu ng Branch No. 50, Roosevelt Rd., Sec. 3, Zhongjheng Dist., Taipei City 100, Taiwan (886-2) 2369-5600
Taipei ShingYi Branch No. 505, Guangfu S. Rd., Shinyi Dist., Taipei City 106, Taiwan (886-2) 2720-7755Taipei Nanjing East Road Branch No. 101, Nanjing E. Rd., Sec. 3, Zhongshan Dist., Taipei City 104, Taiwan (886-2) 7702-9766
Taipei Dadaocheng Branch No. 86, Yenping North Road, Sec. 2, Tatung Dist. , Taipei City 103, Taiwan (886-2) 2558-6186
Taipei 101 Branch 51-1 Floor, Taipei 101 Tower, No. 7, Hsinyi Road, Sec. 5, Taipei City 110, Taiwan (886-2) 8101-0168
Banqiao Nanya Branch No. 172, Nanya S. Rd., Sec. 2, Banqiao Dist., New Taipei City 220, Taiwan (886-2) 8966-3339
Banqiao Wenhua Branch No. 1, Wenhua Rd., Sec. 2, Banqiao Dist., New Taipei City 220, Taiwan (886-2) 2255-6499
Banqiao Zhongjeng Branch No. 226 &228, Zhongjheng Rd., Sec. 2, Banqiao Dist., New Taipei City 220, Taiwan (886-2) 2272-6088
Banqiao Mega City Branch No. 18, Xinzhan Rd., Banqiao Dist., New Taipei City 220, Taiwan (886-2) 7729-0616
Luzhou Branch No. 1, Sanming Rd., Luzhou Dist. New Taipei City 247, Taiwan (886-2) 7730-6978
Sindian Branch No. 98, Beixin Rd., Sec. 3, Sindian Dist., New Taipei City 231, Taiwan (886-2) 2910-6060
Yunghe Branch No. 222, Fuhe Rd., Yonghe Dist., New Taipei City 234, Taiwan (886-2) 2232-6500
Zhunghe Branch No. 748, Zhongjheng Rd., Zhonghe Dist., New Taipei City 235, Taiwan (886-2) 8226-9000
Shuanghe Branch 1F & 2F, No. 535, Zhonghe Rd., Yonghe Dist., New Taipei City 234, Taiwan (886-2) 7717-6668
Sanchung Branch No. 46, Fude N. Rd., Sanchung Dist., New Taipei City 241, Taiwan (886-2) 8973-1133
Taipei Shinjuang Branch No. 209, Fusing Rd., Sec. 1, Shinjuang Dist., New Taipei City 242, Taiwan (886-2) 8991-3366

84
單位名稱 地 址 電 話
新莊富國分行 242新北市新莊區富國路 6號 (886-2) 2901-6868
林口分行 333桃園市龜山區復興一路 227號 (886-3) 397-3888
桃園分行 330桃園市桃園區南華街 78號 (886-3) 339-6339
桃園大興分行 330桃園市桃園區大興西路二段 6號 (886-3) 301-8966
桃園大有分行 330桃園市桃園區大有路 480、482號 (886-3) 346-9688
中壢分行 320桃園市中壢區延平路 372號 (886-3) 427-9696
新竹巨城分行 300新竹市中央路 243號 (886-3) 533-8168
新竹科園分行 300新竹市科學園區園區二路 11號 3樓 (886-3) 579-8833
新竹經國分行 300新竹市經國路二段 100號 (886-3) 533-3131
竹北分行 302新竹市竹北區光明六路 39-41號 (886-3) 553-6699
台中自由分行 400台中市中區自由路二段 131號 (886-4) 2225-2008
台中公益分行 403台中市西區公益路 367號 (886-4) 2328-8666
台中文心分行 406台中市北屯區文心路四段 698號 (886-4) 2230-6689
台中大雅分行 404台中市北區文心路四段 180號 (886-4) 2297-3266
大里分行 412台中市大里區益民路二段 121號 (886-4) 2482-3899
彰化分行 500彰化縣彰化市民生路 233號 (886-4) 728-9188
南投分行 540南投縣南投市三和二路 11號 (886-49) 222-3311
嘉義分行 600嘉義市文化路 272號 (886-5) 278-5911
台南分行 701台南市東區東門路二段 2號 (886-6) 208-9898
永康分行 710台南市永康區中正北路 37號 (886-6) 253-0400
崇德分行 701台南市東區崇道路 87號 (886-6) 290-7290
高雄中正分行 800高雄市新興區中正四路 49號 (886-7) 251-8199
高雄文化中心分行 802高雄市苓雅區四維二路 96號 (886-7) 715-5678
高雄五福分行 803高雄市鹽埕區大勇路 106號 (886-7) 533-3820
鳳山分行 830高雄市鳳山區青年路二段 201號 (886-7) 777-8600
台北農安簡易型分行 104台北市中山區農安街 12之 1號 (886-2) 2592-2255
台北金湖簡易型分行 114台北市內湖區民權東路六段 495號 (886-2) 2630-5788
三重重陽簡易型分行 241新北市三重區重陽路四段 39號 1、2樓 (886-2) 8983-8366
香港分行 香港中環皇后大道中 8號 20樓 (852) 2167-8183

其他資訊Other Information
85
Opera ng Unit Address Telephone Number
Shingjuang Fuguo Branch No. 6, Fuguo Rd., Shingjuang Dist., New Taipei City 242, Taiwan (886-2) 2901-6868
Lin Ko Branch No. 227, Fushing 1st Rd., Gueishan Dist., Taoyuan City 333, Taiwan (886-3) 397-3888
Taoyuan Branch No. 78, Nanhua St., Taoyuan Dist., Taoyuan City 330, Taiwan (886-3) 339-6339
Taoyuan Tashin Branch No. 6, Tashin W. Rd., Sec. 2, Taoyuan Dist., Taoyuan City 330, Taiwan (886-3) 301-8966
Taoyuan Dayou Branch No. 480-482, Dayou Rd., Taoyuan District, Taoyuan City 330, Taiwan (886-3) 346-9688
Jhongli Branch No. 372, Yanping Rd., Jhongli Dist., Taoyuan City 320, Taiwan (886-3) 427-9696
Hsinchu Big City Branch No. 243, Zhongyang Rd., East Dist., Hsinchu City 300, Taiwan (886-3) 533-8168Hsinchu Science Based Industrial Park Branch 3F, No. 11, Yuanchiu 2nd Rd., Hsinchu City 300, Taiwan (886-3) 579-8833
Hsinchu Jinguo Branch No. 100, Jinguo Rd., Sec. 2, Hsinchu City 300, Taiwan (886-3) 533-3131
Jubei Branch No. 39-41, Guangming 6th Rd., Jubei Dist., Hsinchu City 302, Taiwan (886-3) 553-6699
Taichung Tzyou Branch No. 131, Tzyou Rd., Sec. 2, Central Dist., Taichung City 400, Taiwan (886-4) 2225-2008
Taichung Gungyi Branch No. 367, Gongyi Rd., West Dist., Taichung City 403, Taiwan (886-4) 2328-8666
Taichung Wenshin Branch No. 698, Wenshin Rd., Sec. 4, Beitun Dist., Taichung City 406, Taiwan (886-4) 2230-6689
Taichung Taya Branch No. 180, Wunsin Rd., Sec. 4, North Dist., Taichung City 404, Taiwan (886-4) 2297-3266
Tali Branch No. 121, Yimin Rd., Sec. 2, Dali Dist., Taichung City 412, Taiwan (886-4) 2482-3899
Changhua Branch No. 233, Minsheng Rd., Changhua City, Changhua County 500, Taiwan (886-4) 728-9188
Nantou Branch No. 11, Sanhe 2nd Rd., Nantou City, Nantou County 540, Taiwan (886-49) 222-3311
Chiayi Branch No. 272, Wunhua Rd., Chiayi City 600, Taiwan (886-5) 278-5911
Tainan Branch No. 2, Dongmen Rd., Sec. 2, East Dist., Tainan City 701, Taiwan (886-6) 208-9898
Yungkang Branch No. 37, Jhongshan N. Rd., Yungkang Dist., Tainan City 710, Taiwan (886-6) 253-0400
Jhongte Branch No. 87, Jhongdao Rd., East Dist., Tainan City 701, Taiwan (886-6) 290-7290
Kaohsiung Jungjeng Branch No. 49, Zhongzheng 4th Rd., Xinxing Dist., Kaohsiung City 800, Taiwan (886-7) 251-8199Kaohsiung Cultural Center Branch No. 96, Sihwei 2nd Rd., Lingya Dist., Kaohsiung City 802, Taiwan (886-7) 715-5678
Kaohsiung Wufu Branch No. 106, Dayong Rd., Yancheng Dist., Kaohsiung City 803, Taiwan (886-7) 533-3820
Fengshan Branch No. 201, Cingnian Rd., Sec. 2, Fengshan Dist., Kaohsiung City 830, Taiwan (886-7) 777-8600
Taipei Nun-An Mini Branch No. 12-1, Nun-An St., Jhongshan Dist., Taipei City 104, Taiwan (886-2) 2592-2255
Taipei Jinhu Mini Branch No. 495, Minchuan E. Rd., Sec. 6, Neihu Dist., Taipei City 114, Taiwan (886-2) 2630-5788Sanchung Chungyang Mini Branch
1F & 2F, No. 39, Chungyang Rd., Sec. 4, Sanchung Dist. New Taipei City 241, Taiwan (886-2) 8983-8366
Hong Kong Branch 20/F, No. 8, Queen’s Road, Central, Hong Kong ( 852) 2167-8183
壹拾貳 合併財務報表Consolidated Financial Report
86

INDEPENDENT AUDITORS’ REPORT
The Board of Directors and the Shareholders Far Eastern International Bank Ltd.
Opinion
We have audited the accompanying consolidated financial statements of Far Eastern International Bank Ltd. (the “Bank”) and its subsidiaries, which comprise the consolidated balance sheets as of December 31, 2017 and 2016, and the consolidated statements of comprehensive income, changes in equity and cash flows for the years then ended, and the notes to the consolidated financial statements, including a summary of significant accounting policies.
In our opinion, the accompanying consolidated financial statements present fairly, in all material respects, the consolidated financial position of the Bank and its subsidiaries as of December 31, 2017 and 2016, and its consolidated financial performance and its consolidated cash flows for the years then ended in accordance with the Regulations Governing the Preparation of Financial Reports by Public Banks and International Financial Reporting Standards (IFRS), International Accounting Standards (IAS), IFRIC Interpretations (IFRIC), and SIC interpretations (SIC) endorsed and issued into effect by the Financial Supervisory Commission of the Republic of China (FSC).
Basis for Opinion
We conducted our audits in accordance with the Rules Governing the Audit of Financial Statements of Financial Institutions by Certified Public Accountants and auditing standards generally accepted in the Republic of China. Our responsibilities under those standards are further described in the Auditors’ Responsibilities for the Audit of the Consolidated Financial Statements section of our report. We are independent of the Bank and its subsidiaries in accordance with The Norm of Professional Ethics for Certified Public Accountant of the Republic of China, and we have fulfilled our other ethical responsibilities in accordance with these requirements. We believe that the audit evidence we have obtained is sufficient and appropriate to provide a basis for our opinion.
Key Audit Matters
Key audit matters are those matters that, in our professional judgment, were of most significance in our audit of the consolidated financial statements for the year ended December 31, 2017. These matters were addressed in the context of our audit of the consolidated financial statements as a whole, and in forming our opinion thereon, and we do not provide a separate opinion on these matters.
87

year ended December 31, 2017 for the Bank and its subsidiaries, which are described as follows:
Allowance for Credit Losses on Loans and Receivables
As of December 31, 2017, the balances of loans and receivables in the aggregate amounted to $373,807,631 thousand, accounted for 65% of the total assets of the consolidated financial statements; an amount that is deemed to be significant to the consolidated financial statements. To assess the impairment loss of loans and accounts receivables in terms of the allowance for credit
to account the amount and the schedule of collection, the change in economic forecast, and the value of collateral. The assessment involved judgements, estimates, and compliance with regulatory requirements for the allowance for credit losses on loans and receivable. As the assessment on the impairment of loans
and the underlying assumption, the allowance for credit losses on loans and receivables was deemed to be a key audit matter.
Refer to Notes 4, 5, 10, 11 and 43 to the consolidated financial statements for disclosures related to impairment on loans and receivables.
In response to the abovementioned key audit matter, the audit procedures we performed are asfollows:
1.impairment assessment;
2. Sample from individually assessed loans and receivables to assess the management's estimateson the amount of future cash flows from borrowers and the reasonableness of the appraisal ofthe fair value of collateral;
3. Verify whether the underlying assumptions and critical parameters (probability of default andof recovery) adopted by the impairment model adequately reflect the actual position ofcollectively assessed loans and receivables and recalculate the amount of impairment; and
4. Sample and review credit files to evaluate whether the loans and receivables are reasonablycategorized per regulatory stipulation and recalculate for the correctness of the allowance.
Evaluation of Impairment on Intangible Asset - Operation Rights
As of December 31, 2017, the balance of intangible asset - operating rights amounted to $1,538,210 thousand. The amount is the cost for the Bank to acquire business from other financial institutions, acquisition cost that results from the allocation of the fair value to corresponding assets and liabilities. According to IAS 36, management should evaluate the impairment on intangible asset - operating rights annually or whenever there is an indication that the asset may be impaired. For the assessment in determining the value in use of operating rights, the management requires an estimate of future cash flow of relevant cash-generating unit. As its
intangible asset - operating rights is deemed to be a key audit matter.
Refer to Notes 4, 5 and 18 to the consolidated financial statements for disclosures related to impairment on intangible asset.
88

In response to the abovementioned key audit matter, we have consulted with our internal financial experts for their help to perform audit procedures as follows:
1. Evaluate and verify the qualification of the valuation personnel employed by the managementin terms of their professional experience, competency, and independence.
2. Evaluate the reasonableness of critical parameters (such as future cash-flow forecast, discountrate, and sustainable growth rate) and perform sensitivity analysis.
3. Verify the raw data adopted (including the average amounts, the growth rates, interest rates,etc., of deposits and loans) to evaluate its accuracy and completeness.
Other Matter
We have also audited the parent company only financial statements of the Bank as of and for the years ended December 31, 2017 and 2016 on which we have issued an unmodified opinion.
Responsibilities of Management and Those Charged with Governance for the Consolidated Financial Statements
Management is responsible for the preparation and fair presentation of the consolidated financial statements in accordance with the Regulations Governing the Preparation of Financial Reports by Public Banks and International Financial Reporting Standards (IFRS), International Accounting Standards (IAS), interpretations of IAS (SIC) endorsed and issued into effect by the Financial Supervisory Commission of the Republic of China, and for such internal control as management determines is necessary to enable the preparation of consolidated financial statements that are free from material misstatement, whether due to fraud or error.
In preparing the consolidated financial statements, management is responsible for assessing the tinue as a going concern, disclosing, as applicable, matters
related to going concern and using the going concern basis of accounting unless management either intends to liquidate the Bank and its subsidiaries or to cease operations, or has no realistic alternative but to do so.
Those charged with governance, including the audit committee, are responsible for overseeing the
ents
Our objectives are to obtain reasonable assurance about whether the consolidated financial statements as a whole are free from material misstatement, whether due to fraud or error, and to
le assurance is a high level of assurance, but is not a guarantee that an audit conducted in accordance with the auditing standards generally accepted in the Republic of China will always detect a material misstatement when it exists. Misstatements can arise from fraud or error and are considered material if, individually or in the aggregate, they could reasonably be expected to influence the economic decisions of users taken on the basis of these consolidated financial statements.
89

As part of an audit in accordance with the auditing standards generally accepted in the Republic of China, we exercise professional judgment and maintain professional skepticism throughout the audit. We also:
1. Identify and assess the risks of material misstatement of the consolidated financial statements,whether due to fraud or error, design and perform audit procedures responsive to those risks,and obtain audit evidence that is sufficient and appropriate to provide a basis for our opinion.The risk of not detecting a material misstatement resulting from fraud is higher than for oneresulting from error, as fraud may involve collusion, forgery, intentional omissions,misrepresentations, or the override of internal control.
2. Obtain an understanding of internal control relevant to the audit in order to design auditprocedures that are appropriate in the circumstances, but not for the purpose of expressing an
3. Evaluate the appropriateness of accounting policies used and the reasonableness of accountingestimates and related disclosures made by management.
4.accounting and, based on the audit evidence obtained, whether a material uncertainty exists
ability to continue as a going concern. If we conclude that a material uncertainty exists, weare required to draw aconsolidated financial statements or, if such disclosures are inadequate, to modify our opinion.
port.However, future events or conditions may cause the Bank and its subsidiaries to cease tocontinue as a going concern.
5. Evaluate the overall presentation, structure and content of the consolidated financial statements,including the disclosures, and whether the consolidated financial statements represent theunderlying transactions and events in a manner that achieves fair presentation.
6. Obtain sufficient and appropriate audit evidence regarding the financial information of entitiesor business activities within the Bank and its subsidiaries to express an opinion on theconsolidated financial statements. We are responsible for the direction, supervision, andperformance of the Bank and its subsidiaries audit. We remain solely responsible for ouraudit opinion.
We communicate with those charged with governance regarding, among other matters, the planned scope and timing of the audit and significant audit findings, including any significant deficiencies in internal control that we identify during our audit.
We also provide those charged with governance with a statement that we have complied with relevant ethical requirements regarding independence, and to communicate with them all relationships and other matters that may reasonably be thought to bear on our independence, and where applicable, related safeguards.
From the matters communicated with those charged with governance, we determine those matters that were of most significance in the audit of the consolidated financial statements for the year ended December 31, 2017 and are therefore the key audit matters. We describe these matters in
in extremely rare circumstances, we determine that a matter should not be communicated in our report because the adverse consequences of doing so would reasonably be expected to outweigh the public interest benefits of such communication.
90

The engagement partners on the audit resulting in this independent audit -Tsung Wu and Chen-Hsiu Yang.
Deloitte & ToucheTaipei, TaiwanRepublic of China
March 21, 2018
Notice to Readers
The accompanying consolidated financial statements are intended only to present the consolidated financial position, financial performance and cash flows in accordance with accounting principles and practices generally accepted in the Republic of China and not those of any other jurisdictions. The standards, procedures and practices to audit such consolidated financial statements are those generally applied in the Republic of China.
For the convenience of readers, the independent auditors’ report and the accompanying consolidated financial statements have been translated into English from the original Chinese version prepared and used in the Republic of China. If there is any conflict between the English version and the original Chinese version or any difference in the interpretation of the two versions, the Chinese-language independent auditors’ report and consolidated financial statements shall prevail.
91

FAR EASTERN INTERNATIONAL BANK LTD. AND SUBSIDIARIES
CONSOLIDATED BALANCE SHEETSDECEMBER 31, 2017 AND 2016(In Thousands of New Taiwan Dollars)
2017 2016ASSETS Amount % Amount %
Cash and cash equivalents (Note 6) $ 8,693,621 2 $ 7,361,878 1
Due from the central bank and other banks (Notes 7, 37 and 38) 22,351,083 4 32,744,760 6
Financial assets at fair value through profit or loss (Notes 4, 5, 8, 37 and 42) 30,208,333 5 33,830,105 6
Securities purchased under resale agreements (Notes 4, 9 and 37) 11,071,393 2 6,396,656 1
Receivables, net (Notes 4, 5, 10, 11, 37 and 42) 22,750,869 4 22,847,242 4
Current tax assets (Note 4) 7,372 - 4,117 -
Discounts and loans, net (Notes 4, 5, 11, 37 and 42) 351,056,762 61 355,963,672 63
Available-for-sale financial assets (Notes 4, 5, 12, 28, 38 and 42) 109,631,578 19 79,594,706 14
Held-to-maturity financial assets (Notes 4, 5, 13 and 42) 2,135,246 - 2,630,635 1
Investment accounted for using equity method (Notes 4, 14 and 28) 1,774,066 - 1,702,220 -
Debt investments with no active market (Notes 4, 15 and 42) 6,677,076 1 8,170,732 2
Other financial assets, net (Notes 4, 11, 16, 38 and 42) 3,667,760 1 4,670,815 1
Property and equipment, net (Notes 4 and 17) 2,889,392 1 2,889,674 1
Intangible assets, net (Notes 4, 5 and 18) 1,725,085 - 1,750,568 -
Deferred tax assets (Notes 4, 5 and 35) 584,502 - 635,104 -
Other assets, net (Notes 4 and 19) 200,142 - 222,399 -
TOTAL $ 575,424,280 100 $ 561,415,283 100
LIABILITIES AND EQUITY
LIABILITIESDue to the central bank and other banks (Note 20) $ 6,960,774 1 $ 7,432,194 1Financial liabilities at fair value through profit or loss (Notes 4, 5, 8, 24, 37 and 42) 4,319,121 1 7,954,542 2Securities sold under repurchase agreements (Notes 4, 12, 21, 37 and 42) 12,921,364 2 13,711,223 3Payables (Notes 22 and 27) 6,488,285 1 5,799,874 1Current tax liabilities (Note 4) 254,446 - 405,097 -Deposits and remittances (Notes 23,37 and 42) 472,392,183 82 452,720,460 81Bank debentures (Notes 4, 8, 24 and 42) 20,216,664 4 24,309,357 4Other financial liabilities (Notes 25 and 42) 7,416,775 2 6,385,369 1Provisions (Notes 4, 11, 26, 27 and 37) 1,127,116 - 1,240,278 -Other liabilities (Note 35) 540,880 - 506,012 -
Total liabilities 532,637,608 93 520,464,406 93
EQUITY ATTRIBUTABLE TO OWNERS OF THE BANK (Notes 4, 5, 12, 14 and 28)Share capital
Ordinary shares 31,829,286 5 31,113,672 5Capital surplus 456,426 - 456,426 -Retained earnings
Legal reserve 6,544,643 1 5,571,477 1Special reserve 250,703 - 121,028 -Unappropriated earnings 3,691,412 1 3,916,835 1
Total retained earnings 10,486,758 2 9,609,340 2Other equity
Exchange differences on translating foreign operations (8,653) - 115,916 -Unrealized gain (loss) on available-for-sale financial assets 22,855 - (344,477) -
Total other equity 14,202 - (228,561) -
Total equity 42,786,672 7 40,950,877 7
TOTAL $ 575,424,280 100 $ 561,415,283 100
The accompanying notes are an integral part of the consolidated financial statements.
92

FAR EASTERN INTERNATIONAL BANK LTD. AND SUBSIDIARIES
CONSOLIDATED STATEMENTS OF COMPREHENSIVE INCOMEFOR THE YEARS ENDED DECEMBER 31, 2017 AND 2016(In Thousands of New Taiwan Dollars, Except Per Share Amounts)
Percentage Increase
2017 2016 (Decrease)Amount % Amount % %
INTEREST REVENUES (Notes 4, 29 and 37) $ 10,057,931 97 $ 9,629,219 90 4
INTEREST EXPENSES (Notes 4, 29 and 37) 4,653,057 45 3,844,797 36 21
NET INTERESTS 5,404,874 52 5,784,422 54 (7)
NET REVENUES OTHER THAN INTERESTNet service fee income (Notes 4, 30
and 37) 3,152,327 30 3,196,617 30 (1)Net gains on financial assets and
liabilities at fair value through profit or loss (Notes 4, 24, 31, 37 and 42) 1,732,217 17 1,247,844 11 39
Net realized gains on available-for-sale financial assets (Notes 4 and 28) 86,718 1 119,716 1 (28)
Net foreign exchange gains (loss) (Note 4) (293,168) (3) 46,982 - (724)
Shares of profit from associates (Notes 4 and 14) 103,337 1 85,454 1 21
Impairment loss on assets (Notes 4 and 16) (17,009) - (20,528) - 17
Others (Notes 10 and 24) 250,960 2 286,948 3 (13)
Total net revenues other than interest 5,015,382 48 4,963,033 46 1
CONSOLIDATED NET REVENUES 10,420,256 100 10,747,455 100 (3)
PROVISION FOR POSSIBLE LOSSES (Notes 4, 11 and 37) 731,847 7 452,001 4 62
OPERATING EXPENSESEmployee benefits expense (Notes 4,
27, 32 and 37) 3,790,879 36 3,793,101 36 -Depreciation and amortization
(Notes 4 and 33) 248,142 3 226,448 2 10Other general and administrative
expenses (Notes 34 and 37) 2,381,744 23 2,460,003 23 (3)
Total operating expenses 6,420,765 62 6,479,552 61 (1)(Continued)
93

FAR EASTERN INTERNATIONAL BANK LTD. AND SUBSIDIARIES
CONSOLIDATED STATEMENTS OF COMPREHENSIVE INCOMEFOR THE YEARS ENDED DECEMBER 31, 2017 AND 2016(In Thousands of New Taiwan Dollars, Except Per Share Amounts)
Percentage Increase
2017 2016 (Decrease)Amount % Amount % %
INCOME BEFORE INCOME TAX $ 3,267,644 31 $ 3,815,902 35 (14)
INCOME TAX EXPENSE (Notes 4 and 35) 413,761 4 572,016 5 (28)
NET INCOME FOR THE YEAR 2,853,883 27 3,243,886 30 (12)
OTHER COMPREHENSIVE INCOME (LOSS)Items that will not be reclassified
subsequently to profit or loss:Remeasurement of defined benefit
plans (Notes 4 and 27) 55,828 1 (137,752) (1) 141Share of other comprehensive loss
of associates (Notes 4 and 14) (414) - (671) - (38)Income tax relating to items that
will not be reclassified subsequently to profit or loss (Note 35) (9,491) - 23,418 - (141)
45,923 1 (115,005) (1) 140Items that may be reclassified
subsequently to profit or lossExchange differences on translating
foreign operations (Note 4) (128,795) (1) (25,207) - (411)Unrealized gain (loss) on
available-for-sale financial assets (Notes 4 and 28) 357,804 3 (76,297) (1) 569
Share of other comprehensive gain (loss) of associates (Notes 4, 14 and 28) 9,528 - (11,952) - 180
Income tax relating to items that may be reclassified subsequently to profit or loss (Note 35) 4,226 - - - -
242,763 2 (113,456) (1) 314
Other comprehensive income (loss) for the year 288,686 3 (228,461) (2) 226
TOTAL COMPREHENSIVE INCOME FOR THE YEAR $ 3,142,569 30 $ 3,015,425 28 4
(Continued)
94

FAR EASTERN INTERNATIONAL BANK LTD. AND SUBSIDIARIES
CONSOLIDATED STATEMENTS OF COMPREHENSIVE INCOMEFOR THE YEARS ENDED DECEMBER 31, 2017 AND 2016(In Thousands of New Taiwan Dollars, Except Per Share Amounts)
Percentage Increase
2017 2016 (Decrease)Amount % Amount % %
NET INCOME ATTRIBUTABLE TO:Owners of the Bank $ 2,853,883 27 $ 3,243,886 30 (12)
TOTAL COMPREHENSIVE INCOME ATTRIBUTABLE TO:Owners of the Bank $ 3,142,569 30 $ 3,015,425 28 4
EARNINGS PER SHARE (Note 36)Basic $0.90 $1.02Diluted $0.86 $0.98
The accompanying notes are an integral part of the consolidated financial statements. (Concluded)
95

FAR
EA
STER
N IN
TER
NA
TIO
NA
L BA
NK
LTD
. AN
D S
UBS
IDIA
RIE
S
CO
NSO
LID
ATE
D S
TATE
MEN
TS O
F C
HA
NG
ES IN
EQ
UIT
YFO
R T
HE
YEA
RS
END
ED D
ECEM
BER
31,
201
7 A
ND
201
6(I
n T
hous
ands
of N
ew T
aiw
an D
olla
rs)
Equ
ity A
ttrib
utab
le to
Ow
ners
of t
he B
ank
Oth
er E
quity
Exch
ange
Unr
ealiz
edD
iffer
ence
s on
Gai
n (L
oss)
on
Tra
nsla
ting
Ava
ilabl
e-fo
r-O
rdin
ary
Ret
aine
d E
arni
ngs (
Not
e 28
)Fo
reig
nsa
le F
inan
cial
Shar
es
Cap
ital S
urpl
usU
napp
ropr
iate
dO
pera
tions
Ass
ets (
Not
es 4
,(N
ote
28)
(Not
e 28
)L
egal
Res
erve
Spec
ial R
eser
veEa
rnin
gs(N
ote
4)12
, 14
and
28)
Tot
al E
quity
BA
LAN
CE
AT
JAN
UA
RY
1, 2
016
$30
,332
,430
$45
9,91
8$
4,49
1,17
3$
208,
219
$3,
601,
013
$14
1,12
3$
(256
,228
)$
38,9
77,6
48
App
ropr
iatio
n of
the
2015
ear
ning
sLe
gal r
eser
ve-
-1,
080,
304
-(1
,080
,304
)-
--
Rev
ersa
l of s
peci
al re
serv
es-
--
(87,
191)
87,1
91-
--
Cas
h di
vide
nds -
NT$
0.40
0 do
llars
per
shar
e-
--
-(1
,213
,297
)-
-(1
,213
,297
)St
ock
divi
dend
s -N
T$0.
200
dolla
rs p
er sh
are
606,
649
--
-(6
06,6
49)
--
-
606,
649
-1,
080,
304
(87,
191)
(2,8
13,0
59)
--
(1,2
13,2
97)
Net
inco
me
for t
he y
ear e
nded
Dec
embe
r 31,
201
6-
--
-3,
243,
886
--
3,24
3,88
6
Oth
er c
ompr
ehen
sive
loss
for t
he y
ear e
nded
Dec
embe
r 31,
201
6-
--
-(1
15,0
05)
(25,
207)
(88,
249)
(228
,461
)
Tota
l com
preh
ensi
ve in
com
e (lo
ss) f
or th
e ye
ar e
nded
Dec
embe
r 31,
201
6-
--
-3,
128,
881
(25,
207)
(88,
249)
3,01
5,42
5
Empl
oyee
s' bo
nus -
stoc
k17
4,59
3(3
,492
)-
--
--
171,
101
BA
LAN
CE
AT
DEC
EMB
ER 3
1, 2
016
31,1
13,6
7245
6,42
65,
571,
477
121,
028
3,91
6,83
511
5,91
6(3
44,4
77)
40,9
50,8
77
App
ropr
iatio
n of
the
2016
ear
ning
sLe
gal r
eser
ve-
-97
3,16
6-
(973
,166
)-
--
Spec
ial r
eser
ve-
--
129,
675
(129
,675
)-
--
Cas
h di
vide
nds -
NT$
0.42
0 do
llars
per
shar
e-
--
-(1
,306
,774
)-
-(1
,306
,774
)St
ock
divi
dend
s -N
T$0.
230
dolla
rs p
er sh
are
715,
614
--
-(7
15,6
14)
--
-
715,
614
-97
3,16
612
9,67
5(3
,125
,229
)-
-(1
,306
,774
)
Net
inco
me
for t
he y
ear e
nded
Dec
embe
r 31,
201
7-
--
-2,
853,
883
--
2,85
3,88
3
Oth
er c
ompr
ehen
sive
inco
me
(loss
) for
the
year
end
ed D
ecem
ber 3
1, 2
017
--
--
45,9
23(1
24,5
69)
367,
332
288,
686
Tota
l com
preh
ensi
ve in
com
e (lo
ss) f
or th
e ye
ar e
nded
Dec
embe
r 31,
201
7-
--
-2,
899,
806
(124
,569
)36
7,33
23,
142,
569
BA
LAN
CE
AT
DEC
EMB
ER 3
1, 2
017
$31
,829
,286
$45
6,42
6$
6,54
4,64
3$
250,
703
$3,
691,
412
$(8
,653
)$
22,8
55$
42,7
86,6
72
The
acco
mpa
nyin
g no
tes a
re a
n in
tegr
al p
art o
f the
con
solid
ated
fina
ncia
l sta
tem
ents
.
96

FAR EASTERN INTERNATIONAL BANK LTD. AND SUBSIDIARIES
CONSOLIDATED STATEMENTS OF CASH FLOWSFOR THE YEARS ENDED DECEMBER 31, 2017 AND 2016(In Thousands of New Taiwan Dollars)
2017 2016
CASH FLOWS FROM OPERATING ACTIVITIESIncome before income tax $ 3,267,644 $ 3,815,902Adjustments for:
Depreciation 220,196 198,246Amortization 27,946 28,202Provision for possible losses 1,215,343 1,300,165Net valuation gain on financial assets and liabilities at fair value
through profit or loss (160,180) (566,152)Interest expenses 4,653,057 3,844,797Interest revenues (10,057,931) (9,629,219)Dividends income (63,321) (63,195)Shares of profit from associates (103,337) (85,454)Unrealized net loss (gain) on foreign currency exchange 395,728 (59,875)Gain on disposal investment properties (1,490) -Other adjustments (100,995) 768Changes in operating assets and liabilities
Decrease (increase) in due from the central bank and other banks 7,092,056 (3,531,591)Decrease in financial assets at fair value through profit or loss 3,781,946 6,408,184Increase in receivables (1,776,592) (2,273,540)Decrease (increase) in discounts and loans 551,765 (22,683,826)Increase in available-for-sale financial assets (30,236,113) (52,201,509)Decrease in held-to-maturity financial assets 306,249 488,896Decrease (increase) in debt investments with no active market 919,160 (966,219)Increase (decrease) in due to the central bank and other banks 137,136 (5,762,695)Decrease in financial liabilities at fair value through profit or loss (3,635,415) (1,633,706)Increase in payables 456,277 2,040,052Increase in deposits and remittances 25,778,208 1,425,551
Cash generated from (used in) operations 2,667,337 (79,906,218)Interest received 9,933,372 9,633,034Dividends received 63,321 63,195Interest paid (4,338,543) (3,864,971)Income tax paid (486,615) (566,153)
Net cash generated from (used in) operating activities 7,838,872 (74,641,113)
CASH FLOWS FROM INVESTING ACTIVITIESAcquisition of financial assets carried at cost (24,950) -Proceeds from disposal of financial assets carried at cost 51,496 -Acquisition of investments accounted for using equity method (28,980) -Acquisition of property and equipment (224,462) (247,089)Proceeds from disposal of property and equipment 45 325Decrease in other financial assets 49,971 1,652,873Decrease in other assets 19,794 11,093Dividends received from associates 69,585 28,648
Net cash generated from (used in) investing activities (87,501) 1,445,850(Continued)
97

FAR EASTERN INTERNATIONAL BANK LTD. AND SUBSIDIARIES
CONSOLIDATED STATEMENTS OF CASH FLOWSFOR THE YEARS ENDED DECEMBER 31, 2017 AND 2016(In Thousands of New Taiwan Dollars)
2017 2016
CASH FLOWS FROM FINANCING ACTIVITIESProceeds from the issuance of bank debentures $ - $ 4,000,000Redemption of bank debentures (4,000,000) (200)Increase (decrease) in securities sold under repurchase agreements (434,630) 9,968,068Increase in other financial liabilities 1,204,602 3,354,406Increase (decrease) in other liabilities 30,605 (393,772)Cash dividends (1,306,774) (1,213,297)
Net cash generated from (used in) financing activities (4,506,197) 15,715,205
EFFECTS OF EXCHANGE RATE CHANGES ON CASH AND CASH EQUIVALENTS 53,011 (25,606)
NET INCREASE (DECREASE) IN CASH AND CASH EQUIVALENTS 3,298,185 (57,505,664)
CASH AND CASH EQUIVALENTS, BEGINNING OF THE YEAR 28,339,153 85,844,817
CASH AND CASH EQUIVALENTS, END OF THE YEAR $ 31,637,338 $ 28,339,153
Reconciliation of the amounts in the consolidated statements of cash flows with the equivalent items reported in the consolidated balance sheets is as follows:
December 312017 2016
Cash and cash equivalents in consolidated balance sheets $ 8,693,621 $ 7,361,878Due from the Central Bank and other banks that meet the IAS 7 definition
of cash and cash equivalents 11,872,324 14,580,619Securities purchased under resale agreements that meet the IAS 7
definition of cash and cash equivalents 11,071,393 6,396,656Cash and cash equivalents in consolidated statements of cash flows $ 31,637,338 $ 28,339,153
The accompanying notes are an integral part of the consolidated financial statements. (Concluded)
98
FAR EASTERN INTERNATIONAL BANK LTD. AND SUBSIDIARIES
NOTES TO CONSOLIDATED FINANCIAL REPORTSFOR THE YEARS ENDED DECEMBER 31, 2017 AND 2016(In Thousands of New Taiwan Dollars, Unless Stated Otherwise)
1. GENERAL INFORMATION
Far Eastern International Bank Ltd. (the Bank ) obtained its license on January 11, 1992 and started itsbusiness on April 11, 1992. The Bank (a) accepts deposits and extends loans and guarantees; (b) issuesletters of credit, handles domestic and foreign remittances, and accepts commercial drafts; (c) invests insecurities and acts as an agent for trading government bonds, corporate bonds and bank debentures; and (d)conducts relevant businesses that are authorized by the relevant authorities.
trust, real estate trust,
These operations are regulated under the Banking Act and Trust Enterprise Act.
erating units included the Business Department, InternationalBanking Department, Trust Department, Credit Card Department, Offshore Banking Unit (OBU), and 55domestic branches, as well as an overseas branch in Hong Kong.
the Taiwan Stock Exchange. Global depositary receipts, which representownership of ordinary shares of the Bank, have been listed on the Luxembourg Stock Exchange sinceJanuary 2014.
To integrate resources and produce maximum benefit from the business, the Bank absorbed and merged Far
percent equity and the merger did not have effect on the equity of the shareholders.
The Bank accepted generally all assets, liabilities and all rights and obligations of FELIA and FEPIA that were valid as of merger date.
2. APPROVAL OF FINANCIAL REPORTS
The consolidated f March 21, 2018.
3. APPLICATION OF NEW, AMENDED AND REVISED STANDARDS AND INTERPRETATIONS
a. The application of the amendments to the Regulations Governing the Preparation of Financial Reports
did not have material impact on the accounting policies of the Bank and its subsidiaries.
99

b. The Regulations Governing the Preparation of Financial Reports by Public Banks and the IFRSsendorsed by the FSC for application starting from 2018.
New, Amended or Revised Standards and Interpretations Effective DateAnnounced by IASB (Note 1)
Annual Improvements to IFRSs 2014-2016 Cycle Note 2
Share-January 1, 2018
January 1, 2018
January 1, 2018 January 1, 2018
January 1, 2018Revenue from January 1, 2018
January 1, 2017Amendments to IAS 12 Recognition of Deferred Tax Assets for
Unrealized LossesJanuary 1, 2017
January 1, 2018IFRIC 22 January 1, 2018
Note 1: Unless stated otherwise, the above New IFRSs are effective for annual periods beginning on or after their respective effective dates.
Note 2: The amendment to IFRS 12 is retrospectively applied for annual periods beginning on or after January 1, 2017; the amendments to IAS 28 are retrospectively applied for annual periods beginning on or after January 1, 2018.
The application of the above New IFRSs, whenever applied, would have any material impact on the
1)
Classification and measurement of financial assets
All
IFRS 9, the requirement for the classification of financial assets is stated below.
For entities' debt instruments that have contractual cash flows that are solely payments of principaland interest on the principal amount outstanding, their classification and measurement are asfollows:
a) For debt instruments, if they are held within a business model whose objective is to collectcontractual cash flows, are measured at amortized cost and assessed for impairmentcontinuously with any impairment loss recognized in profit or loss. Interest revenue isrecognized in profit or loss by using the effective interest method;
100

b) For debt instruments, if they are held within a business model whose objective is achieved byboth collecting contractual cash flows and selling financial assets, the financial assets aremeasured at fair value and are assessed for impairment. Interest revenue is recognized in profitor loss by using the effective interest method, and assess the impairments continued, impairmentgains or losses and foreign exchange gains and losses are recognized in profit or loss, changes infair value are recognized in other comprehensive income. When the debt instruments arederecognized or reclassified, the cumulative gain or loss previously recognized in othercomprehensive income is reclassified from equity to profit or loss.
Except for the above, all other financial assets are measured at fair value through profit or loss. However, entities may make an irrevocable election to present subsequent changes in the fair value of an equity investment (that is not held for trading) in other comprehensive income, with only dividend income generally recognized in profit or loss. No subsequent impairment assessment is required, and the cumulative gain or loss previously recognized in other comprehensive income cannot be reclassified from equity to profit or loss.
The Bank and its subsidiaries analyzed the current facts and circumstances of its financial assets existing at December 31, 2017 and performed a preliminary assessment of the main impact of IFRS 9 on the classification and measurement of financial assets. Under IFRS 9:
a) xas available-for-sale and unlisted on TWSE and TPEx shares are measured at cost will beclassified as at fair value through other comprehensive income and the fair value gains or lossesaccumulated in other equity will be transferred directly to retained earnings instead of beingreclassified to profit or loss on disposal.
b) Beneficiary certificates classified as available-for-sale will be classified as at fair value throughprofit or loss because the contractual cash flows are not solely payments of principal andinterest on the principal outstanding, and they are not equity instruments;
c) Debt instruments classified as held-to-maturity financial assets and measured at amortized costwill be classified as measured at amortized cost under IFRS 9 because, on initial recognition,the contractual cash flows are solely payments of principal and interest on the principaloutstanding and these investments are held within a business model whose objective is to collectcontractual cash flows.
d) Debt instruments classified as investments with no active market and part of loan will beclassified as at fair value through profit or loss under IFRS 9 because, on initial recognition, thecontractual cash flows are not solely payments of principal and interest on the principaloutstanding.
Impairment loss on financial assets
IFRS 9 requires impairment loss on financial
investments in debt instruments measured at fair value through other comprehensive income, lease receivablescertain written loan commitments and financial guarantee contracts. A loss allowance for 12-month expected credit losses is required for a financial asset if its credit risk has not increased significantly since initial recognition. A loss allowance for full-lifetime expected credit losses is required for a financial asset if its credit risk has increased significantly since initial recognition and is not low.
For purchased or originated credit-impaired financial assets, entities takes into account the expected credit losses on initial recognition in calculating the credit-adjusted effective interest rate. Subsequently, any changes in expected losses are recognized as a loss allowance with a corresponding gain or loss recognized in profit or loss.
101

Effect of applying IFRS 9
the Bank and its subsidiaries elect not to restate prior reporting periods when applying the requirements for the classification, measurement and impairment of financial assets under IFRS 9 but will recognize the cumulative effect of the initial application at the date of initial application and will provide the disclosures related to the classification and the adjustment information upon initial application of IFRS 9.
The anticipated impact on assets, liabilities and equity of retrospective application of the requirements for the classification, measurement and impairment of financial assets as of January 1, 2018 is set out below:
Carrying Amount as of December 31,
2017
Adjustments Arising from
Initial Application
Adjusted Carrying
Amount as of January 1, 2018
Impact on assets, liabilities and equity
Financial assets at fair value through profit or loss $ 30,208,333 $ 9,905,673 $ 40,114,006
Securities purchased under resale agreements 11,071,393 (125) 11,071,268
Discounts and loans, net 351,056,762 (3,161,799) 347,894,963Available-for-sale financial assets 109,631,578 (109,631,578) -Financial assets at fair value through other
comprehensive income - 109,891,833 109,891,833Held-to-maturity financial assets 2,135,246 (2,135,246) -Financial assets measured at amortized
cost - 2,134,976 2,134,976Investment accounted for using equity method 1,774,066 4,010 1,778,076Debt investments with no active market 6,677,076 (6,677,076) -Other financial assets, net 3,667,760 (114,232) 3,553,528
Total effect on assets $ 216,436
Provisions 1,127,116 $ 55,568 1,182,684
Impact on liabilities $ 55,568
Retained earnings 10,486,758 $ (12,342) 10,474,416Other equity 14,202 173,210 187,412
Total effect on equity $ 160,868
102
c. New IFRSs in issue but not yet endorsed and issued into effect by the FSC
New IFRSsEffective Date
Announced by IASB (Note 1)
Annual Improvements to IFRSs 2015-2017 Cycle January 1, 2019January 1, 2019 (Note 2)
To be determined by IASB
January 1, 2019 (Note 3)January 1, 2021
Amendments to IAS 19 January 1, 2019 (Note 4)
-term Interests in Associates and Joint Ventur
January 1, 2019
January 1, 2019
Note 1: Unless stated otherwise, the above New IFRSs are effective for annual periods beginning on or after their respective effective dates.
Note 2: The FSC permits entities to elect application of the amendments in advance on January 1, 2018.
Note 3:January 1, 2019.
Note 4: Entities shall apply these amendments to plan amendments, curtailments or settlements occurring on or after January 1, 2019.
The application of the above new, amended or revised standards and interpretations, whenever applied, olicies are as follows:
1)
IFRS 16 sets out the accounting standards for leases that will supersede IAS 17 and a number ofrelated interpretations.
Under IFRS 16, if entities are lessee, it shall recognize right-of-use assets and lease liabilities for allleases on the balance sheets except for low-value and short-term leases. Entities may elect toapply the accounting method similar to the accounting for operating leases under IAS 17 tolow-value and short-term leases. On the statements of comprehensive income, entities shouldpresent the depreciation expense charged on right-of-use assets separately from the interest expenseaccrued on lease liabilities; interest is computed by using the effective interest method. On thestatements of cash flows, cash payments for the principal portion of lease liabilities are classifiedwithin financing activities; cash payments for the interest portion are classified within operatingactivities.
The application of IFRS 16 is not expected to have a material impact on the accounting of entitiesas lessor.
When IFRS 16 becomes effective, entities may elect to apply this standard either retrospectively toeach prior reporting period presented or retrospectively with the cumulative effect of the initialapplication of this standard recognized at the date of initial application.
103

2)
IFRS 9 stipulated that if a contractual term of a financial asset permits the issuer (i.e. the debtor) toprepay a debt instrument or permits the holder (i.e. the creditor) to put a debt instrument back to theissuer before maturity and the prepayment amount substantially represents unpaid amounts ofprincipal and interest on the principal amount outstanding, which may include reasonablecompensation for early termination, the financial asset has contractual cash flows that are solelypayments of principal and interest on the principal amount outstanding.
The amendments further explained that reasonable compensation may be paid or received by eitherof the parties, i.e. a party may receive reasonable compensation when it chooses to terminate thecontract early.
3) Plan Amendment, Curtailment or Settlement
The amendments stipulate that, if a plan amendment, curtailment or settlement occurs, the currentservice cost and the net interest for the remainder of the annual reporting period are determinedusing the actuarial assumptions used for the remeasurement of the net defined benefit liabilities(assets). In addition, the amendments clarify the effect of a plan amendment, curtailment orsettlement on the requirements regarding the asset ceiling. The amendment shall be appliedprospectively.
Except for the above impact, as of the date the consolidated financial statements were authorized forissue, the Bank and its subsidiaries are continuously assessing the possible impact that the
financial position and financial performance, and will disclose the relevant impact when theassessment is completed.
4. SUMMARY OF SIGNIFICANT ACCOUNTING POLICIES
Statement of Compliance
The consolidated financial reports have been prepared in accordance with the Regulations Governing thePreparation of Financial Reports by Public Banks and the IFRSs endorsed by the FSC.
Basis of Preparation
The consolidated financial reports have been prepared on the historical cost basis except for financialinstruments and net benefit liabilities which are measured at the present value of the defined benefitobligation less the fair value of plan assets. Historical cost is generally based on the fair value of theconsideration given in exchange for assets.
Current and Noncurrent Assets and Liabilities
Accounts included in the consolidated balance sheets are not classified as current or noncurrent since themajor components of the consolidated financial reports are from the banking sector, whose operating cyclecannot be reasonably identified. Nevertheless, accounts are properly categorized in accordance with theirnature and sequenced by their liquidity. Please refer to Note 43 for the maturity analysis of liabilities.
Basis of Consolidation
a. Principles of preparing consolidated financial reports
The consolidated financial reports incorporate the financial reports of the Bank and its subsidiaries.
104

Intercompany transactions, balances, income and expenses between the Bank and its subsidiaries have been eliminated upon consolidation.
b. Entities included in consolidated financial reports
Entities included in consolidated financial reports were as follows:
% of OwnershipDecember 31
Investor Company Investee Company Nature of Businesses 2017 2016
The Bank Far Eastern Asset Management Purchase, evaluation, auction and management of rights of financial institution creditors
100 100
The Bank FELIA Insurance agent - 100The Bank FEPIA Insurance agent - 100
Far Eastern International Securities Foreign securities broker, wealth management and offshore fund consulting
100 100
Far Eastern Asset Management Co., Ltd.
FEIB Financial Leasing Co., Ltd. Leasing operation 100 100
FELIA and FEPIA were merged by the Bank on February 6, 2017.
Acquisitions of another financial institution are accounted for using the purchase method if acquisitions comply with business combination. The consideration transferred in acquisitions of another financial institution is measured at fair value, which is calculated as the sum of the acquisition-date fair values of the assets transferred by the Bank, liabilities incurred by the Bank to the former owners of the acquiree and the equity interests issued by the Bank in exchange for control of the acquiree.
Foreign Currency
Foreign-currency assets and liabilities are recorded in their original currencies. Foreign-currency items in net income of domestic operating units are translated into New Taiwan dollars at prevailing exchange rates at the dates of the transactions. For overseas branches (including the OBU), foreign-currency items in net income from transactions settled in curre
At the balance sheet date, foreign-currency monetary assets and liabilities are translated at prevailing exchange rates, and the exchange differences are recognized as gain or loss.
When foreign-currency assets and liabilities are settled, exchange differences arising from the application of different exchange rates are recognized as gain or loss for the current year.
The financial statements of foreign operations (including foreign branches, the OBU and foreign subsidiaries) are translated into New Taiwan dollars at the following exchange rates: Assets and liabilities - at exchange rates pof foreign branches and the OBU not yet remitted to the head office - the same as the ending balance of the
- at average exchange rates for the period. Exchange differences arising from the translation of the financial statements of foreign branches are recognized as other comprehensive income-exchange differences on translating foreign operations.
105

Investment Accounted for Using Equity Method
Investments in associates are accounted for using the equity method of accounting.
An associate is an entity over which the Bank and its subsidiaries have significant influence and that is not a subsidiary. Significant influence is the power to participate in the financial and operating policy decisions of the investee without having control or joint control over those policies.
An investment in an associate is initially recognized at cost and adjusted thereafter to recognize the Bank
associates.
Property and Equipment
Property and equipment are stated at cost, less accumulated depreciation and accumulated impairment loss.
Depreciation is recognized so as to write off the cost of assets less their residual values over their estimated useful lives, using the straight-line method. The estimated useful lives, residual values and depreciation method are reviewed at the end of each year, with the effect of any changes in estimate accounted for on a prospective basis.
Any gain or loss arising on the disposal or retirement of an item of property and equipment is determined as the difference between the sales proceeds and the carrying amount of the asset and is recognized in profit or loss.
Intangible Assets
Intangible assets acquired in a business combination are initially recognized at their fair value at the acquisition date. Subsequent to initial recognition, intangible assets with finite useful lives are reported at cost less accumulated amortization and accumulated impairment loss. Amortization is recognized on a straight-line basis. The estimated useful life, residual value, and amortization method are reviewed at the end of each reporting period, with the effect of any changes in estimate accounted for on a prospective basis. The residual value of an intangible asset with a finite useful life shall be assumed to be zero unless the Bank expects to dispose of the intangible asset before the end of its economic life. Intangible assets with indefinite useful lives are measured at cost less accumulated impairment loss.
Impairment of Tangible and Intangible Assets
At the end of each reporting period, the Bank and its subsidiaries review the carrying amounts of their tangible and intangible assets to determine whether there is any indication that those assets have suffered an impairment loss. If any such indication exists, the recoverable amount of the asset is estimated in order to determine the extent of the impairment loss. When it is not possible to estimate the recoverable amount of an individual asset, the Bank and its subsidiaries estimate the recoverable amount of the cash-generating unit to which the asset belongs. Corporate assets are allocated to the smallest group of cash-generating units under a reasonable and consistent basis.
Intangible assets with indefinite useful lives are tested for impairment at least annually, and whenever there is an indication that the asset may be impaired.
Recoverable amount is the higher of fair value less costs to sell and value in use. If the recoverable amount of an asset or cash-generating unit is estimated to be less than its carrying amount, the carrying amount of the asset or cash-generating unit is reduced to its recoverable amount.
106

When the recoverable amount increases in a subsequent period, the reversal of an impairment loss is recognized immediately in profit or loss. The carrying amount of the asset or cash-generating unit is increased to the revised estimate of its recoverable amount, but only to the extent of the carrying amount that would have been determined had no impairment loss been recognized for the asset or cash-generating unit in prior years.
Securities Purchased/Sold Under Resale/Repurchase Agreements
Securities purchased under resale agreements and securities sold under repurchase agreements are generallytreated as collateralized financing transactions. Interest expenses and interest revenues are recognized on the accrual basis.
Financial Instruments
Financial assets and financial liabilities are recognized when the Bank and its subsidiaries become a party to the contractual provisions of the instruments.
Transaction costs that are directly attributable to the acquisition or issue of financial assets and financial liabilities (other than financial assets and financial liabilities at fair value through profit or loss) are added to or deducted from the fair value of the financial assets or financial liabilities, as appropriate, on initial recognition. Transaction costs directly attributable to the acquisition of financial assets or financial liabilities at fair value through profit or loss are recognized immediately as expense.
Financial assets
All regular way purchases or sales of financial assets are recognized and derecognized on a trade date basis.
a. Measurement category
Financial assets are classified into the following specified categories: Financial assets at fair valuethrough profit or loss, held-to-maturity investments, available-for-sale financial assets and loans andreceivables.
Cash equivalent includes investments with original maturities within three months from the date ofacquisition, highly liquid, readily convertible to a known amount of cash and time deposits be subject toan insignificant risk of changes in value. These cash equivalents are held for the purpose of meetingshort-term cash commitments.
1) Financial assets at fair value through profit or loss
Financial assets are classified as at fair value through profit or loss when the financial asset is eitherheld for trading or it is designated as at fair value through profit or loss.A financial asset may be designated as at fair value through profit or loss upon initial recognition if:
Such designation eliminates or significantly reduces a measurement or recognitioninconsistency that would otherwise arise; or
The financial asset forms part of a group of financial assets or financial liabilities or both, whichis managed and its performance is evaluated on a fair value basis, in accordance with the Bank
ategy, and information aboutthe grouping is provided internally on that basis; or
The contract contains one or more embedded derivatives so that the entire hybrid (combined)contract can be designated as at fair value through profit or loss.
107

Financial assets at fair value through profit or loss are stated at fair value, with any gains or losses arising on remeasurement, and any dividend or interest earned on the financial asset recognized in profit or loss.
2) Held-to-maturity investments
Held-to-maturity financial assets are non-derivative financial assets with fixed or determinablepayments and fixed maturity dates that the Bank and its subsidiaries have the positive intent andability to hold to maturity. Subsequent to initial recognition, held-to-maturity financial assets aremeasured at amortized cost using the effective interest method less any impairment.
3) Available-for-sale financial assets
Available-for-sale financial assets are non-derivatives that are either designated as available-for-saleor are not classified as loans and receivables, held-to-maturity financial assets or financial assets atfair value through profit or loss.
Available-for-sale financial assets are measured at fair value. Interest revenues ofavailable-for-sale bond investments calculated using the effective interest method and dividends onavailable-for-sale equity investments are recognized in profit or loss. Other changes in the fairvalue of available-for-sale financial assets are recognized in other comprehensive income and willbe reclassified to profit or loss when the investment is disposed of or is determined to be impaired.
Dividends on available-for-right to receive the dividends is established.
Available-for-sale equity investments that do not have a quoted market price in an active marketand whose fair value cannot be reliably measured are measured at cost less any identifiedimpairment loss and are recognized in a separate line item as financial assets measured at cost. If,in a subsequent period, the fair value of the financial assets can be reliably measured, the financialassets are remeasured at fair value. The difference between carrying amount and fair value isrecognized in other comprehensive income on financial assets. Any impairment losses arerecognized in profit or loss.
4) Loans and receivables
Loans and receivables (including receivables, discounts and loans, nonaccrual loans other thandiscounts and loans, and debt investments with no active market) are measured at amortized costusing the effective interest method, less any impairment.
b. Impairment of financial assets
Financial assets, other than those at fair value through profit or loss, are assessed for indicators ofimpairment at the end of each reporting period. Financial assets are considered to be impaired whenthere is objective evidence that, as a result of one or more events that occurred after the initialrecognition of the financial asset, the estimated future cash flows of the investment have been affected.
For all financial assets, objective evidence of impairment could include:
Significant financial difficulty of the issuer or counterparty; orBreach of contract, such as a default or delinquency in interest or principal payments; orIt is becoming probable that the borrower will undergo bankruptcy or financial reorganization; orDisappearance of an active market for that financial asset because of financial difficulties.
108
1) Financial assets measured at amortized cost
For discounts and loans and receivables, assets are assessed for impairment on a collective basiseven if they were assessed as not impaired individually. Objective evidence of impairment for aportfolio of loans and recan increase in the number of delayed payments in the portfolio, as well as observable changes innational or local economic conditions that correlate with default on loans and receivables.
For financial assets measured at amortized cost, the amount of the impairment loss recognized is the
nterest rate. If the amount of the impairment lossdecreases in a subsequent period and the decrease can be related objectively to an event occurringafter the impairment was recognized, the previously recognized impairment loss is reversed throughprofit or loss to the extent that the carrying amount of the investment at the date the impairment isreversed does not exceed what the amortized cost would have been had the impairment not beenrecognized.
2) Available-for-sale financial assets
For available-for-sale equity investments, a significant or prolonged decline in the fair value of thesecurity below its cost is considered to be objective evidence of impairment.
When an available-for-sale financial asset is considered to be impaired, cumulative gains or lossespreviously recognized in other comprehensive income are reclassified to profit or loss in the period.
In respect of available-for-sale equity securities, impairment loss previously recognized in profit orloss are not reversed through profit or loss. Any increase in fair value subsequent to animpairment loss is recognized in other comprehensive income. In respect of available-for-saledebt securities, impairment loss is subsequently reversed through profit or loss if an increase in thefair value of the investment can be objectively related to an event occurring after the recognition ofthe impairment loss.
3) Financial assets measured at cost
For financial assets that are measured at cost, the amount of the impairment loss is measured as the
flows discounted at the current market rate of return for a similar financial asset. Such impairmentloss will not be reversed in subsequent periods.
The carrying amount of the financial asset is reduced by the impairment loss directly for all financial assets with the exception of discounts and loans, receivables and nonaccrual loans other than discounts and loans, where the carrying amount is reduced through an allowance account.
their ability to repay principals and interests, and the values of collaterals in accordance with the Procedures for Banking Institutions to Evaluate Assets and Deal with
categorized by collectability and specify the minimum allowance for possible losses and reserve for guarantee obligations using prescribed percentages.
When a loan or receivable is considered uncollectable, it may be written off on the approval of the -off loans are
credited against provision for possible losses.
109
c. Derecognition of financial assets
The Bank and its subsidiaries derecognize a financial asset only when the contractual rights to the cashflows from the asset expire, or when it transfers substantially all the risks and rewards of ownership ofthe financial asset to another party.
and the sum of the consideration received and receivable and the cumulative gain or loss that had beenrecognized in other comprehensive income and accumulated in equity is recognized in profit or loss.
Equity instruments
Debt and equity instruments issued by the Bank are classified as either financial liabilities or as equity in accordance with the substance of the contractual arrangements and the definitions of a financial liability and an equity instrument.
An equity instrument is any contract that evidences a residual interest in the assets of an entity after deducting all of its liabilities. Equity instruments are recognized at the proceeds received, net of transaction costs.
Financial liabilities
a. Subsequent measurement
Except the following situation, all the financial liabilities are measured at amortized cost using theeffective interest method:
1) Financial liabilities at fair value through profit or loss
Financial liabilities are classified as at fair value through profit or loss when the financial liability isheld for trading. Any gains or losses arising on remeasurement, including interest paid on thefinancial liability, are recognized in profit or loss.
2) Financial guarantee contracts
Financial guarantee contracts issued by the Bank are initially recognized at their amortized cost if itis not designated as at fair value through profit or less. The contract would be measured at higherof the best estimate of the obligation or the amount initially recognized less cumulative amortizationrecognized only when the Bank might have to pay obligation contract price.
b. Derecognition of financial liabilities
The difference between the carrying amount of the financial liability derecognized and theconsideration paid, and any non-cash assets transferred or liabilities assumed, is recognized in profit orloss.
Euro convertible bonds
Euro Convertible Bonds that contain both liability and conversion option derivative components are classified separately into respective items on initial recognition. The conversion option that will be settled other than by the exchange of a fixed amount of cash or other financial asset for a fixed number of the
In subsequent periods, the liability component of the Euro Convertible Bonds is measured at amortized cost using the effective interest method. The conversion option derivative is measured at fair value and the changes in fair value are recognized in profit or loss.
110

Transaction costs related to the issuance of Euro Convertible Bonds are included in the carrying amount of the liability component and are amortized over the lives of Euro Convertible Bonds using the effective interest method.
Derivative financial instruments
Derivatives are initially recognized at fair value at the date the derivative contracts are entered into and are subsequently remeasured to their fair value at the end of each reporting period. The resulting gain or loss is recognized in profit or loss. Derivative financial instruments do not apply hedge accounting are recognized as financial assets or liabilities held for trading. When the fair value of derivative financial instruments is positive, the derivative is recognized as a financial asset; when the fair value of derivative financial instruments is negative, the derivative is recognized as a financial liability.
Derivatives embedded in non-derivative host contracts are treated as separate derivatives when they meet the definition of a derivative, their risks and characteristics are not closely related to those of the host contracts and the contracts are not measured at fair value through profit or loss.
Levies
A levy imposed by a government is accrued as payables when the transaction or activity that triggers the payment of the levy occurs.
Provisions
Provisions are recognized when the Bank and its subsidiaries have a present obligation as a result of a past event, it is probable that the Bank and its subsidiaries will be required to settle the obligation, and a reliable estimate can be made of the amount of the obligation.
Provisions are measured at the best estimate of the consideration required to settle the present obligation at the end of the reporting period, taking into account the risks and uncertainties surrounding the obligation. When a provision is measured using the cash flows estimated to settle the present obligation, its carrying amount is the present value of those cash flows (where the effect of the time value of money is material).
When some or all of the economic benefits required to settle a provision are expected to be recovered from a third party, a receivable is recognized as an asset if it is virtually certain that reimbursement will be received and the amount of the receivable can be measured reliably.
Revenue Recognition
Interest revenues from discounts and loans is recorded on the accrual basis. For nonaccrual loans, interest revenues are recognized only when collections on these obligations are made. Under the regulations of the Banking Bureau under the Financial Supervisory Commission, the interest revenues on credits covered by agreements that extend their maturity is recorded as deferred income and recognized upon collection.
Service fee income is recognized as loans are provided or services have been completed.
The gain or loss on the disposal or recovery of acquired receivables is accounted for by the effective interest method.
When the Bank and its subsidiaries acquires non-performing loans from other financial institutions, revenue related to recovery of non-performing loans is recognized using the cost-recovery method.
111

Retirement Benefit
Payments to defined contribution retirement benefit plans are recognized as an expense when employees have rendered service entitling them to the contributions.
Defined benefit costs (including service cost, net interest and remeasurement) under the defined benefit retirement plans are determined using the projected unit credit method. Service cost (including current service cost and net interest) are recognized as employee benefits expense in the period they occur. Remeasurement, comprising actuarial gains and losses, and the return on plan assets (excluding interest), is recognized in other comprehensive income in the period they occur. Remeasurement recognized in other comprehensive income is reflected immediately in retained earnings and will not be reclassified to profit or loss.
Any surplus resulting from this calculation is limited to the present value of any refunds from the plans or reductions in future contributions to the plans.
Income Tax
Income tax expense represents the sum of current tax payable and deferred tax.
a. Current tax expense
Current tax is the amount of income taxes payable (recoverable) in respect of the taxable profit (tax loss)for a period.
An additional tax of unappropriated earnings is provided for as income tax in the year the shareholdersapprove to retain the earnings.
b. Deferred tax expense
Deferred tax expense represents adjustments to deferred tax assets and liabilities.
Deferred tax assets or liabilities are recognized on temporary differences between the carrying amountsof assets and liabilities in the financial statements and the corresponding tax bases used in thecomputation of taxable profit. The measurement of deferred tax liabilities and assets reflects the taxconsequences that would follow from the manner in which the Bank and its subsidiaries expect, at theend of the reporting period, to recover or settle the carrying amount of its assets and liabilities.Deferred tax liabilities are generally recognized for all taxable temporary differences. Deferred taxassets are generally recognized for all deductible temporary differences and unused loss carryforwardsthat it is probable that taxable profits will be available against which those deductible temporarydifferences can be utilized.
Deferred tax liabilities and assets are measured at the tax rates that are expected to apply in the period inwhich the liability is settled or the asset realized, based on tax rates (and tax laws) that have beenenacted or substantively enacted by the end of the reporting period.
The carrying amount of deferred tax assets is reviewed at the end of each reporting period andrecognized to the extent that it has become probable that future taxable profit will allow the deferred taxassets to be recovered.
112

c. Current and deferred tax for the period
Current and deferred tax are recognized in profit or loss, except when they relate to items that arerecognized in other comprehensive income or directly in equity, in which case, the current and deferredtax are also recognized in other comprehensive income or directly in equity respectively.
5. CRITICAL ACCOUNTING JUDGMENTS AND KEY SOURCES OF ESTIMATIONUNCERTAINTY
In the application of accounting policies, management is required to make essential judgments, estimatesand assumptions about the carrying amounts of assets and liabilities that are not readily apparent from othersources. The estimates and associated assumptions are based on historical experience and other factorsthat are considered to be relevant. Actual results may differ from these estimates.
The estimates and underlying assumptions are reviewed on an ongoing basis. Revisions to accountingestimates are recognized in the period in which the estimate is revised if the revision affects only that periodor in the period of the revision and future periods if the revision affects both current and future periods.
a. Estimating impairment of discounts and loans and receivables
When there is objective evidence of impairment loss, the Bank and its subsidiaries take intoconsideration the estimation of future cash flows. The amount of the impairment loss is measured as
future cash flows
effective interest rate. Where the actual future cash flows are less than expected, an additionalimpairment loss may arise.
b. Estimating impairment of operation rights
Determining whether operation rights are impaired requires an estimation of the value in use of thecash-generating units to which operation rights have been allocated. The value in use calculationrequires management to estimate the future cash flows expected to arise from the cash-generating unitand a suitable discount rate in order to calculate present value. Where the actual future cash flows areless than expected, an impairment loss may arise.
c. Fair value of financial instruments
instruments that do not have quoted market price in an active market. Valuation techniques commonlyused by market practitioners are applied. For derivative financial instruments, models were based onquoted market rates adjusted for specific features of the instruments. Other financial instruments werevalued using a discounted cash flow analysis based on models supported, where possible, by observablemarket prices or rates. Note 43 provides detailed information about the key models used in the
chosen valuation techniques and models used are appropriate in determining the fair value of financialinstruments.
d. Income tax
The use of deferred income tax assets mainly depends on future taxable income and the possible timingand level of taxable temporary differences, along with future income tax strategies.
113
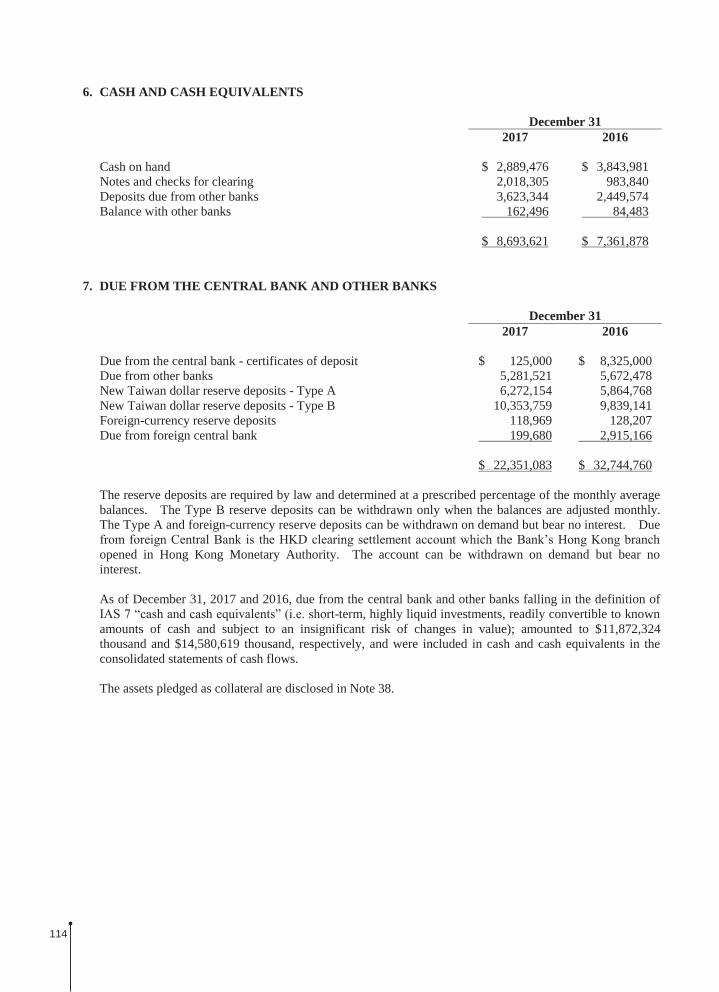
6. CASH AND CASH EQUIVALENTS
December 312017 2016
Cash on hand $ 2,889,476 $ 3,843,981Notes and checks for clearing 2,018,305 983,840Deposits due from other banks 3,623,344 2,449,574Balance with other banks 162,496 84,483
$ 8,693,621 $ 7,361,878
7. DUE FROM THE CENTRAL BANK AND OTHER BANKS
December 312017 2016
Due from the central bank - certificates of deposit $ 125,000 $ 8,325,000Due from other banks 5,281,521 5,672,478New Taiwan dollar reserve deposits - Type A 6,272,154 5,864,768New Taiwan dollar reserve deposits - Type B 10,353,759 9,839,141Foreign-currency reserve deposits 118,969 128,207Due from foreign central bank 199,680 2,915,166
$ 22,351,083 $ 32,744,760
The reserve deposits are required by law and determined at a prescribed percentage of the monthly average balances. The Type B reserve deposits can be withdrawn only when the balances are adjusted monthly. The Type A and foreign-currency reserve deposits can be withdrawn on demand but bear no interest. Due
opened in Hong Kong Monetary Authority. The account can be withdrawn on demand but bear no interest.
As of December 31, 2017 and 2016, due from the central bank and other banks falling in the definition of -term, highly liquid investments, readily convertible to known
amounts of cash and subject to an insignificant risk of changes in value); amounted to $11,872,324 thousand and $14,580,619 thousand, respectively, and were included in cash and cash equivalents in the consolidated statements of cash flows.
The assets pledged as collateral are disclosed in Note 38.
114

8. FINANCIAL ASSETS AND LIABILITIES AT FAIR VALUE THROUGH PROFIT OR LOSS
December 312017 2016
Financial assets at fair value through profit or loss
Financial assets held for tradingNon-derivative financial assets
Commercial paper $ 13,979,621 $ 6,913,572Domestic government bond 5,238,586 2,303,992Negotiable certificates of deposit 1,850,666 2,430,175Stock listed on TWSE and TPEx 347,783 151,537Domestic beneficiary certificates 50,473 25,673
21,467,129 11,824,949Derivative financial assets
Foreign-currency swap contracts 950,685 2,614,378Domestic convertible (exchangeable) bond asset swap contracts 766,433 1,509,128Interest rate swap contracts 721,496 1,063,986Currency option contracts 296,384 894,369Forward exchange contracts 149,661 214,019Others 176,507 229,288
3,061,166 6,525,168Financial assets designated as at fair value through profit or loss
Convertible (exchangeable) bonds 5,680,038 15,479,988
Total financial assets at fair value through profit or loss $ 30,208,333 $ 33,830,105
Financial liabilities at fair value through profit or loss
Non-derivative financial liabilitiesSettlement coverage bonds payable of short sale $ 50,241 $ -
Derivative financial liabilitiesConvertible (exchangeable) bond option contracts 2,125,712 3,587,781Foreign-currency swap contracts 1,161,278 2,125,383Interest rate swap contracts 545,246 823,203Currency option contracts 283,706 927,605Forward exchange contracts 80,710 192,576Others 72,228 297,994
4,268,880 7,954,542
Total financial liabilities at fair value through profit or loss $ 4,319,121 $ 7,954,542
The Bank engages in derivative transactions mainly to tra
management strategy is to hedge most of its exposure to market risk.
115

Outstanding derivative contract (nominal) amounts were as follows:
December 312017 2016
Foreign-currency swap contracts $ 312,727,831 $ 320,907,855Interest rate swap contracts 121,214,106 132,957,199Currency option contracts 57,406,578 95,282,700Credit default swap contracts 18,028,192 23,884,949Forward exchange contracts 16,842,966 13,947,329Cross-currency swap contracts 8,413,280 8,008,710Convertible (exchangeable) bond option contracts 8,122,800 30,424,500Foreign convertible bond asset swap contracts 5,337,816 8,170,732Interest rate option contracts 4,492,400 5,613,950Domestic convertible (exchangeable) bond asset swap contracts 4,015,800 15,666,104Bond futures 1,116,080 -Non-deliverable forward contracts 356,566 1,647,967Commodity forward contracts - 189,823
9. SECURITIES PURCHASED UNDER RESALE AGREEMENTS
December 312017 2016
Government bonds $ 7,852,936 $ 5,658,812Negotiable certificates of deposit 2,719,046 300,067Commercial paper 499,411 437,777
$ 11,071,393 $ 6,396,656
Resale date 2018.01.02-2018.01.30
2017.01.03-2017.01.20
Resale price $ 11,074,058 $ 6,397,911
The total carrying amounts shown above have been included as cash and cash equivalents in consolidated statements of cash flows.
10. RECEIVABLES, NET
December 312017 2016
Credit card $ 15,045,932 $ 14,662,176Factoring 4,843,249 4,099,904Interest 917,409 763,127Spot exchange transactions 598,100 573,306Convertible bond redemption 569,629 727,793Acquired receivables 474,151 445,695Acceptances 421,416 318,477Lease receivables 350,625 92,581Entrustment loans 175,574 207,249Proceeds from disposal of securities 154,944 318,732
(Continued)116

December 312017 2016
Disbursement of derivative instrument settlement $ 20,229 $ 578,302Land development - 724,920Others 335,675 453,640
23,906,933 23,965,902Less: Allowance for possible losses (Note 11) 1,156,064 1,118,660
$ 22,750,869 $ 22,847,242(Concluded)
Land development receivables refer to contracts between the Far Eastern Asset Management Co., Ltd. (FEAMC), a Bank subsidiary, and others. Under these contracts, FEAMC had funded and obtained related land mortgages.
11. DISCOUNTS AND LOANS, NET
December 312017 2016
Negotiations, discounts and overdraft $ 100,576 $ 90,968Short-term loans 69,042,425 79,964,607Medium-term loans 124,489,833 124,444,055Long-term loans 161,806,758 156,199,322Nonaccrual loans 501,027 296,544
355,940,619 360,995,496Less: Allowance for possible losses 4,883,857 5,031,824
$ 351,056,762 $ 355,963,672
Movements of allowance for possible losses on discounts and loans and others (including receivables and other financial assets) were as follows:
Discountsand Loans Others Total
For the year ended December 31, 2017
Balance, January 1, 2017 $ 5,031,824 $ 1,118,674 $ 6,150,498Provision for possible losses 373,153 830,783 1,203,936Amounts written-off (466,510) (743,155) (1,209,665)Effects of exchange rate changes (54,610) (50,050) (104,660)
Balance, December 31, 2017 $ 4,883,857 $ 1,156,252 $ 6,040,109
For the year ended December 31, 2016
Balance, January 1, 2016 $ 4,532,791 $ 802,021 $ 5,334,812Provision for possible losses 797,071 511,490 1,308,561Amounts written-off (284,943) (190,894) (475,837)Effects of exchange rate changes (13,095) (3,943) (17,038)
Balance, December 31, 2016 $ 5,031,824 $ 1,118,674 $ 6,150,498
117

The details of the provision (reversal of provision) for possible losses were as follows:
For the Year Ended December 312017 2016
Provision for possible losses - discounts and loans $ 373,153 $ 797,071Provision for possible losses - others 830,783 511,490Provision (reversal of provision) for possible losses - reserve for
guarantee obligations 11,407 (8,396)Less: Amounts recovered - discounts and loans 257,773 601,852Less: Amounts recovered - others 225,723 246,312
$ 731,847 $ 452,001
For the years ended December 31, 2017 and 2016, the Bank and its subsidiaries had no written-off credits for which legal proceedings had not been initiated.
characteristics of financial assets. The results were as follows:
Discounts and loans
ItemDecember 31, 2017 December 31, 2016
Discounts and Loans
Allowance for Possible Losses
Discounts and Loans
Allowance for Possible Losses
With objective evidence of individual impairment
Assessed individually $ 1,603,535 $ 563,826 $ 1,602,953 $ 632,201Assessed by portfolio 1,937,024 441,292 2,000,020 424,435
Without objective evidence of individual impairment
Assessed individually 3,193,736 31,937 5,553,075 55,531Assessed by portfolio 349,206,324 3,846,802 351,839,448 3,919,657
Total $ 355,940,619 $ 4,883,857 $ 360,995,496 $ 5,031,824
Others (including receivables, other financial assets and debt investments with no active market)
ItemDecember 31, 2017 December 31, 2016
Others Allowance for Possible Losses Others Allowance for
Possible LossesWith objective evidence of
individual impairmentAssessed individually $ 657,574 $ 580,751 $ 1,152,835 $ 505,212Assessed by portfolio 1,465,738 493,309 1,626,539 529,476
Without objective evidence of individual impairment
Assessed individually 9,533,501 7,210 12,570,280 4,805Assessed by portfolio 18,842,391 74,982 17,688,134 79,181
Total $ 30,499,204 $ 1,156,252 $ 33,037,788 $ 1,118,674
12. AVAILABLE-FOR-SALE FINANCIAL ASSETS
December 312017 2016
Negotiable certificates of deposit issued by the central bank $ 62,523,204 $ 45,764,676Domestic government bonds 23,884,945 11,920,299Foreign bank debentures 21,006,259 20,523,215Foreign government bonds 1,458,459 936,545Stocks listed on TWSE and TPEx 709,311 449,971Beneficiary certificates 49,400 -
$ 109,631,578 $ 79,594,706
118

Some of the available-for-sale foreign bank debentures and foreign government bonds were traded with repurchase agreements, and the carrying amounts were as follows (please refer to Note 21 for the related information on repurchase agreements):
December 312017 2016
Foreign bank debentures $ 12,366,170 $ 13,437,411Foreign government bonds $ 1,162,801 $ 936,545
The assets pledged as collaterals are disclosed in Note 38.
13. HELD-TO-MATURITY FINANCIAL ASSETS
December 312017 2016
Foreign bank debentures $ 1,479,602 $ 1,924,971Foreign corporate bonds 655,644 705,664
$ 2,135,246 $ 2,630,635
14. INVESTMENT ACCOUNTED FOR USING EQUITY METHOD
December 312017 2016
Amount% of
Ownership Amount% of
Ownership
Dah Chung Bills Finance Corp. $ 1,646,555 22.06 $ 1,604,159 22.06Deutsche Far Eastern Asset Management
Co., Ltd. 127,511 40.00 98,061 40.00
$ 1,774,066 $ 1,702,220
Deutsche Far Eastern Asset Management Co., Ltd. reduced its capital to cover accumulated deficit and increased capital by cash in September 2017; the Bank participated in the capital increase and invested $28,980 thousand according to the proportion of shares held.
The above associates are individually immaterial to the Bank and its subsidiaries; the shares of the Bank
For the Year Ended December 312017 2016
Net income from continuing operation $ 103,337 $ 85,454Other comprehensive income 9,114 (12,623)
Total comprehensive income $ 112,451 $ 72,831
119

15. DEBT INVESTMENTS WITH NO ACTIVE MARKET
December 312017 2016
Foreign convertible bond asset swap contracts - master agreement $ 5,337,816 $ 8,170,732Convertible bonds 742,300 -Credit-linked notes - master agreement 596,960 -
$ 6,677,076 $ 8,170,732
16. OTHER FINANCIAL ASSETS, NET
December 312017 2016
Nonaccrual loans other than discounts and loans $ 261 $ 80Less: Allowance for possible losses (Note 11) 188 14
73 66Refundable deposits 2,312,331 3,359,981Deposits with original maturity more than 3 months 640,779 554,760Interbank clearing account 600,941 600,307Financial assets carried at cost 113,636 155,701
$ 3,667,760 $ 4,670,815
The assets pledged as collaterals are disclosed in Note 38.
Financial assets carried at cost consist of the following domestic unlisted common stocks:
December 312017 2016
Yuan Hsin Digital Payment Co., Ltd. $ 62,263 $ 54,322Financial Information Service Co., Ltd. 45,500 45,500An Feng Enterprise Co., Ltd. 3,000 3,000Sunshine Asset Management Co., Ltd. 2,073 2,073Taipei Forex Inc. 800 800ERA Communications Co., Ltd. - 50,006
$ 113,636 $ 155,701
The above equity investments, which had no quoted prices in active market or fair values that could be reliably measured, were measured at cost.
The Bank disposed of ERA Communications Co., Ltd. in July 2017; the disposal price was $51,496 thousand and the disposal gain was $1,490 thousand.
The Bank recognized an impairment loss of $17,009 thousand and $20,528 thousand in Yuan Hsin Digital Payment Co., Ltd. in September 2017 and August 2016, respectively, and increased investment it by $24,950 thousand in September 2017.
120
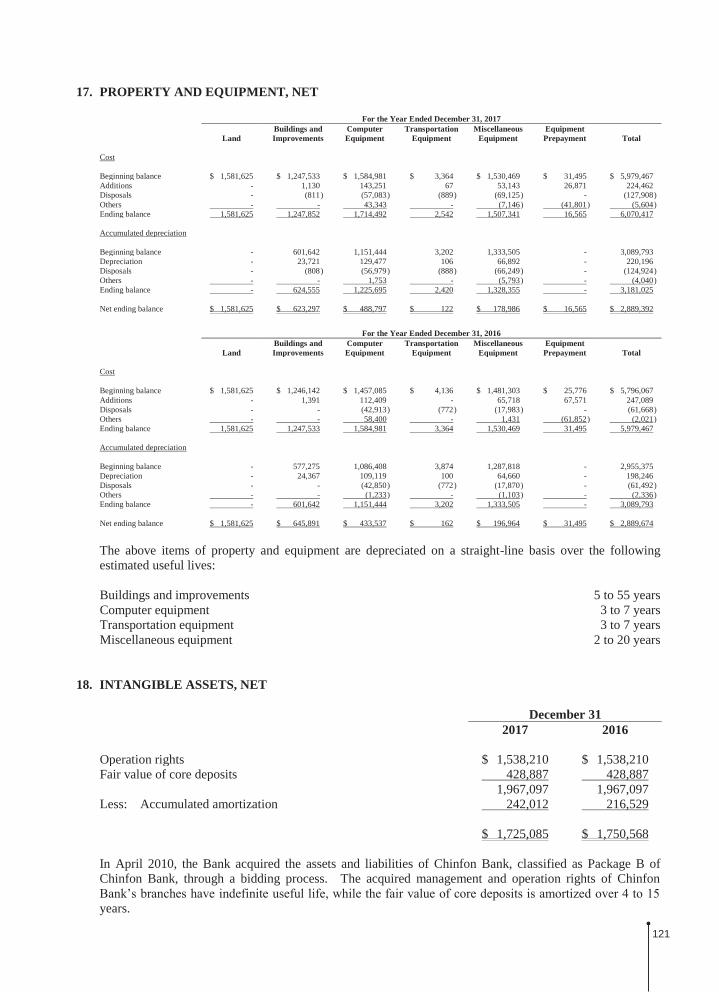
17. PROPERTY AND EQUIPMENT, NET
For the Year Ended December 31, 2017
Land Buildings and Improvements
Computer Equipment
Transportation Equipment
Miscellaneous Equipment
Equipment Prepayment Total
Cost
Beginning balance $ 1,581,625 $ 1,247,533 $ 1,584,981 $ 3,364 $ 1,530,469 $ 31,495 $ 5,979,467Additions - 1,130 143,251 67 53,143 26,871 224,462Disposals - (811) (57,083) (889) (69,125) - (127,908)Others - - 43,343 - (7,146) (41,801) (5,604)Ending balance 1,581,625 1,247,852 1,714,492 2,542 1,507,341 16,565 6,070,417
Accumulated depreciation
Beginning balance - 601,642 1,151,444 3,202 1,333,505 - 3,089,793Depreciation - 23,721 129,477 106 66,892 - 220,196Disposals - (808) (56,979) (888) (66,249) - (124,924)Others - - 1,753 - (5,793) - (4,040)Ending balance - 624,555 1,225,695 2,420 1,328,355 - 3,181,025
Net ending balance $ 1,581,625 $ 623,297 $ 488,797 $ 122 $ 178,986 $ 16,565 $ 2,889,392
For the Year Ended December 31, 2016
Land Buildings and Improvements
Computer Equipment
Transportation Equipment
Miscellaneous Equipment
Equipment Prepayment Total
Cost
Beginning balance $ 1,581,625 $ 1,246,142 $ 1,457,085 $ 4,136 $ 1,481,303 $ 25,776 $ 5,796,067Additions - 1,391 112,409 - 65,718 67,571 247,089Disposals - - (42,913) (772) (17,983) - (61,668)Others - - 58,400 - 1,431 (61,852) (2,021)Ending balance 1,581,625 1,247,533 1,584,981 3,364 1,530,469 31,495 5,979,467
Accumulated depreciation
Beginning balance - 577,275 1,086,408 3,874 1,287,818 - 2,955,375Depreciation - 24,367 109,119 100 64,660 - 198,246Disposals - - (42,850) (772) (17,870) - (61,492)Others - - (1,233) - (1,103) - (2,336)Ending balance - 601,642 1,151,444 3,202 1,333,505 - 3,089,793
Net ending balance $ 1,581,625 $ 645,891 $ 433,537 $ 162 $ 196,964 $ 31,495 $ 2,889,674
The above items of property and equipment are depreciated on a straight-line basis over the following estimated useful lives:
Buildings and improvements 5 to 55 yearsComputer equipment 3 to 7 yearsTransportation equipment 3 to 7 yearsMiscellaneous equipment 2 to 20 years
18. INTANGIBLE ASSETS, NET
December 312017 2016
Operation rights $ 1,538,210 $ 1,538,210Fair value of core deposits 428,887 428,887
1,967,097 1,967,097Less: Accumulated amortization 242,012 216,529
$ 1,725,085 $ 1,750,568
In April 2010, the Bank acquired the assets and liabilities of Chinfon Bank, classified as Package B of Chinfon Bank, through a bidding process. The acquired management and operation rights of Chinfon
years.
121

The Bank assessed the operation rights of branches have indefinite useful life, and the operation rights are expected to generate net cash flows continuously; therefore, the operation rights are not amortized annually.
t at the end of the annual reporting period and the recoverable amount is determined based on the value in use. To reflect risks specific to the operation
ncial forecast, and no impairment after tasted. For the years ended December 31, 2017 and 2016, the Bank did not recognize any impairment loss on its operation rights.
19. OTHER ASSETS
December 312017 2016
Prepaid expenses $ 167,698 $ 183,783Others 32,444 38,616
$ 200,142 $ 222,399
20. DUE TO THE CENTRAL BANK AND OTHER BANKS
December 312017 2016
Call loans to banks $ 6,601,520 $ 7,120,246Due to banks 231,834 273,147Overdraft 127,420 38,801
$ 6,960,774 $ 7,432,194
21. SECURITIES SOLD UNDER REPURCHASE AGREEMENTS
December 312017 2016
Foreign bank debentures (Note 12) $ 11,785,554 $ 12,778,986Foreign government bonds (Note 12) 1,135,810 932,237
$ 12,921,364 $ 13,711,223
Repurchase date 2018.01.08-2018.01.29
2017.01.06-2017.02.13
Repurchase price $ 12,943,304 $ 13,740,566
122

22. PAYABLES
December 312017 2016
Notes and checks for clearing $ 2,018,305 $ 983,840Accrued expenses 1,265,570 1,288,096Accrued interest 964,691 689,244Accounts payable factoring 898,253 1,584,075Liabilities on bank acceptances 421,416 318,477Securities settlement payables 267,124 161,044Others 652,926 775,098
$ 6,488,285 $ 5,799,874
23. DEPOSITS AND REMITTANCES
December 312017 2016
Checking deposits $ 2,913,365 $ 2,565,514Demand deposits 71,810,392 60,996,741Demand savings 63,329,655 62,602,212Time savings 80,875,765 84,813,962Negotiable certificates of deposit 6,387,500 16,898,500Time deposits 246,743,099 224,821,525Remittances 332,407 22,006
$ 472,392,183 $ 452,720,460
24. BANK DEBENTURES
December 312017 2016
Domestic bank debentures $ 18,601,900 $ 22,601,900Euro Convertible Bonds 1,614,764 1,707,457
$ 20,216,664 $ 24,309,357
Domestic Bank Debentures
Issuance December 31Item Period Note 2017 2016
Subordinated bank debentures - seven-year maturity; first issue in 2010
2010.05.18-2017.05.18
Interest payable on May 18 each year; fixed interest rate at 2.98%
$ - $ 2,000,000
Subordinated bank debentures - seven-year maturity; second issue in 2010
2010.09.29-2017.09.29
Interest payable on September 29 each year; fixed interest rate at 2.10%
- 2,000,000
Subordinated bank debentures - seven-year maturity; first issue in 2011
2011.11.10-2018.11.10
Interest payable on November 10 each year; fixed interest rate at 1.95%
3,500,000 3,500,000
Subordinated bank debentures - seven-year maturity; first issue in 2012
2012.06.27-2019.06.27
Interest payable on June 27 each year; fixed interest rate at 1.75%
3,000,000 3,000,000
(Continued)
123

Issuance December 31Item Period Note 2017 2016
Subordinated bank debentures - seven-year maturity; first issue in 2013
2013.11.06-2020.11.06
Interest payable on November 6 each year fixed interest rate at 2.10%
$ 4,000,000 $ 4,000,000
Subordinated bank debentures - seven-year maturity; first issue in 2014
2014.12.23-2021.12.23
Interest payable on December 23 each year fixed interest rate at 2.05%
1,100,000 1,100,000
Subordinated bank debentures - seven-year maturity; first issue in 2015
2015.09.30-2022.09.30
Interest payable on September 30 each year fixed interest rate at 1.95%
3,000,000 3,000,000
Subordinated bank debentures - seven-year maturity; first issue in 2016
2016.09.27-2023.09.27
Interest payable on September 27 each year fixed interest rate at 1.55%
4,000,000 4,000,000
Subordinated bank debentures - seven-year maturity; 1-1 issue in 2005; acquired from Chinfon Bank
Matured on2012.06.28
- 1,660 1,660
Subordinated bank debentures - seven-year maturity; 1-1 issue in 2002; acquired from Chinfon Bank
Matured on 2009.06.28
- 240 240
Total bank debentures $ 18,601,900 $ 22,601,900(Concluded)
Euro Convertible Bonds
-year unsecured zero coupon convertible 000 thousand; these bonds were listed on the
Singapore Exchange Securities Trading Limited. The minimum lot size for the Bonds trading is US$200 thousand. On the Issuance Date, the liability component of the Bonds amounted to $4,009,661 thousand net of a discount of $471,589 thousand but including transaction costs of $38,252 thousand. The initial effective interest rate of the liability component was 2.63%. The derivative components of the Bonds (i.e. conversion right and redemption option) amounted to $433,337 thousand. Other terms and conditions of the Bonds are described below:
a. Redemption at maturity
Unless the Bonds have been previously redeemed, converted or repurchased and canceled, the Bankshall redeem the Bonds at 101.89% of their principal amount in U.S. dollars on February 7, 2018 (the
b. Redemption at the option of the Bank
1) After 30 months following issuance of the Bond, the Bank may redeem the Bonds in whole orpiecemeal at the early redemption amount representing the principal of the Bonds with a gross yield
translated into U.S. dollars at the prevailing rates, within 20 out of 30 consecutive trading days,exceed 130% of the quotient of the early redemption amount divided by the number of ordinaryshares to be issued upon conversion of the Bonds on the applicable trading day based on theconversion price then in effect, translated into U.S. dollars at the fixed exchange rate. The earlyredemption amount for the Bonds is so calculated to provide the bondholders a gross yield of0.375% semi-annually.
2) The Bank may redeem all, but not a portion of, the Bonds at the early redemption amount if morethan 90% of the Bonds has already been redeemed, converted or repurchased and canceled.
3) The Bank is obliged to pay additional amounts as a result of any change relating to taxation in therelevant jurisdiction or any change in the general application or official interpretation of tax laws orregulations, and this obligation cannot be avoided by the Bank even by taking reasonable measures.
124

c. Details of conversion
1)
2) Conversion period: Unless the Bonds have been previously redeemed, converted or repurchased
bondholder during the period from the 41st calendar day after the Bond issuance the 10th calendarday prior to the Maturity Date. However, the conversion right shall not be exercised during thefollowing periods:
a) 60- -day period prior-day period prior to the distribution record
date of earnings or other bonus;
b) The period from 15 business days prior to the book closure dates for distributing stock dividend,cash dividend, or subscribing new shares to the ex-dividend or ex-right dates, or the period fromthe record date for capital reduction to one day prior to the resumption of trading of the reissuedshares following the capital reduction; and
c) Any other period as determined by ROC laws.
3) Adjustments to conversion price: On any stock dilution or events stated in the OfferingMemorandum that occur after the Issue Date, the conversion price shall be adjusted in accordancewith the formula stated in the Offering Memorandum.
4) Conversion price: The original conversion price was NT$15.24 per share (at the fixed exchangerate of NT$29.569 to US$1.00). The conversion price was further adjusted to NT$10.57 per shareas of December 31, 2017 because of the issuance of dividends and new shares for an overseasoffering of Global Depository Receipts.
5) Redemption at the option of the bondholders:
a) Unless the Bonds have been early redeemed, converted or repurchased, each bondholder has aput right to require the Bank to redeem the Bonds in whole or in part at early redemption priceafter 30 months from issue date.
b)bondholder shall have the right to require the Bank to redeem the Bonds in whole or in part.
c) If the Bank has a change of control, each bondholder shall have the right to require the Bank toredeem the Bonds in whole or in part.
25. OTHER FINANCIAL LIABILITIES
December 312017 2016
Principal of structured notes $ 6,482,513 $ 4,938,656Bank loan - December 31, 2017: 1.20% - 6.50%;
December 31, 2016: 1.20% - 4.57% 561,067 989,976Deposit received 373,195 326,773Commercial paper - 129,964
$ 7,416,775 $ 6,385,369
125

The status of commercial paper was as follows: (2017: Nil)
December 31, 2016
International Bills Finance Corp. $ 50,000Shin Kong Commercial Bank 40,000Mega Bills Finance Corp. 40,000Less: Unamortized discount on commercial paper 36
$ 129,964
Interest rates 1.188% -1.208%
26. PROVISIONS
December 312017 2016
Reserve for employee benefits liability - defined benefit plans (Note 27) $ 940,747 $ 1,064,831
Reserve for obligations guarantee 186,369 175,447
$ 1,127,116 $ 1,240,278
27. RETIREMENT BENEFIT PLANS
a. Defined contribution plans
employees subjected to LPA, the Bank makes contributions to their individual pension accounts in theDepartment of Labor at 6% of their monthly salaries and wages.
b. Defined benefit plans
The Bank adopted the defined benefit plan under the Labor Standards Law, under which pensionbenefits are calculated on the basis of the length of service and average monthly salaries of the sixmonths before retirement. The Bank contributes amounts equal to 2% of total monthly salaries andwages to a pension fund administered by the pension fund monitoring committee. Pensioncontryear, the Bank assesses the pension fund balance. If the balance is inadequate to pay retirementbenefits for employees who conform to retirement requirements in the next year, the Bank is required tofund the difference in one appropriation before the end of March of the next year. The pension fund is
right to influence the investment policy and strategy.
126

The amounts of employee benefits included in the consolidated balance sheets were as follows:
December 312017 2016
Present value of defined benefit obligation $ 1,259,285 $ 1,381,862Fair value of plan assets (318,538) (317,031)
Reserve for employee benefits liability $ 940,747 $ 1,064,831
Movements in defined benefit plan were as follows:
Present Value of the Defined
Benefit Obligation
Fair Value of the Plan Assets
Employee Benefit
Balance at January 1, 2017 $ 1,381,862 $ (317,031) $ 1,064,831Service cost
Current service cost 12,016 - 12,016Net interest expense (revenue) 16,651 (4,002) 12,649
Recognized in profit or loss 28,667 (4,002) 24,665Remeasurement
Return on plan assets (excluding amounts included in net interest) - 936 936
Actuarial loss - experience adjustments 17,769 - 17,769Actuarial loss - changes in demographic
assumptions (74,533) - (74,533)Recognized in other comprehensive income (56,764) 936 (55,828)
Contributions from the employer - (18,013) (18,013)Contributions from merged FELIA and
FEPIA - (3,120) (3,120)Contributions from plan assets (22,692) 22,692 -Contributions from provisions (71,788) - (71,788)
Balance at December 31, 2017 $ 1,259,285 $ (318,538) $ 940,747
Balance at January 1, 2016 $ 1,258,805 $ (315,522) $ 943,283Service cost
Current service cost 11,423 - 11,423Net interest expense (revenue) 21,513 (4,854) 16,659
Recognized in profit or loss 32,936 (4,854) 28,082Remeasurement
Return on plan assets (excluding amounts included in net interest) - 2,667 2,667
Actuarial loss - experience adjustments 55,085 - 55,085Actuarial loss - changes in demographic
assumptions 80,000 - 80,000Recognized in other comprehensive income 135,085 2,667 137,752Contributions from the employer - (18,533) (18,533)Contributions from plan assets (19,211) 19,211 -Contributions from provisions (25,753) - (25,753)
Balance at December 31, 2016 $ 1,381,862 $ (317,031) $ 1,064,831
127

The calculation of the present value of the defined benefit obligation was carried out by qualified actuaries. The principal assumptions used in the actuarial valuations were as follows:
December 312017 2016
Discount rates 1.75% 1.25%Expected rates of salary increase 3.00% 3.00%
Had there been a possible reasonable change in each of the significant actuarial assumptions and all other assumptions remained constant, the present value of the defined benefit obligation would have increased (decreased) as follows:
December 31, 2017 2016
Discount rates0.50% increase $ (68,810) $ (80,000)0.50% decrease $ 74,533 $ 86,973
Expected rates of salary increase0.50% increase $ 73,251 $ 85,0340.50% decrease $ (68,348) $ (79,088)
The sensitivity analysis presented above might not have been representative of the actual change in the present value of the defined benefit obligation because it was unlikely that the change in assumptions occurred in isolation of one another, i.e., some of the assumptions might have been correlated.
The expected contribution to the plan for the next year is $18,746 thousand, and the average duration of the defined benefit obligation is 11.5 years.
The Bank is exposed to the following risks on its defined benefit plan managed by the Bureau:
1) Risk on investment: The investment income of benefit plan assets affects the plan fair value andcontribution status. That is, a higher investment income increases the fair value of plan assets anddecreases net defined benefits liabilities (or increases net assets) and thus improves contributionstatus. In contrast, a lower investment income or investment loss is unfavorable to the contributionstatus of benefit the plan.
2) Risk on interest fluctuations: The discount rate used in calculating the present value of definedbenefit obligations is determined by the mainly pertains to the yields of the ROC government. Adecrease in discount rate will increase the present value of defined benefit obligations.
3) Risk on salary fluctuations: As the defined benefit obligation was determined by the salaries ofplan members before their retirement, the expected increase in salary should then be considered inthe calculation. Thus, an increase in the expected rate for salary increase will result in a rise in thepresent values of defined benefit obligations.
128
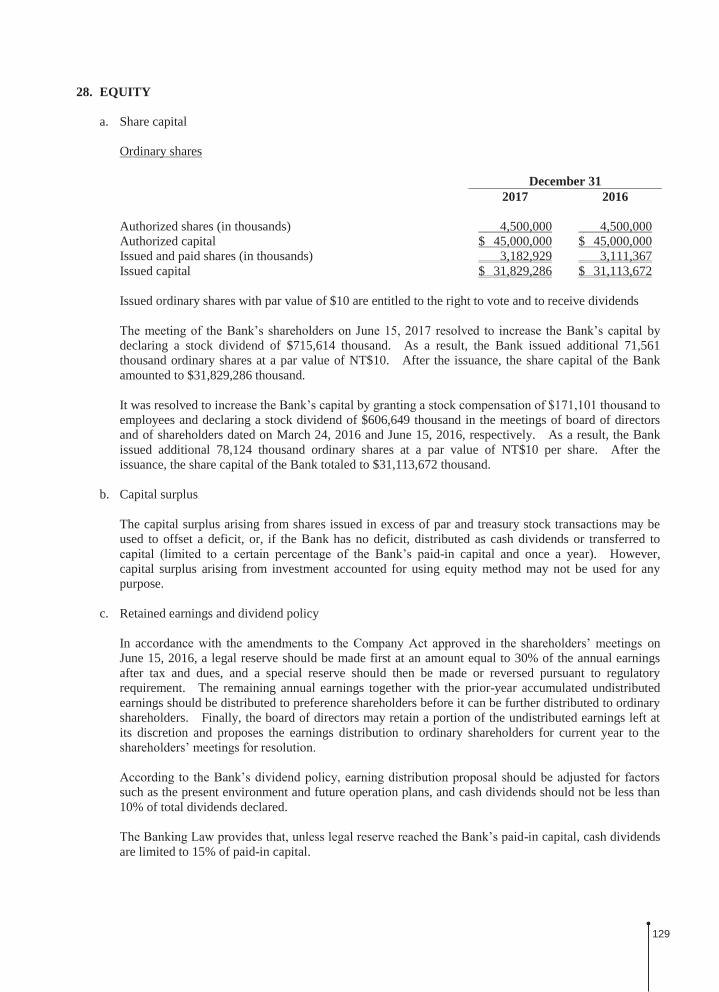
28. EQUITY
a. Share capital
Ordinary shares
December 312017 2016
Authorized shares (in thousands) 4,500,000 4,500,000Authorized capital $ 45,000,000 $ 45,000,000Issued and paid shares (in thousands) 3,182,929 3,111,367Issued capital $ 31,829,286 $ 31,113,672
Issued ordinary shares with par value of $10 are entitled to the right to vote and to receive dividends
by declaring a stock dividend of $715,614 thousand. As a result, the Bank issued additional 71,561 thousand ordinary shares at a par value of NT$10. After the issuance, the share capital of the Bank amounted to $31,829,286 thousand.
It was resolved to iemployees and declaring a stock dividend of $606,649 thousand in the meetings of board of directors and of shareholders dated on March 24, 2016 and June 15, 2016, respectively. As a result, the Bank issued additional 78,124 thousand ordinary shares at a par value of NT$10 per share. After the issuance, the share capital of the Bank totaled to $31,113,672 thousand.
b. Capital surplus
The capital surplus arising from shares issued in excess of par and treasury stock transactions may beused to offset a deficit, or, if the Bank has no deficit, distributed as cash dividends or transferred to
-in capital and once a year). However,capital surplus arising from investment accounted for using equity method may not be used for anypurpose.
c. Retained earnings and dividend policy
In acc onJune 15, 2016, a legal reserve should be made first at an amount equal to 30% of the annual earningsafter tax and dues, and a special reserve should then be made or reversed pursuant to regulatoryrequirement. The remaining annual earnings together with the prior-year accumulated undistributedearnings should be distributed to preference shareholders before it can be further distributed to ordinaryshareholders. Finally, the board of directors may retain a portion of the undistributed earnings left atits discretion and proposes the earnings distribution to ordinary shareholders for current year to the
such as the present environment and future operation plans, and cash dividends should not be less than10% of total dividends declared.
-in capital, cash dividendsare limited to 15% of paid-in capital.
129

-in capital. This reserve may be used to offset a deficit. According to an amendment to the Company Law, when the Bank has no deficit and its legal reserve has exceeded 25% of its paid-in capital, the excess may be distributed in the form of stocks or cash.
differences on translating foreign operations, unrealized gain (loss) on available-for-sale financial assets, and gain or loss on hedging instrument relating to effective portion of cash flow hedge) shall be transferred from unappropriated earnings to a special reserve before any appropriation of earnings. Any special reserve appropriated may be reversed to the extent of the decrease in the net debit balance.
According to Rule No. 10510001510 issued by the FSC on May 25, 2016, a special reserve accounted rnings should be made when making the appropriations of
earnings for the years from 2016 to 2018 to cope with the staff transformation due to financial technology development. The Bank may reverse the special reserve at the same amount with the actual spending on transitioning or settling its employees since 2017.
meetings on June 15, 2017 and June 15, 2016, respectively, were as follows:
Appropriation of EarningsDividends Per Share
(Dollars)2016 2015 2016 2015
Legal reserve $ 973,166 $ 1,080,304Appropriate (reversal) of special
reserve 129,675 (87,191)Cash dividends 1,306,774 1,213,297 $ 0.420 $ 0.400Stock dividends 715,614 606,649 0.230 0.200
$ 3,125,229 $ 2,813,059
If dividends distributed to foreign shareholders are from the earnings subject to an additional 10% income tax, the tax can be used by the foreign shareholders to reduce the final withholding tax on their dividends income.
21, 2018. The appropriations and dividends per share were as follows:
Appropriation of Earnings
Dividends Per Share (NT$)
Legal reserve $ 856,165Reversal of special reserve (214,292)Cash dividends 1,397,306 $0.439Stock dividends 892,573 0.271
$ 2,931,752
The appropriations of earnheld on June 20, 2018.
130
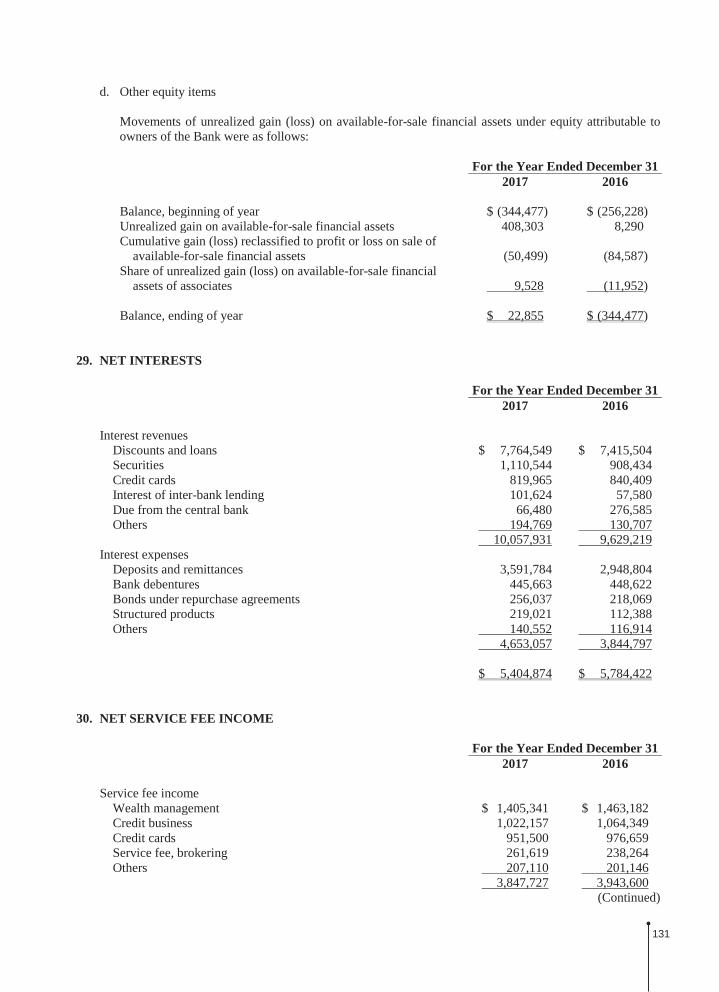
d. Other equity items
Movements of unrealized gain (loss) on available-for-sale financial assets under equity attributable toowners of the Bank were as follows:
For the Year Ended December 312017 2016
Balance, beginning of year $ (344,477) $ (256,228)Unrealized gain on available-for-sale financial assets 408,303 8,290Cumulative gain (loss) reclassified to profit or loss on sale of
available-for-sale financial assets (50,499) (84,587)Share of unrealized gain (loss) on available-for-sale financial
assets of associates 9,528 (11,952)
Balance, ending of year $ 22,855 $ (344,477)
29. NET INTERESTS
For the Year Ended December 312017 2016
Interest revenuesDiscounts and loans $ 7,764,549 $ 7,415,504Securities 1,110,544 908,434Credit cards 819,965 840,409Interest of inter-bank lending 101,624 57,580Due from the central bank 66,480 276,585Others 194,769 130,707
10,057,931 9,629,219Interest expenses
Deposits and remittances 3,591,784 2,948,804Bank debentures 445,663 448,622Bonds under repurchase agreements 256,037 218,069Structured products 219,021 112,388Others 140,552 116,914
4,653,057 3,844,797
$ 5,404,874 $ 5,784,422
30. NET SERVICE FEE INCOME
For the Year Ended December 312017 2016
Service fee incomeWealth management $ 1,405,341 $ 1,463,182Credit business 1,022,157 1,064,349Credit cards 951,500 976,659Service fee, brokering 261,619 238,264Others 207,110 201,146
3,847,727 3,943,600(Continued)
131

For the Year Ended December 312017 2016
Service fee expenseBenefit and chargeback fee $ 173,542 185,269Visa and Master 152,078 165,400Agency service fee 73,154 82,613National credit card center fee 65,927 69,655Credit investigation 45,994 43,154Interbank service fee 42,091 39,666Others 142,614 161,226
695,400 746,983
$ 3,152,327 $ 3,196,617(Concluded)
31. NET GAINS ON FINANCIAL ASSETS AND LIABILITIES AT FAIR VALUE THROUGHPROFIT OR LOSS
For the Year Ended December 312017 2016
Realized gains $ 1,433,686 $ 618,798Valuation gains 160,180 566,152Net interests 127,548 52,320Dividends 10,803 10,574
$ 1,732,217 $ 1,247,844
fair value through profit or loss and the derivative instruments that were collectively managed.
32. EMPLOYEE BENEFITS EXPENSE
For the Year Ended December 312017 2016
Salaries and bonus $ 2,895,618 $ 2,902,591Employee insurance 236,749 228,686
directors 169,400 186,201Post-employment benefits (Note 27) 143,343 147,557Human resource service fee 123,032 109,782Others 222,737 218,284
$ 3,790,879 $ 3,793,101
As of December 31, 2017 and 2016, the Bank and its subsidiaries had 2,754 and 2,776 employees, respectively. The number of employees is calculated on the same basis as employee benefits expense.
132

Pursuant to the Company Act amended in May 2015 and the amended Articles of Incorporation of the Bank
rates of 3.5 % - 4.5% and remuneration of directors at no higher than 1.5%, of net profit before income tax and such compensation, and remuneration.
tors
thousand for the year ended December 31, 2016, both in cash.
If there is a change in the amounts after the financial statements for the year ended December 31, 2017 were authorized for issue, the differences are recorded as a change in the accounting estimate.
directors paid and the amounts recognized in the financial statements for the year ended December 31, 2016.
of Directors in 2018 and 2017 is available at the Market Observation Post System website of the Taiwan Stock Exchange.
33. DEPRECIATION AND AMORTIZATION
For the Year Ended December 312017 2016
Depreciation (Note 17) $ 220,196 $ 198,246Amortization $ 27,946 $ 28,202
34. OTHER GENERAL AND ADMINISTRATIVE EXPENSES
For the Year Ended December 312017 2016
Tax and government fees $ 578,778 592,241Rental 440,427 442,110Marketing and advertising 426,812 $ 431,807Software 184,352 193,093Telecommunications 164,686 180,089Others 586,689 620,663
$ 2,381,744 $ 2,460,003
133
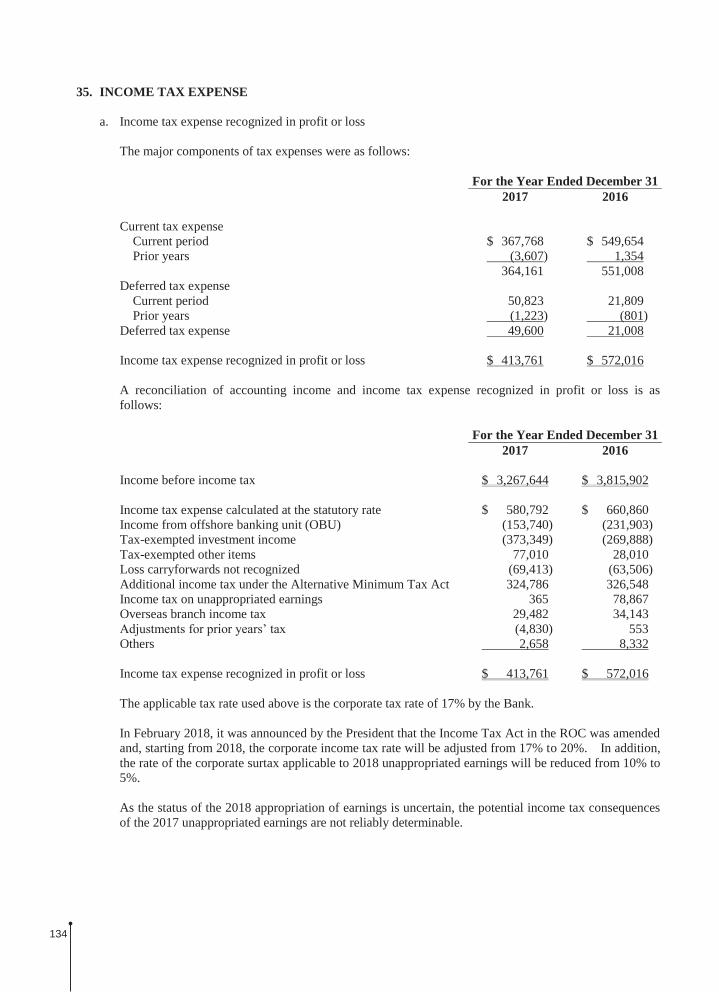
35. INCOME TAX EXPENSE
a. Income tax expense recognized in profit or loss
The major components of tax expenses were as follows:
For the Year Ended December 312017 2016
Current tax expenseCurrent period $ 367,768 $ 549,654Prior years (3,607) 1,354
364,161 551,008Deferred tax expense
Current period 50,823 21,809Prior years (1,223) (801)
Deferred tax expense 49,600 21,008
Income tax expense recognized in profit or loss $ 413,761 $ 572,016
A reconciliation of accounting income and income tax expense recognized in profit or loss is as follows:
For the Year Ended December 312017 2016
Income before income tax $ 3,267,644 $ 3,815,902
Income tax expense calculated at the statutory rate $ 580,792 $ 660,860Income from offshore banking unit (OBU) (153,740) (231,903)Tax-exempted investment income (373,349) (269,888)Tax-exempted other items 77,010 28,010Loss carryforwards not recognized (69,413) (63,506)Additional income tax under the Alternative Minimum Tax Act 324,786 326,548Income tax on unappropriated earnings 365 78,867Overseas branch income tax 29,482 34,143
(4,830) 553Others 2,658 8,332
Income tax expense recognized in profit or loss $ 413,761 $ 572,016
The applicable tax rate used above is the corporate tax rate of 17% by the Bank.
In February 2018, it was announced by the President that the Income Tax Act in the ROC was amended and, starting from 2018, the corporate income tax rate will be adjusted from 17% to 20%. In addition, the rate of the corporate surtax applicable to 2018 unappropriated earnings will be reduced from 10% to 5%.
As the status of the 2018 appropriation of earnings is uncertain, the potential income tax consequences of the 2017 unappropriated earnings are not reliably determinable.
134
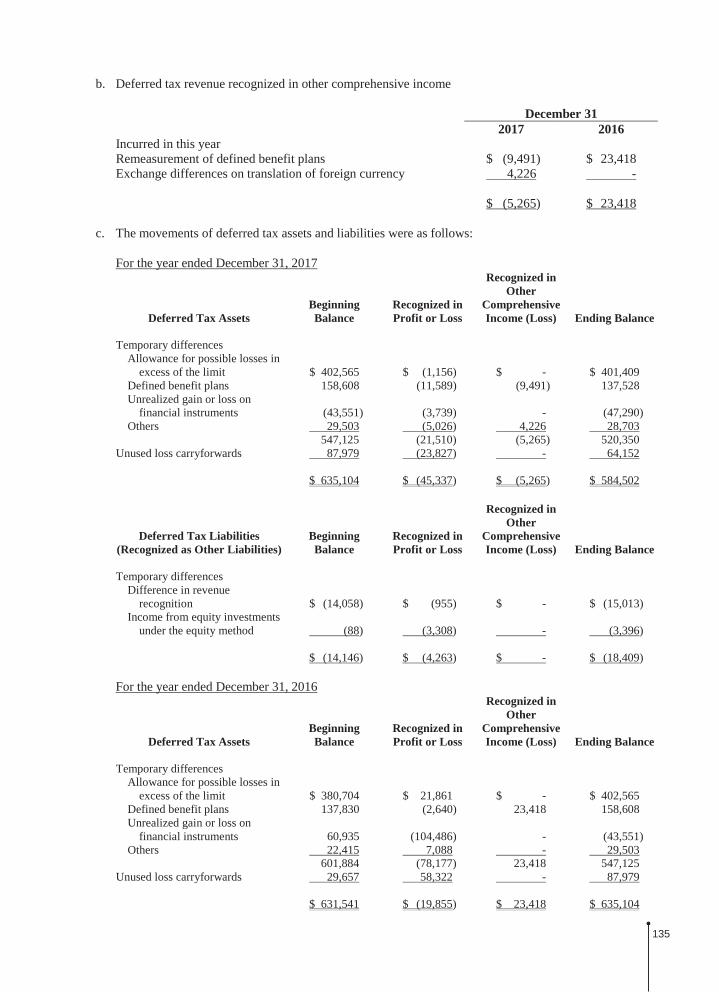
b. Deferred tax revenue recognized in other comprehensive income
December 312017 2016
Incurred in this yearRemeasurement of defined benefit plans $ (9,491) $ 23,418Exchange differences on translation of foreign currency 4,226 -
$ (5,265) $ 23,418
c. The movements of deferred tax assets and liabilities were as follows:
For the year ended December 31, 2017
Deferred Tax AssetsBeginning Balance
Recognized in Profit or Loss
Recognized in Other
Comprehensive Income (Loss) Ending Balance
Temporary differencesAllowance for possible losses in
excess of the limit $ 402,565 $ (1,156) $ - $ 401,409Defined benefit plans 158,608 (11,589) (9,491) 137,528Unrealized gain or loss on
financial instruments (43,551) (3,739) - (47,290)Others 29,503 (5,026) 4,226 28,703
547,125 (21,510) (5,265) 520,350Unused loss carryforwards 87,979 (23,827) - 64,152
$ 635,104 $ (45,337) $ (5,265) $ 584,502
Deferred Tax Liabilities (Recognized as Other Liabilities)
Beginning Balance
Recognized in Profit or Loss
Recognized in Other
Comprehensive Income (Loss) Ending Balance
Temporary differencesDifference in revenue
recognition $ (14,058) $ (955) $ - $ (15,013)Income from equity investments
under the equity method (88) (3,308) - (3,396)
$ (14,146) $ (4,263) $ - $ (18,409)
For the year ended December 31, 2016
Deferred Tax AssetsBeginning Balance
Recognized in Profit or Loss
Recognized in Other
Comprehensive Income (Loss) Ending Balance
Temporary differencesAllowance for possible losses in
excess of the limit $ 380,704 $ 21,861 $ - $ 402,565Defined benefit plans 137,830 (2,640) 23,418 158,608Unrealized gain or loss on
financial instruments 60,935 (104,486) - (43,551)Others 22,415 7,088 - 29,503
601,884 (78,177) 23,418 547,125Unused loss carryforwards 29,657 58,322 - 87,979
$ 631,541 $ (19,855) $ 23,418 $ 635,104
135

Deferred Tax Liabilities (Recognized as Other Liabilities)
Beginning Balance
Recognized in Profit or Loss
Recognized in Other
Comprehensive Income (Loss) Ending Balance
Temporary differencesDifference in revenue
recognition $ (12,993) $ (1,065) $ - $ (14,058)Income from equity investments
under the equity method - (88) - (88)
$ (12,993) $ (1,153) $ - $ (14,146)
d. Items not recognized as deferred tax assets
December 312017 2016
Loss carryforwards
The BankExpire in 2017 $ - $ 1,358,998Expire in 2018 2,178,838 1,863,678
$ 2,178,838 $ 3,222,676
FEIS Expire in 2018 $ - $ 30,374Expire in 2019 - 108,343Expire in 2020 - 53,563Expire in 2021 4,937 38,085Expire in 2022 22,380 22,380Expire in 2023 10,626 10,626Expire in 2024 1,920 1,920
$ 39,863 $ 265,291
e. Information about unused loss carryforwards
As of December 31, 2017, loss carryforwards comprised:
Expiry Year Unused Amount
The Bank
2018 $ 2,243,822 (assessed)2021 133,968 (assessed)
$ 2,377,790(Continued)
136

Expiry Year Unused Amount
FEIS
2019 $ 91,701 (assessed)2020 53,563 (assessed)2021 38,085 (assessed)2022 22,380 (assessed)2023 10,626 (assessed)2024 1,920 (assessed)
$ 218,275(Concluded)
f. Integrated income tax
December 312017 2016
Imputation credits account Note $ 171,881
For the Year Ended December 302017 2016 (Actual)
Creditable ratio for distribution of earnings Note 17.94%
Note: Since the amended Income Tax Act announced in February 2018 abolished the imputation tax system, related information for 2017 is not applicable.
g. Income tax assessments
The income tax returns of the Bank through 2014 had been assessed by the tax authorities. FELIA,FEPIA and FEIS through 2015 had been assessed by the tax authorities. FEAMC through 2016 hadbeen assessed by the tax authorities.
36. EARNINGS PER SHARE
eholders:
Unit: NT$ Per Share
For the Year Ended December 312017 2016
Basic EPS $ 0.90 $ 1.02Diluted EPS $ 0.86 $ 0.98
137

The net income and weighted average number of ordinary shares outstanding for EPS calculation were as follows:
Net Income for the Year
For the Year Ended December 312017 2016
Net income attributable to owners of the Bank $ 2,853,883 $ 3,243,886Effect of dilutive potential ordinary shares
Euro Convertible Bonds 44,029 27,775
Net income used in the computation of diluted EPS $ 2,897,912 $ 3,271,661
Number of Ordinary Shares (In Thousand Shares)
For the Year Ended December 312017 2016
Weighted average number of ordinary shares in the computation of basic EPS 3,182,929 3,178,878
Effect of dilutive potential ordinary sharesEuro Convertible Bonds 151,621 141,952
16,289 18,630
Weighted average number of ordinary shares used in the computation of diluted EPS 3,350,839 3,339,460
The weighted average number of ordinary shares outstanding for 2016 EPS calculation was retroactively adjusted to the issuance of stock dividends. The basic and diluted after-tax EPS were adjusted retrospectively as follows:
Before Adjustment
After Adjustment
Basic EPS $ 1.04 $ 1.02Diluted EPS $ 1.00 $ 0.98
-average number of shares outstanding used for calculating diluted EPS. The dilutive effect of the potential shares should be included in the calculation of diluted EPS until the conference resolves the number of shares to
he following year.
138
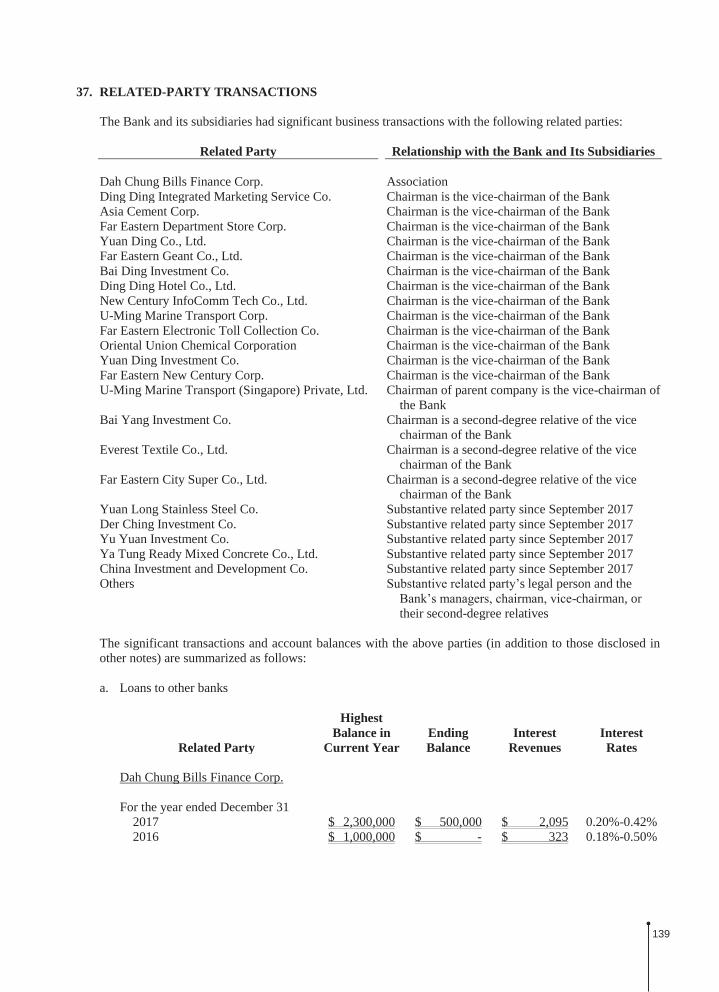
37. RELATED-PARTY TRANSACTIONS
The Bank and its subsidiaries had significant business transactions with the following related parties:
Related Party Relationship with the Bank and Its Subsidiaries
Dah Chung Bills Finance Corp. AssociationDing Ding Integrated Marketing Service Co. Chairman is the vice-chairman of the BankAsia Cement Corp. Chairman is the vice-chairman of the BankFar Eastern Department Store Corp. Chairman is the vice-chairman of the BankYuan Ding Co., Ltd. Chairman is the vice-chairman of the BankFar Eastern Geant Co., Ltd. Chairman is the vice-chairman of the BankBai Ding Investment Co. Chairman is the vice-chairman of the BankDing Ding Hotel Co., Ltd. Chairman is the vice-chairman of the BankNew Century InfoComm Tech Co., Ltd. Chairman is the vice-chairman of the BankU-Ming Marine Transport Corp. Chairman is the vice-chairman of the BankFar Eastern Electronic Toll Collection Co. Chairman is the vice-chairman of the BankOriental Union Chemical Corporation Chairman is the vice-chairman of the BankYuan Ding Investment Co. Chairman is the vice-chairman of the BankFar Eastern New Century Corp. Chairman is the vice-chairman of the BankU-Ming Marine Transport (Singapore) Private, Ltd. Chairman of parent company is the vice-chairman of
the BankBai Yang Investment Co. Chairman is a second-degree relative of the vice
chairman of the BankEverest Textile Co., Ltd. Chairman is a second-degree relative of the vice
chairman of the BankFar Eastern City Super Co., Ltd. Chairman is a second-degree relative of the vice
chairman of the BankYuan Long Stainless Steel Co. Substantive related party since September 2017Der Ching Investment Co. Substantive related party since September 2017Yu Yuan Investment Co. Substantive related party since September 2017Ya Tung Ready Mixed Concrete Co., Ltd. Substantive related party since September 2017China Investment and Development Co. Substantive related party since September 2017Others s legal person and the
-chairman, or their second-degree relatives
The significant transactions and account balances with the above parties (in addition to those disclosed in other notes) are summarized as follows:
a. Loans to other banks
Related Party
Highest Balance in
Current YearEnding Balance
Interest Revenues
Interest Rates
Dah Chung Bills Finance Corp.
For the year ended December 312017 $ 2,300,000 $ 500,000 $ 2,095 0.20%-0.42%2016 $ 1,000,000 $ - $ 323 0.18%-0.50%
139

b. Loans
Number of Accounts and Highest Balance
in Current Ending Nonperforming
Transactions Terms
Different from Those
for Unrelated
Category Related Party Year Balance Normal Loans Loans Collateral Parties
For the year endedDecember 31, 2017
Consumer loans Three individuals $ 1,885 $ 1,645 $ 1,645 $ - Unsecured loan NoteLoans for residential
mortgageTwenty one individuals 207,796 193,154 193,154 - Real estate Note
Others Yuan Long Stainless Steel Co. 1,740,000 1,520,000 1,520,000 - Real estate NoteAsia Cement Corp. 600,000 600,000 600,000 - Stock listed on TWSE NoteChina Investment and
Development Co., Ltd.75,000 75,000 75,000 - Stock listed on TWSE Note
U-Ming Marine Transport Corp. 525,000 - - - Ship and certificates of deposit
Note
Far Eastern Department Stores Co., Ltd
500,000 - - - Stock listed on TWSE Note
Bai Ding Investment Co. 450,000 - - - Unquoted stock NoteFar Eastern New Century Corp. 400,000 - - - Machinery NoteFar Eastern Geant Co., Ltd. 400,000 - - - Real estate NoteYuan Ding Investment Co. 200,000 - - - Unquoted stock NoteEverest Textile Co., Ltd. 200,000 - - - Real estate NoteDer Ching Investment Co. 150,000 - - - Stock listed on TWSE NoteYu Yuan Investment Co. 100,000 - - - Stock listed on TWSE NoteYa Tung Ready Mixed Concrete
Co., Ltd50,000 - - - Real estate Note
$ 2,389,799 $ 2,389,799 $ -
For the year endedDecember 31, 2016
Consumer loans Four individuals 1,249 $ 1,111 $ 1,111 $ - Unsecured loan NoteLoans for residential
mortgageTwenty individuals 186,384 181,607 181,607 - Real estate Note
Others Asia Cement Corp. 650,000 500,000 500,000 - Stock listed on TWSE NoteFar Eastern New Century Corp. 400,000 400,000 400,000 - Machinery NoteFar Eastern Geant Co., Ltd. 400,000 200,000 200,000 - Real estate NoteYuan Ding Investment Co. 200,000 200,000 200,000 - Unquoted stock NoteBai Ding Investment Co. 353,000 132,000 132,000 - Unquoted stock NoteU-Ming Marine Transport Corp. 700,000 - - - Ship and certificates of
depositNote
Yuan Ding Co., Ltd. 450,000 - - - Unquoted stock NoteBai Yang Investment Co. 350,000 - - - Unquoted stock NoteEverest Textile Co., Ltd. 152,009 - - - Real estate NoteDing Ding Hotel Co., Ltd. 70,000 - - - Unquoted stock NoteOthers 14,477 - - - Stock listed on TWSE Note
$ 1,614,718 $ 1,614,718 $ -
Note: The terms of the loans were no superior to those for unrelated parties.
Interest RateInterest
RevenuesProvision for
Possible Losses
For the year ended December 312017 0.90% - 2.24% $ 18,138 $ 7,8092016 1.00% - 2.30% $ 10,040 $ 1,024
Balances of related allowance for possible losses were $24,864 thousand and $17,055 thousand as of December 31, 2017 and 2016, respectively.
140

c. Guarantees
Highest Balance in Current Ending
Reserve for Guarantee
Related Party Year Balance Obligations Interest Rate Collateral
For the year ended December 31, 2017
Oriental Union Chemical Corporation $ 130,000 $ 130,000 $ 1,300 0.50% Unquoted stockYuan Long Stainless Steel Co. 30,000 30,000 300 0.60% MachineryDing Ding Hotel Co., Ltd. 70,000 20,000 200 0.50%-0.80% Unquoted stockEverest Textile Co., Ltd. 16,835 16,835 168 0.70%-0.80% Real estate Yuan Ding Investment Co. 14,100 13,000 130 0.50%-0.80% Unquoted stockFar Eastern City Super Co., Ltd. 3,000 3,000 30 0.60% Certificates of deposit
$ 212,835 $ 2,128
For the year ended December 31, 2016
Oriental Union Chemical Corporation $ 130,000 $ 130,000 $ 1,300 0.40% Unquoted stockDing Ding Hotel Co., Ltd. 70,000 70,000 700 0.50% Unquoted stockEverest Textile Co., Ltd. 16,898 15,804 158 0.75% Real estateYuan Ding Co., Ltd. 14,100 14,100 141 0.50% Unquoted stockFar Eastern City Super Co., Ltd. 3,000 3,000 30 0.60% Certificates of depositU-Ming Marine Transport Corp. 2,740,000 - - 0.50% Ship and certificates of
deposit
$ 232,904 $ 2,329
d. Letters of credit issued
December 312017 2016
Everest Textile Co., Ltd. $ 10,537 $ 138,694Far Eastern Department Store Corp. 17,908 -Asia Cement Corp. - 17,900
$ 28,445 $ 156,594
e. Security transactions - buy and sell
Resale RepurchaseHeld for Trading Short Sales Agreement - Agreement -
Buy Sell Buy Sell Bonds BondsDah Chung Bills Finance
Corp.
For the year ended December 312017 $ 150,000 $ 150,000 $ 150,000 $ 50,000 $ 39,362,203 $ -2016 $ 50,000 $ 200,000 $ 250,000 $ 100,000 $ 35,468,690 $ -
141

f. Derivative instruments
Derivative Contract Nominal Valuation Balance SheetRelated Party Instrument Period Amount Gain (Loss) Account Balance
For the year ended December 31, 2017
U-Ming Marine Transport Corp.
Cross-currency swap contracts
2017.06.16 -2018.06.28
$ 5,671,120 $ (8,066) Financial assets at fair value through profit or loss
$ 48,734
U-Ming Marine Transport (Singapore) Private, Ltd.
Interest rate swap contracts
2012.09.27 -2022.10.25
966,329 (112) Financial liabilities at fair value through profit or loss
11,959
Far Eastern New Century Corp.
Forward exchange contracts
2017.11.06 -2018.02.26
1,007,212 5,651 Financial assets at fair value through profit or loss
7,391
Financial liabilities at fair value through profit or loss
1,740
New Century InfoComm Tech Co., Ltd.
Foreign-currency swap contracts
2017.12.27 -2018.02.26
298,480 (458) Financial liabilities at fair value through profit or loss
458
Dah Chung Bills Finance Corp.
Domestic convertible
2015.05.18 -2019.06.16
225,000 (30,224) Financial assets at fair value through profit or loss
15,416
(exchangeable) bond asset swap contracts
Financial liabilities at fair value through profit or loss
630
For the year ended December 31, 2016
U-Ming Marine Transport Corp.
Cross-currency swap contracts
2016.11.09 -2017.12.18
8,102,029 (19,439) Financial liabilities at fair value through profit or loss
112,758
U-Ming Marine Transport (Singapore) Private, Ltd.
Interest rate swap contracts
2012.09.27 -2022.10.25
627,020 (1,029) Financial liabilities at fair value through profit or loss
11,847
Far Eastern New Century Corp.
Forward exchange contracts
2016.10.19 -2017.03.29
2,303,185 (5,066) Financial assets at fair value through profit or loss
30,781
Financial liabilities at fair value through profit or loss
35,847
New Century InfoComm Tech Co., Ltd.
Foreign-currency swap contracts
2016.10.27 -2017.02.15
645,580 8,723 Financial assets at fair value through profit or loss
8,723
Dah Chung Bills Finance Corp.
Domestic convertible
2014.04.25 -2019.09.30
615,000 42,589 Financial assets at fair value through profit or loss
48,435
(exchangeable) bond asset swap contracts
Financial liabilities at fair value through profit or loss
3,425
g. Deposits
December 312017 2016
Deposits of related parties (each account balance did not exceed 5% of total deposits) $44,426,319 $24,317,006
Interest Rate 0% - 6.08% 0% - 6.08%
For the Year Ended December 312017 2016
Interest expenses $ 228,739 $ 199,576
h. Service fee expense
For the Year Ended December 312017 2016
Ding Ding Integrated Marketing Service Co. $ 144,650 $ 192,218Far Eastern Department Store Corp. 18,534 17,623
$ 163,184 $ 209,841
142

i. Operating expenses
For the Year Ended December 312017 2016
Marketing and advertising - Far Eastern Department Store Corp. $ 116,629 $ 75,984Rental - Yuan Ding Co., Ltd. 79,068 77,938Telecommunications - New Century InfoComm Tech Co., Ltd. 46,031 43,349Marketing and advertising - Far Eastern Electronic Toll
Collection Co. 19,550 45,849Marketing and advertising - Ding Ding Hotel Co., Ltd. 16,801 16,169
$ 278,079 $ 259,289
The Bank rented part of its office premises from Yuan Ding Co., Ltd. Based on the lease agreements, the rents were payable monthly.
j. Compensation of key management personnel
For the Year Ended December 312017 2016
Short-term employee benefits $ 166,913 $ 171,595Post-employment benefits 2,618 1,041
$ 169,531 $ 172,636
38. PLEDGED ASSETS
December 312017 2016
Available-for-sale financial assets - domestic government bonds $ 3,602,186 $ 4,114,890Available-for-sale financial assets - negotiable certificates of
deposits issued by the central bank 3,003,045 3,094,036Due from the central bank and other banks - certificates of deposit - 1,400,000Other financial assets - deposits with original maturity more than 3
months 549,240 554,760
$ 7,154,471 $ 9,163,686
The certificates of deposit issued by the central bank, negotiable certificates of deposits issued by the Central Bank and deposits with original maturity more than 3 months have been pledged as collaterals to
l-time gross settlement system. The balance of intraday credit and the amount of collateral may vary at any time. The domestic government bonds had been provided as the reserve for compensation of trust department as well as security bond for provisional
143

39. SIGNIFICANT CONTINGENT LIABILITIES AND UNRECOGNIZED COMMITMENTS
commitments resulting from operating activities as of December 31, 2017 and 2016 are summarized asfollows:
a. Operating leases commitment
The maturity analysis of rental payments under non-cancellable operating leases was as follows:
December 312017 2016
Within one year $ 366,779 $ 382,650After one year but within five years 687,092 649,411After five years 69,942 56,484
$ 1,123,813 $ 1,088,545
b. Balance sheets and income statements of trust accounts and the trust assets lists were as follows:
Balance Sheets of Trust Accounts
December 312017 2016
Assets
Deposits in banks $ 5,495,110 $ 6,285,619Accounts receivable 14,672 20,068Funds 38,592,345 38,383,352Equity stocks 5,175,789 7,565,124Bond investments 5,434 5,784Real estate, net 1,240,973 1,338,769Marketable securities in custody 7,942,426 3,421,581Others 1,513,200 1,153,742
$ 59,979,949 $ 58,174,039
Liabilities
Accounts payable $ 3,158 $ 1,517Income tax payable 189 92Marketable securities in custody payable 7,942,426 3,421,581Trust capital 50,359,002 52,134,700Reserve and earnings 1,675,174 2,616,149
$ 59,979,949 $ 58,174,039
144

Income Statements of Trust Accounts
For the Year Ended December 312017 2016
Trust revenueInterest $ 35,618 $ 31,190Cash dividends 1,640,769 1,557,416Unrealized investment gain 4,851 1,664,286Revenue from stock lending 75 425Others 19,075 4,084
1,700,388 3,257,401Trust expenses
Management 48,014 35,714Supervision 477 446Service charges 16,259 10,524Taxes 2,177 1,346Service fee for stock affairs 1 7Service fee for stock lending 2 7Realized investment loss 366,599 1,165,028
433,529 1,213,072Income before tax 1,266,859 2,044,329Income tax 391 318
Net income $ 1,266,468 $ 2,044,011
Trust Asset Lists
December 312017 2016
Deposits in banks $ 5,495,110 $ 6,285,619Accounts receivable 14,672 20,068Funds 38,592,345 38,383,352Equity stocks 5,175,789 7,565,124Bonds investments 5,434 5,784Real estate, net
Land 591,940 607,385Building 25,211 30,386Construction in progress 623,822 700,998
Marketable securities in custody 7,942,426 3,421,581Others 1,513,200 1,153,742
$ 59,979,949 $ 58,174,039
As of December 31, 2017 and 2016, funds amounting to $1,183,824 thousand and $980,677 thousand, ities through
Non-discretionary Pecuniary Trust of the OBU.
145

40. UNSETTLED LITIGATION EVENTS
About the claims of the Bank against Allied Material Technology Co., in October 2017, the Taiwan HighCourt ruled that the Bank must pay $244,563 thousand plus interest to other banks which have claims in thereorganization of Allied Material Technology Co. The Bank has appealed the decision according to lawand is waiting for the supreme court verdict.
41. EXCHANGE RATE OF FINANCIAL ASSETS AND LIABILITIES DENOMINATED INFOREIGN CURRENCIES
The significant financial assets and liabilities denominated in foreign currencies were as follows:
December 312017 2016
Foreign Currencies Exchange Rate
New Taiwan Dollars
Foreign Currencies Exchange Rate
New Taiwan Dollars
Financial assets
Monetary itemsUSD $ 3,389,628 29.848 $ 101,173,616 $ 3,256,564 32.279 $ 105,118,599AUD 506,770 23.260 11,787,470 637,299 23.300 14,849,058HKD 3,013,795 3.819 11,509,685 3,261,708 4.162 13,575,230CNY 1,179,420 4.577 5,398,204 1,186,751 4.623 5,486,351ZAR 1,034,693 2.421 2,504,990 785,144 2.368 1,859,222JPY 8,520,437 0.265 2,257,916 12,164,469 0.2758 3,354,961EUR 53,858 35.700 1,922,731 27,205 33.930 923,079CAD 16,429 23.780 390,683 11,470 23.920 274,361GBP 7,809 40.210 314,007 6,994 39.620 277,103NZD 9,076 21.200 192,406 8,836 22.420 198,093
Financial liabilities
Monetary itemsUSD 3,115,364 29.848 92,987,387 3,002,797 32.279 96,927,276AUD 503,348 23.260 11,707,879 639,567 23.300 14,901,908HKD 2,934,977 3.819 11,208,676 3,209,248 4.162 13,356,890CNY 1,181,070 4.577 5,405,758 1,191,479 4.623 5,508,206ZAR 1,082,688 2.421 2,621,187 787,715 2.368 1,865,308JPY 8,156,656 0.265 2,161,514 12,098,732 0.2758 3,336,830EUR 53,671 35.700 1,916,045 26,893 33.930 912,484CAD 15,874 23.780 377,478 11,388 23.920 272,392GBP 7,929 40.210 318,839 6,986 39.620 276,802NZD 9,527 21.200 201,970 8,863 22.420 198,718
42. FINANCIAL INSTRUMENTS
a. Information of fair value
1) Overview
Fair value is defined as the price the trader collected or paid in an ordinary transaction for disposalor acquisition of assets or transfer of liabilities on the measurement date.
Financial instruments are initially recognized at fair value which is the transaction price in generalterms. All financial instruments are subsequently measured at fair value except for financialinstruments which are valued at amortized cost.
2) The definition of three levels of financial instruments at fair value
a) Level 1 inputs are observable inputs that reflect quoted prices for identical financial instrumentsin an active market. A market is active if it has these characteristics: Products traded in themarket are homogeneous; willing buyers and sellers can be found immediately and the price
146
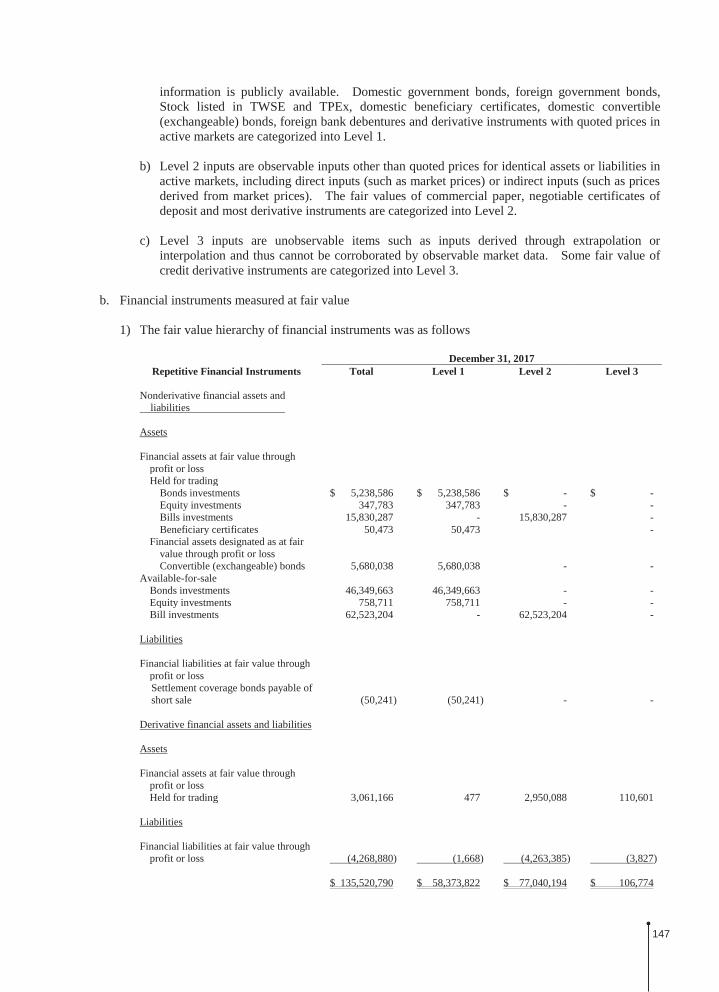
information is publicly available. Domestic government bonds, foreign government bonds, Stock listed in TWSE and TPEx, domestic beneficiary certificates, domestic convertible (exchangeable) bonds, foreign bank debentures and derivative instruments with quoted prices in active markets are categorized into Level 1.
b) Level 2 inputs are observable inputs other than quoted prices for identical assets or liabilities inactive markets, including direct inputs (such as market prices) or indirect inputs (such as pricesderived from market prices). The fair values of commercial paper, negotiable certificates ofdeposit and most derivative instruments are categorized into Level 2.
c) Level 3 inputs are unobservable items such as inputs derived through extrapolation orinterpolation and thus cannot be corroborated by observable market data. Some fair value ofcredit derivative instruments are categorized into Level 3.
b. Financial instruments measured at fair value
1) The fair value hierarchy of financial instruments was as follows
December 31, 2017Repetitive Financial Instruments Total Level 1 Level 2 Level 3
Nonderivative financial assets andliabilities
Assets
Financial assets at fair value through profit or lossHeld for trading
Bonds investments $ 5,238,586 $ 5,238,586 $ - $ -Equity investments 347,783 347,783 - -Bills investments 15,830,287 - 15,830,287 -Beneficiary certificates 50,473 50,473 -
Financial assets designated as at fair value through profit or lossConvertible (exchangeable) bonds 5,680,038 5,680,038 - -
Available-for-saleBonds investments 46,349,663 46,349,663 - -Equity investments 758,711 758,711 - -Bill investments 62,523,204 - 62,523,204 -
Liabilities
Financial liabilities at fair value through profit or lossSettlement coverage bonds payable of short sale (50,241) (50,241) - -
Derivative financial assets and liabilities
Assets
Financial assets at fair value through profit or lossHeld for trading 3,061,166 477 2,950,088 110,601
Liabilities
Financial liabilities at fair value through profit or loss (4,268,880) (1,668) (4,263,385) (3,827)
$ 135,520,790 $ 58,373,822 $ 77,040,194 $ 106,774
147

December 31, 2016Repetitive Financial Instruments Total Level 1 Level 2 Level 3
Nonderivative financial assets andliabilities
Assets
Financial assets at fair value through profit or lossHeld for trading
Bonds investments $ 2,303,992 $ 2,303,992 $ - $ -Equity investments 151,537 151,537 - -Bills investments 9,343,747 - 9,343,747 -Beneficiary certificates 25,673 25,673 - -
Financial assets designated as at fair value through profit or lossConvertible (exchangeable) bonds 15,479,988 15,479,988 - -
Available-for-saleBonds investments 33,380,059 33,380,059 - -Equity investments 449,971 449,971 - -Bill investments 45,764,676 - 45,764,676 -
Derivative financial assets and liabilities
Assets
Financial assets at fair value through profit or lossHeld for trading 6,525,168 - 6,432,394 92,774
Liabilities
Financial liabilities at fair value through profit or loss (7,954,542) - (7,947,724) (6,818)
$ 105,470,269 $ 51,791,220 $ 53,593,093 $ 85,956
2) Evaluation methods for financial instruments measured at fair value
When the Bank and its subsidiaries determine the fair value of financial instruments, they considerthe market. If the market is active, then the fair value of the instruments will be consistent withquoted market prices. If the market is not active, then the fair value will be estimated by using a
parameters or to parameters based on conditions and characteristics of financial instruments that are
used to measure fair value of financial instruments are usually observable data from market, such asThe valuation department determines the scope of
valuation model and assesses any uncertainty and its impact. In its assessment, the valuationdepartment ensures the following:
a) The consistency and adequacy of the market parameters used in the valuation;
b) The appropriateness of the valuation model in light of the assumptions to be used, the internalcontrol and risk management framework, and the degree of mathematical expertise required foran independent unit to make the valuation;
c) Reliability of price information and other parameters used in the valuation and any modeladjustments to be made on the basis of current market conditions.
148

3) Credit risk valuation adjustment
Credit risk valuation adjustment is for financial instrument transactions made outside the stock exchange, namely the transactions made over-the-counter, which could be mainly divided into credit value adjustment and debit value adjustment. The definition is as follows:
a)to default and the possible loss that the counter party may not be able to reimburse entire marketvalue.
b) Debit Value Adjusdefault and the uncertainly that the Bank may not be able to reimburse for the entire marketvalue.
oss given default
is calculated by multiplying PD (under zero default rate of the counterparty), LGD and EAD ofthe Bank together.
To take into account all risk factors involved in model-based fair value measurements, the Bankuses the disclosure guidelines issued by the TWSE on CVA and DVA, which are marked tomarket, using appropriate ratios such as LGD, PD, and EAD. This way, the credit risks oncounterparties in OTC-considered.
4) Transfers between Levels 1 and level 2
There was no transfer between Level 1 and Level 2 for the years ended December 31, 2017 and2016.
5) Level 3 financial instruments
a) Movement of Level 3 financial assets
December 31, 2017
Item Beginning Balance Valuation
Increase in the Current Year Decrease in the Current YearEnding BalancePurchase or
Issue Transfer-inSale,
Disposition or Settlement
Transfer-out from Level 3
Financial assets at fair value through profit or lossHeld for trading - derivative
financial assets $ 92,774 $ 32,470 $ 48,024 $ - $ (62,667) $ - $ 110,601
December 31, 2016
Item Beginning Balance Valuation
Increase in the Current Year Decrease in the Current YearEnding BalancePurchase or
Issue Transfer-inSale,
Disposition or Settlement
Transfer-out from Level 3
Financial assets at fair value through profit or lossHeld for trading - derivative
financial assets $ 49,599 $ 6,365 $ 63,310 $ - $ (26,500) $ - $ 92,774
149
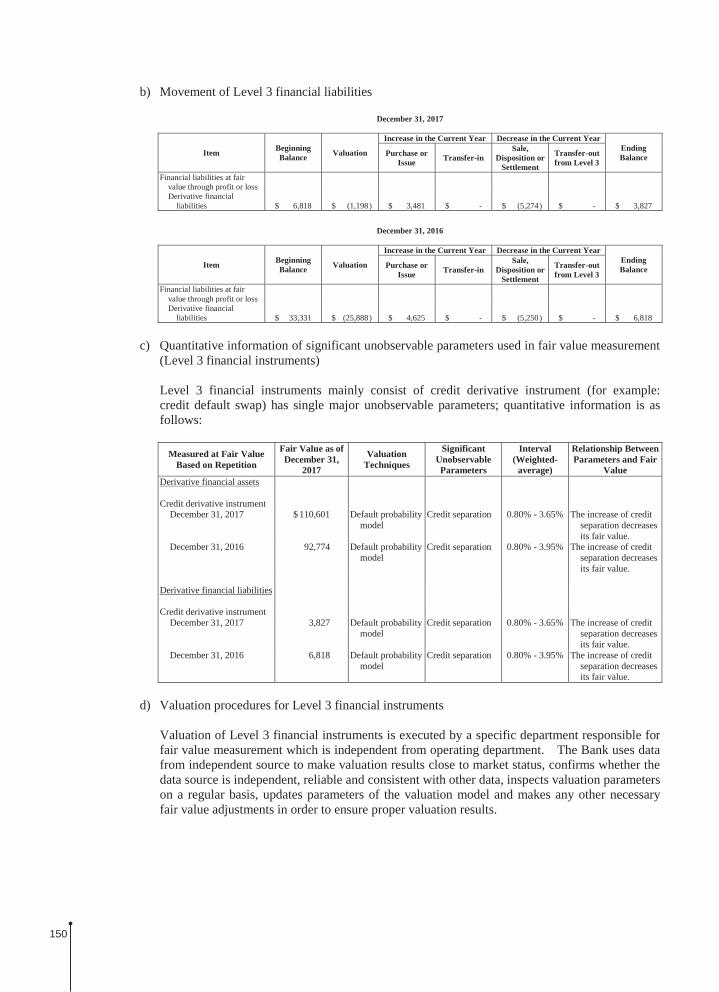
b) Movement of Level 3 financial liabilities
December 31, 2017
Item Beginning Balance Valuation
Increase in the Current Year Decrease in the Current YearEnding BalancePurchase or
Issue Transfer-inSale,
Disposition or Settlement
Transfer-out from Level 3
Financial liabilities at fair value through profit or lossDerivative financial
liabilities $ 6,818 $ (1,198) $ 3,481 $ - $ (5,274) $ - $ 3,827
December 31, 2016
Item Beginning Balance Valuation
Increase in the Current Year Decrease in the Current YearEnding BalancePurchase or
Issue Transfer-inSale,
Disposition or Settlement
Transfer-out from Level 3
Financial liabilities at fair value through profit or lossDerivative financial
liabilities $ 33,331 $ (25,888) $ 4,625 $ - $ (5,250) $ - $ 6,818
c) Quantitative information of significant unobservable parameters used in fair value measurement(Level 3 financial instruments)
Level 3 financial instruments mainly consist of credit derivative instrument (for example:credit default swap) has single major unobservable parameters; quantitative information is asfollows:
Measured at Fair Value Based on Repetition
Fair Value as of December 31,
2017
Valuation Techniques
Significant Unobservable Parameters
Interval (Weighted-
average)
Relationship Between Parameters and Fair
ValueDerivative financial assets
Credit derivative instrumentDecember 31, 2017 $ 110,601 Default probability
modelCredit separation 0.80% - 3.65% The increase of credit
separation decreases its fair value.
December 31, 2016 92,774 Default probability model
Credit separation 0.80% - 3.95% The increase of credit separation decreases its fair value.
Derivative financial liabilities
Credit derivative instrumentDecember 31, 2017 3,827 Default probability
modelCredit separation 0.80% - 3.65% The increase of credit
separation decreases its fair value.
December 31, 2016 6,818 Default probability model
Credit separation 0.80% - 3.95% The increase of credit separation decreases its fair value.
d) Valuation procedures for Level 3 financial instruments
Valuation of Level 3 financial instruments is executed by a specific department responsible forfair value measurement which is independent from operating department. The Bank uses datafrom independent source to make valuation results close to market status, confirms whether thedata source is independent, reliable and consistent with other data, inspects valuation parameterson a regular basis, updates parameters of the valuation model and makes any other necessaryfair value adjustments in order to ensure proper valuation results.
150
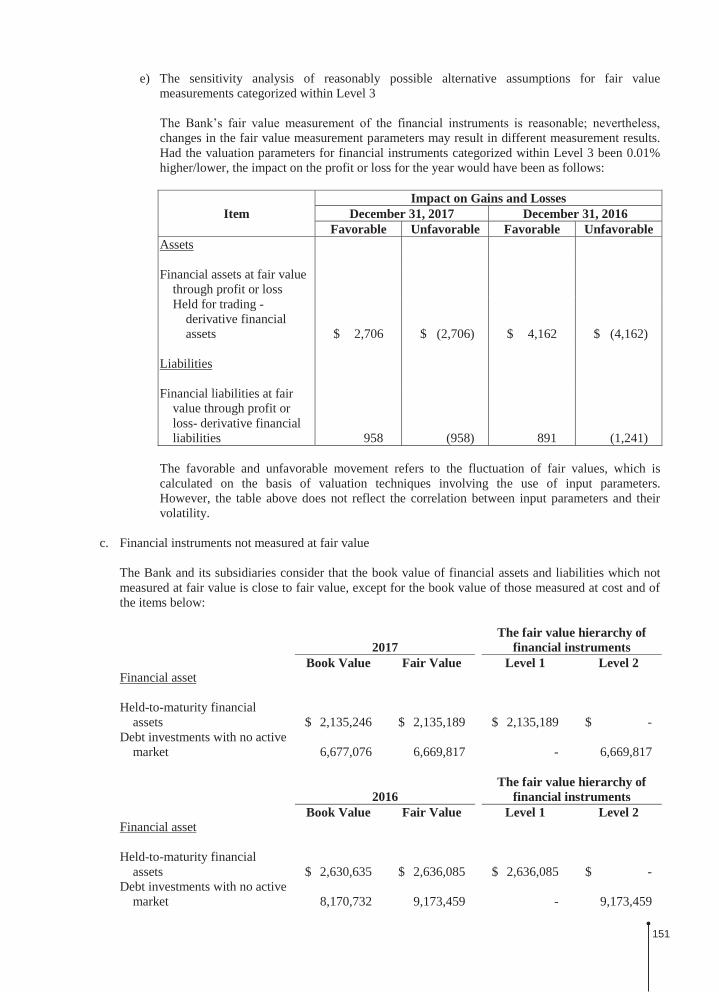
e) The sensitivity analysis of reasonably possible alternative assumptions for fair valuemeasurements categorized within Level 3
changes in the fair value measurement parameters may result in different measurement results.Had the valuation parameters for financial instruments categorized within Level 3 been 0.01%higher/lower, the impact on the profit or loss for the year would have been as follows:
ItemImpact on Gains and Losses
December 31, 2017 December 31, 2016Favorable Unfavorable Favorable Unfavorable
Assets
Financial assets at fair value through profit or lossHeld for trading -
derivative financial assets $ 2,706 $ (2,706) $ 4,162 $ (4,162)
Liabilities
Financial liabilities at fair value through profit or loss- derivative financial liabilities 958 (958) 891 (1,241)
The favorable and unfavorable movement refers to the fluctuation of fair values, which is calculated on the basis of valuation techniques involving the use of input parameters. However, the table above does not reflect the correlation between input parameters and their volatility.
c. Financial instruments not measured at fair value
The Bank and its subsidiaries consider that the book value of financial assets and liabilities which notmeasured at fair value is close to fair value, except for the book value of those measured at cost and ofthe items below:
2017The fair value hierarchy of
financial instrumentsBook Value Fair Value Level 1 Level 2
Financial asset
Held-to-maturity financial assets $ 2,135,246 $ 2,135,189 $ 2,135,189 $ -
Debt investments with no active market 6,677,076 6,669,817 - 6,669,817
2016The fair value hierarchy of
financial instrumentsBook Value Fair Value Level 1 Level 2
Financial asset
Held-to-maturity financial assets $ 2,630,635 $ 2,636,085 $ 2,636,085 $ -
Debt investments with no active market 8,170,732 9,173,459 - 9,173,459
151

The evaluation methods and assumptions for Level 2 financial instruments above are quoted from the offering price of Bloomberg and Reuters.
43. FINANCIAL RISK MANAGEMENT
a. Overview
-oriented culture, and to use bothqualitative and quantitative indexes from internal and external risk management regulations indeveloping operating strategies.
The Bank has set up an independent risk control department to implement and monitor riskmanagement policies.
Bank, to set appropriate risk limits and controls, to monitor risks and adherence to limits, and to achievethe target profit.
b. Risk management framework
The Board of Directors, the highest decision-making body of the Bank, has overall responsibility for theagement framework.
Asset and Liability Management Committee and Risk Management Committee have been formed to
evaluate risk tolerance. The general manager is the convener, and is responsible for appointingmembers of committees.
Risk Management Department comprising of corporate banking and consumer banking groups whichdirectly manage credit extension risks with regard to their respective areas, and present riskmanagement report to Risk Management Committee and the Board of Directors, regularly.
The Internal Audit Department undertakes regular reviews of risk management controls and procedures,including risk management framework, operating procedures of risk management, and provides timelysuggestion and improvement.
c. Credit risk
1) Definition and scope of credit risk
Credit risk is the risk of financial loss to the Bank if a borrower, issuer or counterparty to a financialinstrument fails to meet its contractual obligations due to its credit deterioration or other factors,such as a dispute between the borrower and its counterparty.
Credit risk includes all risks derived from on- and off-balance sheet business, and all credit riskrelated to products, businesses and positions.
152

2) Management policies on credit risk
The Bank shall identify risk factors and consider appropriate risk evaluation and control processprior to taking the existing or new business. For all credit risks identified on- and off-balancesheet, adequate credit limits are set based on the same borrower, counterparty, related party, group,or industry. The Bank shall establish review mechanism to track and assess changes in each
assess and manage asset quality, also strengthenthe management of unusual borrowers and make appropriate allowance for possible losses ifapplicable.
The credit risk management processes and valuation methods for credit extension are as follows:
a) Classification of credit assets
the Procedures for Banking Institutions to Evaluate Assets and Deal withNonperforming/Non-
past due status as follows: Category Two - Special Mention loans; Category Three -Substandard; Category Four - Doubtful, and Category Five - Unrecoverable. Moreover, the
Evaluate Assets and Deal with Nonperforming/Non-credit extension and credit collection and management.
b) Credit quality
Discounts and loans and receivables
The Bank sets credit quality grades according to product features, business types, operatingconditions, collaterals and credit rating. Credit risk from corporate banking is categorizedaccording to the business types, collaterals, credit rating and financial position of borrowers;credit risk from consumer banking is assessed on a case-by-case basis, except for unsecuredloans and credit card products, which are assessed by internal credit rating models.
Interbank facilities, derivative financial instruments and investments in debt instruments
results, credit rating, rating on THE BANKER, net worth and background of shareholders, withsummaries submitted to the Credit Committee, and to the Managing Directors for approval. Inthe month following the end of each quarter, reports on transaction limits for each financialinstitution and the quarterly balance are submitted to Credit Committee, and then to the generalmanager for approval.
Derivative financial instruments transactions entered into counterparties from banking sectorsare those categorized as investment grade, and they are controlled using relevant transactionlimits for each counterparty. For individual counterparty, credit exposure is controlled usingthe limits placed on derivative instruments by both amounts and terms in the general creditapproval process.
Credit risk on debt instruments is evaluated by identifying the risk using the credit ratingobtained from external institutions, credit quality, geographic situations and counterparty creditrisk.
153

3) Credit risk hedging and mitigation policies
a) The terms of credit facilities are determined in the light of assessments of probability andamounts of default and collateral and guarantees are obtained, including bank deposit receipts,securities (such as treasury securities, government bonds, bank debentures, stocks and bondsguaranteed by financial institutions) and real estate such as land and buildings. Stocks listedon TWSE and TPEx are marked to market day to day, and changes in the value of theircollaterals are monitored all the time; values of land and buildings are examined every time thecontract is renewed.
b) Reduce loans to non-target customers to mitigate credit risk.
c) Understand, control and monitor risks on a timely basis via credit limits prior to the credit beingcommitted to customers, restrictive clauses in contracts, loans management, review mechanismto view changes of each case. Understand credit portfolios and overall credit risks by the useof periodic reports and feedbacks.
d)nonperforming loans secured through compulsory enforcement or participating distribution, ifthe minimum auction price or liquidation price of the collateral is too low and damage the
articipate in the auction or declare to undertake, for example,the minimum auction price is too low to compensate the principal and interest of loans but thecollateral must not be difficult to dispose in the future. For collaterals tendered or undertaken,the Bank should actively seek buyers, and if the collateral is real estate, the Bank should disposeof it within the period prescribed under the Banking Law.
e) Other credit enhancements
If there are guarantee, strategic alliance or collaterals provided in the terms of the loan contractswhich the Bank recognized as unsecured loan, the Bank will clearly state that when defaultevents occur, the Bank will demand compensation from the guarantor, strategic alliance,transfer of credits to the Bank or disposal of collaterals to decrease credit risk.
4) The maximum credit risk exposure
-balancesheet assets, without taking into account the collaterals held or other credit enhancements. Theamounts of the maximum credit exposure of the irrevocable off-balance commitments andguarantees, without taking into account the collaterals held or other credit enhancements, were asfollows:
December 312017 2016
Unused portion of credit card lines $ 171,589,511 $ 162,293,437Financial guarantees and standby L/Cs 17,455,518 15,740,080Irrevocable loan commitments 12,171,019 12,467,686
154

The breakdown of maximum credit risk exposure of the Bank according to whether collaterals are held or other credit enhancements exist is as follows:
December 31, 2017
Maximum Credit Risk Exposure
With Collaterals Other Credit
Enhancements Without
Collaterals Total
Balance sheet items
Discounts and loans $ 234,344,356 $ 52,712,990 $ 68,883,273 $ 355,940,619Receivables - credit card - - 14,786,253 14,786,253Receivables - acceptances - 175,516 245,900 421,416
Off-Balance sheet items
Unused portion of credit card lines - - 171,589,511 171,589,511
Receivables - guarantee 4,592,188 5,387,303 6,529,898 16,509,389Letters of credit issued 35,601 244,973 665,555 946,129Irrevocable loan commitments 1,795,770 - 10,375,249 12,171,019
$ 240,767,915 $ 58,520,782 $ 273,075,639 $ 572,364,336
December 31, 2016
Maximum Credit Risk Exposure
With Collaterals Other Credit
Enhancements Without
Collaterals Total
Balance sheet items
Discounts and loans $ 230,469,044 $ 48,949,270 $ 81,577,182 $ 360,995,496Receivables - credit card - - 14,551,297 14,551,297Receivables - acceptances - 16,640 301,837 318,477
Off-Balance sheet items
Unused portion of credit card lines - - 162,293,437 162,293,437
Receivables - guarantee 5,221,120 6,578,303 3,479,325 15,278,748Letters of credit issued 159,241 212,400 89,691 461,332Irrevocable loan commitments 617,408 - 11,850,278 12,467,686
$ 236,466,813 $ 55,756,613 $ 274,143,047 $ 566,366,473
5) Concentrations of credit risk
The concentration of credit risk exists when counterparties to financial transactions are individuals or groups engaging in similar business activities and having similar economic features. The similarity would cause their ability to meet contractual obligations to be similarly affected by
geography and type of collaterals were as follows:
155

a) By industry
no significant concentration to a single customer or counterparty, butthere were some risks in relation to specific industries, as follows:
2017Credit Risk Profile by Industry Sector Amount %
Finance and insurance $ 52,415,634 15Manufacturing 41,373,608 12Wholesale and retail trade 11,331,381 3
$ 105,120,623 30
2016Credit Risk Profile by Industry Sector Amount %
Finance and insurance $ 47,528,521 13Manufacturing 45,376,221 12Transportation and warehousing 16,574,108 5
$ 109,478,850 30
b) By geography
December 312017 2016
Region Amount% to Total Amount
% to Total
Taiwan $ 299,813,491 84 $ 307,583,245 85Asia Pacific except Taiwan 30,750,120 9 26,990,916 8Others 25,377,008 7 26,421,335 7
$ 355,940,619 100 $ 360,995,496 100
c) By type of collaterals
December 312017 2016
Type of Collaterals Amount % Amount %
Unsecured $ 121,596,263 34 $ 130,526,452 36Secured
Real estate 191,379,527 54 187,951,685 52Financial collateral 20,035,658 6 18,964,855 5Movable property 19,630,122 5 20,550,499 6Others 3,299,049 1 3,002,005 1
$ 355,940,619 100 $ 360,995,496 100
156

6) Continuing assessment of credit quality and any impairment of financial assets
Some of the financial assets held by the Bank and its subsidiaries, such as cash and cash equivalents,due from the central bank and other banks, financial assets at fair value through profit or loss,securities purchased under resale agreements, refundable deposits and operating deposits, areassessed with low credit risk due to the good credit rating of the counterparties.
157

An
anal
ysis
of c
redi
t qua
lity
of fi
nanc
ial a
sset
s oth
er th
an th
ose
liste
d ab
ove
is sh
own
belo
w:
a)C
redi
t qua
lity
anal
ysis
of d
isco
unts
and
loan
s and
rece
ivab
les
Dec
embe
r 31
, 201
7
Nei
ther
Pas
t due
Nor
Impa
ired
Past
Due
But
N
ot Im
pair
ed
(B)
Impa
ired
(C)
Tot
al(A
)+(B
)+(C
)
Allo
wan
ce fo
r Po
ssib
le L
osse
s (D
)
Net
Am
ount
(A
)+(B
)+(C
)-(D
)E
xcel
lent
Goo
dM
oder
ate
Spec
ial M
entio
nSu
btot
al (A
)
With
Obj
ectiv
eE
vide
nce
of
Indi
vidu
al
Impa
irm
ent
With
out
Obj
ectiv
e E
vide
nce
of
Indi
vidu
al
Impa
irm
ent
Disc
ount
s and
loan
s$
202,
127,
029
$91
,546
,163
$53
,657
,111
$1,
464,
776
$34
8,79
5,07
9$
3,60
4,98
1$
3,54
0,55
9$
355,
940,
619
$1,
005,
118
$3,
878,
739
$35
1,05
6,76
2R
ecei
vabl
esC
redi
t car
d5,
553,
263
2,52
5,40
94,
676,
783
14,3
4712
,769
,802
574,
604
1,44
1,84
714
,786
,253
469,
259
2,20
914
,314
,785
Oth
ers
1,28
5,40
668
6,97
24,
203,
354
-6,
175,
732
2,57
267
0,90
96,
849,
213
579,
375
68,0
846,
201,
754
Dec
embe
r 31
, 201
6
Nei
ther
Pas
t due
Nor
Impa
ired
Past
Due
But
N
ot Im
pair
ed
(B)
Impa
ired
(C)
Tot
al(A
)+(B
)+(C
)
Allo
wan
ce fo
r Po
ssib
le L
osse
s (D
)
Net
Am
ount
(A
)+(B
)+(C
)-(D
)E
xcel
lent
Goo
dM
oder
ate
Spec
ial M
entio
nSu
btot
al (A
)
With
Obj
ectiv
e E
vide
nce
of
Indi
vidu
al
Impa
irm
ent
With
out
Obj
ectiv
e E
vide
nce
of
Indi
vidu
al
Impa
irm
ent
Disc
ount
s and
loan
s$
207,
852,
127
$87
,441
,819
$58
,099
,496
$63
5,88
0$
354,
029,
322
$3,
363,
202
$3,
602,
972
$36
0,99
5,49
6$
1,05
6,63
6$
3,97
5,18
8$
355,
963,
672
Rec
eiva
bles
Cre
dit c
ard
5,52
9,00
02,
676,
250
4,33
9,38
920
,046
12,5
64,6
8541
6,55
51,
570,
057
14,5
51,2
9748
3,67
520
,040
14,0
47,5
82O
ther
s1,
682,
673
538,
293
3,54
7,64
480
,821
5,84
9,43
135
,661
1,19
3,31
5 7,
078,
407
532,
285
54,2
826,
491,
840
158

b) An analysis of credit quality of discounts and loans neither past due nor impaired by businesstypes
December 31, 2017 Neither Past Due Nor ImpairedExcellent Good Moderate Special Mention Total
Corporate bankingSecured $ 24,577,665 $ 19,672,117 $ 4,307,119 $ 30,498 $ 48,587,399Unsecured 9,855,194 39,597,169 45,050,962 1,107,894 95,611,219
Consumer bankingHousing mortgage 156,815,282 9,900,793 617,144 - 167,333,219Credit loans 6,506,427 7,654,052 2,574,079 326,384 17,060,942Others 4,372,461 14,722,032 1,107,807 - 20,202,300
Total $ 202,127,029 $ 91,546,163 $ 53,657,111 $ 1,464,776 $ 348,795,079
December 31, 2016 Neither Past Due Nor ImpairedExcellent Good Moderate Special Mention Total
Corporate bankingSecured $ 27,102,963 $ 19,470,393 $ 4,548,635 $ 57,978 $ 51,179,969Unsecured 21,246,316 36,824,422 49,324,849 346,769 107,742,356
Consumer bankingHousing mortgage 150,338,522 10,060,548 772,051 - 161,171,121Credit loans 5,368,660 6,946,249 2,159,774 231,133 14,705,816Others 3,795,666 14,140,207 1,294,187 - 19,230,060
Total $ 207,852,127 $ 87,441,819 $ 58,099,496 $ 635,880 $ 354,029,322
c) Loans and receivables past due but not impaired
Financial assets past due 90 days or less are not considered impaired unless there is objectiveevidence that an impairment loss has been incurred. Financial assets might become past due
The aging analysis of loans and receivables past due but not impaired was as follows:
Past Due ItemsDecember 31, 2017
Up to 1 Month Over 1 Month to 3 Months Total
Discounts and loansCorporate banking $ 80,944 $ 154,465 $ 235,409Consumer banking
Housing mortgage 2,116,878 283,789 2,400,667Credit loans 485,657 114,219 599,876Others 344,203 24,826 369,029
Total 3,027,682 577,299 3,604,981Receivables
Credit card 505,595 69,009 574,604Others - 2,572 2,572
Past Due ItemsDecember 31, 2016
Up to 1 Month Over 1 Month to 3 Months Total
Discounts and loansCorporate banking $ 136,998 $ 30,282 $ 167,280Consumer banking
Housing mortgage 1,916,267 323,669 2,239,936Credit loans 421,283 111,056 532,339Others 393,739 29,908 423,647
Total 2,868,287 494,915 3,363,202Receivables
Credit card 347,910 68,645 416,555Others - 35,661 35,661
159

d)A
n an
alys
is o
f cre
dit q
ualit
y of
secu
rity
inve
stm
ents
Dec
embe
r 31
, 201
7N
eith
er P
ast D
ue N
or Im
pair
edPa
st D
ue B
ut
Not
Impa
ired
(B
)Im
pair
ed (C
)T
otal
(A)+
(B)+
(C)
Allo
wan
ce fo
r Po
ssib
le L
osse
s (D
)
Net
Am
ount
(A)+
(B)+
(C)-
(D)
Exc
elle
ntG
ood
Mod
erat
eSp
ecia
l Men
tion
Subt
otal
(A)
Ava
ilabl
e-fo
r-sa
le fi
nanc
ial a
sset
sBo
nd in
vest
men
ts$
46,3
49,6
63$
-$
-$
-$
46,3
49,6
63$
-$
-$
46,3
49,6
63$
-$
46,3
49,6
63B
ill in
vest
men
ts62
,523
,204
--
-62
,523
,204
--
62,5
23,2
04-
62,5
23,2
04H
eld-
to-m
atur
ity fi
nanc
ial a
sset
sBo
nd in
vest
men
ts2,
135,
246
--
-2,
135,
246
--
2,13
5,24
6-
2,13
5,24
6D
ebt i
nves
tmen
ts w
ith n
o ac
tive
mar
ket
4,00
9,51
82,
667,
558
--
6,67
7,07
6-
-6,
677,
076
-6,
677,
076
Tota
l$
115,
017,
631
$2,
667,
558
$-
$-
$11
7,68
5,18
9$
-$
-$
117,
685,
189
$-
$11
7,68
5,18
9
Dec
embe
r 31
, 201
6N
eith
er P
ast D
ue N
or Im
pair
edPa
st D
ue B
ut
Not
Impa
ired
(B
)Im
pair
ed (C
)T
otal
(A)+
(B)+
(C)
Allo
wan
ce fo
r Po
ssib
le L
osse
s (D
)
Net
Am
ount
(A)+
(B)+
(C)-
(D)
Exc
elle
ntG
ood
Mod
erat
eSp
ecia
l Men
tion
Subt
otal
(A)
Ava
ilabl
e-fo
r-sa
le fi
nanc
ial a
sset
sBo
nd in
vest
men
ts$
33,3
80,0
59$
-$
-$
-$
33,3
80,0
59$
-$
-$
33,3
80,0
59$
-$
33,3
80,0
59B
ill in
vest
men
ts45
,764
,676
--
-45
,764
,676
--
45,7
64,6
76-
45,7
64,6
76H
eld-
to-m
atur
ity fi
nanc
ial a
sset
sBo
nd in
vest
men
ts2,
630,
635
--
-2,
630,
635
--
2,63
0,63
5-
2,63
0,63
5D
ebt i
nves
tmen
ts w
ith n
o ac
tive
mar
ket
4,29
3,10
73,
877,
625
--
8,17
0,73
2-
-8,
170,
732
-8,
170,
732
Tota
l$
86,0
68,4
77$
3,87
7,62
5$
-$
-$
89,9
46,1
02$
-$
-$
89,9
46,1
02$
-$
89,9
46,1
02
The
anal
ysis
abo
ve e
xclu
des e
quity
inve
stm
ents
.
160

d. Liquidity risk
1) Sources and definition of liquidity risk
Liquidity risk is the risk that the Bank is unable to liquidate assets or obtain loans to meet itsobligations when they fall due as a result of customer deposits being early withdrawn, deterioratingaccess to and terms of interbank facilities, deteriorating delinquency by borrowers, or financialinstruments not easily liquidated. Such outflows would deplete available cash resources for clientlending, trading activities and investments. In extreme circumstances, lack of liquidity couldresult in reductions in the balance sheet and sales of assets, or potentially an inability to fulfilllending commitments. The risk that the Bank will be unable to do so is inherent in all bankingoperations and can be affected by a range of institution-specific and market-wide events including,but not limited to, credit events, merger and acquisition activities, systemic shocks and naturaldisasters, etc.
2) Risk management policies on liquidity risk
include:
a) Day-to-day funding, managed by monitoring future cash flows to ensure that requirements canbe met;
b) Maintaining a portfolio of highly marketable assets that can easily be liquidated as protectionagainst any unforeseen interruption to cash flow;
c) Monitoring the liquidity ratios against internal and regulatory requirements; and
d) Managing the concentration and profile of debt maturities.
Monitoring and reporting take the form of cash flow measurement and projections respectivelyfor the next ten days, one month, two months, etc., to, one year and over one year. Thestarting point for those projections is an analysis of the contractual maturity of the financialliabilities and the expected collection date of the financial assets.
Committee and the Board of Directors.
3) Financial assets held for liquidity risk management purposes
To support payment obligation and contingent funding in a stressed market environment, the Bankholds high-quality highly-liquid interest-earning assets comprising cash and cash equivalent, duefrom the central bank and other banks, securities purchased under resale agreements and financialassets at fair value through profit or loss for which there is an active and liquid market.
4) Maturity analysis of non-derivative financial liabilities
The table below presents the cash flows payable by the Bank under non-derivative financialliabilities by remaining contractual maturities at the date of the consolidated balance sheet.
December 31, 2017 Due in 30 DaysDue Between 31 Days and
90 Days
Due Between 91 Days and
180 Days
Due Between 181 Days and
One Year
Due After One Year Total
Due to the central bank and other banks $ 3,005,470 $ 3,731,384 $ 200,000 $ 23,920 $ - $ 6,960,774Securities sold under repurchase agreement 12,943,304 - - - - 12,943,304Payables 3,487,254 1,270,370 604,546 450,368 675,747 6,488,285Deposits and remittances 193,355,538 85,621,816 64,791,402 105,119,158 23,504,269 472,392,183Bank debentures 1,900 1,617,762 - 3,500,000 15,100,000 20,219,662Settlement coverage bonds payable of short sale 50,241 - - - - 50,241Other financial liabilities 387,530 98,810 318,781 176,168 6,435,486 7,416,775Total $ 213,231,237 $ 92,340,142 $ 65,914,729 $ 109,269,614 $ 45,715,502 $ 526,471,224
161
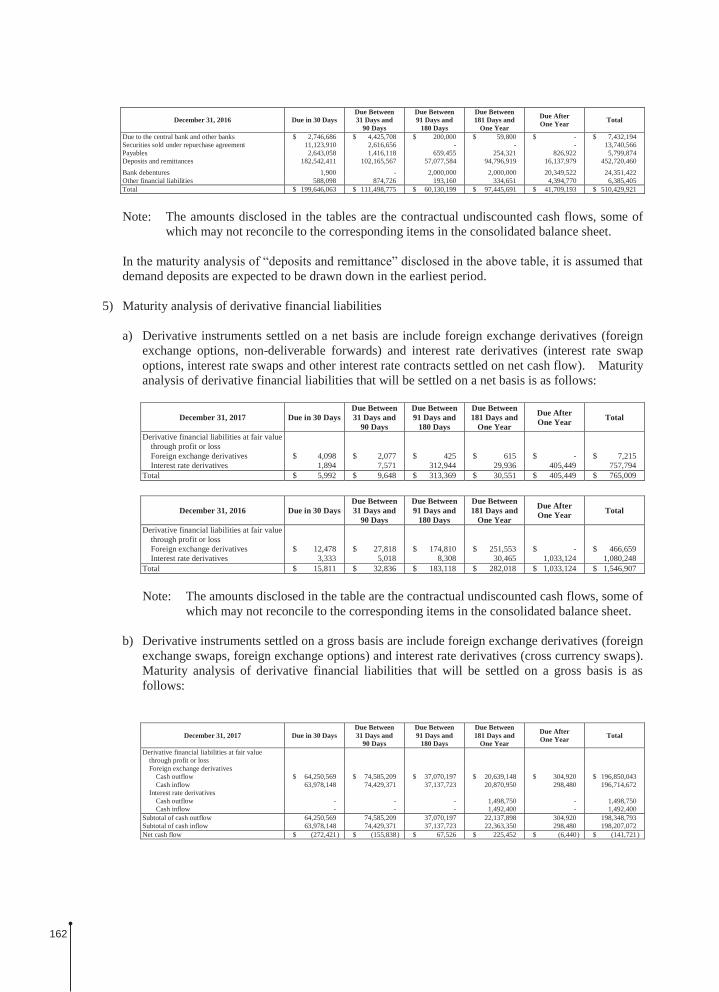
December 31, 2016 Due in 30 DaysDue Between 31 Days and
90 Days
Due Between 91 Days and
180 Days
Due Between 181 Days and
One Year
Due After One Year Total
Due to the central bank and other banks $ 2,746,686 $ 4,425,708 $ 200,000 $ 59,800 $ - $ 7,432,194Securities sold under repurchase agreement 11,123,910 2,616,656 - - - 13,740,566Payables 2,643,058 1,416,118 659,455 254,321 826,922 5,799,874Deposits and remittances 182,542,411 102,165,567 57,077,584 94,796,919 16,137,979 452,720,460Bank debentures 1,900 - 2,000,000 2,000,000 20,349,522 24,351,422Other financial liabilities 588,098 874,726 193,160 334,651 4,394,770 6,385,405Total $ 199,646,063 $ 111,498,775 $ 60,130,199 $ 97,445,691 $ 41,709,193 $ 510,429,921
Note: The amounts disclosed in the tables are the contractual undiscounted cash flows, some of which may not reconcile to the corresponding items in the consolidated balance sheet.
demand deposits are expected to be drawn down in the earliest period.
5) Maturity analysis of derivative financial liabilities
a) Derivative instruments settled on a net basis are include foreign exchange derivatives (foreignexchange options, non-deliverable forwards) and interest rate derivatives (interest rate swapoptions, interest rate swaps and other interest rate contracts settled on net cash flow). Maturityanalysis of derivative financial liabilities that will be settled on a net basis is as follows:
December 31, 2017 Due in 30 DaysDue Between 31 Days and
90 Days
Due Between 91 Days and
180 Days
Due Between 181 Days and
One Year
Due After One Year Total
Derivative financial liabilities at fair value through profit or lossForeign exchange derivatives $ 4,098 $ 2,077 $ 425 $ 615 $ - $ 7,215Interest rate derivatives 1,894 7,571 312,944 29,936 405,449 757,794
Total $ 5,992 $ 9,648 $ 313,369 $ 30,551 $ 405,449 $ 765,009
December 31, 2016 Due in 30 DaysDue Between 31 Days and
90 Days
Due Between 91 Days and
180 Days
Due Between 181 Days and
One Year
Due After One Year Total
Derivative financial liabilities at fair value through profit or lossForeign exchange derivatives $ 12,478 $ 27,818 $ 174,810 $ 251,553 $ - $ 466,659Interest rate derivatives 3,333 5,018 8,308 30,465 1,033,124 1,080,248
Total $ 15,811 $ 32,836 $ 183,118 $ 282,018 $ 1,033,124 $ 1,546,907
Note: The amounts disclosed in the table are the contractual undiscounted cash flows, some of which may not reconcile to the corresponding items in the consolidated balance sheet.
b) Derivative instruments settled on a gross basis are include foreign exchange derivatives (foreignexchange swaps, foreign exchange options) and interest rate derivatives (cross currency swaps).Maturity analysis of derivative financial liabilities that will be settled on a gross basis is asfollows:
December 31, 2017 Due in 30 DaysDue Between 31 Days and
90 Days
Due Between 91 Days and
180 Days
Due Between 181 Days and
One Year
Due After One Year Total
Derivative financial liabilities at fair value through profit or lossForeign exchange derivatives
Cash outflow $ 64,250,569 $ 74,585,209 $ 37,070,197 $ 20,639,148 $ 304,920 $ 196,850,043Cash inflow 63,978,148 74,429,371 37,137,723 20,870,950 298,480 196,714,672
Interest rate derivativesCash outflow - - - 1,498,750 - 1,498,750Cash inflow - - - 1,492,400 - 1,492,400
Subtotal of cash outflow 64,250,569 74,585,209 37,070,197 22,137,898 304,920 198,348,793Subtotal of cash inflow 63,978,148 74,429,371 37,137,723 22,363,350 298,480 198,207,072Net cash flow $ (272,421) $ (155,838) $ 67,526 $ 225,452 $ (6,440) $ (141,721)
162

December 31, 2016 Due in 30 DaysDue Between 31 Days and
90 Days
Due Between 91 Days and
180 Days
Due Between 181 Days and
One Year
Due After One Year Total
Derivative financial liabilities at fair value through profit or lossForeign exchange derivatives
Cash outflow $ 56,032,969 $ 63,547,444 $ 49,863,855 $ 14,881,606 $ - $ 184,325,874Cash inflow 55,418,258 62,769,823 49,113,462 14,890,720 - 182,192,263
Interest rate derivativesCash outflow - 4,357,665 - 3,744,364 - 8,102,029Cash inflow - 4,313,150 - 3,695,560 - 8,008,710
Subtotal of cash outflow 56,032,969 67,905,109 49,863,855 18,625,970 - 192,427,903Subtotal of cash inflow 55,418,258 67,082,973 49,113,462 18,586,280 - 190,200,973Net cash flow $ (614,711) $ (822,136) $ (750,393) $ (39,690) $ - $ (2,226,930)
Note: The amounts disclosed in the table are the contractual undiscounted cash flows, some of which may not reconcile to the corresponding items in the consolidated balance sheet.
6) Maturity analysis of off-balance sheet items
Maturity analysis of the off-balance sheet items that are requested to pay or realize the guarantee onthe basis of their earliest possible contractual maturity is as follows:
December 31, 2017 Due in 30 DaysDue Between 31 Days and
90 Days
Due Between 91 Days and
180 Days
Due Between 181 Days and One Year
Due After One Year Total
Developed and irrevocable loan commitments $ 12,171,019 $ - $ - $ - $ - $ 12,171,019Irrevocable credit card commitments 171,589,511 - - - - 171,589,511Issued but unused letters of credit 946,129 - - - - 946,129Other guarantees 9,977,989 5,751,100 102,000 200,000 478,300 16,509,389Total $ 194,684,648 $ 5,751,100 $ 102,000 $ 200,000 $ 478,300 $ 201,216,048
December 31, 2016 Due in 30 DaysDue Between 31 Days and
90 Days
Due Between 91 Days and
180 Days
Due Between 181 Days and One Year
Due After One Year Total
Developed and irrevocable loan commitments $ 12,467,686 $ - $ - $ - $ - $ 12,467,686Irrevocable credit card commitments 162,293,437 - - - - 162,293,437Issued but unused letters of credit 461,332 - - - - 461,332Other guarantees 9,531,948 2,117,700 1,090,900 300,000 2,238,200 15,278,748Total $ 184,754,403 $ 2,117,700 $ 1,090,900 $ 300,000 $ 2,238,200 $ 190,501,203
e. Market risk
1) Definition and scope of market risk
Market risk is the risk that unfavorable changes in market prices, such as interest rates, foreignexchange rates, equity prices and commodity priceon- and off-securities, interest rates and foreign exchange rates. Equity investment securities risk positionsinclude stocks listed on TWSE and TPEx and convertible (exchangeable) bonds; interest rate riskpositions include bonds and interest rate derivative instruments, such as fixed and floating interestrate swap; foreign exchange rate risk positions include foreign currencies and related derivativeinstruments, such as spot exchange, forward exchange, foreign currency swap and option.
2) Management policies of market risk
The Bank develops appropriate management process to identify, measure and monitor market risk,and to effectively manage and control credit limits, valuation of profits and losses, sensitivityanalysis and stress tests of each financial instrument position. Besides, the Bank takes appropriatemanagement strategy while facing market risk in its daily operating activities and managementprocesses.
The Bank separates its exposure to market risk between trading and non-trading portfolios, whichare managed, monitored and disclosed by the Risk Management Department. A summary report,including suggestion, is submitted regularly to the Risk Management Committee and the Board ofDirectors.
163

3) Management process of market risk
a) Identification and measurement of market risk
exposurepositions, and then, measures risks on- and off-balance sheet trading positions by examining themovement of the identified risk factors, such as interest rates, stock prices, foreign exchangerates and commodity prices.
nt system also applies sensitivity analysis (DV01, Delta and Vega)or different scenarios analysis to assess value changes of asset portfolios, and performs stresstests, as required by the authority, to measure exceptional losses incurred during extreme, butplausible, conditions.
b) Monitoring and reporting
To fully understand the management of market risk, information for developing market riskmanagement objectives, management of positions and profits and losses, sensitivity analysis andstress tests is submitted regularly to Risk Management Committee and the Board of Directorsby the Risk Management Department. The Bank has explicit management process. Itimposes trading limits and stop loss order on each transaction.
A stop loss order would be executed once a given stop price has been reached; otherwise, thetrading unit should report, including reasons for not executing stop loss order and correspondingremedial action taken, to top management for approval.
4) Management process of interest risk
Interest rate risk is the risk of loss or changes in the fair value resulting from interest ratefluctuations. It includes interest rates related to securities and derivative instruments.
The Bank separates the interest rate risk positions between trading book and banking book.Financial instruments and commodity positions held for trading purpose or to hedge against tradingbook positions are carried in trading book. Positions held for trading purpose are those held withthe intention of profiting from actual or forecast spread. Positions not belonging to trading bookare carried in banking book.
Management of interest rate risk in trading book
a) Management process
To limit the loss within acceptable range, the Bank imposes trading limits and stop loss limitson trading room, traders and commodity; it also imposes monthly maximum loss limit ontrading positions.
b) Valuation methods
Securities are marked-to-market, and the risk of interest rate related derivative instruments aremeasured using DV01 and Vega. Both stop loss limits are controlled on a daily basis.
Management of interest rate risk in banking book
Interest rate risk management of banking book is to improve interest risk management, capital efficiency and business operations.
164

a) Strategies
To improve its capacity to adapt to changes, the Bank measures, manages and hedges changesin its profits and losses and economic values of balance sheet items arising from interest ratefluctuations.
b) Management process
Prior to undertaking interest rates related business, the Bank identifies re-pricing and yieldcurve risks, and measures the possible impact of changes in interest rate on profits and losses.The Bank analyzes and monitors position limits and various risk management objectives inrespect of interest rates on a quarterly basis, and the results are submitted regularly to the Assetand Liability Management Committee and the Board of Directors.
If the risk management objectives are found to be in excess of designated limits during themonitoring process, the Bank will report to the Asset and Liability Management Committee andpropose remedial action to be taken.
c) Valuation methods
Interest rate risk measures the re-pricing risk arising from different maturity or re-pricing datesof assets and liabilities carried in the banking book. To stabilize long-term profitability takinginto account business growth, the Bank sets up various monitoring indexes, such as the ratio ofinterest rate sensitivity gap over total assets, for key holding periods. Those indexes arereported to and reviewed by management periodically.
5) Management of foreign exchange risk
a) Definition of foreign exchange risk
Foreign exchange risk is the risk of loss or changes in fair value arising from open positions incurrency due to exchange rate fluctuations. Foreign exchange transactions include spotexchange, forward exchange, non-deliverable forward and foreign currency option betweenNew Taiwan dollars and a foreign currency or between two foreign currencies.
b) Foreign exchange risk management policies, process and valuation methods
To manage foreign exchange risk and limit the loss within acceptable range, the Bank imposestrading limits and stop loss limits on trading room, traders and commodity; it also imposesmonthly maximum loss limit on trading positions. Spot exchange, forward exchange,non-deliverable forward and foreign currency option are controlled collectively using Delta;foreign currency option is controlled using Vega. The stop loss limits are controlled on a dailybasis.
6) Management of equity securities market risk
a) Definition of equity market risk
Equity market risk is the risk arising from open positions in equity securities as a result offluctuations in the market prices of individual securities.
b) Management processes of equity market risk
The Bank sets gross limits on overall positions, by industries, and by groups. For stock listedon TWSE and TPEx and beneficiary certificates, the Bank sets the limit of investment in eachstock and stop loss/gain limits on overall and particular positions, which are monitored daily.
165

A stop loss/gain order would be executed once a given stop price has been reached; otherwise, traders should report to the manager of its department, including reasons for not executing stop loss/gain order.
c) Measurement
The Bank manages market risk on the basis of closing prices of equity securities.
7) Valuation techniques of market risk
a) Stress tests
Stress tests are performed by the Risk Management Department at least once a year to assess theimpact of risk factors that have become extremely volatile on asset portfolios and risk tolerance,and to ensure that the Bank will be able to handle potential losses incurred during extreme, butplausible, events.
The Bank applies market risk factors sensitivity analysis to analyze the impact on asset thatcould arise under extreme scenarios:
i. Interest rate: Evaluate impacts on the values of interest-rate-based securities if yieldcurves move in parallel manner.
ii. Foreign exchange: Evaluate impacts on changes in foreign exchange rates.
iii. Equity securities: Evaluate impacts on volatility of changes in stock prices and its relatedderivatives.
iv. Commodity: Evaluate impacts on volatility of changes in commodity prices and its relatedderivatives.
The Bank will submit the results of stress tests to the Board of Directors and Risk Management Committee as a reference o
b) Sensitivity analysis
i. Interest rate risk
impact on the discounted future cash flows of bonds and interest-rate-based derivative
Assuming all other variables remain constant, where the interest rate increases/decreases by1 bps, there would be an increase/decrease of $1,853 thousand in income before income taxfor the year ended December 31, 2017. There would be an increase of $733 thousand anda decrease of $1,083 thousand for the year ended December 31, 2016. There would be adecrease/increase of $12,268 thousand and $6,318 thousand in other comprehensive incomefor the years ended December 31, 2017 and 2016, respectively.
ii. Foreign exchange risk
the impact on the values of foreign exchange positions for a 1% change in foreign exchangerates.
166

Where the foreign exchange increases/decreases by 1%, assuming all other variables remain constant, there would be an increase/decrease of $374,288 thousand in income before income tax for the year ended December 31, 2017. There would be an increase of 510,749 thousand and a decrease of $510,924 thousand for the year ended December 31, 2016, respectively.
iii. Equity securities market risk
Equity securities market factor sensitivity measured at the balance sheet date is the impacton the values of open positions in equity securities for a 1% change in stock market prices.
Where the securities prices increases/decreases by 1%, assuming all other variables remainconstant, there would be an increase/decrease of $60,783 thousand in income before incometax for the year ended December 31, 2017. There would be an increase of $156,397thousand and a decrease of $156,572 thousand in income before income tax for the yearended December 31, 2016, respectively. There would be an increase/decrease of $7,587thousand and $4,500 thousand in other comprehensive income for the years endedDecember 31, 2017 and 2016.
8) Concentration of foreign exchange risk
Information on concentration of foreign currency exposures at the balance sheet date is shown inNote 41.
f. Transfer of financial assets
In the daily transactions of the Bank, most of the transferred financial assets not eligible forderecognition in full are notes and bonds under repurchase agreement. The cash flows of thosefinancial assets have been transferred to outsiders and the liabilities of repurchasing the transferredfinancial assets in an agreed amount have been recognized. The Bank is not eligible to conduct, sell,or pledge the transferred financial assets during the effective period. However, the Bank is stillexposed to interest rate risks and credit risks. As a result, the transferred financial assets are notderecognized. The following tables show the transferred financial assets not eligible for derecognitionin full and related amounts.
Types of Financial Assets
Book Value of Transferred
Financial Assets
Book Value of Related
Financial Liabilities
Fair Value of Transferred
Financial Assets
Fair Value of Related
Financial Liabilities
Net Position of Fair Value
Available-for-sale financial assets -transactions under repurchase agreements
December 31, 2017 $ 13,528,971 $ 12,921,364 $ 13,528,971 $ 12,921,364 $ 607,607December 31, 2016 $ 14,373,956 $ 13,711,223 $ 14,373,956 $ 13,711,223 $ 662,733
167

g. Disclosures required by the Regulations Governing the Preparation of Financial Reports by PublicBanks
1) Asset quality of loans
Nonperforming loans and nonperforming receivables of the Bank
Item
Business
December 31, 2017
Nonperforming Loans (Note a) Loans
Ratio of Nonperforming Loans (Note b)
Allowance for Possible Losses
CoverageRatio
(Note c)Corporate
BankingSecured 323,017 49,671,241 0.65% 647,700 200.52%Unsecured 145,293 96,610,855 0.15% 1,284,894 884.35%
Consumer Banking
Residential mortgage (Note d) 209,669 118,290,563 0.18% 1,826,450 871.11%Cash card - - - - -Small-scale credit loan (Note e) 207,115 20,109,172 1.03% 363,383 175.45%
Others (Note f) Secured 132,177 66,382,552 0.20% 710,877 537.82%Unsecured 2,634 4,876,236 0.05% 50,553 1,919.24%
Total 1,019,905 355,940,619 0.29% 4,883,857 478.85%Item
Business
Nonperforming Receivables
Accounts Receivable
Ratio of Nonperforming
Receivables
Allowance for Possible Losses
CoverageRatio
Credit card 46,132 14,786,253 0.31% 471,468 1,022.00%Accounts receivable factored without
recourse (Note g) - 4,646,743 - 58,061 -
Item
Business
December 31, 2016
Nonperforming Loans (Note a) Loans
Ratio of Nonperforming Loans (Note b)
Allowance for Possible Losses
CoverageRatio
(Note c)Corporate
BankingSecured 232,624 52,092,197 0.45% 707,670 304.21%Unsecured 7,586 108,892,478 0.01% 1,494,077 19,695.18%
Consumer Banking
Residential mortgage (Note d) 124,823 115,886,536 0.11% 1,778,829 1,425.08%Cash card - - - - -Small-scale credit loan (Note e) 216,964 17,910,918 1.20% 349,910 161.28%
Others (Note f) Secured 108,461 62,490,311 0.17% 663,803 612.02%Unsecured 2,227 3,723,056 0.06% 37,535 1,685.45%
Total 692,685 360,995,496 0.19% 5,031,824 726.42%Item
Business
Nonperforming Receivables
Accounts Receivable
Ratio of Nonperforming
Receivables
Allowance for Possible Losses
CoverageRatio
Credit card 52,803 14,551,297 0.36% 503,715 953.95%Accounts receivable factored without
recourse (Note g) - 3,919,067 - 46,292 -
Note a: Nonperforming credit cards receivables represent the amounts of nonperforming receivables reported to the authorities and disclosed to the public, as required by the
Note b: Ratio of nonperforming loans: Nonperforming loans ÷ Outstanding loan balance.
Ratio of nonperforming credit cards receivables: Nonperforming credit cards receivables ÷ Outstanding credit cards receivables balance.
Note c: Coverage ratio of allowance for possible losses for loans: Allowance for possible losses for loans ÷ Nonperforming loans.
Coverage ratio of allowance for possible losses for credit cards receivables: Allowance for possible losses for credit cards receivables ÷ Nonperforming credit cards receivables.
168
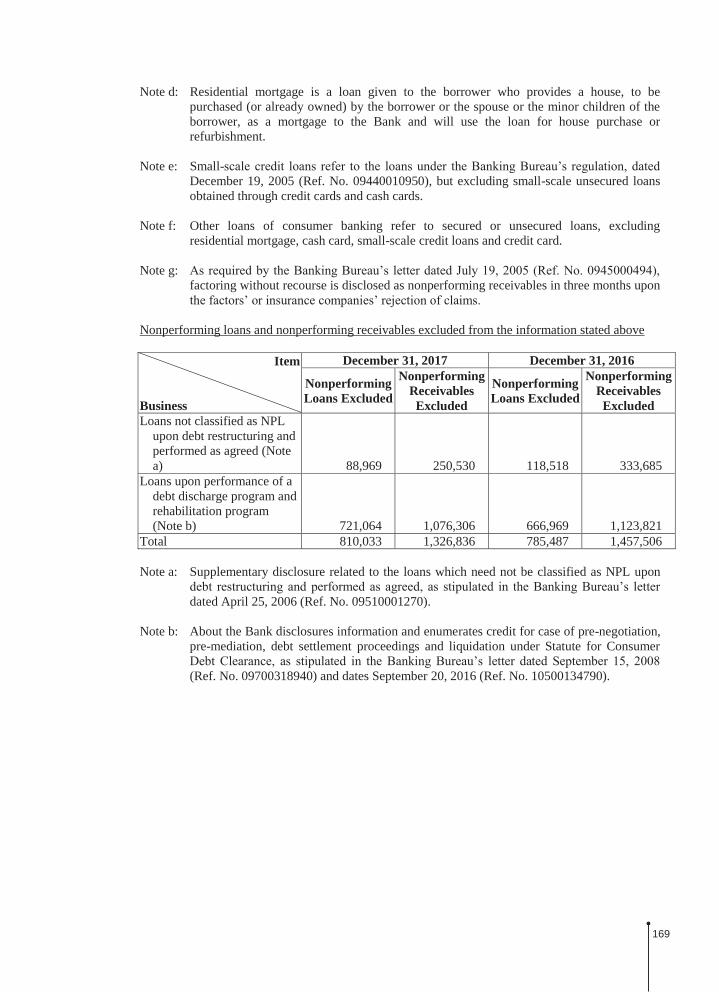
Note d: Residential mortgage is a loan given to the borrower who provides a house, to be purchased (or already owned) by the borrower or the spouse or the minor children of the borrower, as a mortgage to the Bank and will use the loan for house purchase or refurbishment.
Note e: Small-December 19, 2005 (Ref. No. 09440010950), but excluding small-scale unsecured loans obtained through credit cards and cash cards.
Note f: Other loans of consumer banking refer to secured or unsecured loans, excluding residential mortgage, cash card, small-scale credit loans and credit card.
Note g:factoring without recourse is disclosed as nonperforming receivables in three months upon
Nonperforming loans and nonperforming receivables excluded from the information stated above
Item
Business
December 31, 2017 December 31, 2016
Nonperforming Loans Excluded
Nonperforming Receivables Excluded
Nonperforming Loans Excluded
Nonperforming Receivables Excluded
Loans not classified as NPL upon debt restructuring and performed as agreed (Note a) 88,969 250,530 118,518 333,685
Loans upon performance of a debt discharge program and rehabilitation program (Note b) 721,064 1,076,306 666,969 1,123,821
Total 810,033 1,326,836 785,487 1,457,506
Note a: Supplementary disclosure related to the loans which need not be classified as NPL upon
dated April 25, 2006 (Ref. No. 09510001270).
Note b: About the Bank disclosures information and enumerates credit for case of pre-negotiation, pre-mediation, debt settlement proceedings and liquidation under Statute for Consumer
(Ref. No. 09700318940) and dates September 20, 2016 (Ref. No. 10500134790).
169

2) Concentration of credit extensions
Ranking (Note a)
December 31, 2017
Group Entity (Note b)Industry and Code (Note a)
Total Balances of Credit
Extensions(Note c)
Ratio of Credit
Extensions to Net Worth
(%)1 A Group - 6499 - non-categorized and other financial
services$ 4,194,556 10%
2 B Group - 2859 - other household appliances manufacturing
3,614,918 8%
3 C Group - 6496 - private financing industry 3,119,667 7%4 D Group - 3010 - manufacture of motor vehicles 2,743,460 6%5 E Group - 6499 - non-categorized and other financial
services2,655,873 6%
6 F Group - 0850 - manufacture of dairy products 2,566,960 6%7 G Group - 2630 - printed circuit board manufacturing 2,359,822 6%8 H Group - 4210 - ocean freight transportation
forwarding services2,333,686 5%
9 I Group - 2411 - smelting and refining of iron and steel 2,332,835 5%10 J Group - 6499 - non-categorized and other financial
services2,279,666 5%
Ranking (Note a)
December 31, 2016
Group Entity (Note b)Industry and Code (Note a)
Total Balances of Credit
Extensions(Note c)
Ratio of Credit
Extensions to Net Worth
(%)1 A Group - 6499 - non-categorized and other financial
services$ 3,780,495 9%
2 B Group - 2411 - smelting and refining of iron and steel
3,583,904 9%
3 C Group - 2612 - manufacture of discrete devices 3,486,337 9%4 D Group - 6499 - non-categorized and other financial
services3,141,637 8%
5 E Group - 6499 - non-categorized and other financial services
2,965,126 7%
6 F Group - 6499 - non-categorized and other financial services
2,676,150 7%
7 G Group - 3010 - manufacture of motor vehicles 2,335,580 6%8 H Group - 5232 - ocean freight transportation
forwarding services2,042,985 5%
9 I Group - 6499 - non-categorized and other financial services
1,994,444 5%
10 J Group - 0850 - manufacture of dairy products 1,898,585 5%
170

Note a: The rankings above represent the top 10 corporate entities except for government or state-owned enterprises, based on the total balance of credit extension granted by the Bank. The amount of credit extensions should be disclosed in aggregate for each group entity, the code and industry of which are also required. The industry of the group entities is designated as the industry of the individual group entity with the greatest risk exposure. The lines of industry should conform to the industry sub-categorization of the Standard Industrial Classification System of the Republic of China published by the Directorate-General of Budget, Accounting and Statistics under the Executive Yuan.
Note b:
Note c: Credit extension balance includes various loans (import and export negotiations, discounts, overdrafts, unsecured and secured short-term loans, margin loans receivable, unsecured and secured medium-term loans, unsecured and secured long-term loans; and nonaccrual loans), bills purchased, factored accounts receivable without recourse, acceptances and guarantees.
3) Interest rate sensitivity
Table 1: For New Taiwan dollar items
Interest Rate Sensitivity AnalysisDecember 31, 2017
Items 1 to 90 Days 91 to 180 Days 181 Days toOne Year
Over One Year Total
Interest rate-sensitive assets $ 268,141,068 $ 143,810,222 $ 6,514,486 $ 24,444,616 $ 442,910,392Interest rate-sensitive liabilities 139,781,032 157,548,328 82,244,155 19,628,693 399,202,208Interest rate sensitivity gap 128,360,036 (13,738,106 ) (75,729,669 ) 4,815,923 43,708,184Net worth 42,786,672Ratio of interest rate-sensitive assets to liabilities 110.95%Ratio of interest rate-sensitivity gap to net worth 102.15%
Interest Rate Sensitivity AnalysisDecember 31, 2016
Items 1 to 90 Days 91 to 180 Days 181 Days toOne Year
Over One Year Total
Interest rate-sensitive assets $ 258,717,458 $ 133,530,132 $ 6,469,493 $ 24,469,261 $ 423,186,344Interest rate-sensitive liabilities 140,578,404 135,403,448 74,587,943 28,377,971 378,947,766Interest rate sensitivity gap 118,139,054 (1,873,316) (68,118,450) (3,908,710) 44,238,578Net worth 40,950,877Ratio of interest rate-sensitive assets to liabilities 111.67%Ratio of interest rate-sensitivity gap to net worth 108.03%
Note a: The New Taiwan dollar amounts held by the Bank.
Note b: Interest rate-sensitive assets and liabilities refer to interest-earning assets and interest-bearing liabilities that were affected by interest rate changes.
Note c: Interest rate sensitivity gap = Interest rate-sensitive assets - Interest rate-sensitive liabilities.
Note d: Ratio of interest rate-sensitive assets to liabilities = Interest rate-sensitive assets ÷ Interest rate-sensitive liabilities.
171

Table 2: For U.S. dollar items
Interest Rate Sensitivity AnalysisDecember 31, 2017
(In Thousands of U.S. Dollars)
Items 1 to 90 Days 91 to 180 Days 181 Days toOne Year
Over One Year Total
Interest rate-sensitive assets $ 2,188,090 $ 289,348 $ 6,968 $ 480 $ 2,484,886Interest rate-sensitive liabilities 1,996,952 1,022,244 132,994 - 3,152,190Interest rate sensitivity gap 191,138 (732,896 ) (126,026 ) 480 (667,304 )Net worth 1,433,485Ratio of interest rate-sensitive assets to liabilities 78.83%Ratio of interest rate-sensitivity gap to net worth (46.55%)
Interest Rate Sensitivity AnalysisDecember 31, 2016
(In Thousands of U.S. Dollars)
Items 1 to 90 Days 91 to 180 Days 181 Days toOne Year
Over One Year Total
Interest rate-sensitive assets $ 2,017,759 $ 182,359 $ 52,153 $ 12,792 $ 2,265,063Interest rate-sensitive liabilities 1,696,474 1,101,851 114,462 54,200 2,966,987Interest rate sensitivity gap 321,285 (919,492) (62,309) (41,408) (701,924)Net worth 1,268,654Ratio of interest rate-sensitive assets to liabilities 76.34%Ratio of interest rate-sensitivity gap to net worth (55.33%)
Note a: The total U.S. dollar amounts held by the Bank, excluding contingent assets and liabilities.
Note b: Interest rate-sensitive assets and liabilities refer to interest-earning assets and interest-bearing liabilities that were affected by interest rate changes.
Note c: Interest rate sensitivity gap = Interest rate-sensitive assets - Interest rate-sensitive liabilities.
Note d: Ratio of interest rate-sensitive assets to liabilities = Interest rate-sensitive assets ÷ Interest rate-sensitive liabilities.
4) Profitability
Items For the Year Ended December 31, 2017
For the Year Ended December 31, 2016
Return on total assets Before tax 0.57% 0.69%After tax 0.50% 0.59%
Return on equity Before tax 7.80% 9.55%After tax 6.82% 8.12%
Net income ratio 27.39% 30.18%
Note a: Return on total assets = Income before (after) income tax ÷ Average total assets.
Note b: Return on equity = Income before (after) income tax ÷ Average equity.
Note c: Net income ratio = Income after income tax ÷ Total net profit.
172
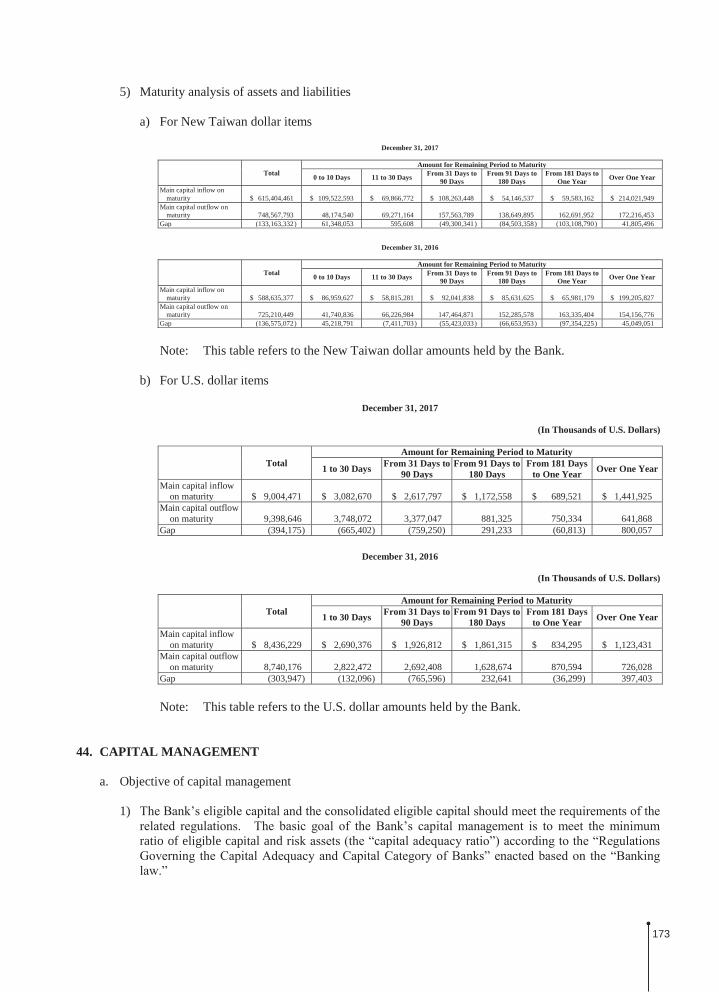
5) Maturity analysis of assets and liabilities
a) For New Taiwan dollar items
December 31, 2017
TotalAmount for Remaining Period to Maturity
0 to 10 Days 11 to 30 Days From 31 Days to 90 Days
From 91 Days to 180 Days
From 181 Days to One Year Over One Year
Main capital inflow on maturity $ 615,404,461 $ 109,522,593 $ 69,866,772 $ 108,263,448 $ 54,146,537 $ 59,583,162 $ 214,021,949
Main capital outflow onmaturity 748,567,793 48,174,540 69,271,164 157,563,789 138,649,895 162,691,952 172,216,453
Gap (133,163,332) 61,348,053 595,608 (49,300,341) (84,503,358) (103,108,790) 41,805,496
December 31, 2016
TotalAmount for Remaining Period to Maturity
0 to 10 Days 11 to 30 Days From 31 Days to 90 Days
From 91 Days to 180 Days
From 181 Days to One Year Over One Year
Main capital inflow on maturity $ 588,635,377 $ 86,959,627 $ 58,815,281 $ 92,041,838 $ 85,631,625 $ 65,981,179 $ 199,205,827
Main capital outflow on maturity 725,210,449 41,740,836 66,226,984 147,464,871 152,285,578 163,335,404 154,156,776
Gap (136,575,072) 45,218,791 (7,411,703) (55,423,033) (66,653,953) (97,354,225) 45,049,051
Note: This table refers to the New Taiwan dollar amounts held by the Bank.
b) For U.S. dollar items
December 31, 2017
(In Thousands of U.S. Dollars)
TotalAmount for Remaining Period to Maturity
1 to 30 Days From 31 Days to 90 Days
From 91 Days to 180 Days
From 181 Days to One Year Over One Year
Main capital inflow on maturity $ 9,004,471 $ 3,082,670 $ 2,617,797 $ 1,172,558 $ 689,521 $ 1,441,925
Main capital outflow on maturity 9,398,646 3,748,072 3,377,047 881,325 750,334 641,868
Gap (394,175) (665,402) (759,250) 291,233 (60,813) 800,057
December 31, 2016
(In Thousands of U.S. Dollars)
TotalAmount for Remaining Period to Maturity
1 to 30 Days From 31 Days to 90 Days
From 91 Days to 180 Days
From 181 Days to One Year Over One Year
Main capital inflow on maturity $ 8,436,229 $ 2,690,376 $ 1,926,812 $ 1,861,315 $ 834,295 $ 1,123,431
Main capital outflow on maturity 8,740,176 2,822,472 2,692,408 1,628,674 870,594 726,028
Gap (303,947) (132,096) (765,596) 232,641 (36,299) 397,403
Note: This table refers to the U.S. dollar amounts held by the Bank.
44. CAPITAL MANAGEMENT
a. Objective of capital management
1)
ratio of eligible capital and
173

2) In order to maintain an adequate level of capital to bear various risks, the Bank makes capitalplanning based on the operating plans and budget, the development strategies, dividend policy andstress tests and forecasts of capital adequacy which are approved by the board of directors. Theobjective is to optimize assets allocation and strengthen capital structure.
b. Procedure of capital management
1)
Commission and the related information is reported to the competent authority on a regular basis.
2) In order to monitor capital adequacy ratio, the execution and changes in the parameters of theand Liabilities Management
and whether the objective of capital management is met.
The calculations of eligible capital, risk-weighted assets and capital adequacy ratio were as follows:
December 31, 2017The Bank Consolidation
Eligible capital
Ordinary equity $ 39,236,233 $ 39,698,325Other Tier I capital - -Tier II capital 11,680,665 12,185,406Total eligible capital 50,916,898 51,883,731
Risk-weighted assets
Credit riskStandardized approach 320,791,287 322,187,276Internal rating-based approach - -Asset securitization - -
Operational risk
Basic indicator approach 19,112,088 19,646,350Standardized approach/alternative
standardized approach - -
Advanced measurement approach - -
Market risk Standardized approach 14,948,088 14,948,088Internal models approach - -
Total risk-weighted assets 354,851,463 356,781,714Capital adequacy ratio 14.35% 14.54%Ratio of ordinary equity to risk-weighted assets 11.06% 11.13%Ratio of Tier I capital to risk-weighted assets 11.06% 11.13%Leverage ratio 6.06% 6.12%
174

December 31, 2016The Bank Consolidation
Eligible capital
Ordinary equity $ 37,403,214 $ 38,122,066Other Tier I capital - -Tier II capital 14,218,654 14,947,886Total eligible capital 51,621,868 53,069,952
Risk-weighted assets
Credit riskStandardized approach 356,944,620 358,837,133Internal rating-based approach - -Asset securitization - -
Operational risk
Basic indicator approach 19,249,288 19,910,475Standardized approach/alternative
standardized approach - -
Advanced measurement approach - -
Market risk Standardized approach 16,796,650 16,796,650Internal models approach - -
Total risk-weighted assets 392,990,558 395,544,258Capital adequacy ratio 13.14% 13.42%Ratio of ordinary equity to risk-weighted assets 9.52% 9.64%Ratio of Tier I capital to risk-weighted assets 9.52% 9.64%Leverage ratio 5.87% 5.97%
Note a: Eligible capital, risk-weighted assets and risk-exposure assets are calculated under the
for Calculating the Eligible Capital and Risk-November 26, 2012.
Note b: An annual report should inbut a semiannual report should include the capital adequacy ratio of the most recent year.
Note c: Formulas used were as follows:
1) Eligible capital = Ordinary equity + Other Tier I capital + Tier II capital.
2) Total risk-weighted assets = Risk-weighted assets for credit risk + (Capital requirements foroperational risk and market risk) × 12.5.
3) Capital adequacy ratio = Eligible capital/Total risk-weighted assets.
4) Ratio of Ordinary equity to risk-weighted assets = Ordinary equity/Total risk-weighted assets.
5) Ratio of Tier I capital to risk-weighted assets = (Ordinary equity + Other Tier I capital)/Totalrisk-weighted assets.
6) Leverage ratio = Tier I capital/Risk-exposure Assets.
45. SEGMENT INFORMATION
allocation and segment performance assessment focuses on nature of operation and profits. Based on IFRS 8 -
a. Individual banking: Mainly includes consumer banking loans such as mortgages, credit loans, carloans, installment, etc.; credit cards; individual deposits; and wealth management;
175

b. Corporate banking: Mainly includes corporate-related business, foreign-currency business andfinancial market business;
c. Others: Any business not included in individual and corporate banking.
The accounting policies of the reportable segments are the same as those stated in Note 4 to the consolidated financial reports.
Segment Income and Operating Results
The income and operating results of the reportable segments of the Bank and its subsidiaries were as follows:
Individual Banking
Corporate Banking
(Including Overseas Branches) Others Total
For the year ended December 31, 2017
Net interests $ 4,361,617 $ 2,579,276 $ (1,536,019) $ 5,404,874Net revenues other than interest
Net service fee income 2,225,487 691,003 235,837 3,152,327Other net income 291,567 1,441,747 129,741 1,863,055
Consolidated net revenues 6,878,671 4,712,026 (1,170,441) 10,420,256Provision for possible losses (112,037) (616,342) (3,468) (731,847)Operating expenses (4,763,104) (1,315,019) (342,642) (6,420,765)
Segment income before income tax $ 2,003,530 $ 2,780,665 $ (1,516,551) $ 3,267,644
For the year ended December 31, 2016
Net interests $ 4,383,170 $ 2,660,002 $ (1,258,750) $ 5,784,422Net revenues other than interest
Net service fee income 2,261,564 722,038 213,015 3,196,617Other net income 206,270 1,362,004 198,142 1,766,416
Consolidated net revenues 6,851,004 4,744,044 (847,593) 10,747,455Provision for possible losses (84,787) (362,171) (5,043) (452,001)Operating expenses (4,843,972) (1,285,776) (349,804) (6,479,552)
Segment income before income tax $ 1,922,245 $ 3,096,097 $ (1,202,440) $ 3,815,902
46. ADDITIONAL DISCLOSURES
a. Information about significant transactions:
1) Marketable securities acquired and disposed of at cost or prices at least NT$300 million or 10% ofthe paid-in capital: Nil
2) Acquisition of individual real estate at cost of at least NT$300 million or 10% of the paid-in capital:Nil
3) Disposal of individual real estate at prices of at least NT$300 million or 10% of the paid-in capital:Nil
176

4) Service charge discounts on transactions with related parties in aggregated amount of at least NT$5million: Nil
5) Receivables from related parties amounting to at least NT$300 million or 10% of the paid-incapital: Nil
6) Sale of nonperforming loans: Nil
7) The type and related information of any securitization product that has been approved in accordancewith the Financial Asset Securitization Act or the Real Estate Securitization Act: Nil
8) Intercompany relationships and significant intercompany transactions: Table 1 (attached)
9) Other significant transactions which may have effects on decision making of financial statementusers: Nil
b. Information of subsecurities held, marketable securities acquired and disposed of at cost or prices at least NT$300 millionor 10% of the paid-in capital and derivative transactions: Table 2 (attached)
c. Related information of investees on which the Bank and its subsidiaries exercises significant influence:Table 3 (attached)
d. Information about branches and investments in mainland China: Table 4 (attached)
177

TAB
LE 1
FAR
EA
STER
N IN
TER
NA
TIO
NA
LBA
NK
LTD
. AN
D S
UBS
IDIA
RIE
S
INTE
RC
OM
PAN
Y R
ELA
TIO
NSH
IPS
AN
D S
IGN
IFIC
AN
T IN
TER
CO
MPA
NY
TR
AN
SAC
TIO
NS
FOR
TH
E Y
EAR
EN
DED
DEC
EMB
ER 3
1, 2
017
(In
Tho
usan
ds o
f New
Tai
wan
Dol
lars
)
No.
(Not
e a)
Com
pany
Nam
eC
ount
erpa
rty
Flow
of T
rans
actio
n
Tra
nsac
tion
Det
ails
Fina
ncia
l Sta
tem
ent A
ccou
ntA
mou
ntT
erm
s
Perc
enta
ge o
f C
onso
lidat
edN
et P
rofit
or
Con
solid
ated
To
tal A
sset
s (N
ote
b)
0Fa
r Eas
tern
Inte
rnat
iona
l Ban
k Lt
d.Fa
r Eas
tern
Ass
et M
anag
emen
t Co.
, Ltd
.Fr
om p
aren
t com
pany
to su
bsid
iary
Dep
osits
and
rem
ittan
ces
$14
,553
Not
e c
-Fa
r Eas
tern
Inte
rnat
iona
l Sec
uriti
es C
o., L
td.
From
par
ent c
ompa
ny to
subs
idia
ryD
epos
its a
nd re
mitt
ance
s21
4,37
8N
ote
c0.
03
1Fa
r Eas
tern
Ass
et M
anag
emen
t Co.
, Ltd
.Fa
r Eas
tern
Inte
rnat
iona
l Ban
k Lt
d.Fr
om su
bsid
iary
to p
aren
t com
pany
Cas
h an
d ca
sh e
quiv
alen
ts
14,5
53N
ote
c-
2Fa
r Eas
tern
Inte
rnat
iona
l Sec
uriti
es C
o., L
td.
Far E
aste
rn In
tern
atio
nal B
ank
Ltd.
From
subs
idia
ry to
par
ent c
ompa
nyC
ash
and
cash
equ
ival
ents
21
4,37
8N
ote
c 0.
03
Not
e a:
Tran
sact
ing
parti
es a
re id
entif
ied
as fo
llow
s:
Num
ber 0
-pa
rent
com
pany
; and
num
ber 1
and
the
follo
win
g nu
mbe
rs -
subs
idia
ries.
Not
e b:
The
ratio
is c
alcu
late
d as
follo
ws:
Fo
r ass
et a
nd li
abili
ty a
ccou
nts =
Tra
nsac
tion
amou
nt/C
onso
lidat
ed to
tal a
sset
s; a
nd fo
r inc
ome
and
expe
nses
= T
rans
actio
n am
ount
/Con
solid
ated
net
pro
fit.
Not
e c:
The
term
s of i
nter
com
pany
tran
sact
ions
are
not
sign
ifica
ntly
diff
eren
t fro
m th
ose
to th
ird p
artie
s.
178

TA
BL
E 2
FAR
EA
STER
N IN
TER
NA
TIO
NA
L BA
NK
LT
D. A
ND
SU
BSID
IAR
IES
FOR
TH
E Y
EAR
EN
DED
DE
CEM
BER
31,
201
7(I
n T
hous
ands
of N
ew T
aiw
an D
olla
rs, I
n T
hous
and
Shar
es)
No.
(Not
e 1)
Lend
erB
orro
wer
Fina
ncia
l St
atem
ent
Acc
ount
Rel
ated
Pa
rtie
s
Hig
hest
B
alan
ce fo
r th
e Pe
riod
End
ing
Bal
ance
Act
ual
Bor
row
ing
Am
ount
Inte
rest
Rat
eN
atur
e of
Fi
nanc
ing
(Not
e 2)
Bus
ines
s T
rans
actio
n A
mou
nt
Rea
sons
for
Shor
t-te
rm
Fina
ncin
g
Allo
wan
ce fo
r Im
pair
men
t L
oss
Col
late
ral
Fina
ncin
g Li
mit
for
Each
B
orro
wer
(Not
e 3)
Agg
rega
te
Fina
ncin
g L
imit
(Not
e 3)
Item
Val
ue
1FE
IB F
inan
cial
Le
asin
g C
o., L
td.
A c
ompa
nyO
ther
rece
ivab
les
No
$13
7,31
0$
137,
310
$12
0,65
06%
-10%
a$
4,11
9-
$1,
207
Rea
l est
ate
$30
9,84
0$
300,
227
$30
0,22
7
B c
ompa
nyO
ther
rece
ivab
les
No
27,4
6227
,462
27,4
626%
-10%
a82
4-
275
Rea
l est
ate
52,4
4830
0,22
730
0,22
7
C c
ompa
nyO
ther
rece
ivab
les
No
27,4
6227
,462
27,4
626%
-10%
a82
4-
275
Stoc
k38
8,34
930
0,22
730
0,22
7
Not
e 1:
No.
col
umn
is c
oded
as f
ollo
ws:
a. b.
Not
e 2:
The
natu
re o
f fin
anci
ng is
des
crib
ed a
s fol
low
s:
a.B
usin
ess t
rans
act
b.Sh
ort-
Not
e 3:
The
limits
on
finan
cing
are
as f
ollo
ws:
a.Fi
nanc
ing
limit
for e
ach
borr
ower
1)In
the
case
of l
endi
ng fu
nds t
o co
mpa
nies
or f
irms w
ho h
ave
a bu
sines
s rel
atio
nshi
p w
ith th
e le
nder
, the
tota
l len
ding
am
ount
to a
n in
divi
dual
bor
row
er sh
all n
ot e
xcee
d tw
o tim
es o
f the
net
val
ue o
f the
lend
er a
s sho
wn
in th
e la
test
fina
ncia
l rep
ort a
udite
d or
revi
ewed
by
a C
PA.
2)In
the
case
of l
endi
ng fu
nds t
o th
e co
mpa
nies
or f
irms i
n ne
ed o
f sho
rt-te
rm fi
nanc
ing,
the
tota
l len
ding
am
ount
to a
n in
divi
dual
bor
row
er sh
all n
ot e
xcee
d 40
% o
f the
net
val
ue o
f the
lend
er a
s sho
wn
in th
ela
test
fina
ncia
l rep
ort a
udite
d or
revi
ewed
by a
CPA
.
b.A
ggre
gate
fina
ncin
g lim
it
1)In
the
case
of l
endi
ng fu
nds t
o co
mpa
nies
or f
irms w
ho h
ave
a bu
sines
s rel
atio
nshi
p w
ith th
e le
nder
, the
tota
l acc
umul
atio
n le
ndin
g am
ount
to a
n in
divi
dual
bor
row
er sh
all n
ot e
xcee
d tw
o tim
es o
f the
net
val
ue o
f the
lend
er a
s sho
wn
in th
e la
test
fina
ncia
l rep
ort a
udite
d or
revi
ewed
by
a C
PA.
2)In
the
case
of l
endi
ng fu
nds t
o th
e co
mpa
nies
or f
irms i
n ne
ed o
f sho
rt-te
rm fi
nanc
ing,
the
tota
l acc
umul
atio
n le
ndin
g am
ount
to a
n in
divi
dual
bor
row
er sh
all n
ot e
xcee
d 40
% o
f the
net
val
ue o
f the
lend
er a
s sho
wn
in th
e la
test
fina
ncia
l rep
ort a
udite
d or
revi
ewed
by
a C
PA.
179

TA
BL
E 3
FAR
EA
STER
N IN
TER
NA
TIO
NA
L BA
NK
LT
D. A
ND
SU
BSID
IAR
IES
RE
LA
TE
D IN
FOR
MA
TIO
N O
F IN
VE
STE
ES
DE
CE
MB
ER
31,
201
7(I
n T
hous
ands
of N
ew T
aiw
an D
olla
rs)
Inve
stee
Com
pany
Loc
atio
nM
ain
Bus
ines
s and
Pro
duct
Perc
enta
ge
of
Ow
ners
hip
(%)
Car
ryin
g A
mou
nt
Inve
stm
ent
Inco
me
(Los
s)
Rec
ogni
zed
The
Pro
port
iona
te S
hare
of t
he B
ank,
Its S
ubsi
diar
ies a
nd
Thei
r A
ffilia
tes i
n In
vest
ees
Not
ePr
esen
t Sha
res
(In
Tho
usan
ds)
Pro
Form
a Sh
ares
Tot
al
Shar
es(I
n T
hous
ands
)
Perc
enta
ge
of
Ow
ners
hip
(%)
Hel
d by
the
Ban
k
Fina
ncia
l bus
ines
sD
euts
che
Far E
aste
rn A
sset
Man
agem
ent C
o.,
Ltd.
7F
, No.
207
Dun
Hw
a So
uth
Roa
d, S
ec. 2
, Tai
pei,
Taiw
anSe
curit
ies i
nves
tmen
t tru
st fu
nds
40.0
0$
127,
511
$74
912
,000
-12
,000
40.0
0
Dah
Chu
ng B
ills F
inan
ce C
orp.
4F, 4
F-1,
4F-
2, 4
F-3,
Np.
88
Dun
Hw
a N
orth
Roa
d, T
aipe
i, Ta
iwan
Und
erw
ritin
g, d
ealin
g an
d br
oker
ing
of sh
ort-t
erm
bill
s22
.06
1,64
6,55
510
2,58
899
,440
-99
,440
22.0
7
Far E
aste
rnA
sset
Man
agem
ent C
o., L
td.
Roo
m B
, 17F
, No.
207
, Dun
Hw
a So
uth
Road
, Sec
. 2, T
aipe
i, Ta
iwan
right
s to
finan
cial
inst
itutio
ns10
0.00
663,
679
36,1
1012
0,00
0-
120,
000
100.
00
Far E
aste
rn In
tern
atio
nal S
ecur
ities
Co.
, Ltd
.51
F, N
o. 7
, Xin
yi R
oad,
Sec
. 5, T
aipe
i, Ta
iwan
Fore
ign
secu
ritie
s bro
ker,
wea
lth m
anag
emen
t and
offs
hore
fu
nd c
onsu
lting
100.
0032
1,16
180
,988
20,0
00-
20,0
0010
0.00
Taip
ei F
orei
gn E
xcha
nge
Age
ncy
Co.
, Ltd
.8F
., N
o. 4
00, B
ade
Roa
d, S
ec. 2
, Tai
pei,
Taiw
anFo
reig
n ex
chan
ge, c
ross
-cur
renc
y sw
aps,
etc.
0.
4080
0-
80-
800.
40
Suns
hine
Ass
et M
anag
emen
t Co.
, Ltd
.15
F., N
o. 2
18, D
un H
wa
Sout
h Ro
ad, S
ec. 2
, Tai
pei,
Taiw
anM
anag
emen
t of c
rede
tect
ive
serv
ices
3.46
2,07
3-
207
-20
73.
46
Fina
ncia
l Inf
orm
atio
n Se
rvic
e C
o., L
td.
No.
81,
Kan
gnin
g R
oad,
Sec
. 3, T
aipe
i, Ta
iwan
Dat
a pr
oces
sing
serv
ice
and
elec
troni
c in
form
atio
n su
pply
1.14
45,5
00-
5,93
8-
5,93
81.
14
Yua
n H
sin
Dig
ital P
aym
ent C
o., L
td.
Roo
m A
, 5F.
, No.
1, Y
uand
ong
Roa
d, B
anqi
ao D
ist.,
New
Ta
ipei
City
, Tai
wan
Is
suin
g el
ectro
nic
ticke
ts a
nd si
gnin
g co
ntra
cted
inst
itutio
ns4.
9962
,263
-6,
226
-6,
226
4.99
Non
finan
cial
bus
ines
sA
n Fe
ng E
nter
pris
e C
o., L
td.
3F.,
No.
139
, Jhe
ngjh
ou R
oad,
Tai
pei,
Taiw
anA
TM m
aint
enan
ce, r
epla
cem
ent a
nd re
pair
10.0
03,
000
-30
0-
300
10.0
0
Hel
d by
Far
Eas
tern
Ass
et M
anag
emen
tCo.
, Ltd
.
Fina
ncia
l bus
ines
sFE
IB F
inan
cial
Lea
sing
Co.
, Ltd
.R
oom
280
6, T
ower
1,G
rand
Gat
eway
66,
No.
1 H
ong
Qia
o R
oad,
Xuh
ui D
istri
ct, S
hang
hai,
Chi
naLe
asin
g op
erat
ion
100.
0030
0,22
719
,461
N/A
-N
/A10
0.00
180
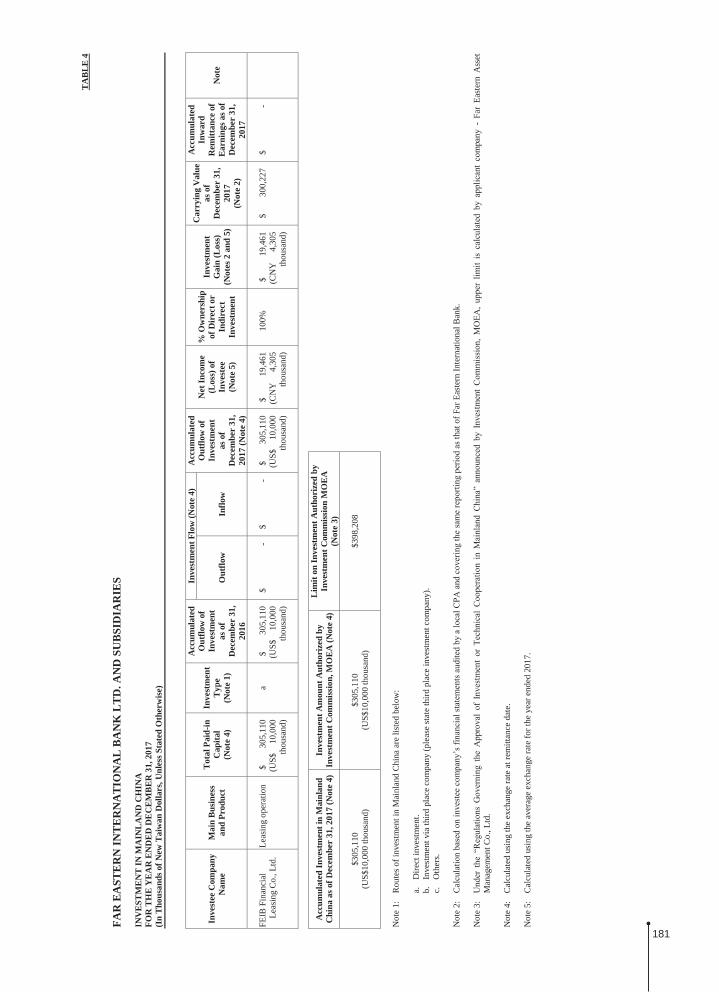
TAB
LE 4
FAR
EA
STER
N IN
TER
NA
TIO
NA
L BA
NK
LTD
. AN
D S
UBS
IDIA
RIE
S
INV
ESTM
ENT
IN M
AIN
LAN
D C
HIN
AFO
R T
HE
YEA
R E
ND
ED D
ECEM
BER
31,
201
7(I
n T
hous
ands
of N
ew T
aiw
an D
olla
rs, U
nles
s Sta
ted
Oth
erw
ise)
Inve
stee
Com
pany
N
ame
Mai
n B
usin
ess
and
Prod
uct
Tota
l Pai
d-in
C
apita
l(N
ote
4)
Inve
stm
ent
Type
(Not
e 1)
Acc
umul
ated
O
utflo
w o
f In
vest
men
tas
of
Dec
embe
r 31
, 20
16
Inve
stm
ent F
low
(Not
e 4)
Acc
umul
ated
O
utflo
w o
f In
vest
men
tas
of
Dec
embe
r 31
, 20
17 (N
ote
4)
Net
Inco
me
(Los
s) o
f In
vest
ee(N
ote
5)
% O
wne
rshi
p of
Dir
ect o
r In
dire
ct
Inve
stm
ent
Inve
stm
ent
Gai
n (L
oss)
(N
otes
2 a
nd 5
)
Car
ryin
g V
alue
as
of
Dec
embe
r 31
, 20
17(N
ote
2)
Acc
umul
ated
In
war
d R
emitt
ance
of
Ear
ning
s as o
f D
ecem
ber
31,
2017
Not
eO
utflo
wIn
flow
FEIB
Fin
anci
al
Leas
ing
Co.
, Ltd
.Le
asin
g op
erat
ion
$30
5,11
0(U
S$10
,000
thou
sand
)
a$
305,
110
(US$
10,0
00th
ousa
nd)
$-
$-
$30
5,11
0(U
S$10
,000
thou
sand
)
$19
,461
(CN
Y4,
305
thou
sand
)
100%
$19
,461
(CN
Y4,
305
thou
sand
)
$30
0,22
7$
-
Acc
umul
ated
Inve
stm
ent i
n M
ainl
and
Chi
na a
s of D
ecem
ber
31,2
017
(Not
e 4)
Inve
stm
ent A
mou
nt A
utho
rize
d by
In
vest
men
t Com
miss
ion,
MO
EA (N
ote
4)
Lim
it on
Inve
stm
ent A
utho
rize
d by
In
vest
men
t Com
miss
ion
MO
EA
(Not
e 3)
$305
,110
(US$
10,0
00 th
ousa
nd)
$305
,110
(US$
10,0
00 th
ousa
nd)
$398
,208
Not
e 1:
Rou
tes o
f inv
estm
ent i
n M
ainl
and
Chi
na a
re li
sted
bel
ow:
a.D
irect
inve
stm
ent.
b.In
vest
men
t via
third
pla
ce c
ompa
ny (p
leas
e st
ate
third
pla
ce in
vest
men
t com
pany
).c.
Oth
ers.
Not
e 2:
Ca
hat o
f Far
Eas
tern
Inte
rnat
iona
l Ban
k.
Not
e 3:
-Fa
r Ea
ster
n A
sset
M
anag
emen
t Co.
, Ltd
.
Not
e 4:
Cal
cula
ted
usin
g th
e ex
chan
ge ra
te a
t rem
ittan
ce d
ate.
Not
e 5:
Cal
cula
ted
usin
g th
e av
erag
e ex
chan
ge ra
te fo
r the
yea
r end
ed 2
017.
181


![[Annual Report] FY2010 Annual Report(FULL)](https://img.dokumen.tips/doc/110x75/58a19c0c1a28abf0428b88ed/annual-report-fy2010-annual-reportfull.jpg)