Embed Size (px)
Citation preview

Sherrill F. Norman, CPA
Auditor General
Report No. 2017-160
March 2017
VALENCIA COLLEGE
For the Fiscal Year Ended
June 30, 2016
Finan
cial Audit

Board of Trustees and President
During the 2015-16 fiscal year, Dr. Sanford C. Shugart served as President of Valencia College and
the following individuals served as Members of the Board of Trustees:
County
Lewis M. Oliver, III, Chair from 9-23-15, Orange
Vice Chair to 9-22-15
Dr. Bruce A. Carlson, Vice Chair Osceola
from 9-23-15
Maria C. Grulich, Chair to 9-22-15 Osceola
John M. Crossman Orange
Guillermo Hansen Osceola
Daisy Lopez-Cid Osceola
Raymer F. Maguire, III Orange
Vacancies a Orange
a Two positions were vacant through 6-30-16.
The Auditor General conducts audits of governmental entities to provide the Legislature, Florida’s citizens, public entity
management, and other stakeholders unbiased, timely, and relevant information for use in promoting government
accountability and stewardship and improving government operations.
The team leader was James H. Cole, CPA, and the audit was supervised by Brenda C. Racis, CPA.
Please address inquiries regarding this report to Jaime N. Hoelscher, CPA, Audit Supervisor, by e-mail at
[email protected] or by telephone at (850) 412-2868.
This report and other reports prepared by the Auditor General are available at:
www.myflorida.com/audgen
Printed copies of our reports may be requested by contacting us at:
State of Florida Auditor General
Claude Pepper Building, Suite G74 ∙ 111 West Madison Street ∙ Tallahassee, FL 32399-1450 ∙ (850) 412-2722

VALENCIA COLLEGE
TABLE OF CONTENTS
Page No.
SUMMARY ........................................................................................................................................... i
INDEPENDENT AUDITOR’S REPORT ................................................................................................ 1
Report on the Financial Statements ................................................................................................. 1
Other Reporting Required by Government Auditing Standards ....................................................... 2
MANAGEMENT’S DISCUSSION AND ANALYSIS .............................................................................. 4
BASIC FINANCIAL STATEMENTS
Statement of Net Position ................................................................................................................ 14
Statement of Revenues, Expenses, and Changes in Net Position .................................................. 16
Statement of Cash Flows ................................................................................................................. 18
Notes to Financial Statements ......................................................................................................... 20
OTHER REQUIRED SUPPLEMENTARY INFORMATION
Schedule of Funding Progress – Other Postemployment Benefits Plan .......................................... 43
Schedule of the College’s Proportionate Share of the Net Pension Liability – Florida Retirement System Pension Plan ................................................................................................... 43
Schedule of College Contributions – Florida Retirement System Pension Plan .............................. 44
Schedule of the College’s Proportionate Share of the Net Pension Liability – Health Insurance Subsidy Pension Plan.... ................................................................................................ 44
Schedule of College Contributions – Health Insurance Subsidy Pension Plan ................................ 44
Notes to Required Supplementary Information ................................................................................ 45
INDEPENDENT AUDITOR’S REPORT ON INTERNAL CONTROL OVER FINANCIAL REPORTING AND ON COMPLIANCE AND OTHER MATTERS BASED ON AN AUDIT OF FINANCIAL STATEMENTS PERFORMED IN ACCORDANCE WITH GOVERNMENT AUDITING STANDARDS ................................................ 46
Internal Control Over Financial Reporting ........................................................................................ 46
Compliance and Other Matters ........................................................................................................ 47
Purpose of this Report ..................................................................................................................... 47

Report No. 2017-160 March 2017 Page i
SUMMARY
SUMMARY OF REPORT ON FINANCIAL STATEMENTS
Our audit disclosed that the basic financial statements of Valencia College (a component unit of the State
of Florida) were presented fairly, in all material respects, in accordance with prescribed financial reporting
standards.
SUMMARY OF REPORT ON INTERNAL CONTROL AND COMPLIANCE
Our audit did not identify any deficiencies in internal control over financial reporting that we consider to
be material weaknesses.
The results of our tests disclosed no instances of noncompliance or other matters that are required to be
reported under Government Auditing Standards issued by the Comptroller General of the United States.
AUDIT OBJECTIVES AND SCOPE
Our audit objectives were to determine whether Valencia College and its officers with administrative and
stewardship responsibilities for College operations had:
Presented the College’s basic financial statements in accordance with generally acceptedaccounting principles;
Established and implemented internal control over financial reporting and compliance withrequirements that could have a direct and material effect on the financial statements; and
Complied with the various provisions of laws, rules, regulations, contracts, and grant agreementsthat are material to the financial statements.
The scope of this audit included an examination of the College’s basic financial statements as of and for
the fiscal year ended June 30, 2016. We obtained an understanding of the College’s environment,
including its internal control, and assessed the risk of material misstatement necessary to plan the audit
of the basic financial statements. We also examined various transactions to determine whether they
were executed, in both manner and substance, in accordance with governing provisions of laws, rules,
regulations, contracts, and grant agreements.
An examination of Federal awards administered by the College is included within the scope of our
Statewide audit of Federal awards administered by the State of Florida.
AUDIT METHODOLOGY
We conducted our audit in accordance with auditing standards generally accepted in the United States
of America and applicable standards contained in Government Auditing Standards, issued by the
Comptroller General of the United States.

Report No. 2017-160 March 2017 Page 1
Phone: (850) 412-2722 Fax: (850) 488-6975
Sherrill F. Norman, CPA Auditor General
AUDITOR GENERAL STATE OF FLORIDA Claude Denson Pepper Building, Suite G74
111 West Madison Street Tallahassee, Florida 32399-1450
The President of the Senate, the Speaker of the House of Representatives, and the Legislative Auditing Committee
INDEPENDENT AUDITOR’S REPORT
Report on the Financial Statements
We have audited the accompanying financial statements of Valencia College, a component unit of the
State of Florida, and its discretely presented component unit as of and for the fiscal year ended
June 30, 2016, and the related notes to the financial statements, which collectively comprise the
College’s basic financial statements as listed in the table of contents.
Management’s Responsibility for the Financial Statements
Management is responsible for the preparation and fair presentation of these financial statements in
accordance with accounting principles generally accepted in the United States of America; this includes
the design, implementation, and maintenance of internal control relevant to the preparation and fair
presentation of financial statements that are free from material misstatement, whether due to fraud or
error.
Auditor’s Responsibility
Our responsibility is to express opinions on these financial statements based on our audit. We did not
audit the financial statements of the discretely presented component unit, which represent 100 percent
of the transactions and account balances of the discretely presented component unit’s columns. Those
statements were audited by other auditors whose report has been furnished to us, and our opinion, insofar
as it relates to the amounts included for the discretely presented component unit, is based solely on the
report of the other auditors. We conducted our audit in accordance with auditing standards generally
accepted in the United States of America and the standards applicable to financial audits contained in
Government Auditing Standards, issued by the Comptroller General of the United States. Those
standards require that we plan and perform the audit to obtain reasonable assurance about whether the
financial statements are free from material misstatement.
An audit involves performing procedures to obtain audit evidence about the amounts and disclosures in
the financial statements. The procedures selected depend on the auditor’s judgment, including the

Report No. 2017-160 Page 2 March 2017
assessment of the risks of material misstatement of the financial statements, whether due to fraud or
error. In making those risk assessments, the auditor considers internal control relevant to the entity’s
preparation and fair presentation of the financial statements in order to design audit procedures that are
appropriate in the circumstances, but not for the purpose of expressing an opinion on the effectiveness
of the entity’s internal control. Accordingly, we express no such opinion. An audit also includes
evaluating the appropriateness of accounting policies used and the reasonableness of significant
accounting estimates made by management, as well as evaluating the overall presentation of the
financial statements.
We believe that the audit evidence we have obtained is sufficient and appropriate to provide a basis for
our audit opinions.
Opinions
In our opinion, based on our audit and the report of other auditors, the financial statements referred to
above present fairly, in all material respects, the respective financial position of Valencia College and of
its discretely presented component unit as of June 30, 2016, and the respective changes in financial
position and, where applicable, cash flows thereof for the fiscal year then ended in accordance with
accounting principles generally accepted in the United States of America.
Other Matter
Required Supplementary Information
Accounting principles generally accepted in the United States of America require that MANAGEMENT’S
DISCUSSION AND ANALYSIS, the Schedule of Funding Progress – Other Postemployment
Benefits Plan, Schedule of the College’s Proportionate Share of the Net Pension Liability – Florida
Retirement System Pension Plan, Schedule of College Contributions – Florida Retirement System
Pension Plan, Schedule of the College’s Proportionate Share of the Net Pension Liability – Health
Insurance Subsidy Pension Plan, Schedule of College Contributions – Health Insurance Subsidy
Pension Plan, and Notes to Required Supplementary Information, as listed in the table of contents,
be presented to supplement the basic financial statements. Such information, although not a part of the
basic financial statements, is required by the Governmental Accounting Standards Board who considers
it to be an essential part of financial reporting for placing the basic financial statements in an appropriate
operational, economic, or historical context. We have applied certain limited procedures to the required
supplementary information in accordance with auditing standards generally accepted in the United States
of America, which consisted of inquiries of management about the methods of preparing the information
and comparing the information for consistency with management’s responses to our inquiries, the basic
financial statements, and other knowledge we obtained during our audit of the basic financial statements.
We do not express an opinion or provide any assurance on the information because the limited
procedures do not provide us with sufficient evidence to express an opinion or provide any assurance.
Other Reporting Required by Government Auditing Standards
In accordance with Government Auditing Standards, we have also issued a report dated March 9, 2017,
on our consideration of the Valencia College’s internal control over financial reporting and on our tests of
its compliance with certain provisions of laws, rules, regulations, contracts, and grant agreements and
other matters included under the heading INDEPENDENT AUDITOR’S REPORT ON INTERNAL

Report No. 2017-160 March 2017 Page 3
CONTROL OVER FINANCIAL REPORTING AND ON COMPLIANCE AND OTHER MATTERS BASED
ON AN AUDIT OF FINANCIAL STATEMENTS PERFORMED IN ACCORDANCE WITH
GOVERNMENT AUDITING STANDARDS. The purpose of that report is to describe the scope of our
testing of internal control over financial reporting and compliance and the results of that testing, and not
to provide an opinion on the internal control over financial reporting or on compliance. That report is an
integral part of an audit performed in accordance with Government Auditing Standards in considering the
Valencia College’s internal control over financial reporting and compliance.
Respectfully submitted,
Sherrill F. Norman, CPA Tallahassee, Florida March 9, 2017

Report No. 2017-160 Page 4 March 2017
MANAGEMENT’S DISCUSSION AND ANALYSIS
Management’s discussion and analysis (MD&A) provides an overview of the financial position and
activities of the College for the fiscal year ended June 30, 2016, and should be read in conjunction with
the financial statements and notes thereto. The MD&A, and financial statements and notes thereto, are
the responsibility of College management. The MD&A contains financial activity of the College for the
fiscal years ended June 30, 2016, and June 30, 2015.
FINANCIAL HIGHLIGHTS
The College’s assets totaled $358.6 million at June 30, 2016. This balance reflects an $11.2 million, or
3.2 percent, increase as compared to the 2014-15 fiscal year, primarily due to a Public Education Capital
Outlay (PECO) receivable for the construction of Poinciana Campus Building 1. While assets grew by
$11.2 million, liabilities increased by $14.7 million, or 18.6 percent, totaling $93.7 million at June 30, 2016,
compared to $79 million at June 30, 2015. The increase in liabilities was primarily due to a growth in the
unfunded portion of the Florida Retirement System (FRS) defined pension plan administered by the
Florida Division of Retirement which the College is required to recognize as a participating member under
Governmental Accounting Standards Board (GASB) Statement No. 68. After factoring in a net deferred
outflows increase of $18.4 million from deferred outflows and inflows changes related to the defined
pension plans, the College’s net position increased by $14.9 million, resulting in a year-end balance of
$276.1 million.
The College’s operating revenues totaled $80 million for the 2015-16 fiscal year, representing an
8.7 percent increase compared to the 2014-15 fiscal year, was primarily due to a decline in scholarship
allowances, resulting in a greater proportion of tuition paid by the student, or third party on behalf of the
student instead of non-operating Gifts and Grants – Student Aid revenues. Operating expenses totaled
$250.1 million for the 2015-16 fiscal year, representing an increase of 4.8 percent as compared to the
2014-15 fiscal year.
Net position represents the residual interest in the College’s assets and deferred outflows of resources
after deducting liabilities and deferred inflows of resources. The College’s comparative total net position
by category for the fiscal years ended June 30, 2016, and June 30, 2015, is shown in the following graph:

Report No. 2017-160 March 2017 Page 5
Net Position
(In Thousands)
The following chart provides a graphical presentation of College revenues by category for the
2015-16 fiscal year:
Total Revenues
OVERVIEW OF FINANCIAL STATEMENTS
Pursuant to GASB Statement No. 35, the College’s financial report consists of three basic financial
statements: the statement of net position; the statement of revenues, expenses, and changes in net
position; and the statement of cash flows. The financial statements, and notes thereto, encompass the
College and its component unit, the Valencia College Foundation, Inc. (Foundation). Based on the
‐$30,000
$110,000
$250,000
Net Investment inCapital Assets
Restricted Unrestricted
$228,179
$58,013
‐$10,134
$227,996
$49,857
‐$16,651
2016 2015
Operating Revenues30%
Nonoperating Revenues
62%
Other Revenues8%

Report No. 2017-160 Page 6 March 2017
application of the criteria for determining component units, the Foundation is included within the College
reporting entity as a discretely presented component unit.
This MD&A focuses on the College, excluding the discretely presented component unit.
The Statement of Net Position
The statement of net position reflects the assets, deferred outflows of resources, liabilities, and deferred
inflows of resources of the College, using the accrual basis of accounting, and presents the financial
position of the College at a specified time. Assets, plus deferred outflows of resources, less liabilities,
less deferred inflows of resources, equals net position, which is one indicator of the College’s current
financial condition. The changes in net position that occur over time indicate improvement or deterioration
in the College’s financial condition.
The following summarizes the College’s assets, deferred outflows of resources, liabilities, deferred
inflows of resources, and net position at June 30:
Condensed Statement of Net Position at June 30
(In Thousands)
2016 2015
AssetsCurrent Assets 75,306$ 78,206$ Capital Assets, Net 238,234 238,557 Other Noncurrent Assets 45,103 30,721
Total Assets 358,643 347,484
Deferred Outflows of Resources 17,798 12,572
LiabilitiesCurrent Liabilities 24,205 25,682 Noncurrent Liabilities 69,523 53,354
Total Liabilities 93,728 79,036
Deferred Inflows of Resources 6,655 19,818
Net PositionNet Investment in Capital Assets 228,179 227,996 Restricted 58,013 49,857 Unrestricted (10,134) (16,651)
Total Net Position 276,058$ 261,202$
Total assets increased primarily from the purchase of $15.7 million of noncurrent investments using cash
from current assets, partially offset by an increase in amounts reported as due from other governmental
agencies of $11.8 million to fund construction of Building 1 at the Poinciana Campus.
Noncurrent liabilities increased primarily due to an increase in the net pension liability of $17.2 million.
Deferred inflows of resources related to the College’s proportionate share of the FRS defined pension

Report No. 2017-160 March 2017 Page 7
benefit plan decreased by $13.2 million due to differences between projected and actual investment
earnings on pension plan investments which also contributed to the increase in net position.
Total net position increased primarily due to an increase in the restricted position related to funding for
capital projects and operating surpluses in the Current Funds - Unrestricted and the Auxiliary fund.
The Statement of Revenues, Expenses, and Changes in Net Position
The statement of revenues, expenses, and changes in net position presents the College’s revenue and
expense activity, categorized as operating and nonoperating. Revenues and expenses are recognized
when earned or incurred, regardless of when cash is received or paid.
The following summarizes the College’s activity for the 2015-16 and 2014-15 fiscal years:
Condensed Statement of Revenues, Expenses, and Changes in Net Position For the Fiscal Years
(In Thousands)
2015-16 2014-15
Operating Revenues 79,973$ 73,602$ Less, Operating Expenses 250,085 238,587
Operating Loss (170,112) (164,985) Net Nonoperating Revenues 163,892 158,533
Loss Before Other Revenues (6,220) (6,452) Other Revenues 21,076 8,393
Net Increase In Net Position 14,856 1,941
Net Position, Beginning of Year 261,202 304,247 Adjustment to Beginning Net Position (1) - (44,986)
Net Position, Beginning of Year, as Restated 261,202 259,261
Net Position, End of Year 276,058$ 261,202$
Note: (1) Adjustment to beginning net position is due to the implementation of GASB Statement No. 68, which is a change in accounting principle that requires employers participating in cost-sharing multiple-employer defined benefit pension plans to report the employer’s proportionate share of the net pension liability of the defined benefit pension plans.
Operating Revenues
GASB Statement No. 35 categorizes revenues as either operating or nonoperating. Operating revenues
generally result from exchange transactions where each of the parties to the transaction either gives or
receives something of equal or similar value.
The following summarizes the operating revenues by source that were used to fund operating activities
for the 2015-16 and 2014-15 fiscal years:

Report No. 2017-160 Page 8 March 2017
Operating Revenues For the Fiscal Years
(In Thousands)
2015-16 2014-15
Student Tuition and Fees, Net 66,721$ 59,343$ Grants and Contracts 566 2,031 Sales and Services of Educational Departments 127 48 Auxiliary Enterprises, Net 11,301 10,413 Other 1,258 1,767
Total Operating Revenues 79,973$ 73,602$
The following chart presents the College’s operating revenues for the 2015-16 and 2014-15 fiscal years:
Operating Revenues
(In Thousands)
Total operating revenues increased by $6.4 million, or 8.7 percent, due to an increase in the number of
students paying the nonresident tuition rate, additional revenue from noncredit courses, and a decrease
in the amount of tuition scholarship allowances.
Operating Expenses
Expenses are categorized as operating or nonoperating. The majority of the College’s expenses are
operating expenses as defined by GASB Statement No. 35. GASB gives financial reporting entities the
choice of reporting operating expenses in the functional or natural classifications. The College has
chosen to report the expenses in their natural classification on the statement of revenues, expenses, and
changes in net position and has displayed the functional classification in the notes to financial statements.
The following summarizes operating expenses by natural classification for the 2015-16 and 2014-15 fiscal
years:
$0 $40,000 $80,000
Other
Auxiliary Enterprises, Net
Sales and Services ofEducational Departments
Grants and Contracts
Student Tuition and Fees, Net
$1,767
$10,413
$48
$2,031
$59,343
$1,258
$11,301
$127
$566
$66,721
2015‐16 2014‐15

Report No. 2017-160 March 2017 Page 9
Operating Expenses For the Fiscal Years
(In Thousands)
2015-16 2014-15
Personnel Services 154,460$ 141,139$ Scholarships and Waivers 30,607 34,270 Utilities and Communications 5,280 5,180 Contractual Services 10,156 9,051 Other Services and Expenses 9,009 8,947 Materials and Supplies 30,661 29,445 Depreciation 9,912 10,555
Total Operating Expenses 250,085$ 238,587$
The following chart presents the College’s operating expenses for the 2015-16 and 2014-15 fiscal years:
Operating Expenses
(In Thousands)
College operating expense changes were the result of the following factors:
Personnel services expense had an overall increase of $13.3 million, or 9.4 percent, due to a 3.75 percent salary increase for all full-time faculty, annually appointed faculty, and part-time faculty. Part-time staff received a 2 percent increase. In addition, there was an increase of $3.3 million, or 177.3 percent, in retirement incentive payouts due to the closure of the retirement incentive program in the 2015-16 fiscal year.
Scholarships and waivers decreased by $3.7 million, or 10.7 percent, primarily due to a reduction in Federal Pell Grant disbursements which is attributable to a decrease in Federal financial aid applicants.
$0 $90,000 $180,000
Depreciation
Materials and Supplies
Other Services and Expenses
Contractual Services
Utilities and Communications
Scholarships and Waivers
Personnel Services
$10,555
$29,445
$8,947
$9,051
$5,180
$34,270
$141,139
$9,912
$30,661
$9,009
$10,156
$5,280
$30,607
$154,460
2015‐16 2014‐15

Report No. 2017-160 Page 10 March 2017
Nonoperating Revenues and Expenses
Certain revenue sources that the College relies on to provide funding for operations, including State
noncapital appropriations, Federal and State student financial aid, certain gifts and grants, and
investment income, are defined by GASB as nonoperating. Nonoperating expenses include capital
financing costs and other costs related to capital assets. The following summarizes the College’s
nonoperating revenues and expenses for the 2015-16 and 2014-15 fiscal years:
Nonoperating Revenues (Expenses) For the Fiscal Years
(In Thousands)
2015-16 2014-15
State Noncapital Appropriations 79,572$ 68,573$ Federal and State Student Financial Aid 74,778 82,968 Gifts and Grants 9,598 6,841 Investment Income 574 193 Other Nonoperating Revenues - 586 Interest on Capital Asset-Related Debt (630) (628)
Net Nonoperating Revenues 163,892$ 158,533$
Net nonoperating revenues increased by $5.4 million, or 3.4 percent, primarily due to an increase of
$11 million, or 16 percent, in State general revenue and performance based incentive program
appropriations for the 2015-16 fiscal year and an increase of $2.8 million, or 40.3 percent, in Gifts and
Grants due to a reclassification of Foundation scholarships. This increase was offset by a reduction of
$8.2 million, or 9.9 percent in financial aid revenue mainly due to a decrease of eligible students for the
Federal Pell Grant program.
Other Revenues
This category is composed of State capital appropriations and capital grants, contracts, gifts, and fees.
The following summarizes the College’s other revenues for the 2015-16 and 2014-15 fiscal years:
Other Revenues For the Fiscal Years
(In Thousands)
2015-16 2014-15
State Capital Appropriations 13,900$ 2,795$ Capital Grants, Contracts, Gifts, and Fees 7,176 5,598
Total 21,076$ 8,393$
Total other revenues increased by $12.7 million, or 151.1 percent, primarily due to increases in State
capital appropriations of $11.9 million for the construction of Building 1 and $1.34 million in donated land
at the Poinciana Campus.

Report No. 2017-160 March 2017 Page 11
The Statement of Cash Flows
The statement of cash flows provides information about the College’s financial results by reporting the
major sources and uses of cash and cash equivalents. This statement will assist in evaluating the
College’s ability to generate net cash flows, its ability to meet its financial obligations as they come due,
and its need for external financing. Cash flows from operating activities show the net cash used by the
operating activities of the College. Cash flows from capital financing activities include all plant funds and
related long-term debt activities. Cash flows from investing activities show the net source and use of
cash related to purchasing or selling investments, and earning income on those investments. Cash flows
from noncapital financing activities include those activities not covered in other sections.
The following summarizes the College’s cash flows for the 2015-16 and 2014-15 fiscal years:
Condensed Statement of Cash Flows For the Fiscal Years
(In Thousands)
2015-16 2014-15
Cash Provided (Used) by:Operating Activities (164,525)$ (152,499)$ Noncapital Financing Activities 162,697 159,018 Capital and Related Financing Activities (434) 6,378 Investing Activities (24,640) 134
Net Increase (Decrease) in Cash and Cash Equivalents (26,902) 13,031 Cash and Cash Equivalents, Beginning of Year 97,691 84,660
Cash and Cash Equivalents, End of Year 70,789$ 97,691$
Major sources of funds came from State noncapital appropriations ($79.6 million), Federal and State
student financial aid ($74.8 million), net student tuition and fees ($64.3 million), and Federal Direct
Student Loan program receipts ($48.5 million). Major uses of funds were for payments to employees
and for employee benefits ($155.4 million), payments to providers of goods and services ($51.6 million),
disbursements to students for Federal Direct Student Loans ($49.4 million), and payments for
scholarships ($30.6 million).
Cash used by operating activities increased by $12 million due to additional personnel positions and the
closing of the retirement incentive program. Cash used by capital and related financing activities
increased by $6.8 million due to the acceleration of capital project spending related to the planning of the
Poinciana campus and construction of two buildings at East Campus nearing completion. The change
in cash and cash equivalents was the result of a $25 million purchase of investments. Additional
information about the College’s investments is presented in the notes to the financial statements.
CAPITAL ASSETS AND DEBT ADMINISTRATION
Capital Assets
At June 30, 2016, the College had $368.9 million in capital assets, less accumulated depreciation of
$130.7 million, for net capital assets of $238.2 million. Depreciation charges for the current fiscal year

Report No. 2017-160 Page 12 March 2017
totaled $9.9 million. The following table summarizes the College’s capital assets, net of accumulated
depreciation, at June 30:
Capital Assets, Net at June 30
(In Thousands)
2016 2015
Land 32,988$ 31,590$ Construction in Progress 6,095 815 Buildings 182,484 188,670 Other Structures and Improvements 3,569 4,972 Furniture, Machinery, and Equipment 3,986 3,294 Leasehold Improvements 2,828 2,766 Assets Under Capital Lease 6,285 6,450
Capital Assets, Net 238,235$ 238,557$
Construction in progress increased $5.3 million due to increases in expenditures for planning the
Poinciana Campus ($1.8 million), continued construction of the East Maintenance Building ($2.4 million),
and the East Campus Building 9 ($1 million). Buildings decreased by the $6.2 million in depreciation
recorded. Additional information about the College’s capital assets is presented in the notes to the
financial statements.
Capital Expenses and Commitments
Capital expenses through June 30, 2016, were incurred on the following projects: East Campus Building
9, Poinciana Campus, and the East Maintenance Building. The College’s construction commitments at
June 30, 2016, are as follows:
Amount(In Thousands)
Total Committed 23,186$ Completed to Date (6,095)
Balance Committed 17,091$
Additional information about the College’s construction commitments is presented in the notes to financial
statements.
Debt Administration
As of June 30, 2016, the College had $10.1 million in outstanding State Board of Education (SBE) capital
outlay bonds and capital lease payable, representing a decrease of $0.5 million, or 4.8 percent, from the
prior fiscal year. The following table summarizes the outstanding long-term debt by type for the fiscal
years ended June 30:

Report No. 2017-160 March 2017 Page 13
Long-Term Debt, at June 30
(In Thousands)
2016 2015
SBE Capital Outlay Bonds 3,458$ 3,954$ Capital Lease 6,598 6,607
Total 10,056$ 10,561$
The State Board of Education (SBE) issues capital outlay bonds on behalf of the College. During the
2015-16 fiscal year, there were no bond sales and debt repayments totaled $0.5 million. Additional
information about the College’s long-term debt is presented in the notes to financial statements.
ECONOMIC FACTORS THAT WILL AFFECT THE FUTURE
The College’s economic condition is closely tied to that of the State of Florida. In the 2016-17 fiscal year
legislative appropriations, the College received a $4.7 million, or 6.2 percent, increase from the State
general revenue and lottery funding. The College’s current financial and capital plans indicate that the
infusion of State appropriations will be necessary to maintain its present level of services.
REQUESTS FOR INFORMATION
Questions concerning information provided in the MD&A or other required supplementary information,
and financial statements and notes thereto, or requests for additional financial information should be
addressed to the Vice President for Business Operations and Finance, Valencia College, Post Office Box
3028, Orlando Florida 32802.

Report No. 2017-160 Page 14 March 2017
BASIC FINANCIAL STATEMENTS
Valencia College A Component Unit of the State of Florida
Statement of Net Position
June 30, 2016
ComponentCollege Unit
ASSETSCurrent Assets:
Cash and Cash Equivalents 24,839,110$ 869,875$ Restricted Cash and Cash Equivalents 16,660,125 - Investments 9,567,605 - Accounts Receivable, Net 5,216,043 321,683 Due from Other Governmental Agencies 15,268,201 - Due from Component Unit/College 817,634 668 Inventories 1,795,910 - Prepaid Expenses 1,134,773 - Deposits 6,278 - Other Assets - 5,346,022
Total Current Assets 75,305,679 6,538,248
Noncurrent Assets:Restricted Cash and Cash Equivalents 29,289,457 - Investments 15,736,504 - Restricted Investments 77,098 65,606,771 Depreciable Capital Assets, Net 199,151,873 5,836,507 Nondepreciable Capital Assets 39,082,884 3,084,064
Total Noncurrent Assets 283,337,816 74,527,342
TOTAL ASSETS 358,643,495 81,065,590
DEFERRED OUTFLOWS OF RESOURCESDeferred Amounts Related to Pensions 17,798,610 -
LIABILITIESCurrent Liabilities:
Accounts Payable 1,661,053 355,685 Salary and Payroll Taxes Payable 7,494,374 - Retainage Payable 191,817 - Due to Other Governmental Agencies 1,177,482 - Due to Component Unit/College 28,452 201,239 Unearned Revenue 445,037 114,115 Estimated Insurance Claims Payable 9,465,465 - Deposits Held for Others 688,216 - Long-Term Liabilities - Current Portion:
Bonds Payable 535,000 - Capital Lease Payable 9,747 - Special Termination Benefits Payable 53,528 - Compensated Absences Payable 1,455,687 - Net Pension Liability 999,567 -
Total Current Liabilities 24,205,425 671,039

Report No. 2017-160 March 2017 Page 15
Valencia College A Component Unit of the State of Florida
Statement of Net Position (Continued)
June 30, 2016
ComponentCollege Unit
LIABILITIES (Continued)Noncurrent Liabilities:
Bonds Payable 2,923,000 - Capital Lease Payable 6,588,036 - Special Termination Benefits Payable 287,758 - Compensated Absences Payable 6,667,190 - Other Postemployment Benefits Payable 1,468,235 - Net Pension Liability 51,588,510 -
Total Noncurrent Liabilities 69,522,729 -
TOTAL LIABILITIES 93,728,154 671,039
DEFERRED INFLOWS OF RESOURCESDeferred Amounts Related to Pensions 6,655,445 -
NET POSITIONNet Investment in Capital Assets 228,178,974 8,920,571 Restricted:
Nonexpendable:Endowment - 33,404,414
Expendable:Grants and Loans 15,178,708 31,564,143 Scholarships 1,852,804 - Capital Projects 40,905,107 - Debt Service 77,098 -
Unrestricted (10,134,185) 6,505,423
TOTAL NET POSITION 276,058,506$ 80,394,551$
The accompanying notes to financial statements are an integral part of this statement.

Report No. 2017-160 Page 16 March 2017
Valencia College A Component Unit of the State of Florida
Statement of Revenues, Expenses, and Changes in Net Position
For the Fiscal Year Ended June 30, 2016
ComponentCollege Unit
REVENUESOperating Revenues:
Student Tuition and Fees, Net of Scholarship Allowances of $44,383,574 66,720,558$ -$ Federal Grants and Contracts 549,045 - State and Local Grants and Contracts - 119,552 Nongovernmental Grants and Contracts 17,500 1,920,159 Sales and Services of Educational Departments 127,147 - Auxiliary Enterprises, Net of Scholarship Allowances of $5,740,796 11,301,234 - Other Operating Revenues 1,257,742 832,074
Total Operating Revenues 79,973,226 2,871,785
EXPENSESOperating Expenses:
Personnel Services 154,460,215 864,252 Scholarships and Waivers 30,607,272 2,584,585 Utilities and Communications 5,279,462 - Contractual Services 10,156,351 79,685 Other Services and Expenses 9,008,993 1,860,640 Materials and Supplies 30,661,035 25,729 Depreciation 9,911,555 155,486
Total Operating Expenses 250,084,883 5,570,377
Operating Loss (170,111,657) (2,698,592)
NONOPERATING REVENUES (EXPENSES)State Noncapital Appropriations 79,571,498 - Federal and State Student Financial Aid 74,777,728 - Gifts and Grants 9,597,878 - Investment Income 574,529 3,704,562 Net Loss on Investments - (3,221,356) Interest on Capital Asset-Related Debt (630,042) -
Net Nonoperating Revenues 163,891,591 483,206
Loss Before Other Revenues (6,220,066) (2,215,386)
State Capital Appropriations 13,900,039 - Capital Grants, Contracts, Gifts, and Fees 7,176,246 -
Total Other Revenues 21,076,285 -
Increase (Decrease) in Net Position 14,856,219 (2,215,386) Net Position, Beginning of Year 261,202,287 82,609,937
Net Position, End of Year 276,058,506$ 80,394,551$
The accompanying notes to financial statements are an integral part of this statement.

Report No. 2017-160 March 2017 Page 17
THIS PAGE INTENTIONALLY LEFT BLANK

Report No. 2017-160 Page 18 March 2017
Valencia College A Component Unit of the State of Florida
Statement of Cash Flows
For the Fiscal Year Ended June 30, 2016
College
CASH FLOWS FROM OPERATING ACTIVITIESStudent Tuition and Fees, Net 64,275,327$ Grants and Contracts 566,545 Payments to Suppliers (51,638,486) Payments for Utilities and Communications (5,366,010) Payments to Employees (129,528,881) Payments for Employee Benefits (25,837,781) Payments for Scholarships (30,589,194) Auxiliary Enterprises, Net 12,208,069 Sales and Services of Educational Departments 127,147 Other Receipts 1,257,742
Net Cash Used by Operating Activities (164,525,522)
CASH FLOWS FROM NONCAPITAL FINANCING ACTIVITIESState Noncapital Appropriations 79,571,498 Federal and State Student Financial Aid 74,777,728 Federal Direct Loan Program Receipts 48,487,591 Federal Direct Loan Program Disbursements (49,361,762) Gifts and Grants Received for Other Than Capital or Endowment Purposes 9,327,862 Other Nonoperating Disbursements (106,258)
Net Cash Provided by Noncapital Financing Activities 162,696,659
CASH FLOWS FROM CAPITAL AND RELATED FINANCING ACTIVITIESState Capital Appropriations 3,485,294 Capital Grants and Gifts 5,832,439 Purchases of Capital Assets (8,616,799) Principal Paid on Capital Debt and Leases (505,119) Interest Paid on Capital Debt and Leases (630,042)
Net Cash Used by Capital and Related Financing Activities (434,227)
CASH FLOWS FROM INVESTING ACTIVITIESProceeds from Sales and Maturities of Investments 17,087 Purchases of Investments (25,000,000) Investment Income 343,320
Net Cash Used by Investing Activities (24,639,593)
Net Decrease in Cash and Cash Equivalents (26,902,683) Cash and Cash Equivalents, Beginning of Year 97,691,375
Cash and Cash Equivalents, End of Year 70,788,692$

Report No. 2017-160 March 2017 Page 19
Valencia College A Component Unit of the State of Florida
Statement of Cash Flows (Continued)
For the Fiscal Year Ended June 30, 2016
College
RECONCILIATION OF OPERATING LOSS TO NET CASH USED BY OPERATING ACTIVITIESOperating Loss (170,111,657)$ Adjustments to Reconcile Operating Loss to Net Cash Used by Operating Activities:
Depreciation Expense 9,911,555 Changes in Assets, Liabilities, Deferred Outflows of Resources, and Deferred Inflows of Resources:
Receivables, Net (2,725,374) Inventories 1,104,047 Prepaid Expenses 202,146 Deposits 5,435 Accounts Payable (924,425) Salary and Payroll Taxes Payable 404,906 Unearned Revenue 8,943 Estimated Insurance Claims Payable (1,279,741) Special Termination Benefits Payable 16,219 Compensated Absences Payable (206,316) Other Postemployment Benefits Payable 257,702 Net Pension Liability 17,200,149 Deferred Outflows of Resources Related to Pensions (5,226,784) Deferred Inflows of Resources Related to Pensions (13,162,327)
NET CASH USED BY OPERATING ACTIVITIES (164,525,522)$
SUPPLEMENTAL DISCLOSURE OF NONCASH INVESTING AND CAPITAL FINANCING ACTIVITIES
230,044$
1,343,807$
Unrealized gains on investments were recognized as an increase to investmentincome on the statement of revenues, expenses, and changes in net position,but are not cash transactions for the statement of cash flows.Donation of capital assets were recognized on the statement of revenues,expenses, and changes in net position, but are not cash transactions for thestatement of cash flows.
The accompanying notes to financial statements are an integral part of this statement.

Report No. 2017-160 Page 20 March 2017
NOTES TO FINANCIAL STATEMENTS
1. Summary of Significant Accounting Policies
Reporting Entity. The governing body of Valencia College, a component unit of the State of Florida, is
the College Board of Trustees. The Board of Trustees constitutes a corporation and is composed of nine
members appointed by the Governor and confirmed by the Senate. The Board of Trustees is under the
general direction and control of the Florida Department of Education, Division of Florida Colleges, and is
governed by State law and State Board of Education (SBE) rules. However, the Board of Trustees is
directly responsible for the day-to-day operations and control of the College within the framework of
applicable State law and SBE rules. Geographic boundaries of the College correspond with those of
Orange and Osceola Counties.
Criteria for defining the reporting entity are identified and described in the Governmental Accounting
Standards Board’s (GASB) Codification of Governmental Accounting and Financial Reporting Standards,
Sections 2100 and 2600. These criteria were used to evaluate potential component units for which the
Board of Trustees is financially accountable and other organizations for which the nature and significance
of their relationship with the Board of Trustees are such that exclusion would cause the College’s financial
statements to be misleading. Based on the application of these criteria, the College is a component unit
of the State of Florida, and its financial balances and activities are reported in the State’s Comprehensive
Annual Financial Report by discrete presentation.
Discretely Presented Component Unit. Based on the application of the criteria for determining
component units, the Valencia College Foundation, Inc. (Foundation), a legally separate entity, is
included within the College’s reporting entity as a discretely presented component unit and is governed
by a separate board.
The Foundation is also a direct-support organization, as defined in Section 1004.70, Florida Statutes,
and although legally separate from the College, is financially accountable to the College. The Foundation
is managed independently, outside the College’s budgeting process, and its powers generally are vested
in a governing board pursuant to various State statutes. The Foundation receives, holds, invests, and
administers property and makes expenditures to or for the benefit of the College.
The Foundation is audited by other auditors pursuant to Section 1004.70(6), Florida Statutes. The
Foundation’s audited financial statements are available to the public and can be obtained from the
Vice President for Business Operations and Finance, Valencia College, Post Office Box 3028, Orlando,
Florida 32802. The financial data reported on the accompanying financial statements was derived from
the Foundation’s audited financial statements for the fiscal year ended March 31, 2016.
Basis of Presentation. The College’s accounting policies conform with accounting principles generally
accepted in the United States of America applicable to public colleges and universities as prescribed by
GASB. The National Association of College and University Business Officers (NACUBO) also provides
the College with recommendations prescribed in accordance with generally accepted accounting
principles promulgated by GASB and the Financial Accounting Standards Board (FASB). GASB allows
public colleges various reporting options. The College has elected to report as an entity engaged in only

Report No. 2017-160 March 2017 Page 21
business-type activities. This election requires the adoption of the accrual basis of accounting and
entitywide reporting including the following components:
Management’s Discussion and Analysis
Basic Financial Statements:
o Statement of Net Position
o Statement of Revenues, Expenses, and Changes in Net Position
o Statement of Cash Flows
o Notes to Financial Statements
Other Required Supplementary Information
Measurement Focus and Basis of Accounting. Basis of accounting refers to when revenues,
expenses, assets, deferred outflows of resources, liabilities, and deferred inflows of resources are
recognized in the accounts and reported in the financial statements. Specifically, it relates to the timing
of the measurements made, regardless of the measurement focus applied. The College’s financial
statements are presented using the economic resources measurement focus and the accrual basis of
accounting. Revenues, expenses, gains, losses, assets, deferred outflows of resources, liabilities, and
deferred inflows of resources resulting from exchange and exchange-like transactions are recognized
when the exchange takes place. Revenues, expenses, gains, losses, assets, deferred outflows of
resources, liabilities, and deferred inflows of resources resulting from nonexchange activities are
generally recognized when all applicable eligibility requirements, including time requirements, are met.
The College follows GASB standards of accounting and financial reporting.
The College’s component unit uses the economic resources measurement focus and accrual basis of
accounting whereby revenues are recognized when earned and expenses are recognized when incurred,
and follows FASB standards of accounting and financial reporting for not-for-profit organizations.
Significant interdepartmental sales between auxiliary service departments and other institutional
departments have been accounted for as reductions of expenses and not revenues of those departments.
The College’s principal operating activity is instruction. Operating revenues and expenses generally
include all fiscal transactions directly related to instruction as well as administration, academic support,
student services, physical plant operations, and depreciation of capital assets. Nonoperating revenues
include State noncapital appropriations, Federal and State student financial aid, investment income (net
of unrealized gains or losses on investments), and revenues for capital construction projects. Interest on
capital asset-related debt is a nonoperating expense.
The statement of net position is presented in a classified format to distinguish between current and
noncurrent assets and liabilities. When both restricted and unrestricted resources are available to fund
certain programs, it is the College’s policy to first apply the restricted resources to such programs followed
by the use of the unrestricted resources.
The statement of revenues, expenses, and changes in net position is presented by major sources and is
reported net of tuition scholarship allowances. Tuition scholarship allowances are the difference between
the stated charge for goods and services provided by the College and the amount that is actually paid by

Report No. 2017-160 Page 22 March 2017
the student or the third party making payment on behalf of the student. The College calculated its
scholarship allowance by identifying within its student accounts receivable system amounts paid by
student aid for tuition and books. The amounts are deducted from student tuition and fees, and auxiliary
enterprise, respectively.
The statement of cash flows is presented using the direct method in compliance with GASB Statement
No. 9, Reporting Cash Flows of Proprietary and Nonexpendable Trust Funds and Governmental Entities
That Use Proprietary Fund Accounting.
Cash and Cash Equivalents. The amount reported as cash and cash equivalents consists of cash on
hand, cash in demand accounts, cash in money market accounts, and cash placed with the State Board
of Administration (SBA) Florida PRIME investment pool. For reporting cash flows, the College considers
all highly liquid investments with original maturities of 3 months or less to be cash equivalents. Under
this definition, the College considers amounts invested in the SBA Florida PRIME investment pool and
in the money market accounts to be cash equivalents.
College cash deposits are held in banks qualified as public depositories under Florida law. All such
deposits are insured by Federal depository insurance, up to specified limits, or collateralized with
securities held in Florida’s multiple financial institution collateral pool required by Chapter 280,
Florida Statutes. Cash and cash equivalents that are externally restricted to make debt service
payments, maintain sinking or reserve funds, or to purchase or construct capital or other restricted assets
are classified as restricted.
At June 30, 2016, the College reported as cash equivalents $39,137,068 in the Florida PRIME investment
pool administered by the SBA pursuant to Section 218.405, Florida Statutes. The College’s investments
in the Florida PRIME investment pool, which the SBA indicates is a Securities and Exchange Commission
Rule 2a7-like external investment pool, are similar to money market funds in which shares are owned in
the fund rather than the underlying investments. The Florida PRIME investment pool carried a credit
rating of AAAm by Standard & Poor’s and had a weighted-average days to maturity (WAM) of 39 days
as of June 30, 2016. A portfolio’s WAM reflects the average maturity in days based on final maturity or
reset date, in the case of floating-rate instruments. WAM measures the sensitivity of the Florida PRIME
investment pool to interest rate changes. The investments in the Florida PRIME investment pool are
reported at amortized cost. Section 218.409(8)(a), Florida Statutes, states that “the principal, and any
part thereof, of each account constituting the trust fund is subject to payment at any time from the moneys
in the trust fund. However, the executive director may, in good faith, on the occurrence of an event that
has a material impact on liquidity or operations of the trust fund, for 48 hours limit contributions to or
withdrawals from the trust fund to ensure that the Board [State Board of Administration] can invest
moneys entrusted to it in exercising its fiduciary responsibility. Such action must be immediately
disclosed to all participants, the trustees, the Joint Legislative Auditing Committee, the Investment
Advisory Council, and the Participant Local Government Advisory Council. The trustees shall convene
an emergency meeting as soon as practicable from the time the executive director has instituted such
measures and review the necessity of those moratorium on contributions and withdrawals, the
moratorium may be extended by the executive director until the trustees are able to meet to review the
necessity for the moratorium. If the trustees agree with such measures, the trustees shall vote to continue
the measures for up to an additional 15 days. The trustees must convene and vote to continue any such

Report No. 2017-160 March 2017 Page 23
measures before the expiration of the time limit set, but in no case may the time limit set by the trustees
exceed 15 days.” As of June 30, 2016, there were no redemption fees or maximum transaction amounts,
or any other requirements that serve to limit a participant’s daily access to 100 percent of their account
value.
Inventories. Inventories consist of items for resale by the campus bookstore, and are valued using the
last invoice cost, which approximates the first-in, first-out, method of inventory valuation. Consumable
laboratory supplies, teaching materials, and office supplies on hand in College departments are expensed
when purchased, and are not considered material. Accordingly, these items are not included in the
reported inventory.
Capital Assets. College capital assets consist of land, construction in progress, buildings, other
structures and improvements, furniture, machinery, and equipment, leasehold improvements, and asset
under capital lease. These assets are capitalized and recorded at cost at the date of acquisition or at
acquisition value at the date received in the case of gifts and purchases of State surplus property.
Additions, improvements, and other outlays that significantly extend the useful life of an asset are
capitalized. Other costs incurred for repairs and maintenance are expensed as incurred. The College
has a capitalization threshold of $5,000 for tangible personal property and $50,000 for buildings and other
structures and improvements. Depreciation is computed on the straight-line basis over the following
estimated useful lives:
Buildings – 40 years
Other Structures and Improvements – 10 years
Furniture, Machinery, and Equipment:
o Computer Equipment – 3 years
o Vehicles, Office Machines, and Educational Equipment – 5 years
o Furniture – 7 years
Leasehold Improvements – 40 years
Asset Under Capital Lease – 40 years
Noncurrent Liabilities. Noncurrent liabilities include bonds payable, capital lease payable, special
termination benefits payable, compensated absences payable, other postemployment benefits payable,
and net pension liability that are not scheduled to be paid within the next fiscal year.
Pensions. For purposes of measuring the net pension liability, deferred outflows of resources and
deferred inflows of resources related to pensions, and pension expense, information about the fiduciary
net position of the Florida Retirement System (FRS) defined benefit plan and the Health Insurance
Subsidy (HIS) defined benefit plan and additions to/deductions from the FRS’s and the HIS’s fiduciary
net position have been determined on the same basis as they are reported by the FRS and the HIS plans.
For this purpose, benefit payments (including refunds of employee contributions) are recognized when
due and payable in accordance with benefit terms. Investments are reported at fair value.
Report No. 2017-160 Page 24 March 2017
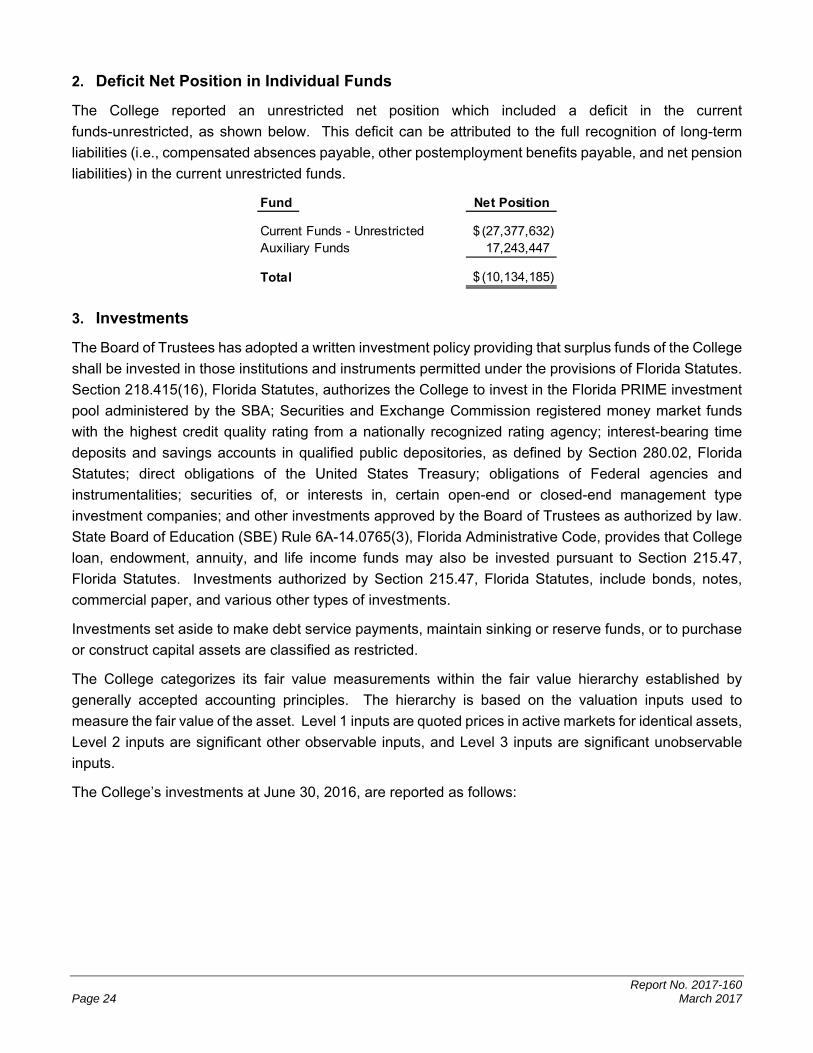
2. Deficit Net Position in Individual Funds
The College reported an unrestricted net position which included a deficit in the current
funds-unrestricted, as shown below. This deficit can be attributed to the full recognition of long-term
liabilities (i.e., compensated absences payable, other postemployment benefits payable, and net pension
liabilities) in the current unrestricted funds.
Fund Net Position
Current Funds - Unrestricted (27,377,632)$ Auxiliary Funds 17,243,447
Total (10,134,185)$
3. Investments
The Board of Trustees has adopted a written investment policy providing that surplus funds of the College
shall be invested in those institutions and instruments permitted under the provisions of Florida Statutes.
Section 218.415(16), Florida Statutes, authorizes the College to invest in the Florida PRIME investment
pool administered by the SBA; Securities and Exchange Commission registered money market funds
with the highest credit quality rating from a nationally recognized rating agency; interest-bearing time
deposits and savings accounts in qualified public depositories, as defined by Section 280.02, Florida
Statutes; direct obligations of the United States Treasury; obligations of Federal agencies and
instrumentalities; securities of, or interests in, certain open-end or closed-end management type
investment companies; and other investments approved by the Board of Trustees as authorized by law.
State Board of Education (SBE) Rule 6A-14.0765(3), Florida Administrative Code, provides that College
loan, endowment, annuity, and life income funds may also be invested pursuant to Section 215.47,
Florida Statutes. Investments authorized by Section 215.47, Florida Statutes, include bonds, notes,
commercial paper, and various other types of investments.
Investments set aside to make debt service payments, maintain sinking or reserve funds, or to purchase
or construct capital assets are classified as restricted.
The College categorizes its fair value measurements within the fair value hierarchy established by
generally accepted accounting principles. The hierarchy is based on the valuation inputs used to
measure the fair value of the asset. Level 1 inputs are quoted prices in active markets for identical assets,
Level 2 inputs are significant other observable inputs, and Level 3 inputs are significant unobservable
inputs.
The College’s investments at June 30, 2016, are reported as follows:
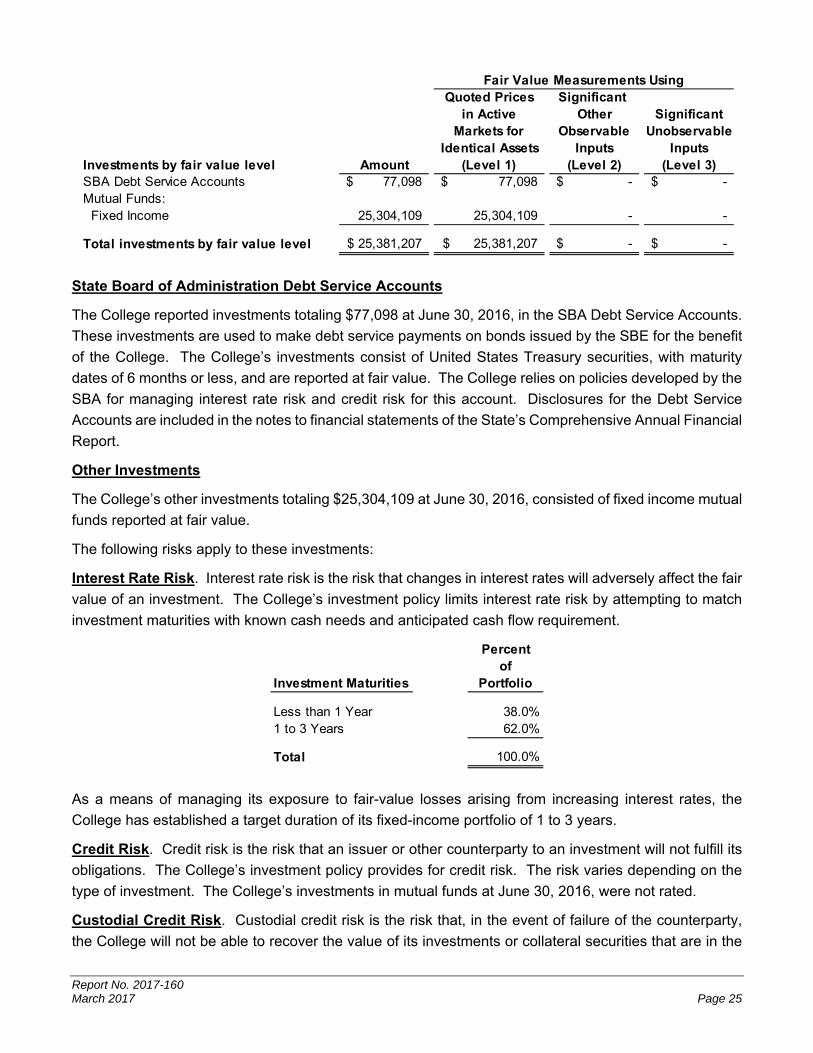
Report No. 2017-160 March 2017 Page 25
Quoted Prices Significant in Active Other Significant
Markets for Observable UnobservableIdentical Assets Inputs Inputs
Investments by fair value level Amount (Level 1) (Level 2) (Level 3)SBA Debt Service Accounts 77,098$ 77,098$ -$ -$ Mutual Funds: Fixed Income 25,304,109 25,304,109 - -
Total investments by fair value level 25,381,207$ 25,381,207$ -$ -$
Fair Value Measurements Using
State Board of Administration Debt Service Accounts
The College reported investments totaling $77,098 at June 30, 2016, in the SBA Debt Service Accounts.
These investments are used to make debt service payments on bonds issued by the SBE for the benefit
of the College. The College’s investments consist of United States Treasury securities, with maturity
dates of 6 months or less, and are reported at fair value. The College relies on policies developed by the
SBA for managing interest rate risk and credit risk for this account. Disclosures for the Debt Service
Accounts are included in the notes to financial statements of the State’s Comprehensive Annual Financial
Report.
Other Investments
The College’s other investments totaling $25,304,109 at June 30, 2016, consisted of fixed income mutual
funds reported at fair value.
The following risks apply to these investments:
Interest Rate Risk. Interest rate risk is the risk that changes in interest rates will adversely affect the fair
value of an investment. The College’s investment policy limits interest rate risk by attempting to match
investment maturities with known cash needs and anticipated cash flow requirement.
Percentof
Investment Maturities Portfolio
Less than 1 Year 38.0%1 to 3 Years 62.0%
Total 100.0%
As a means of managing its exposure to fair-value losses arising from increasing interest rates, the
College has established a target duration of its fixed-income portfolio of 1 to 3 years.
Credit Risk. Credit risk is the risk that an issuer or other counterparty to an investment will not fulfill its
obligations. The College’s investment policy provides for credit risk. The risk varies depending on the
type of investment. The College’s investments in mutual funds at June 30, 2016, were not rated.
Custodial Credit Risk. Custodial credit risk is the risk that, in the event of failure of the counterparty,
the College will not be able to recover the value of its investments or collateral securities that are in the

Report No. 2017-160 Page 26 March 2017
possession of an outside party. The College’s investment policy pursuant to Section 218.415(18),
Florida Statutes, requires securities, with the exception of certificates of deposit, be held with a third party
custodian; and all securities purchased by, and all collateral obtained by the College, should be properly
designated as an asset of the College. The securities must be held in an account separate and apart
from the assets of the financial institution. A third party custodian is defined as any bank depository
chartered by the Federal Government, the State of Florida, or by a national association organized and
existing under the laws of the United States which is authorized to accept and execute trust and is doing
business in the State of Florida. Certificates of deposit will be placed in the provider’s safekeeping
department for the term of deposit.
As of June 30, 2016, the College’s mutual fund investments were held by a third party custodian as
required by the College’s investment policy.
Concentration of Credit Risk. Concentration of credit risk is the risk of loss attributable to the magnitude
of the College’s investments in a single issuer. The College’s investment policy has established asset
allocation and issuer limits which are designed to reduce concentration of credit risk of the College’s
investment portfolio. United States Treasury securities and obligations explicitly guaranteed by the
U.S. Government are not considered to have credit risk and do not have purchase limitations. As of
June 30, 2016, there were no concentrations of credit risk.
Component Unit Investments
Investments held by the College’s component unit at March 31, 2016, are reported as follows:
Investment Type Amount
Mutual Funds 65,606,771$
Total Component Unit Investments 65,606,771$
4. Accounts Receivable
Accounts receivable represent amounts for student fee deferments and unused credit memos. These
receivables are reported net of a $2,336,367 allowance for doubtful accounts.
5. Due From Other Governmental Agencies
The amount due from other governmental agencies primarily consists of $11,800,000 of Public Education
Capital Outlay allocations due from the State for construction of Building 1 at the Poinciana Campus.
6. Due From and To Component Unit/College
The $817,634 reported as due from component unit mainly consists of amounts owed to the College by
the Foundation for grant expenditure program reimbursements and scholarship costs. The
$28,452 reported as due to component unit consists of amounts owed by the College to the Foundation
for theater production ticket sales and payment adjustment for a grant expenditure. The College’s
financial statements are reported for the fiscal year ended June 30, 2016. The College’s component
unit’s financial statements are reported for the fiscal year ended March 31, 2016. Accordingly, amounts
reported by the College as due from and to component unit on the statement of net position do not agree
with amounts reported by the component unit as due from and to the College.
Report No. 2017-160 March 2017 Page 27
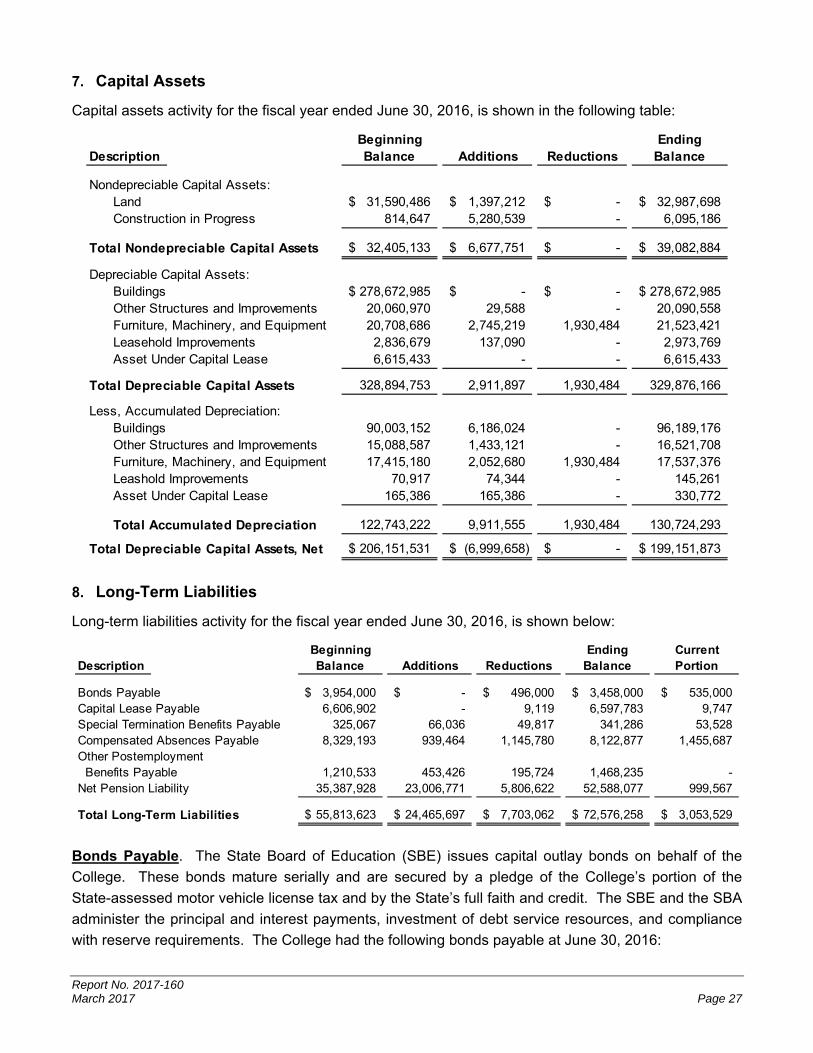
7. Capital Assets
Capital assets activity for the fiscal year ended June 30, 2016, is shown in the following table:
Beginning EndingDescription Balance Additions Reductions Balance
Nondepreciable Capital Assets:Land 31,590,486$ 1,397,212$ -$ 32,987,698$ Construction in Progress 814,647 5,280,539 - 6,095,186
Total Nondepreciable Capital Assets 32,405,133$ 6,677,751$ -$ 39,082,884$
Depreciable Capital Assets:Buildings 278,672,985$ -$ -$ 278,672,985$ Other Structures and Improvements 20,060,970 29,588 - 20,090,558 Furniture, Machinery, and Equipment 20,708,686 2,745,219 1,930,484 21,523,421 Leasehold Improvements 2,836,679 137,090 - 2,973,769 Asset Under Capital Lease 6,615,433 - - 6,615,433
Total Depreciable Capital Assets 328,894,753 2,911,897 1,930,484 329,876,166
Less, Accumulated Depreciation:Buildings 90,003,152 6,186,024 - 96,189,176 Other Structures and Improvements 15,088,587 1,433,121 - 16,521,708 Furniture, Machinery, and Equipment 17,415,180 2,052,680 1,930,484 17,537,376 Leashold Improvements 70,917 74,344 - 145,261 Asset Under Capital Lease 165,386 165,386 - 330,772
Total Accumulated Depreciation 122,743,222 9,911,555 1,930,484 130,724,293
Total Depreciable Capital Assets, Net 206,151,531$ (6,999,658)$ -$ 199,151,873$
8. Long-Term Liabilities
Long-term liabilities activity for the fiscal year ended June 30, 2016, is shown below:
Beginning Ending CurrentDescription Balance Additions Reductions Balance Portion
Bonds Payable 3,954,000$ -$ 496,000$ 3,458,000$ 535,000$ Capital Lease Payable 6,606,902 - 9,119 6,597,783 9,747 Special Termination Benefits Payable 325,067 66,036 49,817 341,286 53,528 Compensated Absences Payable 8,329,193 939,464 1,145,780 8,122,877 1,455,687 Other Postemployment Benefits Payable 1,210,533 453,426 195,724 1,468,235 - Net Pension Liability 35,387,928 23,006,771 5,806,622 52,588,077 999,567
Total Long-Term Liabilities 55,813,623$ 24,465,697$ 7,703,062$ 72,576,258$ 3,053,529$
Bonds Payable. The State Board of Education (SBE) issues capital outlay bonds on behalf of the
College. These bonds mature serially and are secured by a pledge of the College’s portion of the
State-assessed motor vehicle license tax and by the State’s full faith and credit. The SBE and the SBA
administer the principal and interest payments, investment of debt service resources, and compliance
with reserve requirements. The College had the following bonds payable at June 30, 2016:

Report No. 2017-160 Page 28 March 2017
Interest AnnualAmount Rates Maturity
Bond Type Outstanding (Percent) To
SBE Capital Outlay Bonds:Series 2009A, Refunding 210,000$ 5 2019Series 2010A 2,475,000 3.5 - 5 2030Series 2014B, Refundng 773,000 2 - 5 2020
Total 3,458,000$
Annual requirements to amortize all bonded debt outstanding as of June 30, 2016, are as follows:
Fiscal YearEnding June 30 Principal Interest Total
2017 535,000$ 153,635$ 688,635$ 2018 569,000 126,885 695,885 2019 261,000 98,435 359,435 2020 198,000 86,835 284,835 2021 165,000 78,225 243,225 2022-2026 905,000 272,275 1,177,275 2027-2030 825,000 83,225 908,225
Total 3,458,000$ 899,515$ 4,357,515$
SBE Capital Outlay Bonds
Capital Lease Payable. The College entered into a capital lease agreement in the amount of
$6,615,433, at the stated interest rate of 6.77 percent to acquire an administrative office building. The
lease agreement commenced on April 1, 2014, and expires 60 years from this date. The annual lease
payment is $456,461, payable semi-annually on January 1 and July 1 of each year. The lease agreement
contains a purchase option that may be exercised during the period commencing January 1, 2020, and
expiring the earlier of May 31, 2073, or the sale of the property to a third party. Future minimum payments
under the capital lease agreement and the required minimum payments as of June 30, 2016, are as
follows:

Report No. 2017-160 March 2017 Page 29
Fiscal Year Ending June 30 Amount
2017 456,461$ 2018 456,461 2019 456,461 2020 456,461 2021 456,461 2022-2026 2,282,305 2027-2031 2,282,305 2032-2036 2,282,305 2037-2041 2,282,305 2042-2046 2,282,305 2047-2051 2,282,305 2052-2056 2,282,305 2057-2061 2,282,305 2062-2066 2,282,305 2067-2071 2,282,305 2072-2074 1,369,382
Total Minimum Payments 26,474,737 Less, Amount Representing Interest 19,876,954
Present Value of Minimum Payments 6,597,783$
Special Termination Benefits Payable. Executive management employees are provided 7 days of
administrative incentive leave credit each year. Such credit is prorated for each month worked to a
maximum of 35 days. Payment of such credited service is made at the time of termination from full-time
executive management for any other reason other than cause. Accrued benefits for 17 participants at
June 30, 2016, totaled $341,286, of which $53,528 represents the current portion.
Compensated Absences Payable. College employees may accrue annual and sick leave based on
length of service, subject to certain limitations regarding the amount that will be paid upon termination.
The College reports a liability for the accrued leave; however, State noncapital appropriations fund only
the portion of accrued leave that is used or paid in the current fiscal year. Although the College expects
the liability to be funded primarily from future appropriations, generally accepted accounting principles do
not permit the recording of a receivable in anticipation of future appropriations. At June 30, 2016, the
estimated liability for compensated absences, which includes the College’s share of the Florida
Retirement System and FICA contributions, totaled $8,122,877. The current portion of the compensated
absences liability, $1,455,687, is the amount expected to be paid in the coming fiscal year based on a
historically determined average of the current portion in prior years.
Other Postemployment Benefits Payable. The College follows GASB Statement No. 45, Accounting
and Financial Reporting by Employers for Postemployment Benefits Other Than Pensions, for other
postemployment healthcare benefits administered by the College and life insurance benefits through
purchased commercial insurance.
Plan Description. The Other Postemployment Benefits Plan (OPEB Plan) is a single-employer defined
benefit plan administered by the College. Pursuant to the provisions of Section 112.0801,
Florida Statutes, former employees who retire from the College are eligible to participate in the College’s

Report No. 2017-160 Page 30 March 2017
healthcare and life insurance coverage. The College subsidizes the premium rates paid by retirees by
allowing them to participate in the OPEB Plan at reduced or blended group (implicitly subsidized)
premium rates for both active and retired employees. These rates provide an implicit subsidy for retirees
because, on an actuarial basis, their current and future claims are expected to result in higher costs to
the OPEB Plan on average than those of active employees. The College does not offer any explicit
subsidies for retiree coverage. Retirees are required to enroll in the Federal Medicare (Medicare)
program for their primary coverage as soon as they are eligible. The College does not issue a
stand-alone report and the OPEB Plan is not included in the annual report of a public employee retirement
system or another entity.
Funding Policy. OPEB Plan benefits are pursuant to the provisions of Section 112.0801, Florida Statutes,
and the Board of Trustees has established and can amend plan benefits and contribution rates. The
College has not advance-funded or established a funding methodology for the annual other
postemployment benefit (OPEB) costs or the net OPEB obligation, and the OPEB Plan is financed on a
pay-as-you-go basis. For the 2015-16 fiscal year, 137 retirees received OPEB healthcare benefits, and
9 retirees received OPEB life insurance benefits. The College provided required contributions of
$195,724 toward the annual OPEB cost, composed of benefit payments made on behalf of retirees for
claims expenses (net of reinsurance), administrative expenses, and reinsurance premiums. Retiree
contributions totaled $1,022,683, which represents 1.2 percent of covered payroll.
Annual OPEB Cost and Net OPEB Obligation. The College’s annual OPEB cost (expense) is calculated
based on the annual required contribution (ARC), an amount actuarially determined in accordance with
the parameters of GASB Statement No. 45. The ARC represents a level of funding that, if paid on an
ongoing basis, is projected to cover normal cost each year and amortize any unfunded actuarial liabilities
over a period not to exceed 30 years. The following table shows the College’s annual OPEB cost for the
fiscal year, the amount actually contributed to the OPEB Plan, and changes in the College’s net OPEB
obligation:
Description Amount
Normal Cost (Service Cost for One Year) 289,899$ Amortization of Unfunded Actuarial Accrued Liability 159,834
Annual Required Contribution 449,733 Interest on Net OPEB Obligation 48,421 Adjustment to Annual Required Contribution (44,728)
Annual OPEB Cost (Expense) 453,426 Contribution Toward the OPEB Cost (195,724)
Increase in Net OPEB Obligation 257,702 Net OPEB Obligation, Beginning of Year 1,210,533
Net OPEB Obligation, End of Year 1,468,235$
The College’s annual OPEB cost, the percentage of annual OPEB cost contributed to the OPEB Plan,
and the net OPEB obligation as of June 30, 2016, and for the 2 preceding fiscal years were as follows:

Report No. 2017-160 March 2017 Page 31
Percentage ofAnnual
Annual OPEB Cost Net OPEBFiscal Year OPEB Cost Contributed Obligation
2013-14 506,979$ 47.5% 938,519$ 2014-15 532,645 48.9% 1,210,533 2015-16 453,426 43.2% 1,468,235
Funded Status and Funding Progress. As of July 1, 2015, the most recent valuation date, the actuarial
accrued liability for benefits was $4,325,765, and the actuarial value of assets was $0, resulting in an
unfunded actuarial accrued liability of $4,325,765 and a funded ratio of 0 percent. The covered payroll
(annual payroll of active participating employees) was $79,437,477 for the 2015-16 fiscal year, and the
ratio of the unfunded actuarial accrued liability to the covered payroll was 5.4 percent.
Actuarial valuations for an ongoing OPEB Plan involve estimates of the value of reported amounts and
assumptions about the probability of occurrence of events far into the future. Examples include
assumptions about future employment and termination, mortality, and healthcare cost trends. Actuarially
determined amounts regarding the funded status of the OPEB Plan and the annual required contributions
of the employer are subject to continual revision as actual results are compared with past expectations
and new estimates are made about the future. The Schedule of Funding Progress, presented as required
supplementary information following the notes to financial statements, presents multiyear trend
information that shows whether the actuarial value of OPEB Plan assets is increasing or decreasing over
time relative to the actuarial accrued liabilities for benefits.
Actuarial Methods and Assumptions. Projections of benefits for financial reporting purposes are based
on the substantive OPEB Plan provisions, as understood by the employer and participating members,
and include the types of benefits provided at the time of each valuation and the historical pattern of
sharing of benefit costs between the employer and participating members. The actuarial methods and
assumptions used include techniques that are designed to reduce the effects of short-term volatility in
actuarial accrued liabilities and the actuarial value of assets, consistent with the long-term perspective of
the calculations.
The College’s OPEB actuarial valuation as of July 1, 2015, used the entry age normal actuarial method
to estimate the actuarial accrued liability as of June 30, 2016, and the College’s 2015-16 fiscal year ARC.
This method was selected in anticipation of the change outlined in GASB Statement No. 74, Financial
Reporting for Postemployment Benefit Plans Other Than Pension Plans and GASB Statement No. 75,
Accounting and Financial Reporting for Postemployment Benefits Other Than Pensions. Because the
OPEB liability is currently unfunded, the actuarial assumptions included a 4 percent rate of return on
invested assets. The actuarial assumptions also included a payroll growth rate of 3.25 percent per year,
an inflation rate of 2.6 percent, and an annual healthcare cost trend rate of 7.5 percent pre-Medicare and
5.5 percent Medicare for the 2015-16 fiscal year, reduced by decrements to an ultimate rate of 5 percent
after 5 years pre-Medicare and 2 years Medicare. The unfunded actuarial accrued liability is being
amortized as a level percentage of projected payroll amortized over 30 years on an open basis. The
remaining amortization period at June 30, 2016 was 21 years.
Report No. 2017-160 Page 32 March 2017
9. Retirement Plans – Defined Benefit Pension Plans
General Information about the Florida Retirement System (FRS)
The FRS was created in Chapter 121, Florida Statutes, to provide a defined benefit pension plan for
participating public employees. The FRS was amended in 1998 to add the Deferred Retirement Option
Program (DROP) under the defined benefit plan and amended in 2000 to provide a defined contribution
plan alternative to the defined benefit plan for FRS members effective July 1, 2002. This integrated
defined contribution pension plan is the FRS Investment Plan. Chapter 112, Florida Statutes, established
the HIS Program, a cost-sharing multiple-employer defined benefit pension plan to assist retired
members of any State-administered retirement system in paying the costs of health insurance.
Chapter 121, Florida Statutes, also provides for nonintegrated, optional retirement programs in lieu of the
FRS to certain members of the Senior Management Service Class employed by the State and faculty
and specified employees of State colleges.
Essentially all regular employees of the College are eligible to enroll as members of the
State-administered FRS. Provisions relating to the FRS are established by Chapters 121 and 122,
Florida Statutes; Chapter 112, Part IV, Florida Statutes; Chapter 238, Florida Statutes; and FRS Rules,
Chapter 60S, Florida Administrative Code; wherein eligibility, contributions, and benefits are defined and
described in detail. Such provisions may be amended at any time by further action from the
Florida Legislature. The FRS is a single retirement system administered by the Florida Department of
Management Services, Division of Retirement, and consists of two cost-sharing multiple-employer
defined benefit plans and other nonintegrated programs. A comprehensive annual financial report of the
FRS, which includes its financial statements, required supplementary information, actuarial report, and
other relevant information, is available from the Florida Department of Management Services’ Web site
(www.dms.myflorida.com).
The College’s FRS and HIS pension expense totaled $4,902,476 for the fiscal year ended June 30, 2016.
FRS Pension Plan
Plan Description. The FRS Pension Plan (Plan) is a cost-sharing multiple-employer defined benefit
pension plan, with a DROP for eligible employees. The general classes of membership are as follows:
Regular Class – Members of the FRS who do not qualify for membership in the other classes.
Senior Management Service Class (SMSC) – Members in senior management level positions.
Employees enrolled in the Plan prior to July 1, 2011, vest at 6 years of creditable service and employees
enrolled in the Plan on or after July 1, 2011, vest at 8 years of creditable service. All vested members,
enrolled prior to July 1, 2011, are eligible for normal retirement benefits at age 62 or at any age after
30 years of service. All members enrolled in the Plan on or after July 1, 2011, once vested, are eligible
for normal retirement benefits at age 65 or any time after 33 years of creditable service. Employees
enrolled in the Plan may include up to 4 years of credit for military service toward creditable service. The
Plan also includes an early retirement provision; however, there is a benefit reduction for each year a
member retires before his or her normal retirement date. The Plan provides retirement, disability, death
benefits, and annual cost-of-living adjustments to eligible participants.

Report No. 2017-160 March 2017 Page 33
DROP, subject to provisions of Section 121.091, Florida Statutes, permits employees eligible for normal
retirement under the Plan to defer receipt of monthly benefit payments while continuing employment with
an FRS-participating employer. An employee may participate in DROP for a period not to exceed
60 months after electing to participate. During the period of DROP participation, deferred monthly
benefits are held in the FRS Trust Fund and accrue interest. The net pension liability does not include
amounts for DROP participants, as these members are considered retired and are not accruing additional
pension benefits.
Benefits Provided. Benefits under the Plan are computed on the basis of age and/or years of service,
average final compensation, and service credit. Credit for each year of service is expressed as a
percentage of the average final compensation. For members initially enrolled before July 1, 2011, the
average final compensation is the average of the 5 highest fiscal years’ earnings; for members initially
enrolled on or after July 1, 2011, the average final compensation is the average of the 8 highest fiscal
years’ earnings. The total percentage value of the benefit received is determined by calculating the total
value of all service, which is based on retirement plan and/or the class to which the member belonged
when the service credit was earned. Members are eligible for in-line-of-duty or regular disability and
survivors’ benefits. The following chart shows the percentage value for each year of service credit
earned:
Class, Initial Enrollment, and Retirement Age/Years of Service % Value
Regular Class members initially enrolled before July 1, 2011 Retirement up to age 62 or up to 30 years of service 1.60 Retirement at age 63 or with 31 years of service 1.63 Retirement at age 64 or with 32 years of service 1.65 Retirement at age 65 or with 33 or more years of service 1.68
Regular Class members initially enrolled on or after July 1, 2011 Retirement up to age 65 or up to 33 years of service 1.60 Retirement at age 66 or with 34 years of service 1.63 Retirement at age 67 or with 35 years of service 1.65 Retirement at age 68 or with 36 or more years of service 1.68
Senior Management Service Class 2.00
As provided in Section 121.101, Florida Statutes, if the member is initially enrolled in the FRS before
July 1, 2011, and all service credit was accrued before July 1, 2011, the annual cost-of-living adjustment
is 3 percent per year. If the member is initially enrolled before July 1, 2011, and has service credit on or
after July 1, 2011, there is an individually calculated cost-of-living adjustment. The annual cost-of-living
adjustment is a proportion of 3 percent determined by dividing the sum of the pre-July 2011 service credit
by the total service credit at retirement multiplied by 3 percent. Plan members initially enrolled on or after
July 1, 2011, will not have a cost-of-living adjustment after retirement.
Contributions. The Florida Legislature establishes contribution rates for participating employers and
employees. Contribution rates during the 2015-16 fiscal year were as follows:
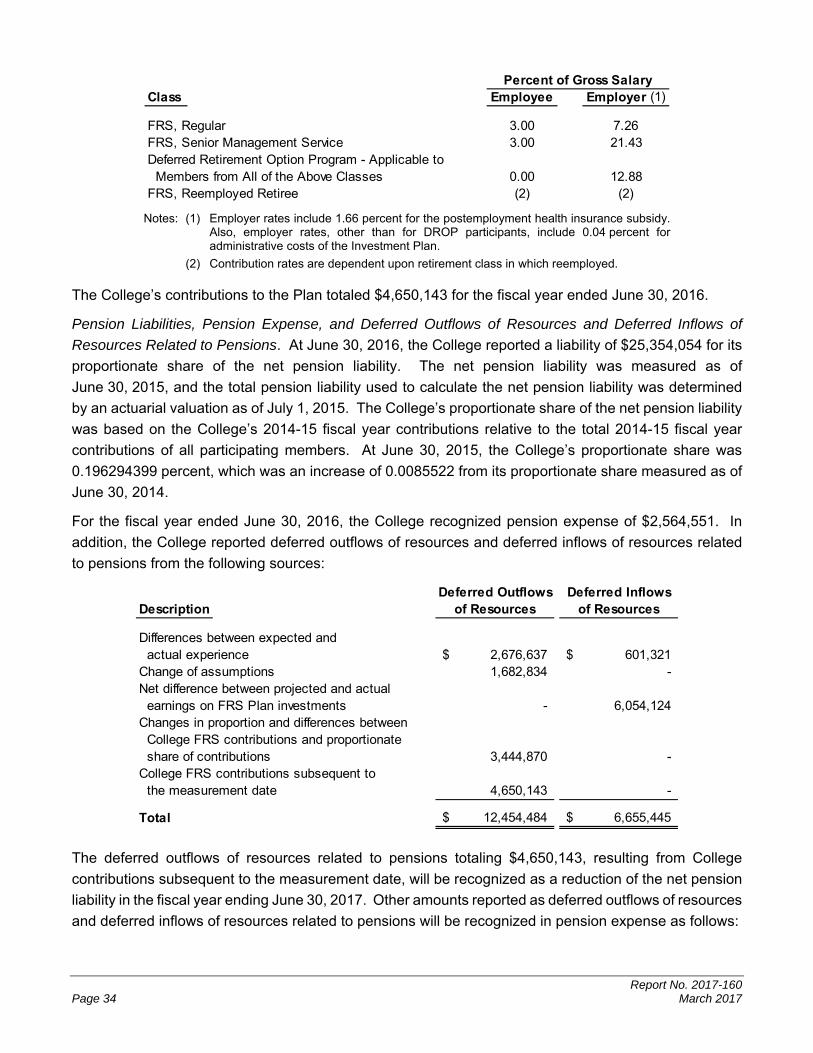
Report No. 2017-160 Page 34 March 2017
Percent of Gross SalaryClass Employee Employer (1)
FRS, Regular 3.00 7.26FRS, Senior Management Service 3.00 21.43Deferred Retirement Option Program - Applicable to Members from All of the Above Classes 0.00 12.88FRS, Reemployed Retiree (2) (2)
Notes: (1) Employer rates include 1.66 percent for the postemployment health insurance subsidy. Also, employer rates, other than for DROP participants, include 0.04 percent for administrative costs of the Investment Plan.
(2) Contribution rates are dependent upon retirement class in which reemployed.
The College’s contributions to the Plan totaled $4,650,143 for the fiscal year ended June 30, 2016.
Pension Liabilities, Pension Expense, and Deferred Outflows of Resources and Deferred Inflows of
Resources Related to Pensions. At June 30, 2016, the College reported a liability of $25,354,054 for its
proportionate share of the net pension liability. The net pension liability was measured as of
June 30, 2015, and the total pension liability used to calculate the net pension liability was determined
by an actuarial valuation as of July 1, 2015. The College’s proportionate share of the net pension liability
was based on the College’s 2014-15 fiscal year contributions relative to the total 2014-15 fiscal year
contributions of all participating members. At June 30, 2015, the College’s proportionate share was
0.196294399 percent, which was an increase of 0.0085522 from its proportionate share measured as of
June 30, 2014.
For the fiscal year ended June 30, 2016, the College recognized pension expense of $2,564,551. In
addition, the College reported deferred outflows of resources and deferred inflows of resources related
to pensions from the following sources:
Deferred Outflows Deferred InflowsDescription of Resources of Resources
Differences between expected and actual experience 2,676,637$ 601,321$ Change of assumptions 1,682,834 - Net difference between projected and actual earnings on FRS Plan investments - 6,054,124 Changes in proportion and differences between College FRS contributions and proportionate share of contributions 3,444,870 - College FRS contributions subsequent to the measurement date 4,650,143 -
Total 12,454,484$ 6,655,445$
The deferred outflows of resources related to pensions totaling $4,650,143, resulting from College
contributions subsequent to the measurement date, will be recognized as a reduction of the net pension
liability in the fiscal year ending June 30, 2017. Other amounts reported as deferred outflows of resources
and deferred inflows of resources related to pensions will be recognized in pension expense as follows:

Report No. 2017-160 March 2017 Page 35
Fiscal Year Ending June 30 Amount
2017 (1,201,481)$ 2018 (1,201,481) 2019 (1,201,481) 2020 3,575,743 2021 959,892 Thereafter 217,704
Total 1,148,896$
Actuarial Assumptions. The total pension liability in the July 1, 2015, actuarial valuation was determined
using the following actuarial assumptions, applied to all periods included in the measurement:
Inflation 2.60 percentSalary increases 3.25 percent, average, including inflationInvestment rate of return 7.65 percent, net of pension plan investment
expense, including inflation
Mortality rates were based on the Generational RP-2000 with Projection Scale BB.
The actuarial assumptions used in the July 1, 2015, valuation were based on the results of an actuarial
experience study for the period July 1, 2008, through June 30, 2013.
The long-term expected rate of return on pension plan investments was not based on historical returns,
but instead is based on a forward-looking capital market economic model. The allocation policy’s
description of each asset class was used to map the target allocation to the asset classes shown below.
Each asset class assumption is based on a consistent set of underlying assumptions, and includes an
adjustment for the inflation assumption. The target allocation and best estimates of arithmetic and
geometric real rates of return for each major asset class are summarized in the following table:
CompoundAnnual Annual
Target Arithmetic (Geometric) StandardAsset Class Allocation (1) Return Return Deviation
Cash 1% 3.2% 3.1% 1.7%Fixed Income 18% 4.8% 4.7% 4.7%Global Equity 53% 8.5% 7.2% 17.7%Real Estate (Property) 10% 6.8% 6.2% 12.0%Private Equity 6% 11.9% 8.2% 30.0%Strategic Investments 12% 6.7% 6.1% 11.4%
Total 100%
Assumed inflation - Mean 2.6% 1.9%
Note: (1) As outlined in the Plan's investment policy.
Discount Rate. The discount rate used to measure the total pension liability was 7.65 percent. The
Plan’s fiduciary net position was projected to be available to make all projected future benefit payments
of current active and inactive employees. Therefore, the discount rate for calculating the total pension
liability is equal to the long-term expected rate of return.
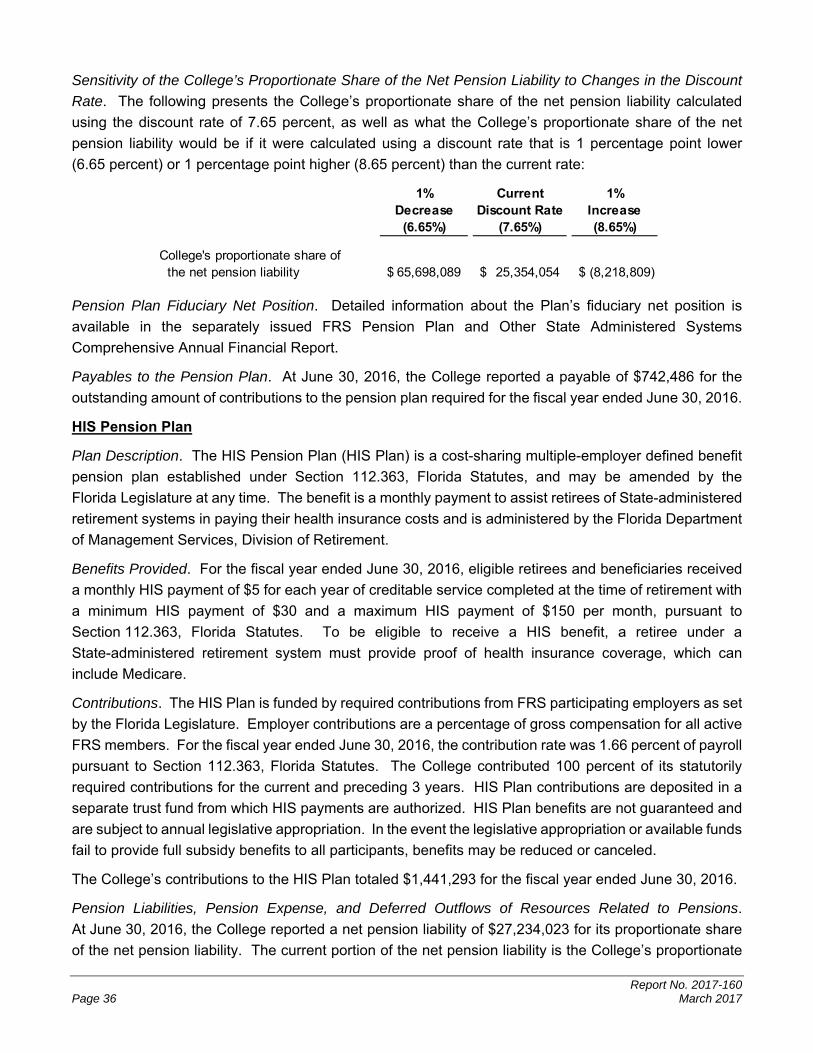
Report No. 2017-160 Page 36 March 2017
Sensitivity of the College’s Proportionate Share of the Net Pension Liability to Changes in the Discount
Rate. The following presents the College’s proportionate share of the net pension liability calculated
using the discount rate of 7.65 percent, as well as what the College’s proportionate share of the net
pension liability would be if it were calculated using a discount rate that is 1 percentage point lower
(6.65 percent) or 1 percentage point higher (8.65 percent) than the current rate:
1% Current 1%Decrease Discount Rate Increase
(6.65%) (7.65%) (8.65%)
College's proportionate share of the net pension liability 65,698,089$ 25,354,054$ (8,218,809)$
Pension Plan Fiduciary Net Position. Detailed information about the Plan’s fiduciary net position is
available in the separately issued FRS Pension Plan and Other State Administered Systems
Comprehensive Annual Financial Report.
Payables to the Pension Plan. At June 30, 2016, the College reported a payable of $742,486 for the
outstanding amount of contributions to the pension plan required for the fiscal year ended June 30, 2016.
HIS Pension Plan
Plan Description. The HIS Pension Plan (HIS Plan) is a cost-sharing multiple-employer defined benefit
pension plan established under Section 112.363, Florida Statutes, and may be amended by the
Florida Legislature at any time. The benefit is a monthly payment to assist retirees of State-administered
retirement systems in paying their health insurance costs and is administered by the Florida Department
of Management Services, Division of Retirement.
Benefits Provided. For the fiscal year ended June 30, 2016, eligible retirees and beneficiaries received
a monthly HIS payment of $5 for each year of creditable service completed at the time of retirement with
a minimum HIS payment of $30 and a maximum HIS payment of $150 per month, pursuant to
Section 112.363, Florida Statutes. To be eligible to receive a HIS benefit, a retiree under a
State-administered retirement system must provide proof of health insurance coverage, which can
include Medicare.
Contributions. The HIS Plan is funded by required contributions from FRS participating employers as set
by the Florida Legislature. Employer contributions are a percentage of gross compensation for all active
FRS members. For the fiscal year ended June 30, 2016, the contribution rate was 1.66 percent of payroll
pursuant to Section 112.363, Florida Statutes. The College contributed 100 percent of its statutorily
required contributions for the current and preceding 3 years. HIS Plan contributions are deposited in a
separate trust fund from which HIS payments are authorized. HIS Plan benefits are not guaranteed and
are subject to annual legislative appropriation. In the event the legislative appropriation or available funds
fail to provide full subsidy benefits to all participants, benefits may be reduced or canceled.
The College’s contributions to the HIS Plan totaled $1,441,293 for the fiscal year ended June 30, 2016.
Pension Liabilities, Pension Expense, and Deferred Outflows of Resources Related to Pensions.
At June 30, 2016, the College reported a net pension liability of $27,234,023 for its proportionate share
of the net pension liability. The current portion of the net pension liability is the College’s proportionate

Report No. 2017-160 March 2017 Page 37
share of benefit payments expected to be paid within 1 year, net of the College’s proportionate share of
the HIS Plan’s fiduciary net position available to pay that amount. The net pension liability was measured
as of June 30, 2015, and the total pension liability used to calculate the net pension liability was
determined by applying update procedures to the HIS Plan actuarial valuation as of July 1, 2014. The
College’s proportionate share of the net pension liability was based on the College’s 2014-15 fiscal year
contributions relative to the total 2014-15 fiscal year contributions of all participating members. At June
30, 2015, the College’s proportionate share was 0.267041405 percent, which was an increase of
0.011081313 from its proportionate share measured as of June 30, 2014.
For the fiscal year ended June 30, 2016, the College recognized pension expense of $2,337,925. In
addition, the College reported deferred outflows of resources related to pensions from the following
sources:
Deferred OutflowsDescription of Resources
Change of assumptions 2,142,607$ Net difference between projected and actual earnings on HIS Plan investments 14,743 Changes in proportion and differences between College HIS contributions and proportionate share of HIS contributions 1,745,483 College contributions subsequent to the measurement date 1,441,293
Total 5,344,126$
The deferred outflows of resources totaling $1,441,293, resulting from College contributions subsequent
to the measurement date, will be recognized as a reduction of the net pension liability in the fiscal year
ending June 30, 2017. Other amounts reported as deferred outflows of resources related to pensions
will be recognized in pension expense as follows:
Fiscal Year Ending June 30 Amount
2017 681,134$ 2018 681,134 2019 681,134 2020 678,261 2021 676,730 Thereafter 504,440
Total 3,902,833$
Actuarial Assumptions. The total pension liability at July 1, 2015, determined by applying update
procedures to the actuarial valuation at July 1, 2014, used the following actuarial assumptions, applied
to all periods included in the measurement:
Inflation 2.60 percentSalary increases 3.25 percent, average, including inflationMunicipal bond rate 3.80 percent

Report No. 2017-160 Page 38 March 2017
Mortality rates were based on the Generational RP-2000 with Projected Scale BB.
While an experience study had not been completed for the HIS Plan, the actuarial assumptions that
determined the total pension liability for the HIS Plan were based on certain results of the most recent
experience study for the FRS Plan.
Discount Rate. The discount rate used to measure the total pension liability was 3.8 percent. In general,
the discount rate for calculating the total pension liability is equal to the single rate equivalent to
discounting at the long-term expected rate of return for benefit payments prior to the projected depletion
date. Because the HIS benefit is essentially funded on a pay-as-you-go basis, the depletion date is
considered to be immediate, and the single equivalent discount rate is equal to the municipal bond rate
selected by the plan sponsor. The Bond Buyer General Obligation 20-Bond Municipal Bond Index was
adopted as the applicable municipal bond index. The discount rate used to determine the total pension
liability decreased from 4.29 percent from the prior measurement date.
Sensitivity of the College’s Proportionate Share of the Net Pension Liability to Changes in the Discount
Rate. The following presents the College’s proportionate share of the net pension liability calculated
using the discount rate of 3.8 percent, as well as what the College’s proportionate share of the net pension
liability would be if it were calculated using a discount rate that is 1 percentage point lower (2.8 percent)
or 1 percentage point higher (4.8 percent) than the current rate:
1% Current 1%Decrease Discount Rate Increase
(2.80%) (3.80%) (4.80%)
College's proportionate share of the net pension liability 31,031,901$ 27,234,023$ 24,067,162$
Pension Plan Fiduciary Net Position. Detailed information about the HIS Plan’s fiduciary net position is
available in the separately issued FRS Pension Plan and Other State Administered Systems
Comprehensive Annual Financial Report.
Payables to the Pension Plan. At June 30, 2016, the College reported a payable of $9,234 for the
outstanding amount of contributions to the HIS Plan required for the fiscal year ended June 30, 2016.
10. Retirement Plans – Defined Contribution Pension Plans
FRS Investment Plan. The SBA administers the defined contribution plan officially titled the FRS
Investment Plan (Investment Plan). The Investment Plan is reported in the SBA’s annual financial
statements and in the State of Florida Comprehensive Annual Financial Report.
As provided in Section 121.4501, Florida Statutes, eligible FRS members may elect to participate in the
Investment Plan in lieu of the FRS defined benefit plan. College employees already participating in the
State College System Optional Retirement Program or DROP are not eligible to participate in the
Investment Plan. Employer and employee contributions are defined by law, but the ultimate benefit
depends in part on the performance of investment funds. Service retirement benefits are based upon
the value of the member’s account upon retirement. Benefit terms, including contribution requirements,
are established and may be amended by the Florida Legislature. The Investment Plan is funded with the
same employer and employee contributions rates, that are based on salary and membership class

Report No. 2017-160 March 2017 Page 39
(Regular Class, Senior Management Service Class, etc.), as the FRS defined benefit plan. Contributions
are directed to individual member accounts, and the individual members allocate contributions and
account balances among various approved investment choices. Costs of administering the Investment
Plan, including the FRS Financial Guidance Program, are funded through an employer contribution of
0.04 percent of payroll and by forfeited benefits of Investment Plan members. Allocations to the
Investment Plan member accounts during the 2015-16 fiscal year were as follows:
Percent ofGross
Class CompensationFRS, Regular 6.30FRS, Senior Management Service 7.67
For all membership classes, employees are immediately vested in their own contributions and are vested
after 1 year of service for employer contributions and investment earnings regardless of membership
class. If an accumulated benefit obligation for service credit originally earned under the FRS Pension
Plan is transferred to the Investment Plan, the member must have the years of service required for FRS
Pension Plan vesting (including the service credit represented by the transferred funds) to be vested for
these funds and the earnings on the funds. Nonvested employer contributions are placed in a suspense
account for up to 5 years. If the employee returns to FRS-covered employment within the 5-year period,
the employee will regain control over their account. If the employee does not return within the
5-year period, the employee will forfeit the accumulated account balance. For the fiscal year ended
June 30, 2016, the information for the amount of forfeitures was unavailable from the SBA; however,
management believes that these amounts, if any, would be immaterial to the College.
After termination and applying to receive benefits, the member may rollover vested funds to another
qualified plan, structure a periodic payment under the Investment Plan, receive a lump-sum distribution,
leave the funds invested for future distribution, or any combination of these options. Disability coverage
is provided in which the member may either transfer the account balance to the FRS Pension Plan when
approved for disability retirement to receive guaranteed lifetime monthly benefits under the FRS Pension
Plan, or remain in the Investment Plan and rely upon that account balance for retirement income.
The College’s Investment Plan pension expense totaled $1,803,776 for the fiscal year ended
June 30, 2016.
State College System Optional Retirement Program. Section 1012.875, Florida Statutes, provides
for an Optional Retirement Program (Program) for eligible college instructors and administrators. The
Program is designed to aid colleges in recruiting employees by offering more portability to employees not
expected to remain in the FRS for 8 or more years.
The Program is a defined contribution plan, which provides full and immediate vesting of all contributions
submitted to the participating companies on behalf of the participant. Employees in eligible positions can
make an irrevocable election to participate in the Program, rather than the FRS, and purchase retirement
and death benefits through contracts provided by certain insurance carriers. The employing college
contributes 5.15 percent of the participant’s salary to the participant’s account, 2.65 percent to cover the
unfunded actuarial liability of the FRS pension plan, and 0.01 percent to cover the administrative costs,

Report No. 2017-160 Page 40 March 2017
for a total of 7.8 percent, and employees contribute 3 percent of the employee’s salary. Additionally, the
employee may contribute, by payroll deduction, an amount not to exceed the percentage contributed by
the college to the participant’s annuity account. The contributions are invested in the company or
companies selected by the participant to create a fund for the purchase of annuities at retirement.
The College’s contributions to the Program totaled $448,301 and employee contributions totaled
$261,146 for the 2015-16 fiscal year.
11. Operating Lease Commitments
The College leased a building under an operating lease, which expires in 2022. This leased asset and
the related commitments are not reported on the College’s statement of net position. Operating lease
payments are recorded as expenses when paid or incurred. Outstanding commitments resulting from
this lease agreement are contingent upon future appropriations. Future minimum lease commitments for
this noncancelable operating lease are as follows:
Fiscal Year Ending June 30 Amount
2017 90,695$ 2018 90,695 2019 97,566 2020 107,185 2021 107,185 2022-2023 133,981
Total Minimum Payments Required 627,307$
12. Capital Expenses and Commitments
The College’s construction commitments at June 30, 2016 is as follows:
Total Completed BalanceProject Description Commitment to Date Committed
East Campus, Building 9 13,034,906$ 1,873,224$ 11,161,682$ Poinciana Campus, Building 1 6,772,094 1,799,573 4,972,521 East Campus, Maintenance Building 3,379,035 2,422,389 956,646
Total $ 23,186,035 $ 6,095,186 $ 17,090,849
13. Risk Management Programs
The College is exposed to various risks of loss related to torts; theft of, damage to, and destruction of
assets; errors and omissions; injuries to employees; and natural disasters. The College provided
coverage for these risks primarily through the Florida College System Risk Management Consortium
(Consortium), which was created under authority of Section 1001.64(27), Florida Statutes, by the boards
of trustees of the Florida public colleges for the purpose of joining a cooperative effort to develop,
implement, and participate in a coordinated Statewide college risk management program. The
Consortium is self-sustaining through member assessments (premiums) and purchases excess
insurance through commercial companies for claims in excess of specified amounts. Excess insurance
from commercial companies provided coverage of up to $200 million for property insurance. Insurance

Report No. 2017-160 March 2017 Page 41
coverage obtained through the Consortium included fire and extended property, general and automobile
liability, workers’ compensation, and other liability coverage. Settled claims resulting from these risks
have not exceeded commercial coverage in any of the past 3 fiscal years.
Life, dental, and vision coverage are provided through purchased commercial insurance with minimum
deductibles for each line of coverage.
Self-Insured Program. The Board has established an individual self-insured program to provide group
health insurance for its employees, retirees, former employees, and their dependents. The College’s
liability was limited by excess reinsurance to $250,000 per insured person through December 2015, and
$500,000 from January 2016. The plan is provided by an insurance company licensed by the Florida
Department of Financial Services, Office of Insurance Regulation. The College contributes employee
premiums as a fringe benefit. Employee dependent coverage is by payroll deduction and coverage for
retirees, former employees, and their dependents is by prepaid premium.
The College reports a liability when it is probable that a loss has occurred and the amount of that loss
can be reasonably estimated. The liability includes an amount for claims that have been incurred, but
not reported, and an amount for claims administration expense. Because the actual claims liability
depends on such complex factors as inflation, change in legal doctrines, and damage awards, the
process used in computing the claims liability does not necessarily result in an exact amount. The
College reevaluates the claims liability periodically and the claims liability totaled $9,465,465 as of
June 30, 2016. Amounts held by the College in excess of the estimated insurance claims liability at
June 30, 2016, totaled $8,549,245 and are classified as insurance claim deposits. The College will use
these amounts to pay claims incurred in future fiscal years.
The following schedule represents the changes in claims liability for the current and prior years for the
College’s self-insured program:
Beginning Claims and End ofFiscal of Fiscal Changes in Claim FiscalYear Year Estimates Payments Year
2014-15 8,090,084$ 12,684,665$ (10,029,543)$ 10,745,206$ 2015-16 10,745,206 10,473,468 (11,753,209) 9,465,465
14. Functional Distribution of Operating Expenses
The functional classification of an operating expense (instruction, academic support, etc.) is assigned to
a department based on the nature of the activity, which represents the material portion of the activity
attributable to the department. For example, activities of an academic department for which the primary
departmental function is instruction may include some activities other than direct instruction such as
public service. However, when the primary mission of the department consists of instructional program
elements, all expenses of the department are reported under the instruction classification. The operating
expenses on the statement of revenues, expenses, and changes in net position are presented by natural
classifications. The following are those same expenses presented in functional classifications as
recommended by NACUBO:

Report No. 2017-160 Page 42 March 2017
Functional Classification Amount
Instruction 81,383,756$ Academic Support 19,567,604 Student Services 28,042,050 Institutional Support 37,127,575 Operation and Maintenance of Plant 27,335,013 Scholarships and Waivers 30,607,272 Depreciation 9,911,555 Auxiliary Enterprises 16,110,058
Total Operating Expenses 250,084,883$
15. Related Party Transactions
The College’s component unit, the Valencia College Foundation, Inc. (Foundation), purchased a
57,680 square foot building in MetroWest, near the West Campus, which it leases to the College as
discussed in Note 8. The rent amount to be paid by the College reflects a 6.77 percent return on the
Foundation’s total cost basis for the amount expended on the acquisition of and structural improvements
to the building. The lease commencement date was April 1, 2014, and expires 60 years from this date.
The rental payment is $456,461 per year, payable semi-annually on January 1 and July 1 of each year.
The lease contains a purchase option that may be exercised during the period commencing on January
1, 2020, and expiring on the earlier of May 31, 2073, or the sale of the property to a third party. The
purchase price will be the Foundation’s cost basis as of the date the College notifies the Foundation of
its election to exercise the purchase option.

Report No. 2017-160 March 2017 Page 43
OTHER REQUIRED SUPPLEMENTARY INFORMATION
Schedule of Funding Progress – Other Postemployment Benefits Plan
Actuarial UAAL as aActuarial Accrued Unfunded Percentage
Actuarial Value of Liability (AAL) AAL Funded Covered of CoveredValuation Assets (1) (UAAL) Ratio Payroll Payroll
Date (a) (b) (b-a) (a/b) (c) [(b-a)/c]
7/1/2011 -$ 2,931,917$ 2,931,917$ 0% 69,025,900$ 4.3%7/1/2013 - 4,711,673 4,711,673 0% 67,789,927 7.0%7/1/2015 - 4,325,765 4,325,765 0% 79,437,477 5.4%
Note: (1) The OPEB actuarial valuation used the projected unit cost method for the 7/1/2011 and 7/1/2013 valuations and the entry age normal method for the 7/1/2015 valuation to estimate the actuarial accrued liability.
Schedule of the College’s Proportionate Share of the Net Pension Liability –
Florida Retirement System Pension Plan
2015 (1) 2014 (1) 2013 (1)College's proportion of the FRS net pension liability 0.196294399% 0.187742199% 0.167975911%
College's proportionate share of the FRS net pension liability 25,354,054$ 11,455,035$ 28,916,130$
College's covered-employee payroll (2) 90,177,274$ 85,319,642$ 78,946,546$
College's proportionate share of the FRS net pension liability as a percentage of its covered-employee payroll 28.12% 13.43% 36.63%
FRS Plan fiduciary net position as a percentage of the total pension liability 92.00% 96.09% 88.54%
Notes: (1) The amounts presented for each fiscal year were determined as of June 30.
(2) Covered-employee payroll includes defined benefit plan actives, investment plan members, and members in DROP because total employer contributions are determined on a uniform basis (blended rate) as required by Part III of Chapter 121, Florida Statutes.

Report No. 2017-160 Page 44 March 2017
Schedule of College Contributions – Florida Retirement System Pension Plan
2016 (1) 2015 (1) 2014 (1)Contractually required FRS contribution $ 4,650,143 $ 4,785,824 $ 4,112,351
FRS contributions in relation to the contractually required contribution (4,650,143) (4,785,824) (4,112,351)
FRS contribution deficiency (excess) -$ -$ -$
College's covered-employee payroll (2) 96,187,891$ 90,177,274$ 85,319,642$
FRS contributions as a percentage of covered-employee payroll 4.83% 5.31% 4.82%
Notes: (1) The amounts presented for each fiscal year were determined as of June 30.
(2) Covered-employee payroll includes defined benefit plan actives, investment plan members, and members in DROP because total employer contributions are determined on a uniform basis (blended rate) as required by Part III of Chapter 121, Florida Statutes.
Schedule of the College’s Proportionate Share of the Net Pension Liability –
Health Insurance Subsidy Pension Plan
2015 (1) 2014 (1) 2013 (1)College's proportion of the HIS net pension liability 0.267041405% 0.255960092% 0.241878469%
College's proportionate share of the HIS net pension liability 27,234,023$ 23,932,893$ 21,058,701$
College's covered-employee payroll (2) 90,177,274$ 85,319,642$ 78,946,546$
College's proportionate share of the HIS net pension liability as a percentage of its covered-employee payroll 30.20% 28.05% 26.67%
HIS Plan fiduciary net position as a percentage of the total pension liability 0.50% 0.99% 1.78%
Notes: (1) The amounts presented for each fiscal year were determined as of June 30.
(2) Covered-employee payroll includes defined benefit plan actives, investment plan members, and members in DROP.
Schedule of College Contributions – Health Insurance Subsidy Pension Plan
2016 (1) 2015 (1) 2014 (1)
Contractually required HIS contribution $ 1,441,293 $ 1,020,798 $ 876,833
HIS contributions in relation to the contractually required HIS contribution (1,441,293) (1,020,798) (876,833)
HIS contribution deficiency (excess) -$ -$ -$
College's covered-employee payroll (2) 96,187,891$ 90,177,274$ 85,319,642$
HIS contributions as a percentage of covered-employee payroll 1.50% 1.13% 1.03%
Notes: (1) The amounts presented for each fiscal year were determined as of June 30.
(2) Covered-employee payroll includes defined benefit plan actives, investment plan members, and members in DROP.

Report No. 2017-160 March 2017 Page 45
NOTES TO REQUIRED SUPPLEMENTARY INFORMATION
1. Schedule of Funding Progress – Other Postemployment Benefit Plan
The July 1, 2015, unfunded actuarial liability of $4,325,765 was lower than the July 1, 2013, liability of
$4,711,673 primarily due to:
Demographic assumptions (rates of withdrawal, retirement, disability and mortality) were revised to be consistent with those used for the Florida Retirement System (FRS).
The assumed rates in the participation in the Plan were adjusted to reflect current experience.
The assumed per capita costs of healthcare were updated.
The assumed rates of healthcare inflation used to project the per capita healthcare costs were revised to reflect recent experience.
The general payroll growth rate and salary scale assumptions were revised to be consistent with the rates used by the FRS.
The actuarial cost method was changed from projected unit credit to entry age normal in anticipation of new disclosure requirements developed by the Governmental Accounting Standards Board.
2. Schedule of Net Pension Liability and Schedule of Contributions – Health Insurance Subsidy Pension Plan
Changes of Assumptions. The municipal rate used to determine the total pension liability decreased from
4.29 percent to 3.80 percent.

Report No. 2017-160 Page 46 March 2017
Phone: (850) 412-2722 Fax: (850) 488-6975
Sherrill F. Norman, CPA Auditor General
AUDITOR GENERAL STATE OF FLORIDA Claude Denson Pepper Building, Suite G74
111 West Madison Street Tallahassee, Florida 32399-1450
The President of the Senate, the Speaker of the House of Representatives, and the Legislative Auditing Committee
INDEPENDENT AUDITOR’S REPORT ON INTERNAL CONTROL OVER
FINANCIAL REPORTING AND ON COMPLIANCE AND OTHER MATTERS
BASED ON AN AUDIT OF FINANCIAL STATEMENTS PERFORMED
IN ACCORDANCE WITH GOVERNMENT AUDITING STANDARDS
We have audited, in accordance with the auditing standards generally accepted in the United States of
America and the standards applicable to financial audits contained in Government Auditing Standards
issued by the Comptroller General of the United States, the financial statements of Valencia College, a
component unit of the State of Florida, and its discretely presented component unit as of and for the fiscal
year ended June 30, 2016, and the related notes to the financial statements, which collectively comprise
the College’s basic financial statements, and have issued our report thereon dated March 9, 2017,
included under the heading INDEPENDENT AUDITOR’S REPORT. Our report includes a reference to
other auditors who audited the financial statements of the discretely presented component unit, as
described in our report on the College’s financial statements. This report does not include the results of
the other auditors’ testing of internal control over financial reporting or compliance and other matters that
are reported on separately by those auditors.
Internal Control Over Financial Reporting
In planning and performing our audit of the financial statements, we considered the College’s internal
control over financial reporting (internal control) to determine audit procedures that are appropriate in the
circumstances for the purpose of expressing our opinions on the financial statements, but not for the
purpose of expressing an opinion on the effectiveness of the College’s internal control. Accordingly, we
do not express an opinion on the effectiveness of the College’s internal control.
A deficiency in internal control exists when the design or operation of a control does not allow
management or employees, in the normal course of performing their assigned functions, to prevent, or
detect and correct, misstatements on a timely basis. A material weakness is a deficiency, or a
combination of deficiencies, in internal control such that there is a reasonable possibility that a material
misstatement of the College’s financial statements will not be prevented, or detected and corrected on a
timely basis. A significant deficiency is a deficiency, or a combination of deficiencies, in internal control

Report No. 2017-160 March 2017 Page 47
that is less severe than a material weakness, yet important enough to merit attention by those charged
with governance.
Our consideration of internal control was for the limited purpose described in the first paragraph of this
section and was not designed to identify all deficiencies in internal control that might be material
weaknesses or significant deficiencies. Given these limitations, during our audit we did not identify any
deficiencies in internal control that we consider to be material weaknesses. However, material
weaknesses may exist that have not been identified.
Compliance and Other Matters
As part of obtaining reasonable assurance about whether the College’s financial statements are free from
material misstatement, we performed tests of its compliance with certain provisions of laws, rules,
regulations, contracts, and grant agreements, noncompliance with which could have a direct and material
effect on the determination of financial statement amounts. However, providing an opinion on compliance
with those provisions was not an objective of our audit and, accordingly, we do not express such an
opinion. The results of our tests disclosed no instances of noncompliance or other matters that are
required to be reported under Government Auditing Standards.
Purpose of this Report
The purpose of this report is solely to describe the scope of our testing of internal control and compliance
and the results of that testing, and not to provide an opinion on the effectiveness of the College’s internal
control or on compliance. This report is an integral part of an audit performed in accordance with
Government Auditing Standards in considering the College’s internal control and compliance.
Accordingly, this report is not suitable for any other purpose.
Respectfully submitted,
Sherrill F. Norman, CPA Tallahassee, Florida March 9, 2017