Embed Size (px)
Citation preview

Goomig-Knox
SurfaceWaterManagementReport2016
January2017

Goomig-Knox Surface Water Management Report 2016 2
SUMMARYANDKEYPOINTS 3
1.0 OVERVIEW 4
2.0 IRRIGATIONSEASON2016 4
2.1 WATERTOGOOMIG 42.2 ON-FARMWATERUSE 42.3 IRRIGATIONSYSTEMEFFICIENCY 5
3.0 SURFACEANDTAILWATERMONITORING 6
3.1 TAILWATERQUALITY2016 63.1.2ATRAZINE 73.1.3NITROGENANDPHOSPHORUS 83.1.4ECANDPH 93.2 DW1GAUGINGSTATION 93.3 BORDERCREEKGAUGINGSTATION 113.4 KEEPRIVERGAUGINGSTATION 12
4.0 FIRSTFLUSHANALYSIS 13
5.0 CONCLUSIONS 15
REFERENCES 16
Table1-WatersuppliedtoGoomig2016......................................................................................................................................4Table2-M2channels:expectedannualevaporationlosses.........................................................................................................5Table3-Distributionsummary.......................................................................................................................................................6Table4-DW1GSwaterquality2016............................................................................................................................................11Table5-DW1,BorderCreekandKeepRiverDilution1/9/2015-31/1/2016..............................................................................12Figure1-Atrazinedetectionintailwater2015..............................................................................................................................7Figure2-Atrazinedetectionintailwater2016..............................................................................................................................7Figure3-Nitrogenandphosphorusintailwater2015-2016.........................................................................................................8Figure4-BorderCreekFlowDataApril2016–January2017.....................................................................................................12Figure5-KeepRiverflowApril2016toJanuary2017.................................................................................................................13Figure6-Earlywetseason(firstflush)flowvolumes2016.........................................................................................................13Figure7-Nitrogenandphosphorusloadestimatesearlywetseason2016...............................................................................14Plate1-DW1GS.29September2016.........................................................................................................................................10Plate2-UpstreamviewofBorderCreekfromDW1GS.29September2016............................................................................10Plate3-'LakeChivers'-DW1/DW4intersection,upstreamofDW1GS.29September2016...................................................10
Goomig-Knox Surface Water Management Report 2016 3
SummaryandkeypointsThis paper tabulates irrigation water use, tailwater management on the Goomig (Weaber Plain)farmlands,andKeepRiversurfacewatermonitoringundertakeninthedryseasonof2016.Itoutlinestheseasonalconditions,watermonitoringprogramresults (includingstoredtailwaterandtheKeepRiver),associatedriskassessmentsandmanagementresponses.Forannualreportingpurposes,thedocument includes reference to the monitoring requirements of the Knox Creek Plain approvals,howeverthedevelopmentoftheKnoxareahasnotyetcommenced.The results and analysis contained in this report cannot be statistically validated given the limitedsampledata.Nonetheless,thedataarebeingaccumulatedtoinformtheriskassessmentandongoingmanagementandmonitoringrequirements.Review of the actual and estimated data for Goomig tailwater, the Keep River and Border Creekindicatesthefollowing:
Ø FirstflowsthroughtheDW1gaugingstationinmid-November2016wereM2water,resultingfromchannelmaintenance(ie,nottailwaterorstormwater).
Ø ‘Firstflush’oftailwatercanbeconsideredtohaveoccurredonandafter22November2016.Ø Atrazineconcentrations inGoomigwaterwerenota risk toaquatic faunaafter July/August
2016,dilutedorotherwise,withlevelsbelowthe99%ANZECCtrigger(0.7ug/L).Ø N&PloadsinstormwateroriginatingfromtheGoomigfarmlandsareproportionatelyhigher
thanthoseoriginatingonpastoralland,andwillcontinuetobemonitored.Ø RemotemonitoringofflowsintheDW1drain,throughtheDW1gaugingstation,andremote
sampling,continuestoberestrictedbytelecommunicationsissues.Ø Collationof actual data from theGoomig farmlands and theKeepRiverpools continues to
informmanagementresponses.Ø Turbidityanalysisistobefurtherconsideredforwetseasonflows,basedonanincreasingset
ofdata(whenaccessispossible).

Goomig-Knox Surface Water Management Report 2016 4
1.0 OverviewThis paper summarises irrigationwater use, tailwatermanagement on the Goomig (Weaber Plain)farmlands,andKeepRiversurfacewatermonitoringundertakeninthedryseasonof2016.Itoutlinestheseasonalconditions,watermonitoringprogramresults (includingstoredtailwaterandtheKeepRiver),associatedriskassessmentsandmanagementresponses.Forannualreportingpurposes,thedocument includes reference to the monitoring requirements of the Knox Creek Plain approvals,howeverthedevelopmentoftheKnoxareahasnotyetcommenced.Thesurfacewatermanagementandmonitoringrequirementsassociatedwiththefollowingapprovalsareaddressedherewith:
• WesternAustralianEnvironmentalProtectionAct1986(EPAct)approvalknownasStatement938,relatingtotheGoomig(WeaberPlain)andKnoxCreekPlainareas.
• Commonwealth Environment Protection and Biodiversity Conservation Act 1999 (EPBC Act)approvals2010/5491relatingtotheGoomigdevelopment,and2014/7143fortheKnoxCreekPlain.
• Western Australian Rights in Water and Irrigation Act 1914 (RiWI Act) water licenceSWL179228,notingthatKimberleyAgriculturalInvestment(KAI)doesnotyethavetenureforthe Goomig farmlands, and thus is not able to obtain irrigation water under this licence.Instead,KAI ispurchasingwater fromOrdStage1until tenurecanberesolvedandKAIcanirrigateunderitsownlicence.Nonetheless,theannualreportingrequirementsofSWL179228areincludedinthispaper.
2.0 IrrigationSeason2016The2016irrigationseasoncommencedontheGoomigfarmlandsinApril2016.Combinedlots3/5and14/17/18wereirrigatedduringtheseason,withoperationaltailwaterreturnfacilitiesestablishedforeach.
2.1 WatertoGoomigSuppliedvolumestotheGoomig farmlands,asmeasuredbyOrd IrrigationCooperative (OIC)at theM2C3structure(neartheD4drain)wereasfollows:Table1-WatersuppliedtoGoomig2016
MONTH(2016)
MEGALITRESSUPPLIED
NOTES
April 1,441 May 2,817 June 2,324 July 3,413 August 3,046 September 364 October 173 November 746 (includes539.6MLWaterCorporationchannelre-fill,November2016) 14,324 TotalsuppliedbyOICthroughM2C3forGoomigirrigation
Source:OIC,December2016
2.2 On-farmwateruseAtotalof8,248.8ML(~8.25GL)wereappliedtolots3,5,14,17and18overtheperiod1April2016to30September2016. Thisequates to58%ofwatersuppliedbyOIC (excludingWaterCorporation’s

Goomig-Knox Surface Water Management Report 2016 5
channelre-fillinNovember).UnderSWL179228,thetargetdistributionefficiency,onceallfarmsareirrigated,is90%.
2.3 IrrigationsystemefficiencyOperational losseswhichaffect theefficiencyof the irrigation systemaremadeupof anumberofcomponents:
Ø EvaporationlossesØ SeepagelossesØ MeteringinaccuracyØ ChanneldraininglossesØ OverflowsfromshutdowneventsØ Channeloperationaloverflows
(Sunwater,2011)The distribution efficiency is defined in the SWL179228 Goomig Operating Strategy as the ratiobetweenthevolumepassingthroughtheM2C3structure,andthecollectivemeteredflowontofarms–which,asdescribedabove,was58%duringthe2016irrigationseason.The42%distributionlossescanbelargelyattributedtothefactthatapproximatelyonethirdoftheGoomigfarmareawasirrigated.However,theseepageandevaporationlossesoccurringwithinthesupplyinfrastructure(ie,thechannels)willberelativelyconstantacrossallseasons,regardlessofthearea irrigated. This consequently affects thedistribution efficiency, as the ratio of evaporation andseepagelosseswilldeclineastheareaofirrigatedcropsincreases.ThisissuewasnotedintheoriginalPhase2(Goomig)designconsiderations(Sunwater,2011).Evaporationlosses,assumingthechannelisfull,wereestimatedduringtheengineeringdesignprogramasfollows:Table2-M2channels:expectedannualevaporationlosses
ChannelSection SurfaceArea(ha) EvaporationLoss(ML)
M2channel(M2C3toM2S1) 31 930M2Schannel 26 780M2Nchannel 18 540 TOTAL 2,250
Source:Sunwater2011
SeepagelossesfortheGoomigchannelsareestimatedat2mm/dayoratotalof1,100MLperannum,TheconstructionofchannelssizedforthefullM2development–includingtheKnoxCreekPlainandtheKeepRiverPlain–hasresultedinhigherthannormalchannelevaporationandseepageratesforadevelopmentthesizeofGoomig.Thisalsocontributestotheseeminglylow58%distributionefficiencyatcurrentscale. Assuch, thedistributionefficiencywill improvewith increasedareaof landunderirrigation.Furtherlossescanbeattributedtometeringaccuracy,calculatedat+/-2%(atotalofapproximately164ML),539.6MLforWaterCorporationinNovember,andupto500MLincludedinApril2016M2C3volumes,forthepurposeoffillingsupplychannels(pers.comm.,OIC,2016).Aminorchanneloverflowoccurredaround21/22June2016,resultinginpoolingattheDW1GaugingStation.Thus, total losses from evaporation, seepage, channel filling and metering inaccuracy equate toapproximately4,014MLforthe2016dryseason,or32%ofsuppliedwater.Thisvolumeoflosses(4GL)shouldremainrelativelystableovertime,astheareairrigatedfromthesupplychannelsincreases.

Goomig-Knox Surface Water Management Report 2016 6
Theremaining1,521ML(or11%)wasutilisedforconstructionpurposes–ie,dustsuppressionduringconstructionofadjoiningfarms–andformaintainingwaterlevelsinminorchannels(M2NandM2S1)toavoidstructuraldamagetothesechannels.Table3-Distributionsummary
GoomigWaterDistribution ML %Totalsuppliedtofarmlots 8,248.8 58%WaterCorporationchannelre-fillNovember2016 539.6 4%Totallossesfromevaporation,seepageandmeteringaccuracy 4,014 28%Constructionwater,dustsuppression,minorchannelre-fills 1,521.6 11%TotalsuppliedbyOICthroughM2C3 14,324 100%
3.0 Surfaceandtailwatermonitoring
3.1 Tailwaterquality2016Under the commitments given by the Proponent for environmental approvals on the Goomigfarmlands,andascontainedinrelatedapprovals,tailwateristoberetainedonfarmsduringthedryseason.Tailwaterrecyclingfacilitieshavebeenconstructedandareoperationalonlots14/17/18and3/5.Tailwaterquality ismonitoredregularlythroughoutthedryseasonto identifypatternsofchange inrelationtokeyanalytes.Inparticular,totalnitrogen(N),totalphosphorus(P),electricalconductivity(EC), pH and Atrazine are monitored. Pre-emergent herbicide Atrazine has been adopted as theindicator chemical for the Goomig farmlands due to its residual nature and annual use at thecommencementofeachdryseason.Tailwatersamplesaretakenfromdrainagewaterfromeachlotunderirrigation,aswellasfromOrdStage 1 water originating from the area immediately south of the Goomig development, knowncollectivelyas‘Pacseeds’,whichisheldadjacenttoKAI’sfarmingoperations.KAI ismonitoring tailwater over the dry season each year, in order to determine trends aswell asconcentrationsofthekeyanalytes.Notingthattherearenowaterqualitytriggersorstandardsforwaterheldonfarm,KAImonitorsforitsownrecordsandtoassistinriskcalculationinrelationtowaterqualityintheKeepRiver.IntheeventofeitheradryseasonflowtotheKeepRiver(veryunlikely)orrainfallresultinginstormwaterflowstotheKeepRiver,KAIseekstobeinapositiontocalculatelikelydownstreamdilutionandtodetermineappropriatemanagementresponses.UnderthetermsofapprovalEPBC2010/5491fortheGoomigdevelopment,anOperationalSurfaceWaterModel(OSWM)isrequired,forthepurposesofcalculatingdownstreamriskintheeventofaflow. In lieuof thecomplexOSWMdeveloped for theGoomig farmlands,KAI isusingactualwaterquality and flow data to assess downstream risk to listed Matters of National EnvironmentalSignificance(MNES)intheKeepRiver–thatis,sawtoothsharks.

Goomig-Knox Surface Water Management Report 2016 7
3.1.2AtrazineThemaximumlimitforAtrazineintheKeepRiver,inlinewiththeANZECC/ARMCANZ99%standard,is0.7ug/L.KAItestsforAtrazinepresenceinitstailwaterasanindicatorofoverallchemicalpresence,duetotheresidualnatureofthisherbicideanditstoxicitytoaquaticfauna.Figures1and2showthedetectedAtrazineconcentrationsintailwatersamplestakenonGoomiglotsandfromOrdStage1(Pacseeds)tailwaterin2015and2016respectively.Figure1-Atrazinedetectionintailwater2015
Notethe6ug/Lmaximumdetectionin2015wasfoundinOrdStage1tailwater,whichhasanallowable13ug/Lconcentrationcomparedtothe0.7ug/LKeepRiverlimitforwateroriginatingontheGoomigfarmlands. Note also that the concentration of Atrazine inOrd Stage 1 tailwater had degraded to0.3ug/L by October 2015. This rate of degradation (under Kimberley conditions) is important forconsiderationsrelatingtoKeepRiverwaterqualityrisk.Similardegradationwasidentifiedin2016:Figure2-Atrazinedetectionintailwater2016
Aswiththe2015dryseason,detectedhigh(5-8ug/L)concentrationsofAtrazineintailwaterduringthefirsthalfoftheseasondegradedtobelowminimumrisklevels(<0.7ug/L)bytheendofAugust.This
01234567
26/05/2015 15/07/2015 3/09/2015 23/10/2015 12/12/2015 31/01/2016
Atrazine
ug/L
Atrazinedetec0on-GoomigandOrdStage1Pacseeds2015DrySeason
ATRAZINE
0
0.5
1
1.5
2
2.5
3
3.5
4
4.5
5
5.5
6
6.5
7
7.5
8
8.5
30/5/2016 19/6/2016 9/7/2016 29/7/2016 18/8/2016 7/9/2016 27/9/2016 17/10/2016
Atrazine
ug/L
Atrazinedetec0on-GoomigandOrdStage1Pacseeds2016DrySeason
ATRAZINE

Goomig-Knox Surface Water Management Report 2016 8
againdemonstratesnaturaldegradationprocessesinrelationtothemostresidualofherbicidesandpesticidescurrentlyusedinKAI’sfarms.Theanalysisof2015and2016dryseasonAtrazineconcentrationsintailwatershowsthatbytheendofAugustinbothseasons,Atrazineconcentrationswerebelowthe0.7ug/LlimitallowableintheKeepRiver.ThismeansthatiftailwaterflowedundilutedtotheKeepRiverattheendofthedryseason,andwas undiluted in the river, it would not pose a risk to 99% of aquatic organisms (per theANZECC/ARMCANZguidelines)andnotbreachenvironmentalconditionsbasedonAtrazinealone.
3.1.3NitrogenandPhosphorusAswithAtrazine,therearenotargetsortriggersfornitrogenandphosphorusintailwaterheldon-farm.KAImonitorsforTotalNandtotalPinordertoinformriskassessmentintheeventthataflowtotheKeepRiveroccurred.Figure3depictsresults fromsampleanalysisacrossGoomigtailwaterandtheadjacentOrdStage1tailwater,forthe2015and2016seasons.UppertriggersfordryseasonconcentrationsofNandPintheKeepRiver(K3)poolare0.69mg/Land0.039mg/Lrespectively. ShouldaflowtotheKeepRiveroccurinthedryseason,thesefiguresarethemaximumdilutedconcentrationsoftotalNandtotalPwhichtriggerflushingrequirements.Figure3-Nitrogenandphosphorusintailwater2015-2016
AscanbeseeninFigure3,totalNandtotalPconcentrationsintailwaterrisemid-season,butbegintodeclinetowardstheendofthedryseason.Withoutstormwaterflowdilution,NandPconcentrationscouldpotentiallyposearisk,shouldtheretainedtailwatermeettheKeepRiverinalowflowperiod.Flushing(withM2channelwater)wouldberequired.NitrogenandphosphorusloadsareestimatedinSection4.0.
00.050.1
0.150.20.250.30.350.40.450.5
0.550.60.650.7
0.750.8
0.850.9
0.951
1.051.1
1.151.21.251.31.351.41.451.5
1.551.61.651.7
1.751.8
1.851.9
1.952
2.052.1
26/05/2015 15/07/2015 3/09/2015 23/10/2015 12/12/2015 31/01/2016 21/03/2016 10/05/2016 29/06/2016 18/08/2016 7/10/2016 26/11/2016
Concen
tra)
on-mg/L
SampleDate
TotalNandTotalP-GoomigandOrdStage1(Pacseeds)Tailwater2015-2016
TOTALN
TOTALP
Linear(TOTALN)
Linear(TOTALP)

Goomig-Knox Surface Water Management Report 2016 9
3.1.4ECandpHTargetsalinity(electricalconductivity/EC)inalltailwatertestsarewellbelowKeepRiverK3triggers,withECrecordingsaveraging30-40mS/macrossalltestedsitesduringthedryseason,andloweroncewetseasonrainshadcommenced.KeepRiver(K3pool)dryseasontriggersforpHrangefrompH7.31(lowerlimit)topH9.11(upperlimit),withlowerandupperfocustriggersatpH7.7andpH8.2respectively.Thus,the‘ideal’rangeforpHfortheK3poolinthedryseasonisintherangeofpH7.7topH8.2.Aswithotheranalytes,therearenospecifictriggersfortailwater.However,thepHrangefortailwatersamplestakenoverthe2016dryseasonwaspH7.7topH8.7,withamodeofpH7.9andmeanofpH8.1.ThisrangeiswithintheallowableK3pool.IfaneattailwaterflowofvolumesufficienttoreachtheKeepRiverhadoccurredduringthedryseason,thepHwouldnothavebeenproblematicforaquaticfaunahealthintheriver.
3.2 DW1GaugingStationThe DW1 Gauging Station (DW1GS) is the stormwater flow metering point for the Goomigdevelopment.Forthemajorityofthe2016dryseason,andtothetimeofpreparationofthisreport (mid-January2017),telecommunicationsprovidingflowreportsfromtheDW1GSwerenotinoperation.Similarly,thetelecommunicationssystemoperatestheautomatedwatersamplerlocatedattheDW1GS,whichwasalsonotinoperationduringthistime.Asassetowner,theWAgovernmentisliaisingwithRubicon(assetbuilder)to(1)conductafullauditofallsitecommunications;and(2)undertaketherequiredrepairstothetelecommunicationstower(Tetra2orWooljimtower)toenabledatareportingfromtheDW1GS.KAIexpectstosignanassetmanagementagreementwiththeWAgovernmentinlate2016orearly2017,whichwillincludemaintenancearrangementsontelecommunicationsinfrastructure.Manualmonitoring of rainfallwithin the catchment of theDW1 drainage system, aswell as visualinspection of tailwater retention facilities to ensure no spillage, was undertaken on a daily basis.VerificationthroughthemonitoringofflowsatthedownstreamBorderCreekgaugingstationwasalsoundertaken(refertoSection3.3).

Goomig-Knox Surface Water Management Report 2016 10
Plate1-DW1GS.29September2016
Plate2-UpstreamviewofBorderCreekfromDW1GS.29September2016
Plate3-'LakeChivers'-DW1/DW4intersection,upstreamofDW1GS.29September2016
Goomig-Knox Surface Water Management Report 2016 11
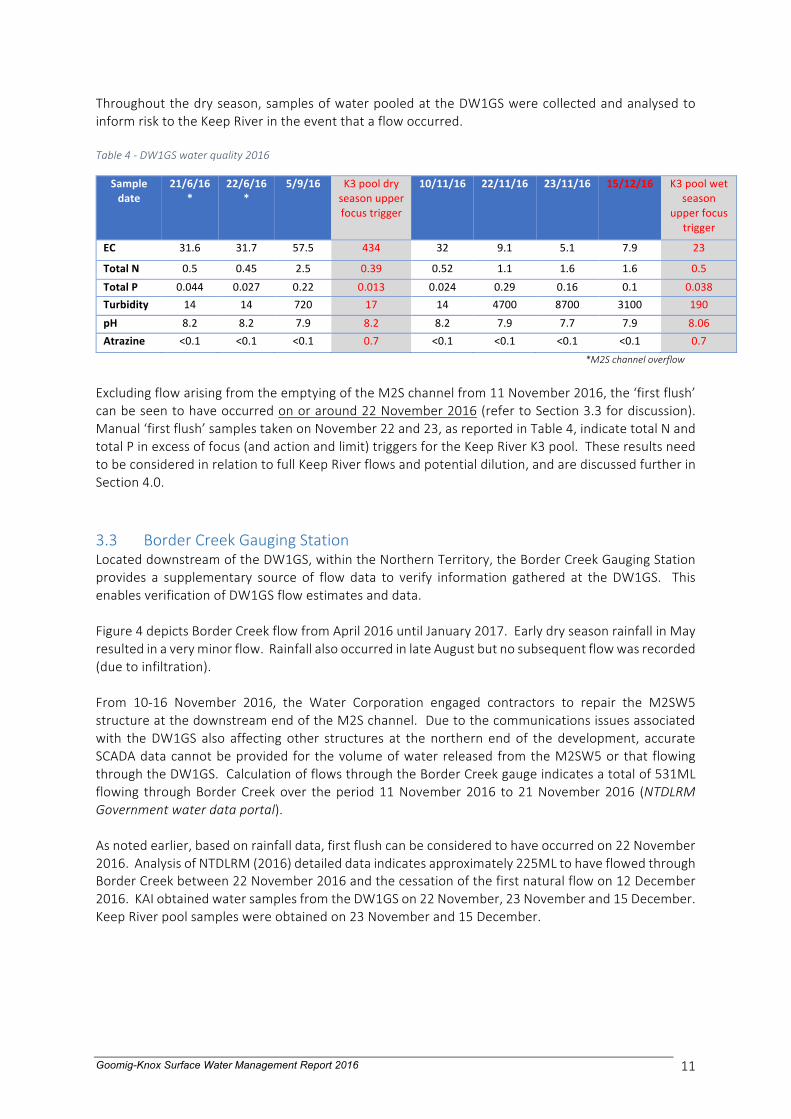
Throughoutthedryseason,samplesofwaterpooledattheDW1GSwerecollectedandanalysedtoinformrisktotheKeepRiverintheeventthataflowoccurred.Table4-DW1GSwaterquality2016
Sampledate
21/6/16*
22/6/16*
5/9/16 K3pooldryseasonupperfocustrigger
10/11/16 22/11/16 23/11/16 15/12/16 K3poolwetseason
upperfocustrigger
EC 31.6 31.7 57.5 434 32 9.1 5.1 7.9 23
TotalN 0.5 0.45 2.5 0.39 0.52 1.1 1.6 1.6 0.5TotalP 0.044 0.027 0.22 0.013 0.024 0.29 0.16 0.1 0.038Turbidity 14 14 720 17 14 4700 8700 3100 190pH 8.2 8.2 7.9 8.2 8.2 7.9 7.7 7.9 8.06Atrazine <0.1 <0.1 <0.1 0.7 <0.1 <0.1 <0.1 <0.1 0.7 *M2Schanneloverflow
ExcludingflowarisingfromtheemptyingoftheM2Schannelfrom11November2016,the‘firstflush’canbeseentohaveoccurredonoraround22November2016(refertoSection3.3fordiscussion).Manual‘firstflush’samplestakenonNovember22and23,asreportedinTable4,indicatetotalNandtotalPinexcessoffocus(andactionandlimit)triggersfortheKeepRiverK3pool.TheseresultsneedtobeconsideredinrelationtofullKeepRiverflowsandpotentialdilution,andarediscussedfurtherinSection4.0.
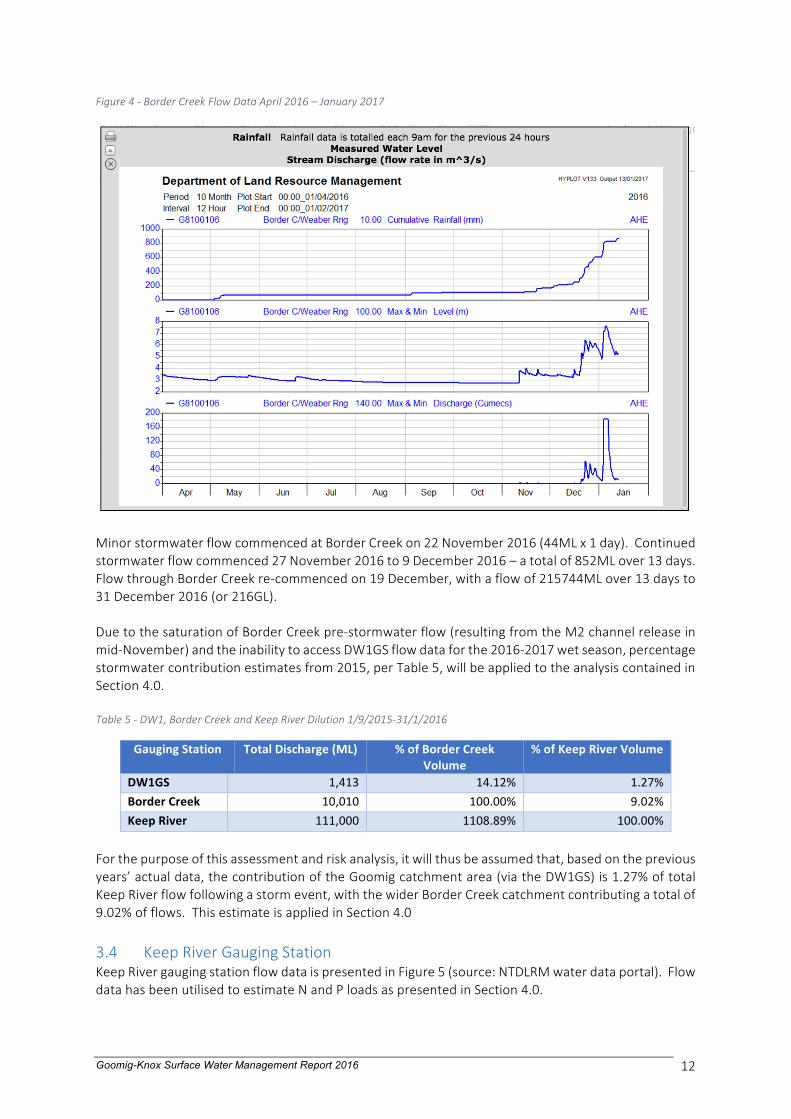
3.3 BorderCreekGaugingStationLocateddownstreamoftheDW1GS,withintheNorthernTerritory,theBorderCreekGaugingStationprovides a supplementary source of flow data to verify information gathered at the DW1GS. ThisenablesverificationofDW1GSflowestimatesanddata.Figure4depictsBorderCreekflowfromApril2016untilJanuary2017.EarlydryseasonrainfallinMayresultedinaveryminorflow.RainfallalsooccurredinlateAugustbutnosubsequentflowwasrecorded(duetoinfiltration).From 10-16 November 2016, the Water Corporation engaged contractors to repair the M2SW5structureatthedownstreamendoftheM2Schannel.Duetothecommunicationsissuesassociatedwith theDW1GS also affecting other structures at the northern endof the development, accurateSCADAdatacannotbeprovidedfor thevolumeofwaterreleasedfromtheM2SW5or that flowingthroughtheDW1GS.CalculationofflowsthroughtheBorderCreekgaugeindicatesatotalof531MLflowing throughBorderCreekover theperiod11November2016 to21November2016 (NTDLRMGovernmentwaterdataportal).Asnotedearlier,basedonrainfalldata,firstflushcanbeconsideredtohaveoccurredon22November2016.AnalysisofNTDLRM(2016)detaileddataindicatesapproximately225MLtohaveflowedthroughBorderCreekbetween22November2016andthecessationofthefirstnaturalflowon12December2016.KAIobtainedwatersamplesfromtheDW1GSon22November,23Novemberand15December.KeepRiverpoolsampleswereobtainedon23Novemberand15December.
Goomig-Knox Surface Water Management Report 2016 12
Figure4-BorderCreekFlowDataApril2016–January2017
MinorstormwaterflowcommencedatBorderCreekon22November2016(44MLx1day).Continuedstormwaterflowcommenced27November2016to9December2016–atotalof852MLover13days.FlowthroughBorderCreekre-commencedon19December,withaflowof215744MLover13daysto31December2016(or216GL).DuetothesaturationofBorderCreekpre-stormwaterflow(resultingfromtheM2channelreleaseinmid-November)andtheinabilitytoaccessDW1GSflowdataforthe2016-2017wetseason,percentagestormwatercontributionestimatesfrom2015,perTable5,willbeappliedtotheanalysiscontainedinSection4.0.Table5-DW1,BorderCreekandKeepRiverDilution1/9/2015-31/1/2016
GaugingStation TotalDischarge(ML) %ofBorderCreekVolume
%ofKeepRiverVolume
DW1GS 1,413 14.12% 1.27%BorderCreek 10,010 100.00% 9.02%KeepRiver 111,000 1108.89% 100.00%
Forthepurposeofthisassessmentandriskanalysis,itwillthusbeassumedthat,basedonthepreviousyears’actualdata,thecontributionoftheGoomigcatchmentarea(viatheDW1GS)is1.27%oftotalKeepRiverflowfollowingastormevent,withthewiderBorderCreekcatchmentcontributingatotalof9.02%offlows.ThisestimateisappliedinSection4.0
3.4 KeepRiverGaugingStationKeepRivergaugingstationflowdataispresentedinFigure5(source:NTDLRMwaterdataportal).FlowdatahasbeenutilisedtoestimateNandPloadsaspresentedinSection4.0.

Goomig-Knox Surface Water Management Report 2016 13
Figure5-KeepRiverflowApril2016toJanuary2017
StormwaterflowthroughtheKeepRiverK4pooloccurredon22November(1dayflowonly;dischargetotal 432 cumecs or 0.43ML). Flow recommenced for a 13 day period from 27November until 9December,thenagainfrom19December.Atthetimeofpreparationofthisreport,theregionwasexperiencingabove-averagerainfallconditions,resultingincontinuedstormwaterinthroughtheKeepRiver.DilutionofstormwaterrunofffromtheGoomigfarmlandscontinues.
4.0 FirstflushanalysisAs previously noted, undiluted tailwater on the Goomig farmlands did not contain Atrazineconcentrations in excess of Keep River trigger levels, during the 2016 season. As such, the risk ofAtrazineharmtoaquaticfaunaintheKeepRiver,followingthefirstflush,isvirtuallynon-existent.WithoutexplicitflowdatafromtheDW1gaugingstation,proportionalvolumesderivedfromthe2015seasonhavebeenassumedtoapply for the2016season (seeFigure6). Notethat thecalculationscontainedwithinFigure7areindicativeonly,andarenotintendedtoreplacefullscientificanalysis.Figure6-Earlywetseason(firstflush)flowvolumes2016
Flowvolumes-earlywetseason(November-December2016) ML GL
TotalflowDW1GS22Nov2016-31Dec2016(estimate) 3122.12 3.12
TotalflowBorderCreek22Nov2016-31Dec2016(actual) 29240.18 29.24
TotalflowKeepRiver22Nov2016-31Dec2016(actual) 216596.25 216.60
Goomig-Knox Surface Water Management Report 2016 14
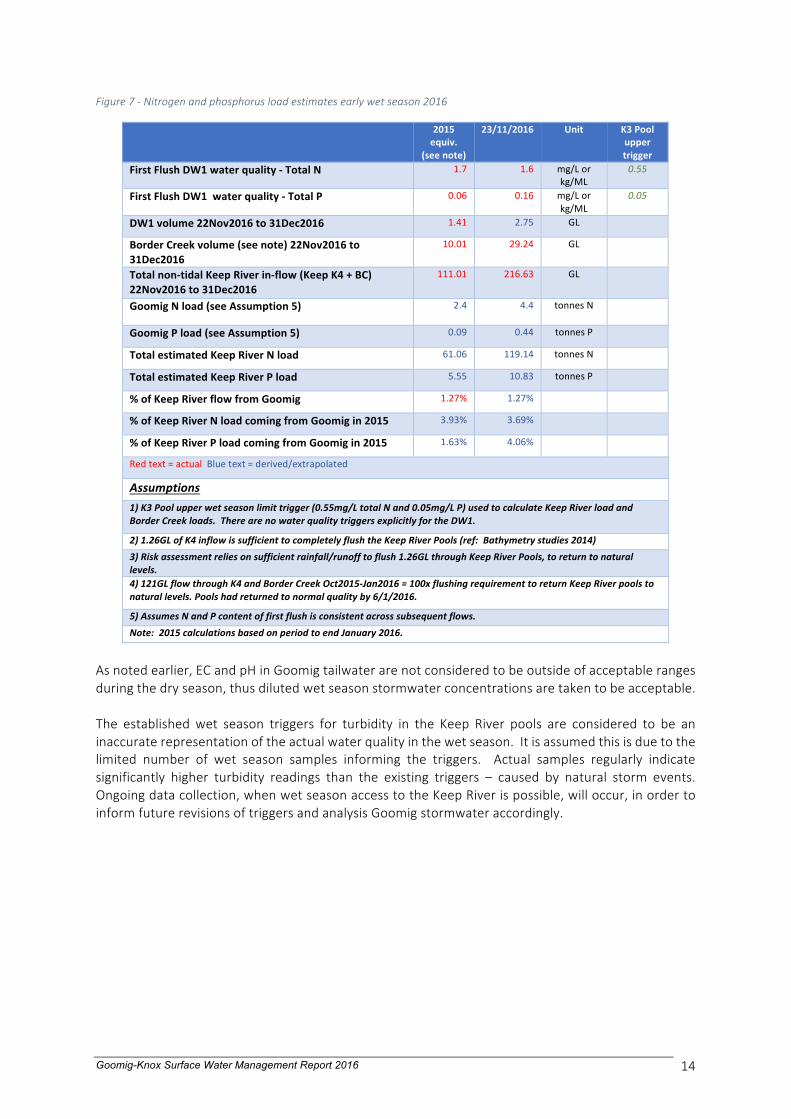
Figure7-Nitrogenandphosphorusloadestimatesearlywetseason2016
2015equiv.
(seenote)
23/11/2016 Unit K3Pooluppertrigger
FirstFlushDW1waterquality-TotalN 1.7 1.6 mg/Lorkg/ML
0.55
FirstFlushDW1waterquality-TotalP 0.06 0.16 mg/Lorkg/ML
0.05
DW1volume22Nov2016to31Dec2016 1.41 2.75 GL
BorderCreekvolume(seenote)22Nov2016to31Dec2016
10.01 29.24 GL
Totalnon-tidalKeepRiverin-flow(KeepK4+BC)22Nov2016to31Dec2016
111.01 216.63 GL
GoomigNload(seeAssumption5) 2.4 4.4 tonnesN
GoomigPload(seeAssumption5) 0.09 0.44 tonnesP
TotalestimatedKeepRiverNload 61.06 119.14 tonnesN
TotalestimatedKeepRiverPload 5.55 10.83 tonnesP
%ofKeepRiverflowfromGoomig 1.27% 1.27% %ofKeepRiverNloadcomingfromGoomigin2015 3.93% 3.69% %ofKeepRiverPloadcomingfromGoomigin2015 1.63% 4.06% Redtext=actualBluetext=derived/extrapolated
Assumptions 1)K3Poolupperwetseasonlimittrigger(0.55mg/LtotalNand0.05mg/LP)usedtocalculateKeepRiverloadandBorderCreekloads.TherearenowaterqualitytriggersexplicitlyfortheDW1.
2)1.26GLofK4inflowissufficienttocompletelyflushtheKeepRiverPools(ref:Bathymetrystudies2014)3)Riskassessmentreliesonsufficientrainfall/runofftoflush1.26GLthroughKeepRiverPools,toreturntonaturallevels.4)121GLflowthroughK4andBorderCreekOct2015-Jan2016=100xflushingrequirementtoreturnKeepRiverpoolstonaturallevels.Poolshadreturnedtonormalqualityby6/1/2016.
5)AssumesNandPcontentoffirstflushisconsistentacrosssubsequentflows.Note:2015calculationsbasedonperiodtoendJanuary2016.
Asnotedearlier,ECandpHinGoomigtailwaterarenotconsideredtobeoutsideofacceptablerangesduringthedryseason,thusdilutedwetseasonstormwaterconcentrationsaretakentobeacceptable.The established wet season triggers for turbidity in the Keep River pools are considered to be aninaccuraterepresentationoftheactualwaterqualityinthewetseason.Itisassumedthisisduetothelimited number of wet season samples informing the triggers. Actual samples regularly indicatesignificantly higher turbidity readings than the existing triggers – caused by natural storm events.Ongoingdatacollection,whenwetseasonaccesstotheKeepRiverispossible,willoccur,inordertoinformfuturerevisionsoftriggersandanalysisGoomigstormwateraccordingly.

Goomig-Knox Surface Water Management Report 2016 15
5.0 ConclusionsThe results and analysis contained in this report cannot be statistically validated given the limitedsampledata.Nonetheless,thedataarebeingaccumulatedtoinformtheriskassessmentandongoingmanagementandmonitoringrequirements.ReviewoftheactualandestimateddataforGoomigtailwater,theKeepRiverandBorderCreekindicatesthefollowing:
Ø FirstflowsthroughtheDW1gaugingstationinmid-November2016wereM2water,resultingfromchannelmaintenance(ie,nottailwaterorstormwater).
Ø ‘Firstflush’oftailwatercanbeconsideredtohaveoccurredonandafter22November2016.Ø Atrazineconcentrations inGoomigwaterwerenota risk toaquatic faunaafter July/August
2016,dilutedorotherwise,withlevelsbelowthe99%ANZECCtrigger(0.7ug/L).Ø N&PloadsinstormwateroriginatingfromtheGoomigfarmlandsareproportionatelyhigher
thanthoseoriginatingonpastoralland,andwillcontinuetobemonitored.Ø RemotemonitoringofflowsintheDW1drain,throughtheDW1gaugingstation,andremote
sampling,continuestoberestrictedbytelecommunicationsissues.Ø Collationof actual data from theGoomig farmlands and theKeepRiverpools continues to
informmanagementresponses.Ø Turbidityanalysisistobefurtherconsideredforwetseasonflows,basedonanincreasingset
ofdata(whenaccessispossible).
ThisreportiscomplementedbyKAI’ssurfacewaterdatabase,whichcanbeprovideduponrequest.

Goomig-Knox Surface Water Management Report 2016 16
ReferencesKimberleyAgriculturalInvestmentPtyLtd,2014,Goomig-KnoxFarmAreasOperatingStrategy.PreparedasarequirementofwaterlicenceSWL179228,fortheDepartmentofWater,Kununurra.OrdIrrigationCooperative,2016,personalcommunicationfromMatDear,GeneralManager,toDebraPearceforKAI.NorthernTerritoryGovernmentWaterdataportal-https://nt.gov.au/environment/water/water-data-portal.SitesG8100106(BorderCreek)andG8100225(KeepRiver).Sunwater,2011,OperationalPhilosophyandBalancingStorageReview–PositionPaperPP015,containedinGHD,2011,Phase2DetailedDesignReport,preparedforLandCorp.