Embed Size (px)
Citation preview

CONVEX ASIA FUND PF LP | DECEMBER 2016 1
FOR PROFESSIONAL INVESTORS ONLY
CONVEX ASIA FUND PF LP Monthly Update – December 2016
Monthly Review
The Convex Asia Fund PF LP, Class ‘A’ was down -0.65% net (based on Trading Level) and down -1.31% net (based on NAV) for the month of December 2016.*
Performance attribution
CAF Net Outright Net RV Net Outright -0.61% REHEDGE 0.00% Carry -0.07%
Relative Value -0.10% VAR -0.21% Skew 0.00% Other 0.06% Vol 0.00% Delta 0.00%
-0.65% Tail -0.40% Curve 0.00% CVX 0.00% Spread 0.00% Tact 0.00% VARSPREAD 0.00%
-0.61% Term 0.00%
Corr 0.00%
Tact -0.02%
Vol 0.00%
-0.10%
*Reflects Convex Asia Fund PF LP – Class ‘A’ net investor returns. Past performance is not a guarantee of future returns, and an investment in the Fund could lose value. Performance attribution is based on the Trading Level of the Fund. Trading Level is defined as the product of the fund’s NAV multiplied by the Funding Factor. The Funding Factor is 1x for Convex Asia Fund LP, while the Funding Factor is 2x for Convex Asia Fund PF LP. Fees and expenses are allocated pro rata with the absolute gross return of each strategy in order to arrive at the net performance figures. Source: City Financial, internal data
Market Review
Interest Rates Portfolio outflows are likely to be a cause for concern in 2017, especially from markets such as Indonesia, Korea and Malaysia. Despite a recent slowing down of debt outflows from Malaysia and Thailand, these markets still remain a risk, even if some inflows were seen in the last two weeks of the 2016. There are plenty of reasons to expect the ‘Great Rotation’ from bonds to equities to be a core theme in the first quarter 2017, as equities continue the Trump-fuelled rally.
As widely anticipated (and very much priced in), the Fed raised the Funds Rate by 25bps in December. The Federal Reserve dot plot did not alter materially in December. We ended the year with a solid December ‘Santa Rally’ in risk assets, whilst the global fixed income markets felt the pinch of higher yields through to mid-December until bond yields stopped moving higher. In fact, bonds rallied a touch into the calmer markets as we approached the year end seasonal holidays.
CONVEX ASIA FUND PF LP | DECEMBER 2016 2
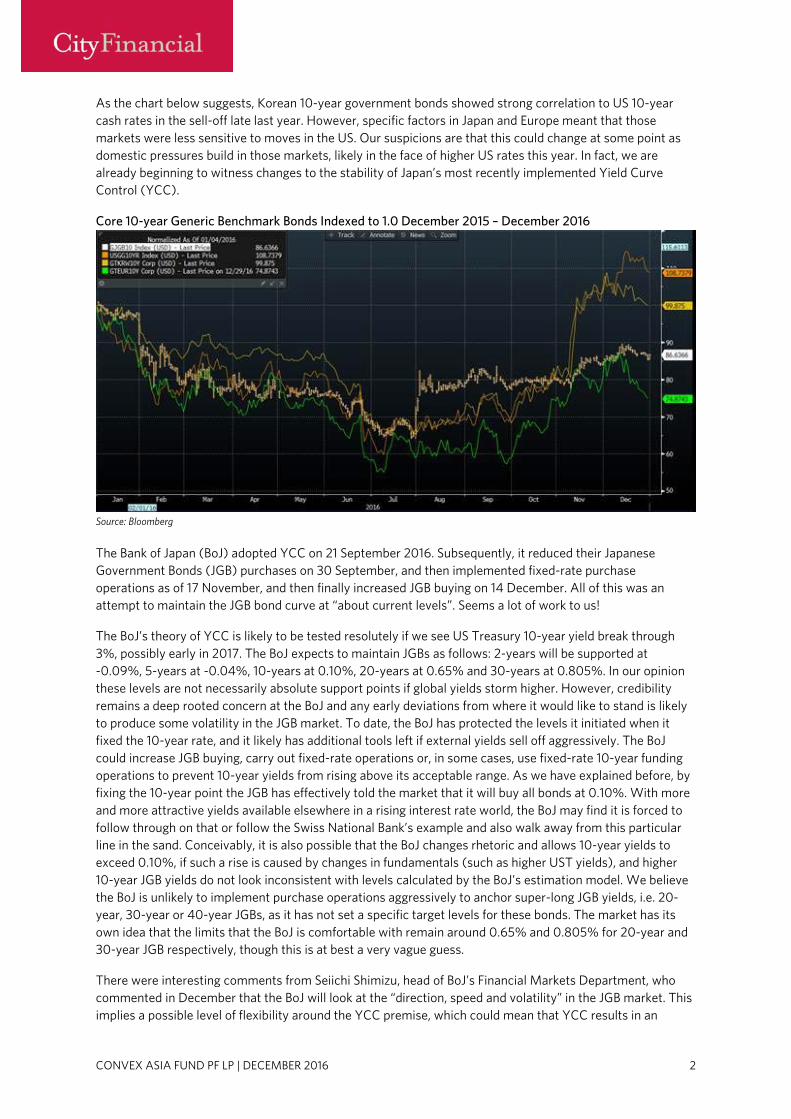
As the chart below suggests, Korean 10-year government bonds showed strong correlation to US 10-year cash rates in the sell-off late last year. However, specific factors in Japan and Europe meant that those markets were less sensitive to moves in the US. Our suspicions are that this could change at some point as domestic pressures build in those markets, likely in the face of higher US rates this year. In fact, we are already beginning to witness changes to the stability of Japan’s most recently implemented Yield Curve Control (YCC).
Core 10-year Generic Benchmark Bonds Indexed to 1.0 December 2015 – December 2016
Source: Bloomberg
The Bank of Japan (BoJ) adopted YCC on 21 September 2016. Subsequently, it reduced their Japanese Government Bonds (JGB) purchases on 30 September, and then implemented fixed-rate purchase operations as of 17 November, and then finally increased JGB buying on 14 December. All of this was an attempt to maintain the JGB bond curve at “about current levels”. Seems a lot of work to us!
The BoJ’s theory of YCC is likely to be tested resolutely if we see US Treasury 10-year yield break through 3%, possibly early in 2017. The BoJ expects to maintain JGBs as follows: 2-years will be supported at -0.09%, 5-years at -0.04%, 10-years at 0.10%, 20-years at 0.65% and 30-years at 0.805%. In our opinion these levels are not necessarily absolute support points if global yields storm higher. However, credibility remains a deep rooted concern at the BoJ and any early deviations from where it would like to stand is likely to produce some volatility in the JGB market. To date, the BoJ has protected the levels it initiated when it fixed the 10-year rate, and it likely has additional tools left if external yields sell off aggressively. The BoJ could increase JGB buying, carry out fixed-rate operations or, in some cases, use fixed-rate 10-year funding operations to prevent 10-year yields from rising above its acceptable range. As we have explained before, by fixing the 10-year point the JGB has effectively told the market that it will buy all bonds at 0.10%. With more and more attractive yields available elsewhere in a rising interest rate world, the BoJ may find it is forced to follow through on that or follow the Swiss National Bank’s example and also walk away from this particular line in the sand. Conceivably, it is also possible that the BoJ changes rhetoric and allows 10-year yields to exceed 0.10%, if such a rise is caused by changes in fundamentals (such as higher UST yields), and higher 10-year JGB yields do not look inconsistent with levels calculated by the BoJ’s estimation model. We believe the BoJ is unlikely to implement purchase operations aggressively to anchor super-long JGB yields, i.e. 20-year, 30-year or 40-year JGBs, as it has not set a specific target levels for these bonds. The market has its own idea that the limits that the BoJ is comfortable with remain around 0.65% and 0.805% for 20-year and 30-year JGB respectively, though this is at best a very vague guess.
There were interesting comments from Seiichi Shimizu, head of BoJ’s Financial Markets Department, who commented in December that the BoJ will look at the “direction, speed and volatility” in the JGB market. This implies a possible level of flexibility around the YCC premise, which could mean that YCC results in an
CONVEX ASIA FUND PF LP | DECEMBER 2016 3
expansion of the Central Bank’s balance sheet into what might then become an endless Quantitative Easing (QE) process, versus the tapering exercise more widely anticipated by markets.
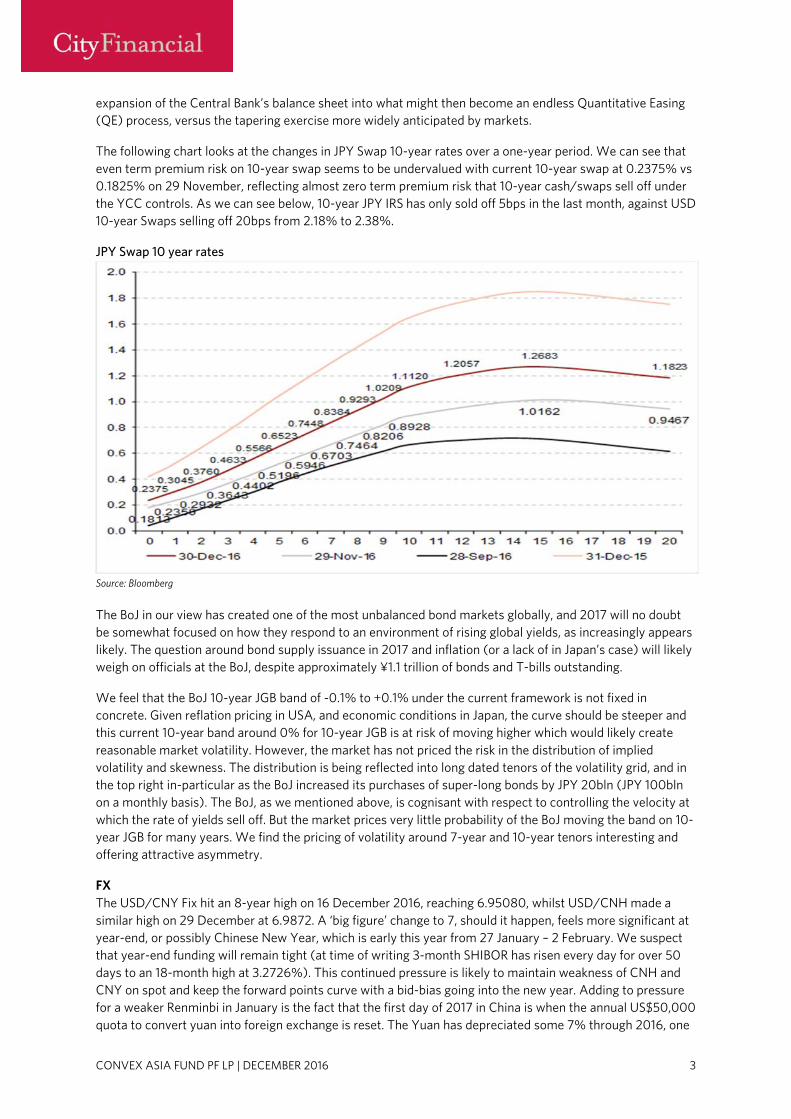
The following chart looks at the changes in JPY Swap 10-year rates over a one-year period. We can see that even term premium risk on 10-year swap seems to be undervalued with current 10-year swap at 0.2375% vs 0.1825% on 29 November, reflecting almost zero term premium risk that 10-year cash/swaps sell off under the YCC controls. As we can see below, 10-year JPY IRS has only sold off 5bps in the last month, against USD 10-year Swaps selling off 20bps from 2.18% to 2.38%.
JPY Swap 10 year rates
Source: Bloomberg
The BoJ in our view has created one of the most unbalanced bond markets globally, and 2017 will no doubt be somewhat focused on how they respond to an environment of rising global yields, as increasingly appears likely. The question around bond supply issuance in 2017 and inflation (or a lack of in Japan’s case) will likely weigh on officials at the BoJ, despite approximately ¥1.1 trillion of bonds and T-bills outstanding.
We feel that the BoJ 10-year JGB band of -0.1% to +0.1% under the current framework is not fixed in concrete. Given reflation pricing in USA, and economic conditions in Japan, the curve should be steeper and this current 10-year band around 0% for 10-year JGB is at risk of moving higher which would likely create reasonable market volatility. However, the market has not priced the risk in the distribution of implied volatility and skewness. The distribution is being reflected into long dated tenors of the volatility grid, and in the top right in-particular as the BoJ increased its purchases of super-long bonds by JPY 20bln (JPY 100bln on a monthly basis). The BoJ, as we mentioned above, is cognisant with respect to controlling the velocity at which the rate of yields sell off. But the market prices very little probability of the BoJ moving the band on 10-year JGB for many years. We find the pricing of volatility around 7-year and 10-year tenors interesting and offering attractive asymmetry.
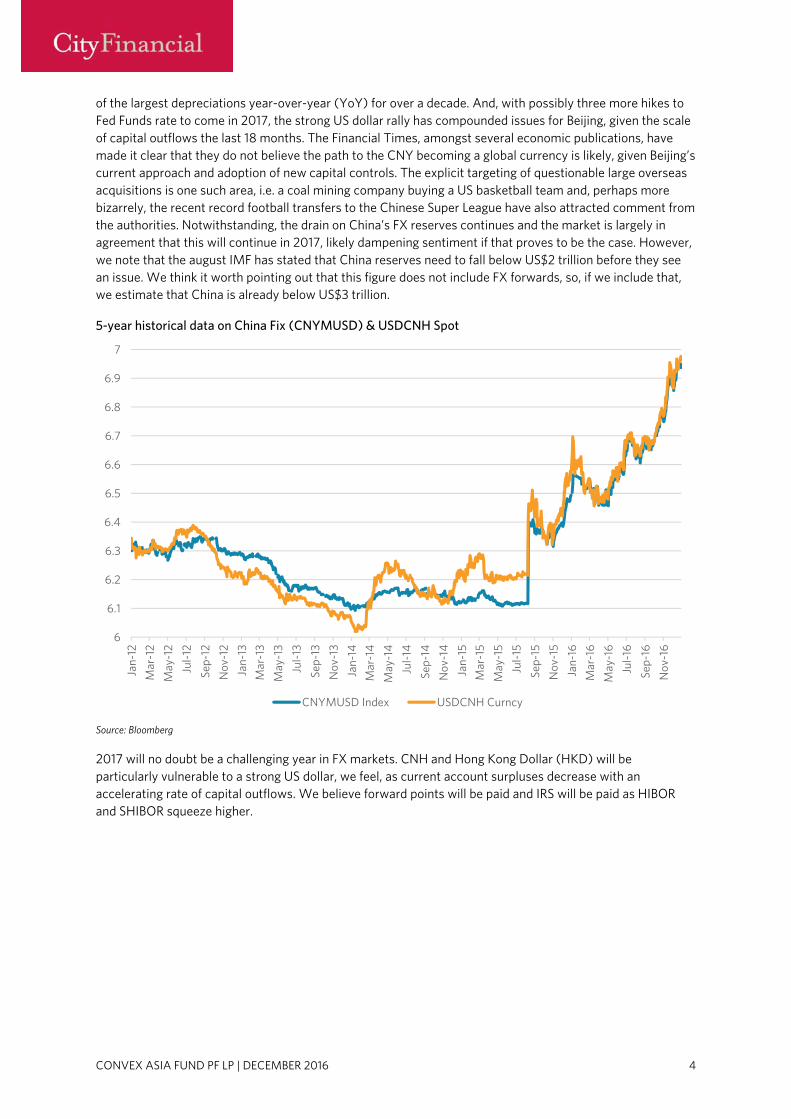
FX The USD/CNY Fix hit an 8-year high on 16 December 2016, reaching 6.95080, whilst USD/CNH made a similar high on 29 December at 6.9872. A ‘big figure’ change to 7, should it happen, feels more significant at year-end, or possibly Chinese New Year, which is early this year from 27 January – 2 February. We suspect that year-end funding will remain tight (at time of writing 3-month SHIBOR has risen every day for over 50 days to an 18-month high at 3.2726%). This continued pressure is likely to maintain weakness of CNH and CNY on spot and keep the forward points curve with a bid-bias going into the new year. Adding to pressure for a weaker Renminbi in January is the fact that the first day of 2017 in China is when the annual US$50,000 quota to convert yuan into foreign exchange is reset. The Yuan has depreciated some 7% through 2016, one
CONVEX ASIA FUND PF LP | DECEMBER 2016 4
of the largest depreciations year-over-year (YoY) for over a decade. And, with possibly three more hikes to Fed Funds rate to come in 2017, the strong US dollar rally has compounded issues for Beijing, given the scale of capital outflows the last 18 months. The Financial Times, amongst several economic publications, have made it clear that they do not believe the path to the CNY becoming a global currency is likely, given Beijing’s current approach and adoption of new capital controls. The explicit targeting of questionable large overseas acquisitions is one such area, i.e. a coal mining company buying a US basketball team and, perhaps more bizarrely, the recent record football transfers to the Chinese Super League have also attracted comment from the authorities. Notwithstanding, the drain on China’s FX reserves continues and the market is largely in agreement that this will continue in 2017, likely dampening sentiment if that proves to be the case. However, we note that the august IMF has stated that China reserves need to fall below US$2 trillion before they see an issue. We think it worth pointing out that this figure does not include FX forwards, so, if we include that, we estimate that China is already below US$3 trillion.
5-year historical data on China Fix (CNYMUSD) & USDCNH Spot
Source: Bloomberg
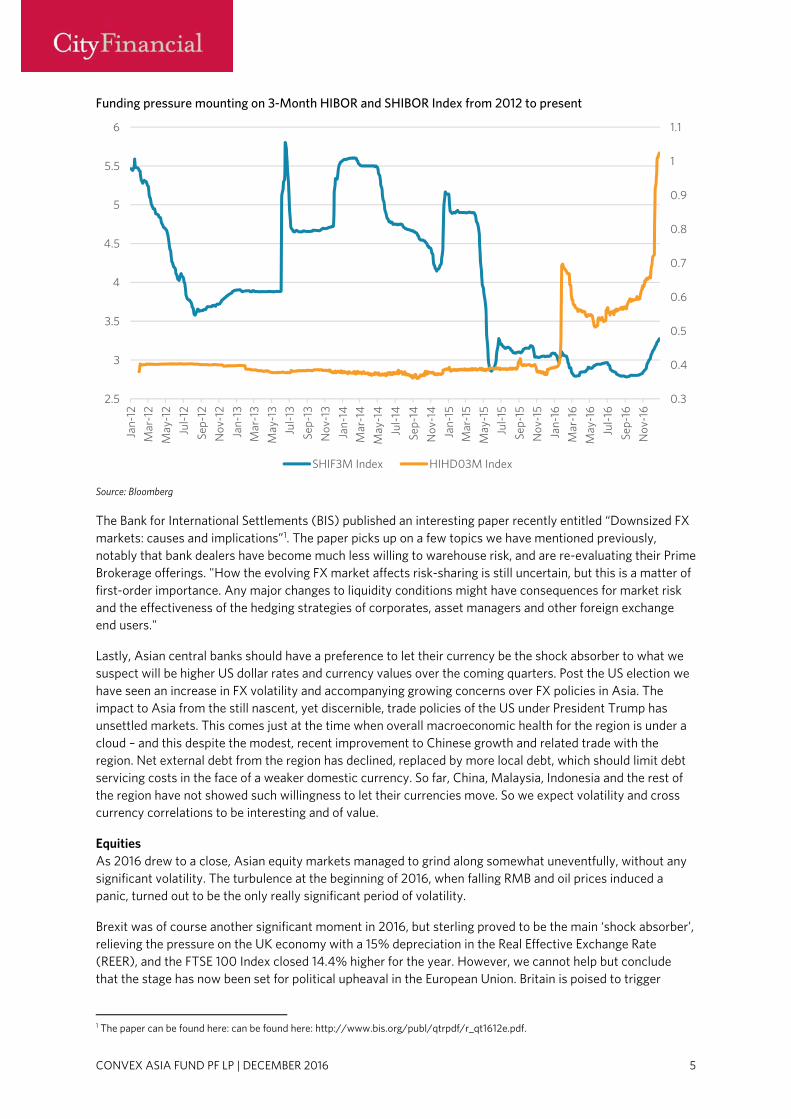
2017 will no doubt be a challenging year in FX markets. CNH and Hong Kong Dollar (HKD) will be particularly vulnerable to a strong US dollar, we feel, as current account surpluses decrease with an accelerating rate of capital outflows. We believe forward points will be paid and IRS will be paid as HIBOR and SHIBOR squeeze higher.
6
6.1
6.2
6.3
6.4
6.5
6.6
6.7
6.8
6.9
7
Jan-
12
Mar
-12
May
-12
Jul-
12
Sep-
12
Nov
-12
Jan-
13
Mar
-13
May
-13
Jul-
13
Sep-
13
Nov
-13
Jan-
14
Mar
-14
May
-14
Jul-
14
Sep-
14
Nov
-14
Jan-
15
Mar
-15
May
-15
Jul-
15
Sep-
15
Nov
-15
Jan-
16
Mar
-16
May
-16
Jul-
16
Sep-
16
Nov
-16
CNYMUSD Index USDCNH Curncy
CONVEX ASIA FUND PF LP | DECEMBER 2016 5
Funding pressure mounting on 3-Month HIBOR and SHIBOR Index from 2012 to present
Source: Bloomberg
The Bank for International Settlements (BIS) published an interesting paper recently entitled “Downsized FX markets: causes and implications”1. The paper picks up on a few topics we have mentioned previously, notably that bank dealers have become much less willing to warehouse risk, and are re-evaluating their Prime Brokerage offerings. "How the evolving FX market affects risk-sharing is still uncertain, but this is a matter of first-order importance. Any major changes to liquidity conditions might have consequences for market risk and the effectiveness of the hedging strategies of corporates, asset managers and other foreign exchange end users."
Lastly, Asian central banks should have a preference to let their currency be the shock absorber to what we suspect will be higher US dollar rates and currency values over the coming quarters. Post the US election we have seen an increase in FX volatility and accompanying growing concerns over FX policies in Asia. The impact to Asia from the still nascent, yet discernible, trade policies of the US under President Trump has unsettled markets. This comes just at the time when overall macroeconomic health for the region is under a cloud – and this despite the modest, recent improvement to Chinese growth and related trade with the region. Net external debt from the region has declined, replaced by more local debt, which should limit debt servicing costs in the face of a weaker domestic currency. So far, China, Malaysia, Indonesia and the rest of the region have not showed such willingness to let their currencies move. So we expect volatility and cross currency correlations to be interesting and of value.
Equities As 2016 drew to a close, Asian equity markets managed to grind along somewhat uneventfully, without any significant volatility. The turbulence at the beginning of 2016, when falling RMB and oil prices induced a panic, turned out to be the only really significant period of volatility.
Brexit was of course another significant moment in 2016, but sterling proved to be the main ‘shock absorber’, relieving the pressure on the UK economy with a 15% depreciation in the Real Effective Exchange Rate (REER), and the FTSE 100 Index closed 14.4% higher for the year. However, we cannot help but conclude that the stage has now been set for political upheaval in the European Union. Britain is poised to trigger
1 The paper can be found here: can be found here: http://www.bis.org/publ/qtrpdf/r_qt1612e.pdf.
0.3
0.4
0.5
0.6
0.7
0.8
0.9
1
1.1
2.5
3
3.5
4
4.5
5
5.5
6Ja
n-12
Mar
-12
May
-12
Jul-
12
Sep-
12
Nov
-12
Jan-
13
Mar
-13
May
-13
Jul-
13
Sep-
13
Nov
-13
Jan-
14
Mar
-14
May
-14
Jul-
14
Sep-
14
Nov
-14
Jan-
15
Mar
-15
May
-15
Jul-
15
Sep-
15
Nov
-15
Jan-
16
Mar
-16
May
-16
Jul-
16
Sep-
16
Nov
-16
SHIF3M Index HIHD03M Index

CONVEX ASIA FUND PF LP | DECEMBER 2016 6
Article 50 during the first quarter of 2017, and start negotiating with a “divided” European Union. The EU faces the threat of rising populism in the coming elections in Netherlands, France, Germany and potentially further fall out from the referendum result in Italy. The US, though, marched to a slightly happier tune. The current S&P 500 bull market (which started in 2009 and has run for 93 months or 2831 days), has now become the second longest bull run since 1987. The S&P 500 Index was up 9.5% for 2016 and has risen 7.4% since Trump was elected. The US dollar climbed 4.4% for the year (+3.6% since 8 November) while the total return of long dated US Treasuries came off around 15% from the elections.
“DEATH BY CHINA is right on. This important documentary depicts our problem with China with facts, figures and insight. I urge you to see it.” – Donald Trump
However, it may not all prove plain sailing for the US post Donald Trump’s inauguration as President on 20 January. He has been making good on some of his election promises, but already as part of his theme to bring jobs back to the US, it appears that China is being turned into the necessary villain, required in any good drama. One of President-elect Trump’s key hires is Peter Navarro, a Harvard-trained economist, who will head the National Trade Council (NTC), and has authored books such as “Death by China” and “Crouching Tiger: What China’s Militarism Means for the World”. He is a well-known China hawk who believes that the best jobs programme is to reform trade relationships with China. It is highly likely that the Trump administration will be confronting China on trade and other issues more aggressively than the previous Obama administration.
Despite the multiple warning shots fired by Donald Trump, the market has been sanguine about the impact of his administration. Trump has spoken about labelling China as a “currency manipulator”, which, if it happened, would kick off bilateral engagements with the threat of trade tariffs being imposed one year after the beginning of the negotiations. The global economy could at that point be facing a rising trend of trade protectionism, populist involvement and heightened geopolitical risks, on top of the record high leverage across emerging markets, especially in Asia.
Seasonal factors drove realised volatility lower across the board in equities this month, and the usual annual renewal of many structured products is likely to see volatility remain under pressure in early 2017. In December 2016, the cost of protection of some equity indices fell below the 20th percentile of the past ten years and the index of global realised volatility collapsed to levels seen only in 2014 and 2006.
30 Day Realised Volatility Kospi, TWSE, SPX, SIMSCI
Source: Bloomberg/BIS

CONVEX ASIA FUND PF LP | DECEMBER 2016 7
Credit “It is as absurd to assume that, for any long period of time, the variables in the economic organization, or any part of them, will "stay put," in perfect equilibrium, as to assume that the Atlantic Ocean can ever be without a wave.” — Irving Fisher, 1933
China is no longer exporting deflation to the rest of the world. After a record breaking four years of negative Producer Price Index (PPI), it has turned positive since September 2016. The US Consumer Price Index (CPI) rose to 1.7% in November, while US wage growth (average hourly earnings +2.9%; Atlanta Fed wage growth +3.9%) accelerated to its fastest since 2009. Inflation in the UK (1.2%) and Germany (1.7%) is also now running well ahead of recent trends. However, this rise in inflation was inconceivable to most market participants earlier in the year as economists raced to cut their estimates for interest rates. The rise in inflation has profound implications for the debt-heavy world economy which is still facing weak GDP and trade growth, especially emerging markets. This tilt to inflation could be attributed to the impact of the global ultra-loose monetary policies, rising commodity prices (cost-push factors), expectations of greater fiscal stimulus, especially from the Trump administration, expected trade protectionism and the raging housing boom seen all over the world.
In China, the rise in the PPI will squeeze the profit margins of producers but will also be passed onto consumers and appear in higher inflation data. Perhaps in anticipation, the Chinese government has started to crack down on the housing market once again, especially in the first tier cities which have seen rampant asset price inflation. The spike in borrowing costs last month (China 10-year bond yields spiked over 30bps) puts even more pressure on both local corporates and municipalities.
Rising inflation also threatens to expose the underlying weaknesses of the European Union. The unprecedented uber-loose monetary policies of the ECB are giving rise to unwanted inflation in Germany, who has been by far the greatest beneficiary of QE in Europe. Germany’s housing price index has risen 25% since 2010, with property prices in Hamburg up 70% over the past five years. Property prices in Munich have reached record levels and joined the likes of London and Hong Kong as the fifth most expensive city in the world according to UBS Real Estate Bubble Index. The task of setting one monetary policy for the whole Eurozone is proving to be near impossible, with Germany currently having to deal with potential runaway inflation while Italy is still nursing a banking crisis.
Credit spreads have tracked global rates lower since 2009. The possibility of US rates breaking their 30-year downtrend will likely cause some sort of correlated move in credit spreads, as hikes in the cost of borrowing feed through to record levels of debt globally.
Perhaps at odds with this backdrop, credit spreads in Europe and Japan all tightened further over the last month to seven-year lows. Credit in the US recovered all the losses made earlier in the year, and in general tightened to new highs in December. Asian bond markets went side-ways as international investors sold out of their Asian bond positions, fearing the impact of the strong US dollar and rising US interest rates. The bond selling by global investors was very orderly, as local Asian investors added to risk as they continue to chase for yields in this low rate environment.

CONVEX ASIA FUND PF LP | DECEMBER 2016 8
Credit Benchmarks
Source: Bloomberg
US High Yield Bond Index
Source: Bloomberg

CONVEX ASIA FUND PF LP | DECEMBER 2016 9
Asian Corporate Bond Index
Source: Bloomberg
Risk Update 2016 is in the books. We have had Brexit and Trump come to pass. We have had the second follow-up 25bps rate hike from the Fed. We have seen a boom of negative yielding bonds, and then a broad disappearance of negative yields. In the end, however, we continue to see a plethora of risk appetite and rising prices for risk assets.
The S&P Index closed out the year up nearly 235% from its lows in March of 2009, and up 23% from the lows earlier in 2016, back in February.
SPX Index Log Chart and Fed Funds Rate
Source: Bloomberg
As we like to do, we have included the Fed Funds rate. We obviously do not know entirely what goes into the Fed’s decision-making process, but this basic picture does give a simplified perspective that they might be “behind the curve”. It also gives some perspective of where some of the oft-looked-for inflation might have shown up.
CONVEX ASIA FUND PF LP | DECEMBER 2016 10
Speaking of inflation, there is growing concern that even the form that Central Banks bother to measure might be making a return. Even before all the enthusiasm around the supposed mass fiscal stimulus from the upcoming Trump presidency, there have been growing signs of upticks in narrow CPI/PPI/deflator measures the world over.
US and Europe Inflation Indices YoY
Source: Bloomberg
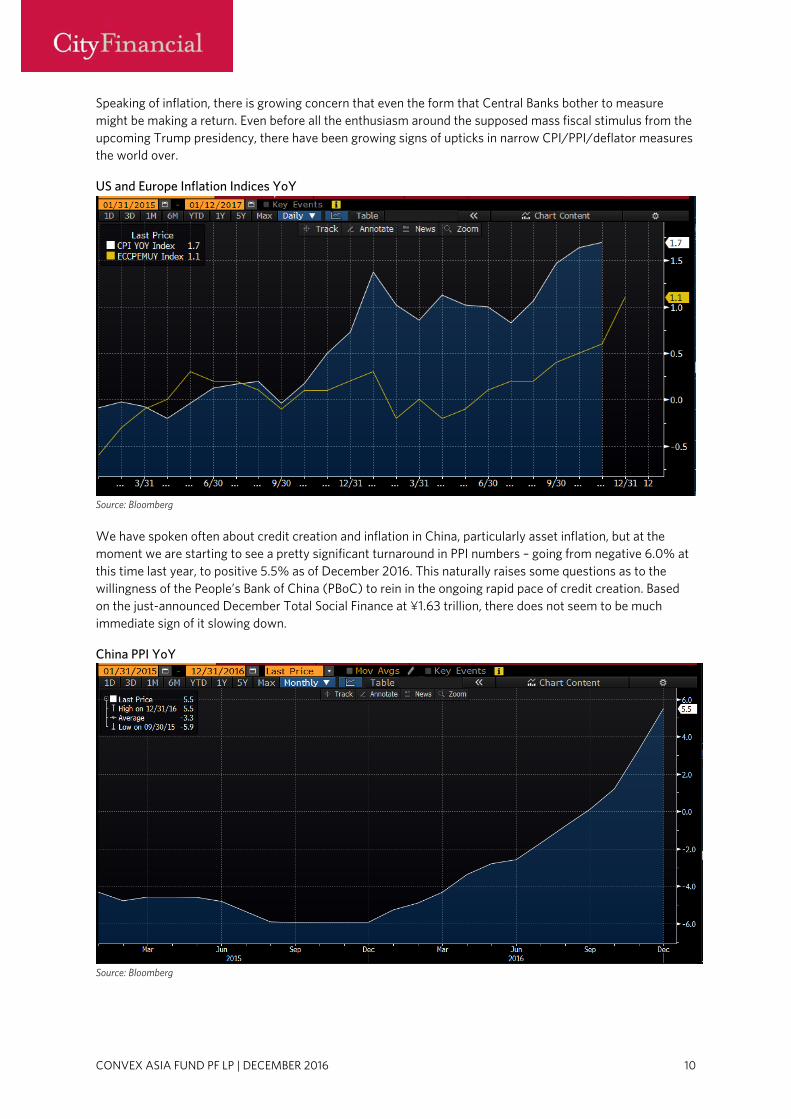
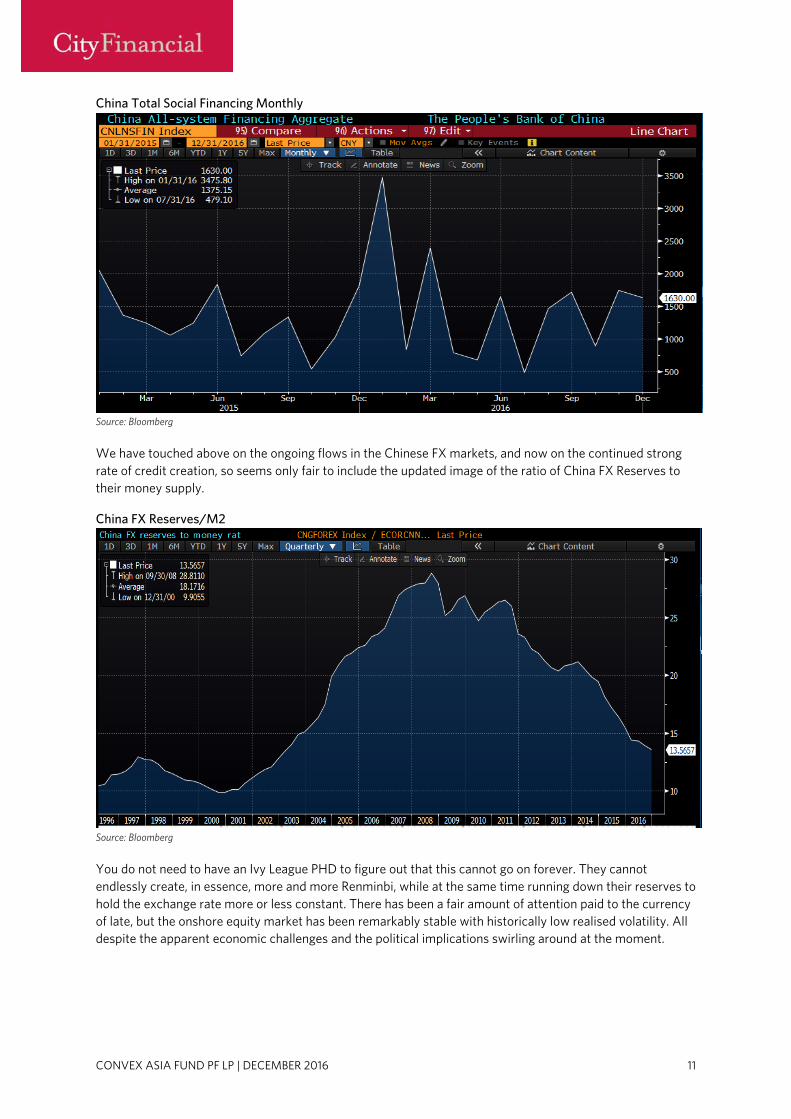
We have spoken often about credit creation and inflation in China, particularly asset inflation, but at the moment we are starting to see a pretty significant turnaround in PPI numbers – going from negative 6.0% at this time last year, to positive 5.5% as of December 2016. This naturally raises some questions as to the willingness of the People’s Bank of China (PBoC) to rein in the ongoing rapid pace of credit creation. Based on the just-announced December Total Social Finance at ¥1.63 trillion, there does not seem to be much immediate sign of it slowing down.
China PPI YoY
Source: Bloomberg
CONVEX ASIA FUND PF LP | DECEMBER 2016 11
China Total Social Financing Monthly
Source: Bloomberg
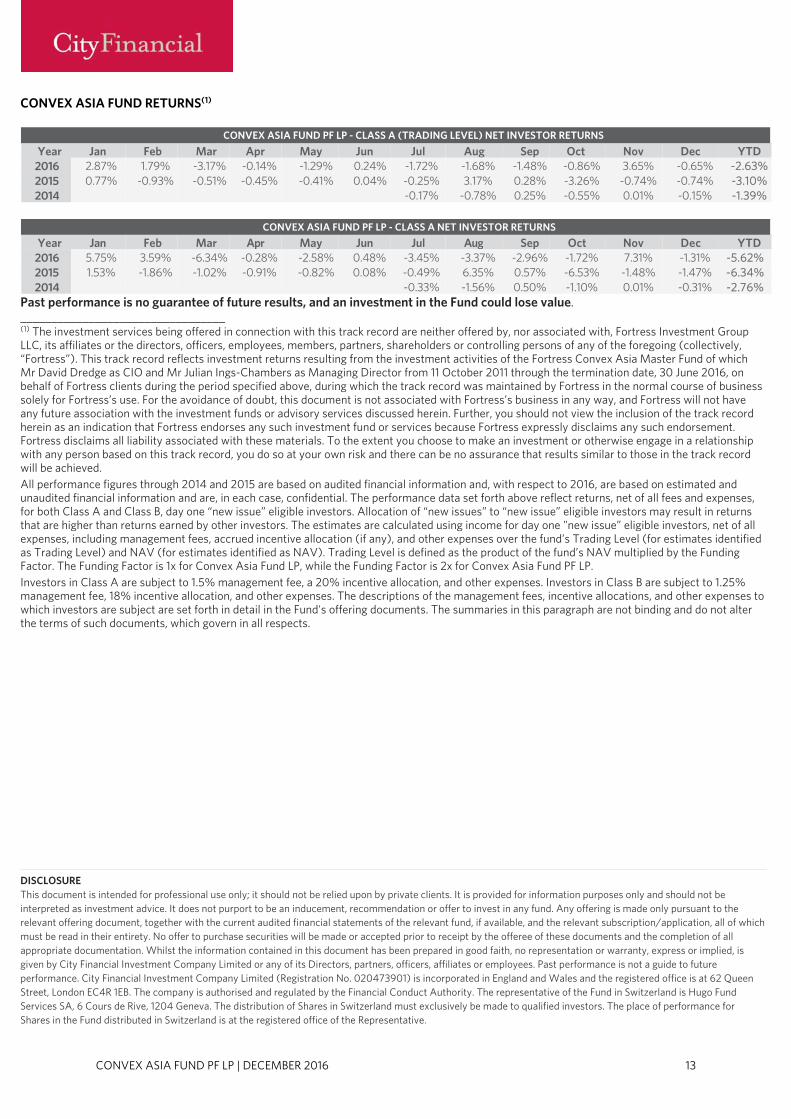
We have touched above on the ongoing flows in the Chinese FX markets, and now on the continued strong rate of credit creation, so seems only fair to include the updated image of the ratio of China FX Reserves to their money supply.
China FX Reserves/M2
Source: Bloomberg
You do not need to have an Ivy League PHD to figure out that this cannot go on forever. They cannot endlessly create, in essence, more and more Renminbi, while at the same time running down their reserves to hold the exchange rate more or less constant. There has been a fair amount of attention paid to the currency of late, but the onshore equity market has been remarkably stable with historically low realised volatility. All despite the apparent economic challenges and the political implications swirling around at the moment.

CONVEX ASIA FUND PF LP | DECEMBER 2016 12
Shanghai Composite Index and its 60-day Realised Volatility
Source: Bloomberg
As we regularly say, in line with our wildfire analogy, it is uncanny how the biggest fire risks line up with where we find the cheapest fire insurance. The asymmetry across a range of markets is just as attractive as it has been at any time throughout the current cycle. It is an attractive smorgasbord of convexity.
CONVEX ASIA FUND PF LP | DECEMBER 2016 13
CONVEX ASIA FUND RETURNS(1)
Year Jan Feb Mar Apr May Jun Jul Aug Sep Oct Nov Dec YTD
2016 2.87% 1.79% -3.17% -0.14% -1.29% 0.24% -1.72% -1.68% -1.48% -0.86% 3.65% -0.65% -2.63% 2015 0.77% -0.93% -0.51% -0.45% -0.41% 0.04% -0.25% 3.17% 0.28% -3.26% -0.74% -0.74% -3.10% 2014 -0.17% -0.78% 0.25% -0.55% 0.01% -0.15% -1.39%
Year Jan Feb Mar Apr May Jun Jul Aug Sep Oct Nov Dec YTD 2016 5.75% 3.59% -6.34% -0.28% -2.58% 0.48% -3.45% -3.37% -2.96% -1.72% 7.31% -1.31% -5.62% 2015 1.53% -1.86% -1.02% -0.91% -0.82% 0.08% -0.49% 6.35% 0.57% -6.53% -1.48% -1.47% -6.34% 2014 -0.33% -1.56% 0.50% -1.10% 0.01% -0.31% -2.76%
Past performance is no guarantee of future results, and an investment in the Fund could lose value. _________________________________ (1) The investment services being offered in connection with this track record are neither offered by, nor associated with, Fortress Investment Group LLC, its affiliates or the directors, officers, employees, members, partners, shareholders or controlling persons of any of the foregoing (collectively, “Fortress”). This track record reflects investment returns resulting from the investment activities of the Fortress Convex Asia Master Fund of which Mr David Dredge as CIO and Mr Julian Ings-Chambers as Managing Director from 11 October 2011 through the termination date, 30 June 2016, on behalf of Fortress clients during the period specified above, during which the track record was maintained by Fortress in the normal course of business solely for Fortress’s use. For the avoidance of doubt, this document is not associated with Fortress’s business in any way, and Fortress will not have any future association with the investment funds or advisory services discussed herein. Further, you should not view the inclusion of the track record herein as an indication that Fortress endorses any such investment fund or services because Fortress expressly disclaims any such endorsement. Fortress disclaims all liability associated with these materials. To the extent you choose to make an investment or otherwise engage in a relationship with any person based on this track record, you do so at your own risk and there can be no assurance that results similar to those in the track record will be achieved. All performance figures through 2014 and 2015 are based on audited financial information and, with respect to 2016, are based on estimated and unaudited financial information and are, in each case, confidential. The performance data set forth above reflect returns, net of all fees and expenses, for both Class A and Class B, day one “new issue” eligible investors. Allocation of “new issues” to “new issue” eligible investors may result in returns that are higher than returns earned by other investors. The estimates are calculated using income for day one "new issue” eligible investors, net of all expenses, including management fees, accrued incentive allocation (if any), and other expenses over the fund’s Trading Level (for estimates identified as Trading Level) and NAV (for estimates identified as NAV). Trading Level is defined as the product of the fund’s NAV multiplied by the Funding Factor. The Funding Factor is 1x for Convex Asia Fund LP, while the Funding Factor is 2x for Convex Asia Fund PF LP. Investors in Class A are subject to 1.5% management fee, a 20% incentive allocation, and other expenses. Investors in Class B are subject to 1.25% management fee, 18% incentive allocation, and other expenses. The descriptions of the management fees, incentive allocations, and other expenses to which investors are subject are set forth in detail in the Fund's offering documents. The summaries in this paragraph are not binding and do not alter the terms of such documents, which govern in all respects. DISCLOSURE This document is intended for professional use only; it should not be relied upon by private clients. It is provided for information purposes only and should not be interpreted as investment advice. It does not purport to be an inducement, recommendation or offer to invest in any fund. Any offering is made only pursuant to the relevant offering document, together with the current audited financial statements of the relevant fund, if available, and the relevant subscription/application, all of which must be read in their entirety. No offer to purchase securities will be made or accepted prior to receipt by the offeree of these documents and the completion of all appropriate documentation. Whilst the information contained in this document has been prepared in good faith, no representation or warranty, express or implied, is given by City Financial Investment Company Limited or any of its Directors, partners, officers, affiliates or employees. Past performance is not a guide to future performance. City Financial Investment Company Limited (Registration No. 020473901) is incorporated in England and Wales and the registered office is at 62 Queen Street, London EC4R 1EB. The company is authorised and regulated by the Financial Conduct Authority. The representative of the Fund in Switzerland is Hugo Fund Services SA, 6 Cours de Rive, 1204 Geneva. The distribution of Shares in Switzerland must exclusively be made to qualified investors. The place of performance for Shares in the Fund distributed in Switzerland is at the registered office of the Representative.
CONVEX ASIA FUND PF LP - CLASS A (TRADING LEVEL) NET INVESTOR RETURNS
CONVEX ASIA FUND PF LP - CLASS A NET INVESTOR RETURNS

![INDEX [korea.kyocera.com] · CM03 (0201) Rated Voltage(Vdc) Capacitance 16 25 50 1R0 1.0 pF 1R5 1.5 pF 2R0 2.0 pF 3R0 3.0 pF 4R0 4.0 pF 5R0 5.0 pF 6R0 6.0 pF 7R0 7.0 pF 8R0](https://img.dokumen.tips/doc/110x75/5f468f04b73716507c2277fc/index-korea-cm03-i0201i-rated-voltageivdci-capacitance-16-25-50-1r0.jpg)
![Envolventes para Centros de Transformación · 16 Centros de Transformación ... pf hasta 36 kV pf.301 pf.302 pf.303 pf.304 pf.3015 pf.3030 Longitud [mm] ... Combinaciones Posibilidad](https://img.dokumen.tips/doc/110x75/5bb1a96c09d3f2f1188b9734/envolventes-para-centros-de-transformacion-16-centros-de-transformacion-.jpg)