Embed Size (px)
Citation preview
2016
bservationsfor a BetterWorld

Contents
About This Report
Vaisala believes in a world where environmental
observations improve the safety, efficiency, and
quality of life in societies. This is why we named
this year’s sustainability report after our mission
“Observations for a Better World 2016.”
Vaisala has published sustainability reports since 2009,
making this the ninth in the series and our first report to
take definite steps towards Integrated Reporting.
We started by asking some of our key stakeholders
what they expect of our integrated reporting. We laid the
foundation by researching what megatrends affect Vaisala
now and in the future, how we react to them, and what
opportunities they may bring us. We then defined what
types of value Vaisala creates and narrowed them down to
the most important ones for each stakeholder. Finally, we
wrapped it all together into a Value Creation Model, The
World of Observations. The groundwork has now been laid
for expanding integrated reporting further.
To satisfy the information need of those who gather data
from GRI reports, we are glad to inform you that this report
also caters to you. You can find a GRI cross-reference on
page 70 and the Independent Assurance Report on page 74.
We hope you enjoy learning more about Vaisala.
Vaisala in Brief 3
A Year in Observations 4
Sustainable Technologies 6
Chairman’s Message 7
CEO’s Message 8
Our Values 10
Our Strategy 11
Strategy Implementation in 2016 12
Global Markets 14
World of Observations 16
Megatrends 18
Stakeholders 20
Value Creation for Employees 22
Value Creation for Customers 30
Value Creation for Society and Environment 36
Performance 46
GRI Content Index 70
Independent Assurance Report 74
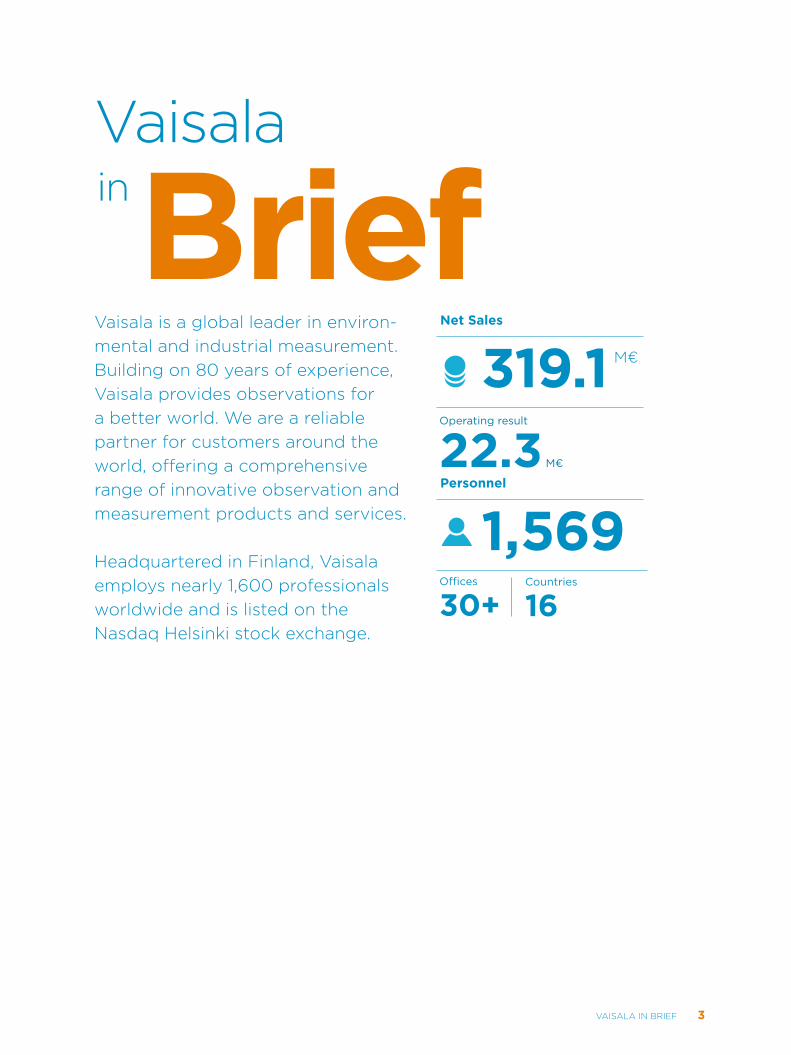
VaisalainBriefVaisala is a global leader in environmental and industrial measurement. Building on 80 years of experience, Vaisala provides observations for a better world. We are a reliable partner for customers around the world, offering a comprehensive range of innovative observation and measurement products and services.
Headquartered in Finland, Vaisala employs nearly 1,600 professionals worldwide and is listed on the Nasdaq Helsinki stock exchange.
Net Sales
Personnel
M€319.1
1,569Offices
30+
Operating result
22.3 M€
Countries
16
3VAisAlA iN BRieF
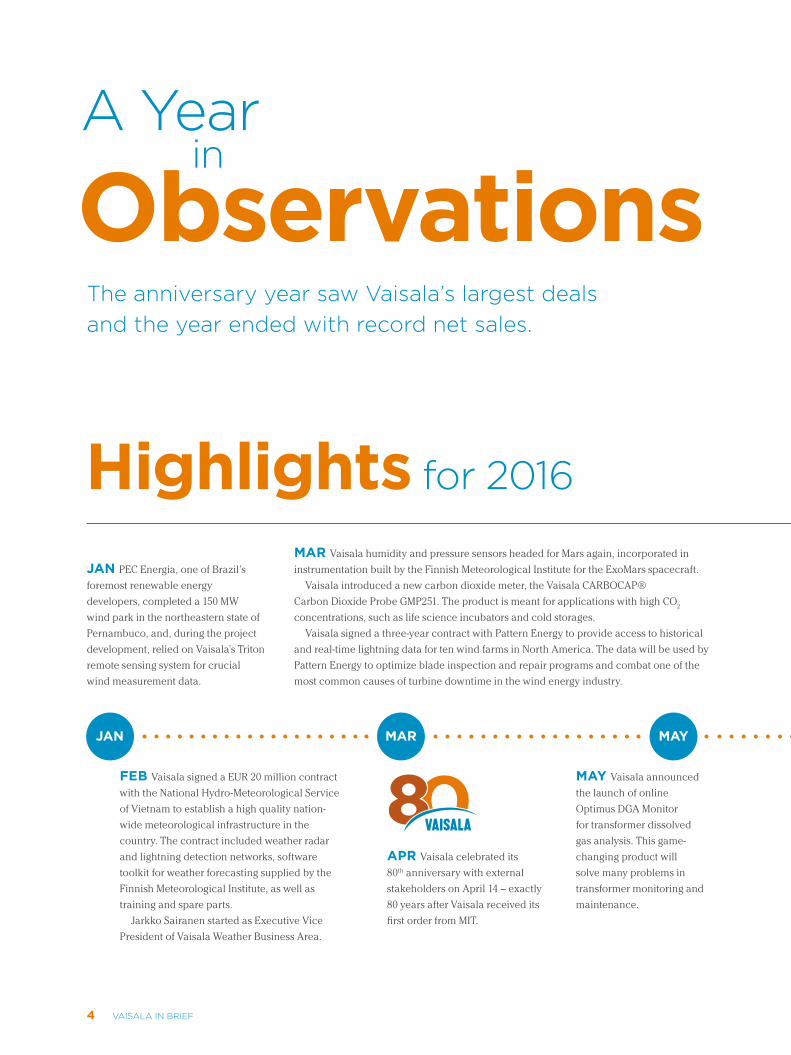
Highlights for 2016
JAN PEC Energia, one of Brazil’s
foremost renewable energy
developers, completed a 150 MW
wind park in the northeastern state of
Pernambuco, and, during the project
development, relied on Vaisala’s Triton
remote sensing system for crucial
wind measurement data.
JAN MAR MAY
FEB Vaisala signed a EUR 20 million contract
with the National Hydro-Meteorological Service
of Vietnam to establish a high quality nation-
wide meteorological infrastructure in the
country. The contract included weather radar
and lightning detection networks, software
toolkit for weather forecasting supplied by the
Finnish Meteorological Institute, as well as
training and spare parts.
Jarkko Sairanen started as Executive Vice
President of Vaisala Weather Business Area.
MAR Vaisala humidity and pressure sensors headed for Mars again, incorporated in
instrumentation built by the Finnish Meteorological Institute for the ExoMars spacecraft.
Vaisala introduced a new carbon dioxide meter, the Vaisala CARBOCAP®
Carbon Dioxide Probe GMP251. The product is meant for applications with high CO2
concentrations, such as life science incubators and cold storages.
Vaisala signed a three-year contract with Pattern Energy to provide access to historical
and real-time lightning data for ten wind farms in North America. The data will be used by
Pattern Energy to optimize blade inspection and repair programs and combat one of the
most common causes of turbine downtime in the wind energy industry.
APR Vaisala celebrated its
80th anniversary with external
stakeholders on April 14 – exactly
80 years after Vaisala received its
first order from MIT.
MAY Vaisala announced
the launch of online
Optimus DGA Monitor
for transformer dissolved
gas analysis. This game-
changing product will
solve many problems in
transformer monitoring and
maintenance.
A Year
ObservationsThe anniversary year saw Vaisala’s largest deals and the year ended with record net sales.
in
4 VAisAlA iN BRieF

JUL SEP DEC
JUN Vaisala
produced its 11th
million radiosonde.
AUG Vaisala made the decision to
expand its offering into the growing air
quality monitoring market by acquiring
new products and technology.
This move aligns perfectly with
Vaisala’s goal of making meaningful
observations for a better world.
OCT Vaisala signed a USD 18 million contract
with the Ministry for Transport and Aviation
of the Commonwealth of The Bahamas. The
contract included weather radars, Automatic
Weather Observation Systems (AWOS) for
airports and Automatic Weather Stations (AWS)
as well as civil works, installation services and a
five years’ service agreement.
NOV American Airlines Safety Department
partnered with Vaisala AviCast® Lightning
Alert System for Real-Time Data and Alerts. The
technology will be utilized at 51 airports in the U.S.
and Puerto Rico, increasing safety and reducing
lightning-related delays and costs.
Vaisala announced the reorganization of the
Weather Business Area. The goal is to simplify its
structure and operations and to better align with
Vaisala’s strategy.
201420132012 2015 2016
5
4
3
2
1
0
Injuries per Million Working Hours (TRI)
3.23
4.354.88
3.14
2.32
201420132012 2015 2016
40
35
30
25
20
15
10
5
0
Operating Result, M€
30.2
18.1
26.429.6
22.3
Weather68%215.4 M€
Controlled environment32% 103.7 M€
Net Sales by Business Area 2016
eMeA29%
92.0 M€
APAC27%86.2 M€
Americas44% 140.9 M€
Net Sales by Region 2016
201420132012 2015 2016
1,800
1,500
1,200
900
600
300
0
Personnel, at Year-end
1,4421,563 1,613 1,588 1,569
201420132012 2015 2016
350
300
250
200
150
100
50
0
Development of Net Sales
293.3273.2
299.7318.5 319.1
5VAisAlA iN BRieF
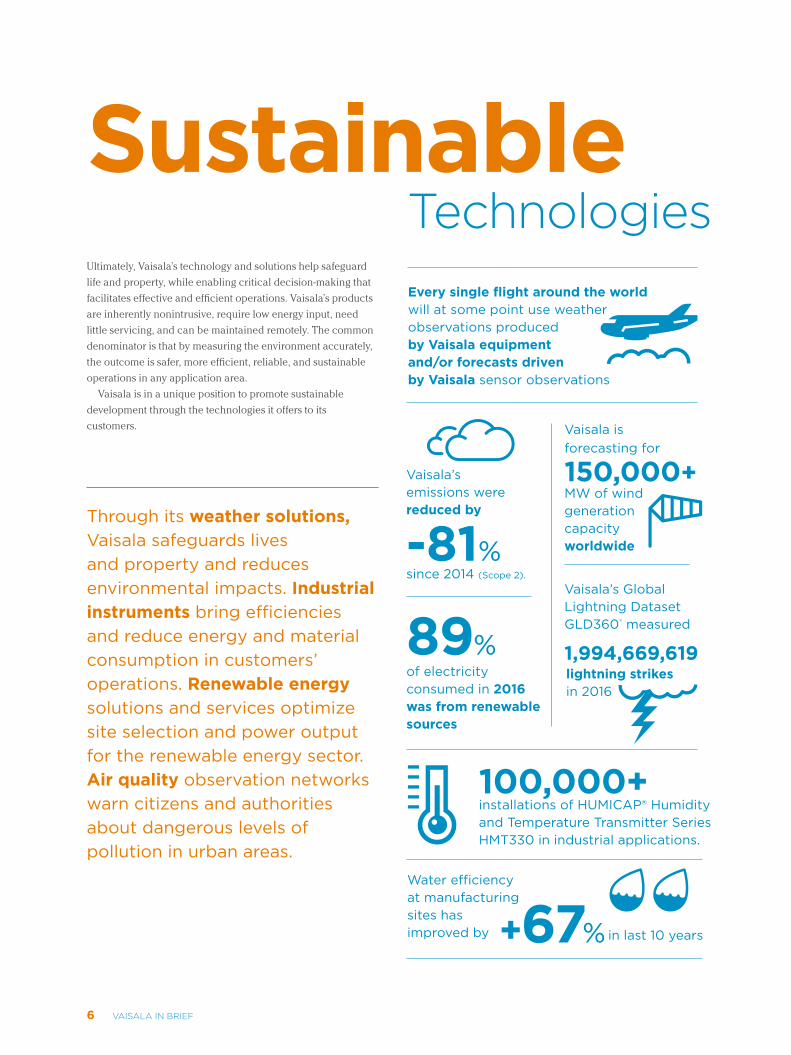
SustainableTechnologiesEvery single flight around the world will at some point use weather observations produced by Vaisala equipment and/or forecasts driven by Vaisala sensor observations
Vaisala’s emissions were reduced by
-81% since 2014 (Scope 2).
Vaisala is forecasting for
150,000+ MW of wind generation capacity worldwide
of electricity consumed in 2016 was from renewable sources
89%
+67%
Vaisala’s Global Lightning Dataset GLD360® measured
lightning strikes in 2016
1,994,669,619
100,000+ installations of HUMICAP® Humidity and Temperature Transmitter Series HMT330 in industrial applications.
Water efficiency at manufacturing sites has improved by
Ultimately, Vaisala’s technology and solutions help safeguard
life and property, while enabling critical decision-making that
facilitates effective and efficient operations. Vaisala’s products
are inherently nonintrusive, require low energy input, need
little servicing, and can be maintained remotely. The common
denominator is that by measuring the environment accurately,
the outcome is safer, more efficient, reliable, and sustainable
operations in any application area.
Vaisala is in a unique position to promote sustainable
development through the technologies it offers to its
customers.
in last 10 years
Through its weather solutions, Vaisala safeguards lives and property and reduces environmental impacts. Industrial instruments bring efficiencies and reduce energy and material consumption in customers’ operations. Renewable energy solutions and services optimize site selection and power output for the renewable energy sector. Air quality observation networks warn citizens and authorities about dangerous levels of pollution in urban areas.
6 VAisAlA iN BRieF
GlobalChallengesTechnologies
solutionsChairman’s Message
During Vaisala’s 80th anniversary year, I met many Vaisala
employees as well as customers and partners, who reminded
me just how meaningful the company’s work is.
Science is at the heart of all progress, and without accurate
and reliable measurements to work on, science cannot find
solutions to the global challenges affecting us all. Vaisala
creates technologies to better understand how this globe of
ours works. Vaisala furnishes societies with tools that help
keep people safe in their everyday lives, from warning people
in a hurricane or flood zone to keeping a premature baby
protected and comfortable in the incubator.
That makes Vaisala’s work purposeful. Vaisala’s value added
to the world is much greater than its size would suggest.
Vaisala is directly affected by and helps in addressing many
of the megatrends reshaping the world now and in the future.
In my opinion, the most disruptive trends are urbanization,
digitalization, and, in a fundamental way, climate change.
Urbanization, as it is taking place now, is inherently
unsustainable. We often envision smart cities with complex
infrastructures in place, but where urbanization is most
intense, they are distant luxuries. Acute challenges are related
to air quality, lack of clean energy, and safe transportation.
Vaisala’s instruments help tackle these everyday issues.
As a new development, Vaisala is entering the market for air
quality measurements in urban areas, where poor air quality
is a health concern for millions of people. Dense and relatively
inexpensive monitoring networks will improve the quality of
life for people living in cities all over the world.
Digitalization leads to more and more things being
measured. Vaisala sees opportunities from this development
that will change how things and people interconnect and how
things are done. Traffic, building automation, smart grids, and
measurements in industrial processes will be just a few fields
that will see an upsurge in demand for connected sensors.
Climate change fuels extreme weather and these events are
becoming more prevalent and costly for societies. We must
start bracing for effective mitigation techniques as the 1.5°C
climate target is slipping further away. Vaisala helps national
weather services to be prepared for dangerous weather events
and on the other hand, support accurate climate research
through long and reliable data series.
Vaisala’s business has a sound foundation – all types of
environments need to be measured to understand them and,
when possible, control them. Vaisala’s job is to provide the best
possible tools to build this understanding, which aims at saving
or securing resources and human lives.
Raimo Voipio
Chairman of the Board of Directors
to
7CHAiRMAN’s MessAge

strong
TogetherIn Vaisala, as in businesses everywhere, focus on sustainability
is shifting from reducing negative impacts to creating sustained
value over time and positive societal impacts. We are also
looking for better ways to express our purpose and tangible
impacts on society and our stakeholders.
Towards a Net Positive VaisalaThis is why new business approaches like net positive
approach, circular economy and integrated value creation
are gaining ground among pioneering companies. They show
that businesses see true value in sustainability and have hence
adopted it into the core of their strategy and operations.
To us, striving to become net positive is a vision that means
doing business in a way that puts back more into society, the
environment and the global economy than it takes out – having a
bigger handprint than footprint.
For the customers, it means that applying our technologies
will improve their performance in a way that reduces negative
impacts of operations, such as emissions, waste, material use
or risks. Ultimately, this will have a net positive effect on the
environment around the globe.
To succeed, becoming net positive requires determination
and planning for long-term success, as well as strong financial
performance and ability to attract the best talent and seeing
the true big picture. Embracing the net positive idea is a
challenging endeavor for any company, but we are driven by
our strong value base and the passion to solve the most difficult
challenges of our time.
Ultimately, we believe that the handprint of applying our
technologies outweighs the footprint of manufacturing our
sensors and hardware.
In more practical terms, Vaisala solutions help reduce energy
consumption in buildings, and at the same time improve
indoor air quality and hence the well-being of the people in the
buildings. Our instruments help make industrial processes more
efficient, optimizing the use of electricity and improving end
product quality. Our weather observation systems provide data
that makes it possible to provide residents advance warning of
tropical storms or flash floods, saving lives. Vaisala services help
pinpoint the most advantageous sites for solar and wind energy
farms.
These are just a few examples of how Vaisala has an indirect
positive impact on its customers and through them, the society
as a whole. However, we do not have a perfect way to verify the
extent of our impact yet; finding a reliable method for this is
work in progress.
Building Capacity for Better Informed SocietiesA growing area of positive influence is capacity
building in developing countries. The World
Meteorological Organization aims
at improving meteorological
capabilities in order to mitigate
the impacts of extreme
weather, but also to enable
the use of weather information
to eradicate poverty and
achieve internationally agreed
development goals.
In 2016, Vaisala has been deeply
involved in these projects, helping
nations get weather-ready, supplying
them with weather radars, for example.
In February, we signed a contract with
National Hydro-Meteorological Service of Vietnam over
establishing a high quality nation-wide meteorological
infrastructure in Vietnam, and in October, a contract was
signed with the Ministry for Transport and Aviation of the
Commonwealth of the Bahamas.
Both countries suffer from extreme weather phenomena
every year, including tropical storms, floods and severe
lightning. After building the meteorological infrastructure,
the countries will be able to serve the whole nation with high
quality meteorological data and weather forecasts, helping
minimize loss of lives and damages to property.
Capacity building not only benefits the countries in
question, but also the world as a whole. As the meteorological
observation network expands to new areas and provides data
in more detail, the basis for studying weather phenomena is
on an even firmer footing and able to advance the science of
forecasting further.
CEO’s Message
8 CeO’s MessAge

Of course, mitigating the effects of extreme weather is just as
relevant to developed countries. The Atlantic hurricane season
in 2016 was above average in activity. For instance, as Hurricane
Matthew hit Florida, Georgia, South Carolina and North Carolina
in the USA, it led to record-breaking flooding, with several lost
lives.
Vaisala’s solutions are used, for instance, in Hurricane
Hunters’ aircraft to determine the direction and strength of
hurricanes at sea, and thunderstorm detection systems provide
warnings for airports and lightning-sensitive operations.
Air Pollution the Single Biggest Environmental Health RiskIn developed countries, air quality has improved over the
years, but at the same time concern over its effects on health
and well-being has grown considerable, as people have
become better informed. In developing countries, poor air
quality is a considerable health hazard, with millions of
premature deaths attributable to it.
Effective and significantly more extensive
measurement networks are required to
understand and analyze the air pollution,
and to build efficient systems for
warning the public of hazardous levels
of pollutants. Our new instruments make
it possible to build dense but cost efficient
air quality measurement networks that increase the number
of measurement points and improve the access to real-time
air quality information for the authorities, decision-makers,
businesses and citizens.
Strong TogetherOne of Vaisala’s fundamental values is Strong Together. Our
success is not built in isolation, but in close cooperation
between our experts from around the world and our
customers, research partners and suppliers. We work with the
top minds of our field and take part in networks across sectors
– industry, academic, public, private or inter-governmental and
UN organizations – to share and exchange knowledge.
Today, our motto ‘observations for a better world’ rings more
true than ever. Essentially, we take refined sand, in the form of
silicon wafers, and transform it into state-of-the-art sensors that
safeguard pharmaceuticals, premature babies in incubators,
indoor and outdoor air quality, and allows scientists to study
incredible extremes, from Antarctica to Mars. Creating this
value for our societies, we have intelligent, knowledgeable,
and forward-looking people, who want to have a job that has
meaning and impact. We can provide them with that. Observing
our world closely takes us to a better understanding of its
workings, and understanding helps us build a better and more
sustainable future for us all.
Kjell Forsén
President and CEO
9CeO’s MessAge
IntegrityWe are honest, respectful and reliable. We promote sustainable and ethical behavior.
Values
Customer FocusWe strive for deep understanding of our customers’ needs and aim at meeting them in everything we do.
Innovation and RenewalWe embrace pioneering innovation and drive change through continuous improvement and learning.
Strong TogetherWe excel by sharing, learning and working together with each other and our stakeholders.
Ourguide Us
10 VAlUes

Controlled EnvironmentWeather
OurStrategygrowth through industryleading offering and digital services
growth through product leadership
Across Vaisala we build our excellence and leadership on
Vaisala’s goal of profitable growth will be achieved in the
following strategic areas: business area-specific growth,
reliability, and operational excellence.
Growth will be created in the Weather Business Area by
building new business around decision support services
that are offered to renewable energy, aviation and roads
customers. The Controlled Environment Business Area will
focus on enhancing its offering and developing the sales
channel for life science and industrial customers to create
value for customers’ operations.
Reliability creates customer satisfaction and loyalty. High
quality of products and services, well-functioning customer
service, and accurate deliveries assure a reliable customer
experience.
Operational efficiency focuses on optimized global
networks, streamlined supply chains, common capabilities,
and continual improvement in all functions to ensure
increased efficiency of Vaisala’s operations.
Observations for a BetterWorld
Reliability We ensure highest reliability and customer delight. We offer reliable, high quality and high performance products, systems and services to our customers. We are a dependable partner for our customers and partners and a reliable employer.
Excellence in high-mix, low volume businesses We have a wide product port folio to serve our customers’ needs in our chosen markets. it is in our core to master the complexity of our manufacturing, sourcing, delivery, and customer service, and to continue to improve their operational efficiency and flow.
Expertise in applications, science and technologies We focus on understanding our customers’ applications, needs and problems, having deep scientific understanding of physical phenomena and being the leader in the latest technologies to bring the best possible solutions to our customers.
11sTRATegY
The Weather Business Area continued its efforts to create
customer value and growth by building business around digital
services that are offered to renewable energy, aviation and
roads customers. Key product launches to enhance growth as
well as to replace existing products included enhancements
to Observation Network Manager NM10, new version of AviMet
Airport Weather Observation System (AWOS) and new version
of sounding system software.
In 2016, Vaisala entered the growing air quality monitoring
market by acquiring products and technology which measure
pollution gases and particles in the air. These products can
be seamlessly combined with Vaisala’s industry-leading
weather sensors, enabling a compact and cost effective
solution for measurement networks. This provides Vaisala a
great opportunity to expand into the air quality monitoring
market, which is supplementing traditional high cost reference
measurement stations. Vaisala expects opportunities in
particular in markets like China, India and the Middle East in
the near future.
While the renewable energy market outlook has remained
solid, development and adaptation of Vaisala’s energy services
has been slower than expected and commoditization of
certain products has led to deterioration of market prices.
Therefore, expected return on Vaisala’s Energy business
investment weakened, and Vaisala recorded a EUR 10.5
million write-down of intangible assets, such as technology
and customer relationships, to Weather Business Area’s
operating results in 2016. Vaisala has decided to focus its
Energy business unit to areas of more sustainable long-term
competitive differentiation. Going forward, Energy business
unit’s offering is based on industry-leading renewable energy
measurement systems, resource assessment and asset
management solutions.
In February, Vaisala made the decision to reshape its
Transportation business unit within Weather Business Area to
simplify structure, and improve profitability and partly divested
the related business in the U.S. Going forward, Transportation
business unit will focus on product leadership, delivery
capability and expansion of information services in order to
drive growth, profitability and customer focus. Vaisala aims
to improve Transportation business profitability by focusing
on Vaisala platform products providing high value customer
support and expanding information services.
At the end of the year, Vaisala decided to reorganize its
Weather Business Area in order to simplify structure and
operations and to better align with the strategy. From January
1, 2017 onwards, Weather Business Area has organized its
business under four regions (Americas; Europe; Asia-Pacific,
Middle East and Africa; China), which have profit and loss
responsibility. Additionally, Weather Business Area separates
its product and service offering into two business lines
(Offering and Information Services), which are responsible for
product management, application expertise and R&D.
The Controlled Environment Business Area’s product leadership
strategy provided a strong platform for further growth during
2016. Controlled Environment Business Area continued to grow
through industrial measurement solutions in various industries
across all geographical areas. Regional expansion continued
by contracting new distributors in countries with high industrial
potential. This had a positive impact on distributor sales, which
achieved double-digit growth.
Controlled Environment Business Area continued investing
in its growth markets, life science and power transmission.
Continuous monitoring systems offered to life science and
other industrial customers had, as in previous year, double-digit
growth with further improving profitability and contributing to
Controlled Environment Business Area’s operating profit even
though investment phase still continues.
Vaisala made a new product entry to power transmission
customers by launching a measurement device for transformer
online monitoring. For life science and industrial domain
customers Vaisala launched the viewLinc Environmental
Monitoring System. Other key launches included a new probe
for industrial CO2 measurement applications and related host
device.
Controlled Environment
Weather
2016Strategy
implementation in
12 sTRATegY
13sTRATegY
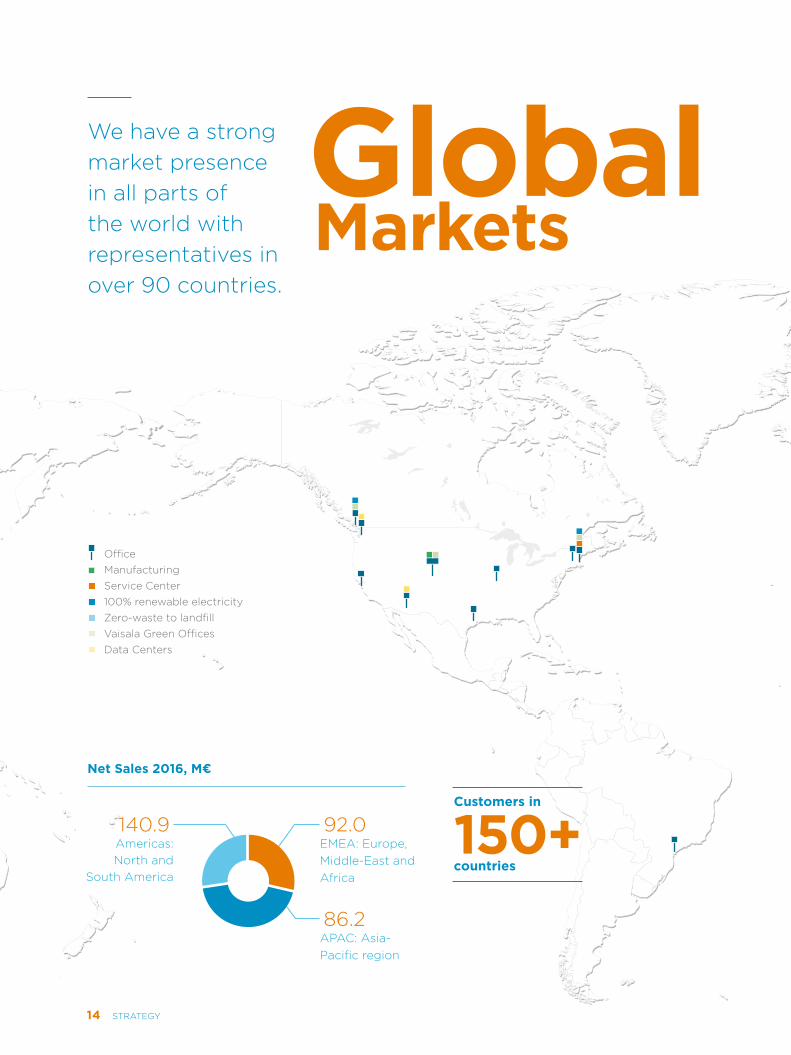
Global Markets
We have a strong market presence in all parts of the world with representatives in over 90 countries.
OfficeManufacturingservice Center100% renewable electricityZerowaste to landfillVaisala green OfficesData Centers
140.9 92.0eMeA: europe, Middleeast and Africa
Americas:North and
south America
Net Sales 2016, M€
Customers in
150+countries
86.2APAC: Asia Pacific region
14 sTRATegY
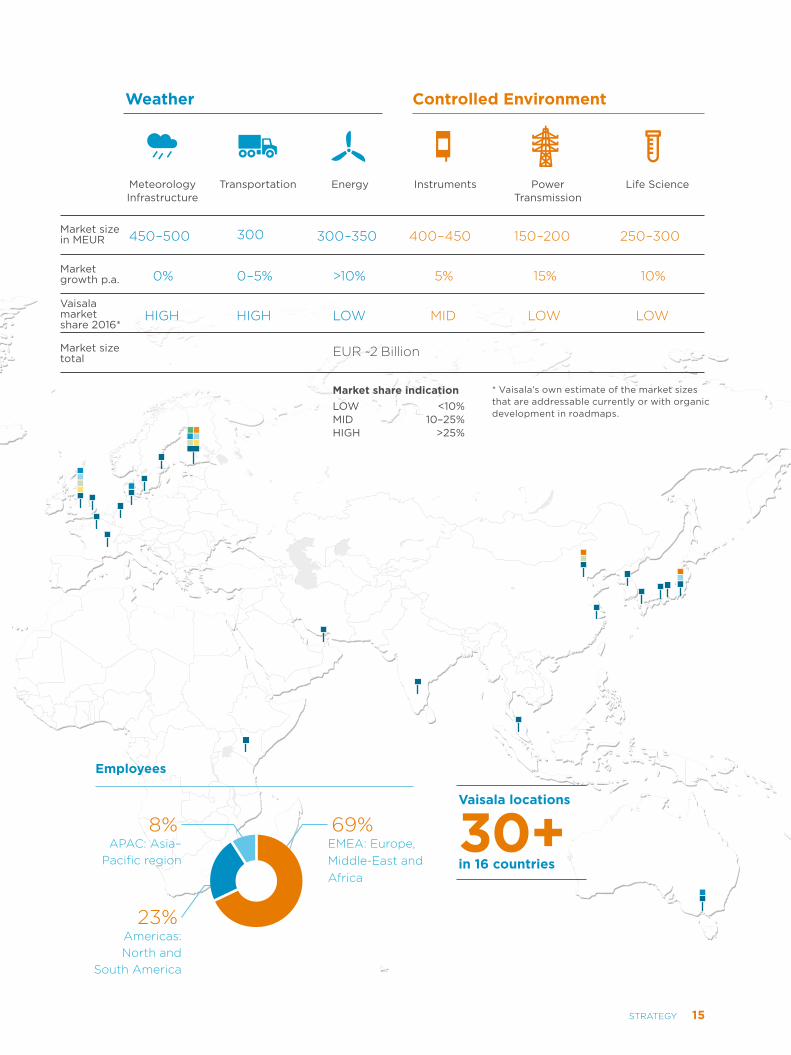
Global MeteorologyInfrastructure
InstrumentsTransportation Power Transmission
Energy Life Science
Weather Controlled Environment
HigH
eUR ~2 Billion
MiDHigH lOWlOW
450–500 400–450300 150–200300–350 250–300
0% 5%0–5% 15%>10% 10%
lOW
Market sizein MEUR
Marketgrowth p.a.
Vaisala market share 2016*
Market sizetotal
* Vaisala’s own estimate of the market sizes that are addressable currently or with organic development in roadmaps.
Market share indicationLOW <10%MID 10–25%HIGH >25%
8% 69%
23%
eMeA: europe, Middleeast and Africa
Americas:North and
south America
APAC: Asia– Pacific region
Employees
Vaisala locations
30+in 16 countries
15sTRATegY

FE
ED
BA
CK
VALUECREATED
INVESTORSRESPONSIBLERETURNS
EMPLOYEES CUSTOMERS SOCIETY & ENVIRONMENT
Purposeful work
Well-being
Learning
Better informed societies
Economic value
Safety
Reliable decisions
Productivity
Quality
Growth through industry-leading
o�ering and digital services
Growth through product
leadership
CONTROLLEDENVIRONMENT
Strong together
Integrity
Customer focus
Innovation and renewal
Excellence in high mix, low volume businesses
WEATHER
OBSERVATIONS FOR A BETTER WORLD
WHAT DO WE FOCUS ON?
WHAT DO WE NEED?
Stro
ng
P
rofessional
Technology Robust Vaisala production Net
fina
ncia
l pos
iti
on
excellence
leadership partnerships system positive
Climate change
Renewable energy
Future of mobility
Digitalization & big data
Resource e�ciency & circular economy
Energy e�ciency
Improved well-being & health
Urbanization Sustainabilityawareness
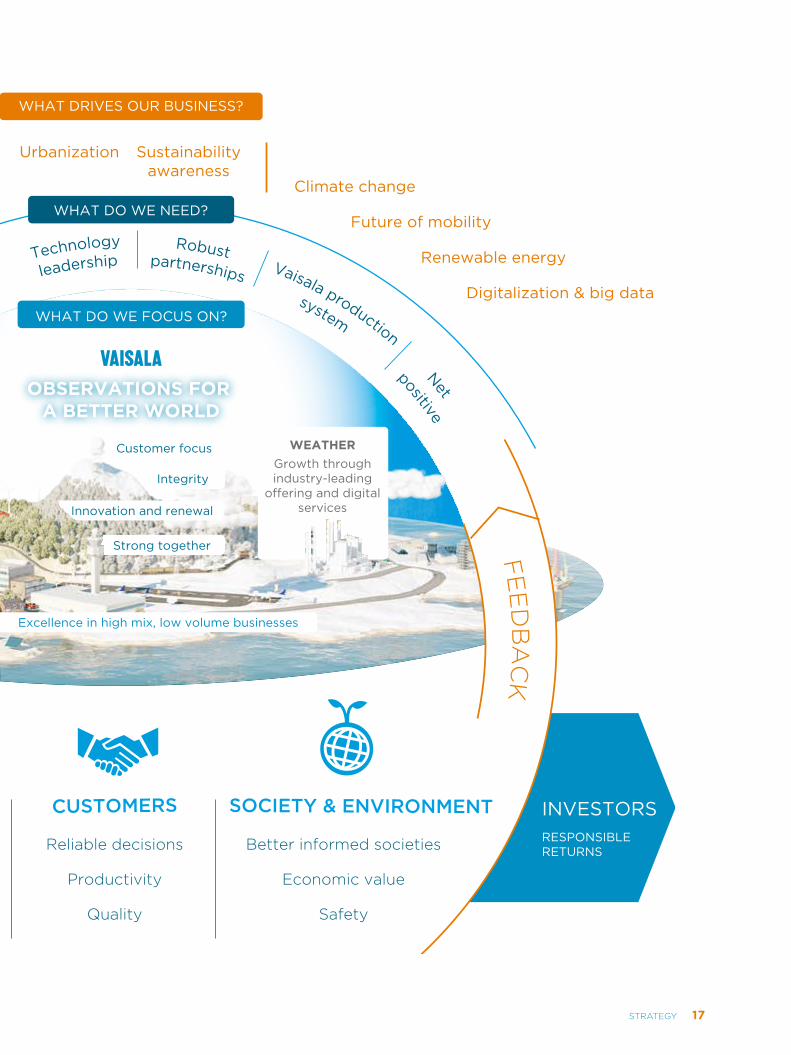
WHAT DRIVES OUR BUSINESS?Vaisala’sWorldWe believe in a world where environmental measurements and observations improve every aspect of daily life.
Vaisala’s value creation model is a holistic representation of our impacts in the world and shows the values we create to our key stakeholders.
ofObservations
16 sTRATegY
FE
ED
BA
CK
VALUECREATED
INVESTORSRESPONSIBLERETURNS
EMPLOYEES CUSTOMERS SOCIETY & ENVIRONMENT
Purposeful work
Well-being
Learning
Better informed societies
Economic value
Safety
Reliable decisions
Productivity
Quality
Growth through industry-leading
o�ering and digital services
Growth through product
leadership
CONTROLLEDENVIRONMENT
Strong together
Integrity
Customer focus
Innovation and renewal
Excellence in high mix, low volume businesses
WEATHER
OBSERVATIONS FOR A BETTER WORLD
WHAT DO WE FOCUS ON?
WHAT DO WE NEED?
Stro
ng
P
rofessional
Technology Robust Vaisala production Net
fina
ncia
l pos
iti
on
excellence
leadership partnerships system positive
Climate change
Renewable energy
Future of mobility
Digitalization & big data
Resource e�ciency & circular economy
Energy e�ciency
Improved well-being & health
Urbanization Sustainabilityawareness
WHAT DRIVES OUR BUSINESS?
17sTRATegY
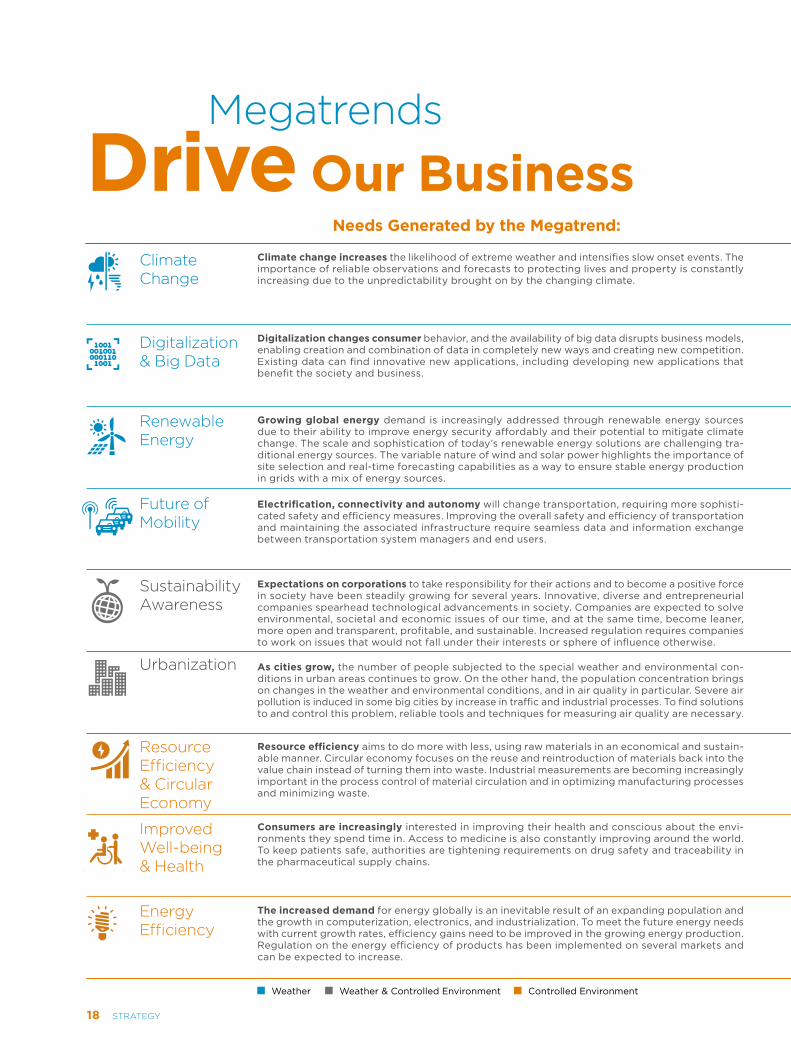
Drive Our Business Climate Change
Digitalization & Big Data
Renewable energy
Future of Mobility
sustainability Awareness
Urbanization
Resource efficiency & Circular economy
improved Wellbeing & Health
energy efficiency
Needs Generated by the Megatrend:
Climate change increases the likelihood of extreme weather and intensifies slow onset events. The importance of reliable observations and forecasts to protecting lives and property is constantly increasing due to the unpredictability brought on by the changing climate.
Digitalization changes consumer behavior, and the availability of big data disrupts business models, enabling creation and combination of data in completely new ways and creating new competition. Existing data can find innovative new applications, including developing new applications that benefit the society and business.
Growing global energy demand is increasingly addressed through renewable energy sources due to their ability to improve energy security affordably and their potential to mitigate climate change. The scale and sophistication of today’s renewable energy solutions are challenging tra-ditional energy sources. The variable nature of wind and solar power highlights the importance of site selection and real-time forecasting capabilities as a way to ensure stable energy production in grids with a mix of energy sources.
Electrification, connectivity and autonomy will change transportation, requiring more sophisti-cated safety and efficiency measures. Improving the overall safety and efficiency of transportation and maintaining the associated infrastructure require seamless data and information exchange between transportation system managers and end users.
Resource efficiency aims to do more with less, using raw materials in an economical and sustain-able manner. Circular economy focuses on the reuse and reintroduction of materials back into the value chain instead of turning them into waste. Industrial measurements are becoming increasingly important in the process control of material circulation and in optimizing manufacturing processes and minimizing waste.
Consumers are increasingly interested in improving their health and conscious about the envi-ronments they spend time in. Access to medicine is also constantly improving around the world. To keep patients safe, authorities are tightening requirements on drug safety and traceability in the pharmaceutical supply chains.
The increased demand for energy globally is an inevitable result of an expanding population and the growth in computerization, electronics, and industrialization. To meet the future energy needs with current growth rates, efficiency gains need to be improved in the growing energy production. Regulation on the energy efficiency of products has been implemented on several markets and can be expected to increase.
As cities grow, the number of people subjected to the special weather and environmental con-ditions in urban areas continues to grow. On the other hand, the population concentration brings on changes in the weather and environmental conditions, and in air quality in particular. Severe air pollution is induced in some big cities by increase in traffic and industrial processes. To find solutions to and control this problem, reliable tools and techniques for measuring air quality are necessary.
Expectations on corporations to take responsibility for their actions and to become a positive force in society have been steadily growing for several years. Innovative, diverse and entrepreneurial companies spearhead technological advancements in society. Companies are expected to solve environmental, societal and economic issues of our time, and at the same time, become leaner, more open and transparent, profitable, and sustainable. Increased regulation requires companies to work on issues that would not fall under their interests or sphere of influence otherwise.
Megatrends
Aging Populationand Health
ClimateChange
ConnectedDevices
Digitalizationand Big Data
EnergyE�ciency
Growing Electric Power Consumption
RenewableEnergy
Weather Weather & Controlled Environment Controlled Environment
18 sTRATegY
Vaisala’s Response:
Vaisala helps its customers to establish weather observation networks and build up capabilities that improve their capacity to assess, predict, and prepare for extreme weather. In addition, we support the scientific community in its effort to increase knowl-edge of our changing climate and its impacts, by enabling them to observe our world as accurately as possible. Our aim is to help nations to better understand their vulnerabilities and risks and become more resilient to climate change through state-of-the-art environmental observations and forecasting.
Data gathered through Vaisala’s weather observation platforms forms the basis for decision-making by governmental organiza-tions, research organizations and the public. Vaisala delivers decision support by integrating observational data into applications via unified, connected services. We focus on meeting the expanding needs and requirements of users across multiple industries and disciplines. This is especially true in transportation, air quality, renewable energy, and the power industry at large.
Renewable energy sites must be selected based on verifiable local environmental conditions. Modeling future energy output from wind and solar production sites is a requirement for both investment decisions and to achieve maximum energy output from the deployed assets. Vaisala predictive models and measurement technologies provide comprehensive information that facilitates sound investment decisions for wind and solar sites. Vaisala’s energy assessment methodology reduces performance risk with accurate estimates of long-term energy production at a site, while our measurements and real-time power forecasting capabilities aid in determining and predicting power generation, which can vary significantly in the short term.
Vaisala provides solutions that help transportation authorities and operators ensure the safety and efficiency of road, rail, sea, and air transport. Connected networks will collect and disseminate data and information between national and local observation and forecasting networks, to be delivered directly to vehicles. Connected services will integrate weather data seamlessly into decisions support systems and vehicle automation, increasing safety and efficiency of all modes of traffic.
Vaisala provides reliable tools and technologies for measuring air quality, urban weather and micro-climates, and traffic, enabling authorities, businesses and the public to observe, react to, and mitigate the effects of weather. From the viewpoint of industrial growth, Vaisala offers diverse and advanced technologies needed in environments that need precise and constant monitoring, e.g. hospitals, subways, and large manufacturing facilities.
Our responsibility does not stop at the factory door. We have been anticipating stronger requirements and commitments for sus-tainable business from customers, governments and the public for a long time, to be ready for them ahead of time. Increasingly, not just consumer-facing companies are scrutinized for their responsible and ethical behavior. In Vaisala’s environmental observations business, trust, reliability, quality, respect, and sustainability are fundamental attributes that lay the foundation for our existence. We aim to be at the forefront in our industry, even from the sustainability point of view. Moreover, the positive effects on society occur through our customers when they apply our solutions, and therefore reach the sustainability targets of their own operations.
The purpose of Vaisala’s industrial measurement solutions is to improve productivity, end product quality and yield, and resource efficiency in industrial processes. Vaisala’s excellence in maintenance and calibration services ensures a very long lifetime for the instruments and guarantees their reliable operation in harsh environmental conditions. Optimization of manufacturing processes and process control for material circulation require robust and high-quality measurement solutions; this performance is intrinsic to Vaisala’s instruments.
Technological advances make it possible to increase environmental monitoring of indoor conditions to secure people’s health and well-being. Vaisala’s solutions safeguard and optimize living and working conditions inside buildings, laboratories, hospitals, incubators, and other strictly controlled environments. They also help optimize the conditions in pharmaceutical manufacturing and supply chains, guaranteeing the safety of drugs we use. Vaisala’s high-end monitoring solutions provide the accuracy and stability required to monitor these critical environments reliably and continuously.
Vaisala’s measurement technologies improve energy efficiency by optimizing the control of many industrial processes. Vaisala helps customers in a multitude of energy intensive industries to reduce energy consumption as well as improve operations. Meas-uring parameters like humidity, carbon dioxide and temperature is important in many sectors, such as in Heating, Ventilation and Air-conditioning (HVAC) automation and in drying processes.
19sTRATegY
engaging OurStakeholdersWe want to have an open relationship with our stakeholders, as they are the ones who influence the future of our business. We are active in many corners of society and want to influence and convince people with our expertise. Working with environmental issues is a priority in our scope of societal affairs.
Stakeholder EngagementWe identify and evaluate our stakeholders as part of our
risk and sustainability management procedures. Both
assessment methods are carried out internally and are part
of corporate-wide processes. We determine the impact of
various stakeholder groups on the company and analyze how
our actions in turn affect them. We actively seek partnerships
and joint opportunities with customers, suppliers, academia,
research institutes, and other parties. We maintain a constant
dialogue with our most important stakeholders.
The previous systematic stakeholder study was carried out
in the fall 2016 with the intent of getting feedback from expert
stakeholders on what a report like this should include to be
valuable for Vaisala’s stakeholders. The survey was carried
out through in-depth interviews with investors, customers,
employees, research partners, and Vaisala management, by
an external consultancy agency. The results provided insight
into the future of reporting requirements, as well as into
strategy, transparency and sustainability issue management.
Some of the key takeaways were how Vaisala should present
value creation of its operations to stakeholders, how to discuss
it with them, and how sustainability should be integrated
into strategy, processes, and operations. One of the results
that came out of the discussion and interviews led us to
consolidate our grouping of stakeholders and prioritize the
four stakeholder groups that have the most influence on
Vaisala.
20 sTAkeHOlDeRs
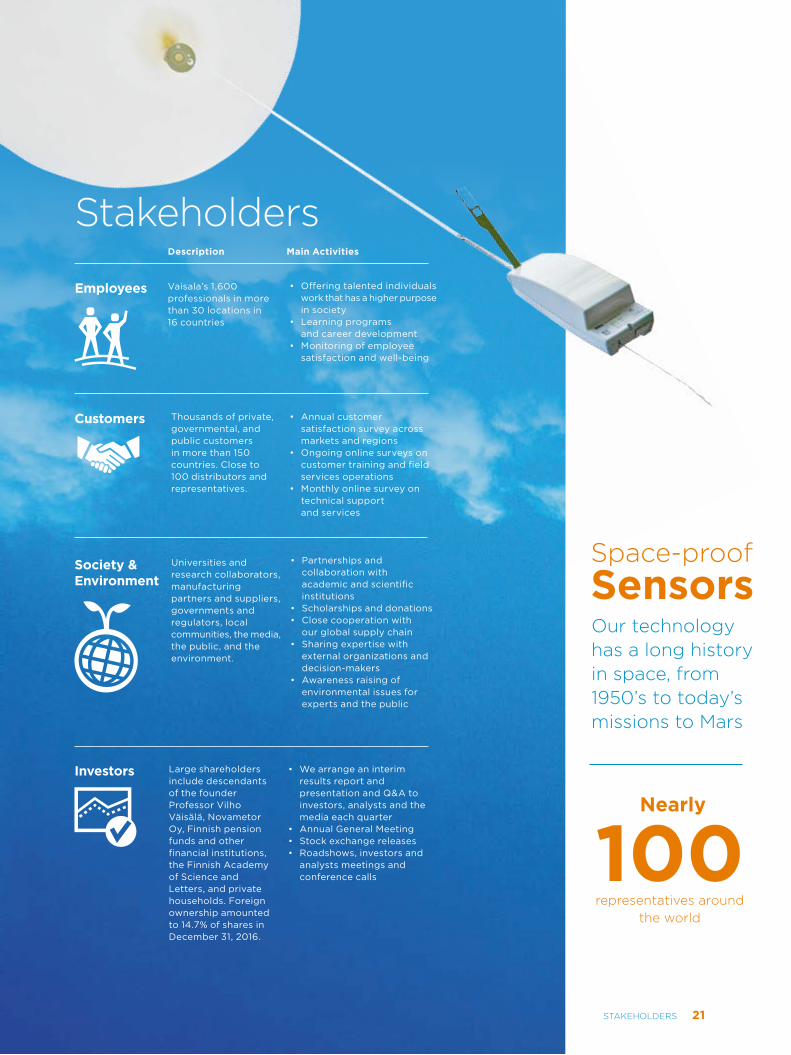
stakeholders
Investors Large shareholders include descendants of the founder Professor Vilho Väisälä, Novametor Oy, Finnish pension funds and other financial institutions, the Finnish Academy of Science and Letters, and private households. Foreign ownership amounted to 14.7% of shares in December 31, 2016.
• We arrange an interim results report and presentation and Q&A to investors, analysts and the media each quarter
• Annual General Meeting• Stock exchange releases• Roadshows, investors and
analysts meetings and conference calls
Employees • Offering talented individuals work that has a higher purpose in society
• Learning programs and career development
• Monitoring of employee satisfaction and well-being
Vaisala’s 1,600 professionals in more than 30 locations in 16 countries
Customers • Annual customer satisfaction survey across markets and regions
• Ongoing online surveys on customer training and field services operations
• Monthly online survey on technical support and services
Thousands of private, governmental, and public customers in more than 150 countries. Close to 100 distributors and representatives.
Society & Environment
Universities and research collaborators, manufacturing partners and suppliers, governments and regulators, local communities, the media, the public, and the environment.
• Partnerships and collaboration with academic and scientific institutions
• Scholarships and donations• Close cooperation with
our global supply chain• Sharing expertise with
external organizations and decision-makers
• Awareness raising of environmental issues for experts and the public
Description Main Activities
Our technology has a long history in space, from 1950’s to today’s missions to Mars
spaceproof Sensors
100representatives around
the world
Nearly
21sTAkeHOlDeRs

Create Valueto Our Employees
Curious and capable employees are a cornerstone of Vaisala’s success. Attracting creative and skilled people is not selfevident, and every member of our team is valued and respected. Although our employees stay with us for a decade on average, we do not take this for granted, and aim to offer them highly motivating career paths. This kind of longterm commitment has provided us with extremely competent professionals dedicated to developing superior technology and longterm customer relationships.
Vaisala offers meaningful challenges to curious and passionate
professionals who value work with a purpose.
Integrity is one of our core values, meaning that we want to
maintain an honest, respectful and reliable work environment.
We promote sustainable and ethical behavior. We are proud
that our employees find these values visible in their daily lives.
Environmental observations that have a true purpose for
societies, businesses and individuals are a key motivator for
many of our employees. Being at the forefront of solving the
most difficult challenges of our time is an exciting part of
being with the Vaisala team.
Value created: Purposeful Work
How We
Giant Leap InternshipChallenging but also rewarding, Vaisala Giant Leap internship
program targets university students with a variety of skills,
qualities and educational backgrounds. Each year up to 20
students work with real-life projects that have genuine business
relevance for a period of three months over the summer. The
three-month project is filled with social events, engaging
training sessions and it culminates in presenting the project
outcomes to Vaisala’s management group at the end of the
summer. Many of the interns end up continuing with us in
various positions, whether as thesis workers or specialists in
their field and start building their careers in Vaisala.
22 HOW VAisAlA CReATes VAlUe

Employee Engagement Index
I am proud that I work for Vaisala
4.08/5
4.14/5
Indicators:
Our people talking about the purpose of their work“I’m proud to work at Vaisala because I can see that the company cares about the earth. I know I am contributing to something valuable. Our work even saves lives.”
“The best quality of an employer is to provide a sense of meaning to our work – environmental measurements are more important than ever”
“Vaisala is filled with good people. The company trusts its employees to do their job, so employees in turn trust the company. That, in my opinion, is what makes Vaisala such a great company.”
“We provide global solutions that can, and often will, make a positive difference. The best part of this is that we all have an important role in this effort.”
Great Leadership One of Vaisala’s key strengths is the competence of its middle
management and team leaders. They regularly score above
our peer companies in annual personnel surveys. We invest
in good leadership by offering comprehensive training for
our managers and supporting them in their work. Many of our
development programs focus on generating great leadership,
fostering a healthy workplace culture, and supporting a good
work-life balance.
At Vaisala we see the value of great leadership and believe
that investments in leadership development not only bring
better results but also increase the well-being of both managers
and team members. Good leaders help us attract and retain
talented employees. When both managerial and professional
expertise are highly valued, there are also more attractive
development opportunities for employees in both areas.
For our managers in supervisory positions, we have a
corporate wide learning program, LEAD. The program started
in 2007 and has since then developed the leadership skills of
our managers around the world. Along the way a spin-off called
Expert LEAD has evolved. It is a program for employees who
are not in supervisory role but need excellent leadership and
communication skills.
Awesome Place to WorkVaisala’s Operations organization has systematically improved
its manufacturing and delivery capabilities thus fulfilling the
strategic objective of operational excellence. To support and
further develop these capabilities, Vaisala Production System,
an overarching method of ensuring operational excellence,
was launched in 2016. By standardizing the ways of working
and empowering the whole organization to systematically
develop them together, the Production System will lead to ever
smarter work and shared commitment to improvements. We are
aiming for high performing, evolving teams, with a clear vision
– we want to be an ‘Awesome Place to Work’.
23HOW VAisAlA CReATes VAlUe

Jukka-Pekka Piirainen
joined Vaisala in 2015
as a part of the Giant Leap
program. Giant Leap is Vaisala’s
own internship program that gives interns the opportunity
to make a true impact. Like many of the former Giant Leap
interns, also Jukka-Pekka has stayed onboard.
At the start of the internship, Jukka-Pekka had just
finished his fifth year of the Industrial Engineering and
Management degree program at Tampere University of
Technology: “As my studies were drawing to a close, I felt
that it was time to look for a truly ambitious and interesting
summer job to challenge myself and to develop profes-
sionally. Giant Leap offered me what I was looking for. It
provided me with experience of managing a project of my
own. It also offered a comprehensive view to cross-func-
tional co-operation and collaboration between Vaisala and
its suppliers,” says Jukka-Pekka.
A great experience The summer at Vaisala lived up to Jukka-Pekka’s expecta-
tions professionally, and even exceeded his expectations
in terms of how much he enjoyed the experience: “Thanks
to the other interns and Vaisala’s welcoming people. It was
incredibly rewarding to take up the challenge since the
projects are genuinely considered important in the com-
pany. Vaisala has proven to be an employer whose values
I can share, a workplace where my work is appreciated,
and a company that can make a global difference through
innovation.” After his summer working as a part of Giant
Leap, Jukka-Pekka was able to utilize his experiences in
his thesis: “My thesis built on the lessons learned and in-
cluded developing systematic practices for Early Supplier
Involvement in Vaisala.”
Future with VaisalaNowadays Jukka-Pekka works as Sourcing Project Manager
in Vaisala’s Helsinki office. He participates in new product
development projects as a sourcing representative and one
of his key responsibilities is driving and facilitating Early
Supplier Involvement in practice: “Both Giant Leap and
my Master’s thesis prepared me for the job well. Having
participated in Vaisala’s mentoring program and several
trainings, I have been pleased with Vaisala’s opportunities
for personal development. To summarize, Giant Leap took
me to the core of strategic sourcing and offered me a
truly rewarding chance to influence practices and ways of
thinking. I got to carry out a full loop, from current state
analysis and generating development ideas, to change
management, practical implementation, and
continuous improvement,“ says
Jukka-Pekka.
JukkaPekka Took the giant leap
24 HOW VAisAlA CReATes VAlUe

Technology company Vaisala may not be the most obvious
choice that comes to the mind for a young marketing stu-
dent close to graduation. Business student Niina Reponen
however decided to apply, and was selected for Vaisala’s
Giant Leap internship program in 2011. “What really got my
attention was the international aspect of the company, as
well as the interesting Giant Leap projects. I’m glad I kept
my mind open and joined the company – the Giant Leap
summer exceeded all my expectations. I got to
work with an interesting and meaningful
project, which strengthened my skills
in digital marketing, which is my
field of specialization,” Niina
recollects.
Best People globallyAfter her Giant Leap
summer Niina wrote
her Master’s thesis about
Vaisala. Ever since, she has worked in several positions in
marketing at the company. She is amazed by how much
responsibility the company is willing to give to young
professionals: “International projects have brought me to
Boston, where I’m currently located. It’s eye-opening to see
the company’s operations in another continent and from
another perspective. Vaisala is truly a global company,
which makes the business and everyday work exciting.
However, even if it’s a cliché, the people are the best part
of Vaisala. I feel privileged to work with such an amazing,
professional, fun and talented group of people,” she says.
From giant leap to Boston
Each year we handpick exciting real business challenges for ourGiant Leapers to manage. Our unique approach allows these young talents to kickstart their careers and gain special insight into our mission of creating observations for a better world.
The 20 interns in 2016 gave an overall score of 4.8/5 for the Giant Leap program. “Vaisala has a great working culture, I would definitely look forward to working here again” – Giant Leap Intern, 2016
25HOW VAisAlA CReATes VAlUe

The tenth global Vaisala Business Learning Program is
ongoing, extending leadership skills especially in strategy,
customer focus, personal growth and financial performance.
The program is about the future of Vaisala and it is a
strategic investment in the development of talent within our
organization, by broadening the perspectives of a selected
group of managers and experts. Participants for the program
are selected and approved by Vaisala Management Group.
The participant list is put together on the basis of individual
development discussions and strategic business aims. There
are around 25 employees on each program, and they come
from different units and locations around the company.
The ninth program ended in March 2016, with very positive
feedback from the participants.
Vaisala’s approach to competence development combines
internal and external learning programs, cooperation with
universities and researchers, job rotation, international
assignments, and mentoring and coaching processes. Vaisala
also maintains a comprehensive e-learning platform to
complement other learning methods. The online e-learning
environment hosts more than 40 interactive modules,
supporting our own employees learning and that of Vaisala’s
representatives and customers.
MentoringVaisala has a mentoring program to support the professional
development of its employees. We use mentoring as a method
of accelerating employee development and providing learning
opportunities for both the mentor and the mentee.
The program is a structured, goal oriented 12–18-month
process where mentees and mentors build a professional
Our competitive strength originates in our highly capable personnel. We encourage our employees to take the initiative to improve their capabilities, promoting an active approach to career planning. learning runs through every employee’s whole career in Vaisala, both through structured programs and through learning on the job and getting valuable firsthand experience.
Value created: Learning
relationship. It consists of a facilitated kick-off session,
coaching activities during the program as well as a facilitated
feedback session at the end of the program. The core of the
program is built on regular meetings between the mentor and
mentee.
Vaisala’s fifth mentoring program was launched in April
2016. The purpose of the program is to support professional
development, enhance Vaisala’s leadership and coaching
culture, and transfer tacit knowledge and best practices across
business units and functions. Altogether 48 participants with
diverse professional backgrounds and roles were selected
from multiple locations.
3.84/5 I have opportunities to develop my skills and competencies at work
3.83/5 My supervisor develops our skills and our operations
Indicators:
26 HOW VAisAlA CReATes VAlUe
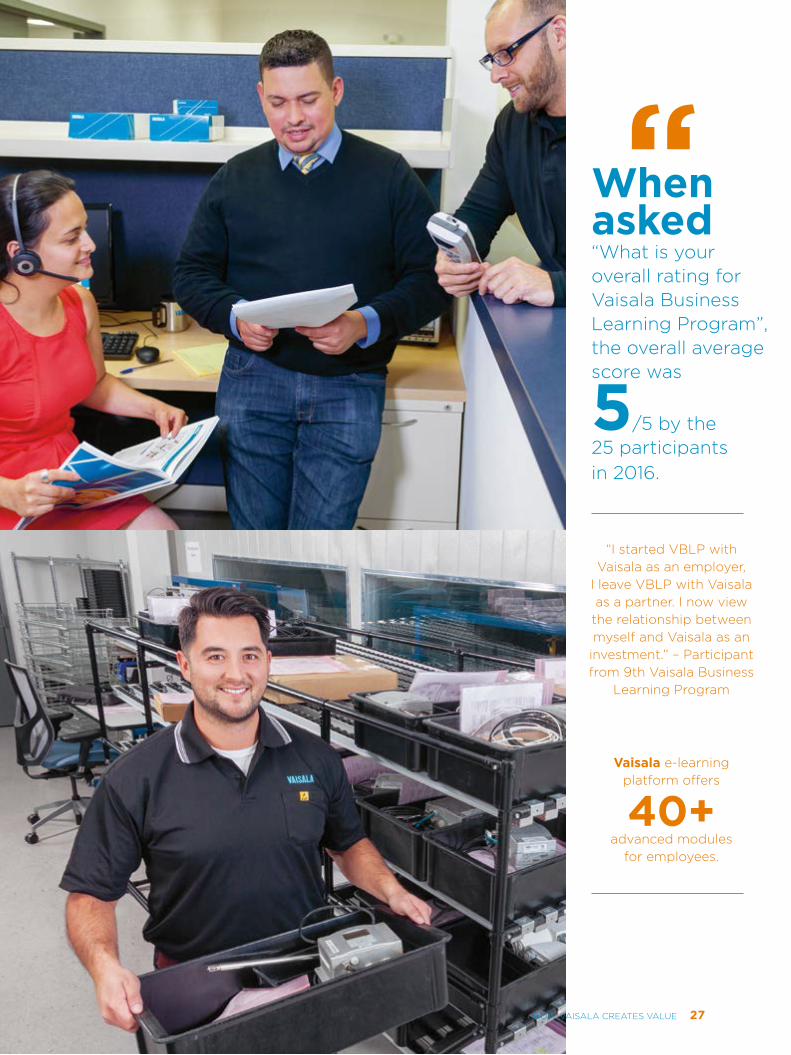
When asked “What is your overall rating for Vaisala Business learning Program”, the overall average score was
5/5 by the 25 participants in 2016.
“
Vaisala elearning platform offers
40+ advanced modules
for employees.
“i started VBlP with Vaisala as an employer,
i leave VBlP with Vaisala as a partner. i now view
the relationship between myself and Vaisala as an investment.” – Participant from 9th Vaisala Business
learning Program
27HOW VAisAlA CReATes VAlUe

Value created: Well-being
At Vaisala, well-being is regarded as comprising of following
factors: meaningful work, team spirit, leadership, balanced
work load, and safe working conditions. In addition, we
encourage and support employees in the adoption of healthy
and active lifestyle choices. We arrange and fund local
activities to support the well-being and health of our people,
We value work environments that support the wellbeing of our employees and smooth collaboration between teams. Our employees value the opportunities for good worklife balance as well as the meaningful challenges and outstanding supervisory work.
such as the Vaisala FIT program in the U.S. and sports and
recreational clubs in Finland.
Keeping Track of Well-beingEmployee satisfaction and well-being are measured regularly
at Vaisala to better understand the views of employees
throughout the company and to keep abreast with possible
changes and trends in our employees’ attitudes. The survey
is commissioned from a research company to guarantee the
confidentiality of responses. The response rate was 85% in
2016 and more than 1,300 employees took part in the survey.
Engaging CareersThe results showed that Vaisala employees are proud to
work at Vaisala, find their own work meaningful, and feel
professional in their own field of expertise. All survey areas
developed positively compared to previous year. Supervisors’
leadership showed strong positive development. Supervisors’
support, fairness and objectivity, as well as positive attitude to
new ideas were clearly above the benchmark data. Also team
work results developed nicely. Engagement is a strength across
Vaisala; however, cooperation between teams still requires
further improvement.
In addition to the annual Staff Survey, a global Pulse Survey
was conducted to further map out the level of employee well-
being at Vaisala. Pulse is a focused follow-up study to the Staff
Survey; it is conducted each fall. It provides complimentary
feedback and development input to the Staff Survey.
Feedback from the surveys is used for continual development
of our common ways of working and our work environment. The
most important phase in the process is group meetings where
the results are studied and development actions agreed. The
reports and team discussions held each year provide valuable
feedback to team leaders and support team development.
28 HOW VAisAlA CReATes VAlUe
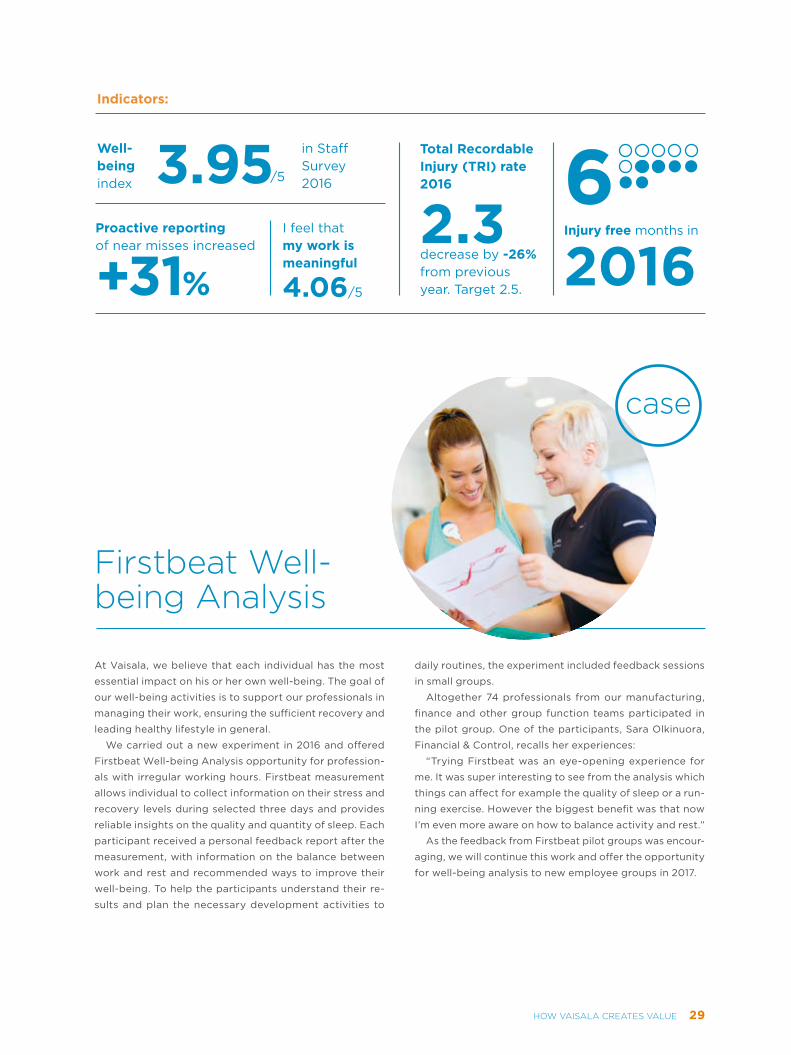
At Vaisala, we believe that each individual has the most
essential impact on his or her own well-being. The goal of
our well-being activities is to support our professionals in
managing their work, ensuring the sufficient recovery and
leading healthy lifestyle in general.
We carried out a new experiment in 2016 and offered
Firstbeat Well-being Analysis opportunity for profession-
als with irregular working hours. Firstbeat measurement
allows individual to collect information on their stress and
recovery levels during selected three days and provides
reliable insights on the quality and quantity of sleep. Each
participant received a personal feedback report after the
measurement, with information on the balance between
work and rest and recommended ways to improve their
well-being. To help the participants understand their re-
sults and plan the necessary development activities to
daily routines, the experiment included feedback sessions
in small groups.
Altogether 74 professionals from our manufacturing,
finance and other group function teams participated in
the pilot group. One of the participants, Sara Olkinuora,
Financial & Control, recalls her experiences:
“Trying Firstbeat was an eye-opening experience for
me. It was super interesting to see from the analysis which
things can affect for example the quality of sleep or a run-
ning exercise. However the biggest benefit was that now
I’m even more aware on how to balance activity and rest.”
As the feedback from Firstbeat pilot groups was encour-
aging, we will continue this work and offer the opportunity
for well-being analysis to new employee groups in 2017.
Firstbeat Wellbeing Analysis
Total Recordable Injury (TRI) rate 2016
I feel that my work is meaningful
4.06/5
decrease by -26% from previous year. Target 2.5.
2.3Proactive reporting of near misses increased
+31%
Injury free months in
20166
Well- being index
in Staff Survey 20163.95/5
Indicators:
29HOW VAisAlA CReATes VAlUe

We enable customers to make reliable decisions based on accurate environmental observations. Whether in transportation, the energy sector or various industrial applications, the information produced through our technologies help our customers make superior choices for the efficiency, safety, and sustainability of their operations.
CustomersHow We
to Our
Value created: Reliable Decisions
Create Value
30 HOW VAisAlA CReATes VAlUe

Vaisala’s equipmentdetects close to of the world’s thunder-storms and captures two billion lightning strikes each year.
100%Lightning causes around
24,000 deaths
240,000 injuries each year.
and
Winter road maintenance accounts for about
20% of the state DOT budgets. Each year, more than
USD 2.3 billion are spent on snow and ice control operations by state and local agencies. (FHWA, 2012)
Vaisala is the market leader with around
Air quality is a matter of life or death. In 2014, the World
Health Organization reported that an estimated seven mil-
lion people died in 2012 as a result of air pollution exposure.
Even though developed countries are not immune to
problems, developing countries fare much worse. Accord-
ing to “The Cost of Air Pollution” by the World Bank and
Institute for Health Metrics and Evaluation (IHME) at the
University of Washington, in 2013, about 93% of deaths
and nonfatal illnesses attributed to air pollution occurred in
them. The same study found that in 2013, premature deaths
due to air pollution cost the global economy about USD
225 billion in lost labour income, or about USD 5.11 trillion
in welfare losses worldwide.
Decisions Based on local DataToday, air quality is monitored using stations that measure
about 10–20 parameters, and cost a few hundred thousand
dollars. A megacity may have a few dozens of these sta-
tions, scattered around its area; a smaller city might have
two or three.
These stations are good at providing information on
the long term, but they monitor far too few parameters
to give a good picture of the atmosphere. Moreover, they
are too far apart to provide information on local air quality.
In addition, pollution in cities is highly local, made worse
by traffic, weather phenomena
and buildings.
When the network of air quality
observation stations is dense enough,
the information it provides can be used in
decision-making. Even today, air quality can be improved
by e.g. redirecting traffic, or temporarily closing manu-
facturing plants.
Understanding Through ObservationIn the long term, observations help in achieving a more thor-
ough understanding of the atmosphere and the interplay
between the weather and air pollution. The observations
could be used to start modelling the presence and spread
of air pollutants in a way similar to weather modelling today.
This understanding is essential, if we are to solve air quality
problems and mitigate their impact.
The latest addition to Vaisala’s offering are Air Quality
Transmitters that are a cost-effective solution to monitor-
ing conditions locally. The transmitters measure up to four
most common gaseous pollutants, such as nitrogen oxides,
sulphur dioxide, carbon monoxide, and ozone, as well as
particles (PM2.5 and PM10).
smoke gets in Your eyes — Air Quality at Dangerous levelsPoor air quality kills millions and costs a lot. Addressing the problem requires better understanding through observations, globally and locally.
3,700+ deployments of Triton Wind Profiler.
of the world’s non-invasive road
surface sensing equipment.90%
31HOW VAisAlA CReATes VAlUe
Value created: Productivity
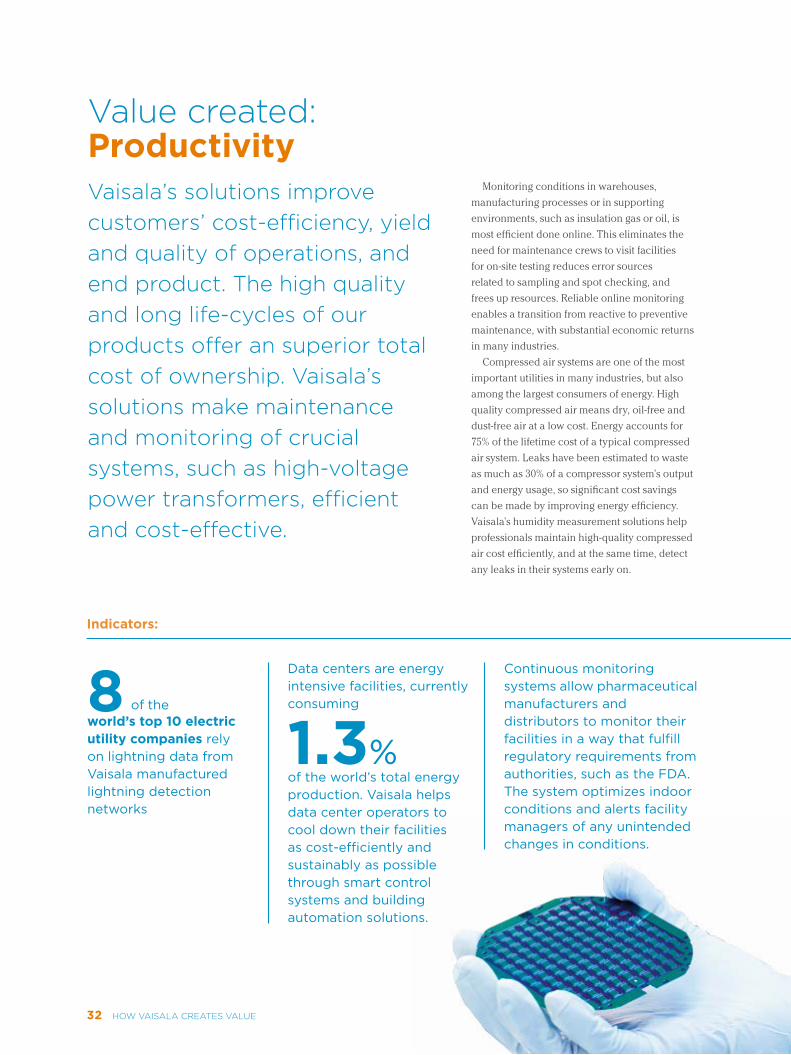
Continuous monitoring systems allow pharmaceutical manufacturers and distributors to monitor their facilities in a way that fulfill regulatory requirements from authorities, such as the FDA. The system optimizes indoor conditions and alerts facility managers of any unintended changes in conditions.
Data centers are energy intensive facilities, currently consuming
1.3% of the world’s total energy production. Vaisala helps data center operators to cool down their facilities as cost-efficiently and sustainably as possible through smart control systems and building automation solutions.
world’s top 10 electric utility companies rely on lightning data from Vaisala manufactured lightning detection networks
8 of the
Indicators:
Vaisala’s solutions improve customers’ costefficiency, yield and quality of operations, and end product. The high quality and long lifecycles of our products offer an superior total cost of ownership. Vaisala’s solutions make maintenance and monitoring of crucial systems, such as highvoltage power transformers, efficient and costeffective.
Monitoring conditions in warehouses,
manufacturing processes or in supporting
environments, such as insulation gas or oil, is
most efficient done online. This eliminates the
need for maintenance crews to visit facilities
for on-site testing reduces error sources
related to sampling and spot checking, and
frees up resources. Reliable online monitoring
enables a transition from reactive to preventive
maintenance, with substantial economic returns
in many industries.
Compressed air systems are one of the most
important utilities in many industries, but also
among the largest consumers of energy. High
quality compressed air means dry, oil-free and
dust-free air at a low cost. Energy accounts for
75% of the lifetime cost of a typical compressed
air system. Leaks have been estimated to waste
as much as 30% of a compressor system’s output
and energy usage, so significant cost savings
can be made by improving energy efficiency.
Vaisala’s humidity measurement solutions help
professionals maintain high-quality compressed
air cost efficiently, and at the same time, detect
any leaks in their systems early on.
32 HOW VAisAlA CReATes VAlUe

Vaisala CheckTime helps airlines reduce their consumption of de-icing chemicals in their winter operations by up to 30% through decision support for pilots based on real-time weather data.
Automated ventilation in buildings can be energy intensive as outdoor conditions affect how much indoor air needs to be cooled down or warmed up. Vaisala’s building automation solutions optimize indoor air and conserve energy by eliminating unnecessary ventilation through accurate measurement of humidity, temperature and carbon dioxide levels in buildings.
Improving yield and quality in customers’ manufacturing processes through installing technology that help to improve operational efficiency. Vaisala’s customer, a dairy manufacturer, managed to increase production volumes by more than
20% with zero increase in energy consumption, through accurate humidity and temperature measurements in their milk powder manufacturing.
Buildings are one of the biggest consumers of energy; in
2015, they accounted for about 40% of total U.S. energy
use. People want to save energy, but at the same time
they have higher expectations on their living and working
environments.
To address both demands, buildings are becoming smart-
er, optimizing the conditions indoors as well as energy
consumption.
McGraw Hill Construction published a SmartMarket Re-
port stating that intelligent buildings use 20–40% less
energy and result in 8–9% lower operating expenses with
valuations 7.5% higher than those with legacy systems.
Optimization for the long TermOptimizing indoor conditions requires integrated control
systems, and they can only work properly when their op-
eration is based on accurate and reliable measurements.
Even more important, however, is the stability of the sensors used
to measure indoor conditions.
The instruments used are left to their own devices for
years, so they need to be able to produce consistent and
dependable results. However, the end users and owners
often have to rely
on instruments the
builders and system
integrators have selected,
and in today’s cost-driven world,
the main criterion is price.
This helps keep initial costs to a minimum, but in the long
run, it can lead to higher maintenance costs and undermine
the advantages of smart buildings.
Taking the Outdoors into AccountGoing forward, buildings can be made even smarter by
using data from the outdoors.
Weather stations can provide information for optimizing
air intake and cooling or heating, drying or humidifying it.
In the future, forecasting could be used to change building
automation settings in advance. Anticipating temperature
peaks during the day, would allow systems to turn cooling
up before the midday heat warms up the building.
Outdoor air quality measurements could be used by
minimizing air intake when there is a lot of pollution or
harmful particles in the outdoor air.
smarter Buildings Have smaller Footprintssmart buildings save energy and keep their users healthy. For good results, building automation must be based on reliable measurements.
33HOW VAisAlA CReATes VAlUe

Value created: QualityA shared appreciation for quality is something that our customers value when choosing their environmental measurement technology provider. Highquality products and services have always been the core of Vaisala, but most importantly, ensuring the quality of customers’ end products or operations, is what makes all the difference.
Vaisala brings its technology and expertise to its customers’
operations to improve quality and resource efficiency in
various applications. At the customer, quality is improved by
making processes more efficient and raising the quality of
end products. Quality in operations typically entail ensuring
stable environmental conditions and minimizing waste, such
as reducing the need for treatment chemicals, saving energy in
drying processes, optimizing indoor air in buildings, but also
making the most out of an investment in wind parks or solar
production plants.
The value created for customers through our reliable
and sustainable technology is concrete and in many cases
not only improves yield, quality, and resource use, but the
profitability and quality of their operations and end products,
too. Coupled with unrivalled product quality and service,
the strength of Vaisala’s solutions is the proven, superior
Total Cost of Ownership. The long-life cycles of our products,
easy installation, low-maintenance needs, and exceptional
customer service guarantee that choosing Vaisala is always the
reliable and cost effective choice.
For example, metal industry customers performing heat
treatment processes benefit from atmospheric control with
Vaisala dewpoint transmitters. The metal surface ends up with
an improved finish and the process generates less scrap, and
higher yield.
34 HOW VAisAlA CReATes VAlUe

Vaisala’s HUMICAP® Humidity and Temperature Transmitter Series HMT330 has surpassed
installations world-wide100,000
of CO2 measurements in industrial applications
20 years
of net sales come from products that contain sensors manufactured in our in-house cleanroom
75% of
different products 6,000+
1,000+ shipments to customers weekly, with a typical one week lead time from order to delivery globally.
With continuous dissolved gas level monitoring, our customers can predict and reduce the maintenance costs of their transformers and greatly extend their investments’ lifespan.
Hundreds of thousands of power transformers
around the world are essential for providing elec-
tricity to communities. These transformers were
designed for a lifespan of 40 years, while the
average age is now already 42 years. The old
age is now starting to show as gradual trans-
former faults. This means that in the near future,
old transformers need to be either replaced or
repaired before the break downs cause outages,
or complete failures.
Replacing transformers with new ones is ex-
pensive, time-consuming and wasteful. Instead,
timely maintenance provides a more economical
solution. The challenge is to figure out which of
the operators’ transformers are at risk and when
to repair them before they fail.
ensuring long life Cycles for Power TransformersOne indicator of a potential fault is a change in
the levels of dissolved gas in the transformer oil.
The traditional periodic monitoring of these levels
has been inefficient and unreliable in the past.
Through the expertise in monitoring moisture in oil,
Vaisala developed an innovative system that ena-
bles continuous online monitoring of the dissolved
gas levels. This became the Vaisala OPT100 Op-
timus DGA Monitor.
The monitor provides operators with accurate
real-time data remotely, to anywhere in the world.
It measures and tracks levels of dissolved gas in
the transformer oil, and sends an alarm when
predetermined conditions are met. As a result,
potential problems can be resolved before the
equipment is damaged, and operators can op-
timize decision-making about when to service,
upgrade, or refurbish their transformers. The tech-
nology in the maintenance-free DGA monitor
eliminates false alarms reducing costs and freeing
up resources.
Servicing the transformers on time instead of
replacing them with new ones brings benefits
to both the operators and the society in form of
sustained economic value and stable power grids.
Maximizing the lifespan of power transformers
through this innovation is a great example of how
Vaisala can help its customers be part of a more
circular economy through technological advances.
When Failure is Not an Option
98%On-time Delivery was
in 2016
97.9% of surveyed customers were satisfied or very satisfied with Vaisala’s products.
Indicators:
35HOW VAisAlA CReATes VAlUe
Vaisala works together with nearly all meteorological institutes
in the world, supporting them to provide accurate, real-time
information and forecasts on weather events all around the
globe. Vaisala also collaborates with international funding
agencies and weather experts, and together build capacity for
weather observation networks in developing economies.
Extreme weather, such as hurricanes can have devastating
consequences on local economies and livelihoods. Vaisala
is the only manufacturer of hurricane tracking dropsondes
that are used for in-situ measurements inside a hurricane,
providing essential information when forecasting the
hurricane’s path and intensity.
Renewable energy is powered by weather and choosing
optimal locations for wind and solar power production is vital
for keeping the price of renewable energy low and investments
profitable. Vaisala’s solutions and services optimize site
selection and power output for the renewable energy sector.
Air pollution is yet another threat to the health and well-
being of people. The World Health Organization, WHO, has
estimated that poor air quality causes seven million premature
deaths annually, three million of which are directly linked to
ambient air pollution. People living in low- and middle-income
countries disproportionately experience the burden of outdoor
air pollution with 87% occurring in low- and middle-income
countries (WHO 2016).
Unicef reported in 2016 that 300 million children live in
areas with extremely toxic levels of air pollution and an
estimate of 2 billion children live in areas where pollution
levels exceed the minimum air quality standards set by the
WHO.
Vaisala’s new venture into supplementary air quality
monitoring networks will help authorities pinpoint and
manage the problem areas especially in cities. With
accurate and real-time air quality information becoming
available, decision-makers as well as citizens, can
adjust their activities according to the current air
quality situation in their part of the city.
How We Create Value
forSociety& Environment
We bring value to societies through accurate and reliable environmental measurements, decision support for national and local authorities, businesses, and the renewable energy sector.
Value created: Better Informed Societies
36 HOW VAisAlA CReATes VAlUe

Vaisala is the only company producing dropsondes, an essential hurricane observation equipment.
Capacity building projects involve building weather observation infrastructure for entire countries.
7 million premature deaths annually are linked to poor air quality. (WHO, 2016)
92% of the world population is living in areas where air quality guidelines are not met. (WHO, 2014)
+20M hours of wind measurement data collected worldwide with the Triton Wind Profiler.
Indicators:
37HOW VAisAlA CReATes VAlUe
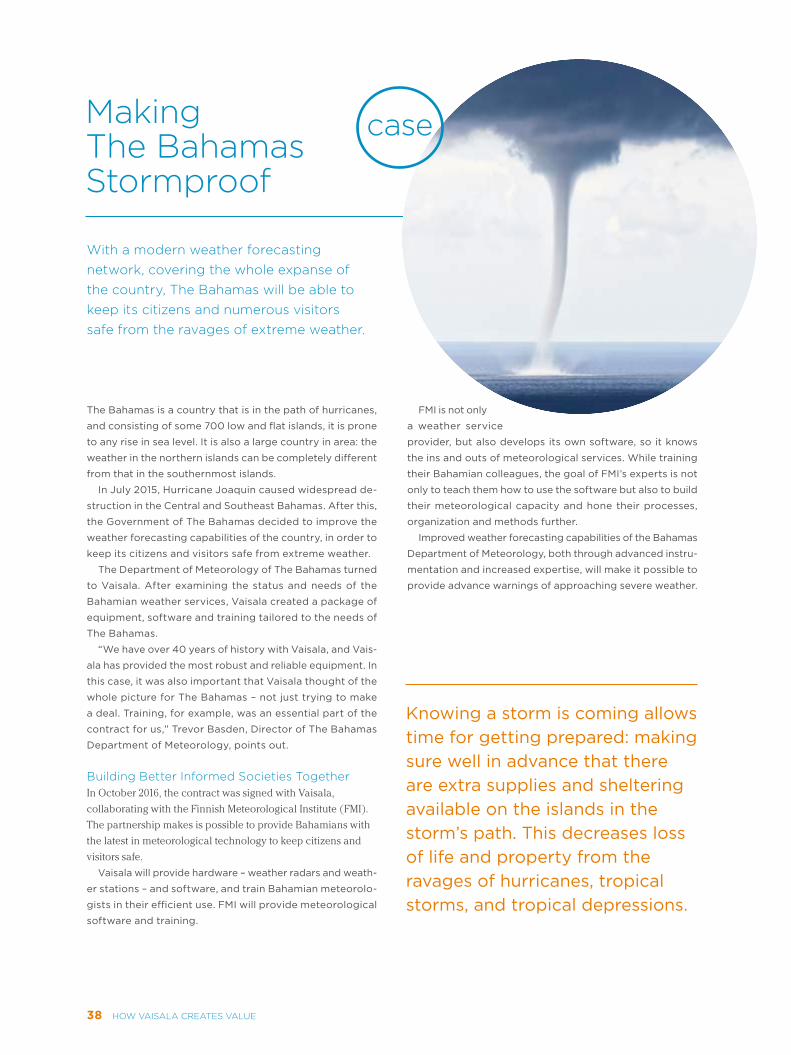
The Bahamas is a country that is in the path of hurricanes,
and consisting of some 700 low and flat islands, it is prone
to any rise in sea level. It is also a large country in area: the
weather in the northern islands can be completely different
from that in the southernmost islands.
In July 2015, Hurricane Joaquin caused widespread de-
struction in the Central and Southeast Bahamas. After this,
the Government of The Bahamas decided to improve the
weather forecasting capabilities of the country, in order to
keep its citizens and visitors safe from extreme weather.
The Department of Meteorology of The Bahamas turned
to Vaisala. After examining the status and needs of the
Bahamian weather services, Vaisala created a package of
equipment, software and training tailored to the needs of
The Bahamas.
“We have over 40 years of history with Vaisala, and Vais-
ala has provided the most robust and reliable equipment. In
this case, it was also important that Vaisala thought of the
whole picture for The Bahamas – not just trying to make
a deal. Training, for example, was an essential part of the
contract for us,” Trevor Basden, Director of The Bahamas
Department of Meteorology, points out.
Building Better informed societies TogetherIn October 2016, the contract was signed with Vaisala,
collaborating with the Finnish Meteorological Institute (FMI).
The partnership makes is possible to provide Bahamians with
the latest in meteorological technology to keep citizens and
visitors safe.
Vaisala will provide hardware – weather radars and weath-
er stations – and software, and train Bahamian meteorolo-
gists in their efficient use. FMI will provide meteorological
software and training.
FMI is not only
a weather service
provider, but also develops its own software, so it knows
the ins and outs of meteorological services. While training
their Bahamian colleagues, the goal of FMI’s experts is not
only to teach them how to use the software but also to build
their meteorological capacity and hone their processes,
organization and methods further.
Improved weather forecasting capabilities of the Bahamas
Department of Meteorology, both through advanced instru-
mentation and increased expertise, will make it possible to
provide advance warnings of approaching severe weather.
Making The Bahamas stormproof
With a modern weather forecasting network, covering the whole expanse of the country, The Bahamas will be able to keep its citizens and numerous visitors safe from the ravages of extreme weather.
Knowing a storm is coming allows time for getting prepared: making sure well in advance that there are extra supplies and sheltering available on the islands in the storm’s path. This decreases loss of life and property from the ravages of hurricanes, tropical storms, and tropical depressions.
38 HOW VAisAlA CReATes VAlUe

Value created: Safety
Vaisala’s technologies help our customers maintain safe operating environments in many parts of the society.
It takes ten times more road salt to treat a road after freezing has set in than pre-treating the surface before it happens. Vaisala’s RoadDSS solution alerts road operators when to apply chemicals on
their road network for maximum effect.
Every single flight around the world will at some point use weather observations produced by Vaisala equipment and/or forecasts driven by Vaisala sensor observations
Vaisala has installed over
2,000 complete airport weather systems in over
100 countries around the world
According to National Highway Traffic Safety Administration, on average 1,511,000 vehicle crashes — 24% of all vehicle crashes in the U.S. are weather-related each year, and 7,130 people are killed and over 629,000 injured in these crashes each year.
Indicators:
Weather affects all transportation sectors, whether shipping
goods or transporting people. The aviation industry is
dependent on accurate weather information to minimize
delays and ensure safe operations. Road authorities can
mitigate accidents through roadside weather warnings
and plan winter operations more efficiently with advance
information about prevailing weather conditions. Railway
operators, especially those of high-speed trains, benefit from
wind warnings, so trains can slow down when wind conditions
become dangerous. The maritime sector is depending on
weather forecasts for safe transportation of people and goods,
and harbor operations. Even missions to space need safe
weather conditions during launches.
Using road weather information in winter maintenance
operations, is an example where an ivestment’s benefit to cost
ratio is generally high, reaching up to 10:1. Vaisala’s customers
have reported that by applying our maintenance decision
support systems in road winter maintenance, they have been
able to reduce their de-icing costs by up to 40%, resulting in
associated reductions in traffic accidents of as much as 50%.
39HOW VAisAlA CReATes VAlUe

Weather is the biggest cause for delayed flights; e.g. in
the USA it accounts for 70% of all delays, according to the
Federal Aviation Administration (FAA). It may be surprising
that thunderstorms in the spring and summer are much more
disruptive than snow and ice in the winter.
In April–September, over 40% of the delays to arrivals are
caused by convective weather, i.e. rain or thunderstorms,
according to the FAA.
Thunderstorms stop all traffic at an airport. In the air,
lightnings can strike planes without problems, but they pose
a danger to ground crews. In 1991–2011, at least 92 injuries
and 1 death were caused by lightning at airports.
As all field operations as well as take-offs and landings
come to a halt, flights are inevitably delayed, or even divert-
ed. And this has a domino effect – delays in one place, even
short ones, are felt throughout the aviation system.
Forecasts Help get ReadySince lightning and thunderstorms will always be with us,
airports and airlines have to do their best to manage oper-
ations in all weathers.
Winter storms develop and move slowly and are thus
easier to forecast, giving airports and airlines more time to
plan for them. Summer and spring thunderstorms can form
quickly and affect large areas. They can be predicted, but
their coverage and exact location cannot.
Many airports have their own meteorologists to monitor
weather and provide local forecasts, but they also partner
with private companies like Vaisala, to measure airfield
conditions and track thunderstorms and lightning.
Vaisala is a leading authority on the monitoring and detec-
tion of lightning with its Global Lightning Dataset GLD360.
Vaisala invests heavily in lightning science research to
improve the system’s accuracy, as this translates directly into
savings. Flight delays can cost as much as USD 35,000 per
minute. For operators, accuracy equals reliability, eliminating
any false alarms and unnecessary standstills. For travelers,
accuracy means first and foremost safety.
www.faa.gov/nextgen/programs/weather/faq/#faq3c
Thunderstorms Cause More Air Travel Delays than Winter Weather
Accurate thunderstorm detection helps keeping ground crews and passengers safe.
40 HOW VAisAlA CReATes VAlUe

Investments in new renewable energy capacity depend on
reliable information on a potential site’s future power output.
Vaisala’ clients use the forecasts we generate for wind or solar
power plant sites to secure financing.
Vaisala as a company has a positive economic impact on
local communities through employment and taxes, both
directly and through its supply chain. Responsible business
practices and use of local suppliers create indirect benefits to
local communities.
Even without specific factoring in of natural disasters, United
States economic activity varies by up to plus or minus 1.7% due
to weather variability, resulting in impacts as large as USD 485
billion of the 2008 GDP of USD 14.4 trillion (Lazo, American
Meteorological Society, 2011). Furthermore, “in 2011, about
206 million people were victims of natural disasters with an
economic cost of USD 366 billion worldwide with the largest
part of this due to disasters of meteorological and hydrological
origin (WMO Report 1153, 2015).”
A nationwide survey by the National Weather Service (NWS)
indicates that 96% of the U.S. public obtains, either actively or
passively, 301 billion weather forecasts each year. Based on an
average annual household value of USD 286 placed on weather
information, the American public collectively receives USD
31.5 billion in benefits from forecasts each year. These benefits
far exceed the USD 5.1 billion spent annually by both private
and public weather bureaus on generating forecasts (Weather
Ready Nation – NWS, 2011).
Value created: Economic ValueVaisala’s solutions help societies become more prepared and resilient against the negative effects of weather and the climate, and at the same time take advantage of favorable weather conditions.
Upgrading meteorological and hydrological information and early warning capacity in all developing countries to developed country standards would save an average of
20,000 lives per year and
USD 300–2,000 million of avoided asset losses, according to a 2012 report by the World Bank.
economic value of GBD 29.5 billion to the UK over the next ten years with a benefit to cost ratio of 14:1.(London Economics, 2015)
Economic assessments set benefit to cost ratio for improved hydrometeorological capabilities from
4:1 to 36:1 for every invested dollar.
1,800+ wind and solar energy project assessments to date.
Vaisala has helped secure project financing for 30 GW of wind capacity and 42 GW of solar capacity globally.
Indicators:
The UK Met Officewill deliver a net
41HOW VAisAlA CReATes VAlUe
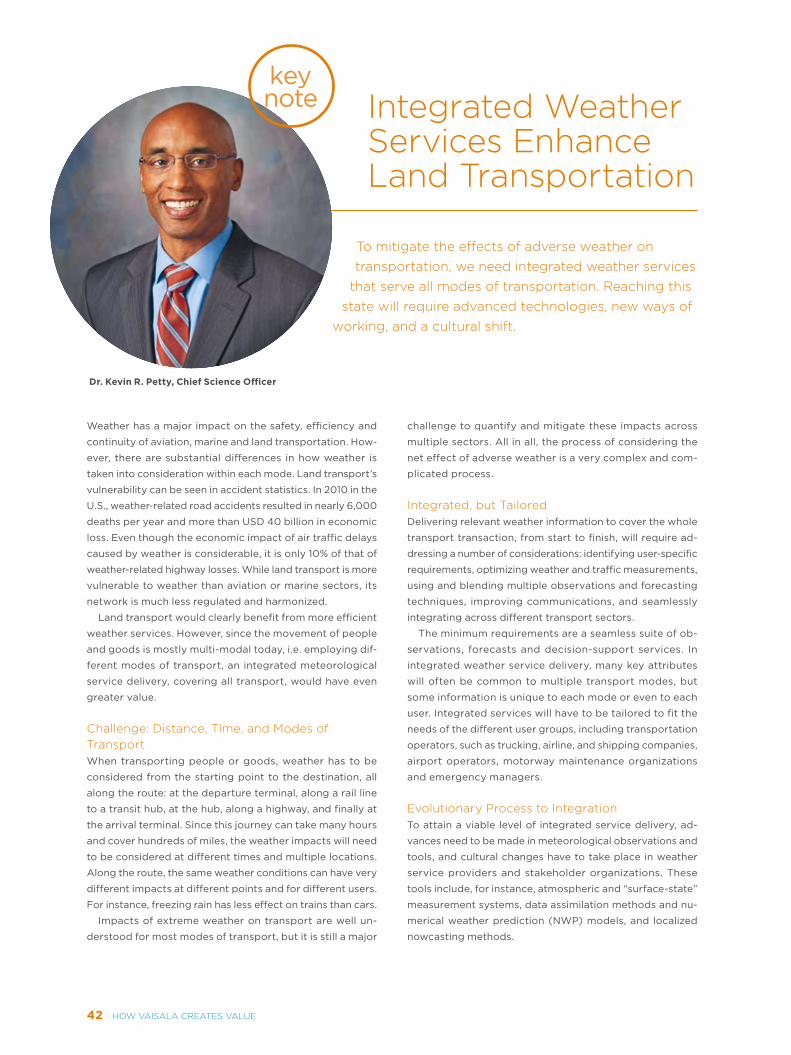
Weather has a major impact on the safety, efficiency and
continuity of aviation, marine and land transportation. How-
ever, there are substantial differences in how weather is
taken into consideration within each mode. Land transport’s
vulnerability can be seen in accident statistics. In 2010 in the
U.S., weather-related road accidents resulted in nearly 6,000
deaths per year and more than USD 40 billion in economic
loss. Even though the economic impact of air traffic delays
caused by weather is considerable, it is only 10% of that of
weather-related highway losses. While land transport is more
vulnerable to weather than aviation or marine sectors, its
network is much less regulated and harmonized.
Land transport would clearly benefit from more efficient
weather services. However, since the movement of people
and goods is mostly multi-modal today, i.e. employing dif-
ferent modes of transport, an integrated meteorological
service delivery, covering all transport, would have even
greater value.
Challenge: Distance, Time, and Modes of TransportWhen transporting people or goods, weather has to be
considered from the starting point to the destination, all
along the route: at the departure terminal, along a rail line
to a transit hub, at the hub, along a highway, and finally at
the arrival terminal. Since this journey can take many hours
and cover hundreds of miles, the weather impacts will need
to be considered at different times and multiple locations.
Along the route, the same weather conditions can have very
different impacts at different points and for different users.
For instance, freezing rain has less effect on trains than cars.
Impacts of extreme weather on transport are well un-
derstood for most modes of transport, but it is still a major
challenge to quantify and mitigate these impacts across
multiple sectors. All in all, the process of considering the
net effect of adverse weather is a very complex and com-
plicated process.
integrated, but TailoredDelivering relevant weather information to cover the whole
transport transaction, from start to finish, will require ad-
dressing a number of considerations: identifying user-specific
requirements, optimizing weather and traffic measurements,
using and blending multiple observations and forecasting
techniques, improving communications, and seamlessly
integrating across different transport sectors.
The minimum requirements are a seamless suite of ob-
servations, forecasts and decision-support services. In
integrated weather service delivery, many key attributes
will often be common to multiple transport modes, but
some information is unique to each mode or even to each
user. Integrated services will have to be tailored to fit the
needs of the different user groups, including transportation
operators, such as trucking, airline, and shipping companies,
airport operators, motorway maintenance organizations
and emergency managers.
evolutionary Process to integrationTo attain a viable level of integrated service delivery, ad-
vances need to be made in meteorological observations and
tools, and cultural changes have to take place in weather
service providers and stakeholder organizations. These
tools include, for instance, atmospheric and “surface-state”
measurement systems, data assimilation methods and nu-
merical weather prediction (NWP) models, and localized
nowcasting methods.
integrated Weather services enhance land Transportation
To mitigate the effects of adverse weather on transportation, we need integrated weather services
that serve all modes of transportation. Reaching this state will require advanced technologies, new ways of
working, and a cultural shift.
keynote
Dr. Kevin R. Petty, Chief Science Officer
42 HOW VAisAlA CReATes VAlUe
An evolutionary process would probably be best, begin-
ning by ensuring there is common situational awareness
across the transport sectors during high-impact weather
events. This should be followed by addressing the weath-
er-related challenges that arise at and between the intercon-
nections among transport modes and among stakeholders.
This will be the most important challenge in the process.
In this, the first step could be to use a relatively mature
and well-focused user group. This would facilitate the crea-
tion of a strategy for developing, testing and documenting
best practices, which could be extended to other end user
groups. This user group could be selected, for example,
from among global logistics service providers, emergency
management responders or multimodal hub operators – all
groups already experienced with the impacts of weather.
keeping up with TechnologyIntegrated meteorological services will also have to keep
abreast of changes in technology, culture and climate. Rap-
idly developing technologies in the transport system are
opening new possibilities for weather services. For exam-
ple, vehicle-to-vehicle (V2V) and vehicle-to-infrastructure
(V2I) capabilities, to be introduced over the next decade,
will enable using the vehicles as weather sensing platforms.
The real-time mobile observations can enhance weather
analysis and forecasting. Autonomous vehicles and automa-
tion in the form of e.g. vehicle platooning are also moving
forward. The sensing technologies – radar, radio, and laser
based detection methods to name a few – used in this
transformation are sensitive to environmental conditions.
This is why understanding and addressing the impacts of
extreme weather on these technologies is crucial to ensure
the safety of the traveling public.
The ultimate goal is service delivery that meets the needs
of the transport operators and users, ensuring the safe,
effective and efficient operation of the transport network,
whether it is global, national, regional or local.
This is based on an article first published in the WMO
Bulletin Vol 65 (2)–2016. The piece was authored by a WMO
Expert Task Team, including Vaisala’s Kevin R. Petty, Paul Bridge, Walter F. Dabberdt, and WMO Secretariat.
Original article: https://public.wmo.int/en/resources/
bulletin/integrating-meteorological-service-delivery-
land-transportation
43HOW VAisAlA CReATes VAlUe
2016Performance

Personnel 46
Occupational Health and Safety 49
Supply Chain Management 51
Environmental Sustainability 53
Community Outreach 58
Financial Performance 59
Risk Management 64
Responsible Business Conduct 66
Reporting Principles 68
UN Global Compact 69
GRI Content Index 70
Independent Assurance Report 74
Sustainability Contacts 75
Contents
Performance
Recruitment and TurnoverAt the end of 2016, our personnel had decreased by 19
employees compared to the situation the previous year. The
total number of employees at the end of the year was 1,569
(1,588). The average number of personnel employed in Vaisala
during 2016 was 1,590 (1,611). The average age of personnel
was 43 years. During 2016, 108 permanent employees were
recruited and 160 left the company. Employees in research and
development amounted to 19% of personnel and employees in
manufacturing amounted to 14%.
Major Changes during the Reporting PeriodThe decision to reshape Transportation business unit within
Weather Business Area led to simplified organizational
structure and profitability improvement. In total, these changes
led to a reduction of 64 employees of which 11 employees were
offered a new job in Vaisala. Most of the employees under
the scope of the business transfer in the United States were
employed by the acquiring company. In Weather Business
Area, business development capability was strengthened by
building a business development team and launching new
agile business concept creation practices.
Collective Agreements and Trade UnionsVaisala recognizes the Federation of Finnish Technology
Industries as its trade union. Vaisala’s employees in Finland
are covered by three collective agreements: the collective
agreement for employees in technology industries, the
collective agreement for salaried employees in technology
industries, and the collective agreement for senior salaried
employees in technology industries.
Salaries and wages paid by the company are based on local
collective and individual agreements, individual performance
and the demand level of each job. The base salaries are
supplemented by performance-based bonus systems, which
cover all Vaisala personnel.
Minimum notice periods are based on labor legislation in
each country we operate. For Finland this means a minimum
notice period from two weeks to six months depending on the
length of employment.
Diversity, Equality and InclusivenessWe demonstrate equal employment opportunity in all
recruitment, hiring, and working practices such as training
and development. In North America, Vaisala Inc. is an
Equal Opportunity Employer (EOE). Qualified applicants
are considered for employment without regard to age, race,
color, religion, gender, marital status, national origin, sexual
orientation, disability, or veteran status. If an applicant needs
assistance or an accommodation during the application
process because of a disability, the company is pleased to
provide it. No applicant will be penalized as a result of such a
request.
According to the Finnish Non-Discrimination Act, section 4,
an employer must create a plan to advance equality. The goal
is that people at Vaisala work within a safe, caring, communal
and accessible operating culture.
The equality plan is a plan on how Vaisala, as an employer,
in the course of their operations, shall promote equality
and prevent and address discrimination. The goal of our
equality plan is that Vaisala’s personnel, jobseekers and
the subcontractors operating within Vaisala’s guidance and
offices, as well as leased personnel, will work and be treated
equally, independently of their attributes.
Equality and fairness are also important elements of
Vaisala’s compensation policy. We do not distinguish between
gender or other non-professional attributes in employee
compensation or benefits plans.
Personnel
46 PeRFORMANCe

Employees by employment contract type and gender Permanent Temporary
1,512 57
Male Female Male Female
Full time 1,008 421 34 23
Part time 48 35
Total 1,090 479
Self-employed workers do not make up a significant part of the workforce
Personnel 2012 2013 2014 2015 2016
Employees at end of period 1,442 1,563 1,613 1,588 1,569
Finland 57.3% 55.7% 56.9% 58.5% 61.9%
Rest of Europe 7.7% 7.0% 7.2% 7.2% 6.9%
Americas 26.3% 29.2% 27.3% 25.7% 22.6%
Asia, Australia and Oceania 8.7% 8.1% 8.6% 8.6% 8.6%
Women 29.5% 30.3% 29.9% 30.0% 30.5%
Men 70.5% 69.7% 70.1% 70.0% 69.5%
Personnel in R&D 19.5% 19.8% 22.3% 21.4% 19.2%
Personnel in manufacturing n/a n/a 10.5% 11.9% 13.9%
Permanent 95.8% 96.6% 96.3% 96.0% 96.4%
Temporary 4.2% 3.4% 3.7% 4.0% 3.6%
Turnover 2016 Permanent Temporary Turnover rate Turnover rate,
permanent employeesRecruitment rate,
permanent employees
Recruitment (+) 108 102
Turnover (-) 160 72 14.7%* 10.6%** 7.1%
* number of employees leaving the company in the reporting period divided by total number of employees at the end of the period
** number of permanent employees leaving the company in the reporting period divided by total number of permanent employees at the end of the period
Turnover 2016, age – 19 20 – 29 30 – 39 40 – 49 50 – 59 60 –
Male 6 42 46 34 27 13
Female 0 27 10 12 10 5
Total 6 69 56 46 37 18
% 2.6% 29.7% 24.1% 19.8% 15.9% 7.8%
Turnover 2016, region Finland Other Europe Americas Asia and Australia Total
Permanent 55 10 83 12 160
Temporary 58 8 6 0 72
Total 113 18 89 12 232
Recruitments 2016, age – 19 20 – 29 30 – 39 40 – 49 50 – 59 60 –
Male 10 72 35 18 11 0
Female 2 36 13 8 5 0
Total 12 108 48 26 16 0
% 5.7% 51.4% 22.9% 12.4% 7.6% 0.0%
47PeRFORMANCe

Number of retired, Group 2014 2015 2016
Permanent 7 18 8
Average age 63.3 64.8 64.0
Staff turnover 2012 – 2016 2012 2013 2014 2015 2016
Employees +/- +234/-151 +230/-176 +257/-176 +204/-246 +210/-232
Turnover 10.5% 11.9% 10.9% 15.5% 14.7%
Turnover, permanent employees 6.2% 6.0% 6.4% 10.4% 10.6%
Development discussions 2012 2013 2014 2015 2016
Rate of personnel that has had a development discussion with their supervisor during the last 12 months (February 2017). Excludes long time absent and recently recruited employees.
92% 95% 98% 98% 93%
Recruitments 2016, region Finland Other Europe Americas Asia and Australia Total
Permanent 63 6 26 13 108
Temporary 86 7 7 2 102
TrainingEUR 1,000 2012 2013 2015 2015 2016
Total employee training cost 1,271 1,318 1,270 1,052 1,148
Average training cost per employee 0.9 0.9 0.8 0.7 0.7
Doctoral degree
2.8%
Comprehensive school 5.1%
College/ vocational school 11.4%
general programs10.4%
Technology 54.7%
University degree62.8%
Commercial, social science 15.4%
Natural sciences
12.3%
High school/ vocational institute 17.8%
Other professional
7.2%
Personnel by Level of Education Personnel by Area of Education
30- 39
20- 29
-19 40- 49
60-50- 59
600
500
400
300
200
100
07
214
406
90
341
511
Personnel by Age Group and Gender
Male Female
1000
800
600
400
200
0
Personnel by Region and Contract
EMEAAMERFinland APAC
Permanent Temporary
971
109
354
135
1000
800
600
400
200
0
Personnel by Region and Gender
EMEAAMERFinland APAC
Male Female
971
109
354
135
* Covers 85% of employees * Covers 85% of employees
48 PeRFORMANCe
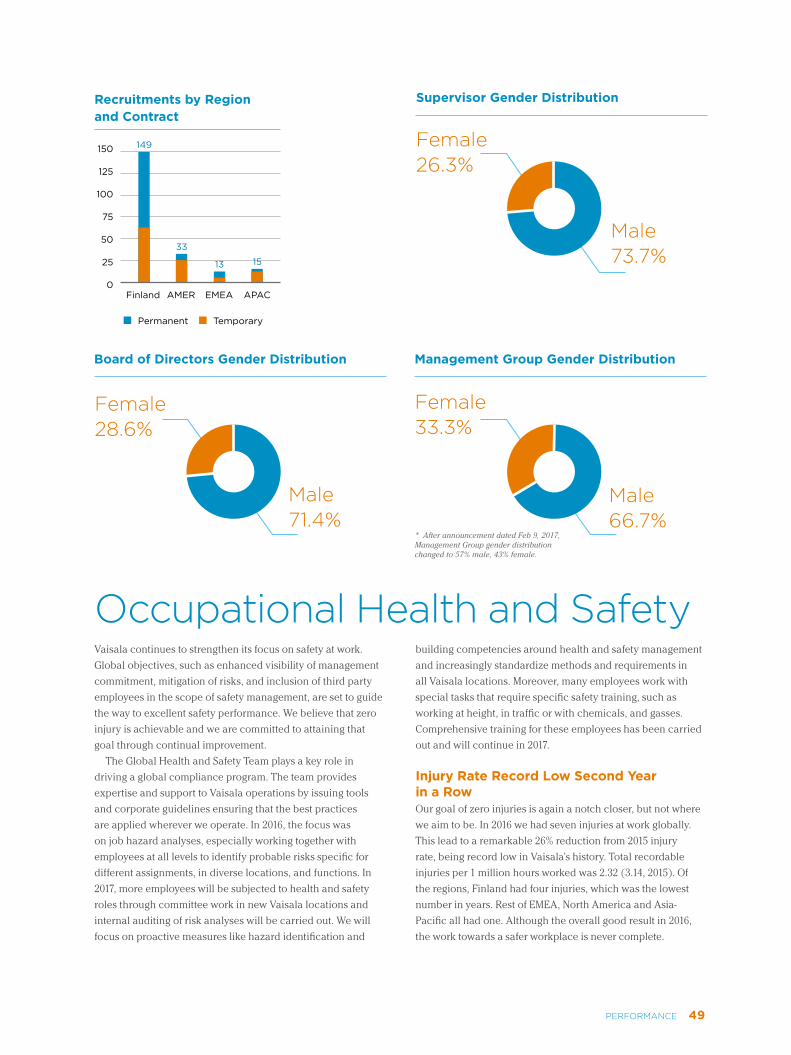
Female 28.6%
Female 33.3%
Male 71.4%
Male 66.7%
Board of Directors Gender Distribution Management Group Gender Distribution
Vaisala continues to strengthen its focus on safety at work.
Global objectives, such as enhanced visibility of management
commitment, mitigation of risks, and inclusion of third party
employees in the scope of safety management, are set to guide
the way to excellent safety performance. We believe that zero
injury is achievable and we are committed to attaining that
goal through continual improvement.
The Global Health and Safety Team plays a key role in
driving a global compliance program. The team provides
expertise and support to Vaisala operations by issuing tools
and corporate guidelines ensuring that the best practices
are applied wherever we operate. In 2016, the focus was
on job hazard analyses, especially working together with
employees at all levels to identify probable risks specific for
different assignments, in diverse locations, and functions. In
2017, more employees will be subjected to health and safety
roles through committee work in new Vaisala locations and
internal auditing of risk analyses will be carried out. We will
focus on proactive measures like hazard identification and
building competencies around health and safety management
and increasingly standardize methods and requirements in
all Vaisala locations. Moreover, many employees work with
special tasks that require specific safety training, such as
working at height, in traffic or with chemicals, and gasses.
Comprehensive training for these employees has been carried
out and will continue in 2017.
Injury Rate Record Low Second Year in a RowOur goal of zero injuries is again a notch closer, but not where
we aim to be. In 2016 we had seven injuries at work globally.
This lead to a remarkable 26% reduction from 2015 injury
rate, being record low in Vaisala’s history. Total recordable
injuries per 1 million hours worked was 2.32 (3.14, 2015). Of
the regions, Finland had four injuries, which was the lowest
number in years. Rest of EMEA, North America and Asia-
Pacific all had one. Although the overall good result in 2016,
the work towards a safer workplace is never complete.
Female 26.3%
Male 73.7%
Supervisor Gender Distribution
150
125
100
75
50
25
0
Recruitments by Region and Contract
EMEAAMERFinland APAC
Permanent Temporary
149
13
33
15
* After announcement dated Feb 9, 2017, Management Group gender distribution changed to 57% male, 43% female.
Occupational Health and safety
49PeRFORMANCe

Last year we experienced a loss of life of one of our
colleagues, taking place during a business trip. The other
five injuries all required absence from work. In many injuries
last year, the root cause was insufficient identification of risk
exposures. Root cause analysis is done after each incident to
prevent the same incident of recurring.
Common Processes and ProceduresAll employees are entitled to remain in good health at work,
and well-being is a theme of great importance at Vaisala. We
want to ensure that the working environment and methods
are safe, regardless of the country of employment or employee
status. This commitment extends to our contractors and
service partners.
We develop common procedures and unified
requirements in cooperation with our employees and ensure
implementation through training and regular audits.
Reporting and InvestigationWe encourage an active approach in reporting. Employees
are directed not only to report incidents and hazards, but
also to suggest safety improvements to the workplace and
working methods. In order to prevent injuries and a recurrence
of incidents, reported non-conformities are investigated and
corrective actions based on root causes are implemented
promptly. As an example of increased awareness and sense
of responsibility, our employees reported more near misses,
hazards and health and safety improvements than ever before.
Reporting frequency of hazards and near misses increased
by 31% compared to previous year. Our target of one reported
near miss or hazard per ten employees, was still not met, as 0.4
reports per ten employees were reported. Nevertheless, these
reports allowed us to interfere early with hazards and risks and
gave us several opportunities to prevent injuries.
To increase the transparency of incident management and
to share lessons learned, we have developed an Environment,
Health & Safety (EHS) reporting system which covers
all Vaisala operations. A globally harmonized reporting
procedure and database allows for improved health and safety
performance follow-up.
Spreading Safety CultureIn Vaisala’s locations in Finland, Canada and Seattle, USA, it
is a statutory requirement for the employer and employees
to meet in health and safety committees. In Finland, our
Health and Safety Committee consists of eight employee
representatives and two management representatives. Their
objective is to improve safety culture throughout the site,
follow-up on incident reporting and implement the global EHS
strategy and action plan. This committee meets a minimum
of four times annually, and in between meetings it organizes
events and information sharing sessions for employees.
The Canadian committee is formed of four members, four
of whom are non-management employee representatives.
The committee meets on a monthly basis to e.g. conduct site
inspections and talk about recent incidents or injuries at the
workplace. Under legislation, committee members are entitled
to eight hours of paid training per year. In our Seattle office the
committee is made up of three non-managerial employees and
three managers who meet on a monthly basis.
Currently the representatives in health and safety committees
make up 1.2% of the total workforce, representing 66% of
personnel. We intend to have at least one non-management
employee representative on each site of more than ten
employees. When this target is achieved, employee
representation in health and safety matters will be doubled,
helping us to raise awareness throughout the organization.
APAC*AMER**Finland EMEA
100
80
60
40
20
0
9
103
12
1
Days of Absence due to Injury
* Employee later perished to their injuries** Injury occurred 2015
Total Recordable Injuries per Region
APACAMERFinland EMEA
5
4
3
2
1
0
4
1 1 1
Male Female
201420132012 2015 2016
5
4
3
2
1
0
Injuries per Million Working Hours (TRI)
3.23
4.354.88
3.14
2.32
50 PeRFORMANCe
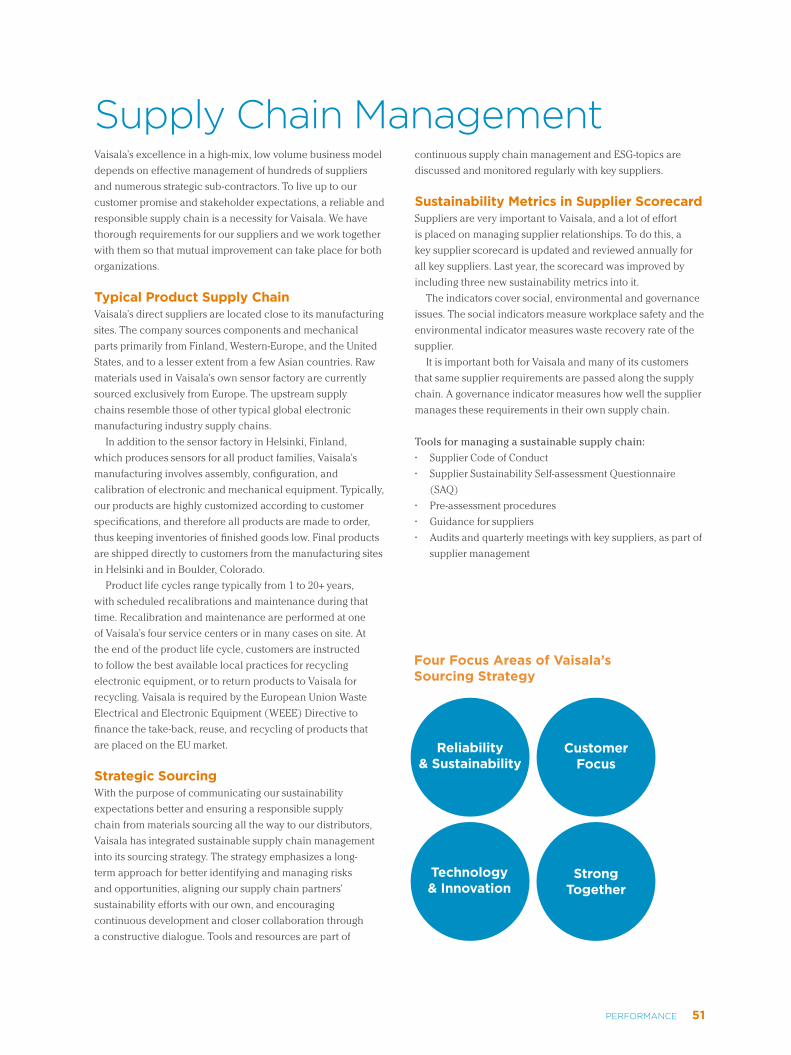
Vaisala’s excellence in a high-mix, low volume business model
depends on effective management of hundreds of suppliers
and numerous strategic sub-contractors. To live up to our
customer promise and stakeholder expectations, a reliable and
responsible supply chain is a necessity for Vaisala. We have
thorough requirements for our suppliers and we work together
with them so that mutual improvement can take place for both
organizations.
Typical Product Supply ChainVaisala’s direct suppliers are located close to its manufacturing
sites. The company sources components and mechanical
parts primarily from Finland, Western-Europe, and the United
States, and to a lesser extent from a few Asian countries. Raw
materials used in Vaisala’s own sensor factory are currently
sourced exclusively from Europe. The upstream supply
chains resemble those of other typical global electronic
manufacturing industry supply chains.
In addition to the sensor factory in Helsinki, Finland,
which produces sensors for all product families, Vaisala’s
manufacturing involves assembly, configuration, and
calibration of electronic and mechanical equipment. Typically,
our products are highly customized according to customer
specifications, and therefore all products are made to order,
thus keeping inventories of finished goods low. Final products
are shipped directly to customers from the manufacturing sites
in Helsinki and in Boulder, Colorado.
Product life cycles range typically from 1 to 20+ years,
with scheduled recalibrations and maintenance during that
time. Recalibration and maintenance are performed at one
of Vaisala’s four service centers or in many cases on site. At
the end of the product life cycle, customers are instructed
to follow the best available local practices for recycling
electronic equipment, or to return products to Vaisala for
recycling. Vaisala is required by the European Union Waste
Electrical and Electronic Equipment (WEEE) Directive to
finance the take-back, reuse, and recycling of products that
are placed on the EU market.
Strategic SourcingWith the purpose of communicating our sustainability
expectations better and ensuring a responsible supply
chain from materials sourcing all the way to our distributors,
Vaisala has integrated sustainable supply chain management
into its sourcing strategy. The strategy emphasizes a long-
term approach for better identifying and managing risks
and opportunities, aligning our supply chain partners’
sustainability efforts with our own, and encouraging
continuous development and closer collaboration through
a constructive dialogue. Tools and resources are part of
continuous supply chain management and ESG-topics are
discussed and monitored regularly with key suppliers.
Sustainability Metrics in Supplier Scorecard Suppliers are very important to Vaisala, and a lot of effort
is placed on managing supplier relationships. To do this, a
key supplier scorecard is updated and reviewed annually for
all key suppliers. Last year, the scorecard was improved by
including three new sustainability metrics into it.
The indicators cover social, environmental and governance
issues. The social indicators measure workplace safety and the
environmental indicator measures waste recovery rate of the
supplier.
It is important both for Vaisala and many of its customers
that same supplier requirements are passed along the supply
chain. A governance indicator measures how well the supplier
manages these requirements in their own supply chain.
Tools for managing a sustainable supply chain:
• Supplier Code of Conduct
• Supplier Sustainability Self-assessment Questionnaire
(SAQ)
• Pre-assessment procedures
• Guidance for suppliers
• Audits and quarterly meetings with key suppliers, as part of
supplier management
supply Chain Management
Four Focus Areas of Vaisala’s Sourcing Strategy
Technology & Innovation
Customer Focus
Reliability & Sustainability
Strong Together
51PeRFORMANCe
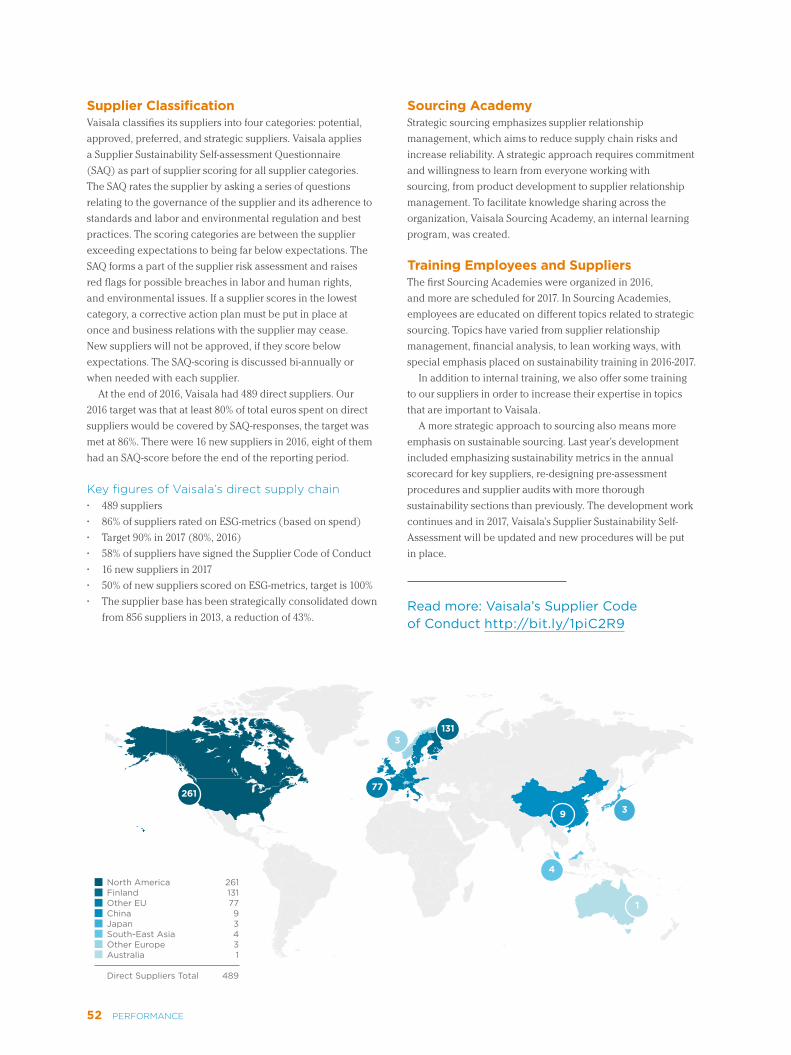
Supplier ClassificationVaisala classifies its suppliers into four categories: potential,
approved, preferred, and strategic suppliers. Vaisala applies
a Supplier Sustainability Self-assessment Questionnaire
(SAQ) as part of supplier scoring for all supplier categories.
The SAQ rates the supplier by asking a series of questions
relating to the governance of the supplier and its adherence to
standards and labor and environmental regulation and best
practices. The scoring categories are between the supplier
exceeding expectations to being far below expectations. The
SAQ forms a part of the supplier risk assessment and raises
red flags for possible breaches in labor and human rights,
and environmental issues. If a supplier scores in the lowest
category, a corrective action plan must be put in place at
once and business relations with the supplier may cease.
New suppliers will not be approved, if they score below
expectations. The SAQ-scoring is discussed bi-annually or
when needed with each supplier.
At the end of 2016, Vaisala had 489 direct suppliers. Our
2016 target was that at least 80% of total euros spent on direct
suppliers would be covered by SAQ-responses, the target was
met at 86%. There were 16 new suppliers in 2016, eight of them
had an SAQ-score before the end of the reporting period.
key figures of Vaisala’s direct supply chain • 489 suppliers
• 86% of suppliers rated on ESG-metrics (based on spend)
• Target 90% in 2017 (80%, 2016)
• 58% of suppliers have signed the Supplier Code of Conduct
• 16 new suppliers in 2017
• 50% of new suppliers scored on ESG-metrics, target is 100%
• The supplier base has been strategically consolidated down
from 856 suppliers in 2013, a reduction of 43%.
Sourcing AcademyStrategic sourcing emphasizes supplier relationship
management, which aims to reduce supply chain risks and
increase reliability. A strategic approach requires commitment
and willingness to learn from everyone working with
sourcing, from product development to supplier relationship
management. To facilitate knowledge sharing across the
organization, Vaisala Sourcing Academy, an internal learning
program, was created.
Training Employees and Suppliers The first Sourcing Academies were organized in 2016,
and more are scheduled for 2017. In Sourcing Academies,
employees are educated on different topics related to strategic
sourcing. Topics have varied from supplier relationship
management, financial analysis, to lean working ways, with
special emphasis placed on sustainability training in 2016-2017.
In addition to internal training, we also offer some training
to our suppliers in order to increase their expertise in topics
that are important to Vaisala.
A more strategic approach to sourcing also means more
emphasis on sustainable sourcing. Last year’s development
included emphasizing sustainability metrics in the annual
scorecard for key suppliers, re-designing pre-assessment
procedures and supplier audits with more thorough
sustainability sections than previously. The development work
continues and in 2017, Vaisala’s Supplier Sustainability Self-
Assessment will be updated and new procedures will be put
in place.
261
131
77
3
9
4
1
3
North AmericaFinlandOther EUChinaJapanSouth-East AsiaOther EuropeAustralia
Direct Suppliers Total
2611317793431
489
Read more: Vaisala’s Supplier Code of Conduct http://bit.ly/1piC2R9
52 PeRFORMANCe
Vaisala wants to be involved in establishing a sound foundation for a better quality of the environment, safety of people and property, and productivity of its customers. Accordingly, the main purpose of many of our products is to contribute to these ends. Our industrial products and solutions provide our customers with means to improve their operational performance, and our weather measurement systems increase safety and predictability in weather critical operations.
Excellence in Environmental Management The Vaisala Environmental Management System (EMS) is
an integral part of our global management system structure.
The EMS has been ISO 14001 certified already since 2004.
The certification covers not only all our manufacturing sites
but many of our offices as well. In fact, as many as 94% of our
employees work in ISO 14001 certified offices. All certified
offices are audited by an independent third party and are a
part of our internal audit program. The EMS helps us identify
the most significant environmental impacts at each of our
sites and set relevant corporate and local environmental
objectives. Currently six offices, housing 86% of our staff, have
made the commitment to take their environmental practices
to the next level. They have formed green teams of voluntary
employees to champion the improvement actions needed to
accomplish this. Although the focus of this internal program
has been on conserving energy and minimizing waste, the
offices have come up with numerous other actions to protect
the environment including nature clean up events, promoting
green commuting and participation in programs to support
wildlife and local natural habitats.
Renewable Energy Gaining GroundWe believe in a future where societies are powered by
renewable sources of energy. In order to minimize our
own impacts on climate, we are committed to using 100%
renewable electricity by 2020. After years of improving the
energy efficiency of our operations, this commitment was the
natural next step for us towards even more environmentally
conscious operations. Although our manufacturing sites both
in Finland and in the United States already produce clean
energy by operating their own solar arrays, we still need to
purchase most of our electricity from local energy companies.
In 2016, 89% of the electricity we consumed originated from
renewable energy sources, mostly wind power. We are also
a member of RE100, a global initiative that encourages the
world’s most influential companies to make a 100% renewable
energy commitment with a clear timeframe for reaching that
goal.
Significant Reduction in EmissionsManaging our own operations and activities in an
environmentally sustainable manner is the cornerstone of
our commitment to the protection of the environment. Over
the past years, we have implemented a series of measures
improving the energy efficiency of our factories and offices
ranging from LED lighting installations to more efficient HVAC
equipment. These measures have helped us improve our
energy efficiency by 1,800 MWh (6,480 GJ) and reduced our
energy related CO2-e emissions by 2,375 metric tons. Actions
towards the 100% renewable electricity goal have already
reduced our electricity consumption related Scope 2 emissions
by more than 80% or 5,279 metric tons of CO2-e compared to
the 2014 baseline.
Responsible Waste and Water Management In 2016, we were able to maintain our waste recovery rate at
a solid 98% in our manufacturing sites. This means that only
2% of the total waste ended up in landfills and the rest was
recovered as material or energy. In our main manufacturing
site in Finland, for example, the waste is sorted into 14 different
subcategories in order to ensure the best possibilities for
further treatment. The total amount of waste increased from
the previous year’s 329 tons to 359 tons mostly due to major
layout changes in our manufacturing and warehouse areas.
Our manufacturing processes are not water intensive as
such, but especially our sensor manufacturing process does
require significant amounts of water. We have a state-of-
the-art water cleaning facility on site that purifies municipal
water to be used in our in-house cleanroom. The water is also
treated before draining and closed loop processes are used
whenever possible. Water consumption in 2016 remained on the
previous year’s level despite of the increased headcount in our
manufacturing sites.
Continuously Improved LogisticsWe are continuously working with our logistic partners in
order to minimize the environmental impact of transporting
components and raw materials from suppliers to us and
delivering products to our customers. These improvement
actions include more efficient consolidation of shipments,
optimization of packaging and increased use of electronic
export documentation instead of paper.
environmental sustainability
53PeRFORMANCe
Scope of Environmental ReportingVaisala’s carbon footprint comprises various components
from the corporate value chain. The carbon footprint is
divided into three scopes according to The Greenhouse Gas
Protocol Account and Reporting Standard. Data collection and
reporting scope for the carbon footprint is more extensive than
for group Environmental Key Performance Indicators (EKPIs).
Data is collected from offices with more than 15 employees.
In 2016, Paris and Melbourne offices were dropped from the
reporting scope after their headcount had decreased below 15
employees. Scope 1 includes field service and other vehicles
owned by Vaisala. Scope 2 includes purchased electricity and
heat. Scope 3 consists of business flights, rental cars, inbound
and outbound logistics, energy consumption of installed base
of weather radars, employee commuting, and waste treatment
(from Finland only which accounts for 85% of group total
waste). Business travel includes flights, as well as travel by rail
and rental cars. This data comes from our global travel agency
and covers over 90% of business flights in terms of costs.
Our EKPIs include energy consumption, water consumption
and waste generation. The scope of our externally reported
EKPIs include the manufacturing sites in Helsinki, Finland
and Boulder, CO, U.S. The manufacturing sites are estimated
to account for 83% of total energy consumption, 89% of total
water consumption and 91% of total waste of all Vaisala offices
globally. Intensity indicators are calculated by comparing the
previously mentioned key performance indicators to company
revenue and/or headcount of the two manufacturing sites.
We frequently evaluate the comprehensiveness of the scope
of reporting EKPIs and are ready to extend the scope if seen
necessary. As the two manufacturing sites clearly account for
most of our environmental impacts regarding EKPIs, reporting
is also conducted on this basis. The rest of our sites have small
individual impacts on the overall environmental performance.
Methodologies and AssumptionsEnergy, water and waste data are collected from various
sources. If on-site monitoring is not available, service
providers’ invoices are used. Electricity and heating invoices
are used for the reference documents for energy consumption.
Solar energy generation as well as water consumption are
measured with on-site meters. Waste data is obtained from
bills and waste operator customer portals when available.
All energy efficiency improvement actions have been
calculated individually using the best available information
from for instance equipment manufacturers and applying
the financial control method outlined in “The GHG Protocol:
A Corporate Accounting and Reporting Standard”.
Emission FactorsGreenhouse gas emissions are calculated by using the best
available conversion factors. These factors come from various
reliable sources including DEFRA emission factor database
and GHG Protocol calculation tools. Some emission factors
are from more specific sources such as logistics partners and
local energy utility companies, and emission factors of our
fleet from vehicle manufacturers. Emission factors are updated
regularly. We report our energy footprint mainly according to
market-based emission factors. Sites using 100% renewable
energy sources use 0,0 g CO2-e/kWh market-based emission
factors.
The carbon footprint includes all greenhouse gases
converted into CO2 using Global Warming Potential GWP-
100. As our GHG accounting has improved and expanded,
we have calculated the carbon footprint retroactively in
order to maintain comparability over the reporting periods.
Comparability from year to year is, however, still imperfect.
Reduced Carbon Emissions by
-81%from 2014 baseline (Scope 2)
Water Efficiency has Improved
+67%in last 10 years
Renewable Electricity
89.2%
Waste Recovery Rate, Manufacturing sites
98%
Employees Working in ISO 14001 Certified Locations
94%
Employees Working at Green Office Locations
86%
54 PeRFORMANCe
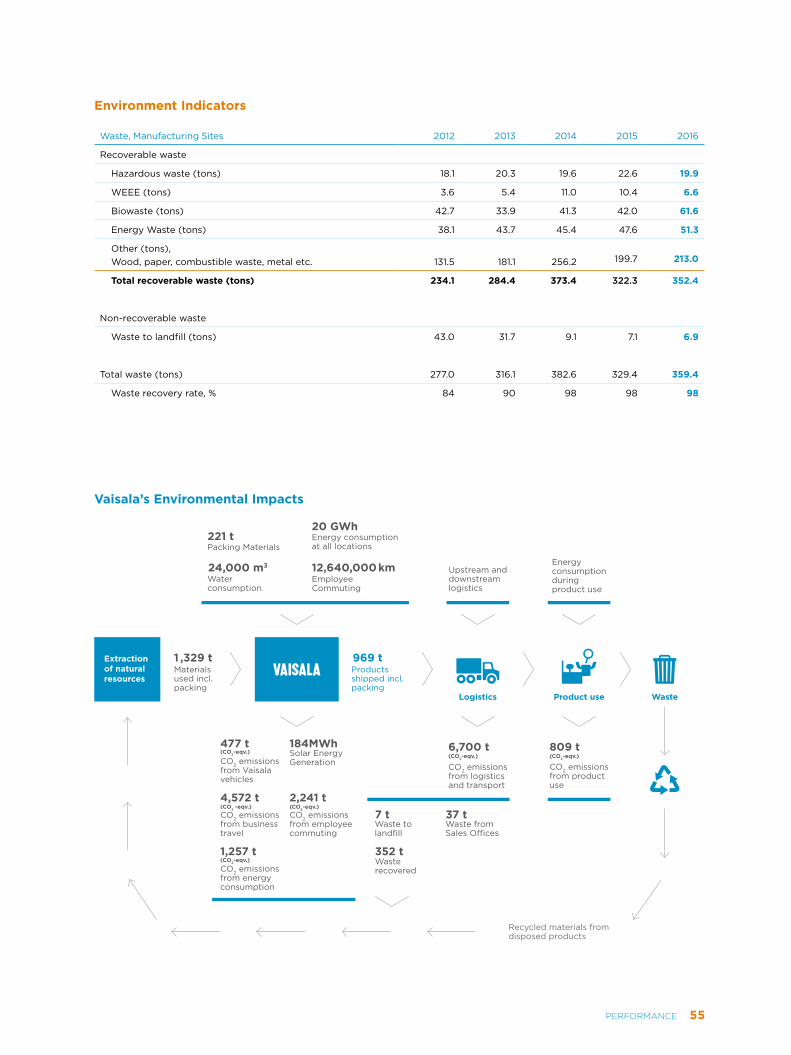
Waste, Manufacturing Sites 2012 2013 2014 2015 2016
Recoverable waste
Hazardous waste (tons) 18.1 20.3 19.6 22.6 19.9
WEEE (tons) 3.6 5.4 11.0 10.4 6.6
Biowaste (tons) 42.7 33.9 41.3 42.0 61.6
Energy Waste (tons) 38.1 43.7 45.4 47.6 51.3
Other (tons),Wood, paper, combustible waste, metal etc.
131.5
181.1
256.2
199.7
213.0
Total recoverable waste (tons) 234.1 284.4 373.4 322.3 352.4
Non-recoverable waste
Waste to landfill (tons) 43.0 31.7 9.1 7.1 6.9
Total waste (tons) 277.0 316.1 382.6 329.4 359.4
Waste recovery rate, % 84 90 98 98 98
Environment Indicators
Vaisala’s Environmental Impacts
Packing Materials
EmployeeCommuting
Water consumption
Energy consumptionat all locations
Product useLogistics
Upstream anddownstreamlogistics
Energyconsumptionduringproduct use
Waste
Extraction of natural resources
24,000 m3
20 GWh
12,640,000km
CO2 emissionsfrom logisticsand transport
6,700 t(CO2-eqv.)
CO2 emissionsfrom product use
809 t(CO2-eqv.)
CO2 emissionsfrom Vaisalavehicles
(CO2-eqv.)477 t
Solar EnergyGeneration
184MWh
CO2 emissionsfrom business travel
(CO2 -eqv.)4,572 t
(CO2-eqv.)CO2 emissionsfrom employeecommuting
2,241 t
CO2 emissionsfrom energyconsumption
(CO2-eqv.)1,257 t
221 t
Materials used incl. packing
1 ,329 tProducts shipped incl. packing
969 t
352 tWasterecovered
Waste tolandfill
7 tWaste from Sales O�ces
37 t
Recycled materials fromdisposed products
55PeRFORMANCe

201420132012 2015 2016
20
15
10
5
0
Energy, Manufacturing Sites
16.4 16.6 16.6 16.517.4
Water, Manufacturing Sites
2014 2015 2016
1.3
1.0 1.1
201420132012 2015 2016
25
20
15
10
5
0
22.1 23.2 23.321.5 21.4
1,000 m3
201420132012 2015 2016
400
300
200
100
0
Waste, Manufacturing Sites
277.0316.1
382.6
329.4359.4
Tons
2009 20142008 201320072006 20122010 20152011 2016
250
200
150
100
50
0
Water Consumption per Sales (m3/M€)
200.9
111.2
160.8
84.7102.0
75.5102.2
77.8
112.7
67.4 67.1
m3/MeUR
20092008 201320072006 20122010 2011
2.01.81.61.41.21.00.80.60.40.20.0
Waste Generation per Sales (Tons/M€)
1.41.6
1.3 1.3
0.9
1.8
1.21.2
Tons/M€
2009 20142008 201320072006 20122010 20152011 2016
80
70
60
50
40
30
20
10
0
Energy Consumption per Sales (MWh/M€)
70.162.6
69.2
60.865.6
55.9
70.7
55.5
68.8
51.9 54.4
MWh/MeURgWh
56 PeRFORMANCe
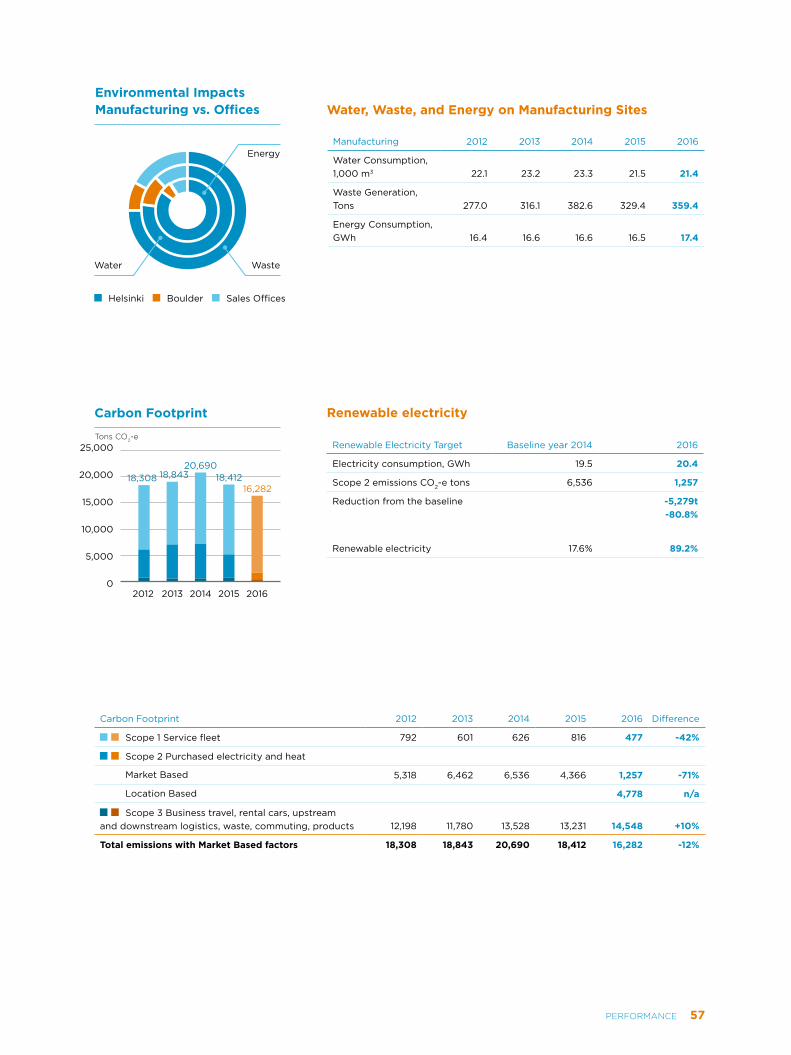
Renewable Electricity Target Baseline year 2014 2016
Electricity consumption, GWh 19.5 20.4
Scope 2 emissions CO2-e tons 6,536 1,257
Reduction from the baseline -5,279t -80.8%
Renewable electricity 17.6% 89.2%
Renewable electricity
201420132012 2015 2016
25,000
20,000
15,000
10,000
5,000
0
Carbon Footprint
18,308 18,84320,690
18,41216,282
Tons CO2e
Carbon Footprint 2012 2013 2014 2015 2016 Difference
Scope 1 Service fleet 792 601 626 816 477 -42%
Scope 2 Purchased electricity and heat
Market Based 5,318 6,462 6,536 4,366 1,257 -71%
Location Based 4,778 n/a
Scope 3 Business travel, rental cars, upstream and downstream logistics, waste, commuting, products
12,198
11,780
13,528
13,231
14,548
+10%
Total emissions with Market Based factors 18,308 18,843 20,690 18,412 16,282 -12%
Manufacturing 2012 2013 2014 2015 2016
Water Consumption, 1,000 m3
22.1
23.2
23.3
21.5
21.4
Waste Generation, Tons
277.0
316.1
382.6
329.4
359.4
Energy Consumption, GWh
16.4
16.6
16.6
16.5
17.4
Water, Waste, and Energy on Manufacturing Sites
Helsinki Boulder Sales Offices
Environmental Impacts Manufacturing vs. Offices
Water
Energy
Waste
57PeRFORMANCe

Community OutreachVaisala believes in a world where environmental observations
improve daily life. As the global leader in environmental
measurement and an active member of society, we
acknowledge that the company has a responsibility to support
its stakeholders in society and the research community.
Vaisala may provide charitable donations of products,
funding, or services to non-profit organizations through
its Community Outreach Program. The Program’s overall
objective is to support organizations and projects that advance
environmental awareness and science education. All our
outreach activities should be in line with Vaisala’s values
and resonate well with environmental issues such as climate,
weather, environmental measurement, and environmental
sciences.
In 2016, donations were EUR 672,000 globally. Our objective
is to focus our donations and continuously correlate them with
the community outreach policy. Vaisala does not donate funds
to political parties, causes, or campaigns.
Focus AreasWithin science education, we focus on students and
their teachers, in contexts that promote natural sciences,
innovation, and environmental awareness. We also support
universities, scientists and researchers who help increase
the understanding of environmental observations and their
implications. Scholarships paid in the form of salary are
outside the scope of this program.
The second focus area is non-profit organizations
working for environmental disaster prevention and
recovery, particularly in connection with the prevention
of environmental hazards. Also, impartial and neutral
humanitarian organizations that provide protection and
assistance to people affected by disasters are in the scope of
this program.
Current SponsorshipsFollowing the guidelines set by Vaisala’s Community Outreach
Program, we sponsor a variety of different causes.
Professor Vilho Väisälä AwardVaisala funds the biennial Professor Vilho Väisälä Award. The
award was established in 1985 to encourage and stimulate
interest in research in the field of environmental measurement
instruments and methods of observation. It is administrated
by the World Meteorological Organization, which selects the
winners on a biennial basis. The award consists of a medal,
diploma and a cash prize of USD 10,000.
In 2004, the WMO Executive Council decided to establish
a second Professor Vilho Väisälä Award. The main focus of
this award is meteorological instrument work in developing
countries and countries with economies in transition. At
the same time, the WMO Executive Council adopted new
guidelines for granting the Professor Vilho Väisälä Awards.
Both awards are granted biannually in connection with the
WMO TECO/METEOREX conference and carry a cash prize of
USD 10,000. More information about the awards: www.wmo.int
The 2016 Award Winners:25th Award for An Outstanding Research Paper on
Instruments and Methods of Observation:
R.J. Dirksen, M. Sommer, F.J. Immler, D.F. Hurst, R. Kivi and
H. Vomel
Reference quality upper-air measurements: GRUAN data
processing for the Vaisala RS92 radiosonde, Atmospheric
Measurement Techniques, 7, pp 4463-4490, 2014.
5th Award for Development and Implementation of
Instruments and Methods of Observation in Developing
Countries:
Ms Amudha Bakthavathsalu and Dr Rabia Merrouchi
Survey on alternatives for dangerous and obsolete instruments:
evaluation of the questionnaire and recommendations for
alternatives, WMO, IOM Report No. 117, 2014.
Millennium Technology PrizeVaisala’s success is based on a constant stream of world-class
innovations. It is only natural that we are a proud supporter of
the Finnish tribute for better life, The Millennium Technology
Prize. The biennial prize is awarded to groundbreaking
technological innovations that enhance the quality of people’s
lives in a sustainable manner.
http://taf.fi/en/millennium-technology-prize/
New Children’s HospitalVaisala is an honorary in-kind donator for the new children’s
hospital being built in Helsinki, Finland in 2017. Vaisala will
be contributing humidity, temperature, and carbon dioxide
measurement instruments to the hospital. The equipment is
valued at an estimated EUR 225,000 and will be integrated into
the hospital’s building automation solution.
Donations to UniversitiesIn 2016, the Board of Directors decided to donate a total of
EUR 310,000 in support of the following universities: Aalto
University, University of Helsinki, Lappeenranta University of
Technology, University of Oulu, and Tampere University of
Technology. Moreover, a donation of USD 25,000 was made to
Colorado State University, CSU. The weather radar donated in
2015 was delivered to CSU at the end of 2016.
Vilho, Yrjö and Kalle Väisälä FundIn the 1960’s, Professor Vilho Väisälä, the company’s founder,
donated Vaisala shares to the Finnish Academy of Science and
58 PeRFORMANCe
Letters. These shares were used to establish the Vilho, Yrjö
and Kalle Väisälä Fund. The Fund provides grants annually for
research in mathematics, physics, geophysics, meteorology
and astronomy.
In 2016, the Fund granted a total of EUR 1.4 million to
75 researchers. The Fund’s available grants are dependent
on Vaisala’s profits, so the company has an economic
responsibility towards the Fund.
Raising AwarenessVaisala partners with Heureka Science Centre in Finland in
order to increase awareness of atmospheric sciences among
children and adolescents. As an example, Vaisala sponsors the
Science on a Sphere exhibition at Heureka. In 2017, Vaisala is
also sponsoring The Museum of Technology in Helsinki as part
of Finland’s centenary celebrations.
The Vilho, Yrjö and Kalle Väisälä Fund granted donations to
75 researchers in 2016
Financial PerformanceMarket situation in 2016In 2016, market environment for Vaisala was characterized
by differences between geographic areas and customer
groups. Weather observation market conditions weakened in
2016 compared to rather good previous two years. Industrial
measurement market was favorable overall.
In EMEA, weather observation market was weak. In North
America, weather observation market was stable, and Vaisala’s
deliveries increased as a result of good order intake in 2015.
In Latin America, weather observation market was affected
by weak macroeconomic conditions especially in Brazil. In
APAC, weather observation market was stable, and as a result
of a few large projects, Vaisala’s performance improved.
Vaisala’s industrial measurement solution orders received
increased in all regions. This was a result of favorable market
conditions, and Vaisala also grew faster than the addressable
market. The growth was strong especially in APAC and in life
science market.
Market Outlook for 2017Global economy accelerated towards the end of 2016,
and latest forecasts refer to moderate outlook. Increase in
commodity prices, especially in crude oil, is expected to
improve outlook of several emerging economies. Vaisala is
expecting stable market in 2017 both for weather observation
and industrial measurement.
Weather observation market outlook is overall stable.
However, development of Vaisala’s orders and deliveries are
still expected to remain dependent on timing and progress
of individual projects. In EMEA, weather observation market
is expected to improve after weak 2016. In North America,
weather observation market outlook is stable and Vaisala’s
orders are expected to increase from 2016, whereas deliveries
are expected to decrease as a result of fewer large orders
in 2016. In Latin America, stabilizing economic outlook is
expected to support weather observation market conditions. In
APAC, weather observation market customer activity for orders
is expected to improve from 2016, whereas deliveries are
expected to decrease slightly as a result of fewer large weather
infrastructure projects. In China, weather observation market
is expected to remain stable, although market conditions are
currently difficult to project. Market outlook for renewable
energy solutions is overall positive, even though growth of
renewable power capacity has decelerated.
Market outlook for industrial measurement solutions is
stable globally, and Vaisala is expecting increase in annual
deliveries. Life science market growth is expected to continue,
as a result of tightening requirements for monitoring and
reporting of environmental conditions. Utility companies
are increasingly adopting transformer online condition
monitoring, what is expected to accelerate demand for power
transmission solutions.
59PeRFORMANCe
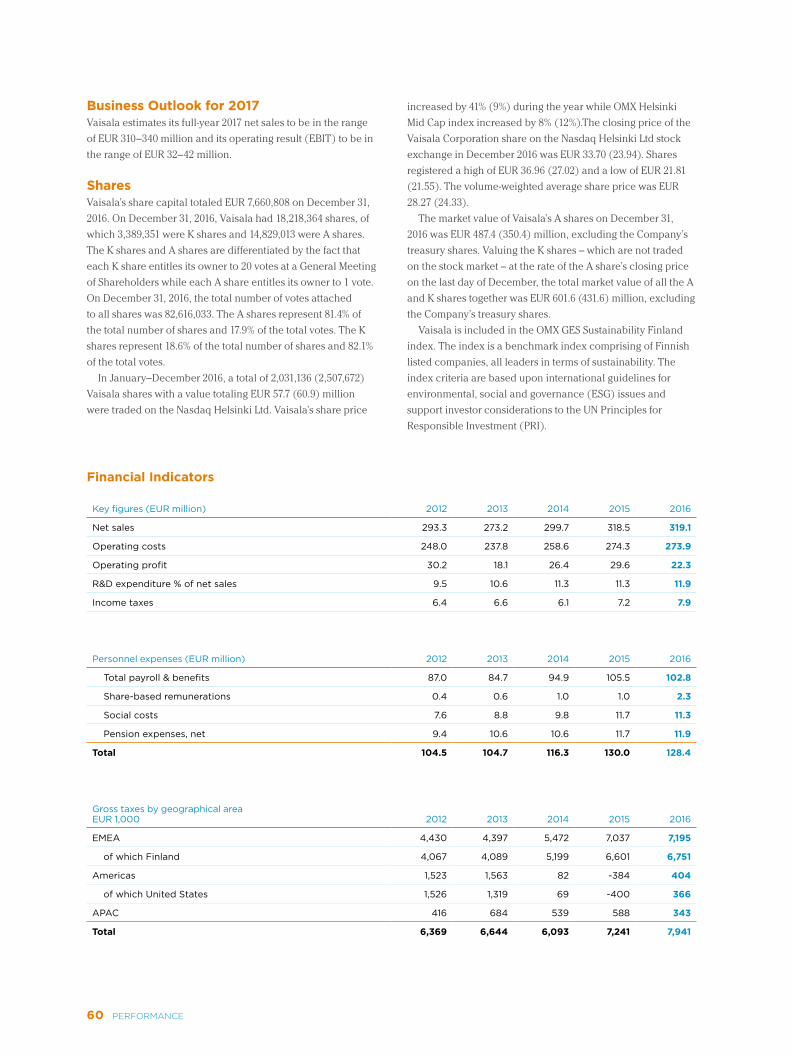
Business Outlook for 2017Vaisala estimates its full-year 2017 net sales to be in the range
of EUR 310–340 million and its operating result (EBIT) to be in
the range of EUR 32–42 million.
SharesVaisala’s share capital totaled EUR 7,660,808 on December 31,
2016. On December 31, 2016, Vaisala had 18,218,364 shares, of
which 3,389,351 were K shares and 14,829,013 were A shares.
The K shares and A shares are differentiated by the fact that
each K share entitles its owner to 20 votes at a General Meeting
of Shareholders while each A share entitles its owner to 1 vote.
On December 31, 2016, the total number of votes attached
to all shares was 82,616,033. The A shares represent 81.4% of
the total number of shares and 17.9% of the total votes. The K
shares represent 18.6% of the total number of shares and 82.1%
of the total votes.
In January–December 2016, a total of 2,031,136 (2,507,672)
Vaisala shares with a value totaling EUR 57.7 (60.9) million
were traded on the Nasdaq Helsinki Ltd. Vaisala’s share price
increased by 41% (9%) during the year while OMX Helsinki
Mid Cap index increased by 8% (12%).The closing price of the
Vaisala Corporation share on the Nasdaq Helsinki Ltd stock
exchange in December 2016 was EUR 33.70 (23.94). Shares
registered a high of EUR 36.96 (27.02) and a low of EUR 21.81
(21.55). The volume-weighted average share price was EUR
28.27 (24.33).
The market value of Vaisala’s A shares on December 31,
2016 was EUR 487.4 (350.4) million, excluding the Company’s
treasury shares. Valuing the K shares – which are not traded
on the stock market – at the rate of the A share’s closing price
on the last day of December, the total market value of all the A
and K shares together was EUR 601.6 (431.6) million, excluding
the Company’s treasury shares.
Vaisala is included in the OMX GES Sustainability Finland
index. The index is a benchmark index comprising of Finnish
listed companies, all leaders in terms of sustainability. The
index criteria are based upon international guidelines for
environmental, social and governance (ESG) issues and
support investor considerations to the UN Principles for
Responsible Investment (PRI).
Key figures (EUR million) 2012 2013 2014 2015 2016
Net sales 293.3 273.2 299.7 318.5 319.1
Operating costs 248.0 237.8 258.6 274.3 273.9
Operating profit 30.2 18.1 26.4 29.6 22.3
R&D expenditure % of net sales 9.5 10.6 11.3 11.3 11.9
Income taxes 6.4 6.6 6.1 7.2 7.9
Personnel expenses (EUR million) 2012 2013 2014 2015 2016
Total payroll & benefits 87.0 84.7 94.9 105.5 102.8
Share-based remunerations 0.4 0.6 1.0 1.0 2.3
Social costs 7.6 8.8 9.8 11.7 11.3
Pension expenses, net 9.4 10.6 10.6 11.7 11.9
Total 104.5 104.7 116.3 130.0 128.4
Gross taxes by geographical areaEUR 1,000
2012
2013
2014
2015
2016
EMEA 4,430 4,397 5,472 7,037 7,195
of which Finland 4,067 4,089 5,199 6,601 6,751
Americas 1,523 1,563 82 -384 404
of which United States 1,526 1,319 69 -400 366
APAC 416 684 539 588 343
Total 6,369 6,644 6,093 7,241 7,941
Financial Indicators
60 PeRFORMANCe

Financial ratios 2012 2013 2014 2015 2016
Return on equity (ROE) (%) 11.7 6.3 14.3 15.7 10.5
Solvency ratio (%) 75 72 71 70 71
Earnings per share (EUR) 1.20 0.60 1.30 1.52 1.05
Dividend per share (EUR) 0.90 0.90 0.90 0.95 1.00*
* Board's proposal to the Annual General Meeting
Financial assistance from governments by countryEUR 1,000
2012
2013
2014
2015
2016
Investment grants, R&D Grants, or other grants
Finland 873 568 355 1,314 595
Canada 48
United Kingdom 24
Total 873 616 355 1,314 619
DonationsEUR 1,000
2012
2013
2014
2015
2016
Total 59 75 310 466 672
201420132012 2015 2016
350
300
250
200
150
100
50
0
Development of Net Sales
293.3273.2
299.7318.5 319.1 Public sector
5.97
Nonprofit Organizations11.38
Financial and insurance institutions12.90
Private Companies14.29
Households40.76
Outside of Finland and Nominee Registered
14.68
Shareholders by Sector %
201420132012 2015 2016
12
10
8
6
4
2
0
R&D Expenditure % of Net Sales
9.510.6
11.3 11.311.9
61PeRFORMANCe
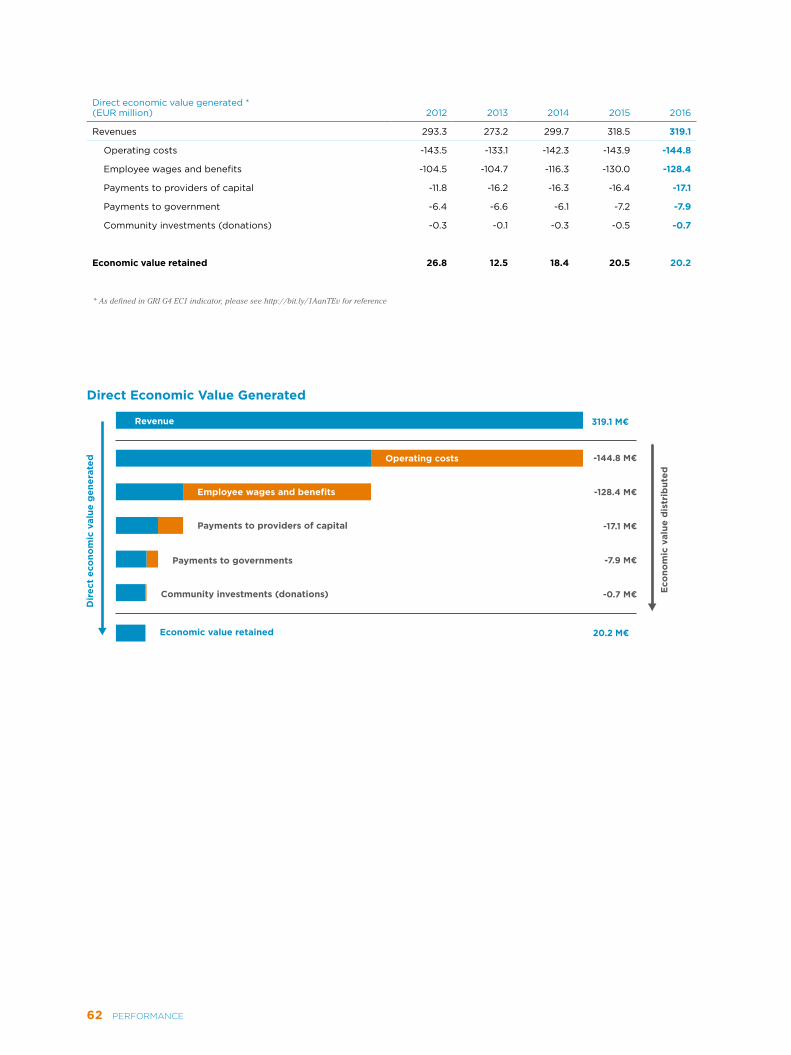
Employee wages and benefits
Operating costs
Dir
ect
eco
nom
ic v
alue
gen
erat
ed
Eco
nom
ic v
alue
dis
trib
uted
Payments to governments
Payments to providers of capital
Community investments (donations)
Economic value retained
Revenue
-144.8 M€
-128.4 M€
-17.1 M€
-7.9 M€
-0.7 M€
319.1 M€
20.2 M€
Direct Economic Value Generated
Direct economic value generated *(EUR million) 2012 2013 2014 2015 2016
Revenues 293.3 273.2 299.7 318.5 319.1
Operating costs -143.5 -133.1 -142.3 -143.9 -144.8
Employee wages and benefits -104.5 -104.7 -116.3 -130.0 -128.4
Payments to providers of capital -11.8 -16.2 -16.3 -16.4 -17.1
Payments to government -6.4 -6.6 -6.1 -7.2 -7.9
Community investments (donations) -0.3 -0.1 -0.3 -0.5 -0.7
Economic value retained 26.8 12.5 18.4 20.5 20.2
* As defined in GRI G4 EC1 indicator, please see http://bit.ly/1AanTEv for reference
62 PeRFORMANCe
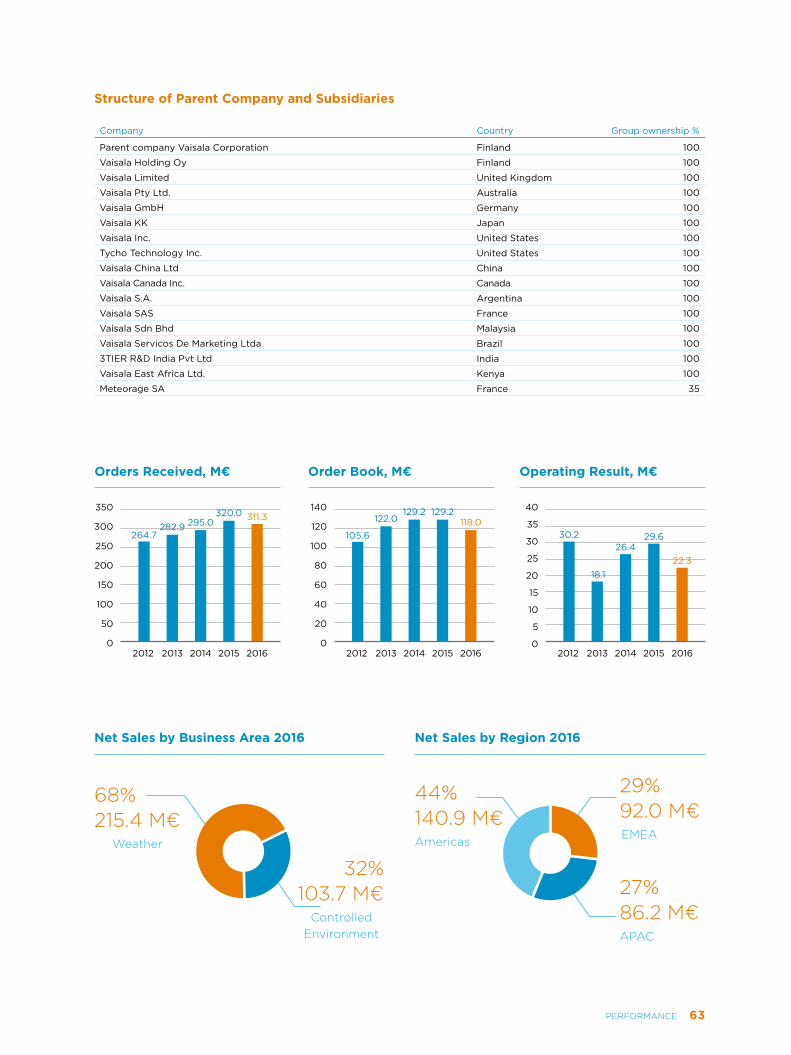
Company Country Group ownership %
Parent company Vaisala Corporation Finland 100
Vaisala Holding Oy Finland 100
Vaisala Limited United Kingdom 100
Vaisala Pty Ltd. Australia 100
Vaisala GmbH Germany 100
Vaisala KK Japan 100
Vaisala Inc. United States 100
Tycho Technology Inc. United States 100
Vaisala China Ltd China 100
Vaisala Canada Inc. Canada 100
Vaisala S.A. Argentina 100
Vaisala SAS France 100
Vaisala Sdn Bhd Malaysia 100
Vaisala Servicos De Marketing Ltda Brazil 100
3TIER R&D India Pvt Ltd India 100
Vaisala East Africa Ltd. Kenya 100
Meteorage SA France 35
Structure of Parent Company and Subsidiaries
201420132012 2015 2016
40
35
30
25
20
15
10
5
0
Operating Result, M€
30.2
18.1
26.429.6
22.3
201420132012 2015 2016
350
300
250
200
150
100
50
0
Orders Received, M€
282.9264.7
295.0320.0 311.3
201420132012 2015 2016
140
120
100
80
60
40
20
0
Order Book, M€
105.6
122.0129.2 129.2
118.0
32%103.7 M€
68%215.4 M€
Weather
Controlled environment
Net Sales by Business Area 2016
44%140.9 M€
29%92.0 M€
27%86.2 M€
eMeA
APAC
Americas
Net Sales by Region 2016
63PeRFORMANCe
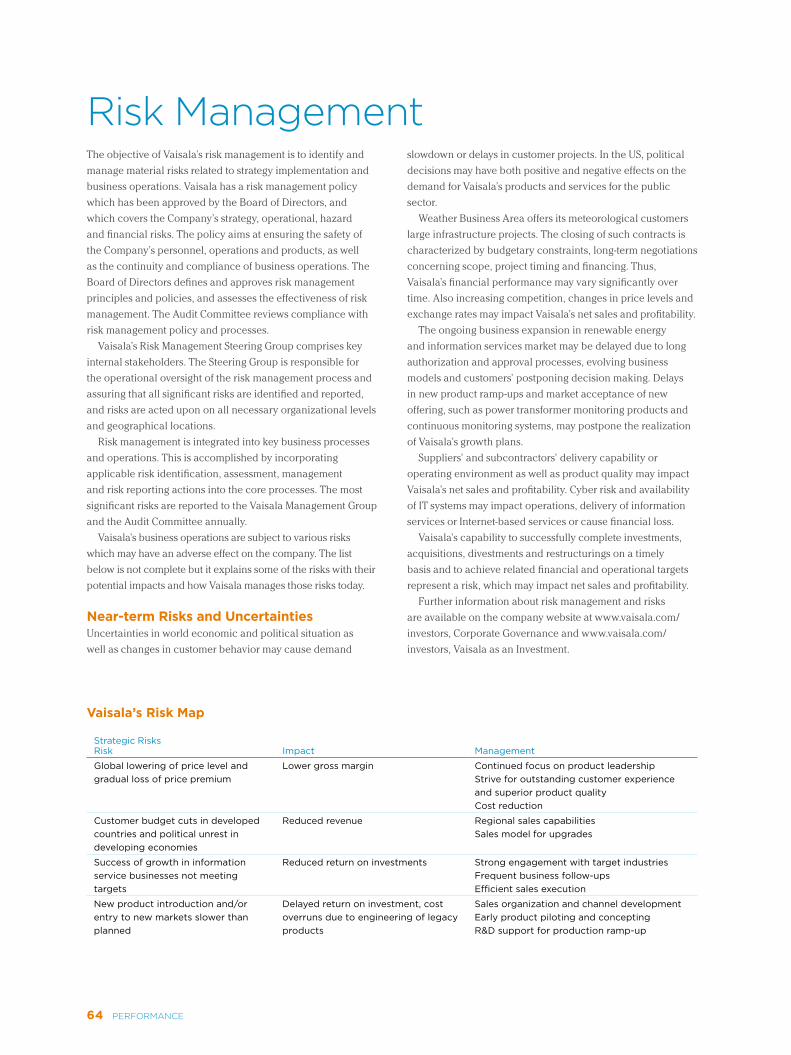
The objective of Vaisala’s risk management is to identify and
manage material risks related to strategy implementation and
business operations. Vaisala has a risk management policy
which has been approved by the Board of Directors, and
which covers the Company’s strategy, operational, hazard
and financial risks. The policy aims at ensuring the safety of
the Company’s personnel, operations and products, as well
as the continuity and compliance of business operations. The
Board of Directors defines and approves risk management
principles and policies, and assesses the effectiveness of risk
management. The Audit Committee reviews compliance with
risk management policy and processes.
Vaisala’s Risk Management Steering Group comprises key
internal stakeholders. The Steering Group is responsible for
the operational oversight of the risk management process and
assuring that all significant risks are identified and reported,
and risks are acted upon on all necessary organizational levels
and geographical locations.
Risk management is integrated into key business processes
and operations. This is accomplished by incorporating
applicable risk identification, assessment, management
and risk reporting actions into the core processes. The most
significant risks are reported to the Vaisala Management Group
and the Audit Committee annually.
Vaisala’s business operations are subject to various risks
which may have an adverse effect on the company. The list
below is not complete but it explains some of the risks with their
potential impacts and how Vaisala manages those risks today.
Near-term Risks and Uncertainties Uncertainties in world economic and political situation as
well as changes in customer behavior may cause demand
Risk Managementslowdown or delays in customer projects. In the US, political
decisions may have both positive and negative effects on the
demand for Vaisala’s products and services for the public
sector.
Weather Business Area offers its meteorological customers
large infrastructure projects. The closing of such contracts is
characterized by budgetary constraints, long-term negotiations
concerning scope, project timing and financing. Thus,
Vaisala’s financial performance may vary significantly over
time. Also increasing competition, changes in price levels and
exchange rates may impact Vaisala’s net sales and profitability.
The ongoing business expansion in renewable energy
and information services market may be delayed due to long
authorization and approval processes, evolving business
models and customers’ postponing decision making. Delays
in new product ramp-ups and market acceptance of new
offering, such as power transformer monitoring products and
continuous monitoring systems, may postpone the realization
of Vaisala’s growth plans.
Suppliers’ and subcontractors’ delivery capability or
operating environment as well as product quality may impact
Vaisala’s net sales and profitability. Cyber risk and availability
of IT systems may impact operations, delivery of information
services or Internet-based services or cause financial loss.
Vaisala’s capability to successfully complete investments,
acquisitions, divestments and restructurings on a timely
basis and to achieve related financial and operational targets
represent a risk, which may impact net sales and profitability.
Further information about risk management and risks
are available on the company website at www.vaisala.com/
investors, Corporate Governance and www.vaisala.com/
investors, Vaisala as an Investment.
Strategic Risks Risk Impact Management
Global lowering of price level and gradual loss of price premium
Lower gross margin Continued focus on product leadershipStrive for outstanding customer experience and superior product qualityCost reduction
Customer budget cuts in developed countries and political unrest in developing economies
Reduced revenue Regional sales capabilitiesSales model for upgrades
Success of growth in information service businesses not meeting targets
Reduced return on investments Strong engagement with target industriesFrequent business follow-upsEfficient sales execution
New product introduction and/or entry to new markets slower than planned
Delayed return on investment, cost overruns due to engineering of legacy products
Sales organization and channel developmentEarly product piloting and conceptingR&D support for production ramp-up
Vaisala’s Risk Map
64 PeRFORMANCe

Operational RisksRisk Impact Management
Availability of IT systems Interruptions to operations, especially manufacturing
• Stabilization of operational IT environment, shortening of resolution time of critical incidents
• Change management process with impact analysis and formal approvals
Business continuity risks related to suppliers
Delays in deliveries, and consequent loss of customers
• Active supplier risk assessment• Supplier base optimization• Long-term supplier development plans• Strategic supplier continuity audits
Cyber risks Delays in deliveries, and consequent loss of customersFinancial lossLoss of trade secrets or personal data
• Information Security Management System (ISMS) creation and deployment
• Cyber insurance
Change management performance Reduced revenue or profitability caused by failed or delayed investment, acquisition, divestment or restructuring projects
• Continuous progress follow-up• Resource allocation for critical projects
Project delivery performance and interdependencies
Uncertainty of revenue forecasting, lower profitability
• Continuous sales and delivery process follow-up and improvement
Political, legislative or regulatory changes
Loss of market potential, or increased cost of accessing a market
• Geographic and market diversity of business
• Market and regulatory foresight
Inventory risk Reduced profitability due to write-down
• Development of product ramp-down and material management and inventory processes
Hazard RisksRisk
Impact Management
Fire, contamination, or other major disruption in the cleanroom operation
Reduced revenueLoss of customers
• Emergency stock of sensor components, risk based management of production equipment and spare parts, safety of facilities
• Business continuity planning
Field service health and safety risks related to working conditions
Harm to health or safety of personnel • Continuous development of occupational health and safety system, emergency procedures
• Traveler tracking system
Failure of infrastructure supporting information service businesses
Reduced availability of information services
• Geographic system redundancy across four server sites
Natural disaster, epidemic, civil unrest, terrorism
Impaired business environment leading to cancellation of orders, or delays in deliveries and revenue
• Geographic business diversity• Monitoring of the business environment• Risk assessment of business opportunities
Financial RisksRisk Impact Management
Credit risk Credit loss • Secured terms of payment, business credit checks, diversification of customer pool
Liquidity and refinancing risk Unavailability of credit facilities • Sustainable capital structure
Financial credit and interest rate risk Financial credit loss, lower finance income
• High credit rating of financial counter parties, low risk cash investment
Currency risk Lower net profit due to foreign exchange rate movements
• Currency hedging
65PeRFORMANCe
To ensure and further promote responsible business practices,
Vaisala has a Code of Conduct which is to be followed by
all employees. The Code embodies our rules for behavior in
conducting business at or with Vaisala, and translates our
values and responsibility into actions taken by our employees
every day. The Code highlights important issues such as
regulatory compliance and integrity, human rights, workplace
behavior and safety, anti-corruption, healthy competition and
environmental aspects of our operations.
The first Code of Conduct was introduced to the
organization in 2008. Since then, all employees have been
required to complete an online training module which is also
part of the orientation program for new employees.
In 2015, a revised Code of Conduct was put in place,
together with a new training module. At the time of reporting
in February 2017, 90% (94%) of current Vaisala employees
had completed the new Code of Conduct training module
either online or in separate training sessions. In 2017, a new
e-learning tool will be taken into use for improved staff training
on the Code of Conduct. When the training is launched, all
staff will be required to complete the training and retake the
course periodically.
During 2016, Vaisala renewed its longstanding International
Anti-corruption Policy. The new policy brings more clarity and
details to what is expected of Vaisala personnel, distributors
and agents, customers and suppliers. Training on the policy
was arranged for key employee groups, such as sales and
sourcing personnel, during 2016 and continues in 2017.
Vaisala’s Code of Conduct Vaisala Group is a global leader in environmental and
industrial measurement. Our goal is to provide reliable
environmental observations for better decision making, safety,
and efficiency. We aim at growing and conducting long-term
profitable business in an ethical and responsible manner. We
endorse the United Nations Global Compact strategic initiative
for sustainable business practices and support the Global
Compact’s Ten Principles which are derived from the areas of
human rights, labor, environment and anti-corruption.
This Code of Conduct (“Code”) sets forth the most important
principles and practices guiding Vaisala and its employees
in all of their actions. As Vaisala’s reputation is reliant on the
conduct of its employees, each Vaisala employee is expected
to comply with the requirements set forth in this Code without
exception.
Vaisala’s business partners are required to endorse the
principles of this Code as part of their contractual relationship
with Vaisala. We have a separate Supplier Code of Conduct in
which we require that our suppliers and subcontractors meet
the standards and requirements set forth in the Supplier Code
of Conduct.
1. Compliance with Laws We comply with all applicable laws and regulations in the
countries in which we operate. Where differences exist
between local laws, regulations, customs or norms and this
Code, Vaisala strives to apply which ever sets the highest
standard. In addition to following formal legal norms, we make
no compromise in acting in an ethical manner. Our ambition
is to be a good corporate citizen and let our commitment to
integrity show through in all our actions.
2. Human Rights We respect human rights as defined in the United Nations’
Universal Declaration of Human Rights and we seek to
promote them in our conduct and practices. In particular,
we refrain from using any form of forced or child labor and
insist on the same from our business partners. We endorse
the International Labour Organization’s Declaration of
Fundamental Principles and Rights at Work, which entail, inter
alia, respecting our employees’ right to peaceful assembly,
freedom of association and collective bargaining.
3. Employees We value innovation and curiosity and encourage the
professional and personal growth of our employees. We
recognize the value of diversity and do not accept any form of
discrimination, harassment or other offensive or inappropriate
behavior from or towards our employees. We are committed
to providing a safe working environment and require the same
from our business partners.
4. Anti-Corruption We maintain a zero tolerance approach towards all forms of
corruption and abide by the anti-corruption laws applicable in
the countries in which we operate. Our reputation as an honest
and reliable company is of paramount importance to us, and
each employee is expected to safeguard this reputation. The
monetary value of any gifts, entertainment or other types of
hospitality offered to clients or business partners, or received
by Vaisala’s employees, must be reasonable and appropriate
under the circumstances. Making any offers to public officials
or other business partners with an intent to improperly
influence their decisions is strictly prohibited.
5. Use of Vaisala’s Funds and Assets Vaisala’s funds and assets are to be used for the benefit of
Vaisala only, and they may not be used for any unlawful or
improper purpose. Employees must avoid and report events or
Responsible Business Conduct
66 PeRFORMANCe

circumstances where their personal interests may be in direct
or indirect conflict with the interests of Vaisala. Such scenarios
could include a situation where a Vaisala employee holds a
financial interest in a competing entity or in a business partner.
6. Competition We recognize the importance of healthy competition in the
marketplace and encourage fair competition worldwide. We
comply with all laws and regulations concerning competition
and expect the same from our competitors and business
partners. Business practices we renounce include participating
in cartels, abusing one’s dominant position in the market place
and fixing prices with competitors.
7. Environment Our investment in and commitment to sustainable business
practices demonstrates our ambition to be a good corporate
citizen. The environment is a key stakeholder for us,
and we comply with all generally accepted international
environmental standards and often seek to exceed those
standards. In addition, we constantly seek to include a
sustainability element in our products and services.
8. Implementation and Monitoring We implement this Code by training our employees and
requiring periodical acknowledgements of their compliance
with this Code. Further, compliance with this Code is
continuously monitored by regional/business unit heads
and immediate supervisors and is also subject to internal
audit. If any Vaisala employee becomes aware of or suspects
a violation of this Code, they are required to report their
concerns through the internal communication channel
which provides anonymity. Violating this Code will lead
to appropriate corrective action, up to and including the
termination of employment or business relationship.
Supplier Code of ConductThe Supplier Code of Conduct reflects Vaisala’s values and
the Vaisala Code of Conduct, and is based on principles
created by the International Labor Organization (ILO), the
United Nations Global Compact initiative, and the Electronic
Industry Citizenship Coalition (EICC). The Code of Conduct
contains language from standards and policies formulated
by the above-mentioned organizations, as well as those of
the Business Social Compliance Initiative (BSCI) and Social
Accountability International (SAI).
Regulatory ComplianceWe believe that responsible business conduct is based on
fairness and integrity. Vaisala complies with all national laws
and regulations, and does not respond to suspicious business
proposals. We continuously follow changes in legislation and
keep our staff informed through internal communication, such
as the company intranet, and training for key employees.
There were no confirmed complaints or sanctions
by authorities during 2016. Specifically, no incidents of
corruption, anti-competitive behavior, anti-trust or monopoly
practices or any other breach of legislation or regulations
were confirmed during 2016. Furthermore, there were no
reported concerns or breaches of human rights, labor rights, or
environmental legislation in the adjacent supply chain.
Compliance CommitteeVaisala has a compliance committee whose task is to oversee
that all parts of Vaisala’s operations are in line with the Code
of Conduct as well as all other legislation and regulation. The
committee has members from the Legal Department, Finance
& Control and Human Resources and is headed by Senior Vice
President for Compliance and Risk Management.
Grievance MechanismsVaisala provides an internal grievance mechanism for
its employees through a dedicated channel, the Vaisala
Whistleblowing Channel. The channel operates by e-mail
and regular mail and accepts both anonymous and signed
messages. Responsibility for the channel and actions taken
on cases put forward in the forum lies with the Compliance
Committee. Cases are handled confidentially by the
Committee.
The Whistleblowing Channel also acts as a medium for
clarifying questions about our Code of Conduct or the Code
of Conduct training. All Vaisala employees are required to
take part in annual training covering the Code of Conduct.
This channel also serves Vaisala’s other stakeholders, such as
suppliers, customers, or distributors.
Compliance to Human Rights and Labor LawsVaisala does not condone infringement of human rights or
breaches of labor laws in any part of its supply chain and
takes appropriate measures to ensure that the risks of any
violations of the company’s Code of Conduct or its Supplier
Code of Conduct are minimized in the adjacent supply chain.
Moreover, due to the enforcement of Section 1502 of the
Dodd-Frank Wall Street Reform and Consumer Protection Act,
suppliers to Vaisala must ensure that proper precautions are
taken in order not to source any materials that have their origin
in conflict areas, including but not limited to the tin, tungsten,
tantalum, and gold mined in the Democratic Republic of
Congo (DRC) or in adjoining countries.
67PeRFORMANCe

Vaisala has published annual sustainability reports since 2009.
This is the ninth in the series, and the first report that includes
elements of Integrated Reporting. This year, we named our
sustainability report according to our mission “Observations
for a Better World 2016.”
Towards Integrated ReportingVaisala has decided to take steps towards Integrated
Reporting, as defined by the International Integrated Reporting
Council (IIRC). The primary purpose of an Integrated Report is
to describe how a company creates value over time. We started
our work towards this goal through exploring the different
types of value Vaisala creates for its stakeholders. In 2016, we
initiated the process by engaging in dialogue with some of our
key stakeholders and interviewed them to find out what they
expect of Vaisala and our corporate reporting. We studied
what megatrends affect Vaisala now and in the future, how we
react to them, and what opportunities they may bring us. We
then defined what types of value Vaisala creates and narrowed
them down to the most relevant ones for each stakeholder.
Finally, we wrapped it all together into a Value Creation Model,
“The World of Observations.” The groundwork has now been
laid for taking our integrated reporting further.
Implementing the GRI GuidelinesTo maintain transparency and consistency in its sustainability
reporting, Vaisala applies the Global Reporting Initiative’s
(GRI) G4 guidelines, and its report is in accordance with the
guideline’s Core criteria. For some indicators, we also refer to
Vaisala’s Financial Statements and the Corporate Governance
Statement, both of which are available on our website.
The Performance chapter of this report discloses our key
performance indicators as determined through a materiality
analysis, which is based on the GRI G4 Guidelines.
Following the GRI boundary guidelines, our financial and
human resource data is reported for the entire Group and in
all locations. The scope of our environmental data is divided
into Group Environmental Key Performance Indicators, which
cover the manufacturing sites; Carbon Footprint, which covers
manufacturing sites and offices with more than 15 employees;
and indirect sources.
Vaisala’s management reviewed the material aspects and
key stakeholders in 2016 as part of the integrated reporting
process. The material aspects reflect Vaisala’s strategic
priorities and concerns raised by stakeholders.
Reporting PrinciplesWe also report sustainability information directly to selected
organizations. We prioritize reporting to CDP, Global Compact,
our customers, institutional investors and ESG rating agencies.
You can find further information not incorporated in this
report on our website. In particular, we encourage you to
have a look at the sustainability section of the website
(www.vaisala.com/sustainability).
Independent AssuranceAccording to our reporting process, we seek assurance for
the report from a third party assurance provider. Standard
disclosures for 2016 with a reference to external assurance
in the GRI content index have been externally assured by an
independent third party, Ernst & Young Oy.
68 PeRFORMANCe
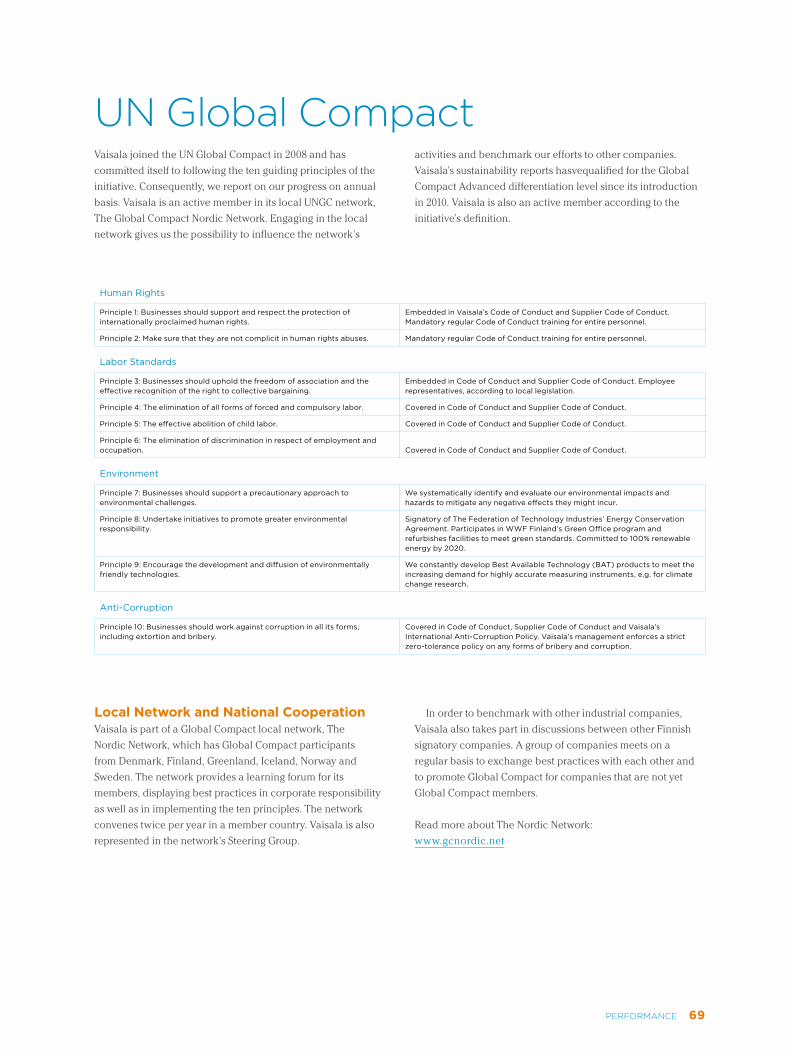
Vaisala joined the UN Global Compact in 2008 and has
committed itself to following the ten guiding principles of the
initiative. Consequently, we report on our progress on annual
basis. Vaisala is an active member in its local UNGC network,
The Global Compact Nordic Network. Engaging in the local
network gives us the possibility to influence the network’s
UN global Compact
Human Rights
Principle 1: Businesses should support and respect the protection of internationally proclaimed human rights.
Embedded in Vaisala’s Code of Conduct and Supplier Code of Conduct. Mandatory regular Code of Conduct training for entire personnel.
Principle 2: Make sure that they are not complicit in human rights abuses. Mandatory regular Code of Conduct training for entire personnel.
Labor Standards
Principle 3: Businesses should uphold the freedom of association and the effective recognition of the right to collective bargaining.
Embedded in Code of Conduct and Supplier Code of Conduct. Employee representatives, according to local legislation.
Principle 4: The elimination of all forms of forced and compulsory labor. Covered in Code of Conduct and Supplier Code of Conduct.
Principle 5: The effective abolition of child labor. Covered in Code of Conduct and Supplier Code of Conduct.
Principle 6: The elimination of discrimination in respect of employment and occupation. Covered in Code of Conduct and Supplier Code of Conduct.
Environment
Principle 7: Businesses should support a precautionary approach to environmental challenges.
We systematically identify and evaluate our environmental impacts and hazards to mitigate any negative effects they might incur.
Principle 8: Undertake initiatives to promote greater environmental responsibility.
Signatory of The Federation of Technology Industries’ Energy Conservation Agreement. Participates in WWF Finland’s Green Office program and refurbishes facilities to meet green standards. Committed to 100% renewable energy by 2020.
Principle 9: Encourage the development and diffusion of environmentally friendly technologies.
We constantly develop Best Available Technology (BAT) products to meet the increasing demand for highly accurate measuring instruments, e.g. for climate change research.
Anti-Corruption
Principle 10: Businesses should work against corruption in all its forms, including extortion and bribery.
Covered in Code of Conduct, Supplier Code of Conduct and Vaisala’s International Anti-Corruption Policy. Vaisala’s management enforces a strict zero-tolerance policy on any forms of bribery and corruption.
activities and benchmark our efforts to other companies.
Vaisala’s sustainability reports hasvequalified for the Global
Compact Advanced differentiation level since its introduction
in 2010. Vaisala is also an active member according to the
initiative’s definition.
Local Network and National Cooperation Vaisala is part of a Global Compact local network, The
Nordic Network, which has Global Compact participants
from Denmark, Finland, Greenland, Iceland, Norway and
Sweden. The network provides a learning forum for its
members, displaying best practices in corporate responsibility
as well as in implementing the ten principles. The network
convenes twice per year in a member country. Vaisala is also
represented in the network’s Steering Group.
In order to benchmark with other industrial companies,
Vaisala also takes part in discussions between other Finnish
signatory companies. A group of companies meets on a
regular basis to exchange best practices with each other and
to promote Global Compact for companies that are not yet
Global Compact members.
Read more about The Nordic Network:
www.gcnordic.net
69PeRFORMANCe

The Global Reporting Initiative content index is provided
to assist the reader in navigating through the report and
to compare it to the GRI G4 Guidelines. The report is in
accordance with the core criteria of the guidelines. Standard
disclosures for 2016, with a reference to external assurance
in the GRI content index, have been externally assured by an
independent third party, Ernst & Young Oy. The independent
assurance report is on page 74 of this report. For more
information about the guidelines or the application levels,
please see www.globalreporting.org
Description ReferenceReasons for omission Assurance
Global Compact Principle
General Standard Disclosures
G4-1
Provide a statement from the most senior decision-maker of the organization (such as CEO, chair, or equivalent senior position) about the relevance of sustainability to the organization and the organization’s strategy for addressing sustainability 7–9
Organizational Profile
G4-3 Name of the organization 3
G4-4 Primary brands, products, and services 6
G4-5 Location of the organization’s headquarters 3
G4-6 Number of countries where the organization operates 3, 15
G4-7 Nature of ownership and legal form 3
G4-8 Markets served 14–15
G4-9 Scale of the organization 14–15
G4-10 Workforce information 46–49 l Principle 6
G4-11 Report the percentage of total employees covered by collective bargaining agreements 46 l Principle 3
G4-12 Describe the organization’s supply chain 51–52
G4-13Significant changes during the reporting period regarding the organization’s size, structure, ownership, or its supply chain 46
G4-14 Approach to the precautionary principle 64–67
G4-15Externally developed economic, environmental and social charters, principles, or other initiatives to which the organization subscribes or which it endorses. 69
G4-16 List memberships of associations and national or international advocacy organizations 8–9, 21, 69
Identified Material Aspects and Boundaries
G4-17
Entities included in the organization’s consolidated financial statements or equivalent documents. Report whether any entity included in the organization’s consolidated financial statements or equivalent documents is not covered by the report.
The report’s scope include all affiliates and wholly owned companies of the parent company Vaisala Oyj, pages 63.
G4-18 Process for defining the report content and the Aspect Boundaries 2, 16–17, 68
G4-19 List all the material Aspects identified in the process for defining report content 16–17
G4-20 Reporting of Aspect Boundaries within the organization 16–17
G4-21 Reporting of Aspect Boundaries outside the organization 16–17
G4-22Effect of any restatements of information provided in previous reports, and the reasons for such restatements
68, Re-statements are explained within the text were applicable.
G4-23Report significant changes from previous reporting periods in the Scope and Aspect Boundaries. 68
Stakeholder Engagement
G4-24 List of stakeholder groups engaged by the organization 21
G4-25 Basis for identification and selection of stakeholders with whom to engage 20–21
G4-26 Organization’s approach to stakeholder engagement 20
G4-27 Key topics and concerns that have been raised through stakeholder engagement 16–19, 20-21
gRi Content index
70 PeRFORMANCe

Report Profile
G4-28 Reporting period for information provided Calendar year 2016
G4-29 Date of most recent previous report 22 March 2016
G4-30 Reporting cycle Annual
G4-31 Contact point for questions regarding the report or its contents 75
G4-32 The ‘in accordance’ option the organization has chosen.In accordance with the GRI G4 Core option.
G4-33Organization’s policy and current practice with regard to seeking external assurance for the report. 68
Governance
G4-34 Governance structure of the organization Corporate Governance Statement
Ethics and Integrity
G4-56Organization’s values, principles, standards and norms of behavior such as codes of conduct and codes of ethics 10, 66–67 All principles
G4-57Internal and external mechanisms for seeking advice on ethical and lawful behavior, and matters related to organizational integrity, such as helplines or advice lines 66 All principles
G4-58
Internal and external mechanisms for reporting concerns about unethical or unlawful behavior, and matters related to organizational integrity, such as escalation through line management, whistleblowing mechanisms or hotlines 66 All principles
Description Reference Reasons for omission Assurance
Global Compact Principle
Disclosures on Management Approach (DMA)
G4-DMA Materiality and impacts 11–12
Indicators
Category: Economic
Aspect: Economic Performance
G4-EC1 Direct economic value generated and distributed 62Figures reported on Group level. We consider the regional level reporting of these figures trade secrets. l
G4-EC3Coverage of the organization’s defined benefit plan obligations
Financial Statements, p. 32, 43, 54
There is no single Group policy, as practices differ between countries. Percentage of salary and participation level not reported. l
G4-EC4 Financial assistance received from government 61 l
Category: Environmental
Aspect: Energy
G4-EN3 Energy consumption within the organization 56
Vaisala does not consume fuels or sell electricity in any significant quantities, therefore these are not considered material. l Principles 7, 8
G4-EN4 Energy consumption outside of the organization 53–54The scope is the installed base of Vaisala’s C-band Weather Radar, converted into Scope 2 emissions. l
Principles 7, 8, 9
G4-EN5 Energy intensity 56 l Principle 8
G4-EN6 Reduction of energy consumption 54–57 l Principle 8
Aspect: Water
G4-EN8 Total water withdrawal by source 56 l Principles 7, 8
Aspect: Emissions
G4-EN15 Direct greenhouse gas (ghg) emissions (scope 1) 57 l Principles 7, 8
G4-EN16 Energy indirect greenhouse gas (ghg) emissions (scope 2) 57 l Principles 7, 8
G4-EN17 Other indirect greenhouse gas (ghg) emissions (scope 3) 57
The data includes business travel and commuting for the Group; logistics and waste for Finland; and installed base of one product group, the C-band weather radar. Scope of reporting will be reviewed annually. l Principles 7, 8
G4-EN18 Greenhouse gas (ghg) emissions intensity 57 l Principles 7, 8
G4-EN19 Reduction of greenhouse gas (ghg) emissions 57 l Principle 8
Aspect: Effluents and Waste
G4-EN23 Total weight of waste by type and disposal method 55 l Principles 7, 8
71PeRFORMANCe

Description Reference Reasons for omission Assurance
Global Compact Principle
Aspect: Compliance
G4-EN29
Monetary value of significant fines and total number of non-monetary sanctions for non-compliance with environmental laws and regulations 67 l Principle 7
Aspect: Supplier Environmental Assessment
G4-EN32Percentage of new suppliers that were screened using environmental criteria 52 l Principle 7
Aspect: Environmental Grievance Mechanisms
G4-EN34
Number of grievances about environmental impacts filed, addressed, and resolved through formal grievance mechanisms 67 l Principle 7
Category: Social
Sub-category: Labor Practices and Decent Work
Aspect: Employment
G4-LA1Total number and rates of new employee hires and employee turnover by age group, gender and region 47–49 l Principle 6
Aspect: Labor/Management Relations
G4-LA4
Minimum notice periods regarding operational changes, including whether these are specified in collective agreements 46 l Principle 3
Aspect: Occupational Health and Safety
G4-LA5
Percentage of total workforce represented in formal joint management–worker health and safety committees that help monitor and advise on occupational health and safety programs 50 l Principle 3
G4-LA6
Type of injury and rates of injury, occupational diseases, lost days, and absenteeism, and total number of work-related fatalities, by region and by gender 49–50
Occupational disease rate, absentee rates, and lost day rate have been determined not to be material in Vaisala due to low frequency. Data for contractors is too limited for reporting. l
G4-LA7Workers with high incidence or high risk of diseases related to their occupation 49–50
Aspect: Training and Education
G4-LA10
Programs for skills management and lifelong learning that support the continued employability of employees and assist them in managing career endings 46 l Principle 6
G4-LA11
Percentage of employees receiving regular performance and career development reviews, by gender and by employee category 48
Performance reviews are a key indicator for Vaisala's human resources development. As 93% of staff had had a development discussion in the past 12 months, we determine region and gender not material for Vaisala. l
Aspect: Diversity and Equal Opportunity
G4-LA12
Composition of governance bodies and breakdown of employees per employee category according to gender, age group, minority group membership, and other indicators of diversity 47–49
Vaisala does not register ethnicity or minority group status in most of its operating countries, except where it is a regulatory requirement. Minority status has also been determined as not material. l
Aspect: Supplier Assessment for Labor Practices
G4-LA14Percentage of new suppliers that were screened using labor practices criteria 52 l
Principles 3, 4, 5
Aspect: Labor Practices Grievance Mechanisms
G4-LA16Number of grievances about labor practices filed, addressed, and resolved 67 l
Principles 3, 4, 5
Sub-category: Human Rights
Aspect: Investment
G4-HR2Total hours of employee training on human rights policies or procedures 66
The e-learning platform does not account for hours spent on training, but instead registered completion of the course. l Principles 1, 2
Aspect: Non-discrimination
G4-HR3Total number of incidents of discrimination and corrective actions taken 67 l Principle 2
Aspect: Freedom of Association and Collective Bargaining
G4-HR4
Operations and suppliers identified in which the right to exercise freedom of association and collective bargaining may be violated or at significant risk, and measures taken to support these rights 52
Aspect was determined not material in Vaisala’s own operations, only in specific areas of the supply chain. For details of supply chain risk mapping, the information is proprietary. l
Principles, 1, 2, 3
72 PeRFORMANCe

Description Reference Reasons for omission Assurance
Global Compact Principle
Aspect: Child Labor
G4-HR5
Operations and suppliers identified as having significant risk for incidents of child labor, and measures taken to contribute to the effective abolition of child labor 52
Aspect was determined not material in Vaisala’s own operations, only in the supply chain. l Principle 5
Aspect: Forced or Compulsory Labor
G4-HR6
Operations and suppliers identified as having significant risk for incidents of forced or compulsory labor, and measures to contribute to the elimination of all forms of forced or compulsory labor 52
Aspect was determined not material in Vaisala’s own operations, only in the supply chain. l Principle 4
Aspect: Supplier Human Rights Assessment
G4-HR10Percentage of new suppliers that were screened using human rights criteria 52 l Principles 1, 2
Aspect: Human Rights Grievance Mechanisms
G4-HR12
Number of grievances about human rights impacts filed, addressed, and resolved through formal grievance mechanisms 67 l Principles 1, 2
Sub-category: Society
Aspect: Anti-corruption
G4-SO4Communication and training on anti-corruption policies and procedures 66–67
Every employee is in the scope for these policies and procedures. Therefore, the breakdown of staff has been deemed not material. l Principle 10
G4-SO5 Confirmed incidents of corruption and actions taken 67 l Principle 10
Aspect: Public Policy
G4-SO6Total value of political contributions by country and recipient/beneficiary 58, 61 l Principle 10
Aspect: Anti-competitive Behavior
G4-SO7Total number of legal actions for anti-competitive behavior, anti-trust, and monopoly practices and their outcomes 67 l Principle 10
Aspect: Compliance
G4-SO8
Monetary value of significant fines and total number of non-monetary sanctions for non-compliance with laws and regulations 67 l Principle 10
Aspect: Supplier Assessment for Impacts on Society
G4-SO9Percentage of new suppliers that were screened using criteria for impacts on society 52 l Principle 10
Aspect: Grievance Mechanisms for Impacts on Society
G4-SO11
Number of grievances about impacts on society filed, addressed, and resolved through formal grievance mechanisms 67 l Principle 10
Sub-category: Product Responsibility
Aspect: Customer Health and Safety
G4-PR2
Total number of incidents of non-compliance with regulations and voluntary codes concerning the health and safety impacts of products and services during their life cycle, by type of outcomes 67 l
Aspect: Product and Service Labeling
G4-PR4
Total number of incidents of non-compliance with regulations and voluntary codes concerning product and service information and labeling, by type of outcomes 67 l
Aspect: Compliance
G4-PR9
Monetary value of significant fines for non-compliance with laws and regulations concerning the provision and use of products and services 67 l
References: Vaisala Annual Review 2016 and Corporate Governance Statementwww.vaisala.com/investors/
73PeRFORMANCe

independent Assurance ReportTo the Management of Vaisala OyjAt the request of the Management of Vaisala Oyj (hereafter Vaisala) we have performed a limited assurance engagement on certain economic, environmental, social, and compliance information in Vaisala’s Observations for a Better World 2016 -report for the reporting period 1 January to 31 December 2016 (hereafter corporate responsibility information). Further information about the scope of the assurance engagement can be found in the GRI index on pages 70–73 of the report.
Management’s ResponsibilityThe Management of Vaisala is responsible for the preparation and presentation of the corporate responsibility information in accordance to Vaisala’s internal reporting instructions and the Global Reporting Initiative (GRI) Sustainability Reporting Guidelines G4 (hereafter the reporting principles).
Assurance Provider’s ResponsibilityIt is our responsibility to present an independent conclusion on the corporate responsibility information based on our work performed. We do not accept nor assume responsibility to anyone else except to Vaisala for our work, for the assurance report and for the conclusions that we have reached.
We have conducted the assurance engagement in accordance with the International Standard on Assurance Engagements (ISAE) 3000 ‘Assurance Engagements Other than Audits or Reviews of Historical Financial Information’. The ISAE 3000 standard requires compliance with ethical requirements as well as planning and performing the assurance engagement to obtain limited assurance on whether the corporate responsibility information has been prepared, in all material respects, in accordance with the reporting principles.
Assurance Provider’s Independence and Quality AssuranceWe comply with the independence and other ethical requirements of the Code of Ethics for Professional Accountants issued by the IESBA (International Ethics Standards Board for Accountants). We apply ISQC 1 (International Standard on Quality Control) and accordingly maintain a comprehensive system of quality control including documented policies and procedures regarding compliance with ethical requirements, professional standards and applicable legal and regulatory requirements.
Limitations of the EngagementAssurance is provided only on the information outlined in the GRI index on pages 70–73 of Vaisala’s Observations for a Better World 2016 -report. We have not been engaged to provide assurance on amounts or disclosures relating to other topics or to prior reporting periods presented in the Annual Review 2016 and Observations for a Better World 2016 -reports.
In a limited assurance engagement the evidence gathering procedures are more limited than in a reasonable assurance
engagement, and therefore less assurance is obtained than in a reasonable assurance engagement. The procedures selected depend on the Assurance Provider’s judgment, including an assessment of the risks that the corporate responsibility information would not, in all material respects, comply with the reporting principles. We have planned and performed our engagement to obtain sufficient appropriate evidence on which to base our conclusion.
We have performed, among others, the followingprocedures:a. An update of our knowledge and understanding of Vaisala’s
material sustainability reporting topics, organization and activities,
b. An assessment of suitability and application of the reporting principles regarding the stakeholders’ needs for information,
c. Interviews with senior management to understand Vaisala’s corporate responsibility leadership,
d. Interviews with personnel responsible for gathering and consolidating the corporate responsibility information to understand systems, processes and controls related to gathering and consolidating the information,
e. Visiting a site in United States and a site in Finland to obtain evidence of the data gathering and consolidation process,
f. Reviewing evidence retrieved from internal and external data sources and checking the data to reporting information on a sample basis,
g. Performing recalculation of information on a sample basis and reviewing the underlying data that is the basis of narrative disclosures related to the data.
Our assurance report should be read in conjunction with the inherent limitations of accuracy and completeness for corporate responsibility information. This independent assurance report should not be used on its own as a basis for interpreting Vaisala’s performance in relation to its principles of corporate responsibility.
ConclusionBased on our work described in this report, nothing has come to our attention that causes us to believe that the corporate responsibility information has not been prepared, in all material respects, in accordance with the reporting principles, or that the Information is not reliable, in all material respects, based on the reporting principles.
Helsinki, 13 March 2017Ernst & Young Oy
Jani AleniusLeader of Climate Changeand Sustainability Services
Terhi MäkinenPartner, AuthorizedPublic Accountant
74 PeRFORMANCe
Follow us
If you have questions or comments regarding the report or Vaisala’s sustainability activities, please feel free to contact us.
Tomi RintanenSustainability [email protected]+358 9 8949 3059
Vaisala OyjSustainabilityP.O. Box 26FI–00421 Helsinki, [email protected]/sustainability
facebook.com/Vaisalatwitter.com/VaisalaGrouplinkedin.com/company/vaisala-oyjyoutube.com/user/VaisalaGroup
Sustainability Contacts in Vaisala
independent Assurance Report
The papers used for the printed publication are Curious Matter 270 g/m2 and Scandia 2000 White 150 g/m2.